
Photo: Ryan Griffith
Editor’s note: This is the latest piece of PSP’s season preview on Philadelphia Union. Read the other posts of the season preview here.
Below are the initial 2018 MLS season forecasts using data from games through February 25, 2018.
What remains the same
We build a model to predict the probabilities for Win/Loss/Tie for every match, and then apply those odds to a large amount of season-simulations to get an estimate of how the season may turn out given where we are now.
The parts of the model that remain for last year are Team, Opponent, and Home/Away. There are changes that will be described below.
Also remaining as part of the model’s weighting structure is how previous matches inform the model based upon their player-minutes distribution. For example, if Philadelphia starts the season with a starting lineup, but by June four of the starters have lost their playing time, we might not find the opening day as useful for assessing the “Philadelphia Union’s” importance as one where the rosters are much more similar.
We are also still using goal differential to weight match results, by assuming that a 2-1 victory was less assured than a 4-1 victory, and therefore that the model should take model errors to the latter more seriously than the former.
*Last year I introduced, mid-season, Plus/Minus values for players based upon how goals were scored when a player is on the field. The Plus/Minus values won’t be in this initial, post, but they will be returning.
What changed from last year
The biggest change is that I’ve now added Travel Distance as a factor into the model. Last season I did some data exploration for potential causes of home field advantage, and I found that Travel Distance could sometimes have a decent effect on the Away team performance (even though the effect is not necessarily what we’d expect).
I also intend to add short rest (and short upcoming rest) into the model in the next couple of weeks, but I’m just not there yet (and it should have a modest effect based upon previous research).
When doing early-season forecasts, instead of manually setting a parameter to adjust the confidence of manual predictions, I am now looking back at the previous season to set this parameter. For example, with currently only 2017 data to predict the 2018 season, I look back at how predictive 2016 data was for the 2017 season to set the confidence of my 2018 model.
Graphics. I’m working to embed interactive charts into these posts instead of the many images I copied/pasted previously to demonstrate results. For the moment it’s not quite available on PSP directly, but for the time being I’ll post both the old format as well as some links to the interactive charts so that you can peruse however you’d like. Hopefully, these charts will also get better over time. Let me know if you have a suggestion.
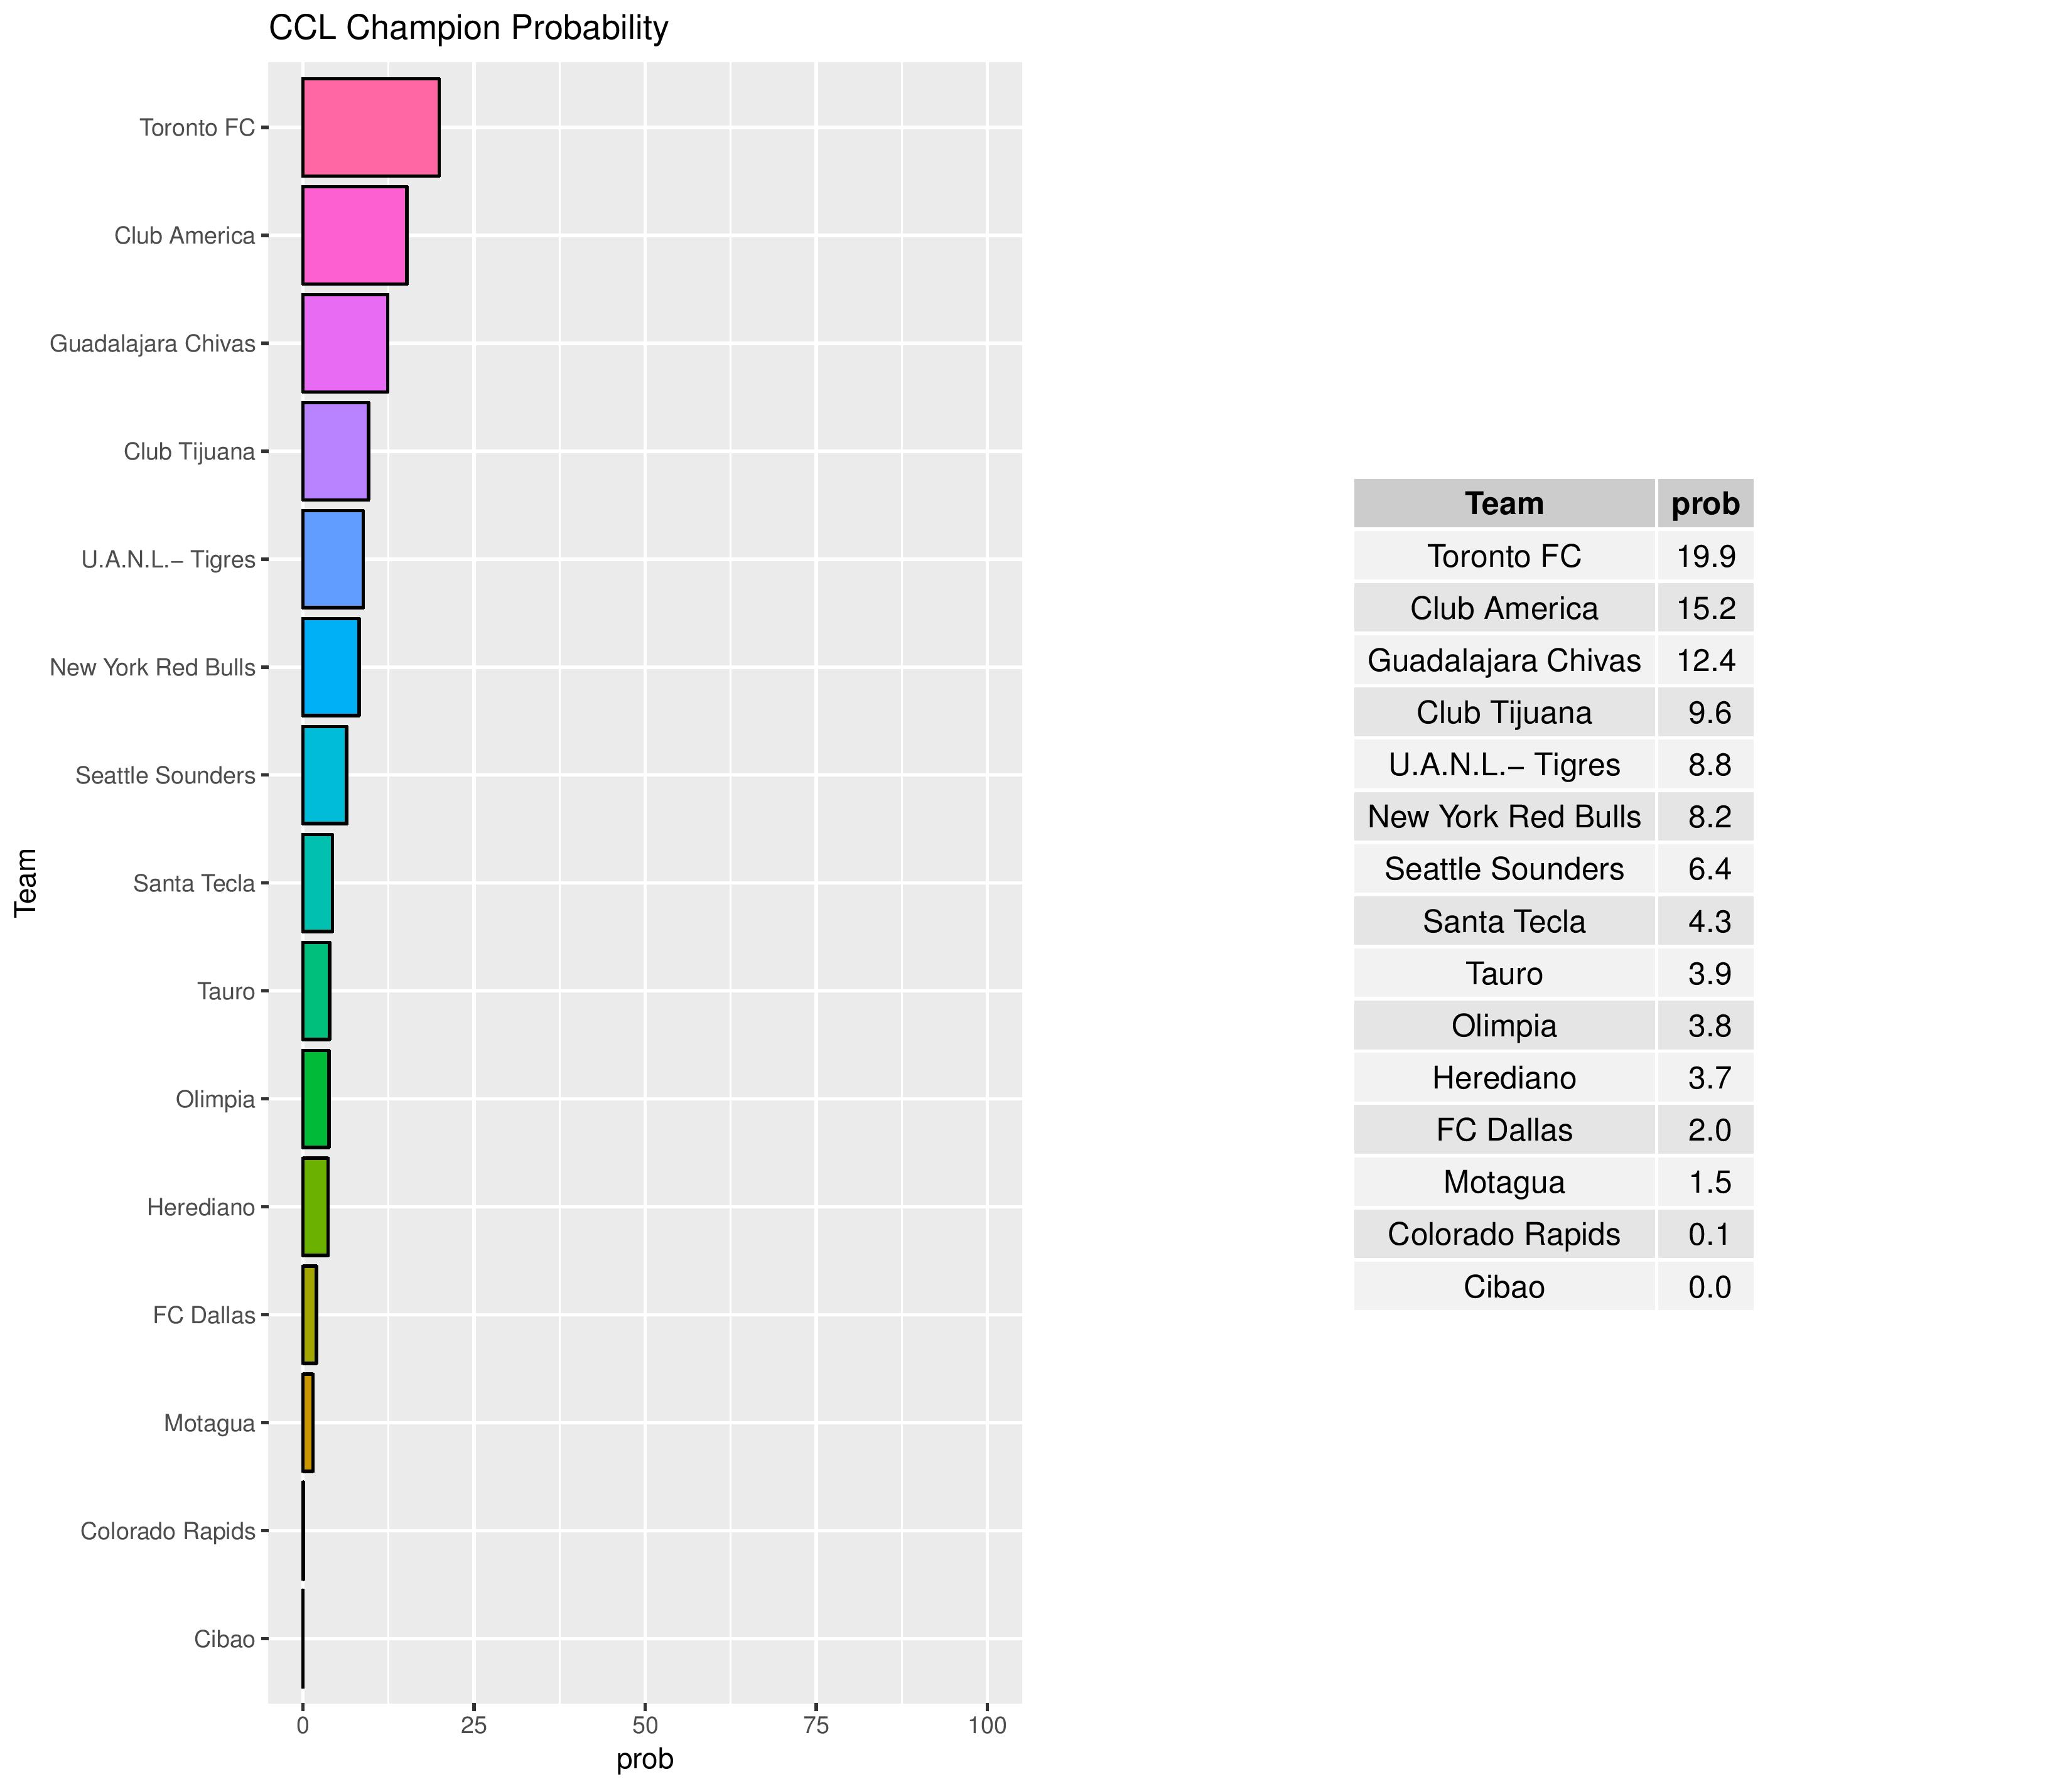
CONCACAF Champions League: I’m now forecasting the 2018 CCL Championship winners. To help with this, I’m bringing in data from the Costa Rica, Honduras, Panama, El Salvador, and Dominican top domestic leagues (I was already using Mexico’s) to help with those predictions.
I am no longer going to do power rankings comparisons (with other media outlets), because it was a fair amount of manual work. I’d rather focus that time on researching the data instead.
Graphics
You can view a more interactive chart here
Power Rankings
The “Power Rankings” we concoct are the actual “strength” of the team according to competitive expectations. They are computed showing average expected points result if every team in MLS played every team both home and away.
SEBA has Philadelphia in 10th.

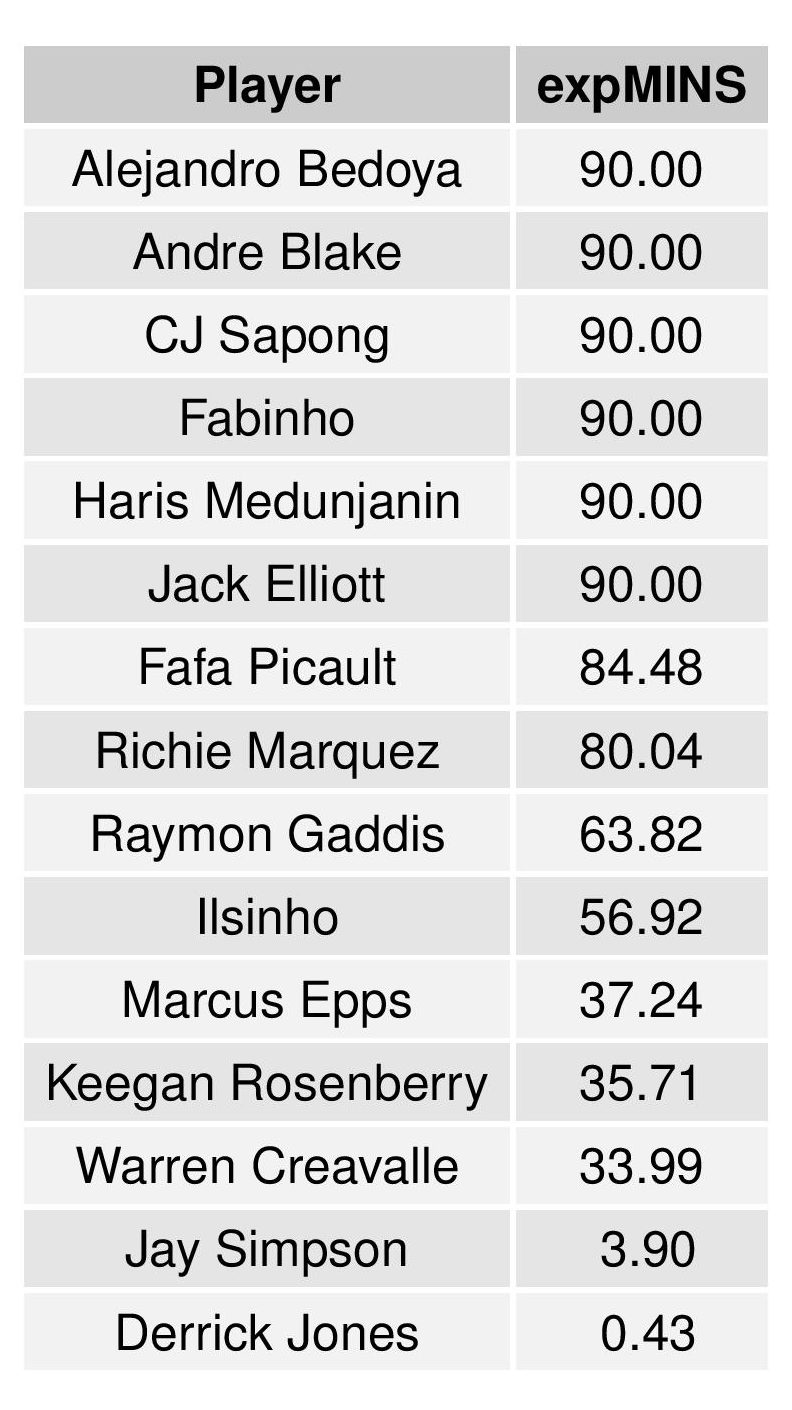
Currently, Philadelphia’s performance expectation is set by the following distribution of minutes:
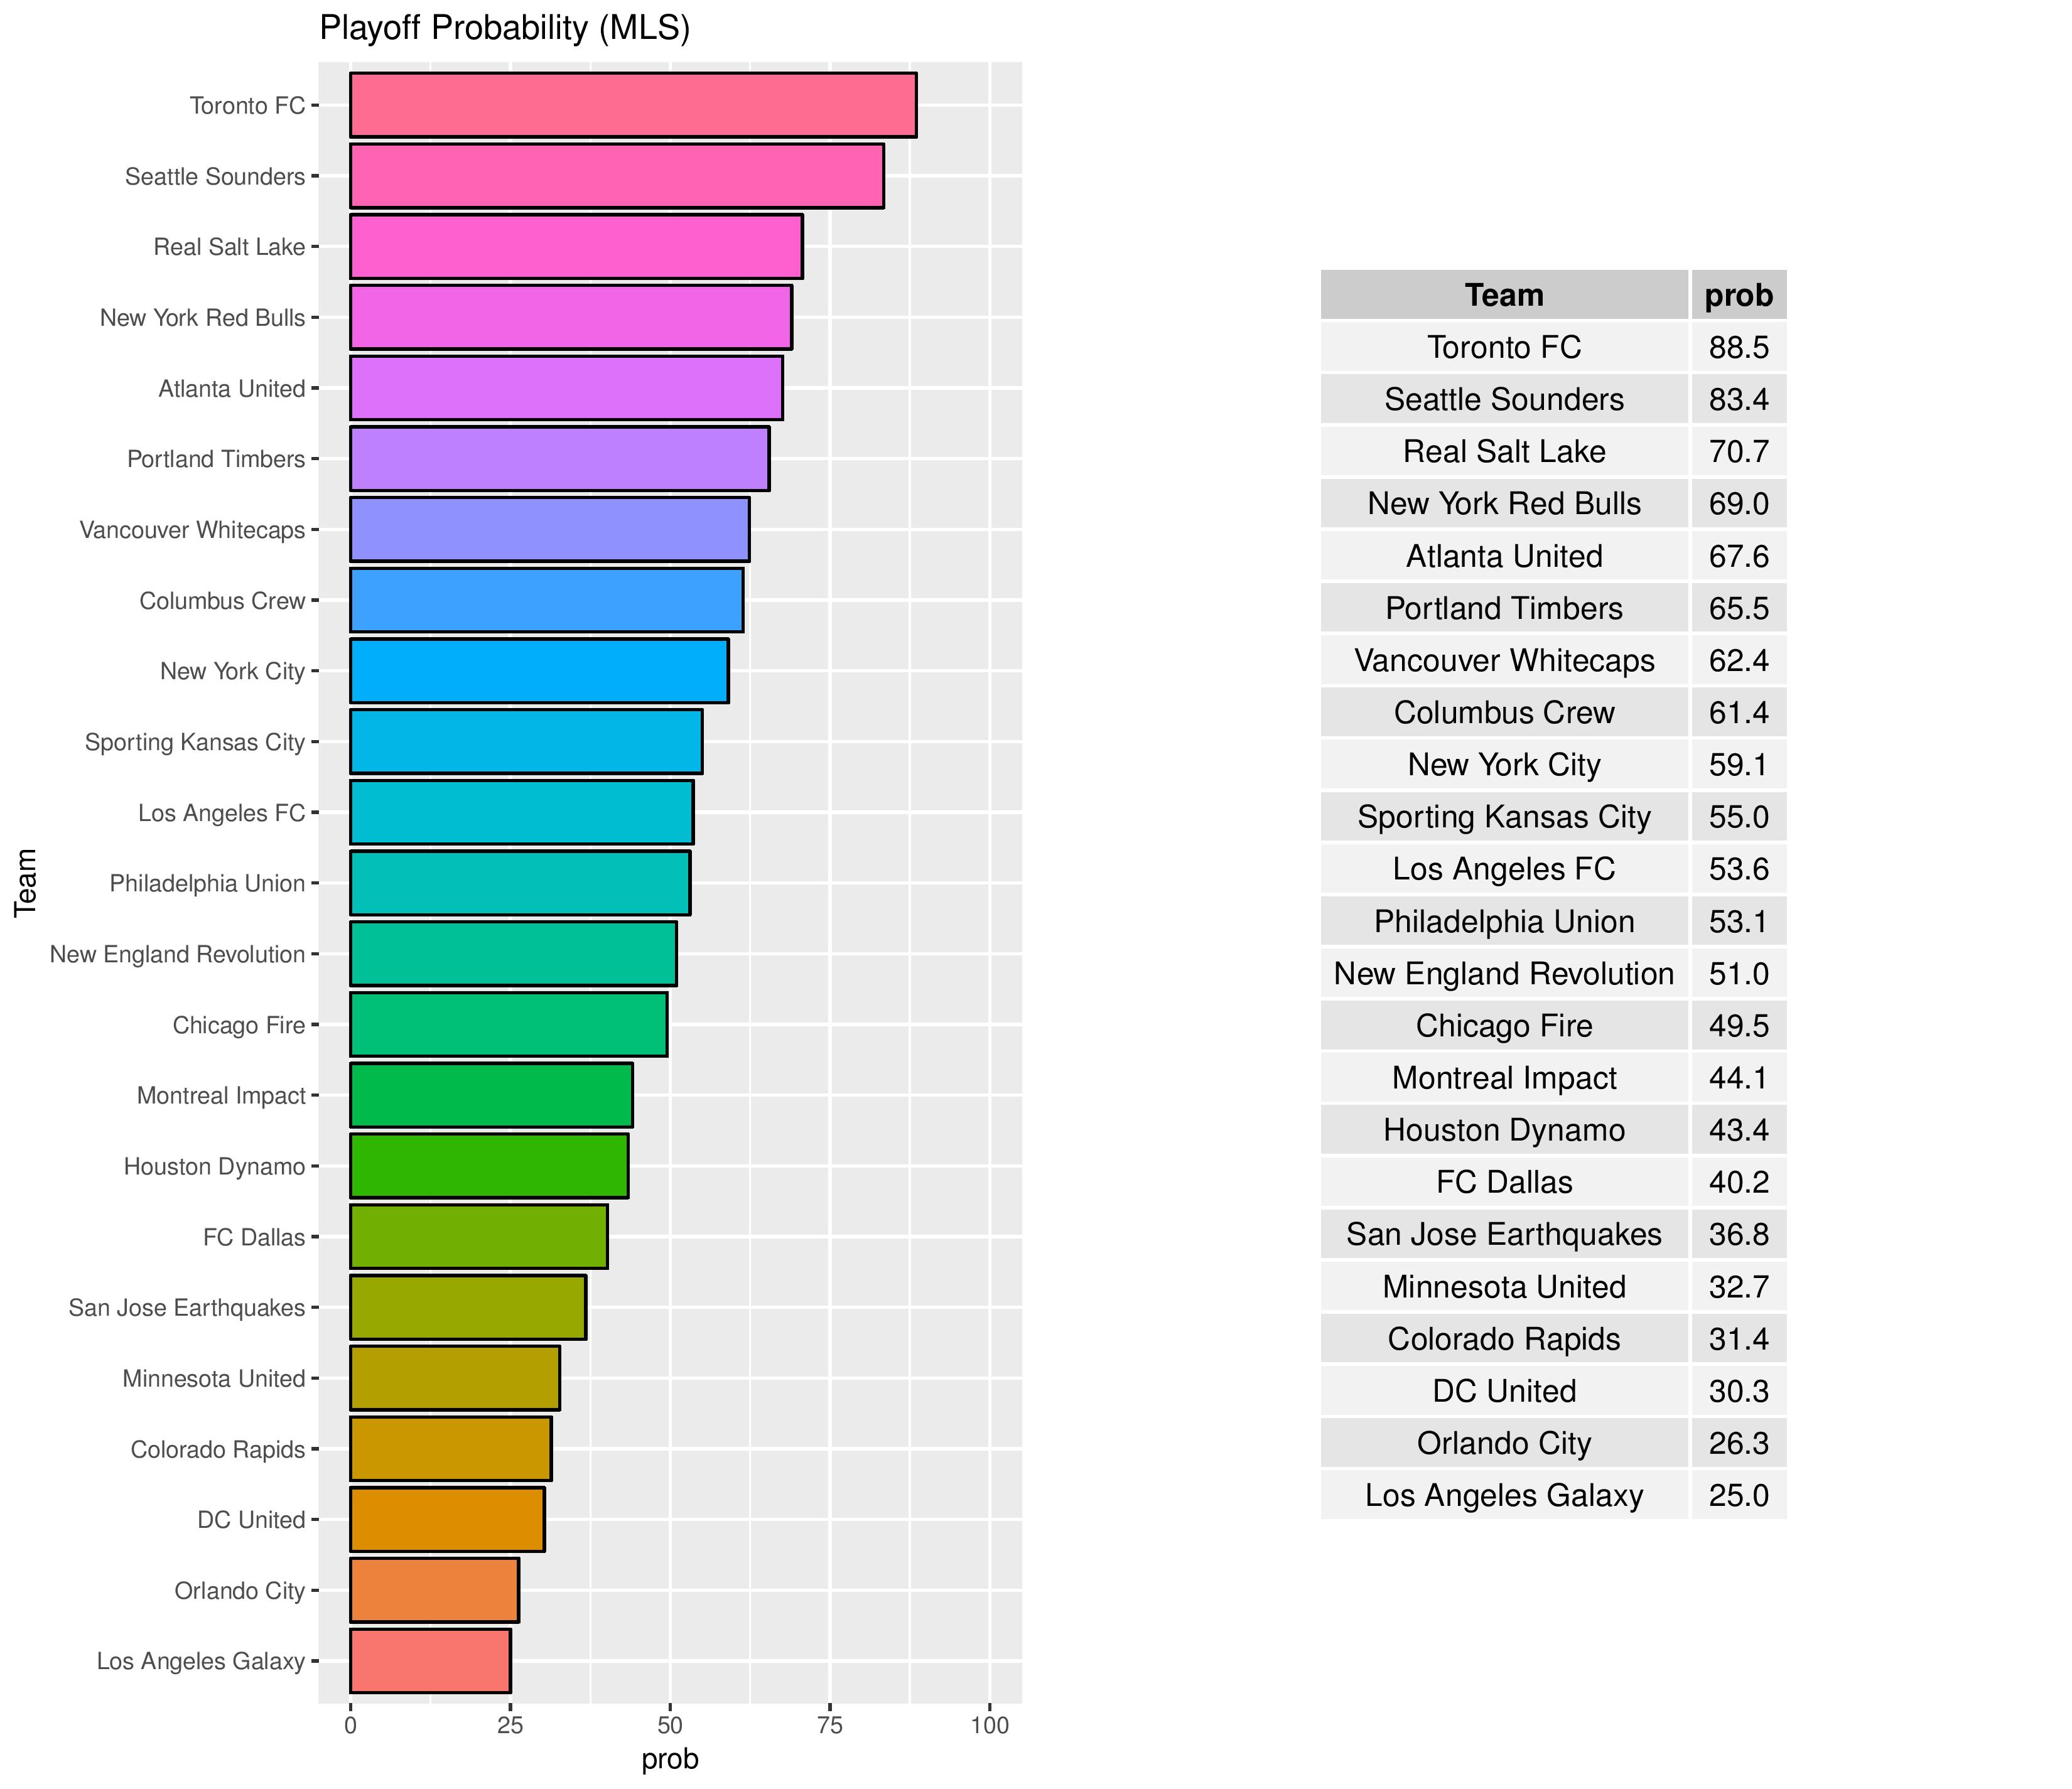
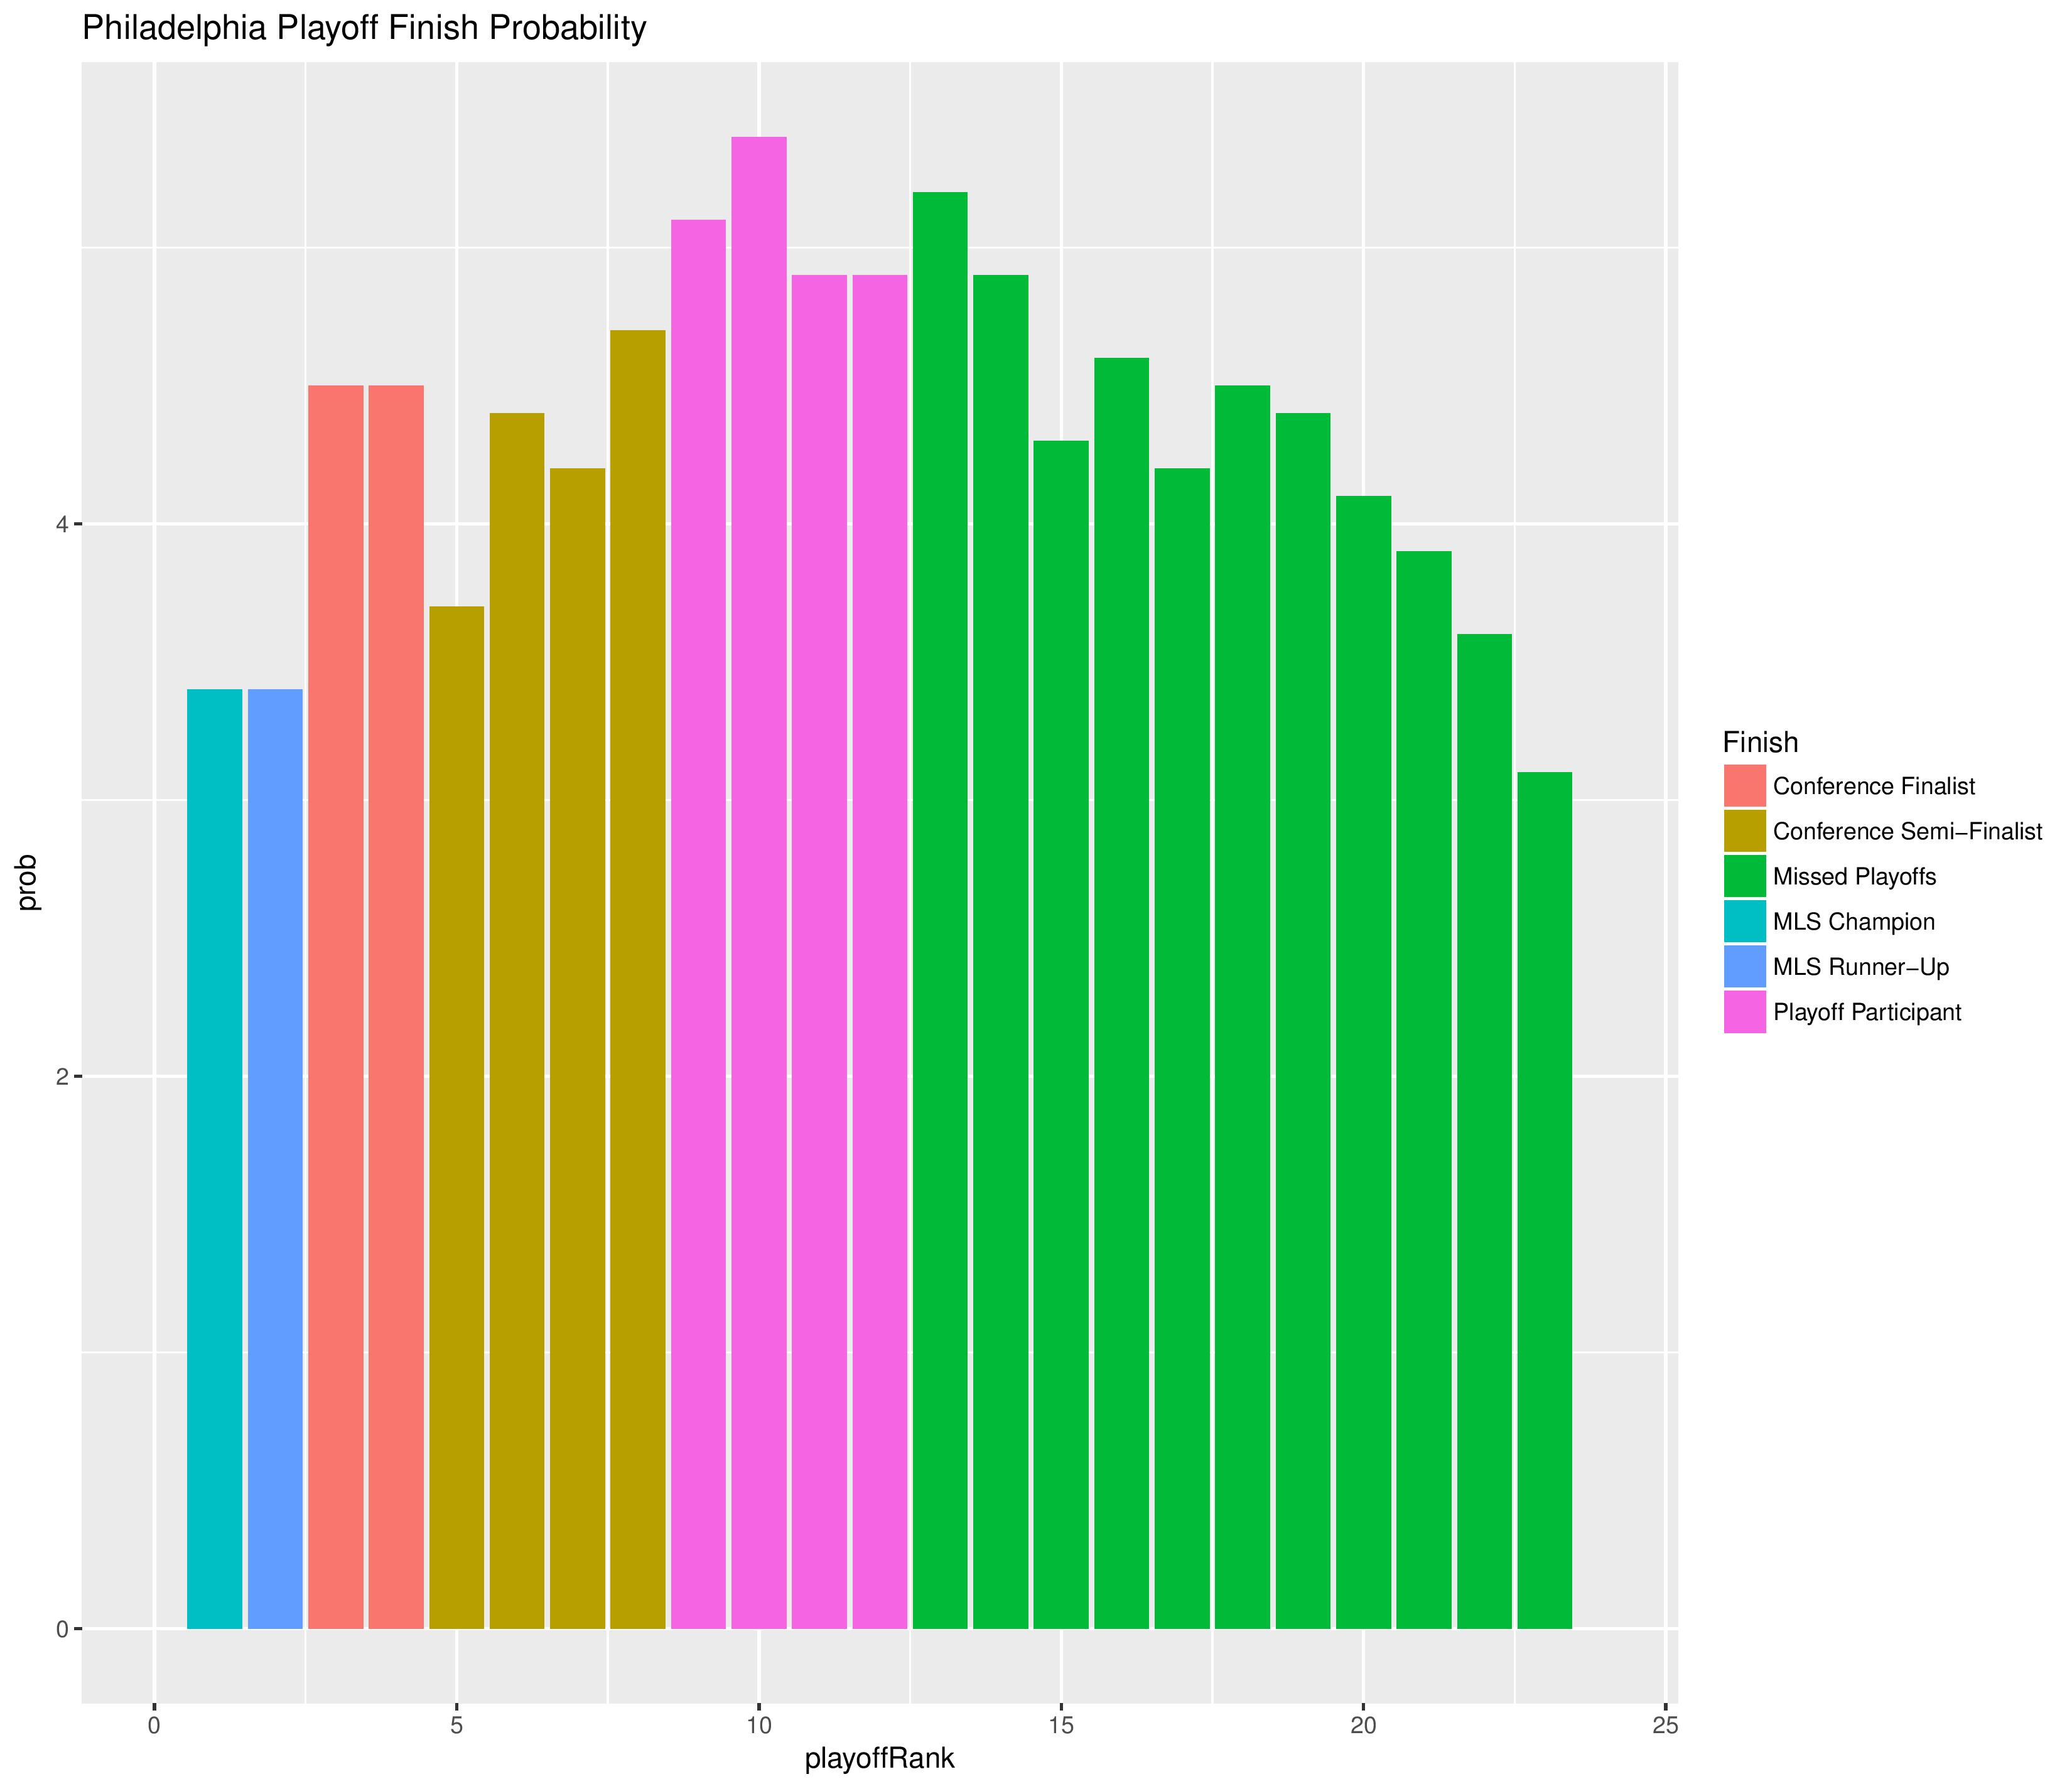
Playoffs probability and more
Philadelphia has a 53.1% chance of making the playoffs.
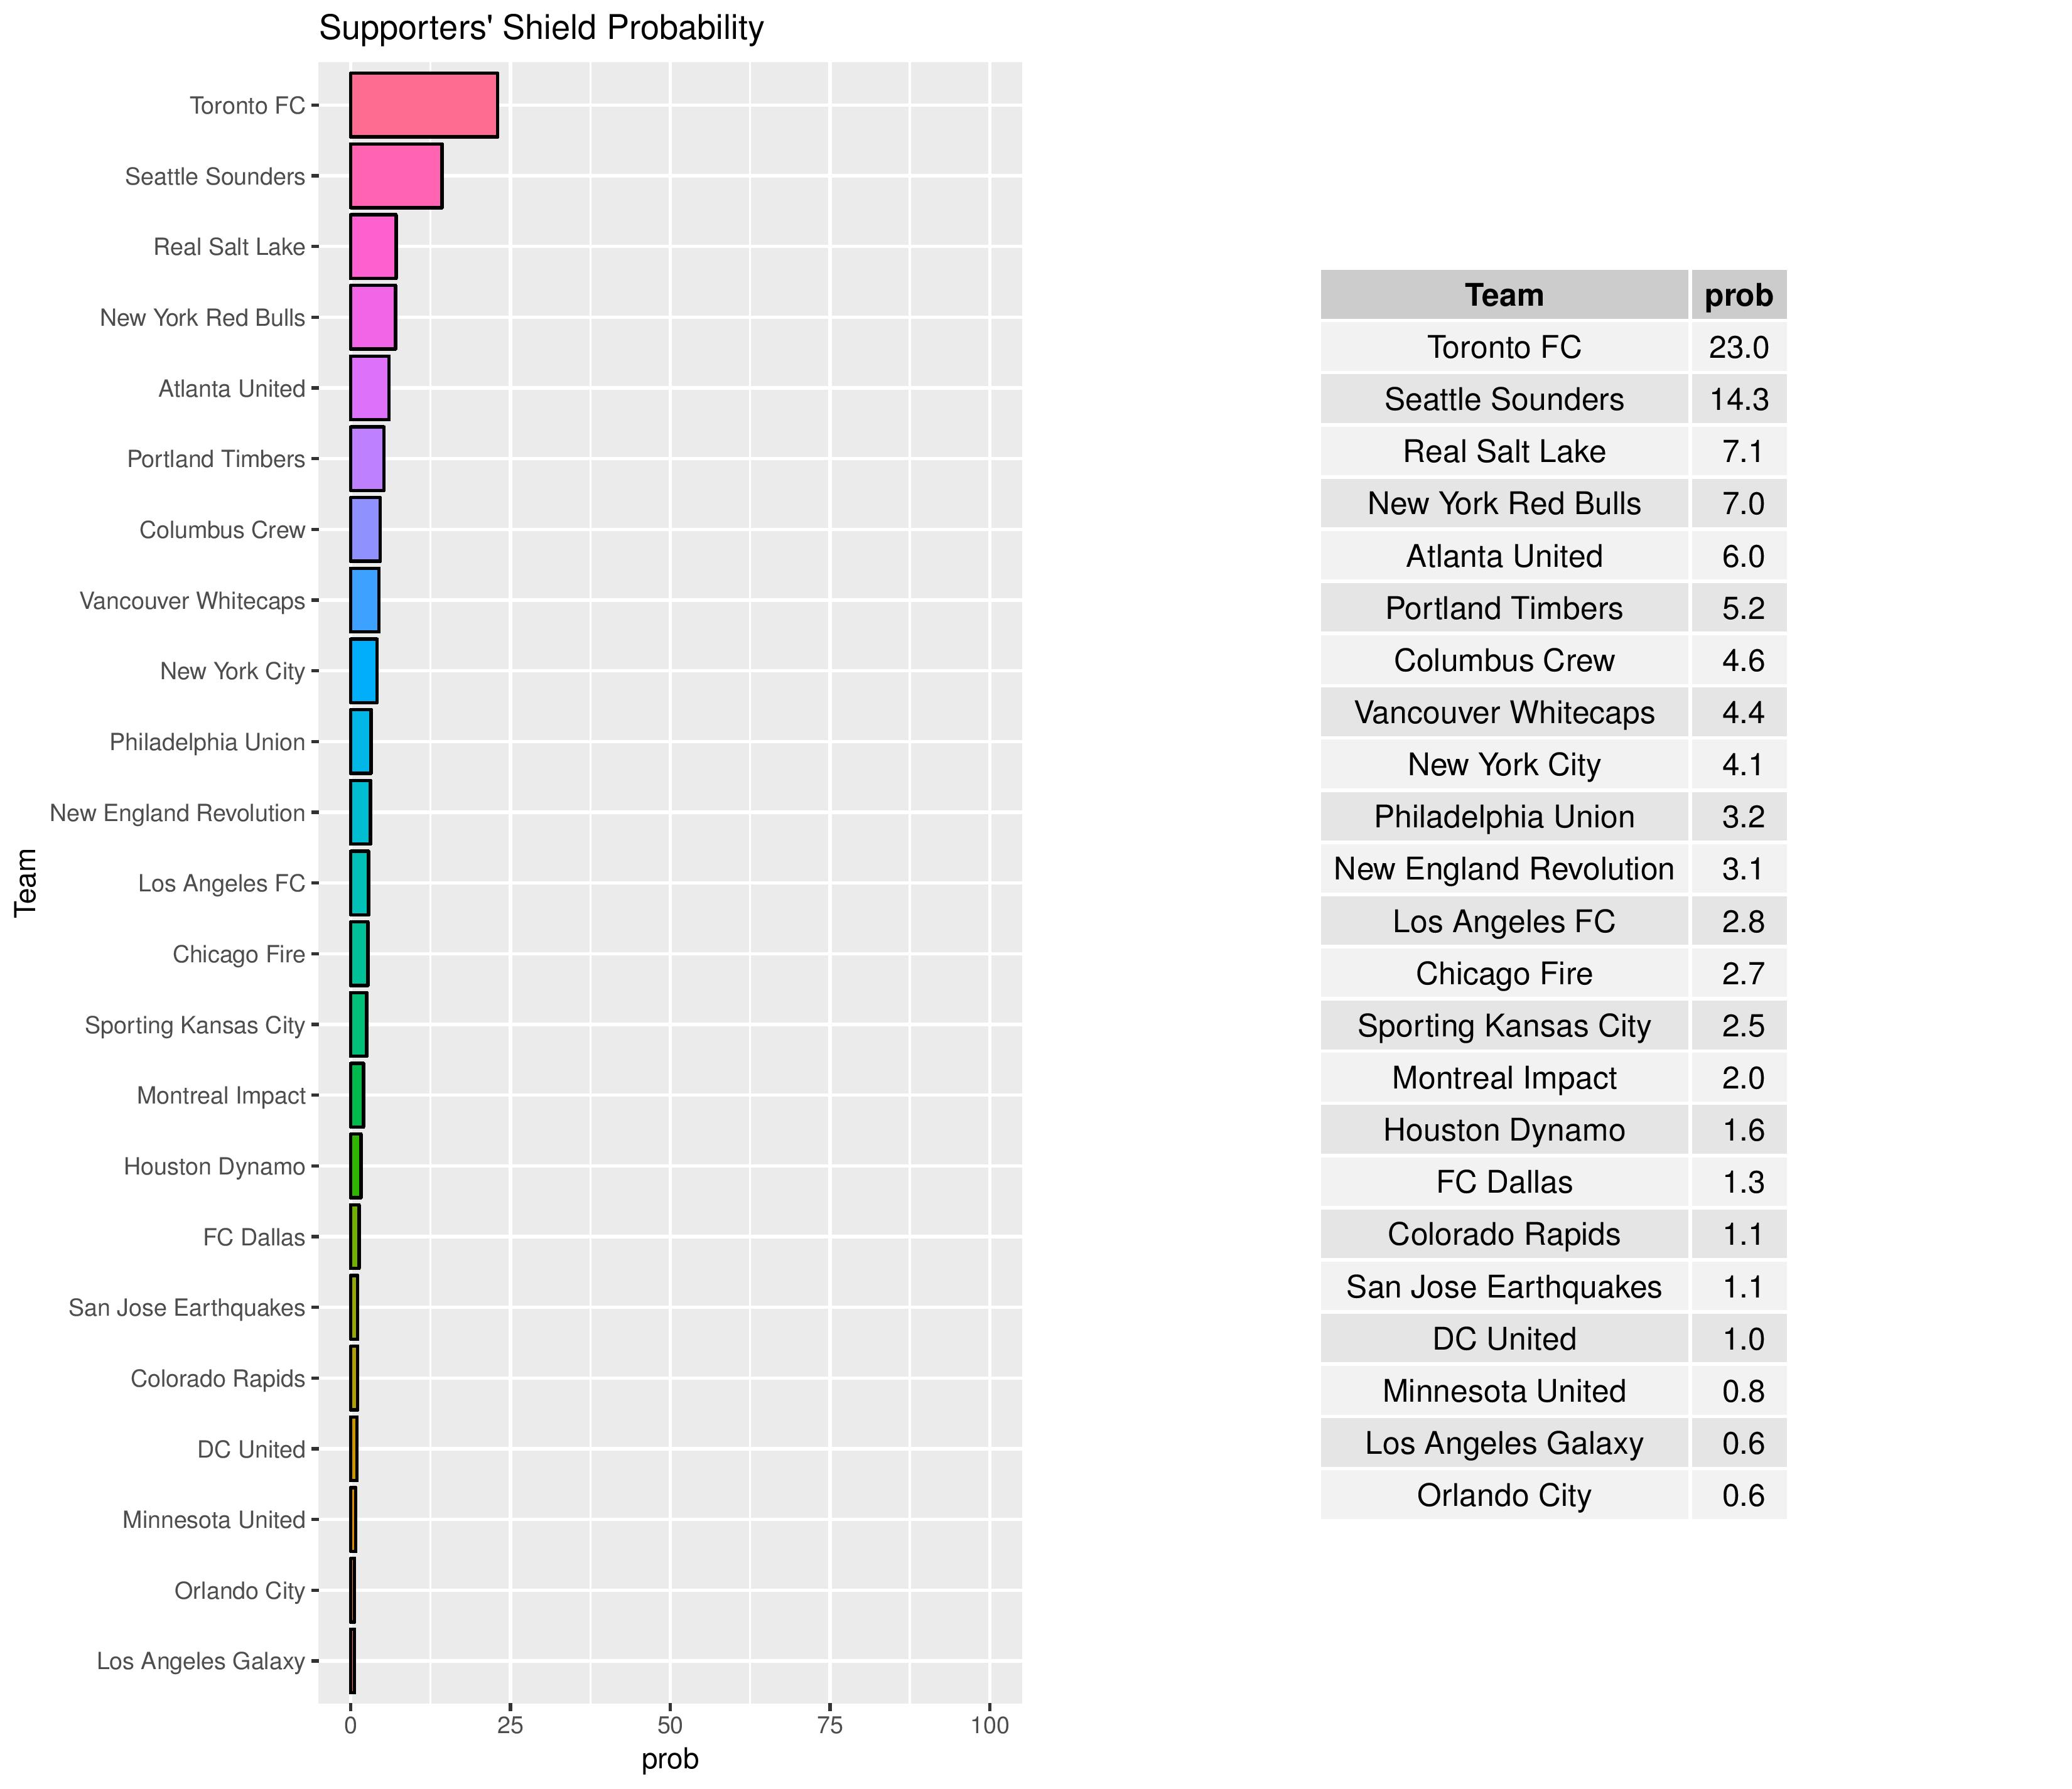
Philadelphia is started off with a 3.2% chance of winning the Supporters’ Shield.
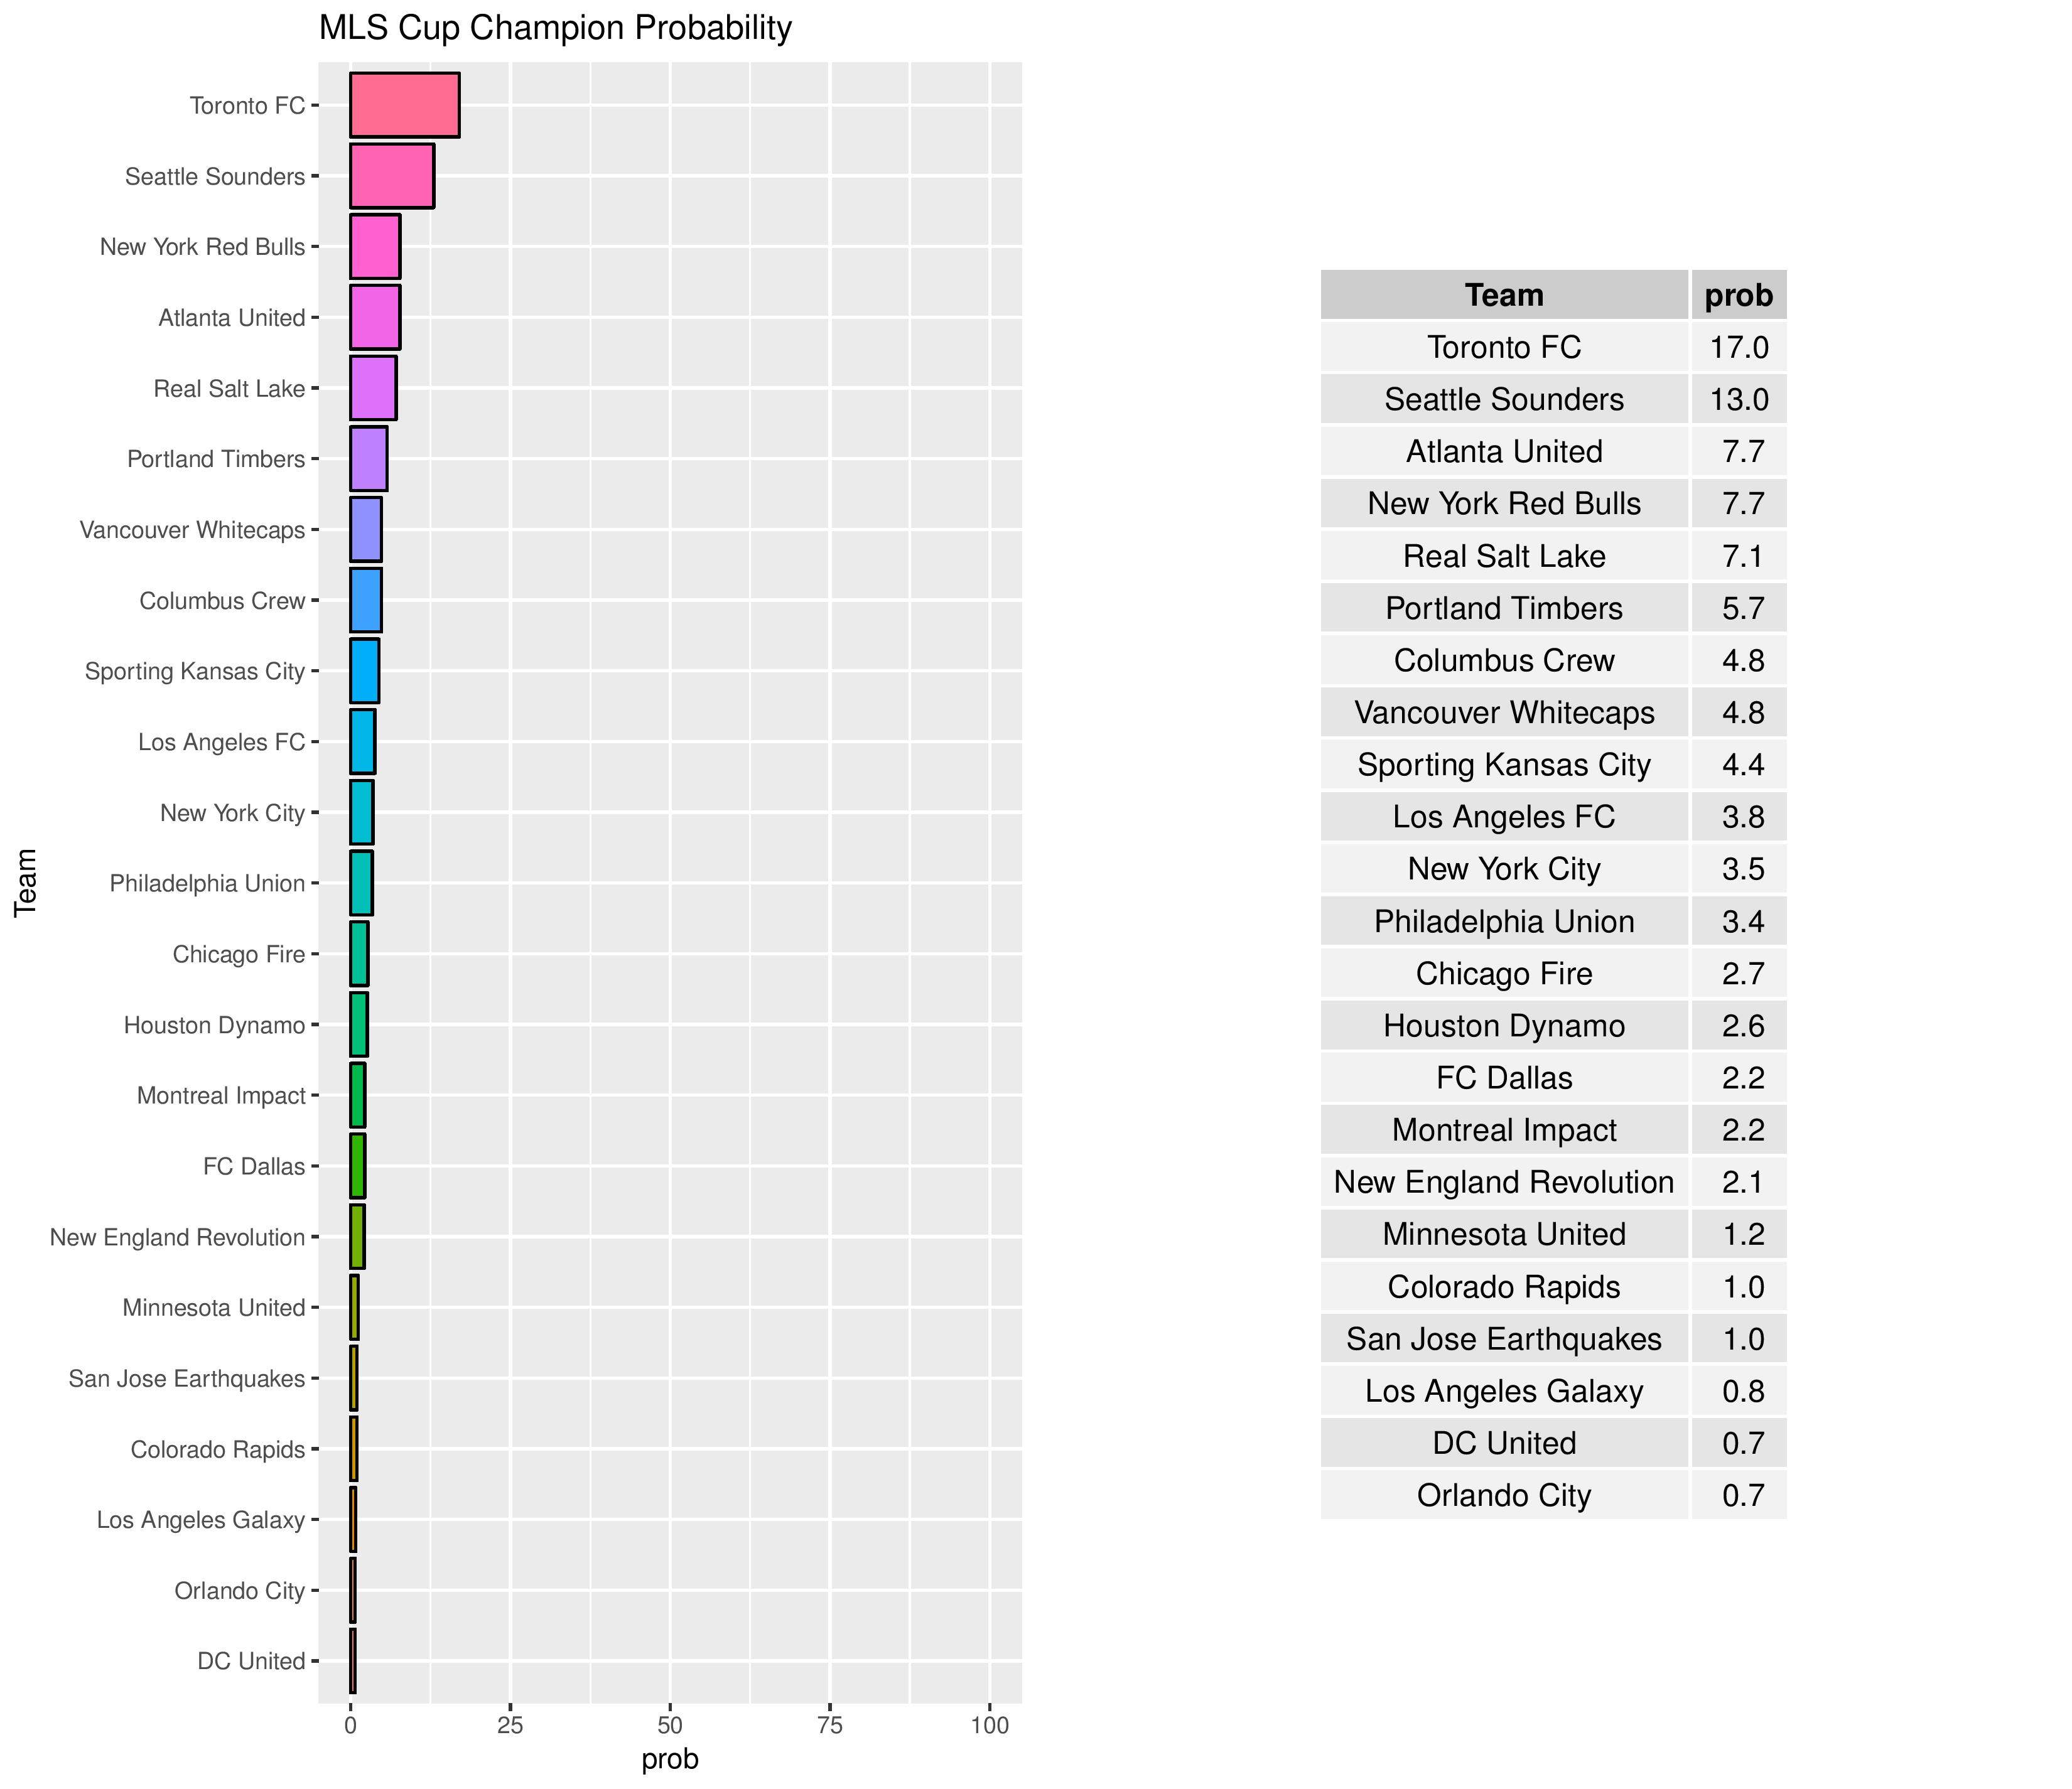
The Union has a 3.4% chance of winning the MLS Cup.
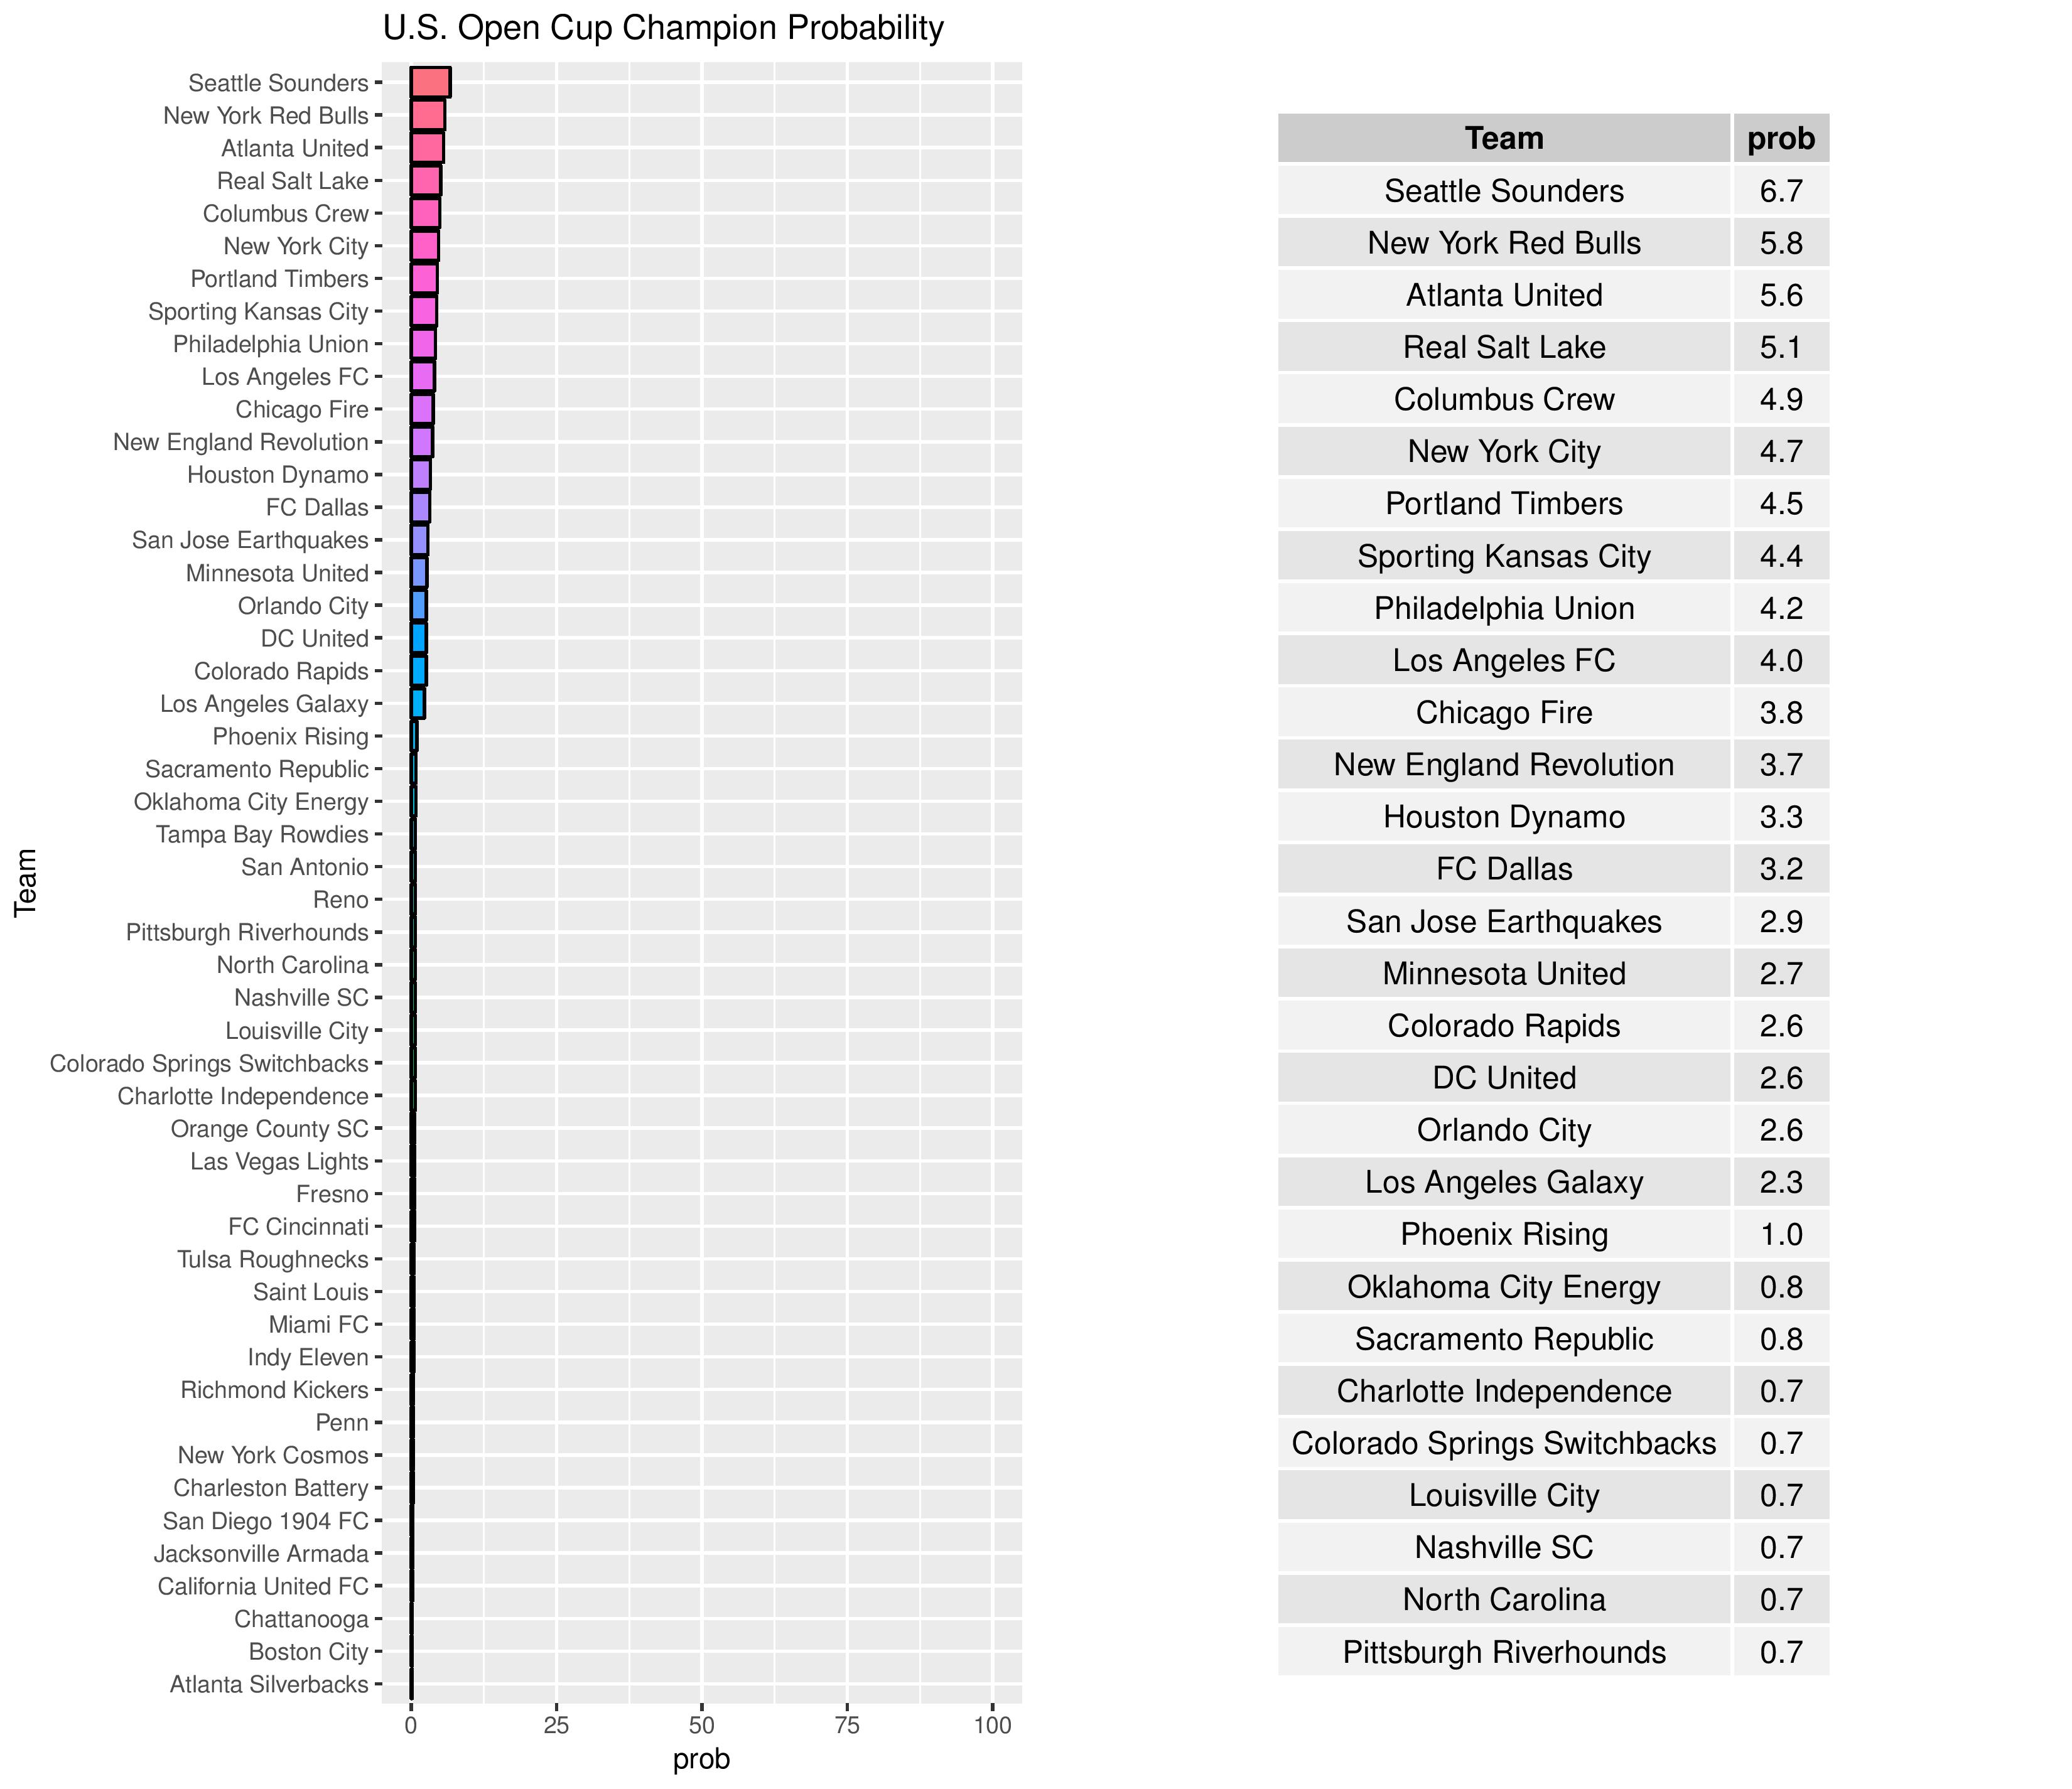
As the 2018 US Open Cup’s format has not yet been announced, I have made some assumptions based upon last year. The most challengable assumption I had to make to adapt to 2018 is that I have the 5 eligible NASL clubs entering the competition in the first round along with other sub-2nd-division clubs.
Philadelphia is currently marked as having a U.S. Open Cup win probability of 4.2%.
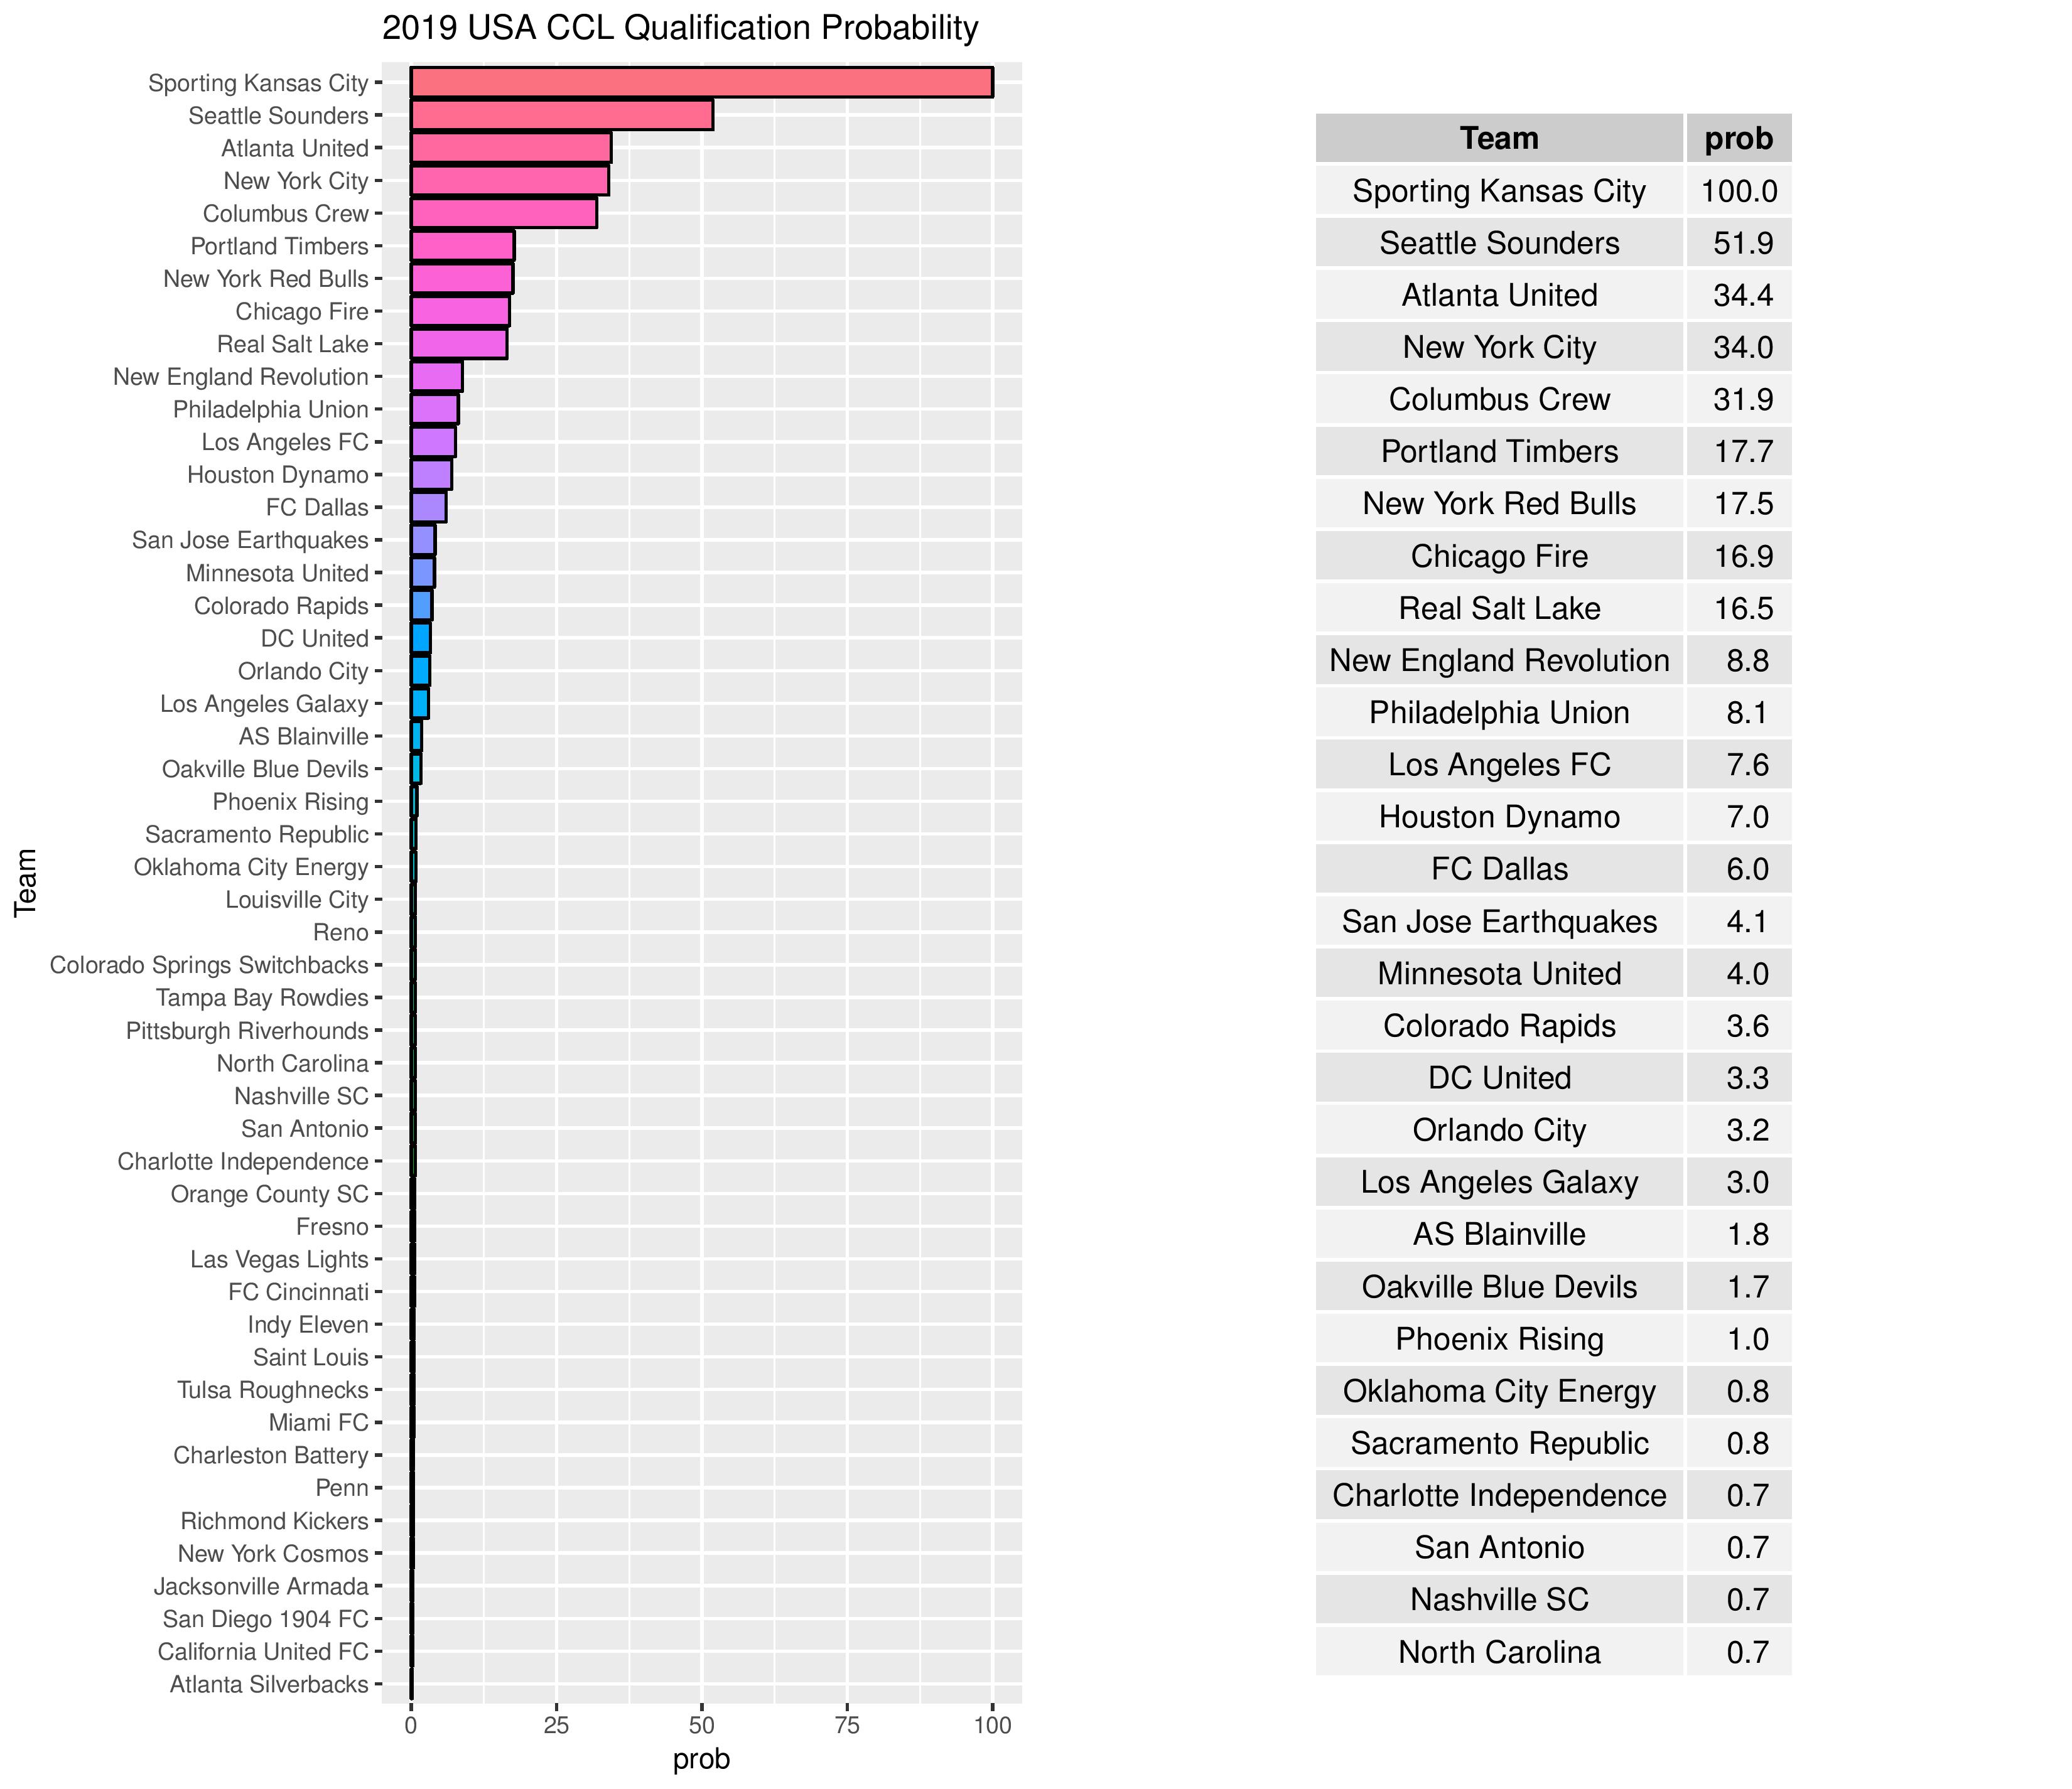
The 2019 CONCACAF Champions League qualification from the U.S. was supposed to be the 2017 & 2018 winners of the U.S. Open Cup and the MLS Cup. This is why Kansas City has already qualified. However, since Toronto (not eligible for a U.S. qualification slot) won the MLS Cup, that slot (and any other future Canadian or Kansas City wins) will be given to the club with the most regular season points over both 2017 and 2018.
Philadelphia is presently listed as having an 8.1% chance of qualifying for the 2019 edition of the CONCACAF Champions League.
The following are the probabilities of each final playoffs placement for Philadelphia.
The following shows the summary of the simulations in an easy table format.
| Team | Conf | pts | W | L | T | GF | GA | GD | powerRk | pwrScr | Plyfs | MLSCup | Shld | USOCChmp | CANChmp | CCLQual | CCLChmp | confRegSeasFinish | regSeasFinish | plyfFinish |
|---|---|---|---|---|---|---|---|---|---|---|---|---|---|---|---|---|---|---|---|---|
| New York Red Bulls | East | 71 | 22 | 7 | 5 | 62 | 33 | 29 | 2 | 1.852 | 100 | 30.7 | 100 | 0 | NA | 69.7 | 0 | 1 | 1 | 2.9 |
| Atlanta United | East | 69 | 21 | 7 | 6 | 70 | 44 | 26 | 1 | 1.871 | 100 | 24.1 | 0 | 0 | NA | 100 | NA | 2 | 2 | 3.3 |
| Sporting Kansas City | West | 62 | 18 | 8 | 8 | 65 | 40 | 25 | 3 | 1.736 | 100 | 14.9 | 0 | 0 | NA | 100 | NA | 1 | 3 | 3.6 |
| Seattle Sounders | West | 59 | 18 | 11 | 5 | 52 | 37 | 15 | 5 | 1.613 | 100 | 8.1 | 0 | 0 | NA | 8.1 | 0 | 2 | 4 | 4.4 |
| Los Angeles FC | West | 57 | 16 | 9 | 9 | 68 | 52 | 16 | 4 | 1.65 | 100 | 7.7 | 0 | 0 | NA | 7.7 | NA | 3 | 5 | 5.2 |
| FC Dallas | West | 57 | 16 | 9 | 9 | 52 | 44 | 8 | 6 | 1.571 | 100 | 4.2 | 0 | 0 | NA | 4.2 | 0 | 4 | 6 | 6.4 |
| New York City | East | 56 | 16 | 10 | 8 | 59 | 45 | 14 | 8 | 1.547 | 100 | 3.3 | 0 | 0 | NA | 3.3 | NA | 3 | 7 | 6.7 |
| Portland Timbers | West | 54 | 15 | 10 | 9 | 54 | 48 | 6 | 7 | 1.554 | 100 | 1.8 | 0 | 0 | NA | 1.8 | NA | 5 | 8 | 8.2 |
| DC United | East | 51 | 14 | 11 | 9 | 60 | 50 | 10 | 9 | 1.521 | 100 | 3.5 | 0 | 0 | NA | 3.5 | NA | 4 | 9 | 7.3 |
| Columbus Crew | East | 51 | 14 | 11 | 9 | 43 | 45 | -2 | 11 | 1.4 | 100 | 0.7 | 0 | 0 | NA | 0.7 | NA | 5 | 10 | 9.3 |
| Philadelphia Union | East | 50 | 15 | 14 | 5 | 49 | 50 | -1 | 10 | 1.416 | 100 | 0.6 | 0 | 0 | NA | 0.6 | NA | 6 | 11 | 9.9 |
| Real Salt Lake | West | 49 | 14 | 13 | 7 | 55 | 58 | -3 | 15 | 1.319 | 100 | 0.3 | 0 | 0 | NA | 0.3 | NA | 6 | 12 | 10.9 |
| Los Angeles Galaxy | West | 48 | 13 | 12 | 9 | 66 | 64 | 2 | 14 | 1.322 | 0 | 0 | 0 | 0 | NA | 0 | NA | 7 | 13 | 13 |
| Vancouver Whitecaps | West | 47 | 13 | 13 | 8 | 54 | 67 | -13 | 16 | 1.227 | 0 | 0 | 0 | NA | 0 | 0 | NA | 8 | 14 | 14 |
| Montreal Impact | East | 46 | 14 | 16 | 4 | 47 | 53 | -6 | 12 | 1.388 | 0 | 0 | 0 | NA | 0 | 0 | NA | 7 | 15 | 15 |
| New England Revolution | East | 41 | 10 | 13 | 11 | 49 | 55 | -6 | 18 | 1.189 | 0 | 0 | 0 | 0 | NA | 0 | NA | 8 | 16 | 16 |
| Houston Dynamo | West | 38 | 10 | 16 | 8 | 58 | 58 | 0 | 17 | 1.199 | 0 | 0 | 0 | 100 | NA | 100 | NA | 9 | 17 | 17 |
| Minnesota United | West | 36 | 11 | 20 | 3 | 49 | 71 | -22 | 21 | 0.963 | 0 | 0 | 0 | 0 | NA | 0 | NA | 10 | 18 | 18 |
| Toronto FC | East | 36 | 10 | 18 | 6 | 59 | 64 | -5 | 13 | 1.342 | 0 | 0 | 0 | NA | 100 | 100 | 0 | 9 | 19 | 19 |
| Chicago Fire | East | 32 | 8 | 18 | 8 | 48 | 61 | -13 | 19 | 1.068 | 0 | 0 | 0 | 0 | NA | 0 | NA | 10 | 20 | 20 |
| Colorado Rapids | West | 31 | 8 | 19 | 7 | 36 | 63 | -27 | 22 | 0.926 | 0 | 0 | 0 | 0 | NA | 0 | 0 | 11 | 21 | 21 |
| Orlando City | East | 28 | 8 | 22 | 4 | 43 | 74 | -31 | 20 | 0.975 | 0 | 0 | 0 | 0 | NA | 0 | NA | 11 | 22 | 22 |
| San Jose Earthquakes | West | 21 | 4 | 21 | 9 | 49 | 71 | -22 | 23 | 0.806 | 0 | 0 | 0 | 0 | NA | 0 | NA | 12 | 23 | 23 |
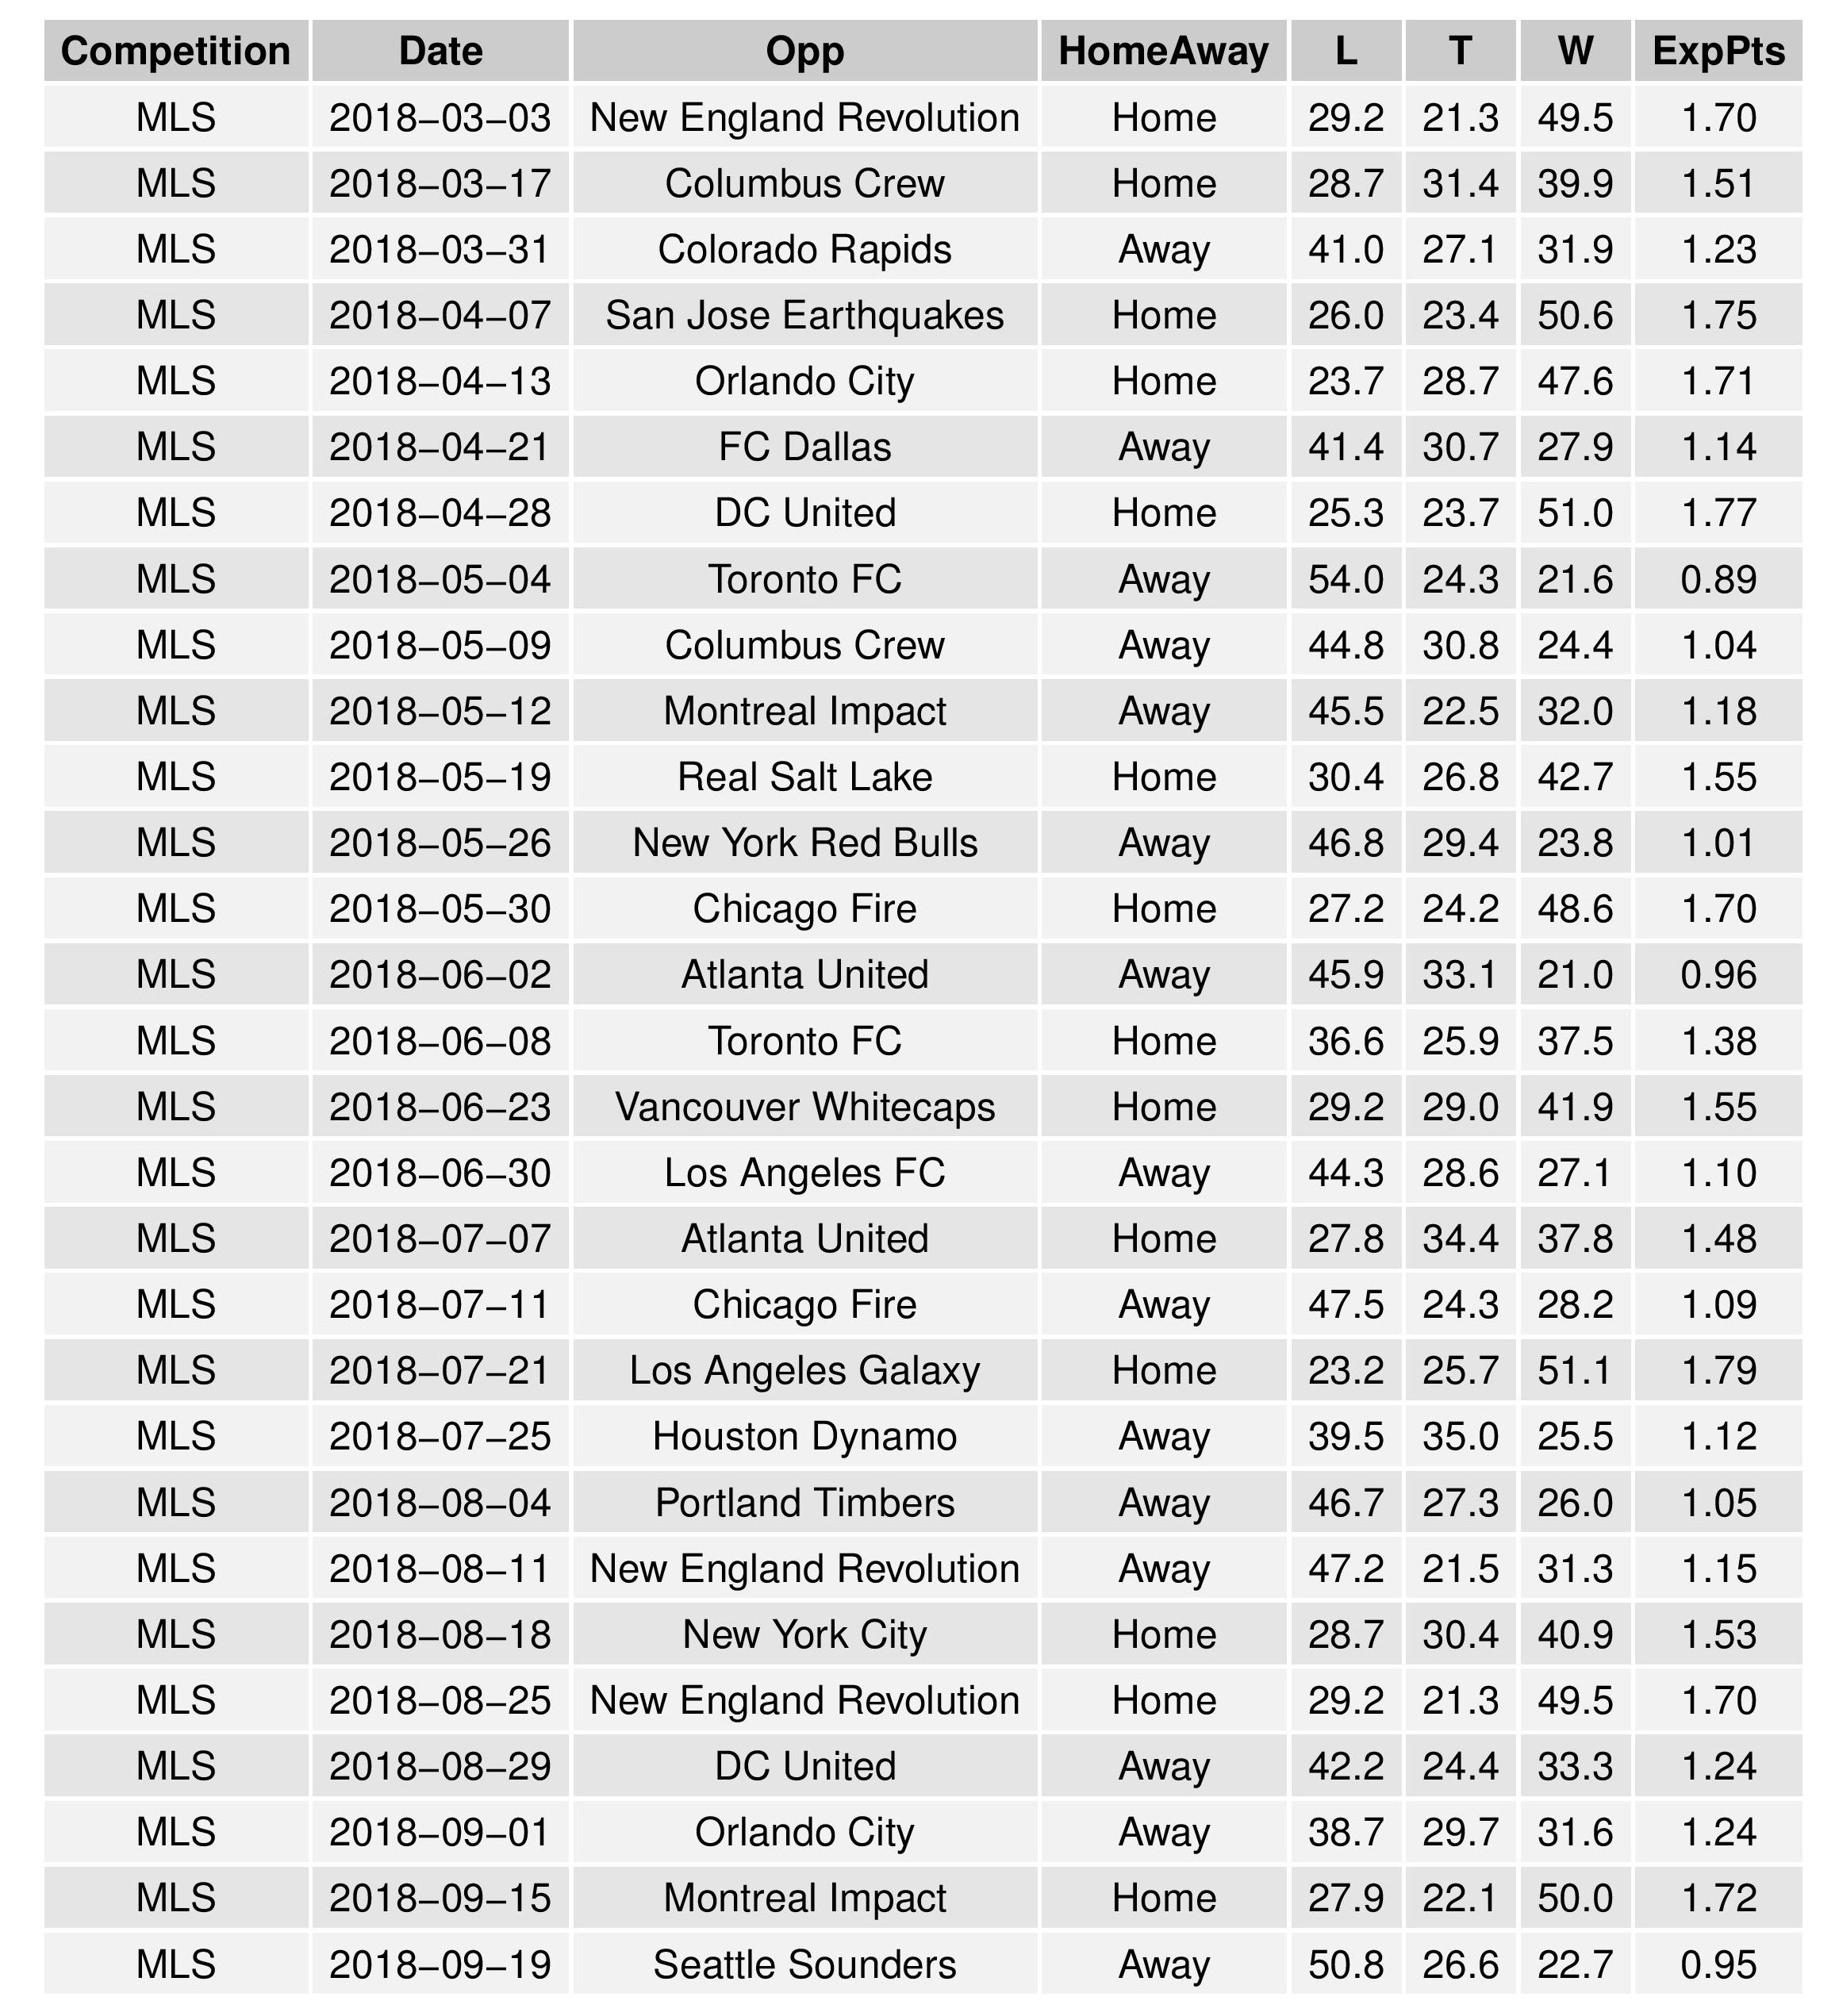
The following shows the expectations for upcoming Philadelphia matches:

This is without Dockal and Accam being factored in? Does is not include the other MLS additions, too? It’s waaaaay more optimistic than I am, anyway.
That’s correct. Right now, the player-scheme is only to weight how informative past matches are for determining the current strength of a club. Once the first match starts Accam, Fontana, and Trusty should factor in more and the model will update. Ultimately, I don’t have a way to forecast how additions will perform until matches start rolling in (although players no longer at the club at all should affect the team’s assessment even now).
–
Also keep in mind that while the Union’s rank is 10th, the relative strength of all the clubs is currently very close due to the model’s uncertainty. Even Toronto, where we actually have some match data from CCL, is only currently estimated to score an additional 0.24 points/per/game than the Union.
Interesting that Philly and NE should be battling it out for the last playoff spot when most pundits think they’ll be fighting for the cellar.
.
Your last graph cuts off at the Seattle game and is missing the last few games of the season. I’m guessing their expected points against Seattle will plummet once you start factoring in short rest since it involves long travel and short rest on both ends (hopefully they’ll be able to use that as a throwaway and not play anyone over the age of 25 except McCarthy).
Perhaps, but my research showed that long distances were quite favorable to Away clubs compared with mid-range-distances, possibly due to clubs taking extra time/preparations for the coast-to-coast trips. Additionally, short rest did seem to have an effect, but had a smaller impact than many of us would expect.
Looking forward to the new Additions, and the graphic interface. Many thanks. Clearly a busy off-season with a lot of effort on our behalf.
.
How did you generate any data for LAFC? You may have already explained that but my brain did not catch it.
Thanks! LAFC doesn’t have any data, which means the model treats it like an average club as far as performance, so that will likely change rapidly as data comes in
I was getting a bit worried the SEBA analysis column wasn’t coming back this season. Keep up the great work Chris!