This is a continuation of the Home Field Advantage statistical analysis series:
Part 1: Traveling Distance (and proof of premise)
This article uses exclusively MLS data for evaluation of results, but it uses MLS, US Open Cup, and CONCACAF Champions League data for the purposes of determining short rest. All data is from 2010 through June 18th, 2017.
Theory #3: Scheduling and short rest
I’m not sure how common a theory it is, but one explanation I’ve heard and considered is that home teams could have a larger amount of rest, and therefore an easier time winning games because of it.
I’ve read that in the NHL, road trips are typically scheduled in a tighter schedule than home stands and therefore home teams are typically more rested than their traveling opponents when they play.
So with this analysis, we test to see:
- Does short rest create any disadvantage on its own.
- Does MLS scheduling apply that disadvantage on away teams.
Short rest effect
Note: For much of this analysis, I cap the amount of rest received at 7 days, suggesting that resting for longer does not actually improve a team’s odds for competition. I reached this number through testing different numbers and the availability of data, which is not very well represented at greater than 7 days.
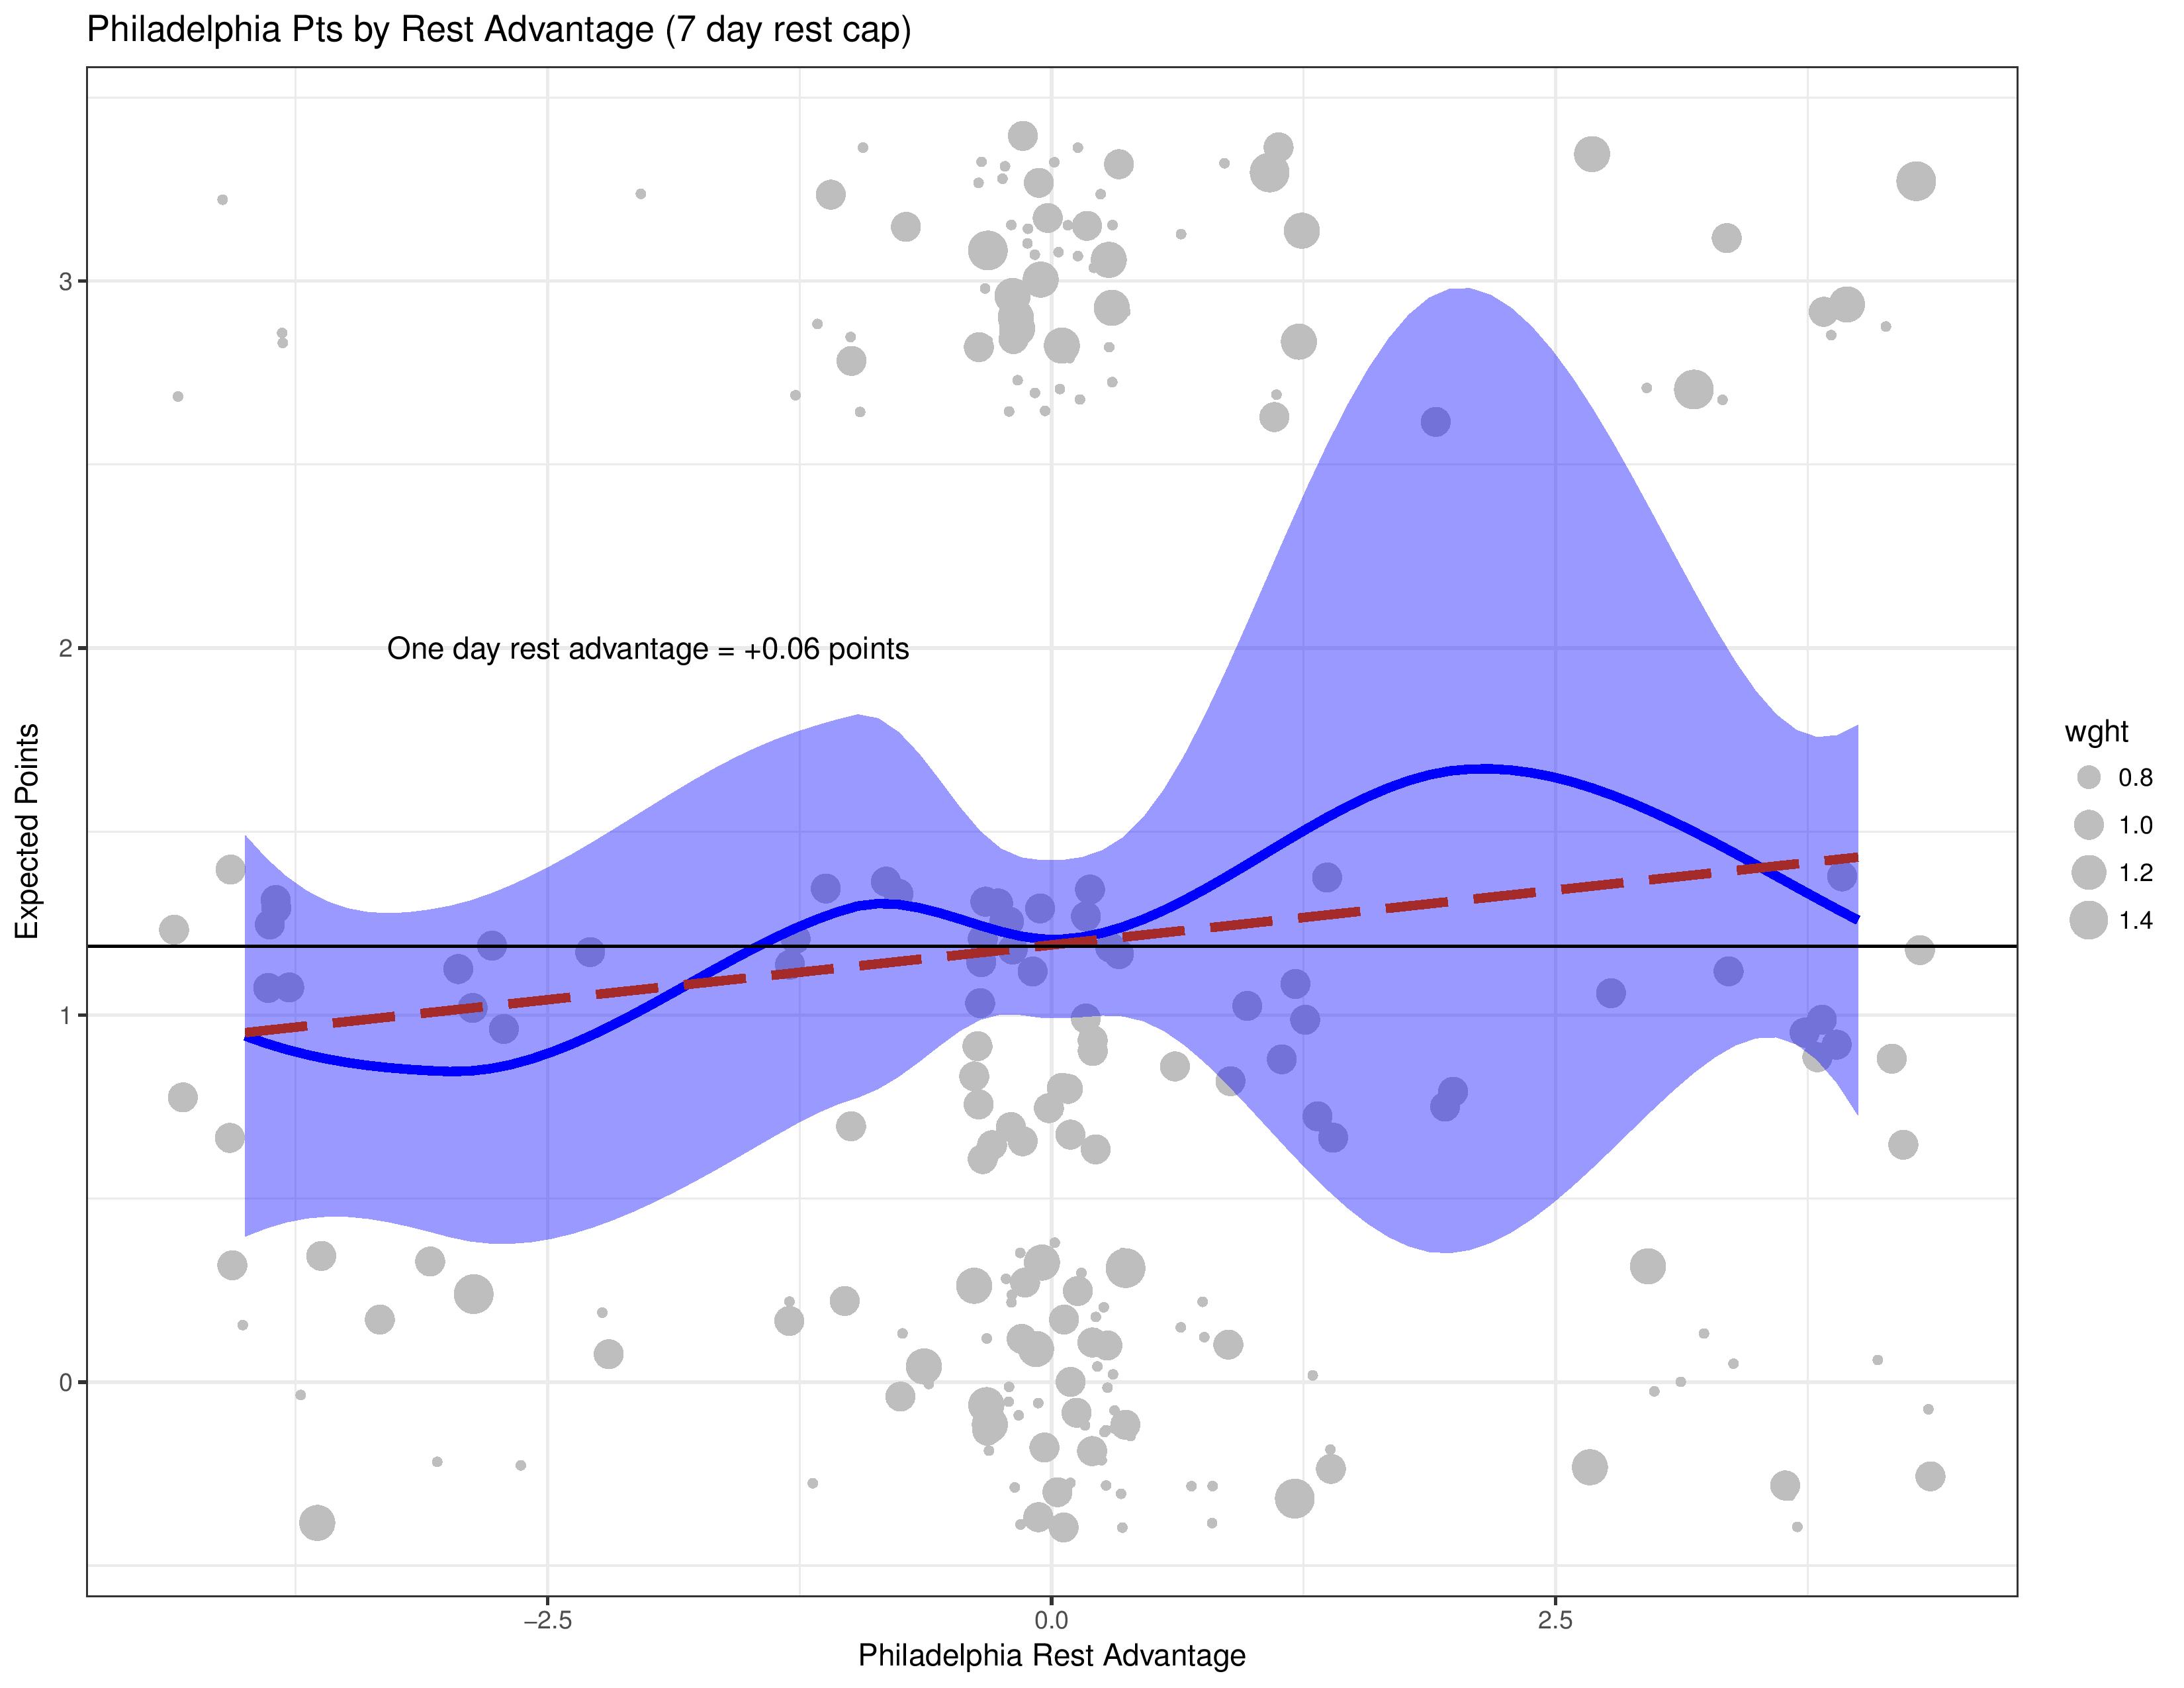
The following chart shows the relationship between a team’s rest advantage (team rest minus opponent rest) and the amount of win/loss/draw points.
If you’d like a legend of what each element in the chart is, please check out the previous article in this series.
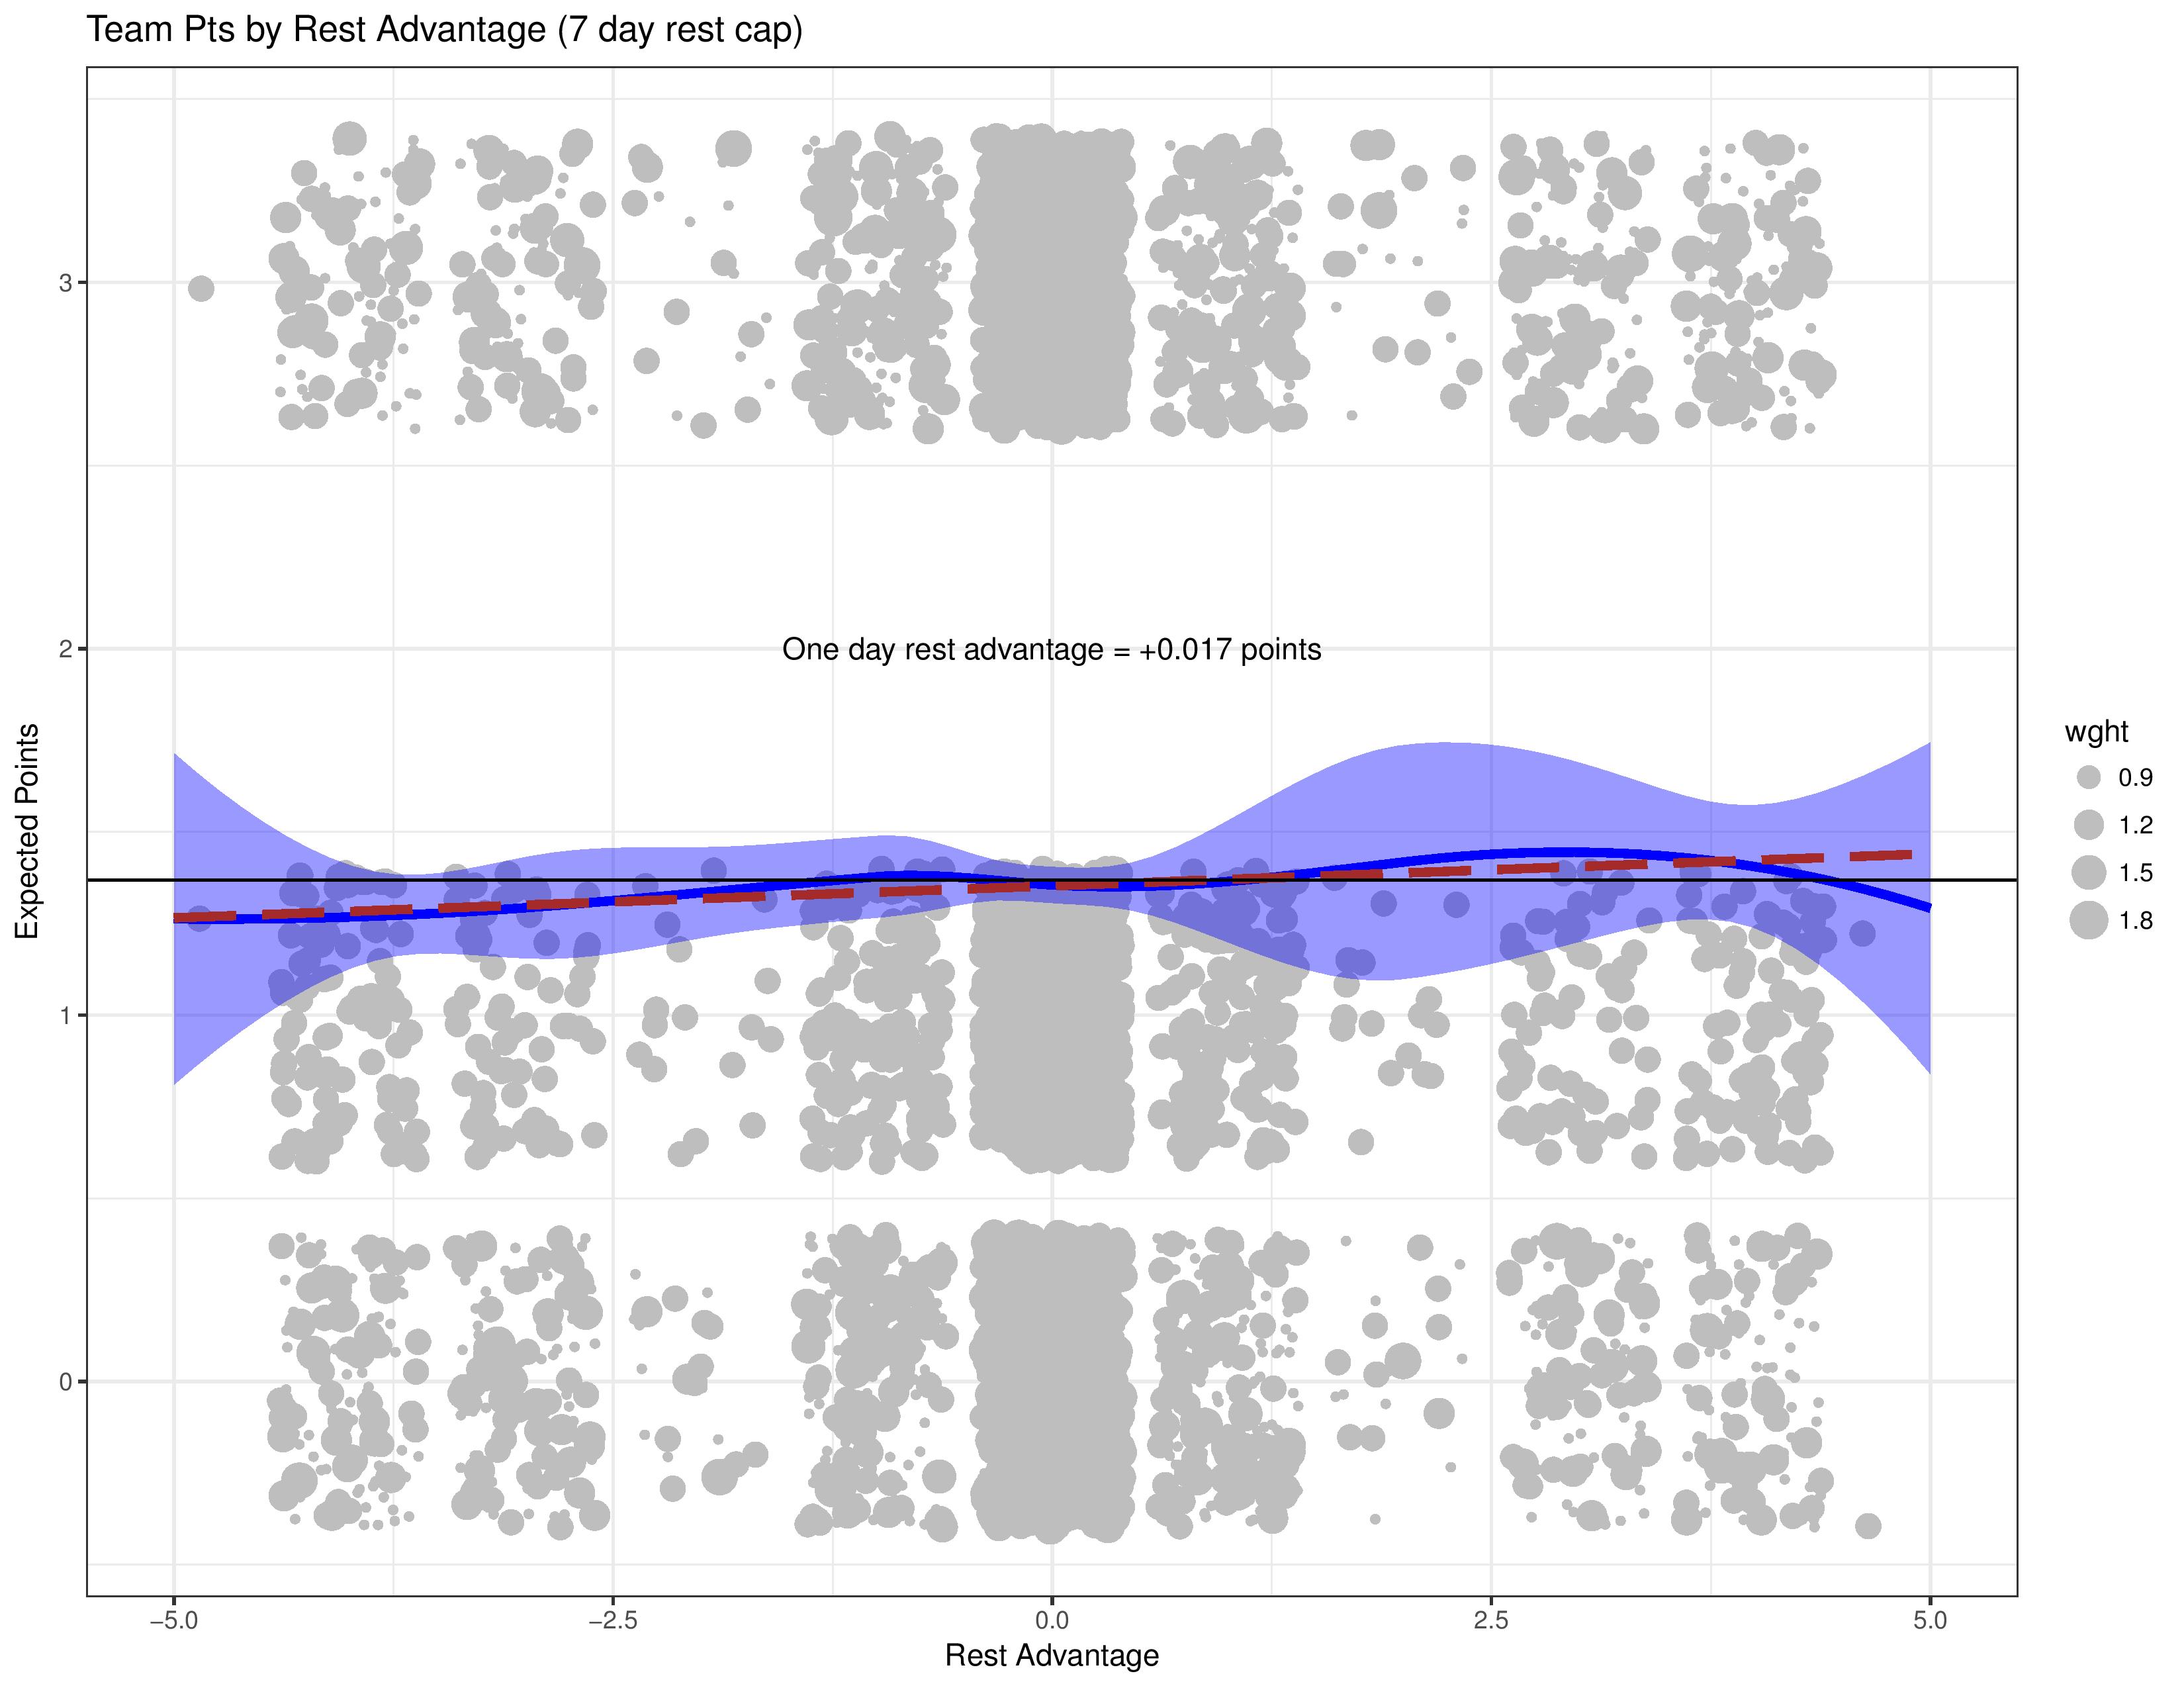
This shows that there is a relationship, albeit a small one, between having more or less rest than your opponent and the impact on results.
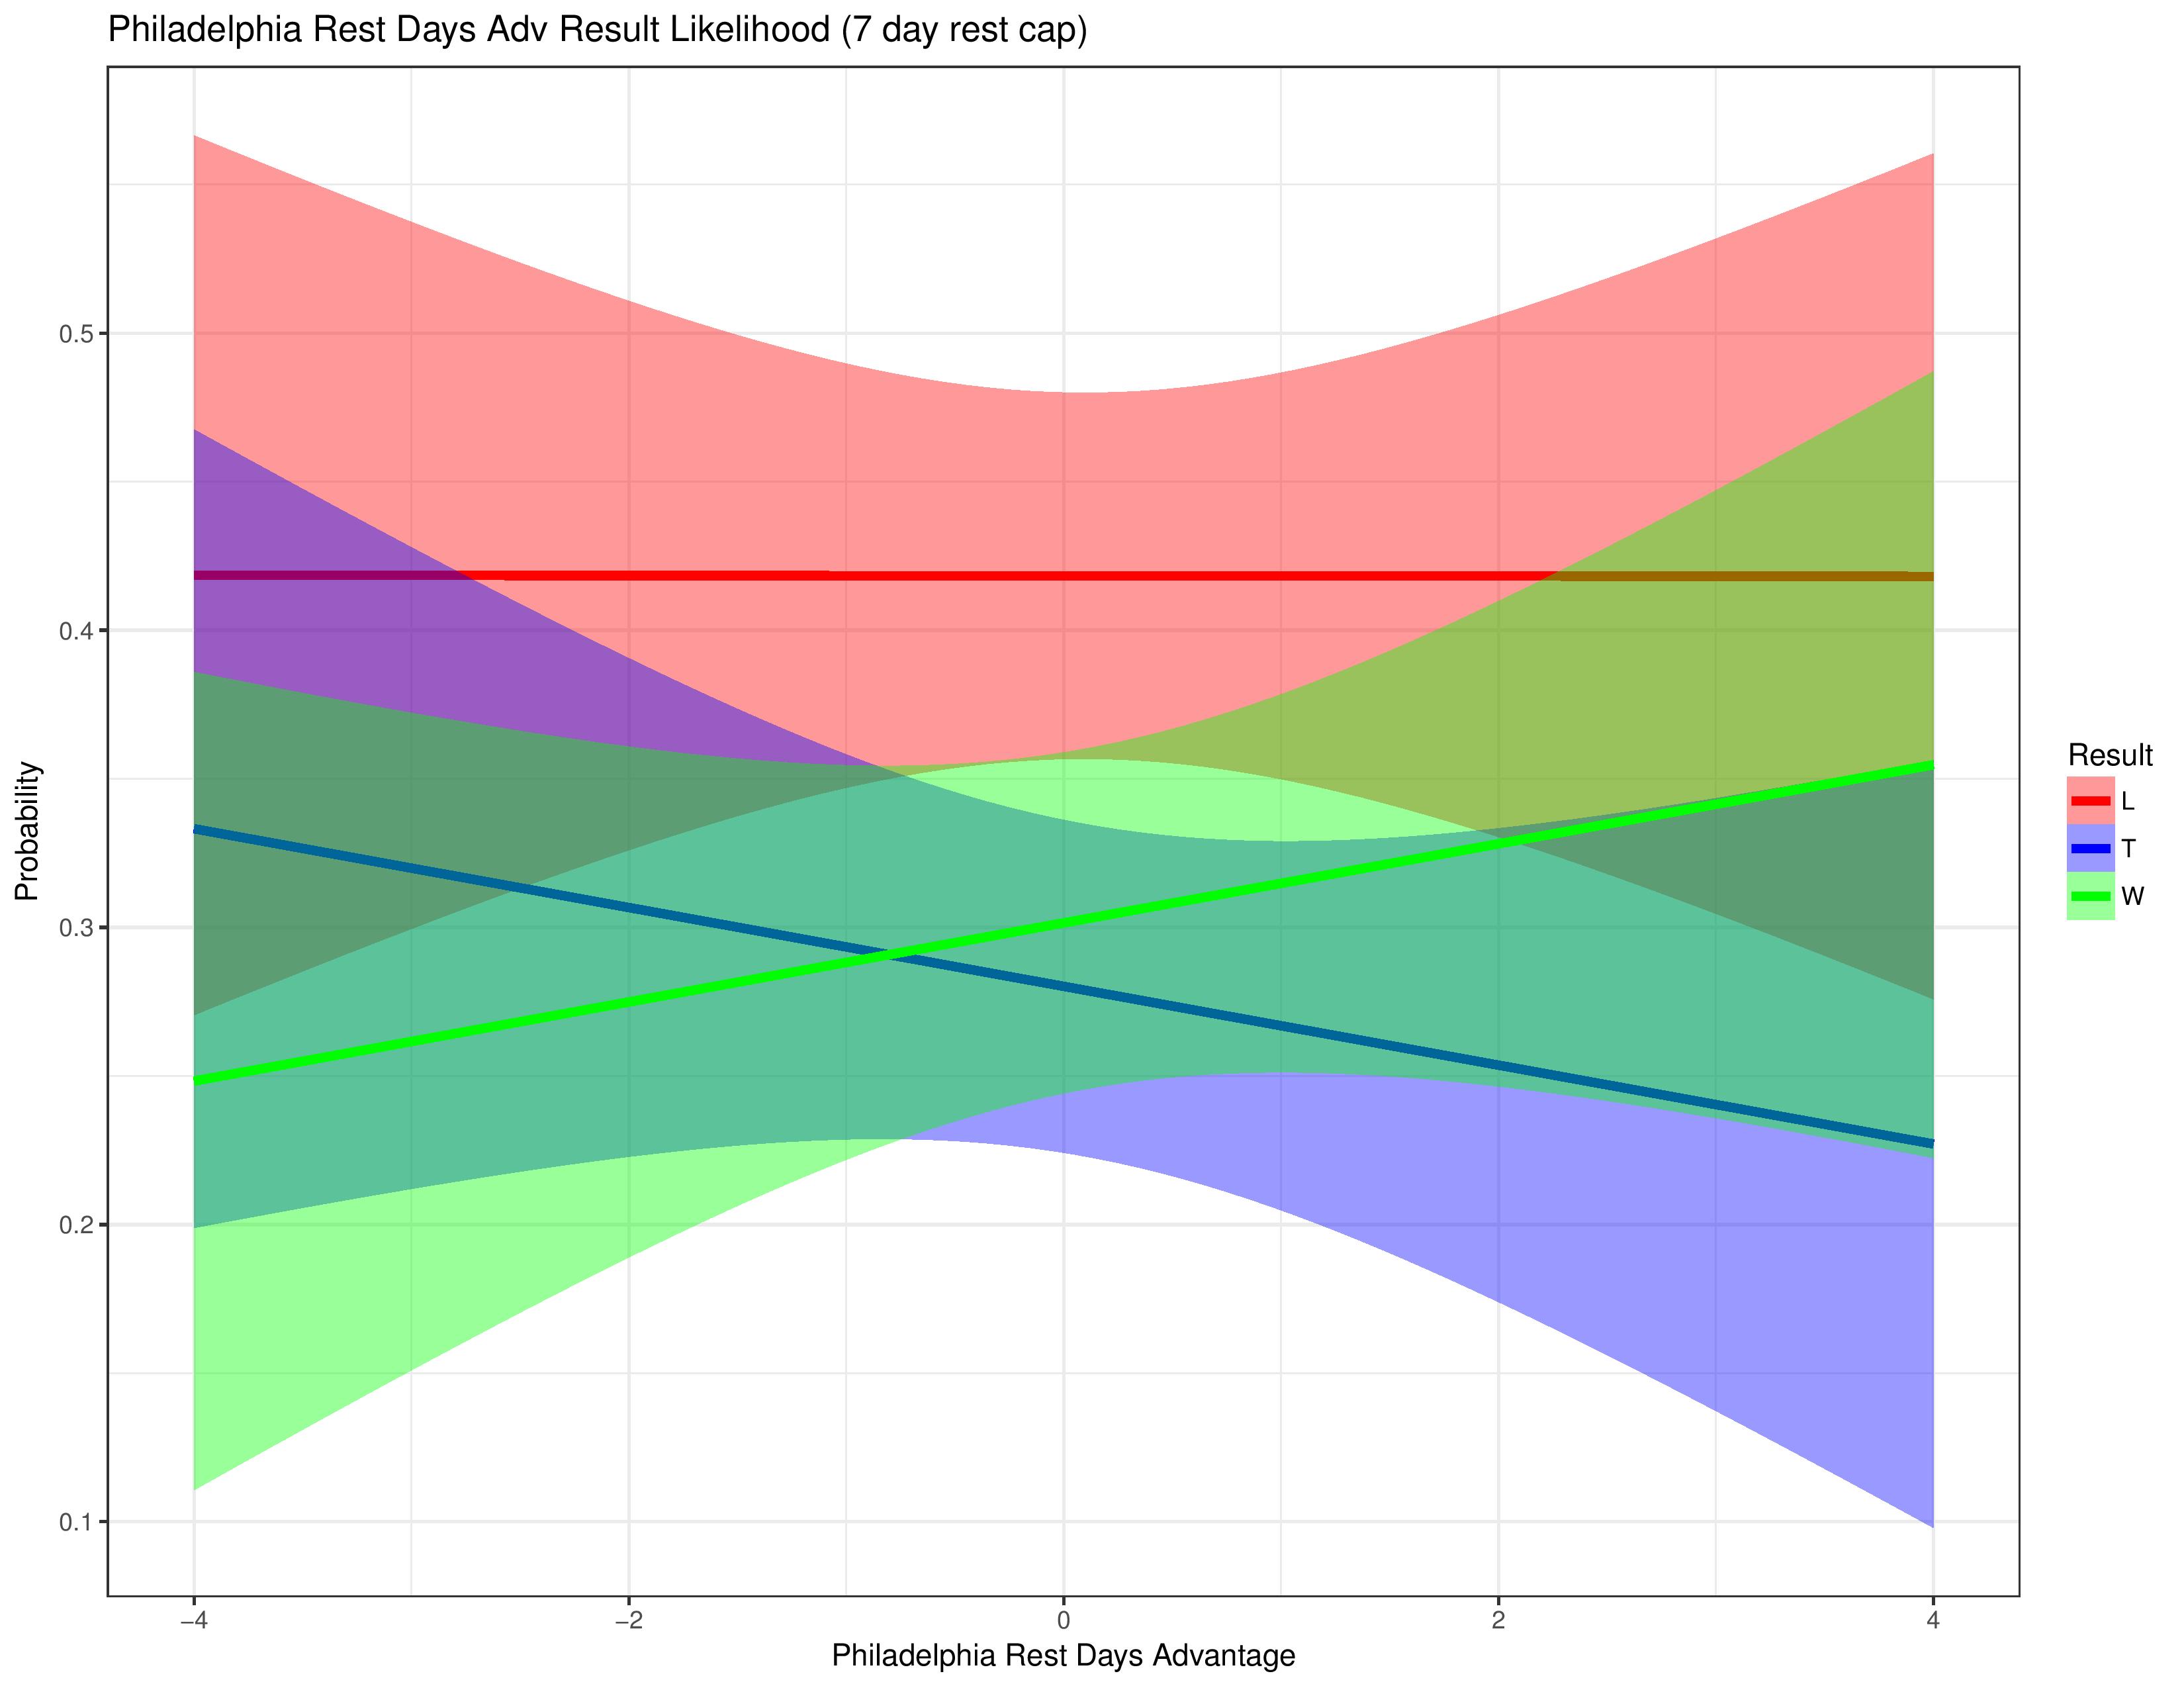
The following shows the linear approximation of how different match results compare with the rest advantage.
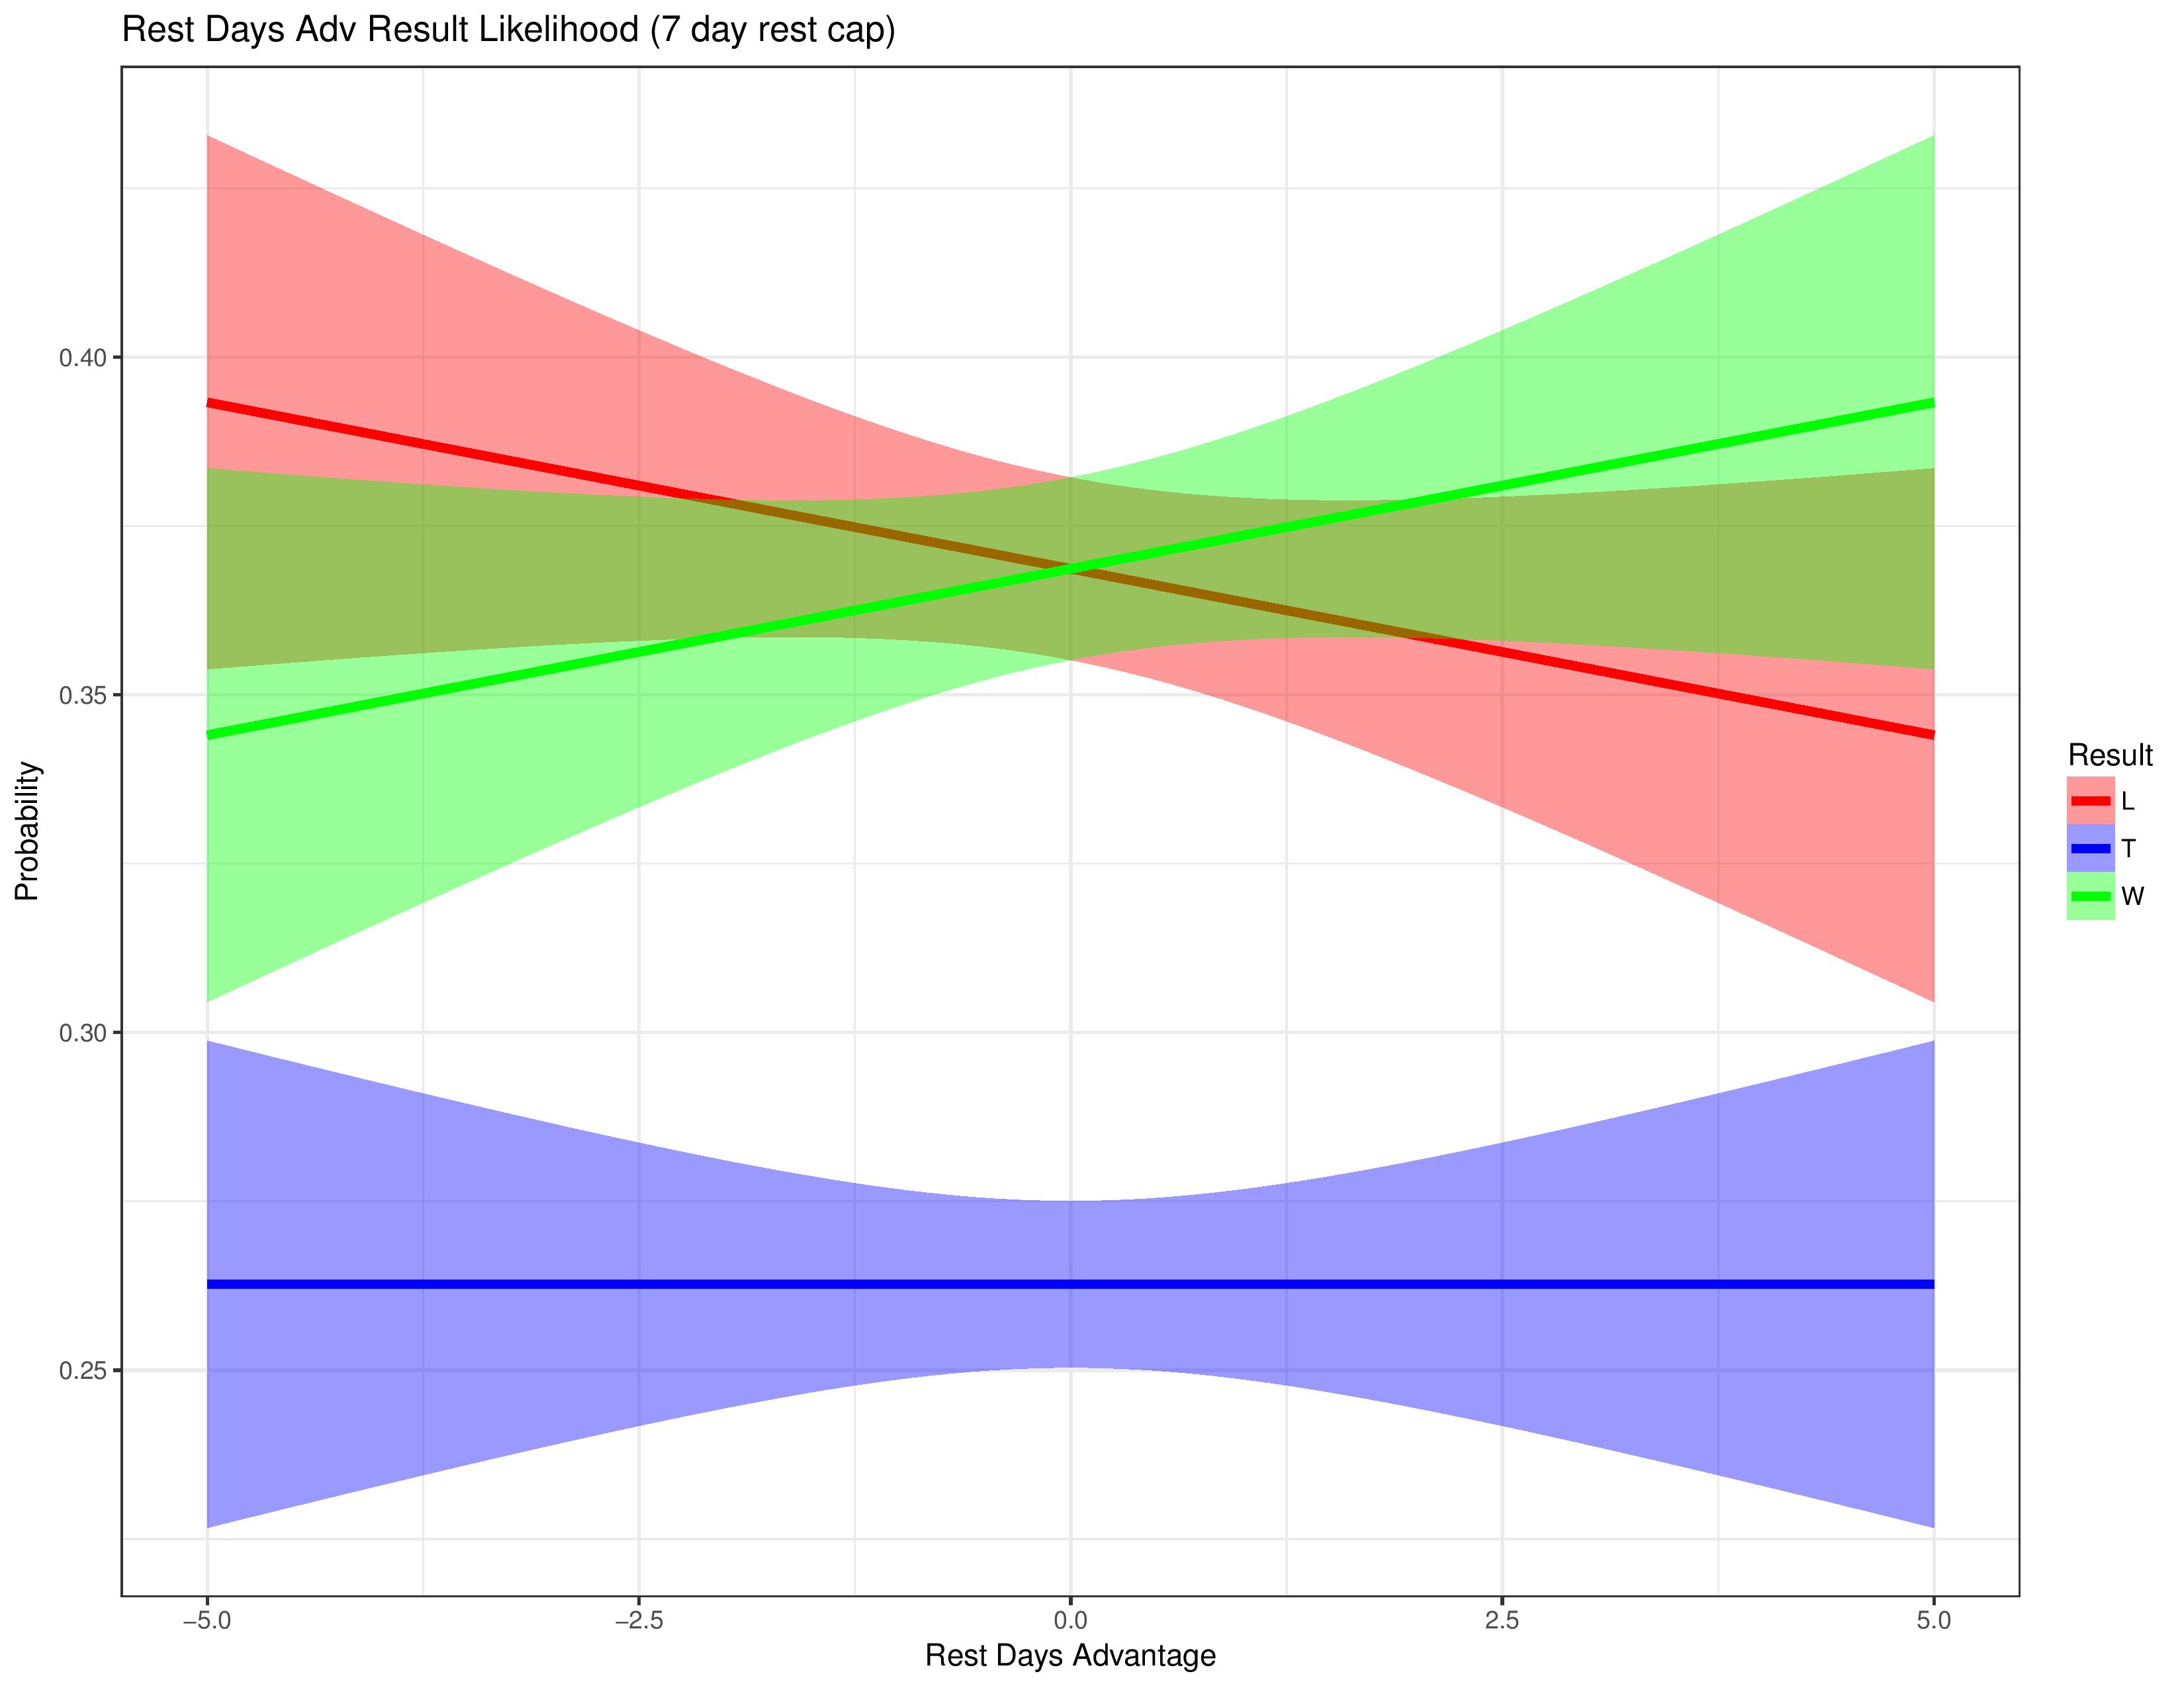
This seems to indicate that as a team’s rest advantage grows, wins take away from losses while the rate of ties remains the same.
*However, the draw rate could not have a linear approximation that is different, since for every draw with a 4-day advantage, there is an opposite team with a 4-day-disadvantage who also received a draw.
The following shows the rates of wins, losses, and draws when considering only that a team has an advantage, but ignoring the magnitude of that advantage.
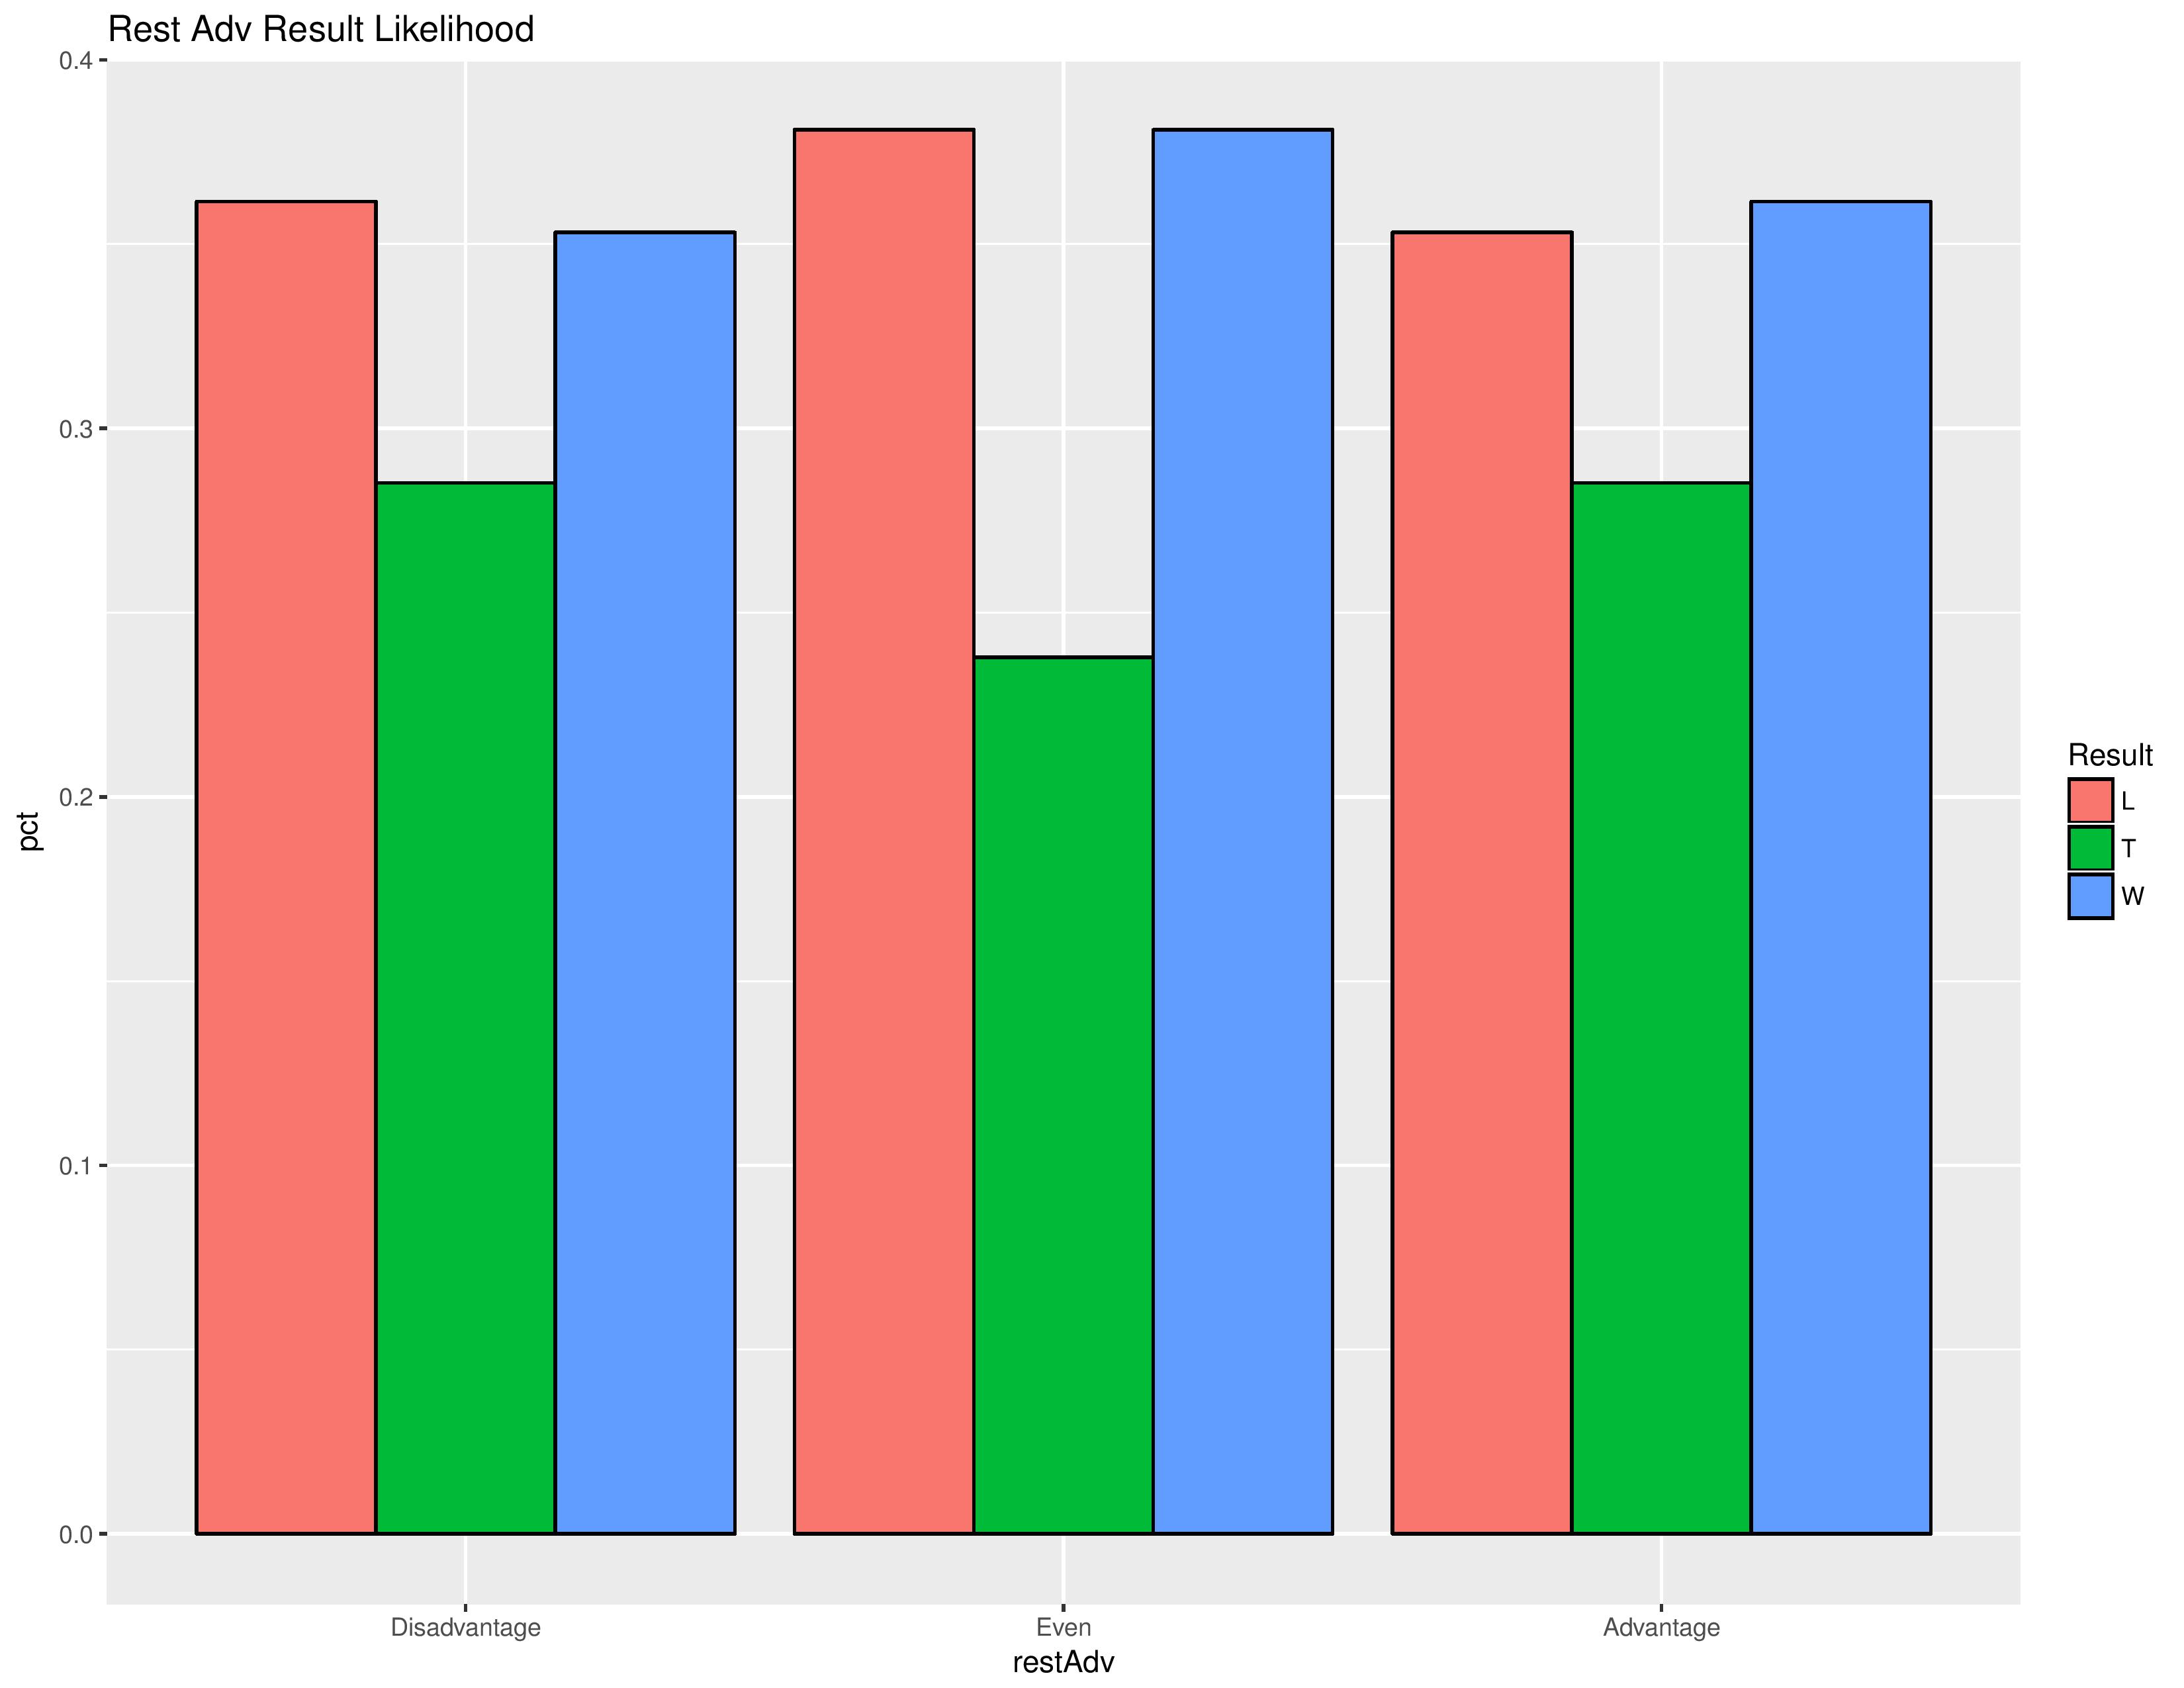
This shows that the rate of draws is lower when teams are equally well-rested than when one team has an advantage. This makes sense since a team playing on short rest may play more conservatively and aim for a tie, fearing that their weariness will make them more vulnerable to losses when playing their natural game.
It also shows that a rest advantage has a small increase in the win rate over the loss rate.
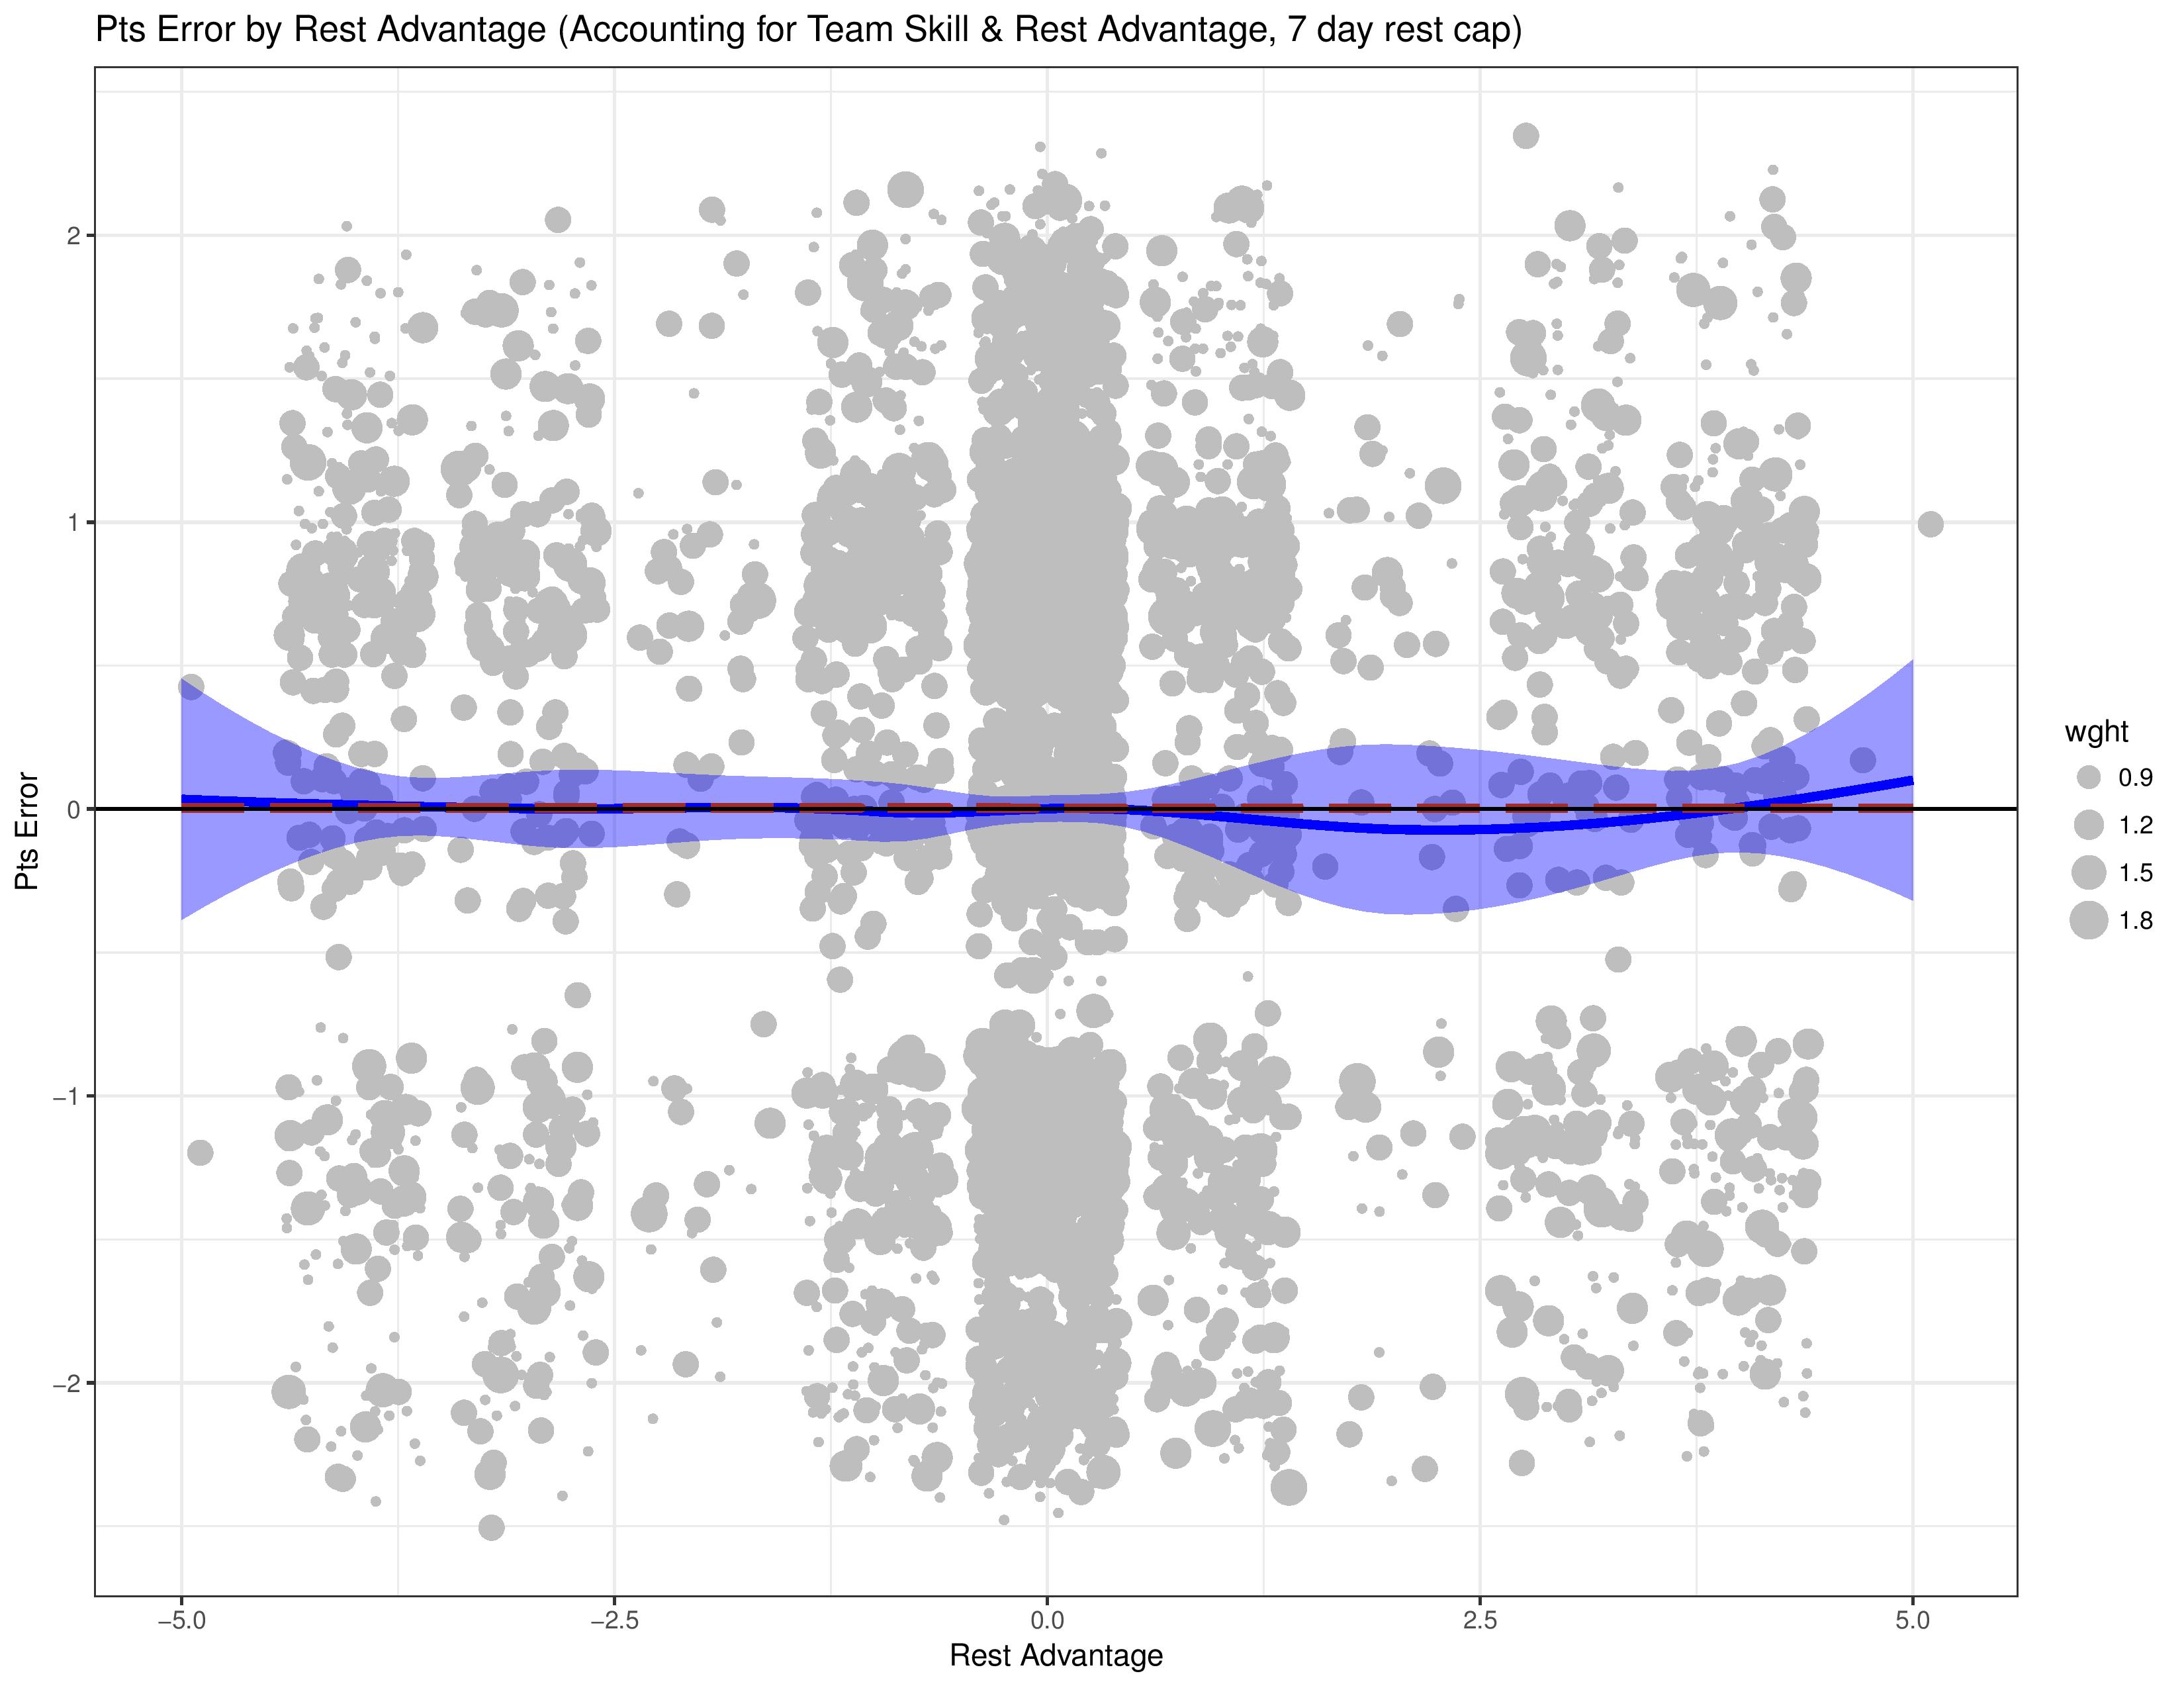
The above only examines one variable at a time, and we want to consider the impact of rest advantage alongside other variables. To do this, we employ a model that accounts for a team’s skill (over the whole 2010-to-now observation window) and home field advantage, and we chart how the model’s prediction error charts compared with a team’s rest advantage.
Error greater than 0 suggests that the model overestimated the team’s chances for points, while less than 0 suggests the opposite.
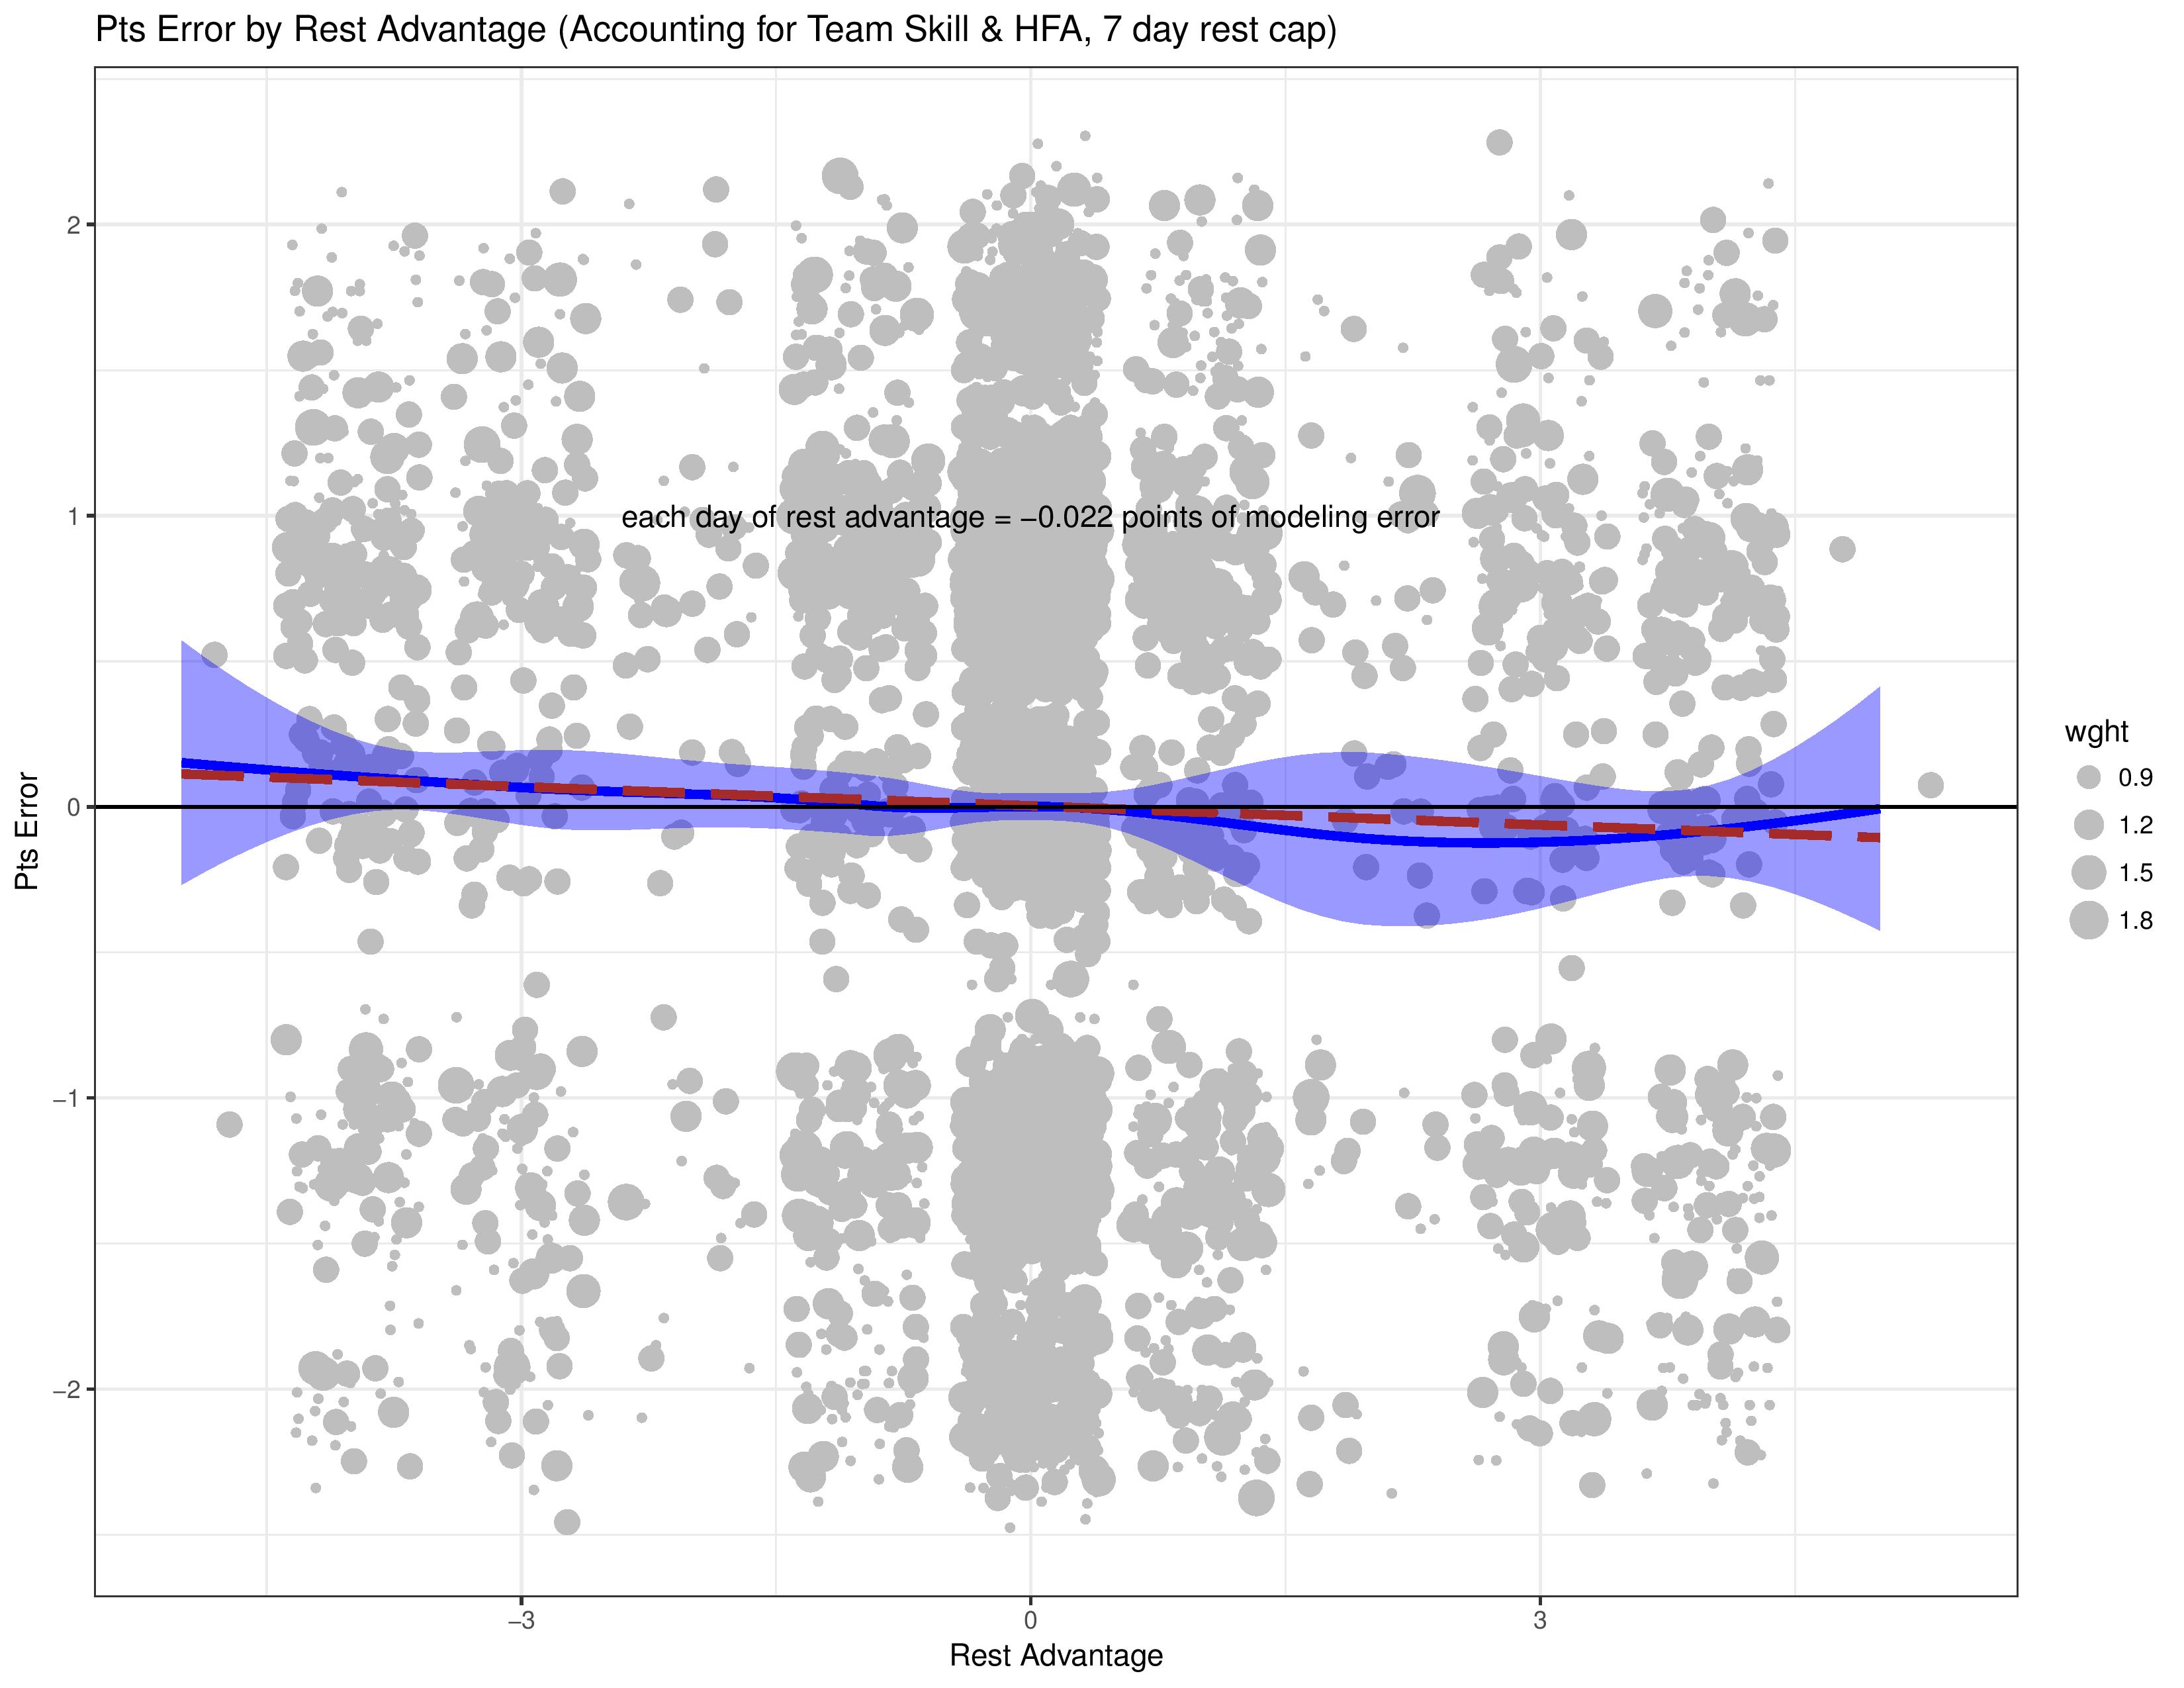
This shows that there is definitely a correlation (albeit a small one) between a team’s rest advantage, and the model’s error, suggesting the a team’s rest advantage belongs in the model’s predictive variables too.
The following shows the correlation between a team’s rest advantage and a new model, which factors in rest advantage.
As you can see, there is no longer any correlation, which tells us that our new variable is helpful within the model.
Another consideration is that upcoming rest advantage could have an effect too. If a coach is worried about a tougher opponent that they will have to play on short rest next, he might rest a couple of starters. For that matter, some of the players might take it easier to save energy for the upcoming match.
The following shows the model’s prediction error (the model which includes past rest advantage), against the upcoming match’s team rest advantage.
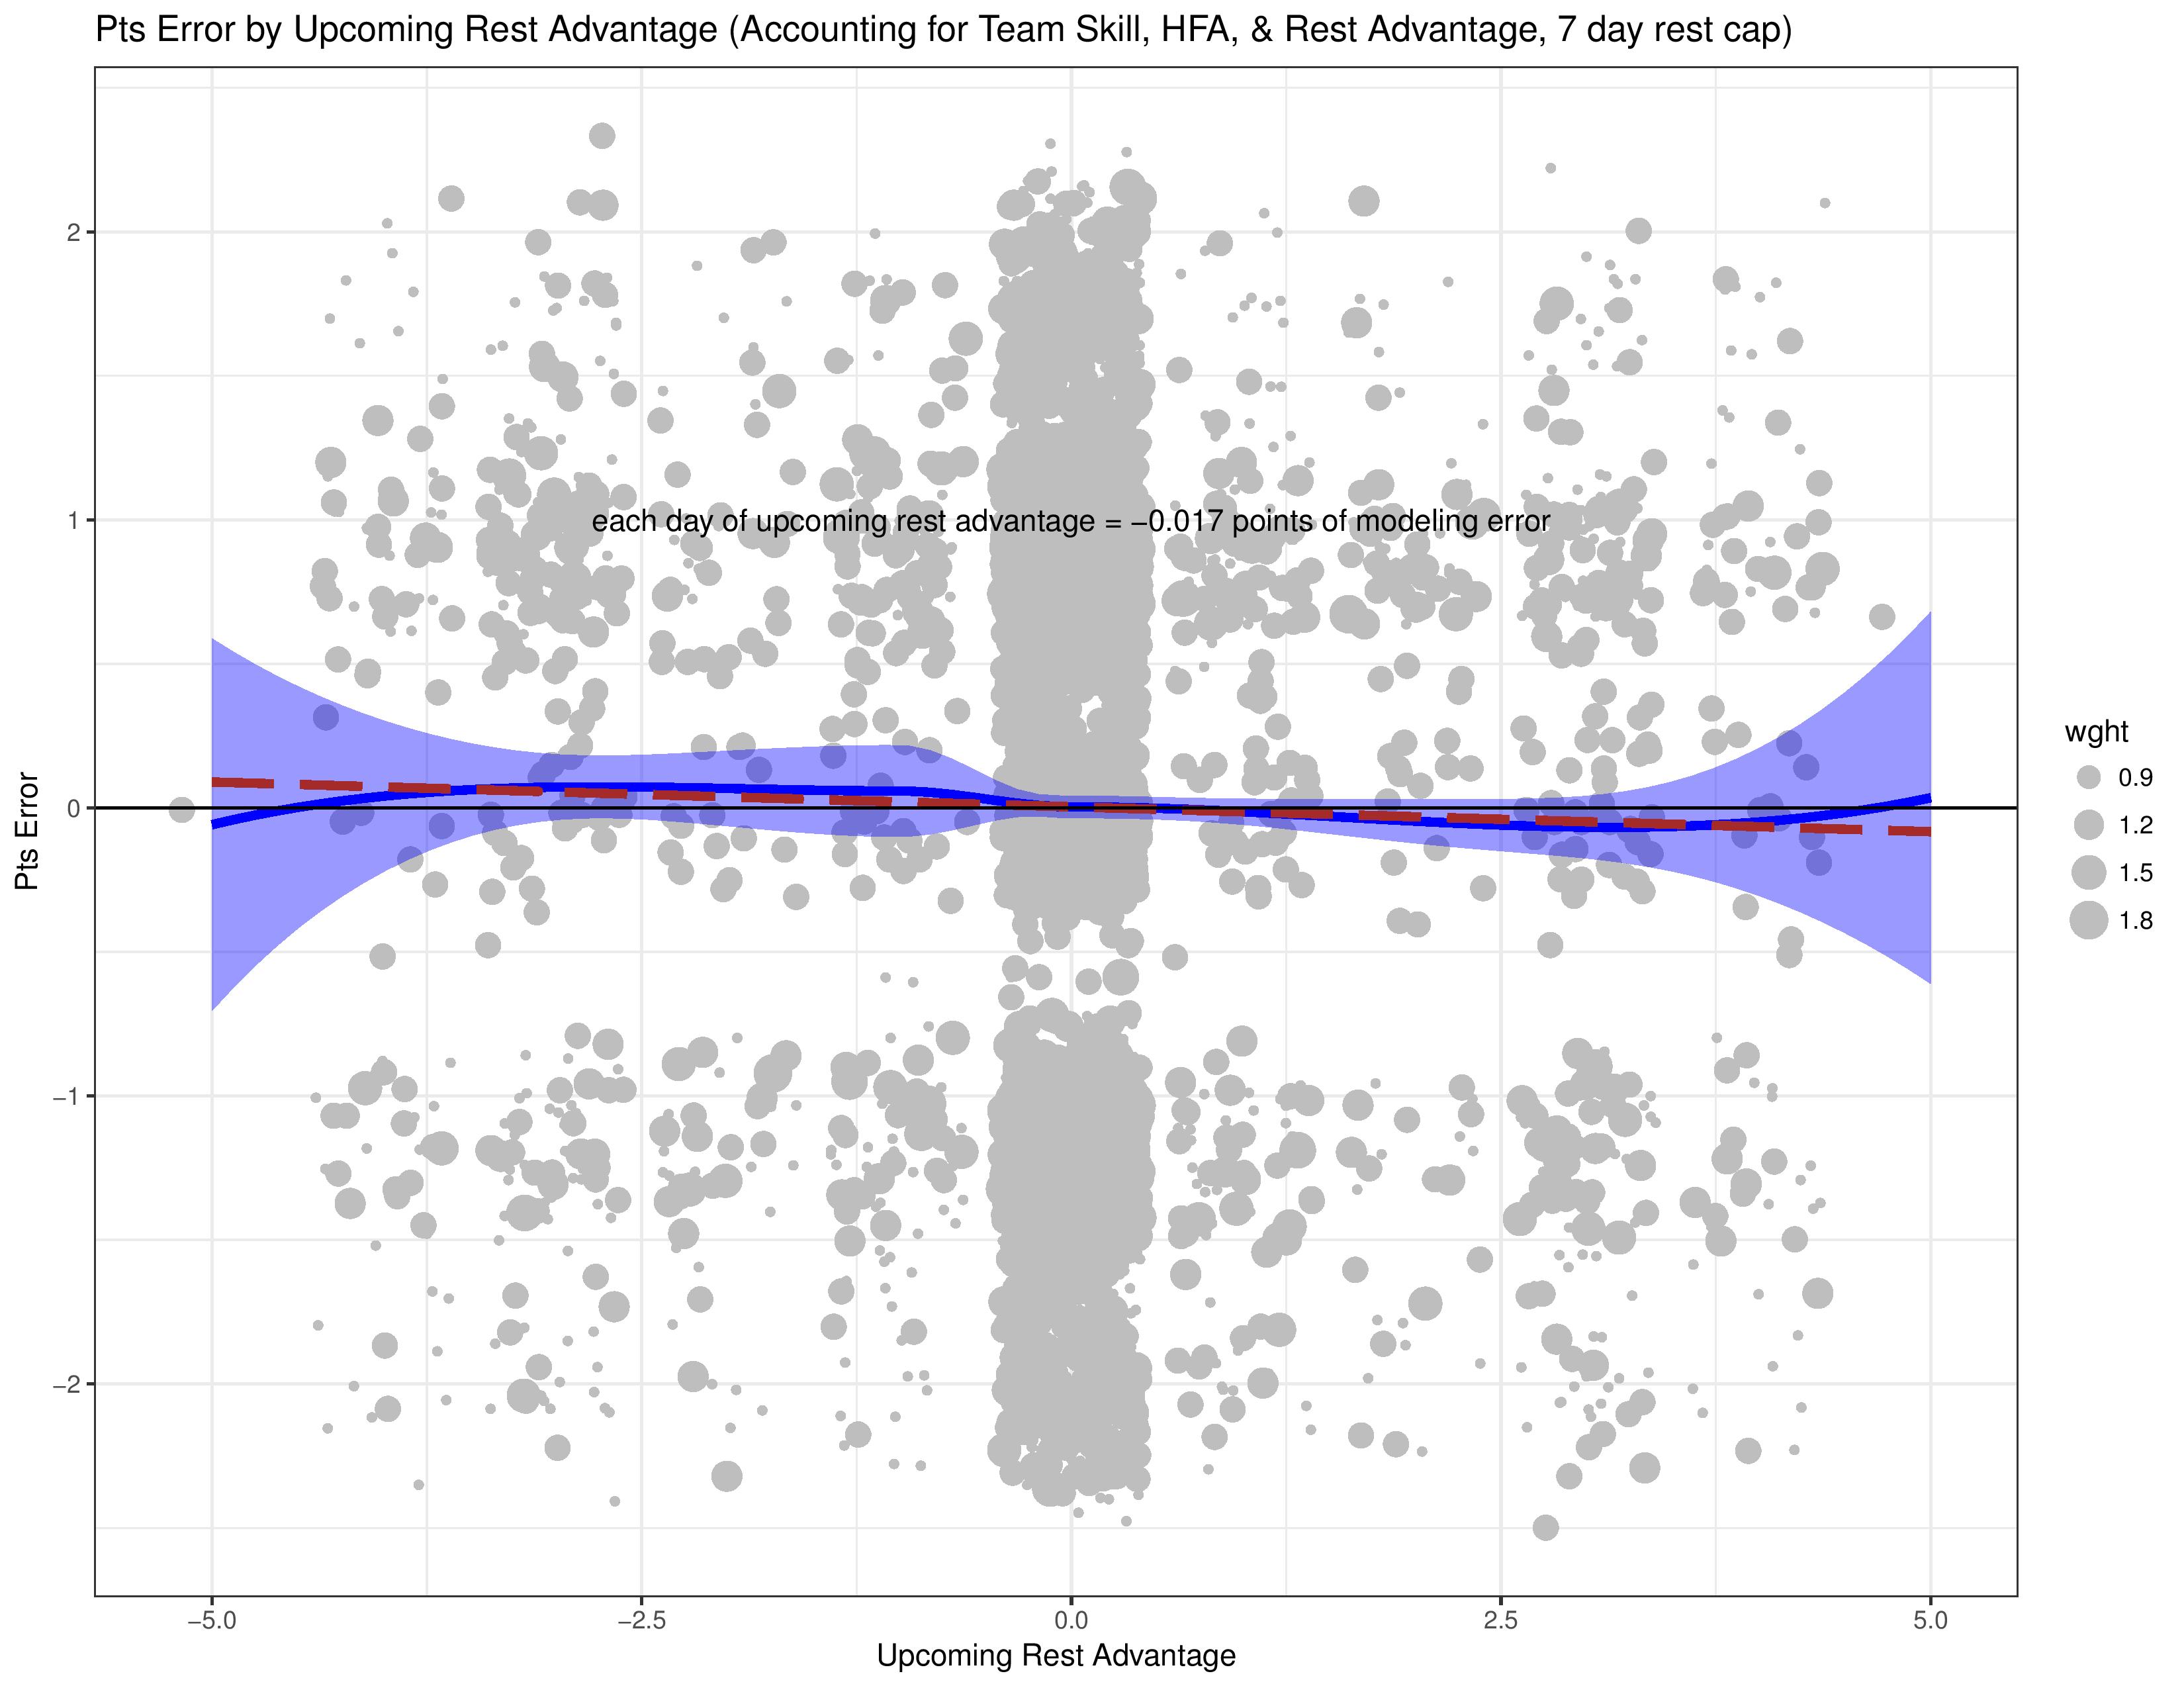
As this shows, the upcoming rest appears to have an impact in addition to the current rest advantage.
The following shows how upcoming rest correlates with the model’s predictions when we add upcoming rest into the model’s explanatory variables.
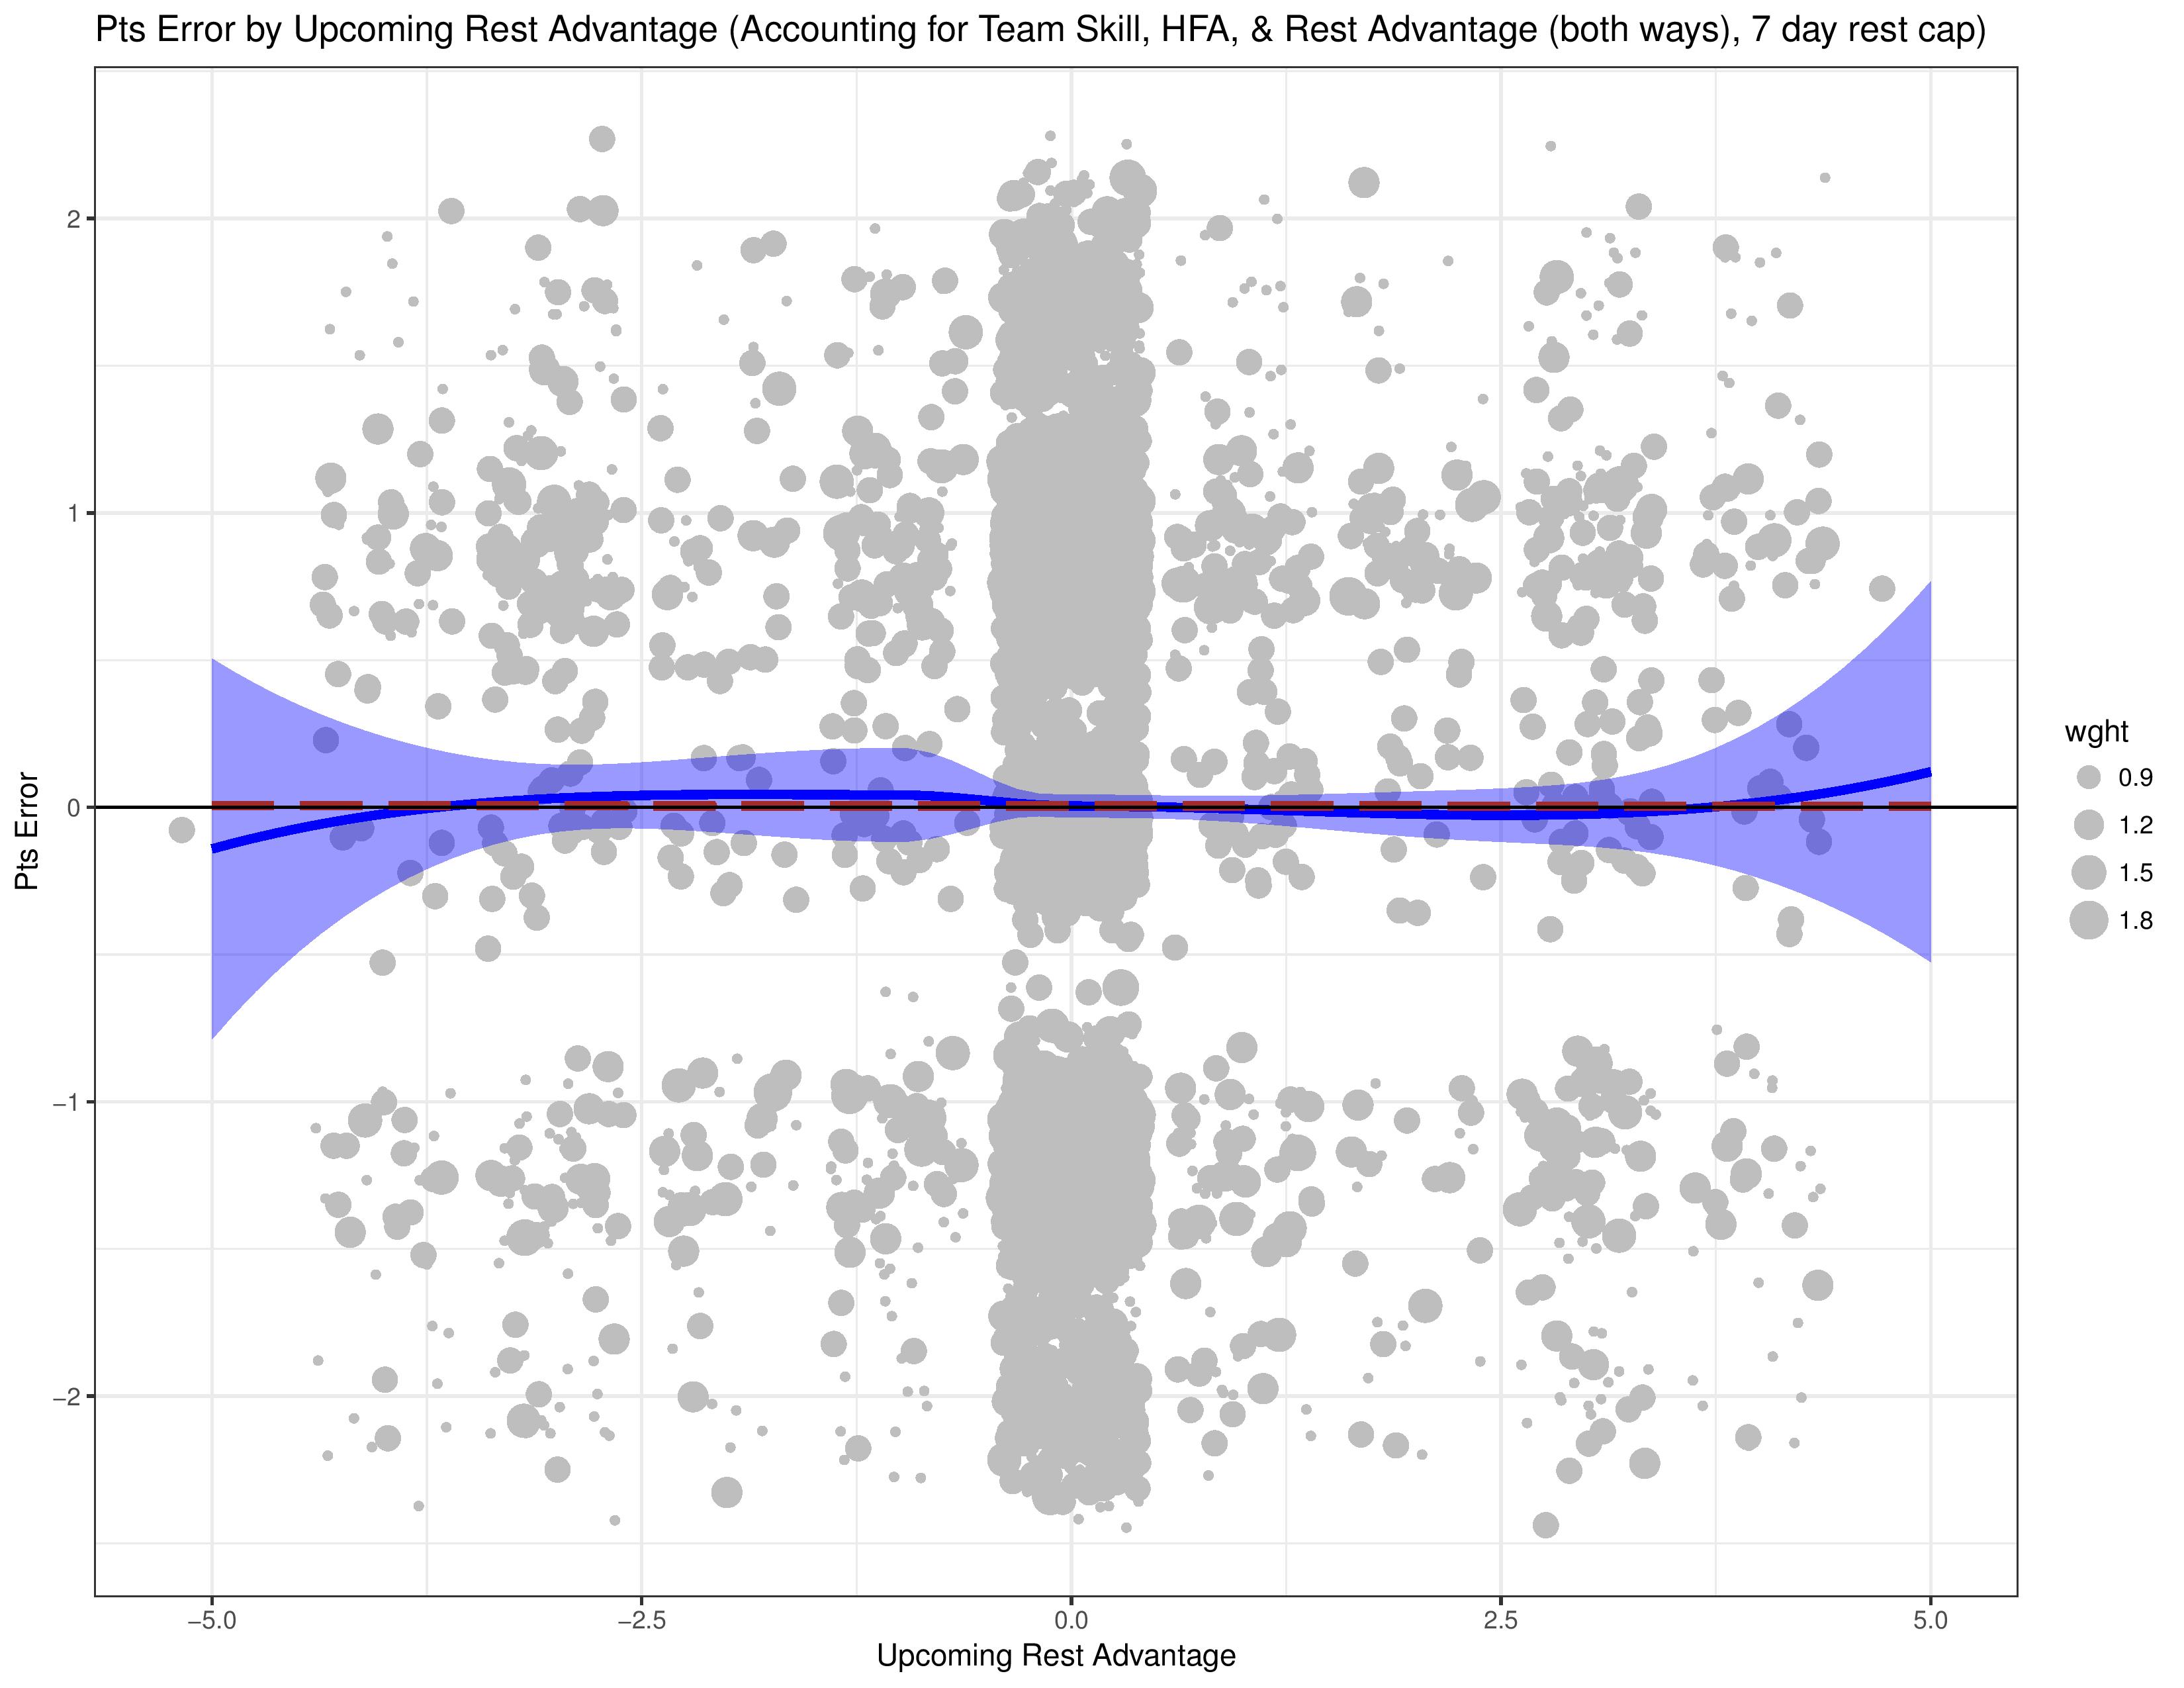
Now we are, once again, showing that the variables in the model don’t correlate with the model’s error, thus showing that the variables are beneficial.
MLS Scheduling
Now that we’ve shown that rest has an impact on expected results, we need to show whether this contributes to home field advantage. As MLS cannot be held responsible for USOC or CCL matches, this analysis shows how home and away teams differ with respect to rest within schedule MLS matches (not including playoffs).
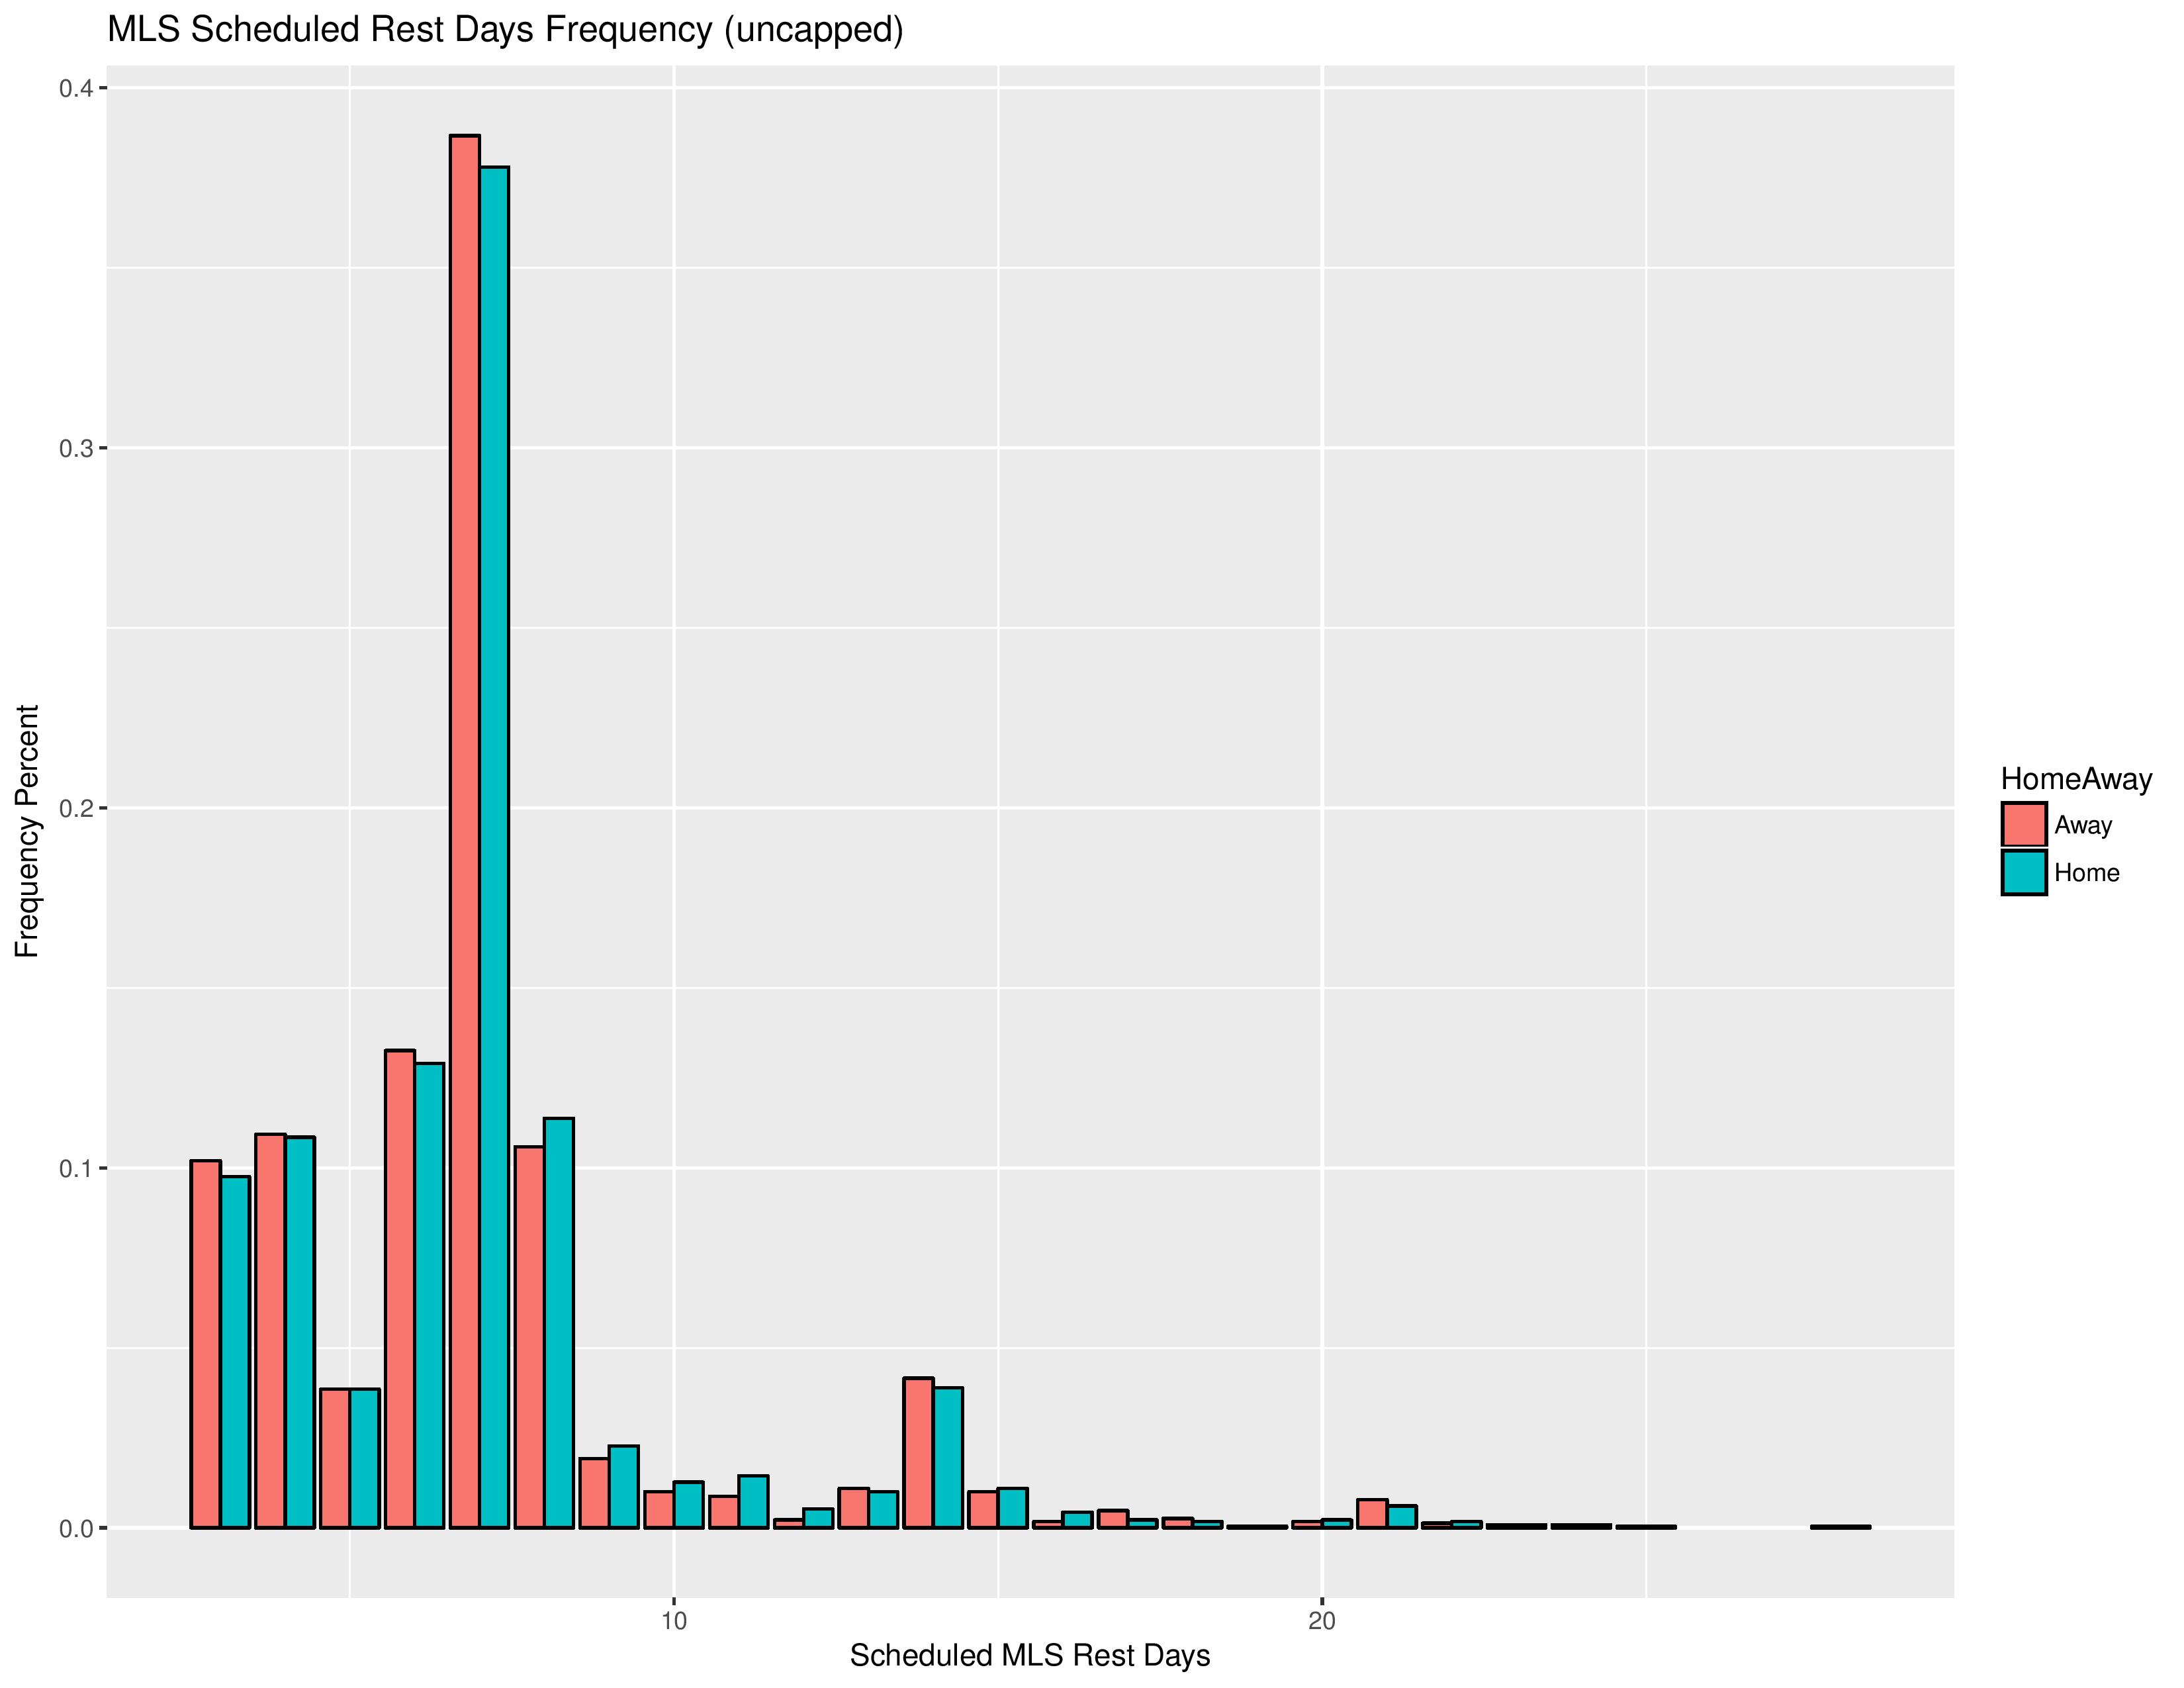
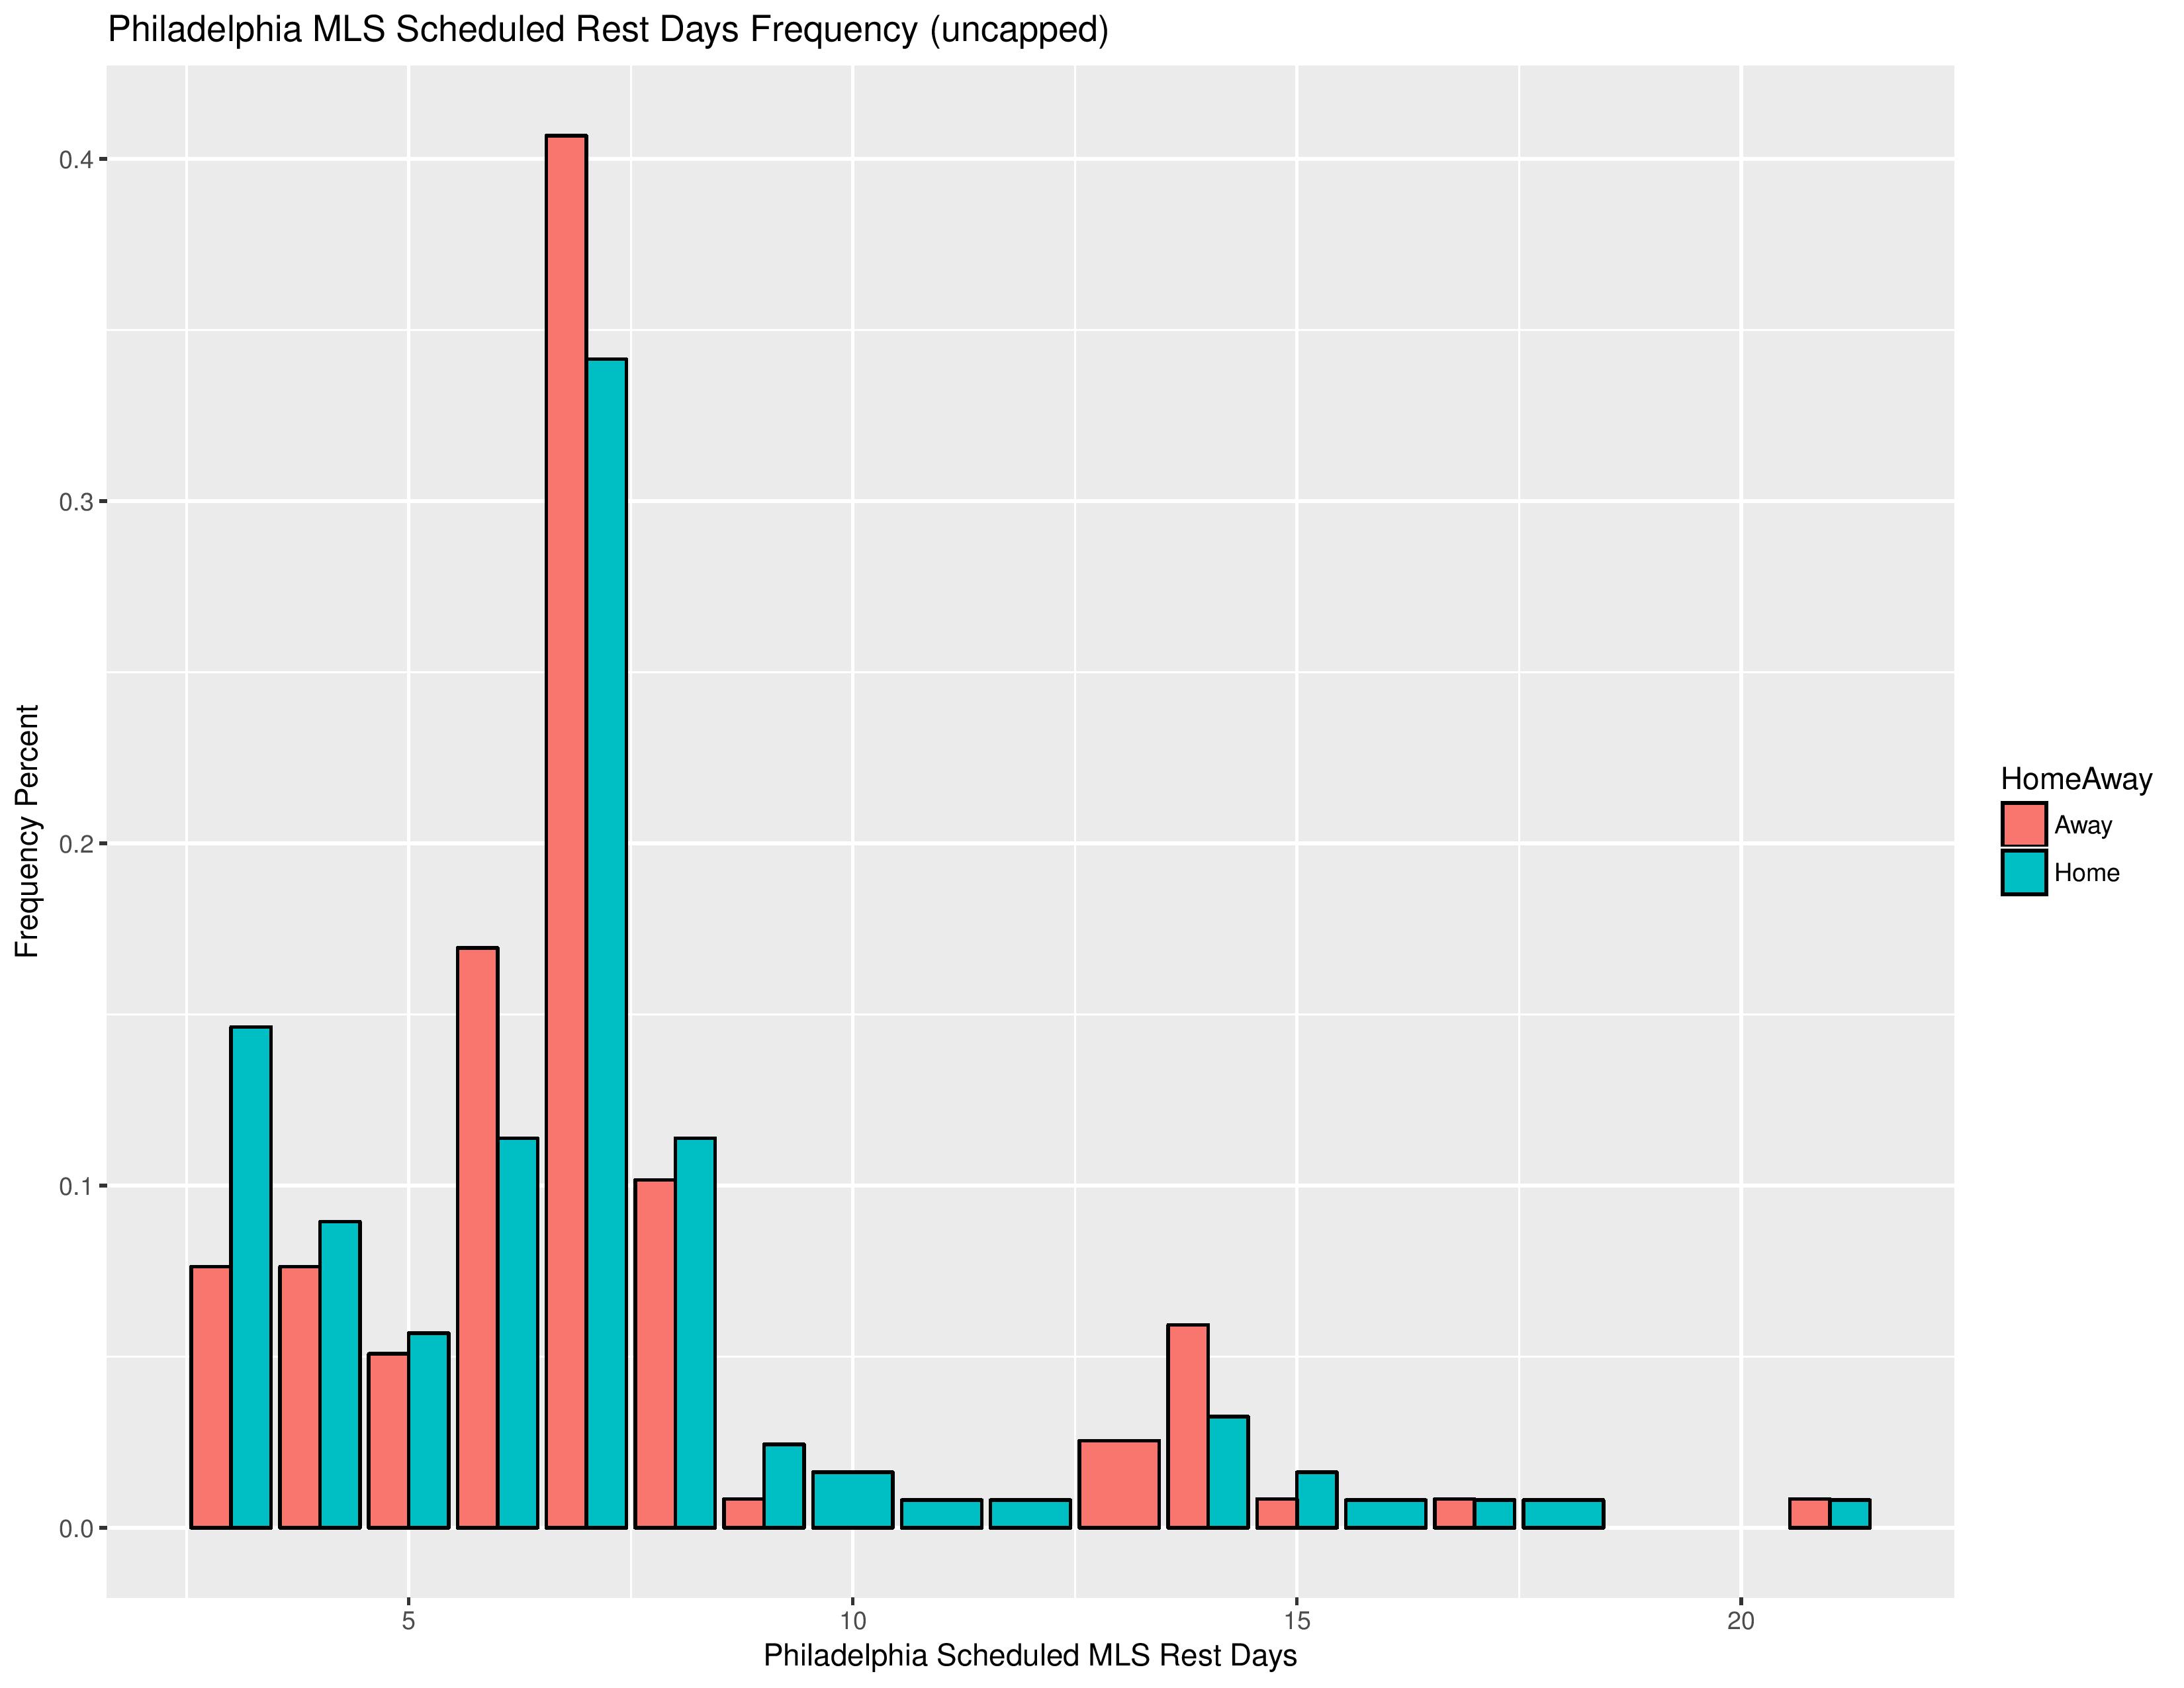
The following shows the uncapped distribution of rest days for home and away teams.
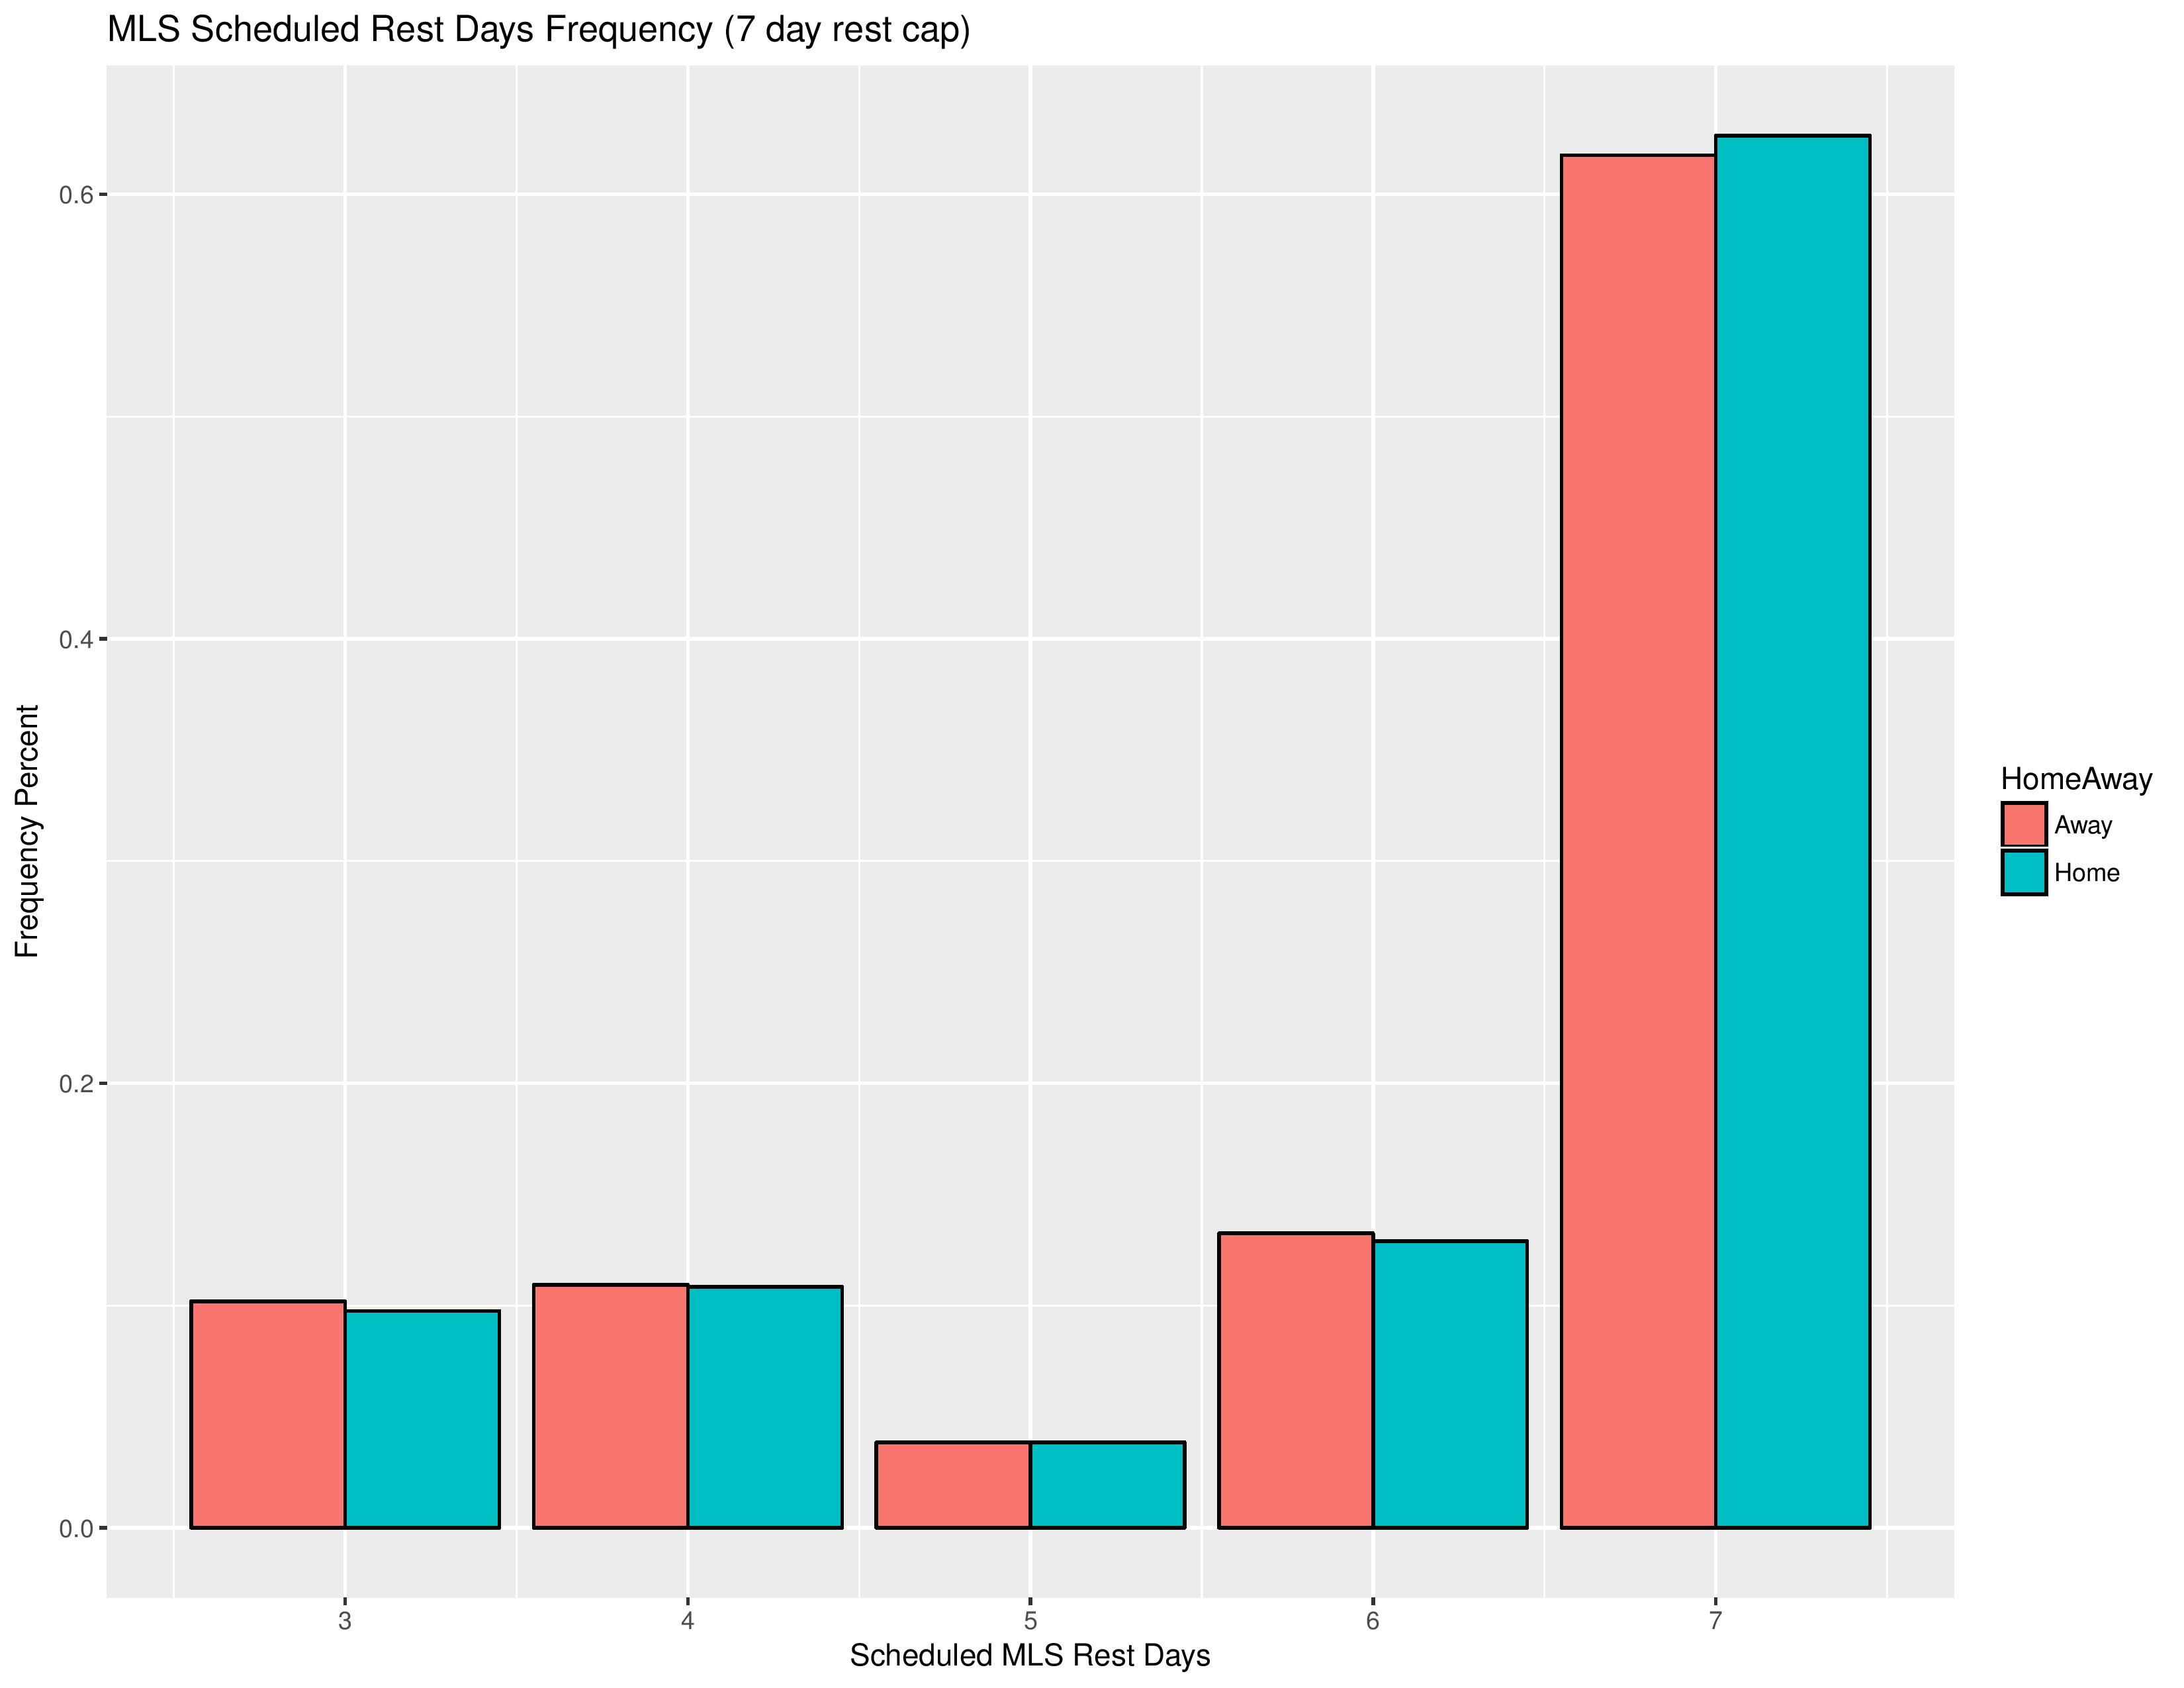
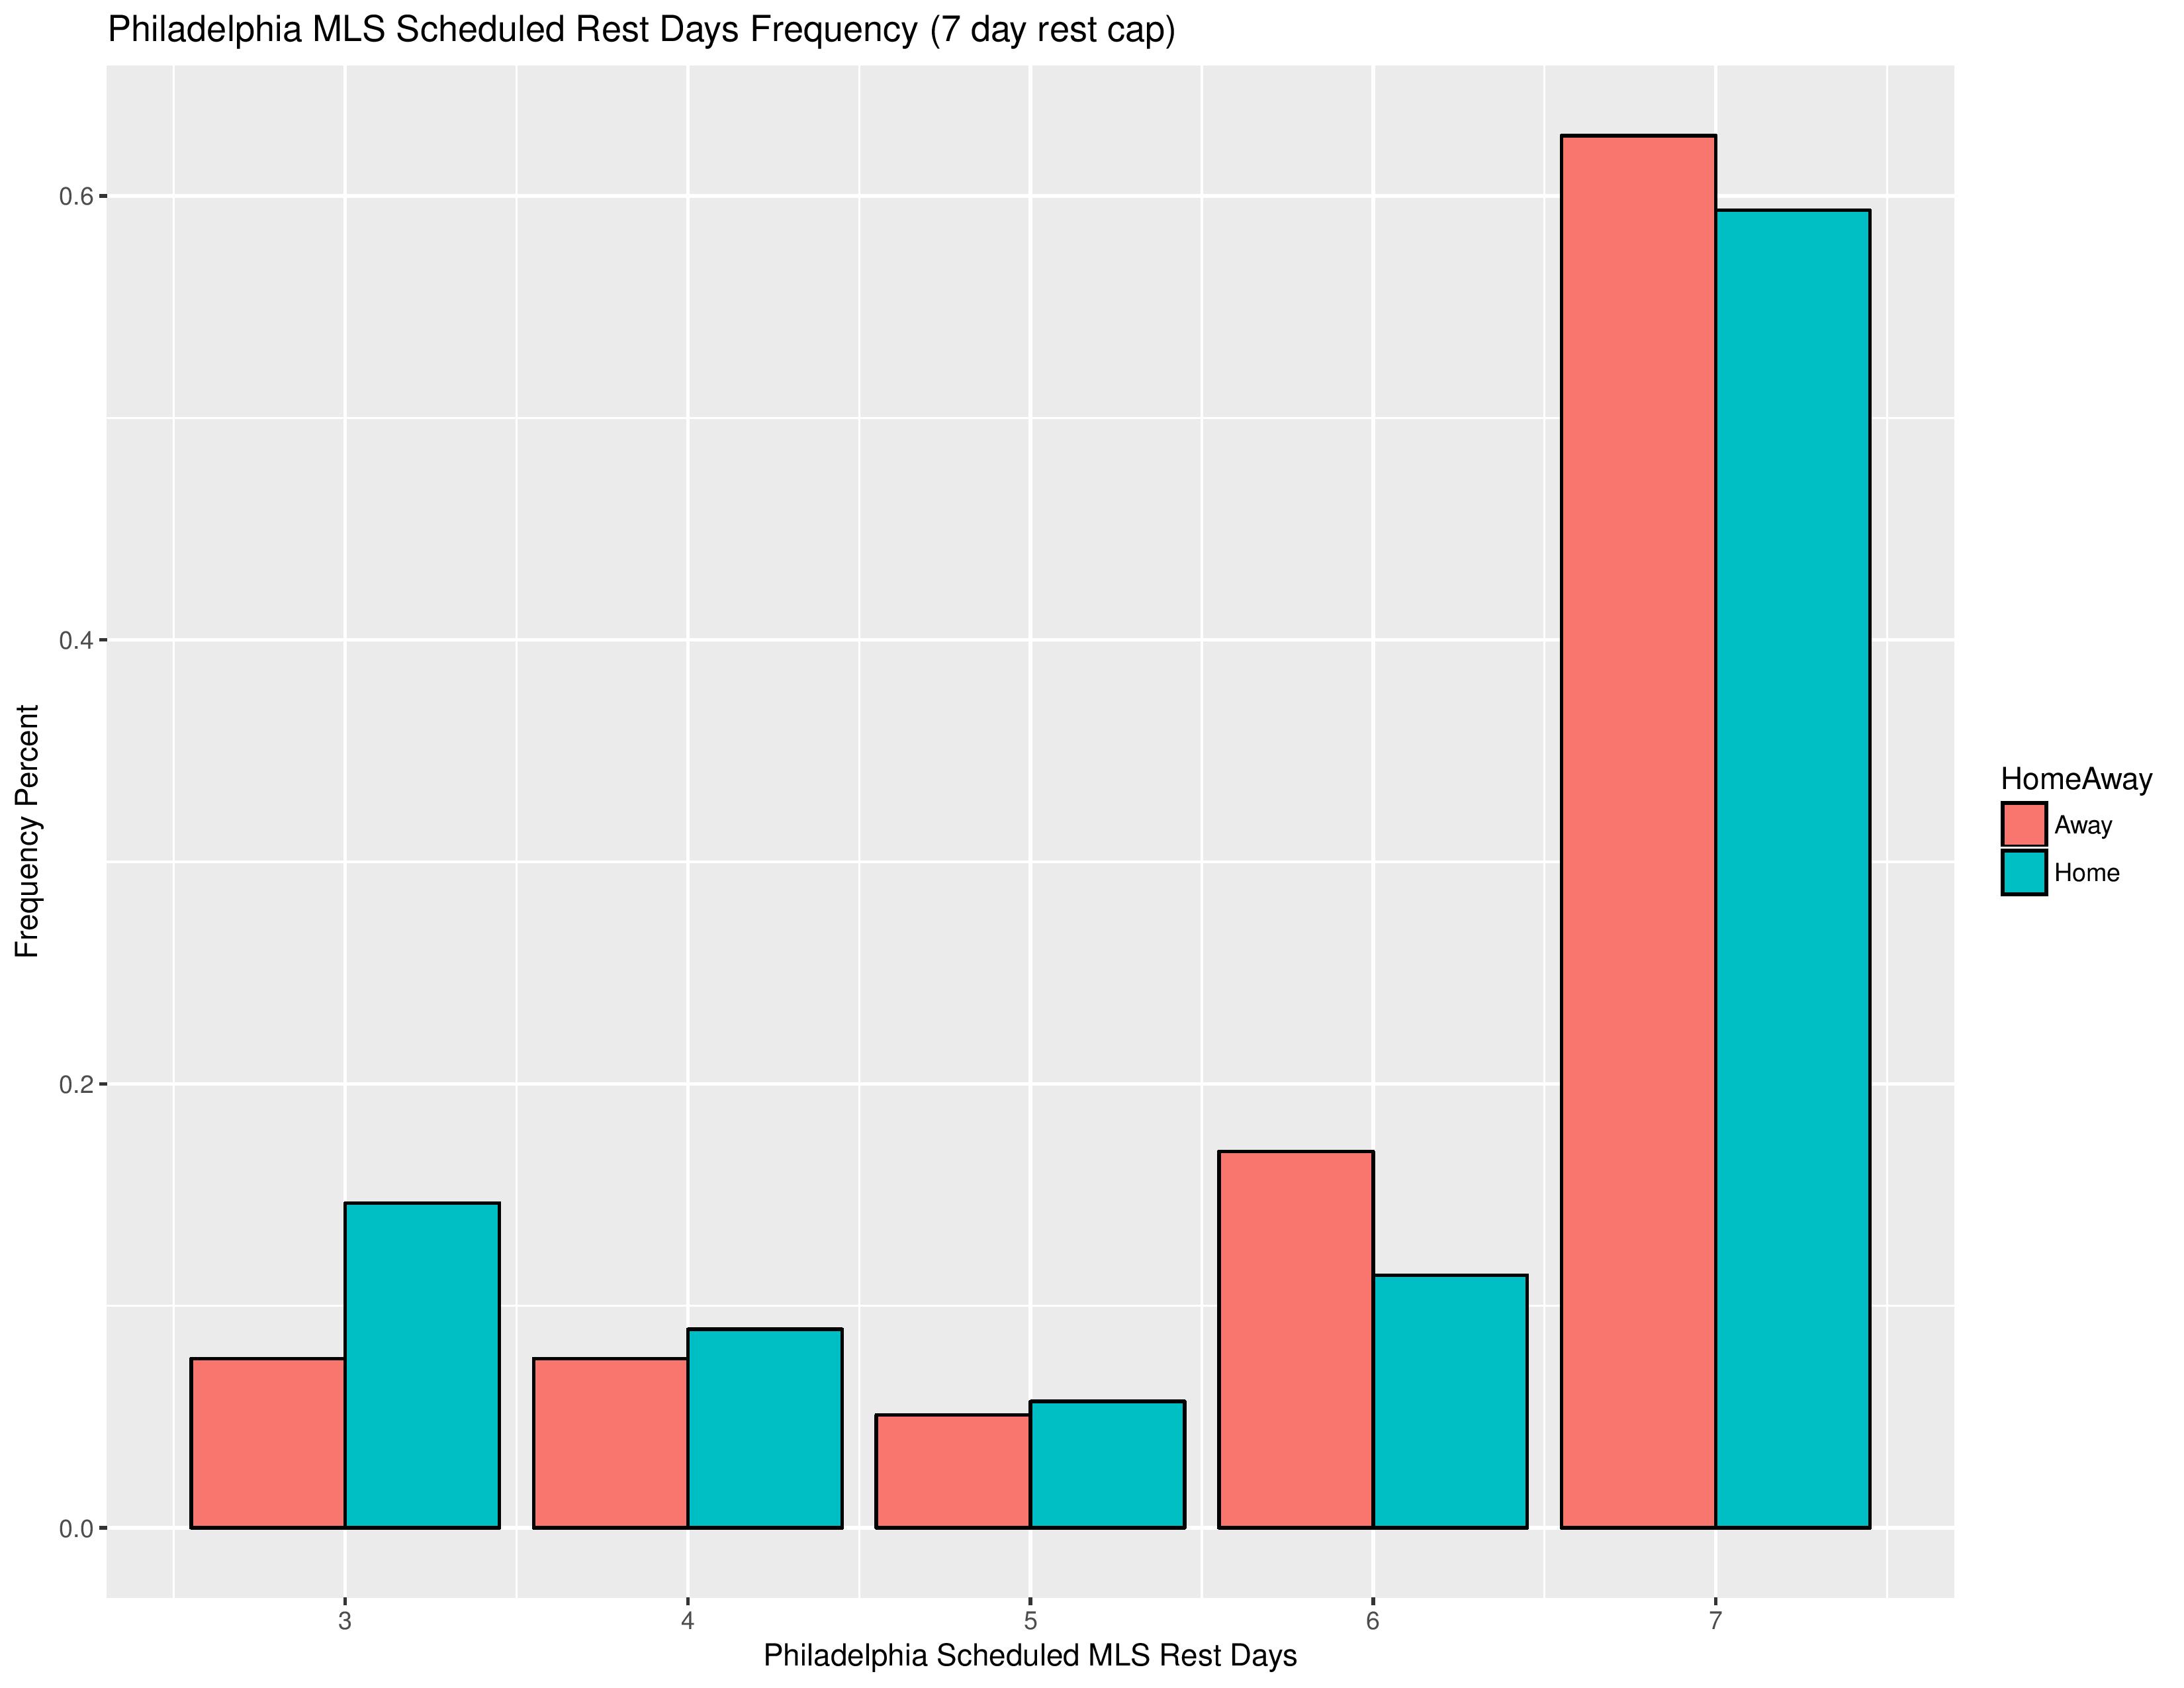
The following shows that distribution when the rest is capped at 7 days.
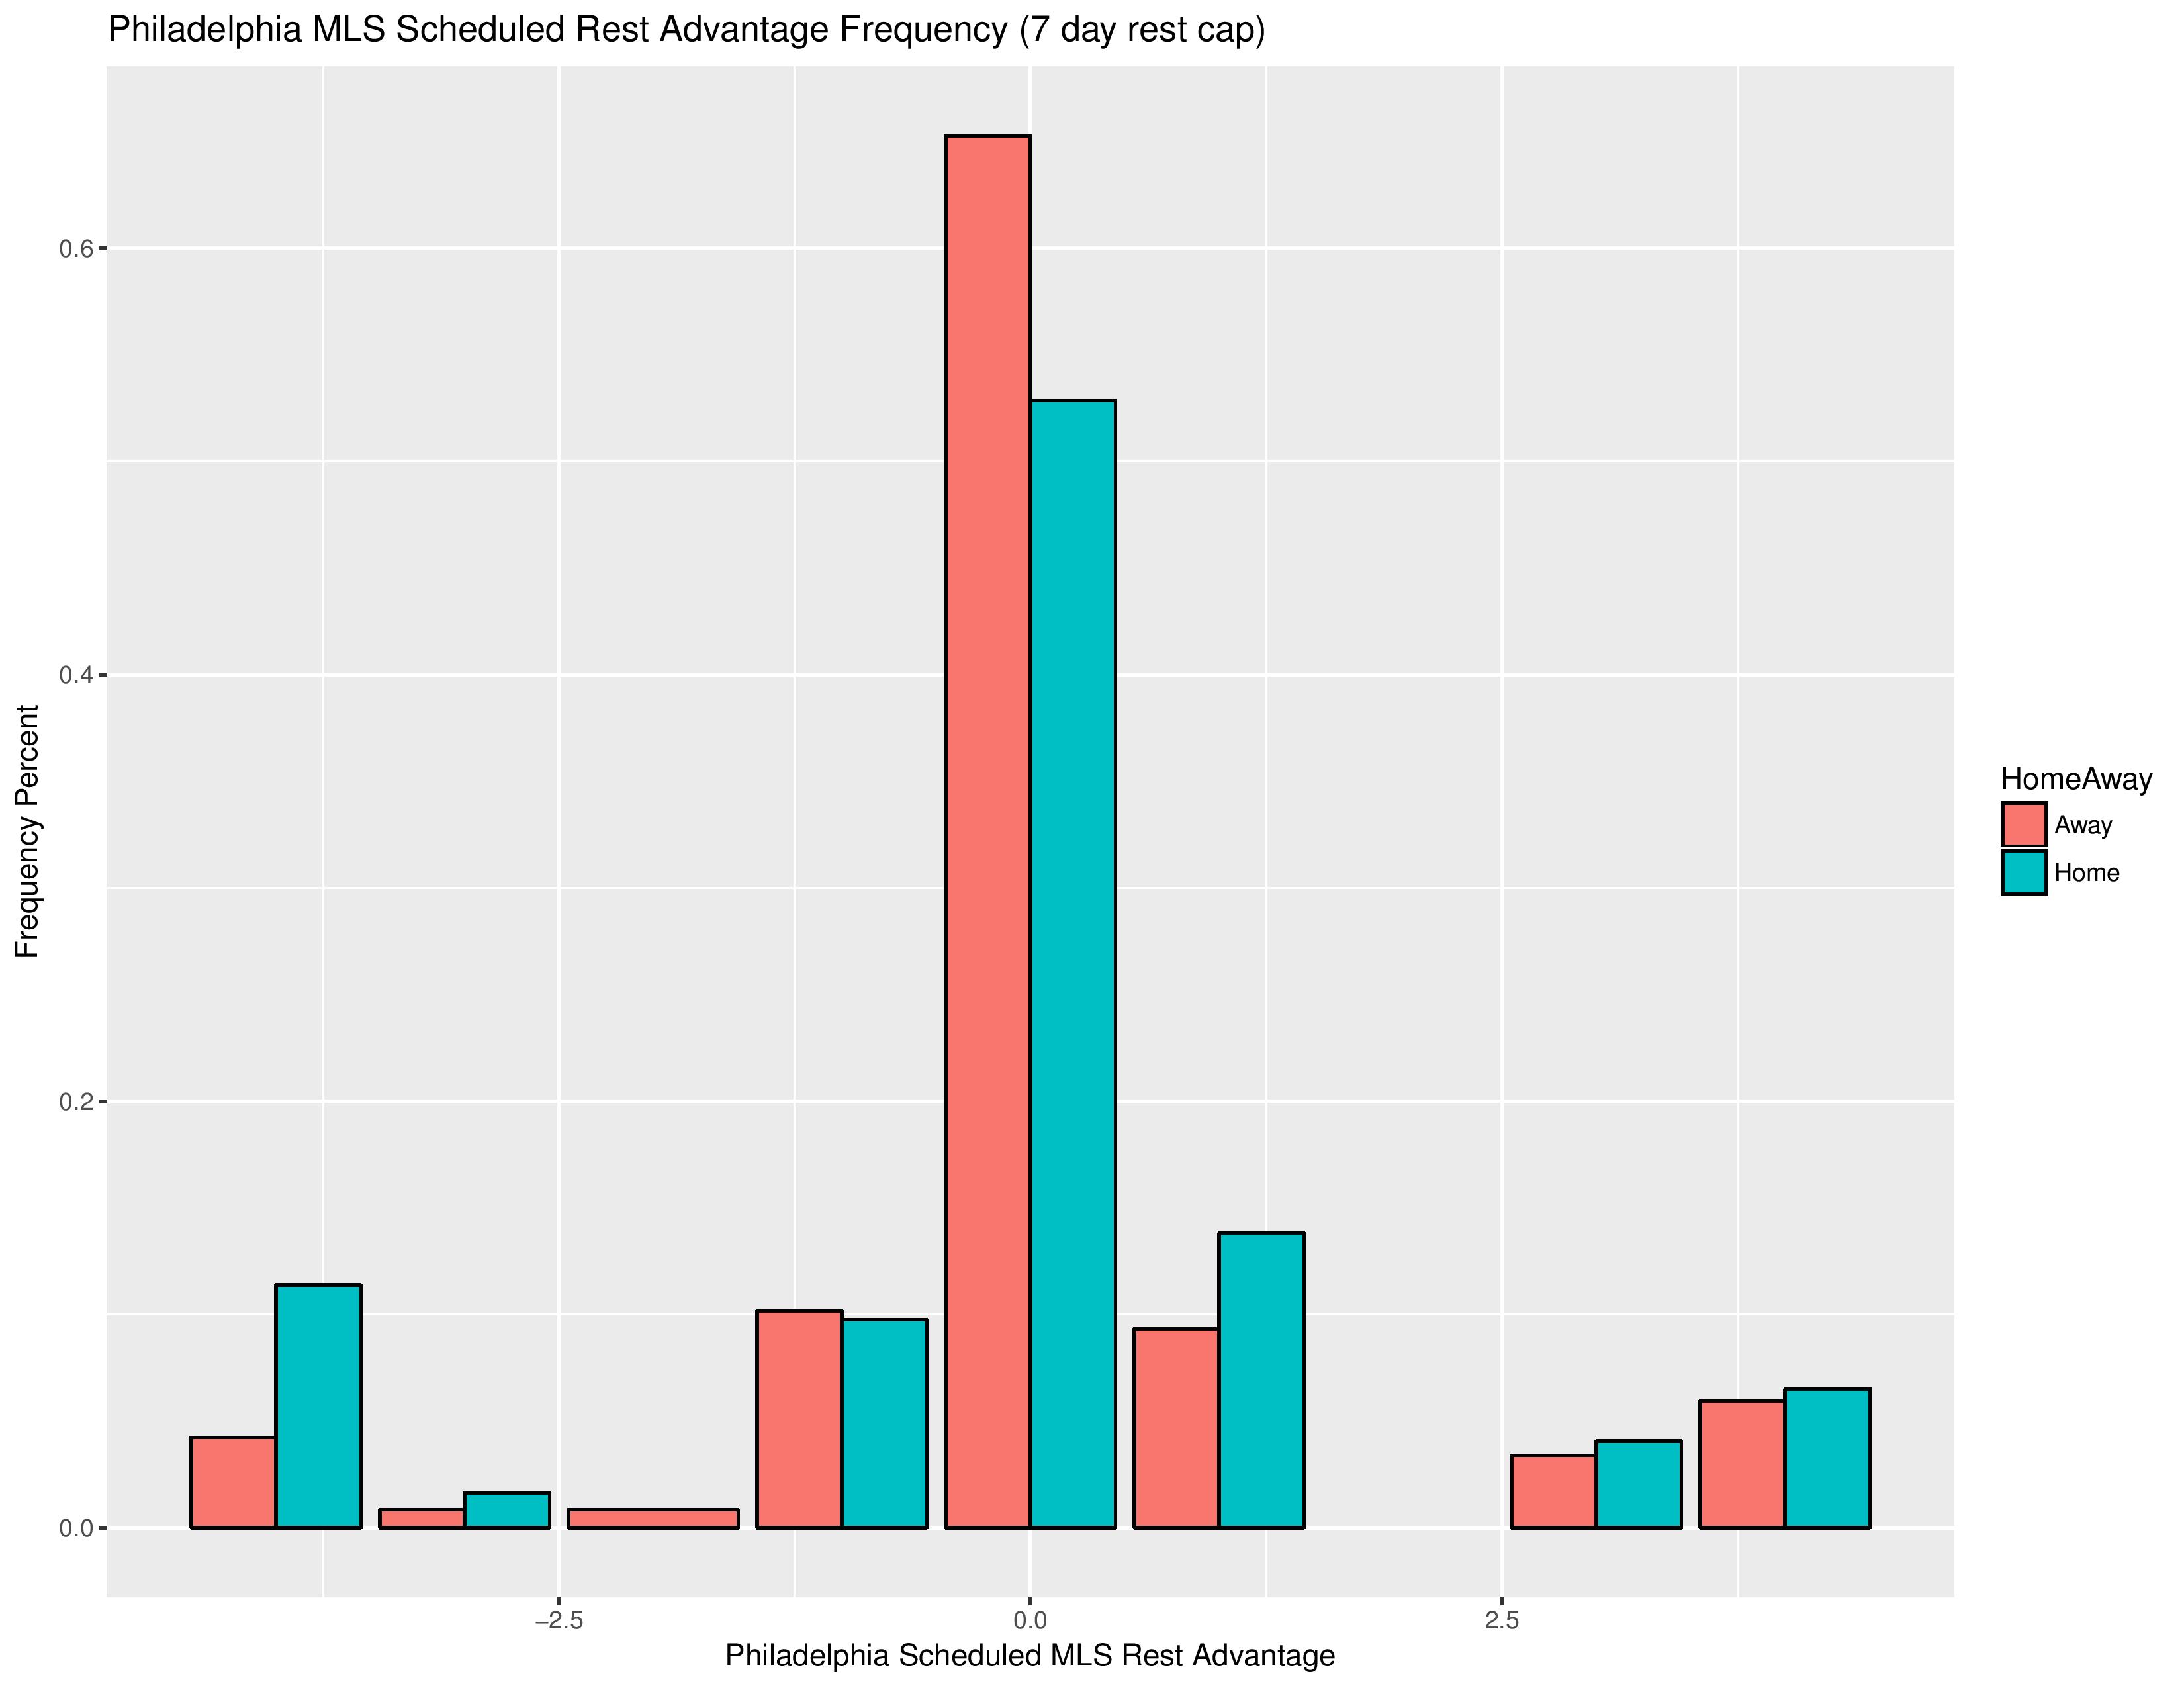
The following shows the rest advantage distribution enjoyed by home and away teams (as the distribution would be symmetrical, I only show when rest advantage is >= 0).
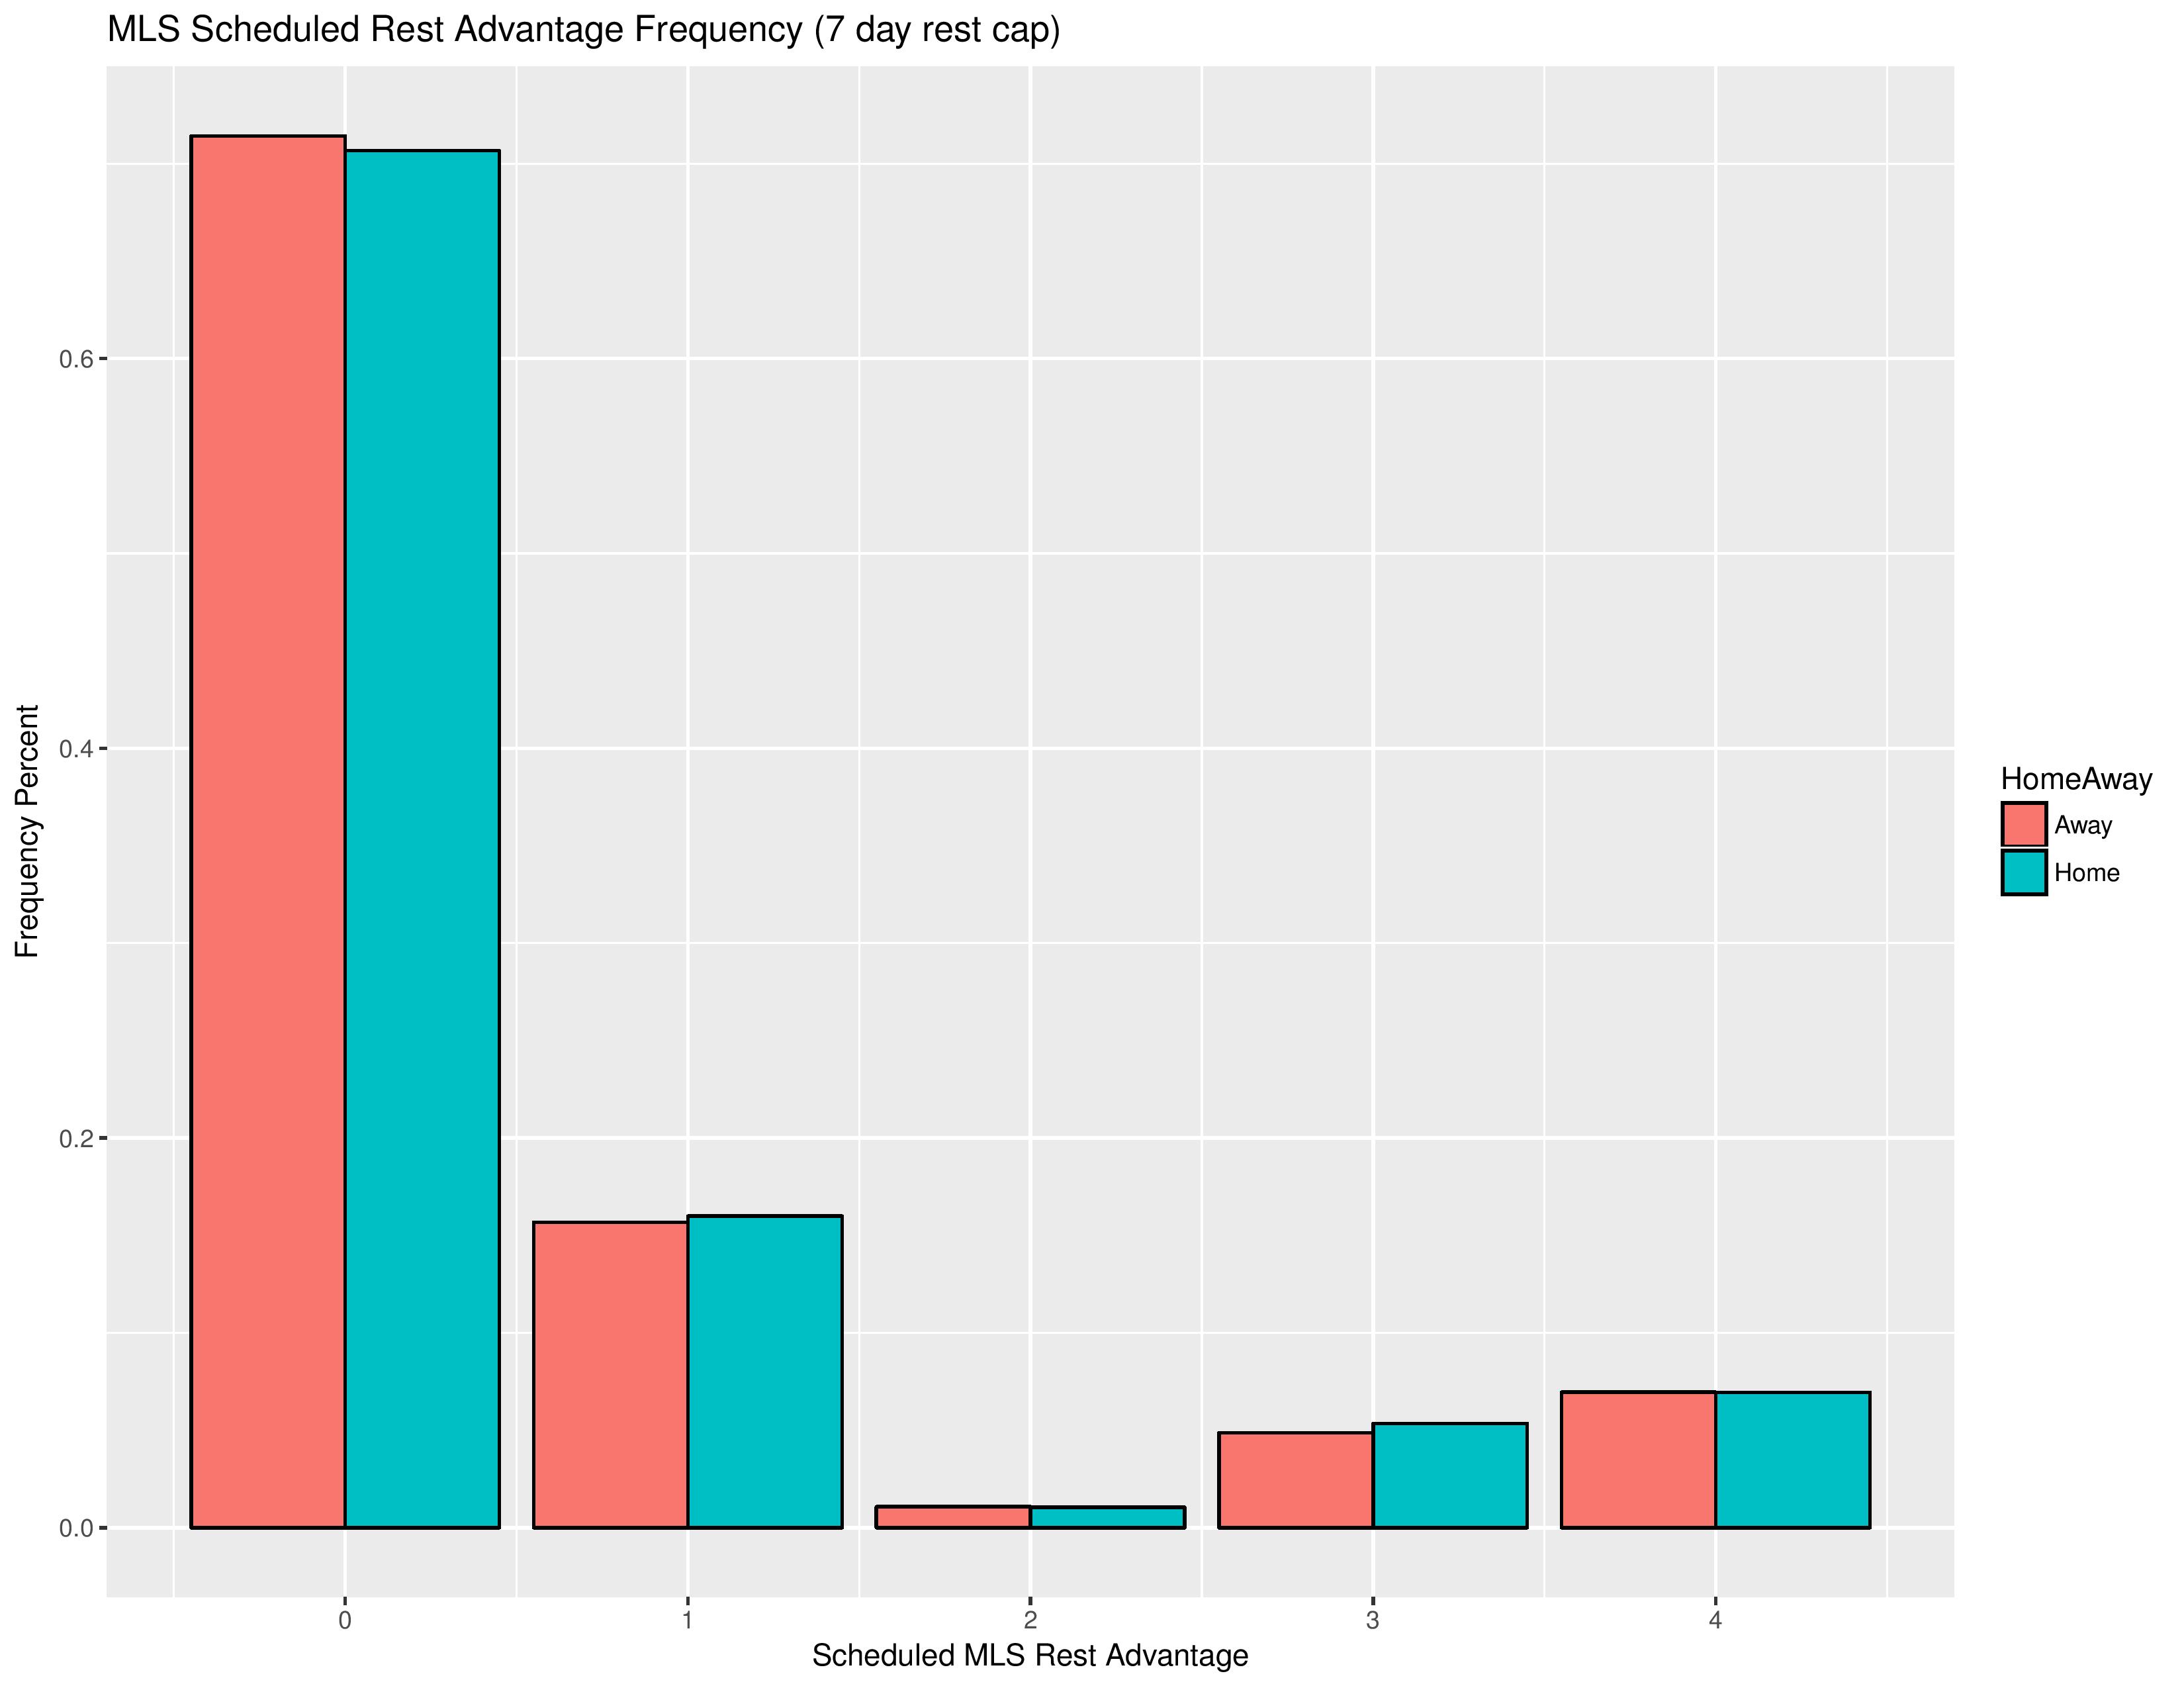
This generally indicates that home teams are very slightly more likely to have a rest advantage than away teams.
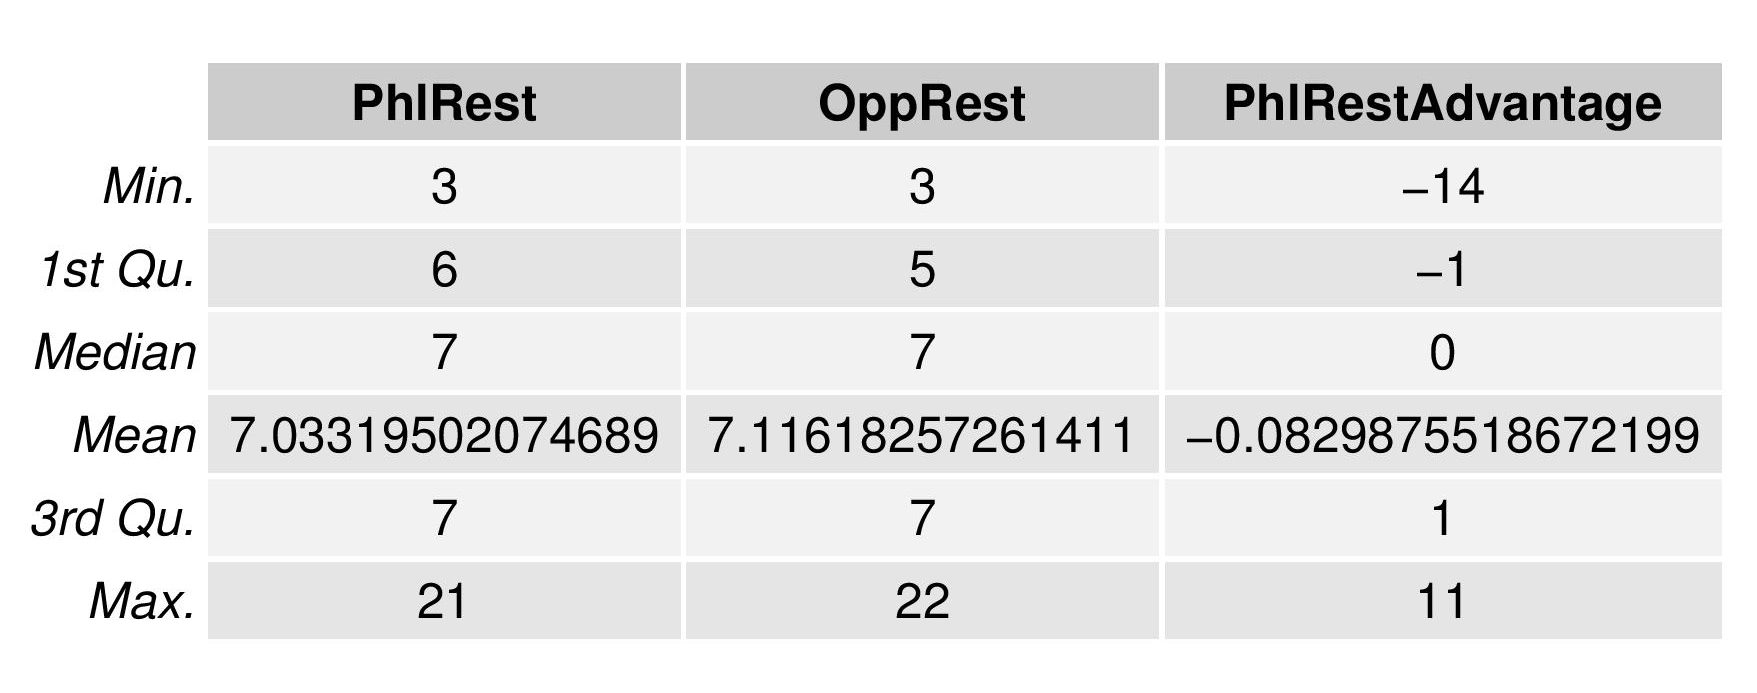
The following shows the summary statistics for home field advantage.
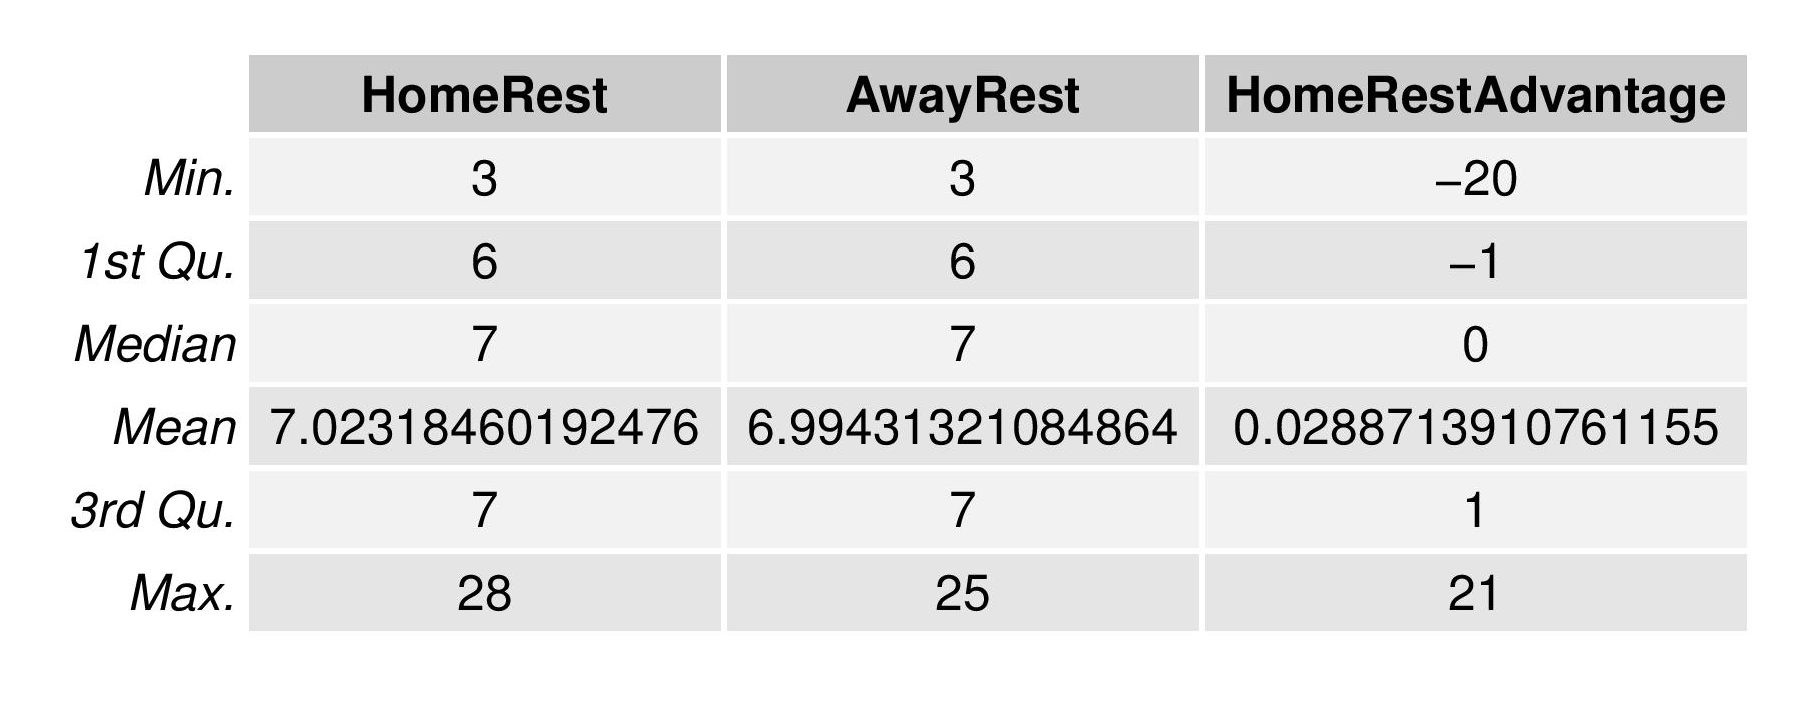
Again, this indicates that home teams are favored with respect to rest advantage, but only to a negligible degree.
Conclusion
- Short rest does have an effect on performance, although not as large of one as many people might believe.
- Upcoming rest plays a role much like past rest, in that teams that expect short rest might make an earlier sub or let a valued starter sit out a match to rest up for the next one.
- While there is a slight tendency for the MLS schedule to favor home teams with regards to rest, it is very tiny.
- I currently calculate that short rest (both in the past and upcoming), accounts for only 0.3% of home field advantage.
Appendix
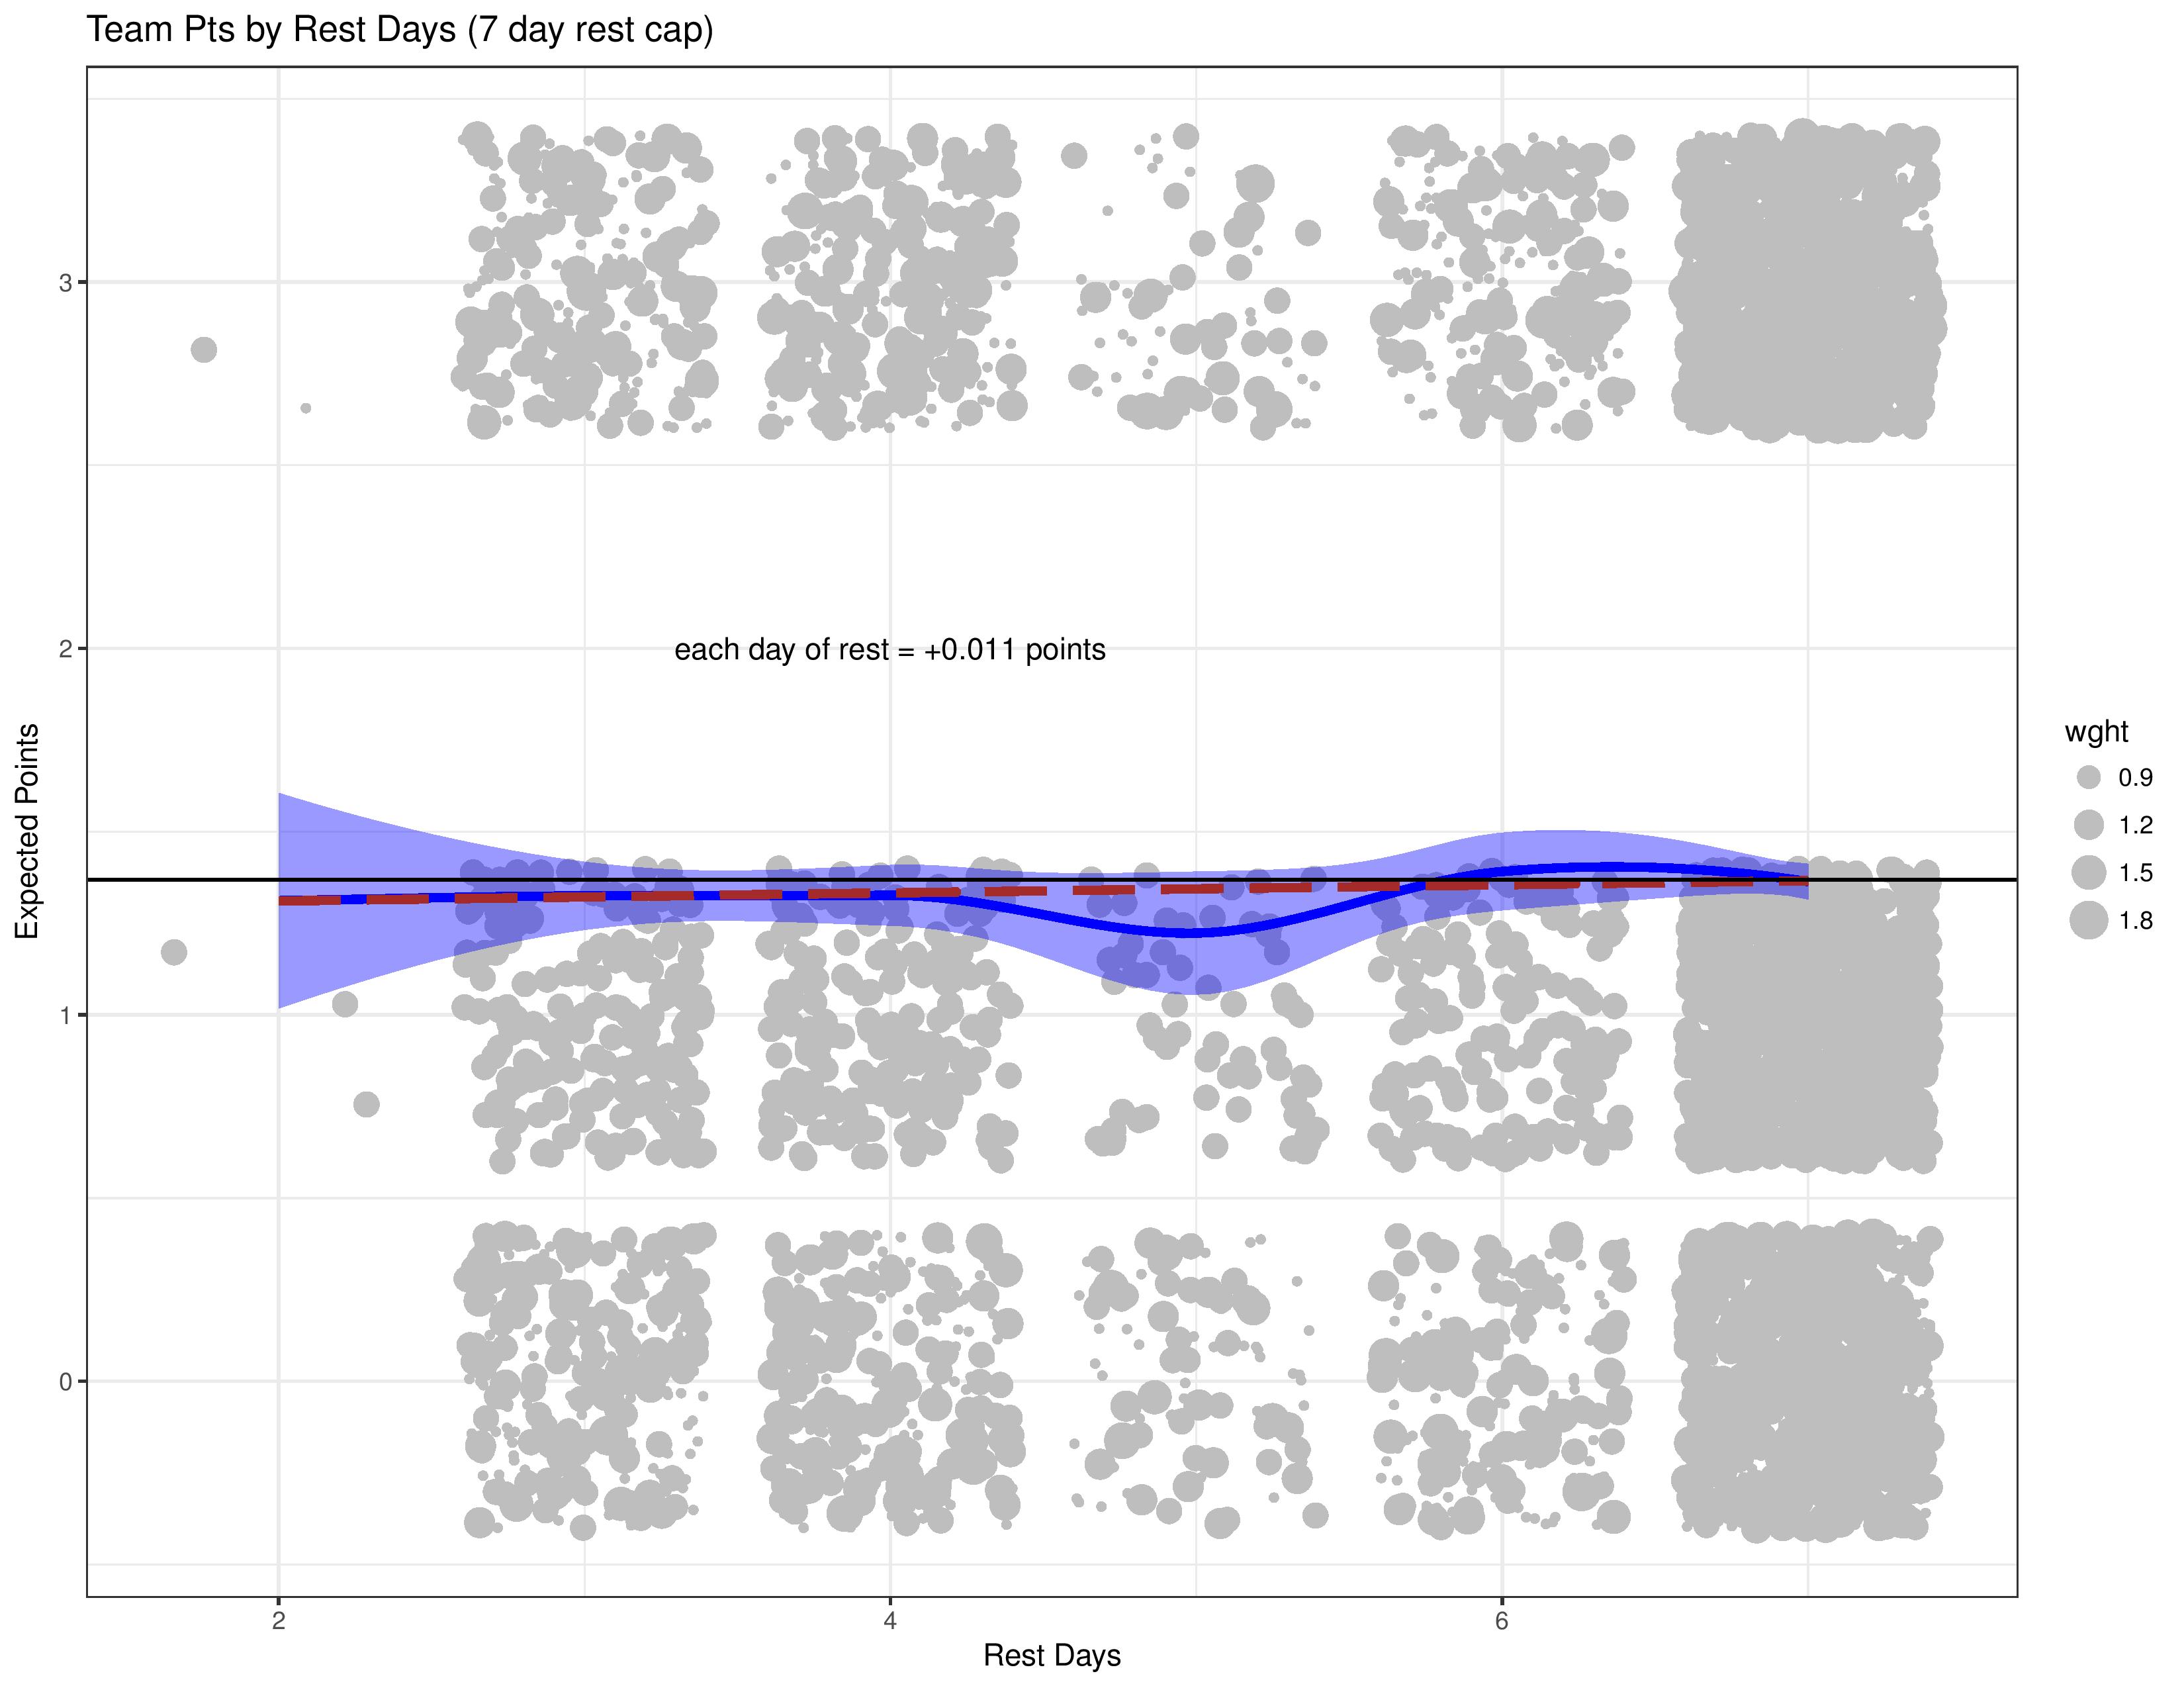
The following shows the points earned vs. rest days (as opposed to rest advantage).
Philadelphia Versions of Charts

0.3% seems minuscule and within any margin of error for your sampling. That being said, I still don’t like the fact that the Union will be going into Columbus on July 22 on 3 days rest (and likely without some or all of their Gold Cup players) while Columbus will be on 2.5 weeks rest (with no one at the Gold Cup). One of my biggest pet peeves with MLS is that given an even number of teams, there is no reason the rest amount should be different by more than a day or two except due to Open Cup/CCL/International Friendlies.
Yeah, that does seem unfair, as you pointed out, that there is no reason to not subject teams to similar schedules
Very nice work, Chris.
–
One could argue that the relatively modest effect of short rest on performance validates Jim Curtin’s attitude toward squad rotation: I’d rather my best guy, with a 5% drop in his performance, than my second-best guy, who is 10-15% worse than my best guy. (Of course, squad rotation is also a long-term issue, which is not addressed here.)
Thanks! I agree, I think it makes sense to have the best player in, unless you have a backup nearly as good. But I also agree that there is a long-term weariness effect. I’d be surprised if Sapong’s drop-off last year wasn’t partly caused by long-term weariness
This and the other two articles are great. I find the travel distance analysis the most interesting.
.
Any plans to incorporate this information into your SEBA algorithm?
Thanks! Yes, I’m working out how to do it best, since it isn’t straightforward now that the measured team ability changes throughout the year.
–
I’ll also need to test it before publishing it to make sure I didn’t implement it incorrectly, so it’s possible this may be an off-season change.