Below are the updated season forecasts using data from games through June 11, 2017.
Power Rankings
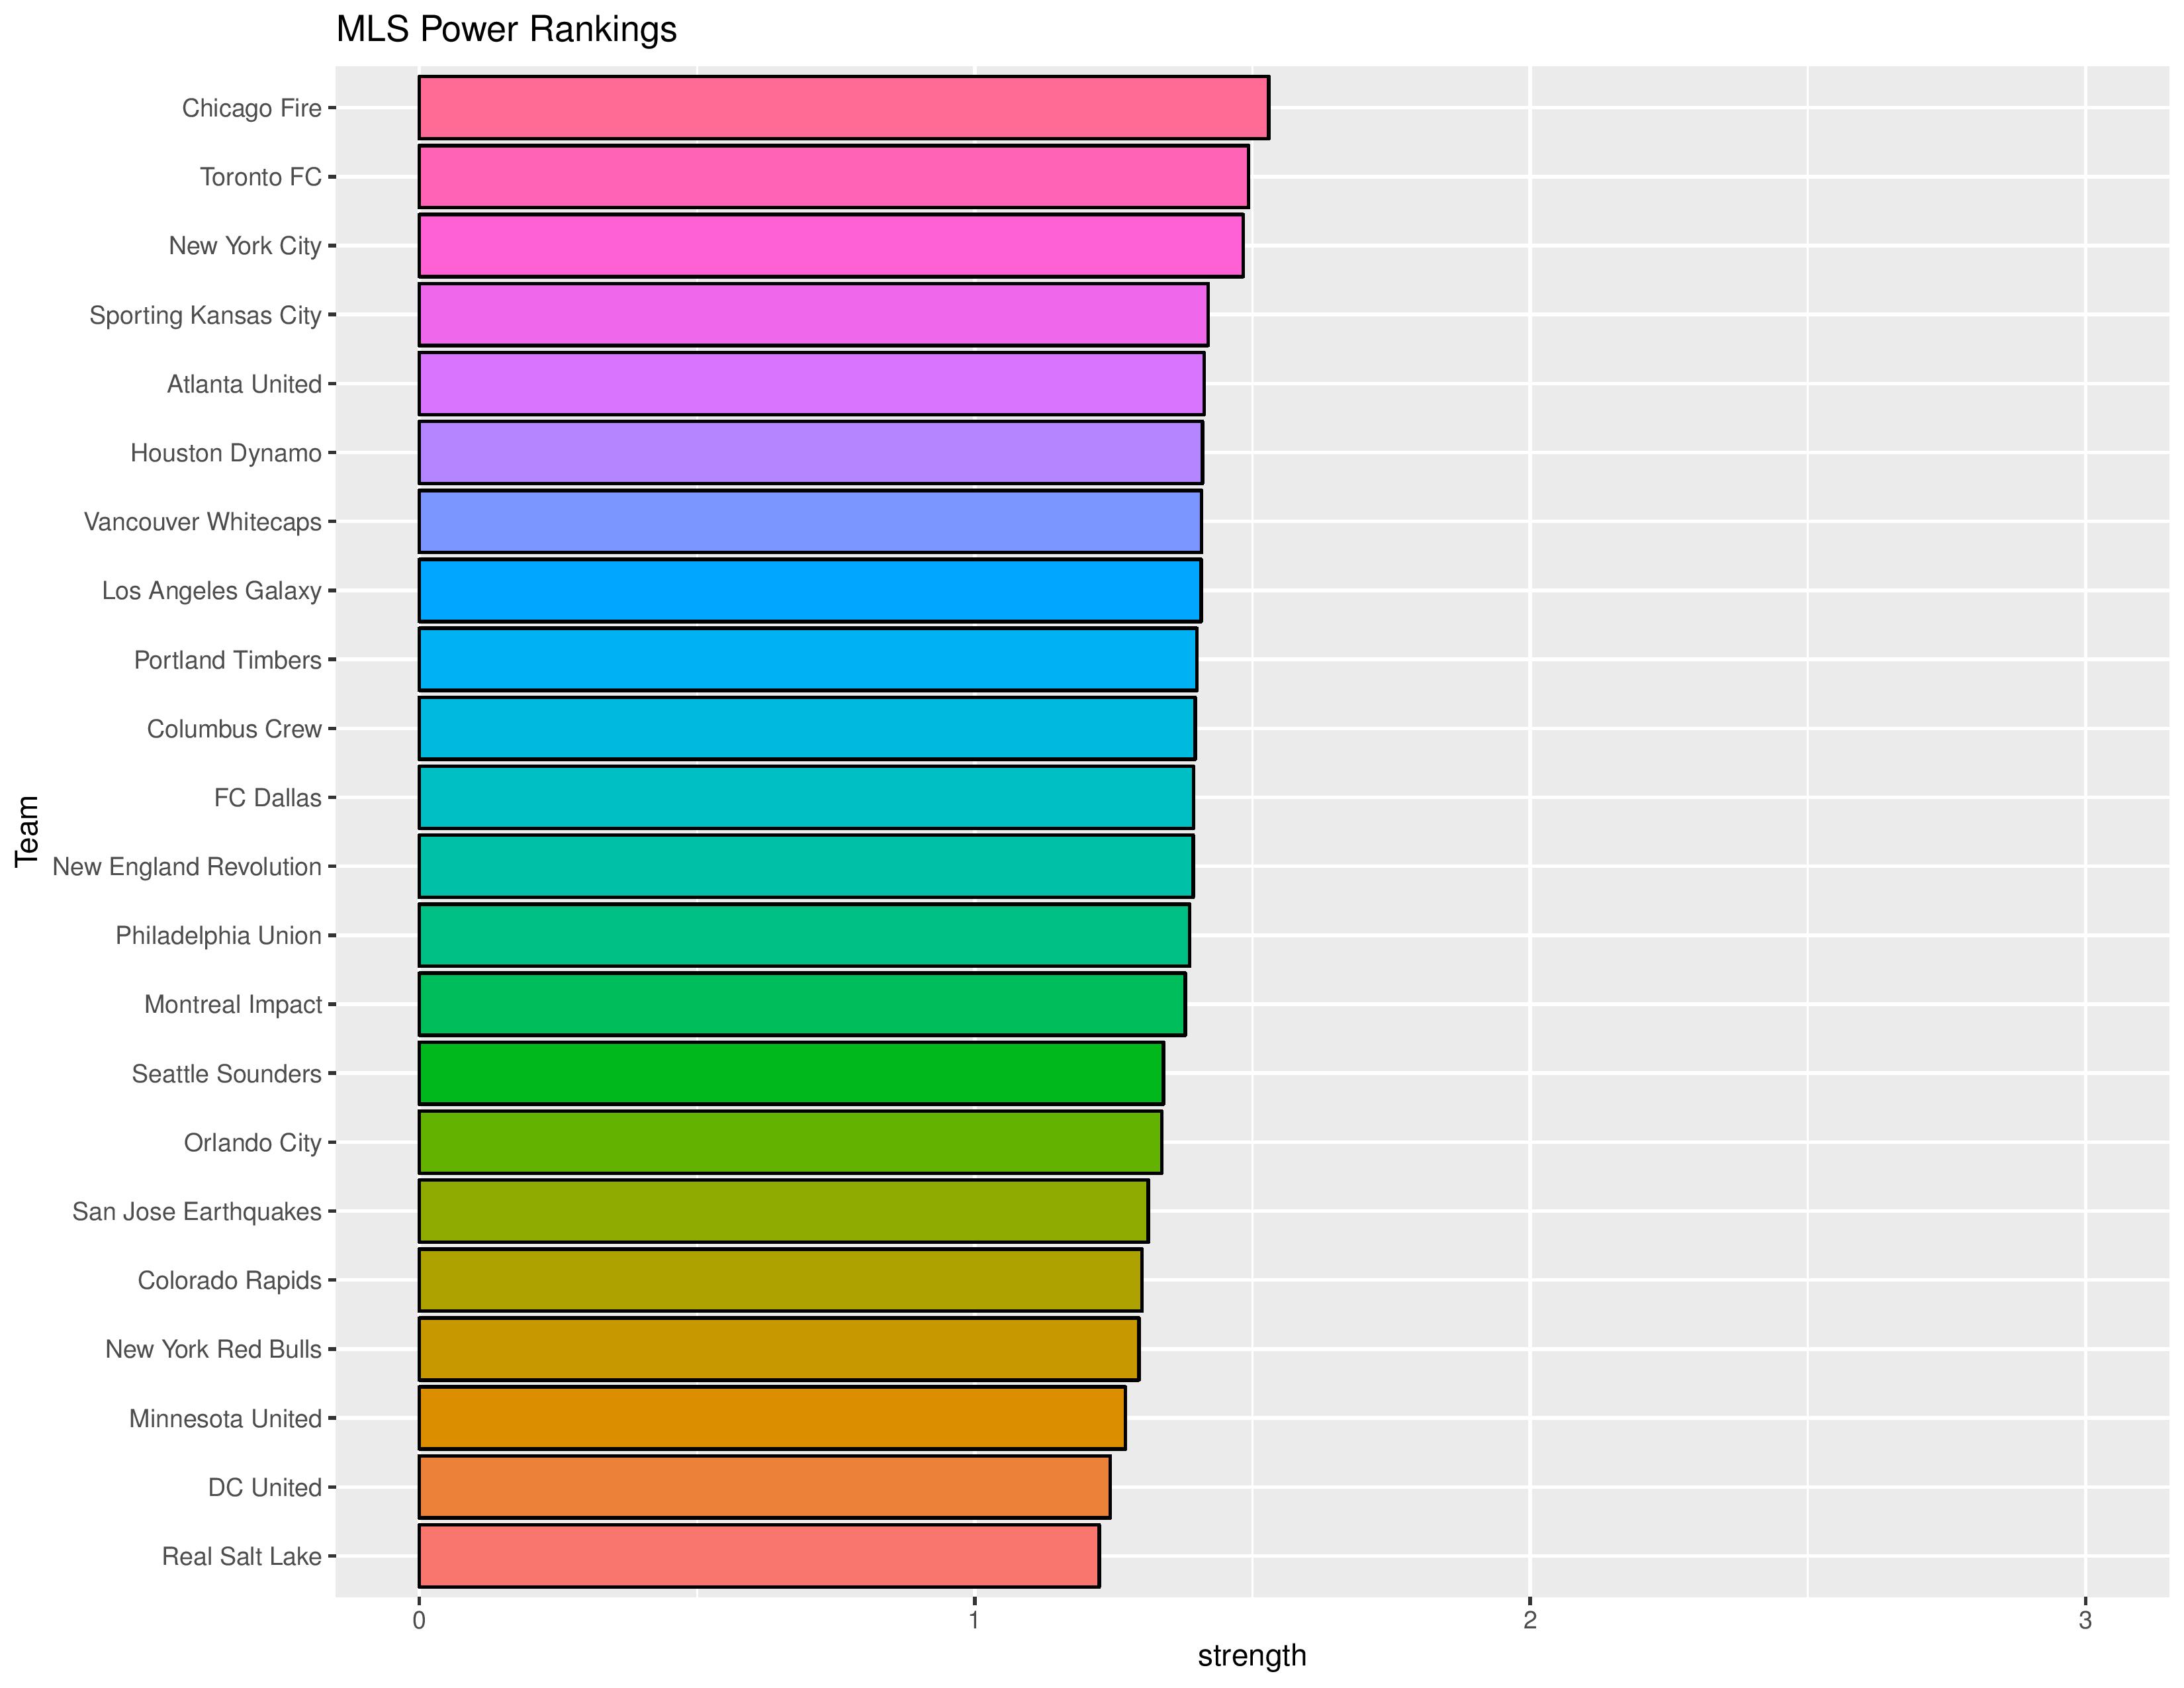
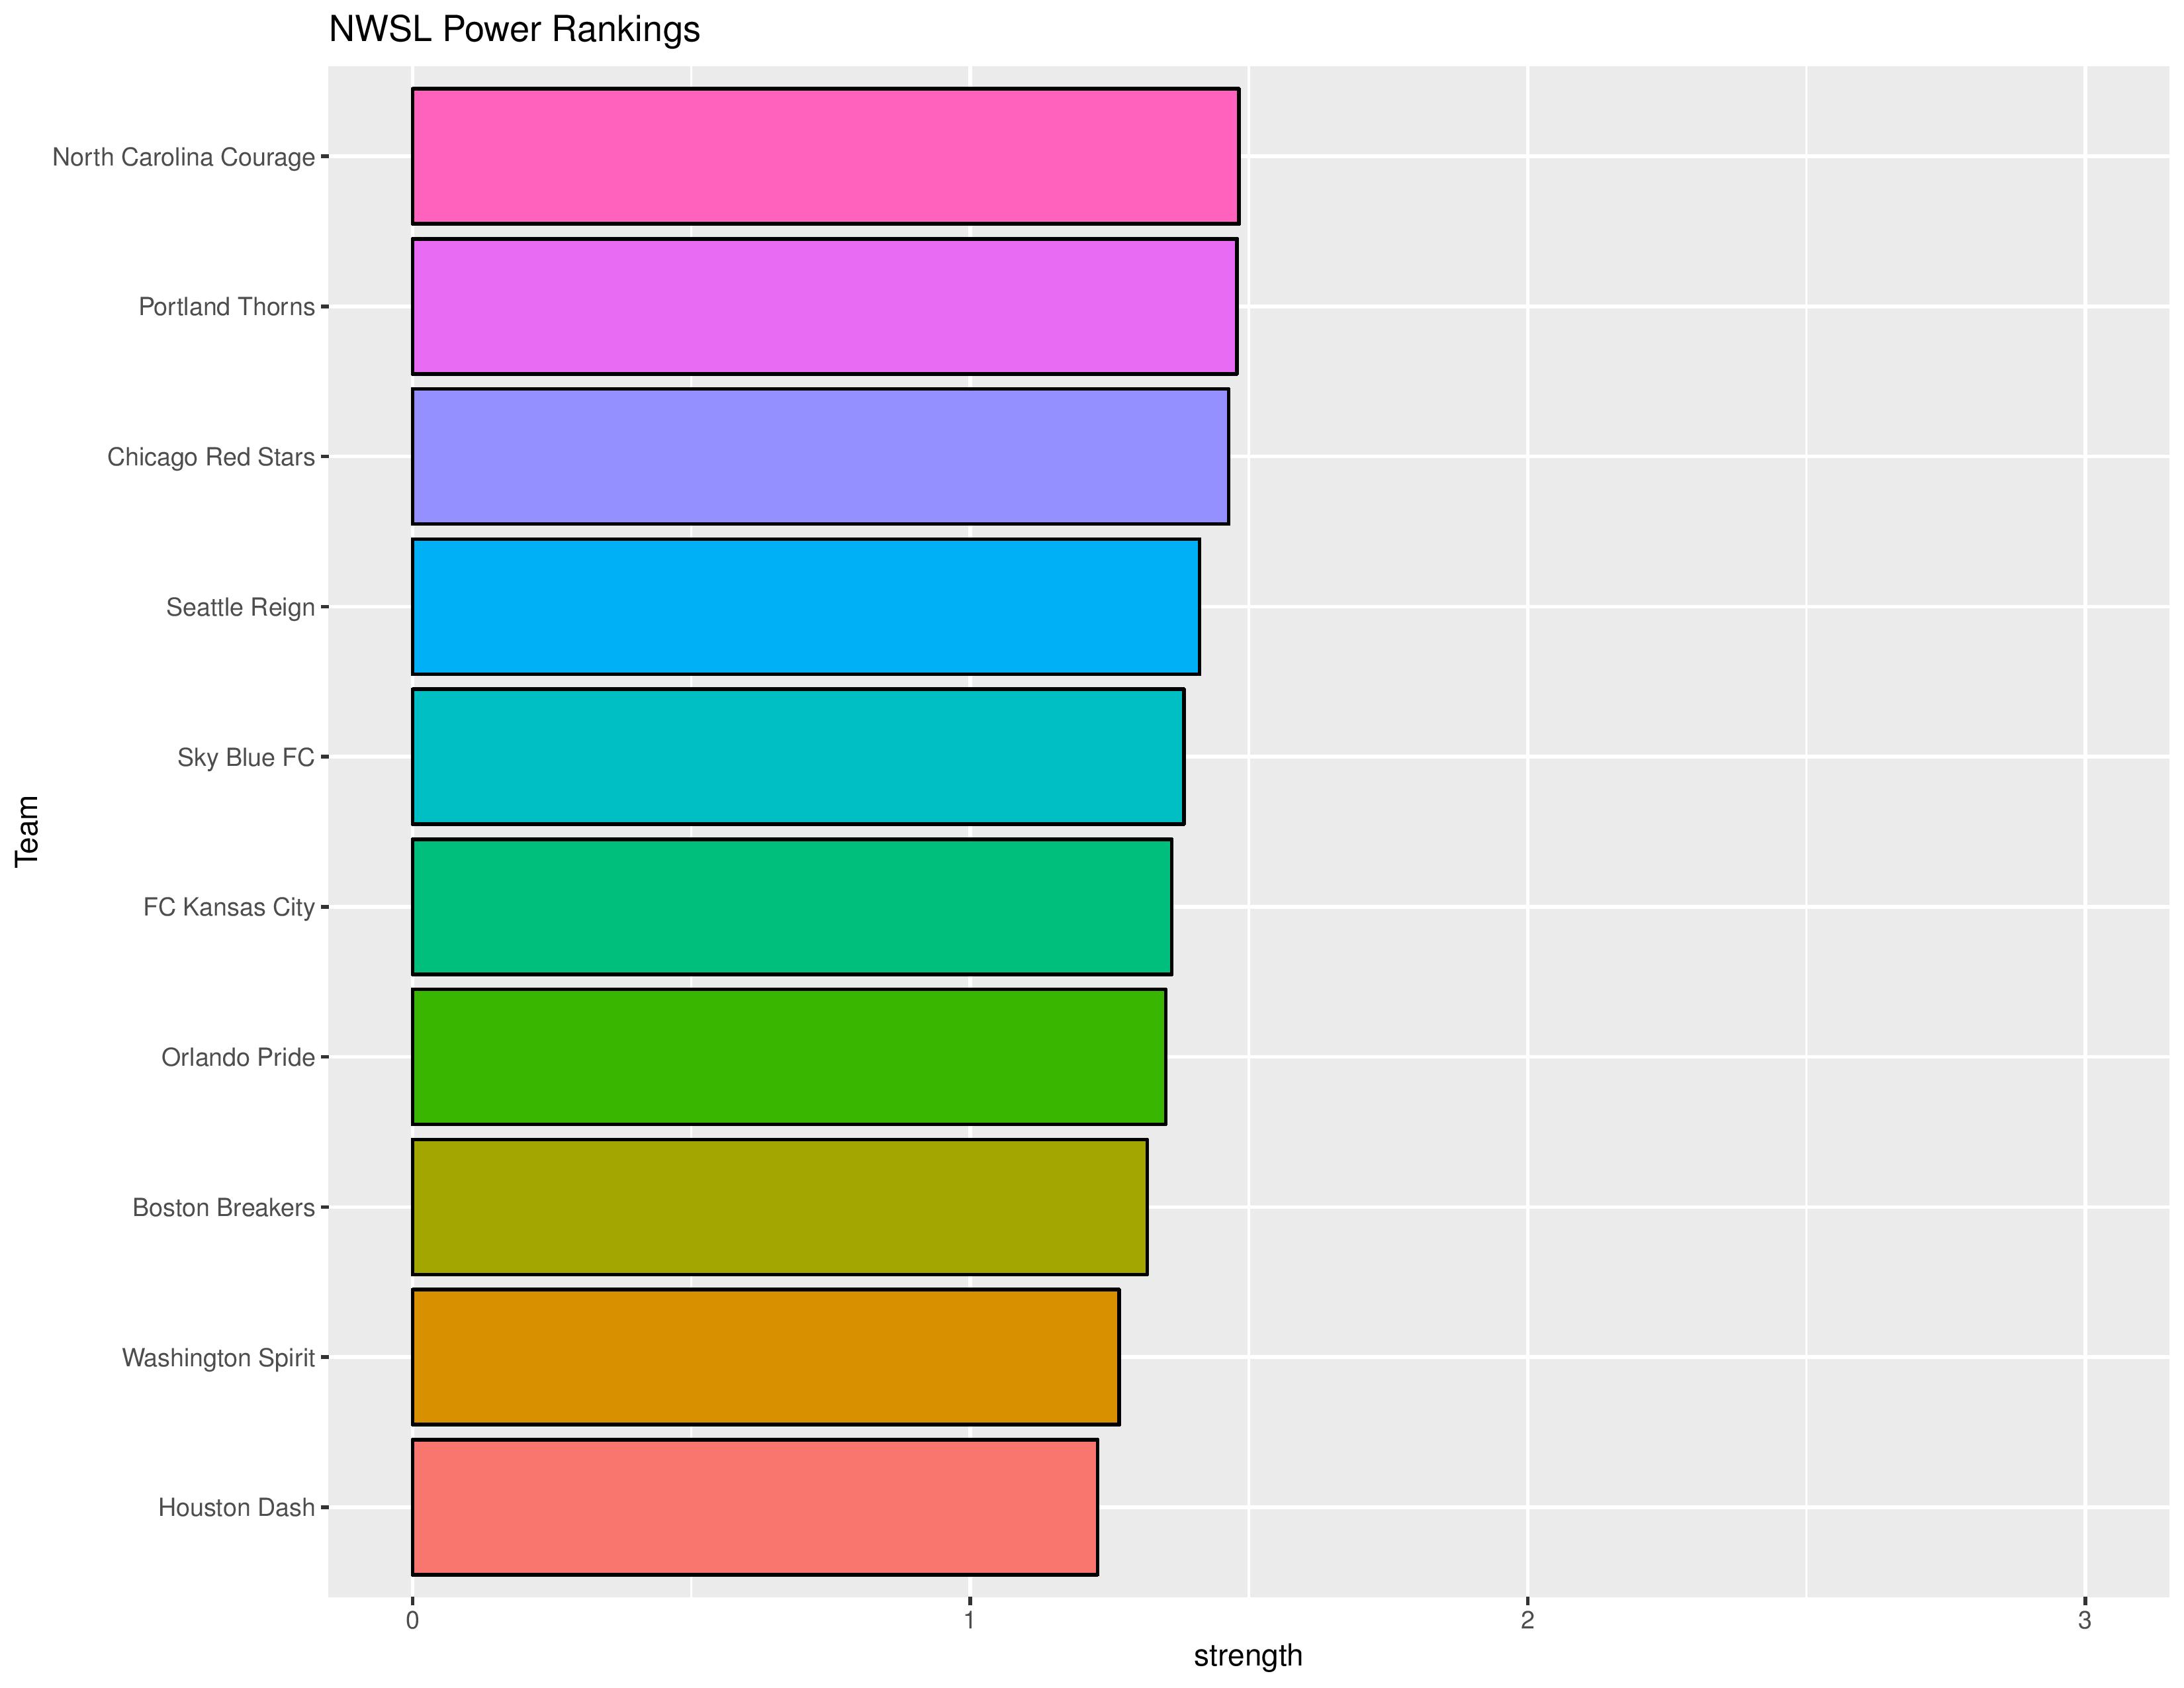
The “Power Rankings” we concoct are the “strength” of the team according to its competitive expectations. They are computed by forecasting the expected points (3 x win probability + 1 x draw probability) against every MLS team, both home and away, and taking the average per team.
SEBA has the Union declining from 11th to 13th. MLSSoccer.com has Philadelphia remaining at 18th.
For those interested in how Philadelphia’s matches are weighted in the model (especially if skeptical about why SEBA’s are so different from other outlets):
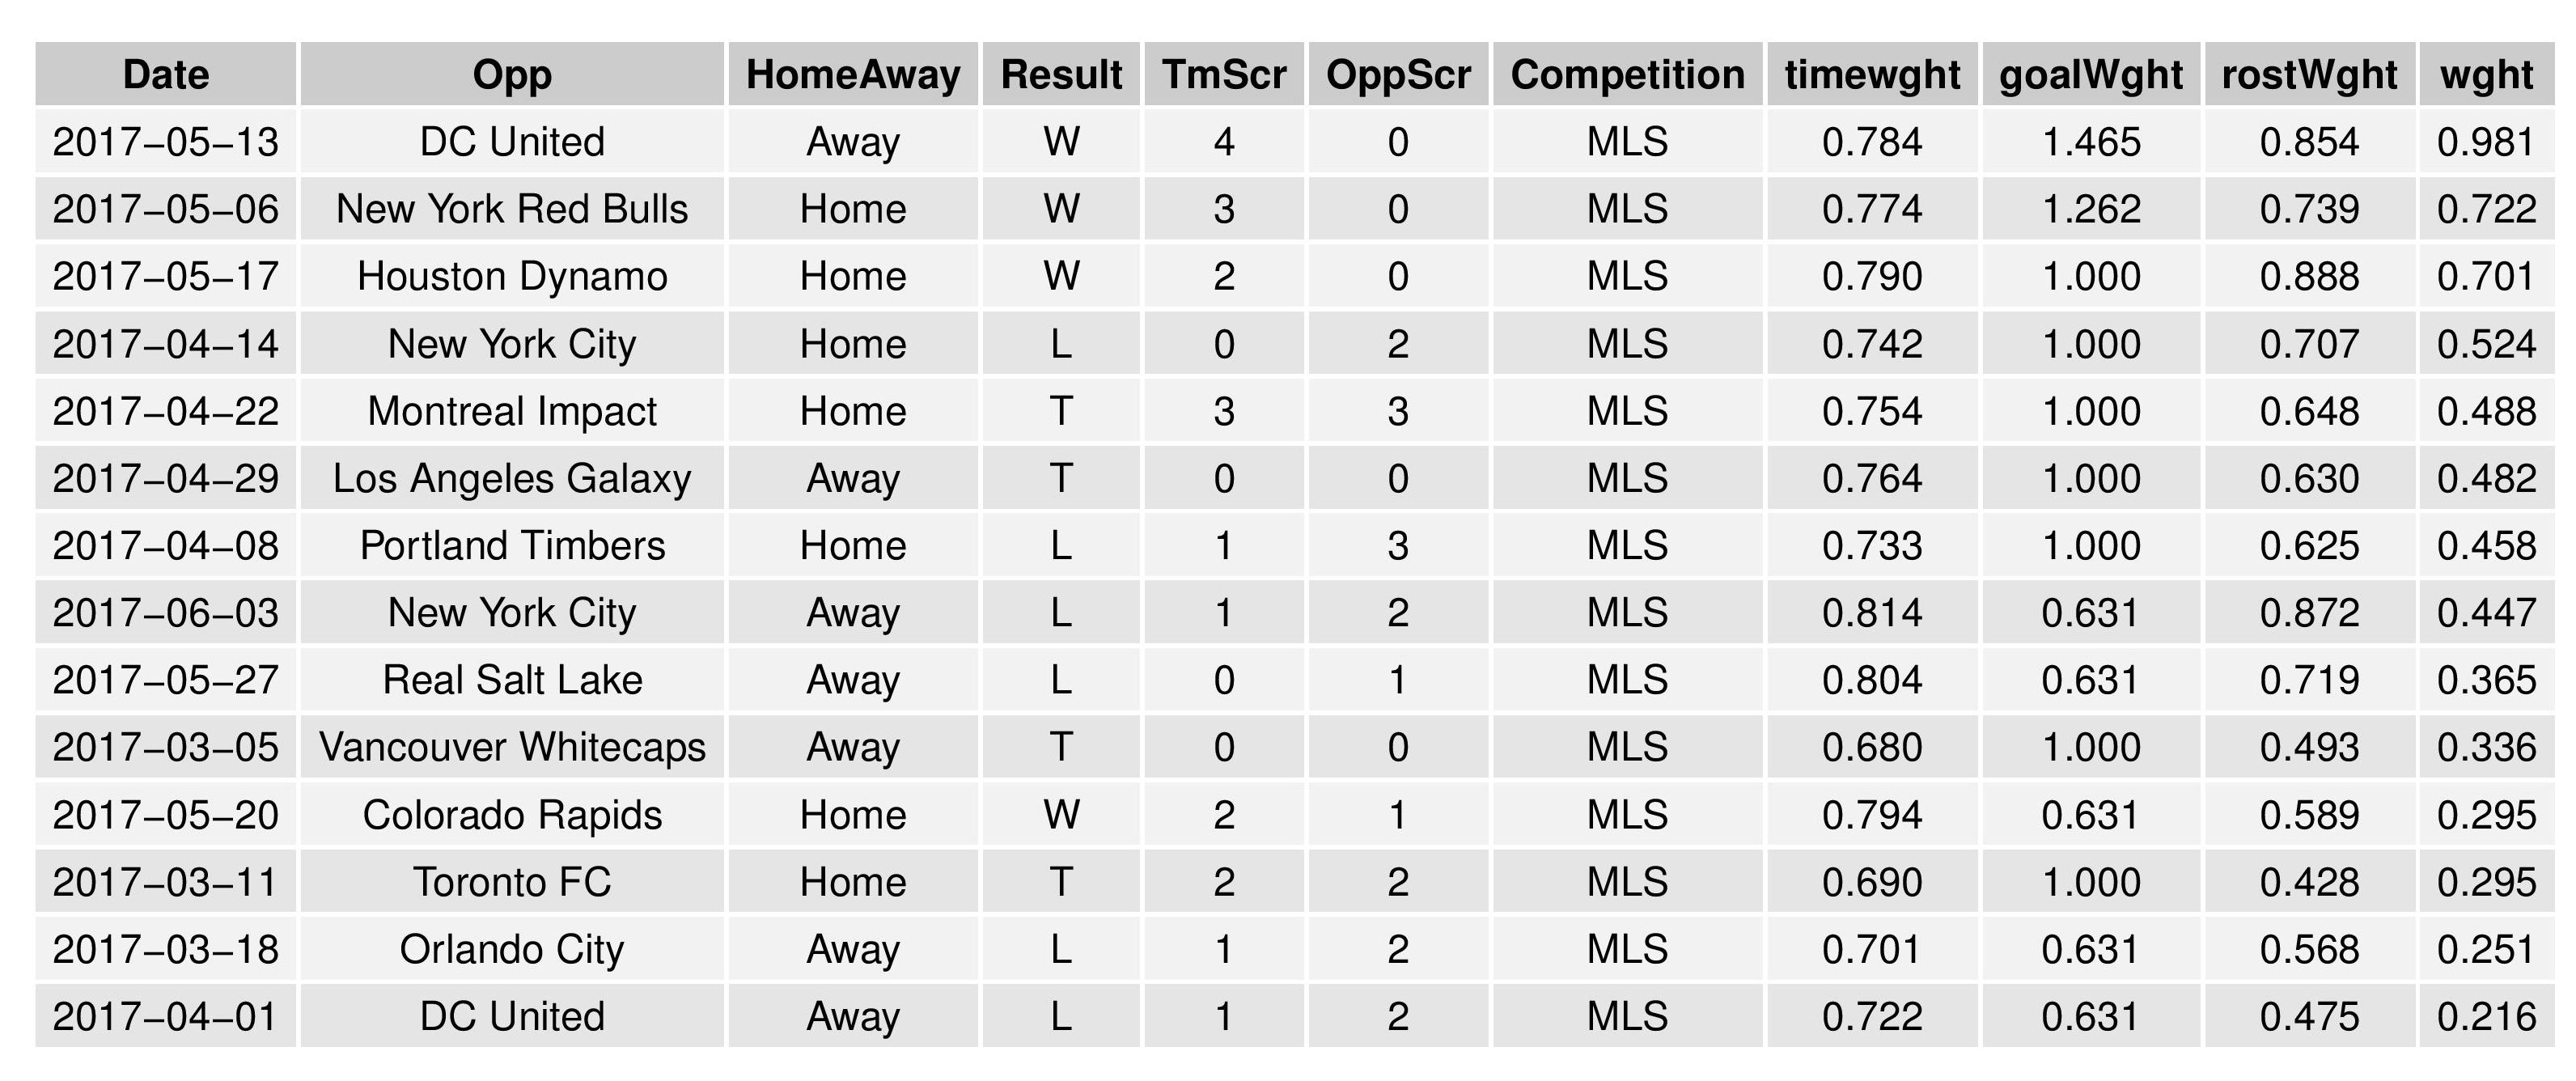
‘wght’ is the actual weight value used in the model, which is a combination of the ‘timewght’ (how long ago the match occurred), ‘goalWght’ (how much luck could have influenced the match result, as indicated by the goal differential), and ‘rostWght’ (how similar the roster deployments for both teams were compared with current trends).
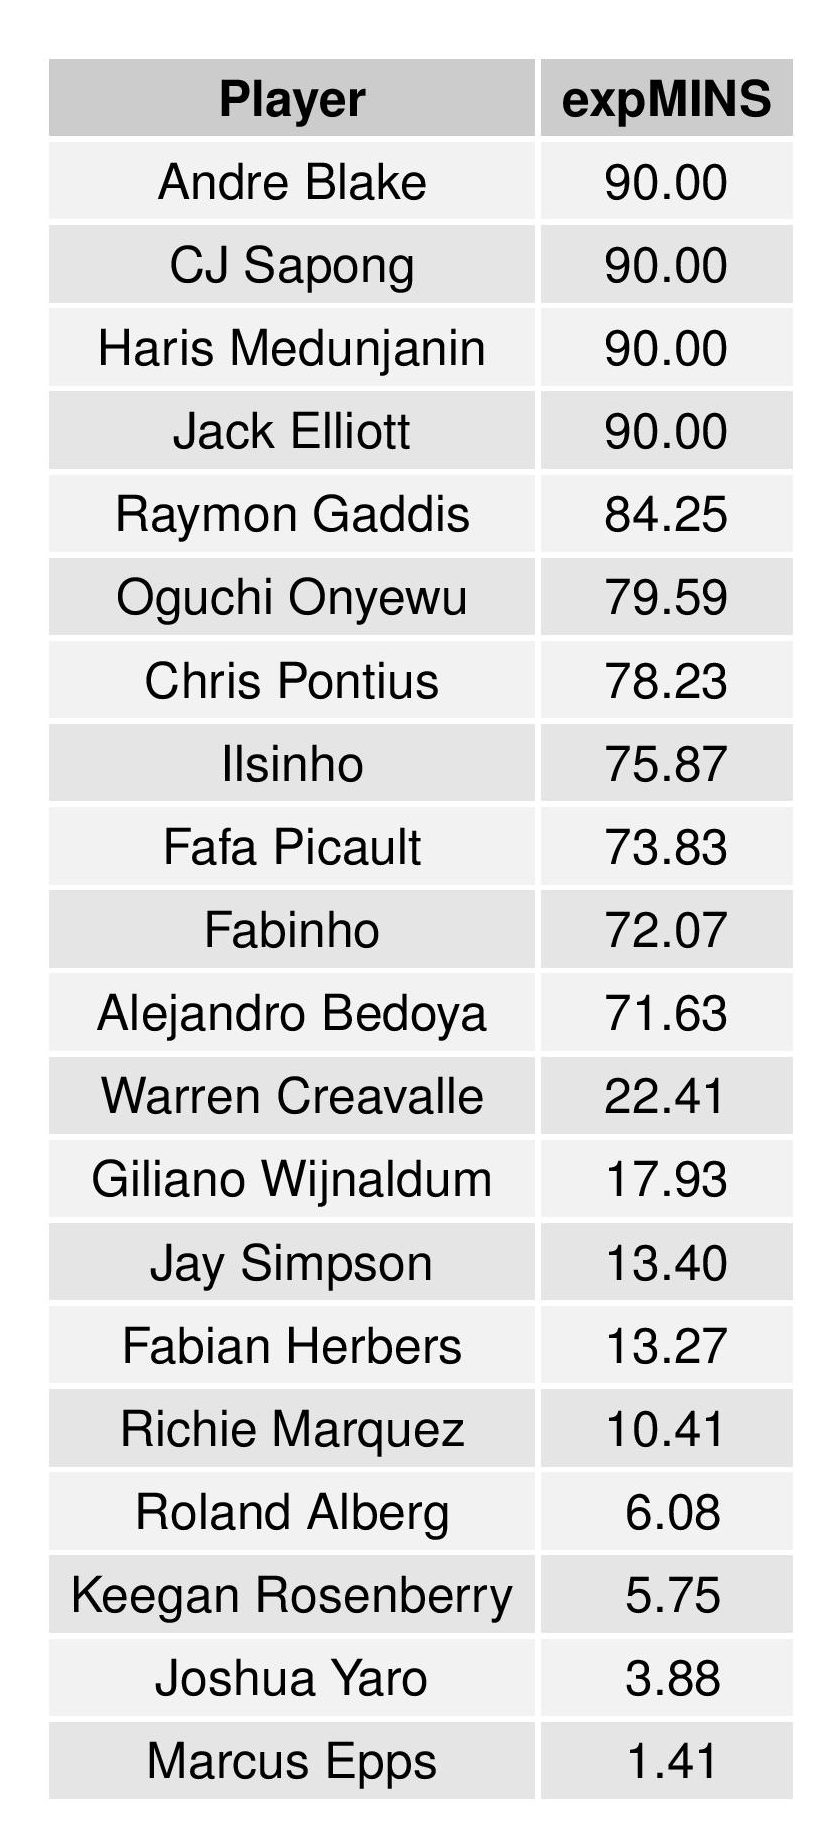
For comparison, the current roster expectations for maximum weight for the Union are currently:
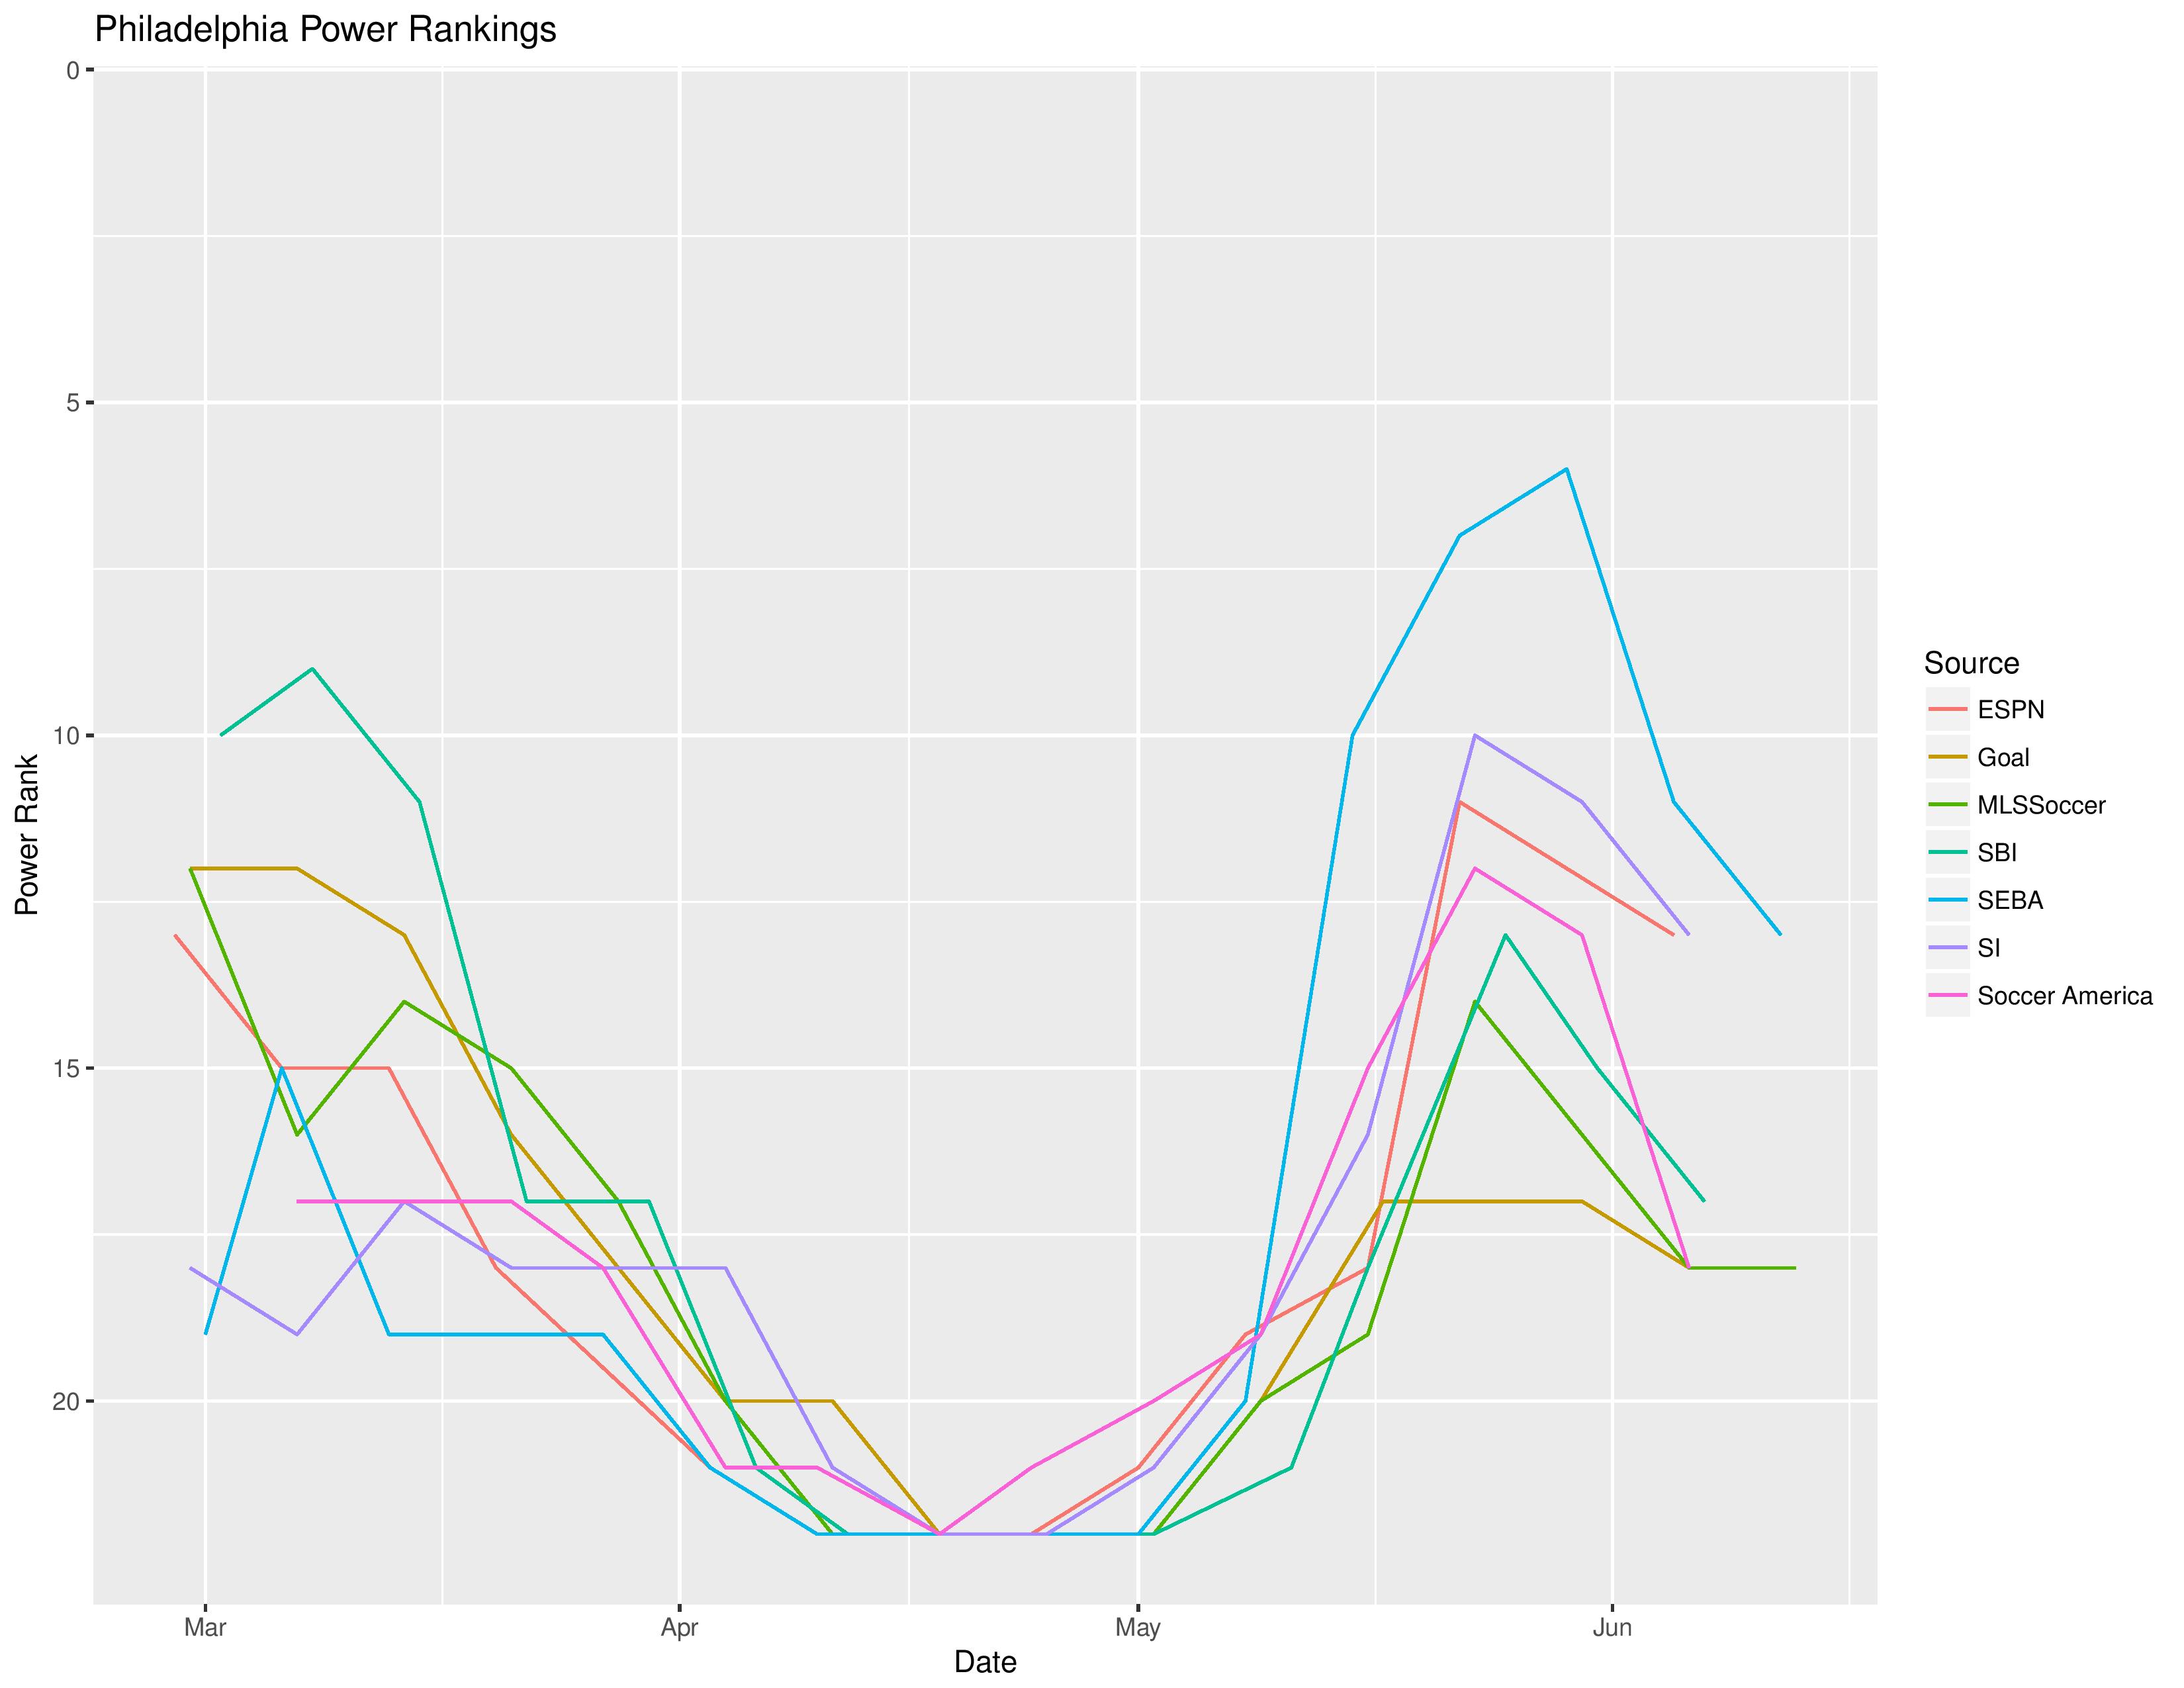
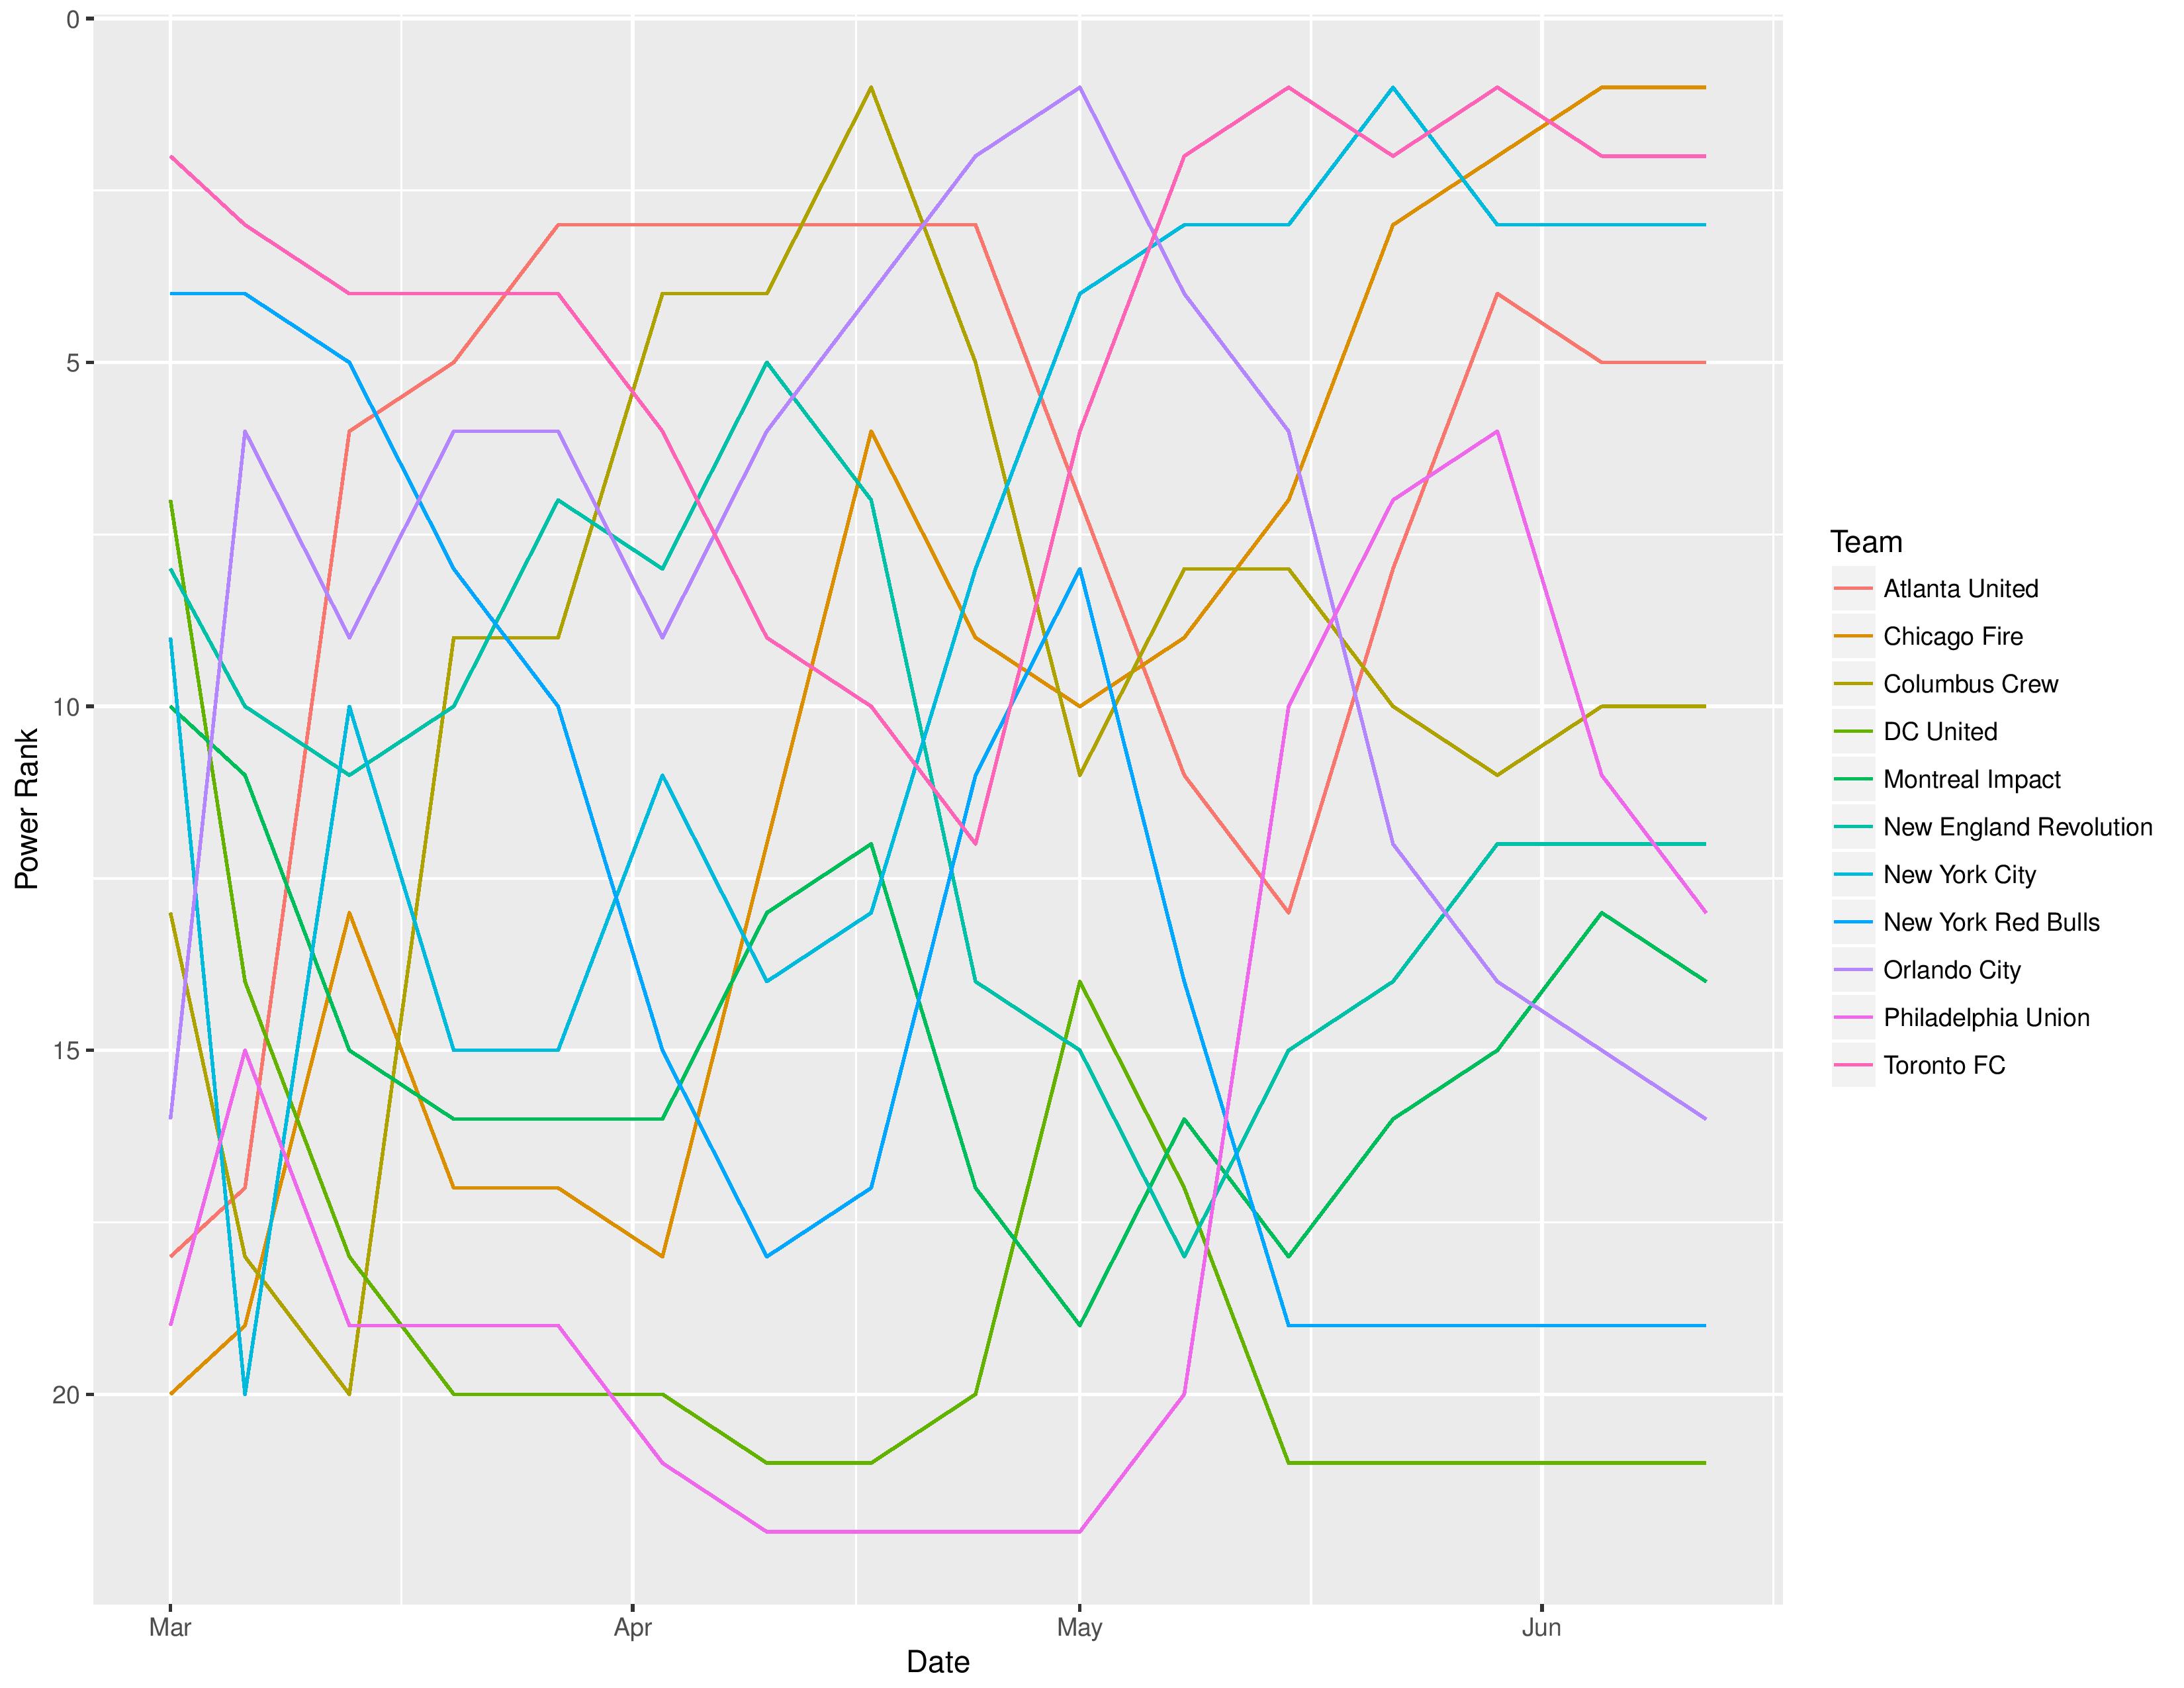
The following shows the evolution of SEBA’s power rankings for the MLS Eastern Conference over time:
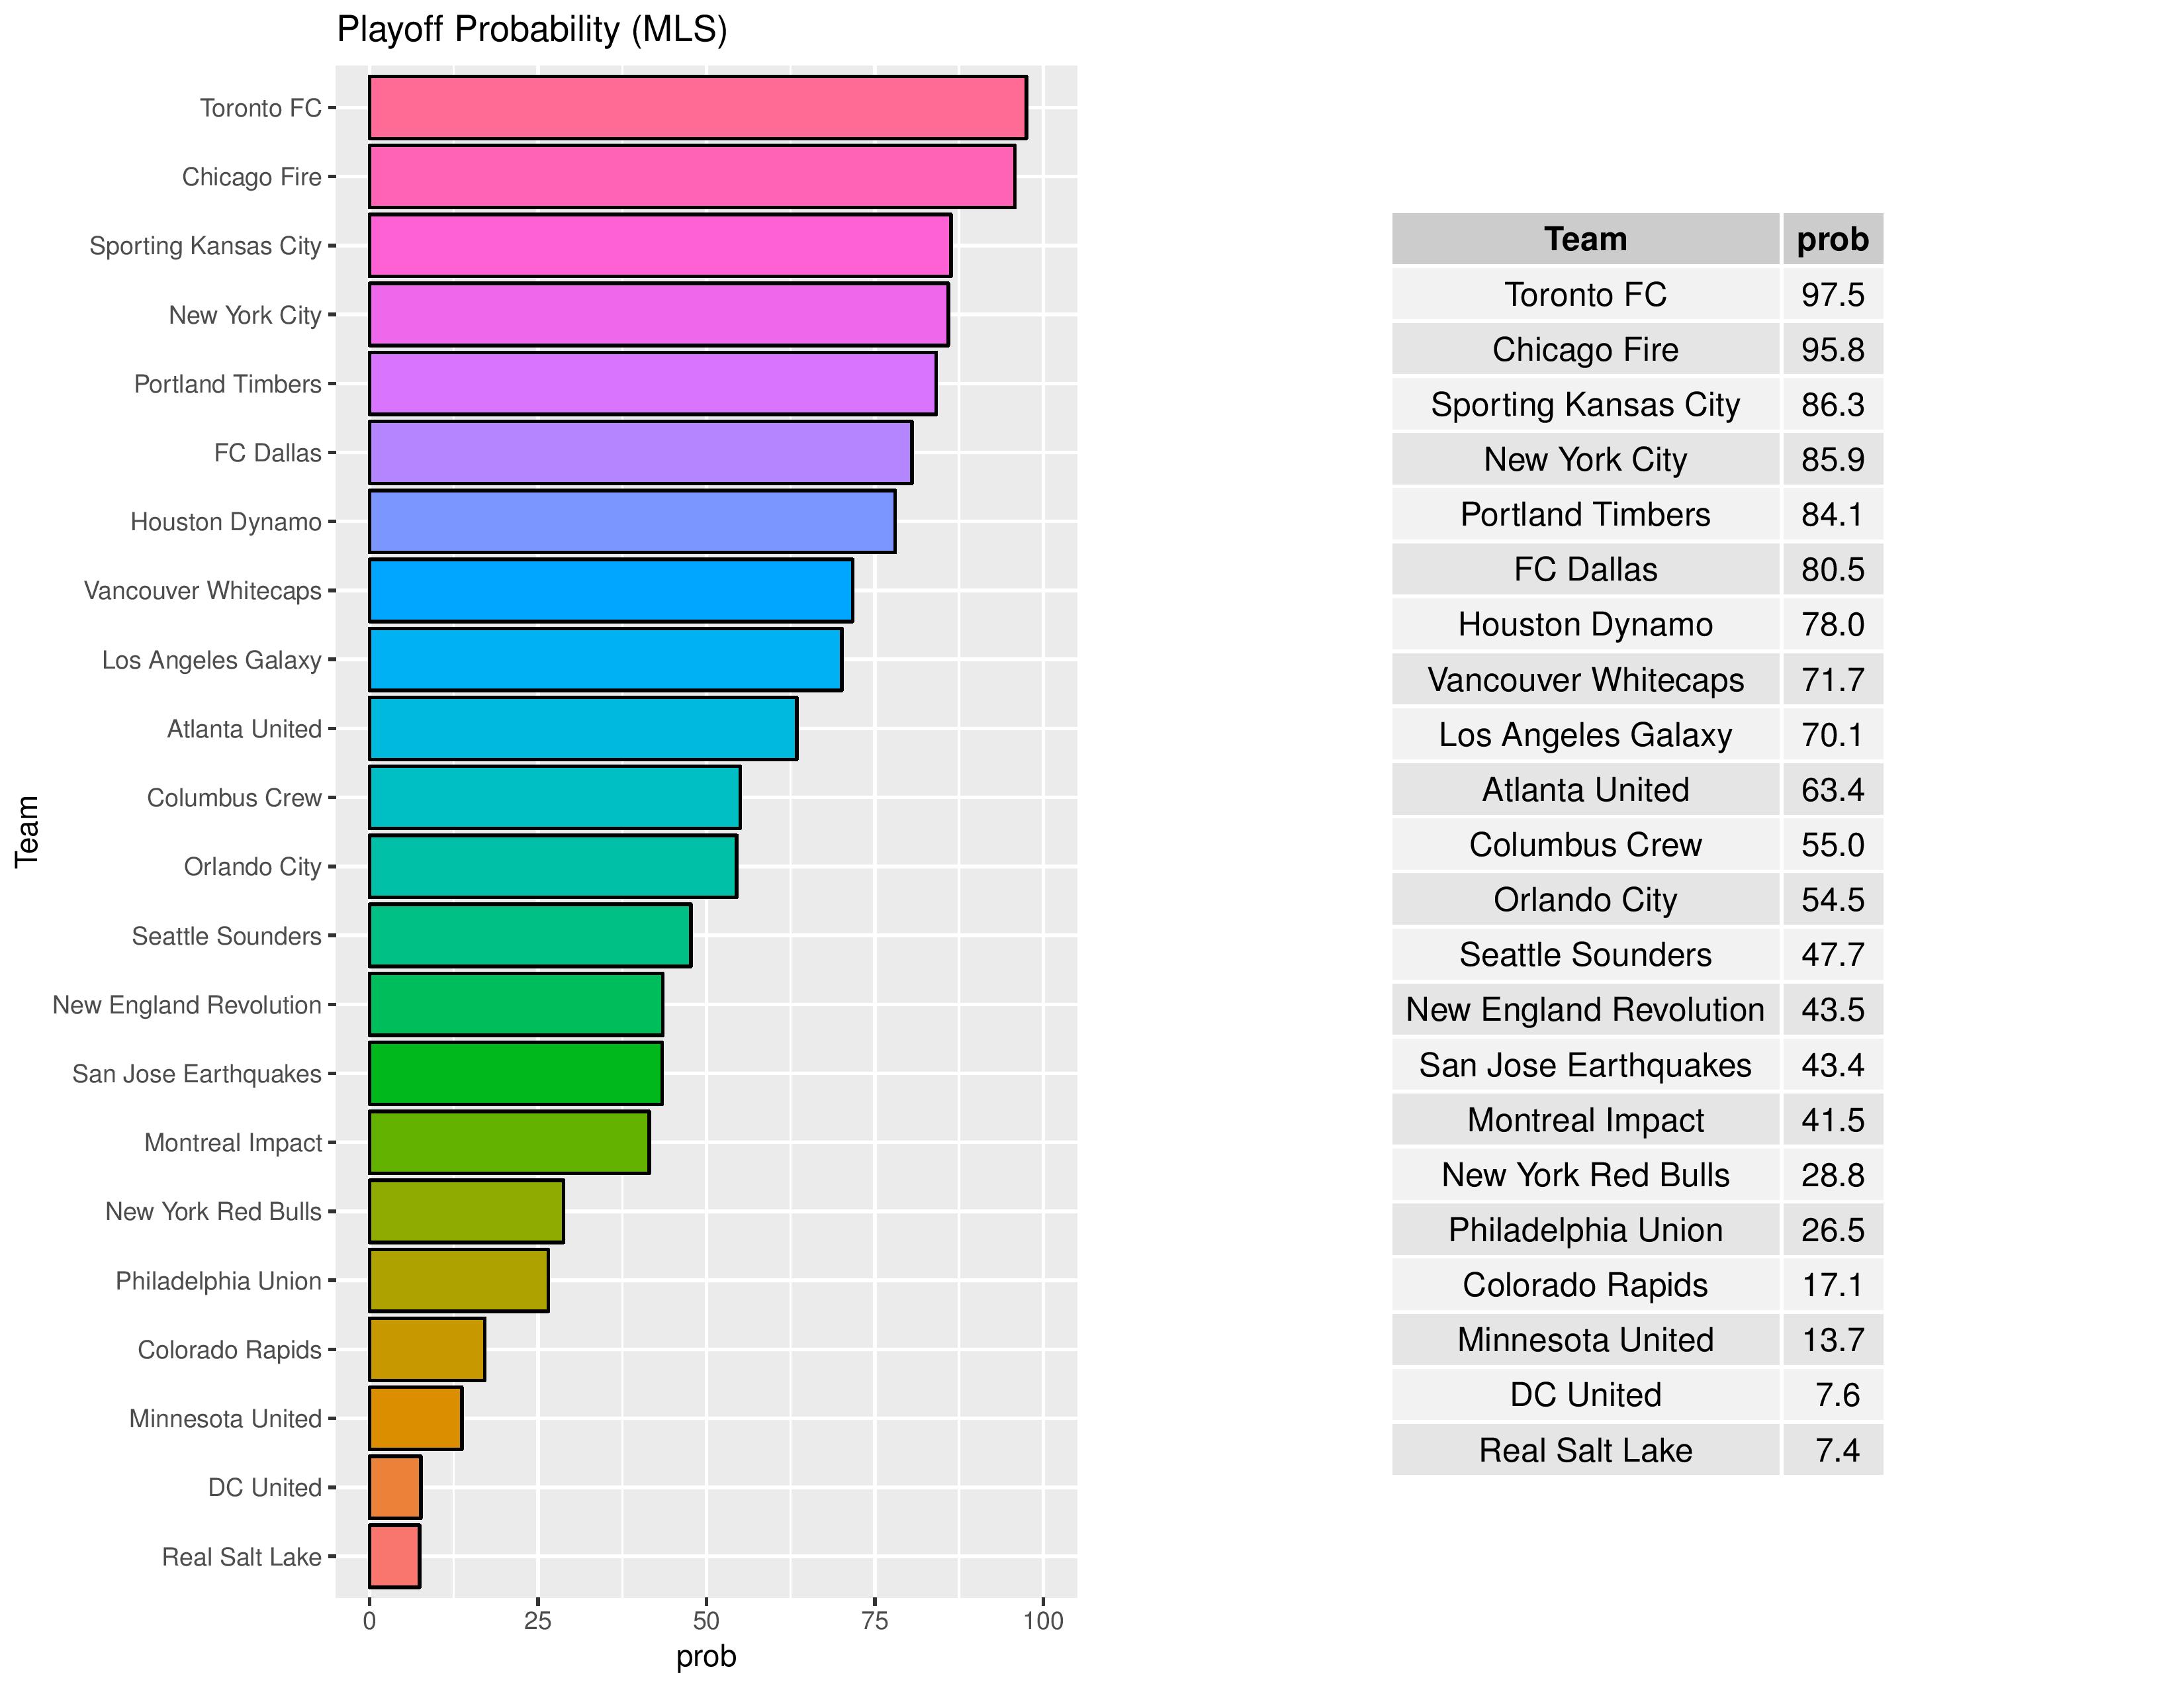
Playoffs probability and more
Philadelphia’s playoffs odds have decreased from 27.8% to 26.5%.
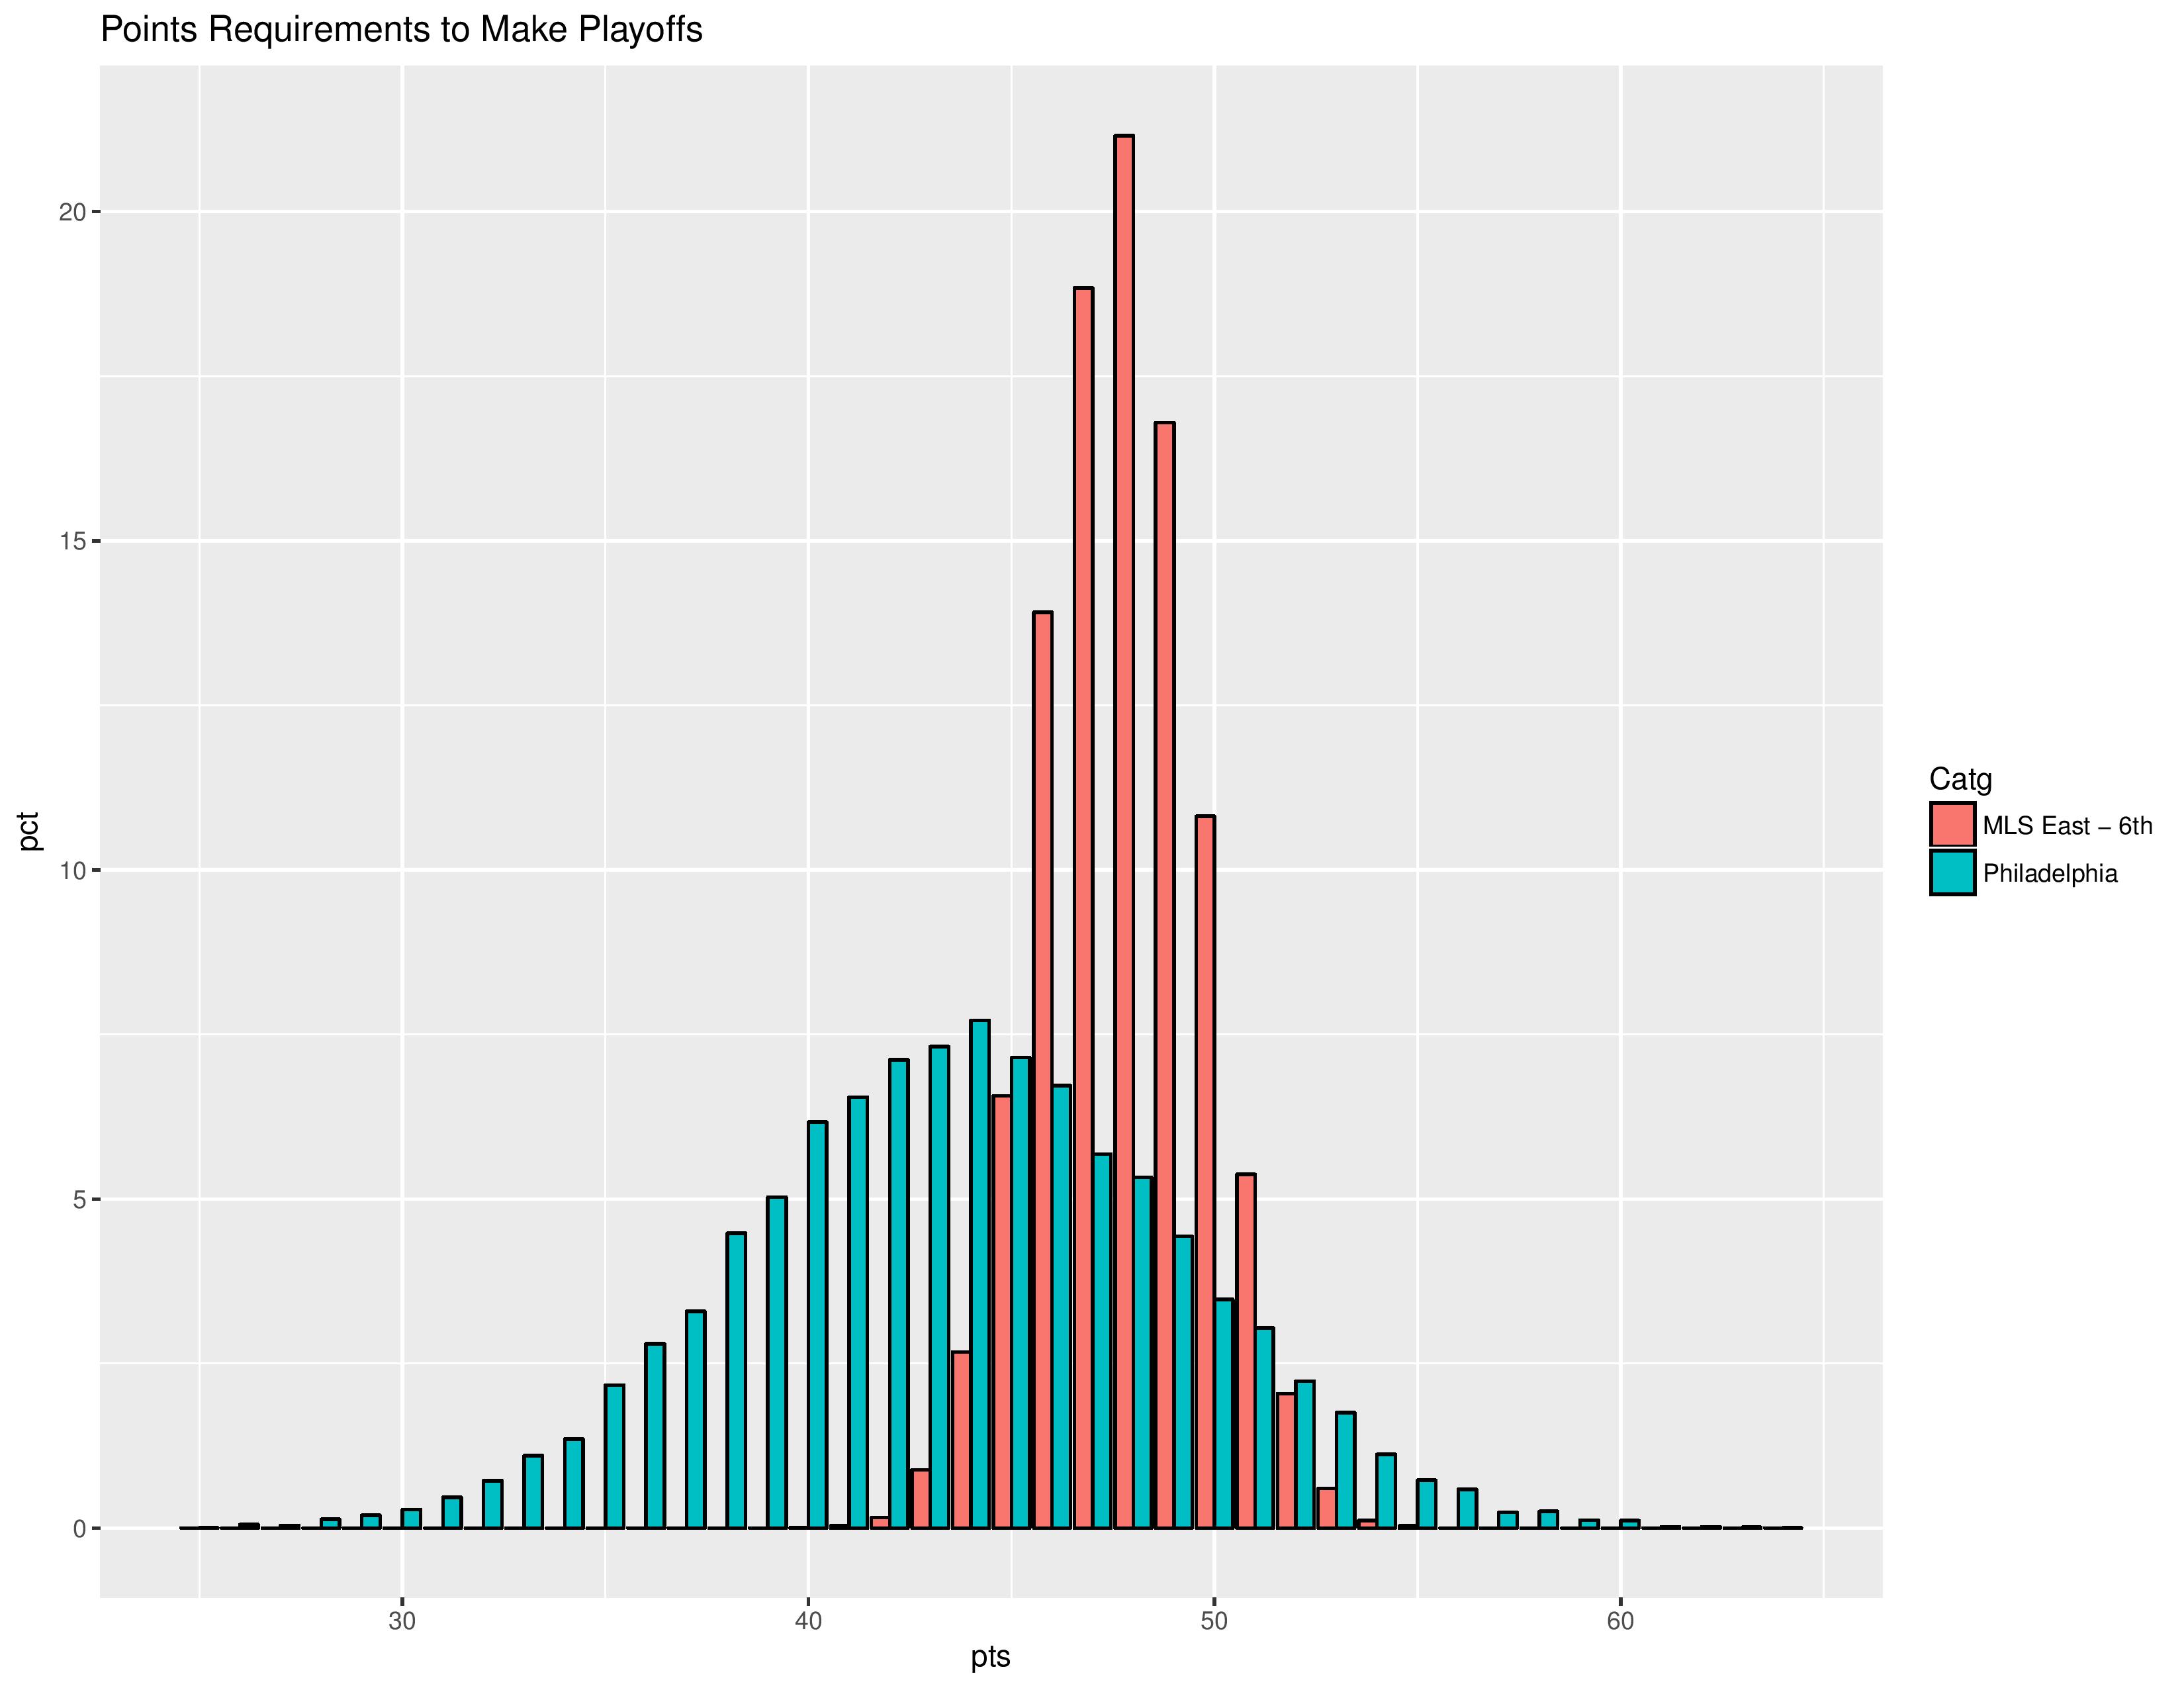
The following shows the simulation distribution for the points earned by the sixth place MLS East club, joined with the simulation distribution of points that Philadelphia is expected to earn.
Tiebreakers aside, the Union make the playoffs when >= this MLS-East-6th value.
The most common number of points required to make the playoffs in the 6th slot is 48. The most common number of points simulated for the Union is 44.
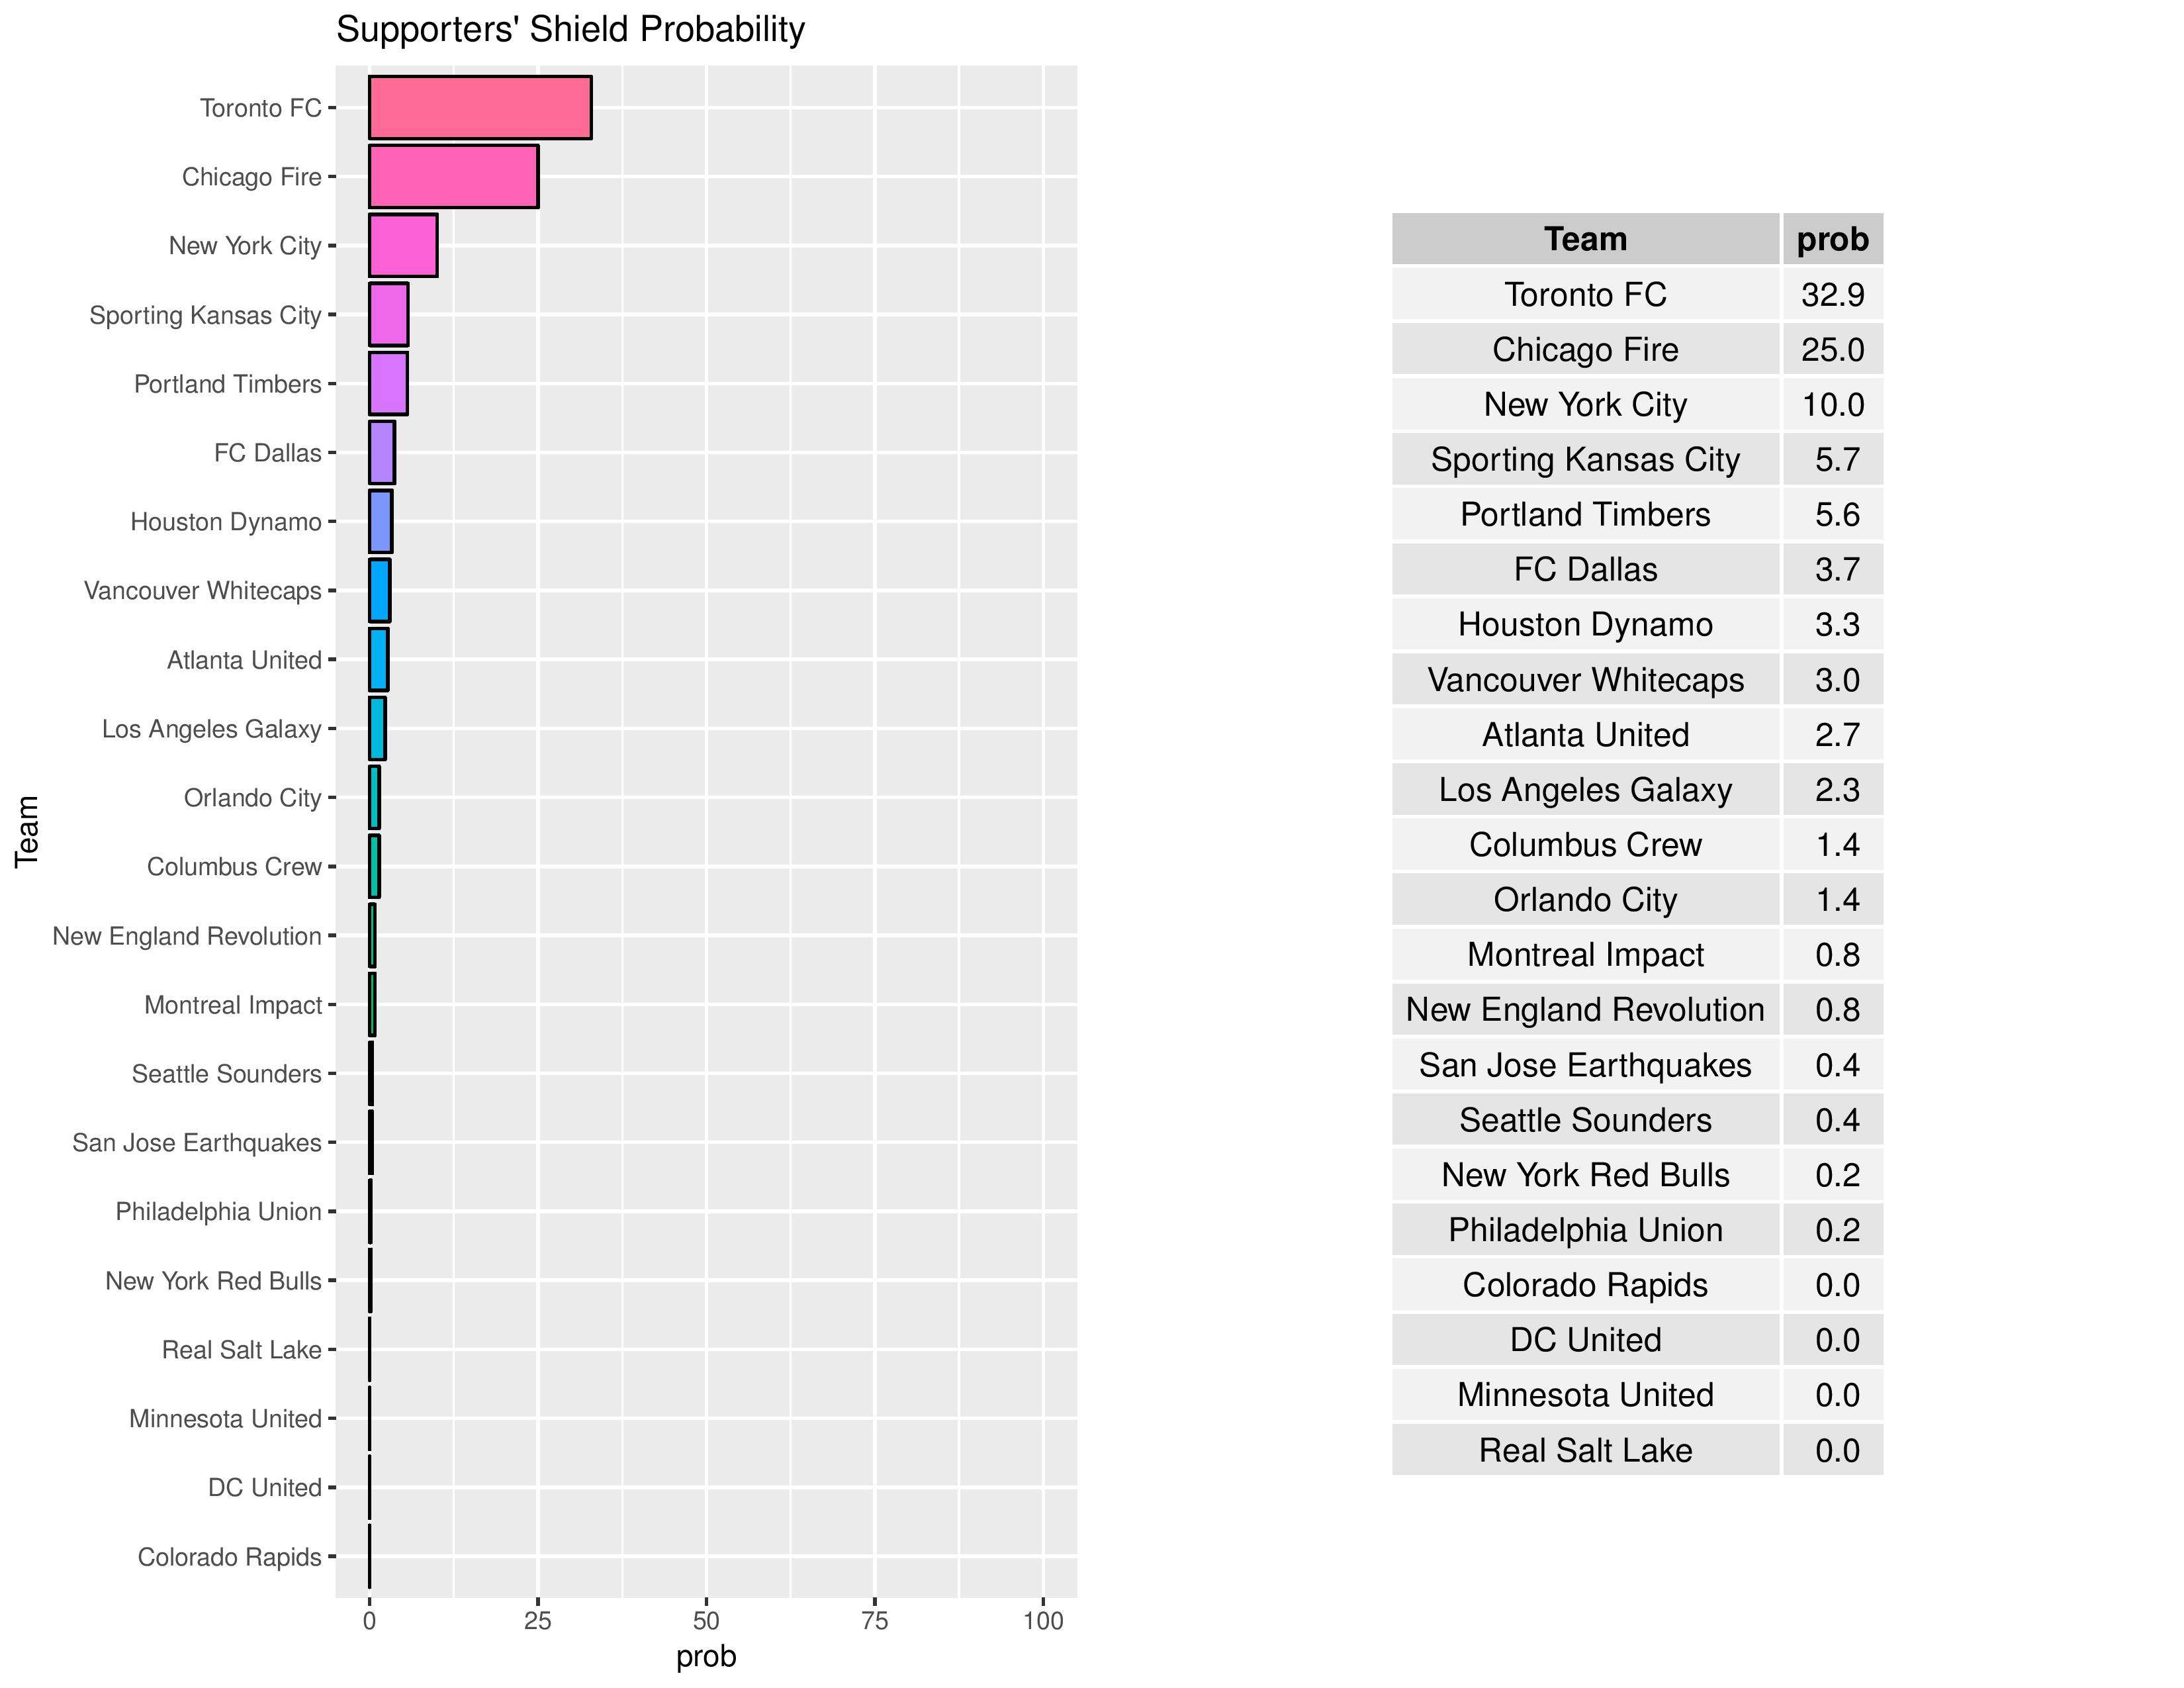
Philadelphia’s odds to win the Supporters’ Shield remain at 0.2%.
In part, clubs that score a lot of goals are given an advantage in MLS Cup due to the two leg aggregate goal format of the conference semi-finals and conference finals. This gives those clubs a better chance at banking large victories which carry over.
The Union’s chances of winning the MLS Cup have decreased from 1.4% to 1.2%.

*Note: The simulations were run prior to yesterday’s USOC matches
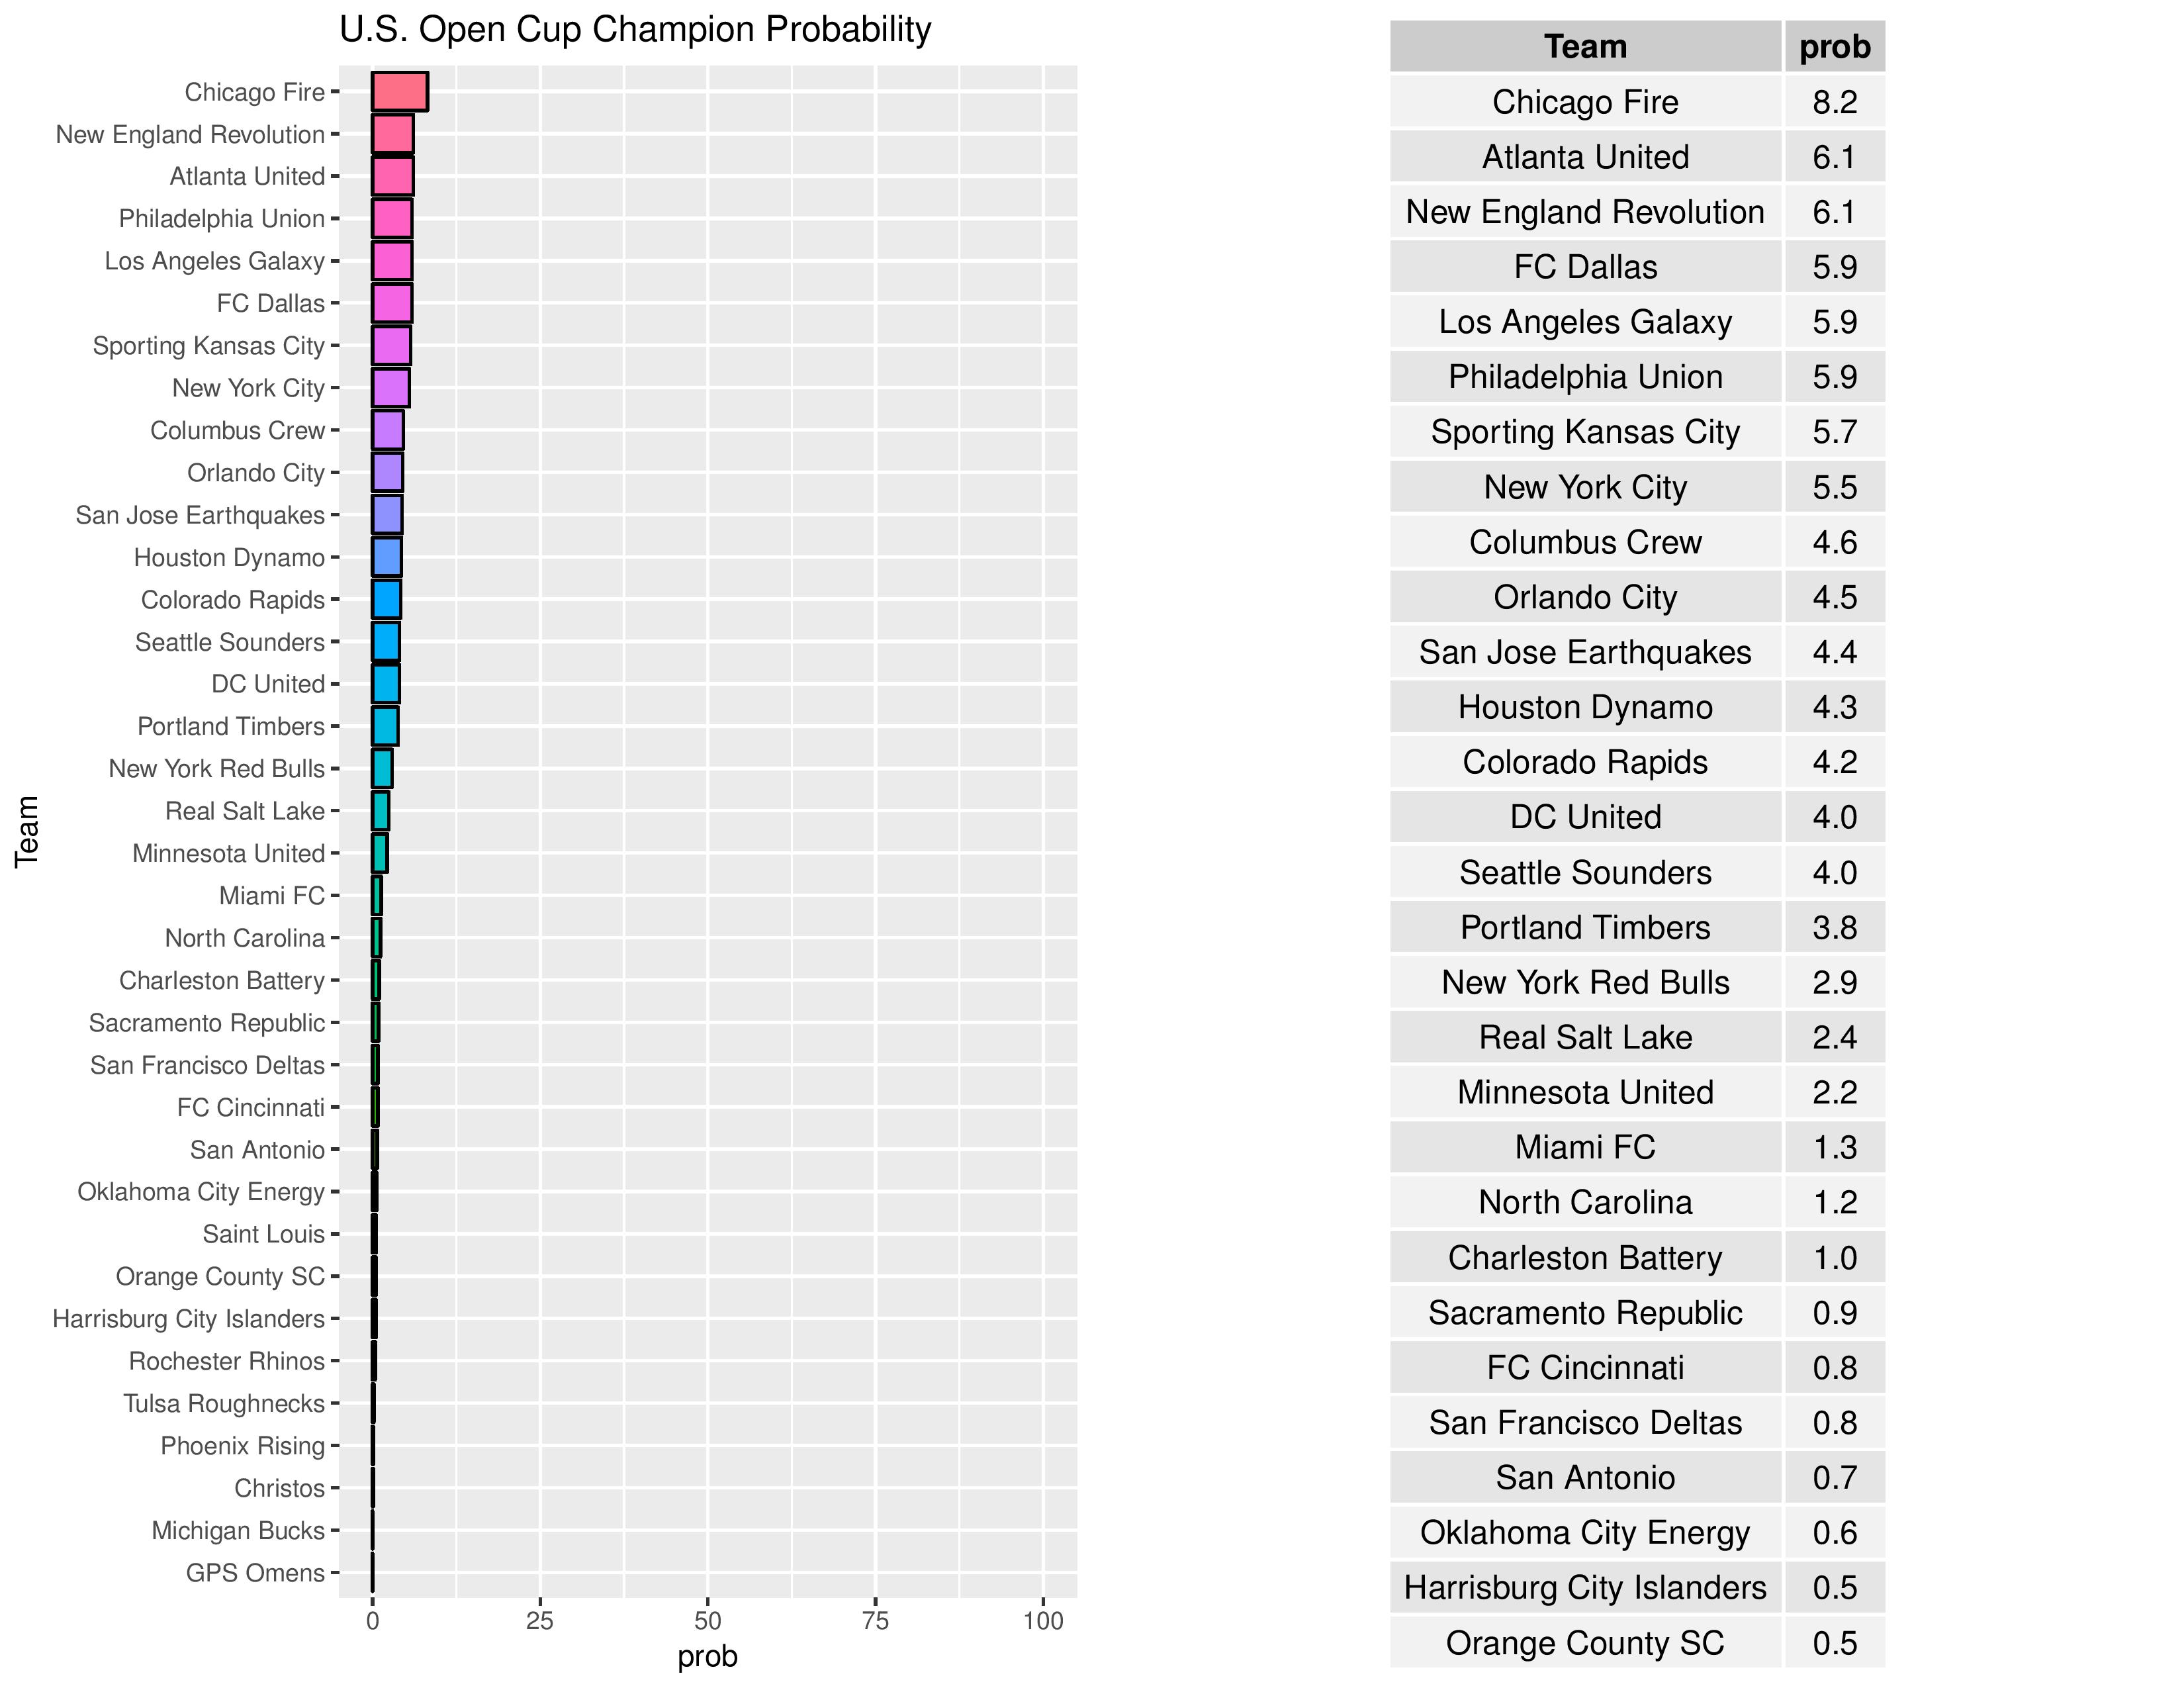
In the U.S. Open Cup, poor teams with a higher propensity to earn a draw are given an advantage, as they are more likely to reach penalty kicks which are a complete toss-up. Conversely, good teams with a higher propensity to earn a draw have a disadvantage for the same reason.
In the fourth round, Philadelphia will host the Harrisburg City Islanders today.
Philadelphia’s odds of winning the U.S. Open Cup have increased from 5.7% to 5.9%.
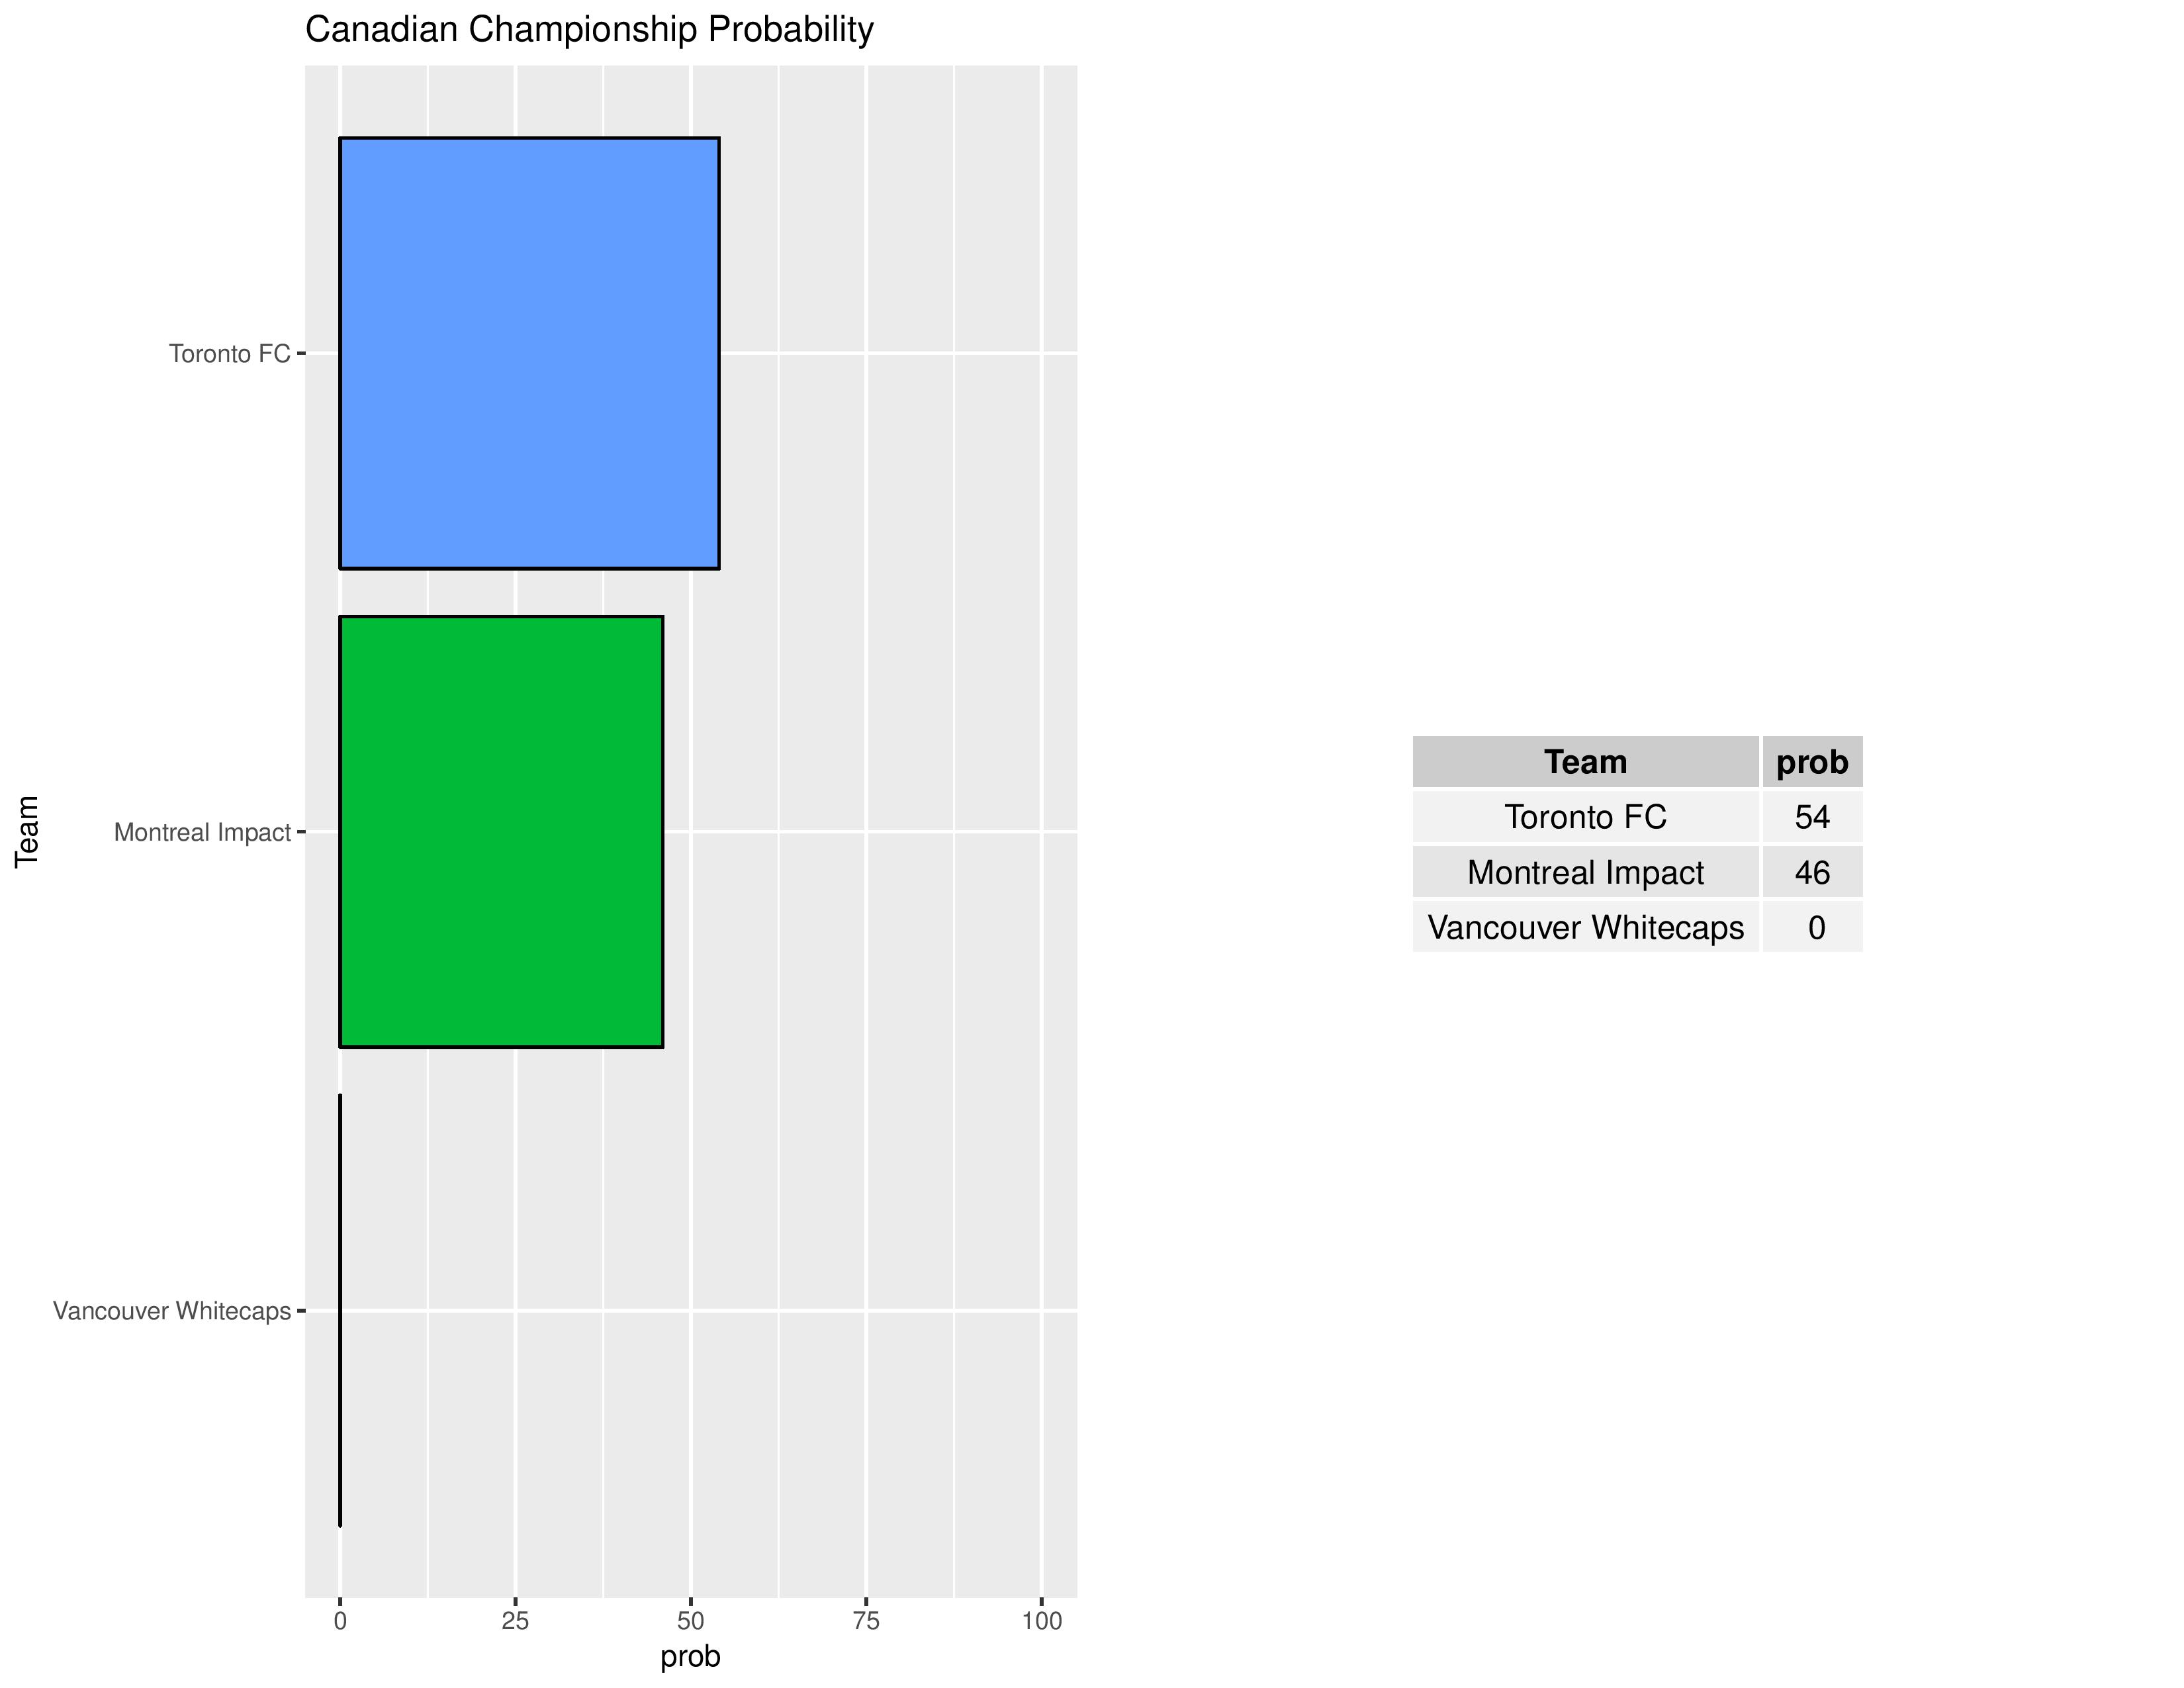
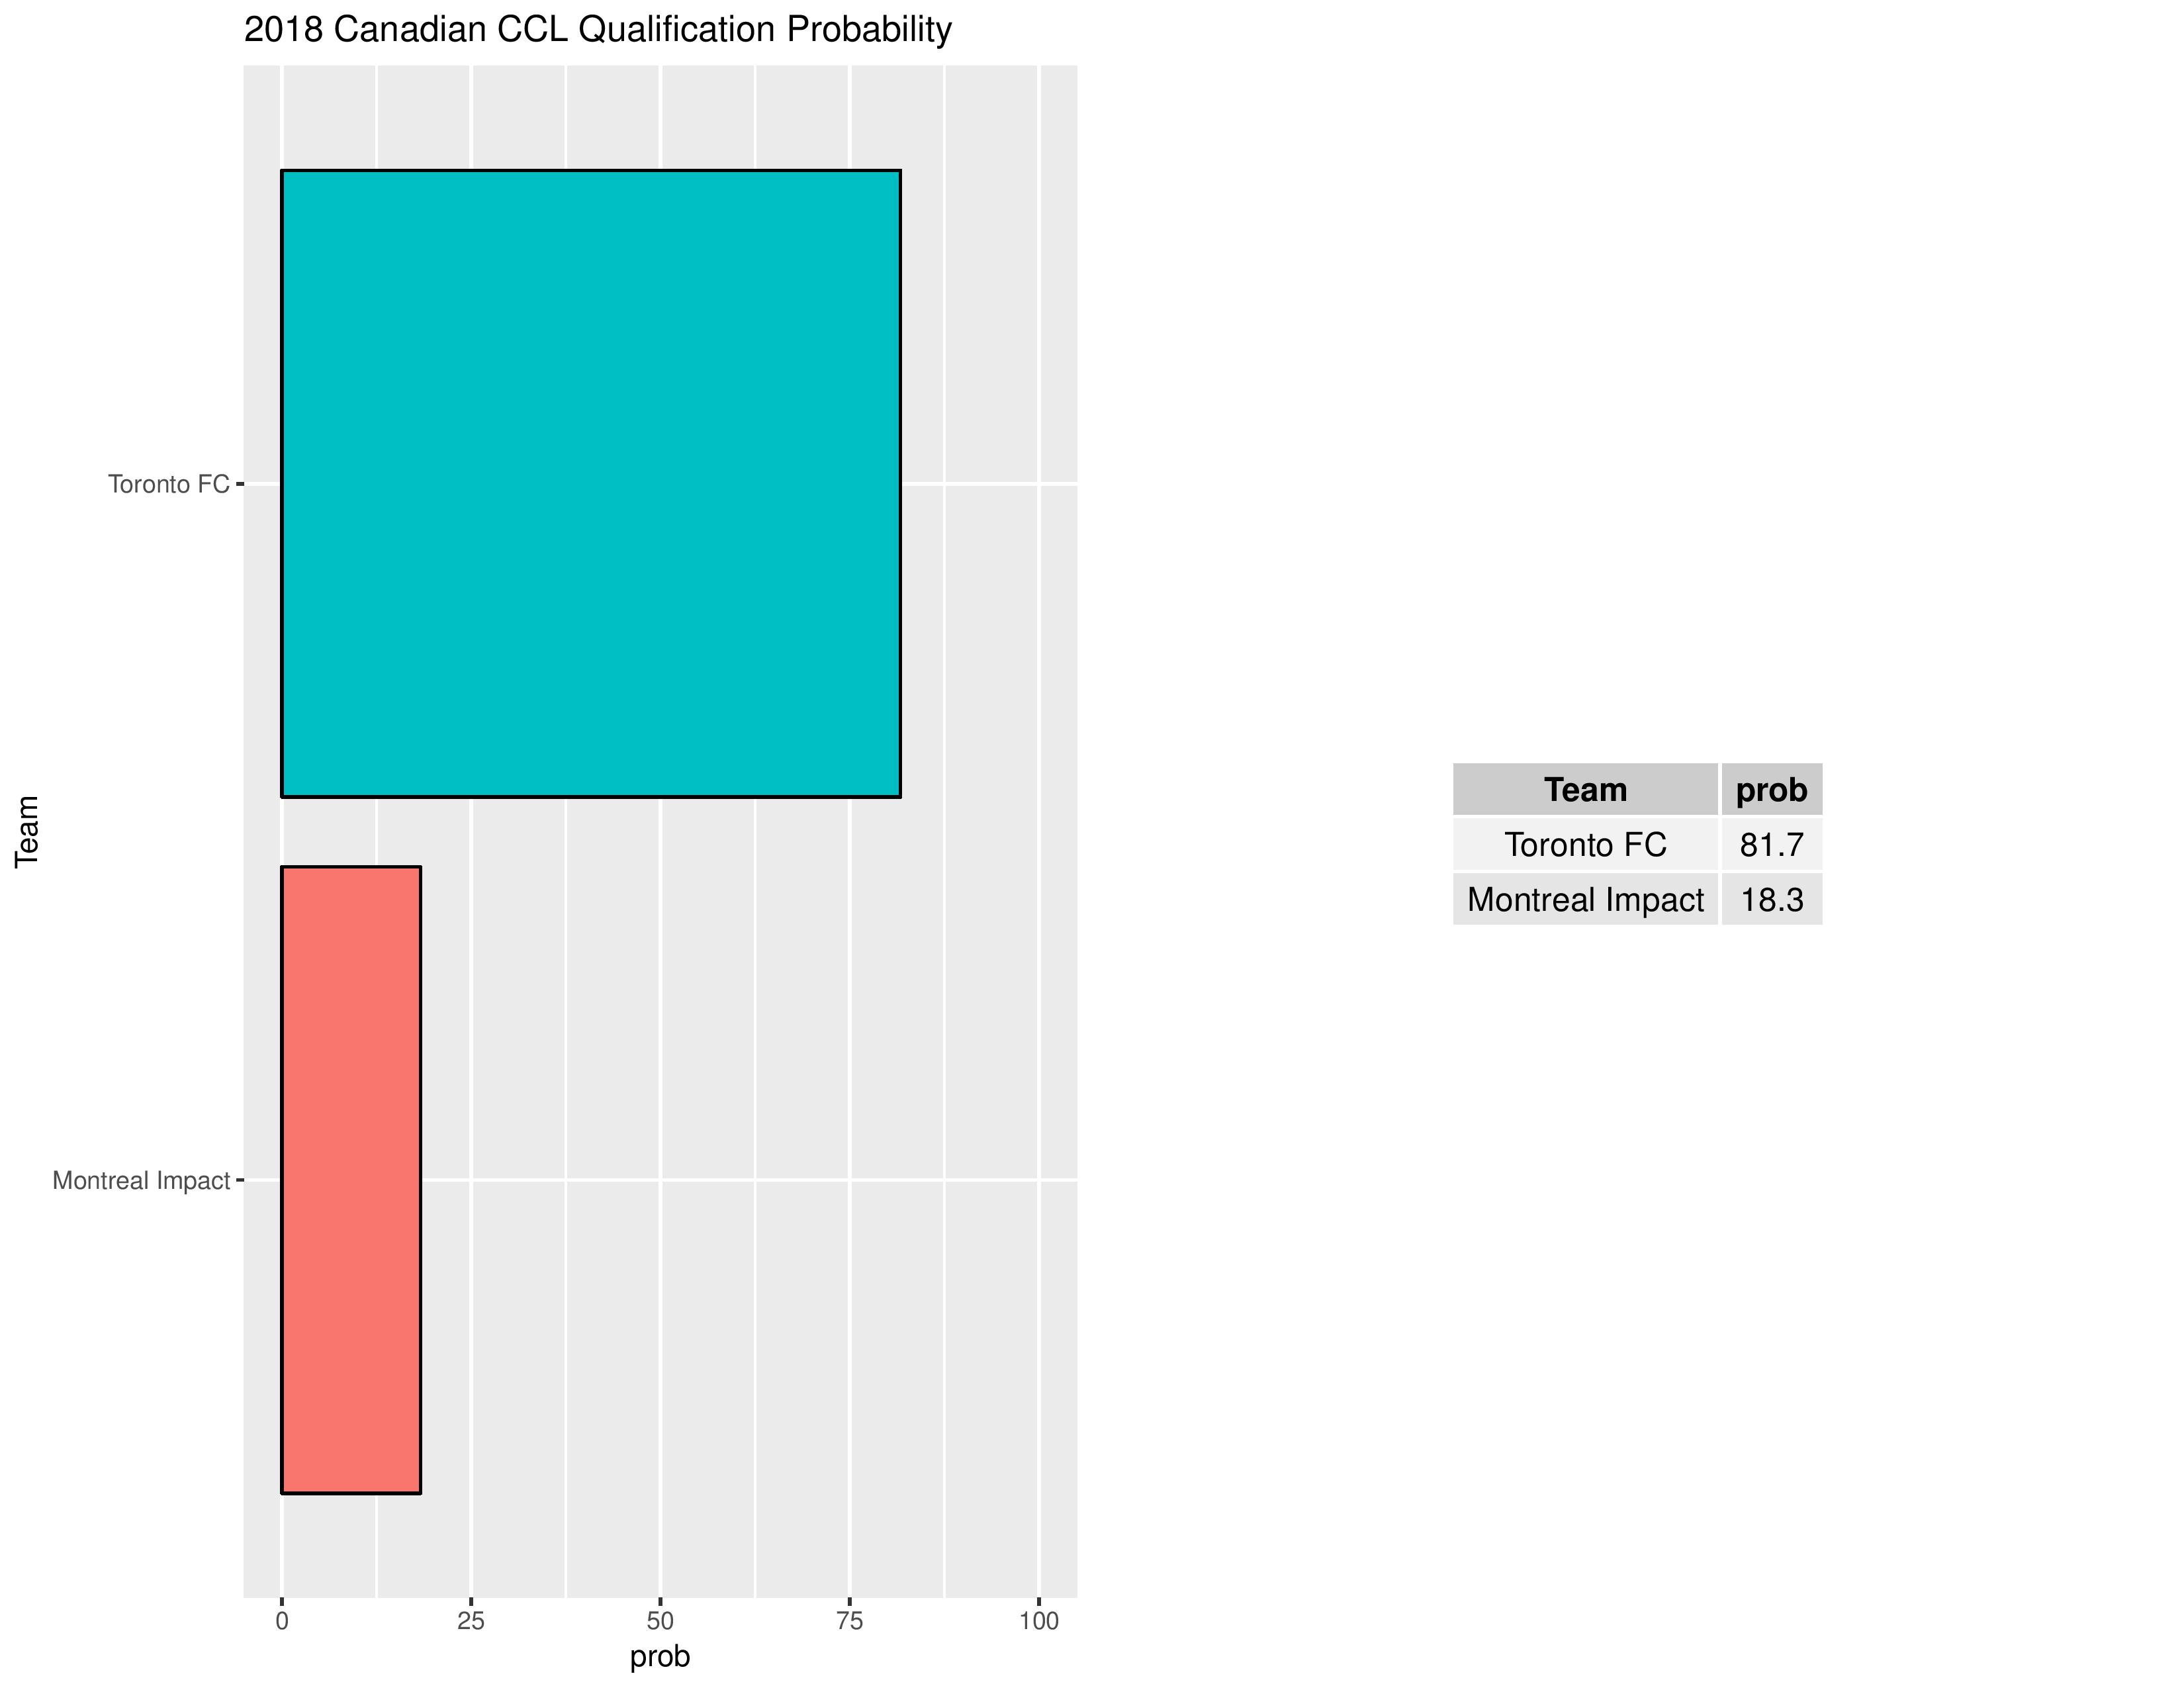
The chances of Canadian teams qualifying for the 2018 CCL are as follows (USA teams remain set as qualified last year):
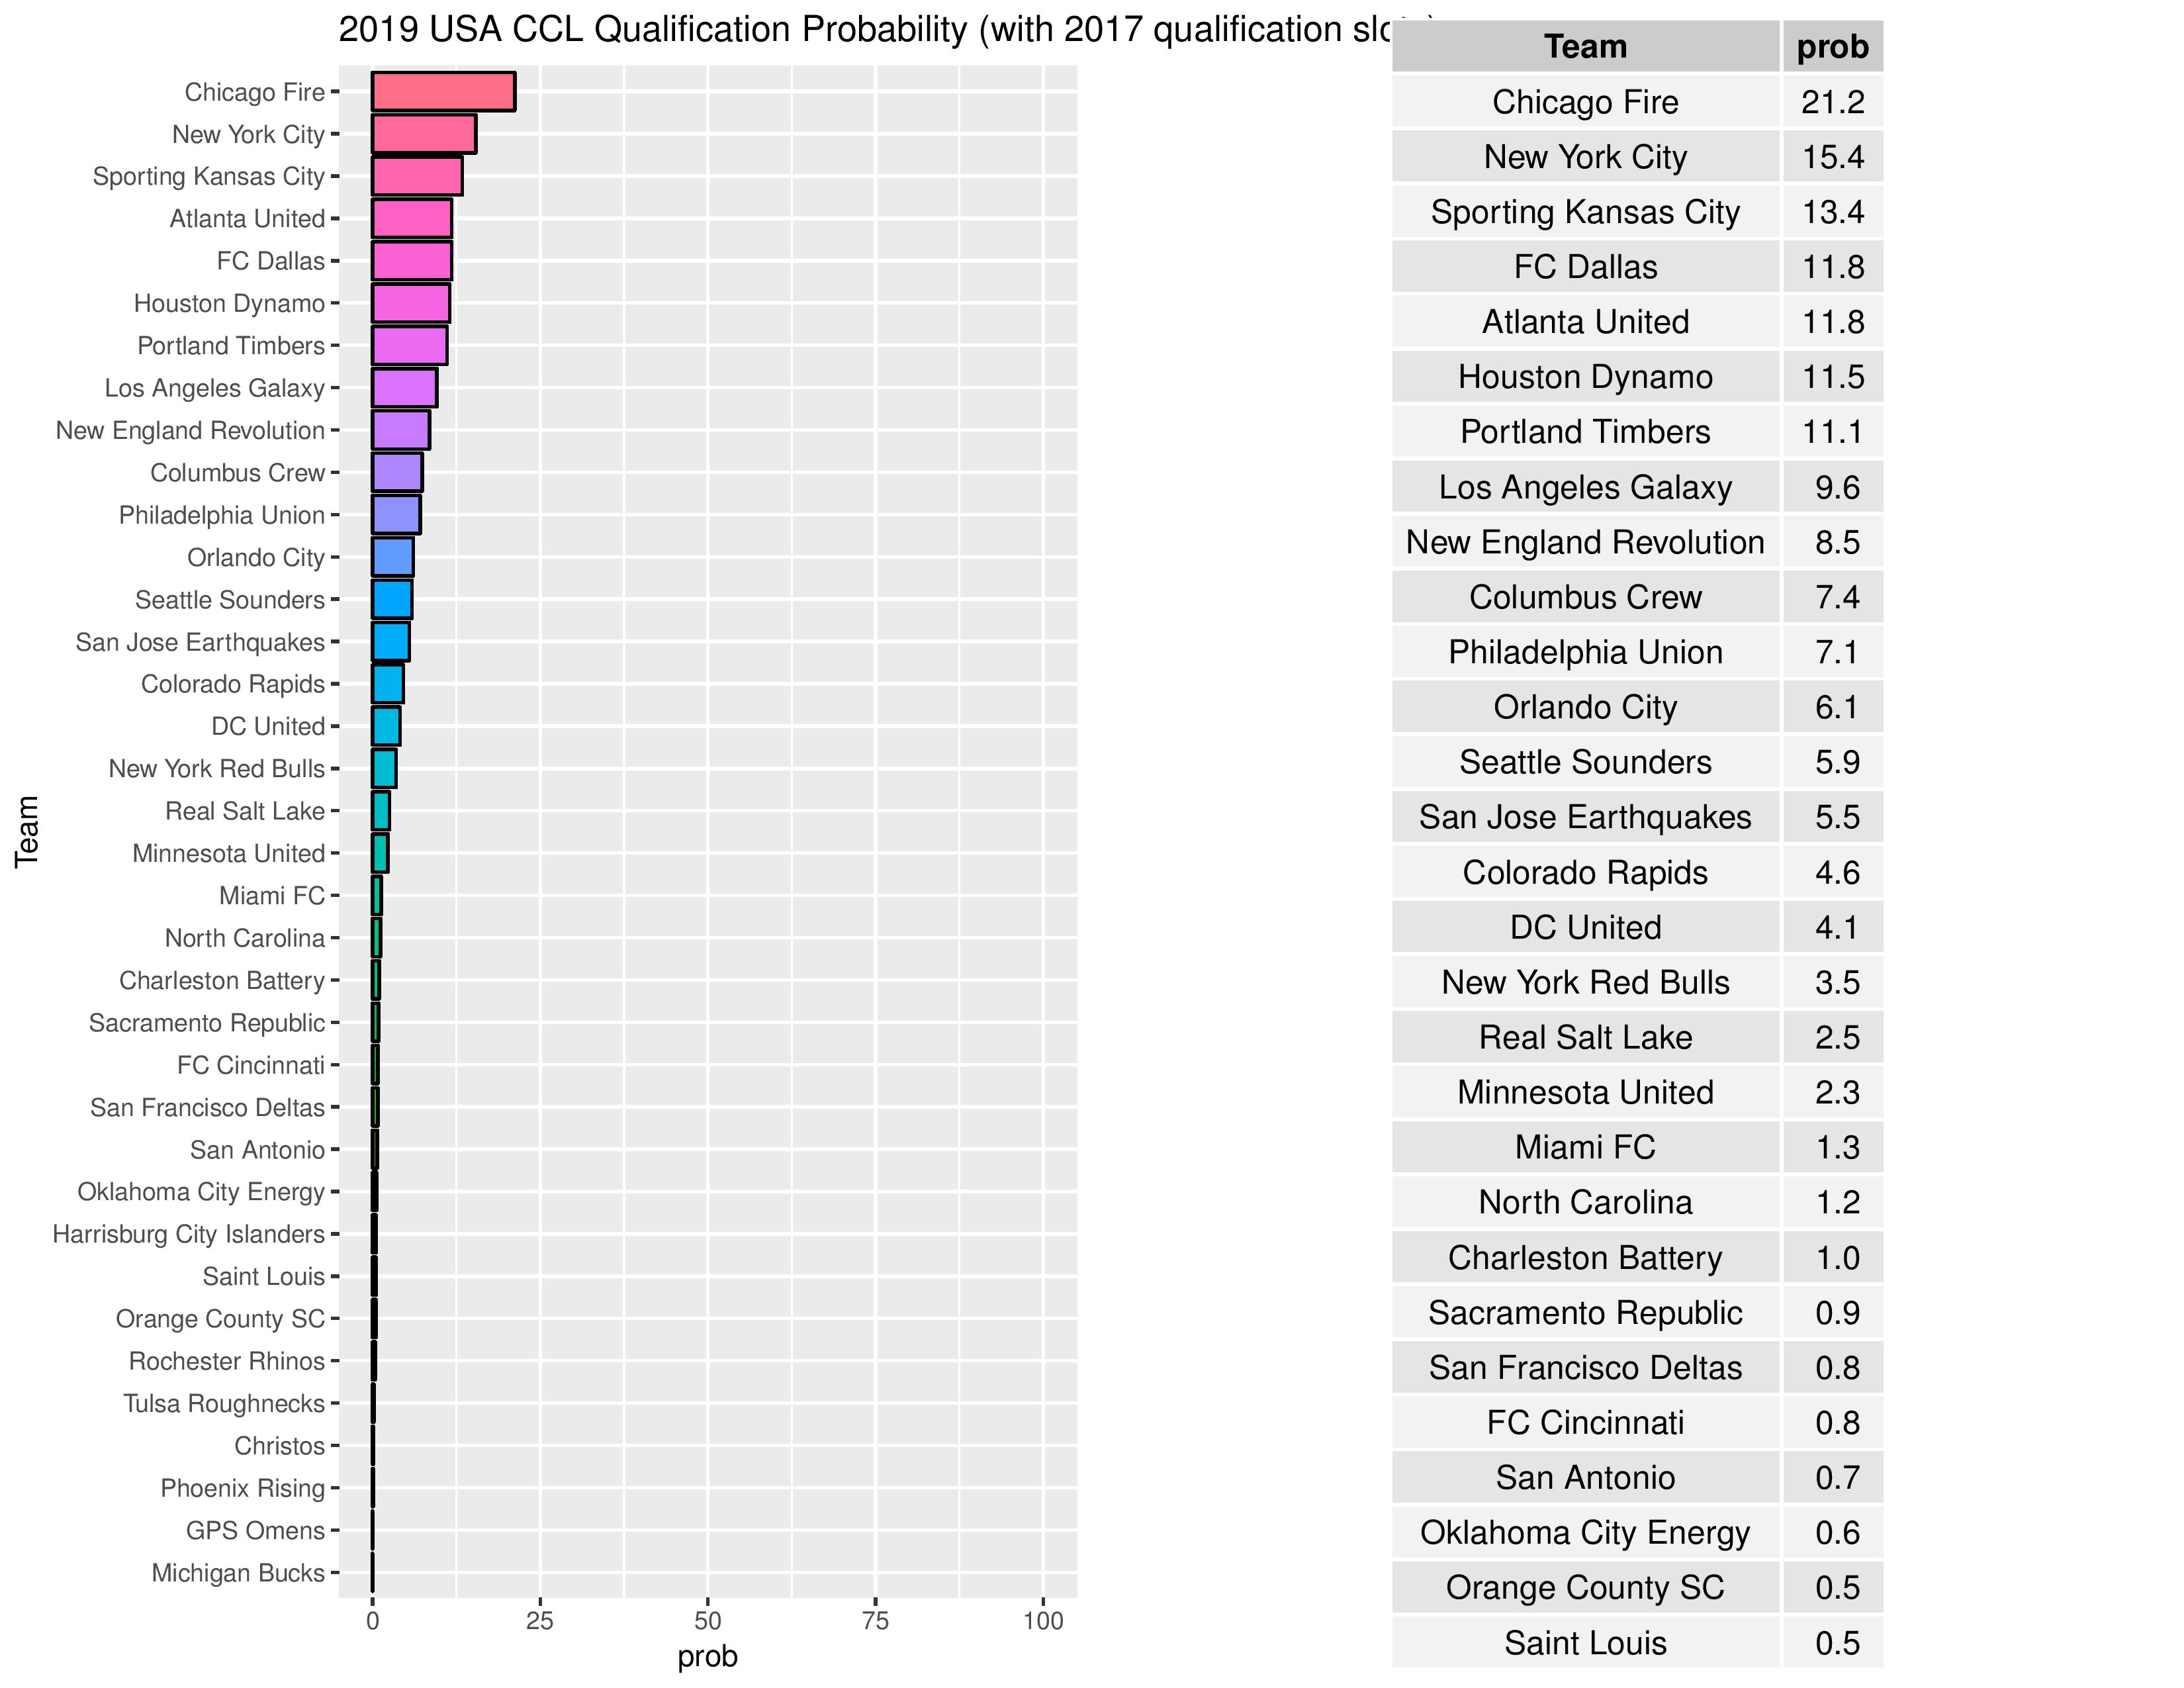
Philadelphia’s chances for qualifying in 2017 for the 2019 edition of the CONCACAF Champions League have increased from 7.0% to 7.1%.
Over time, we can see how Philadelphia’s odds for different prizes have changed.
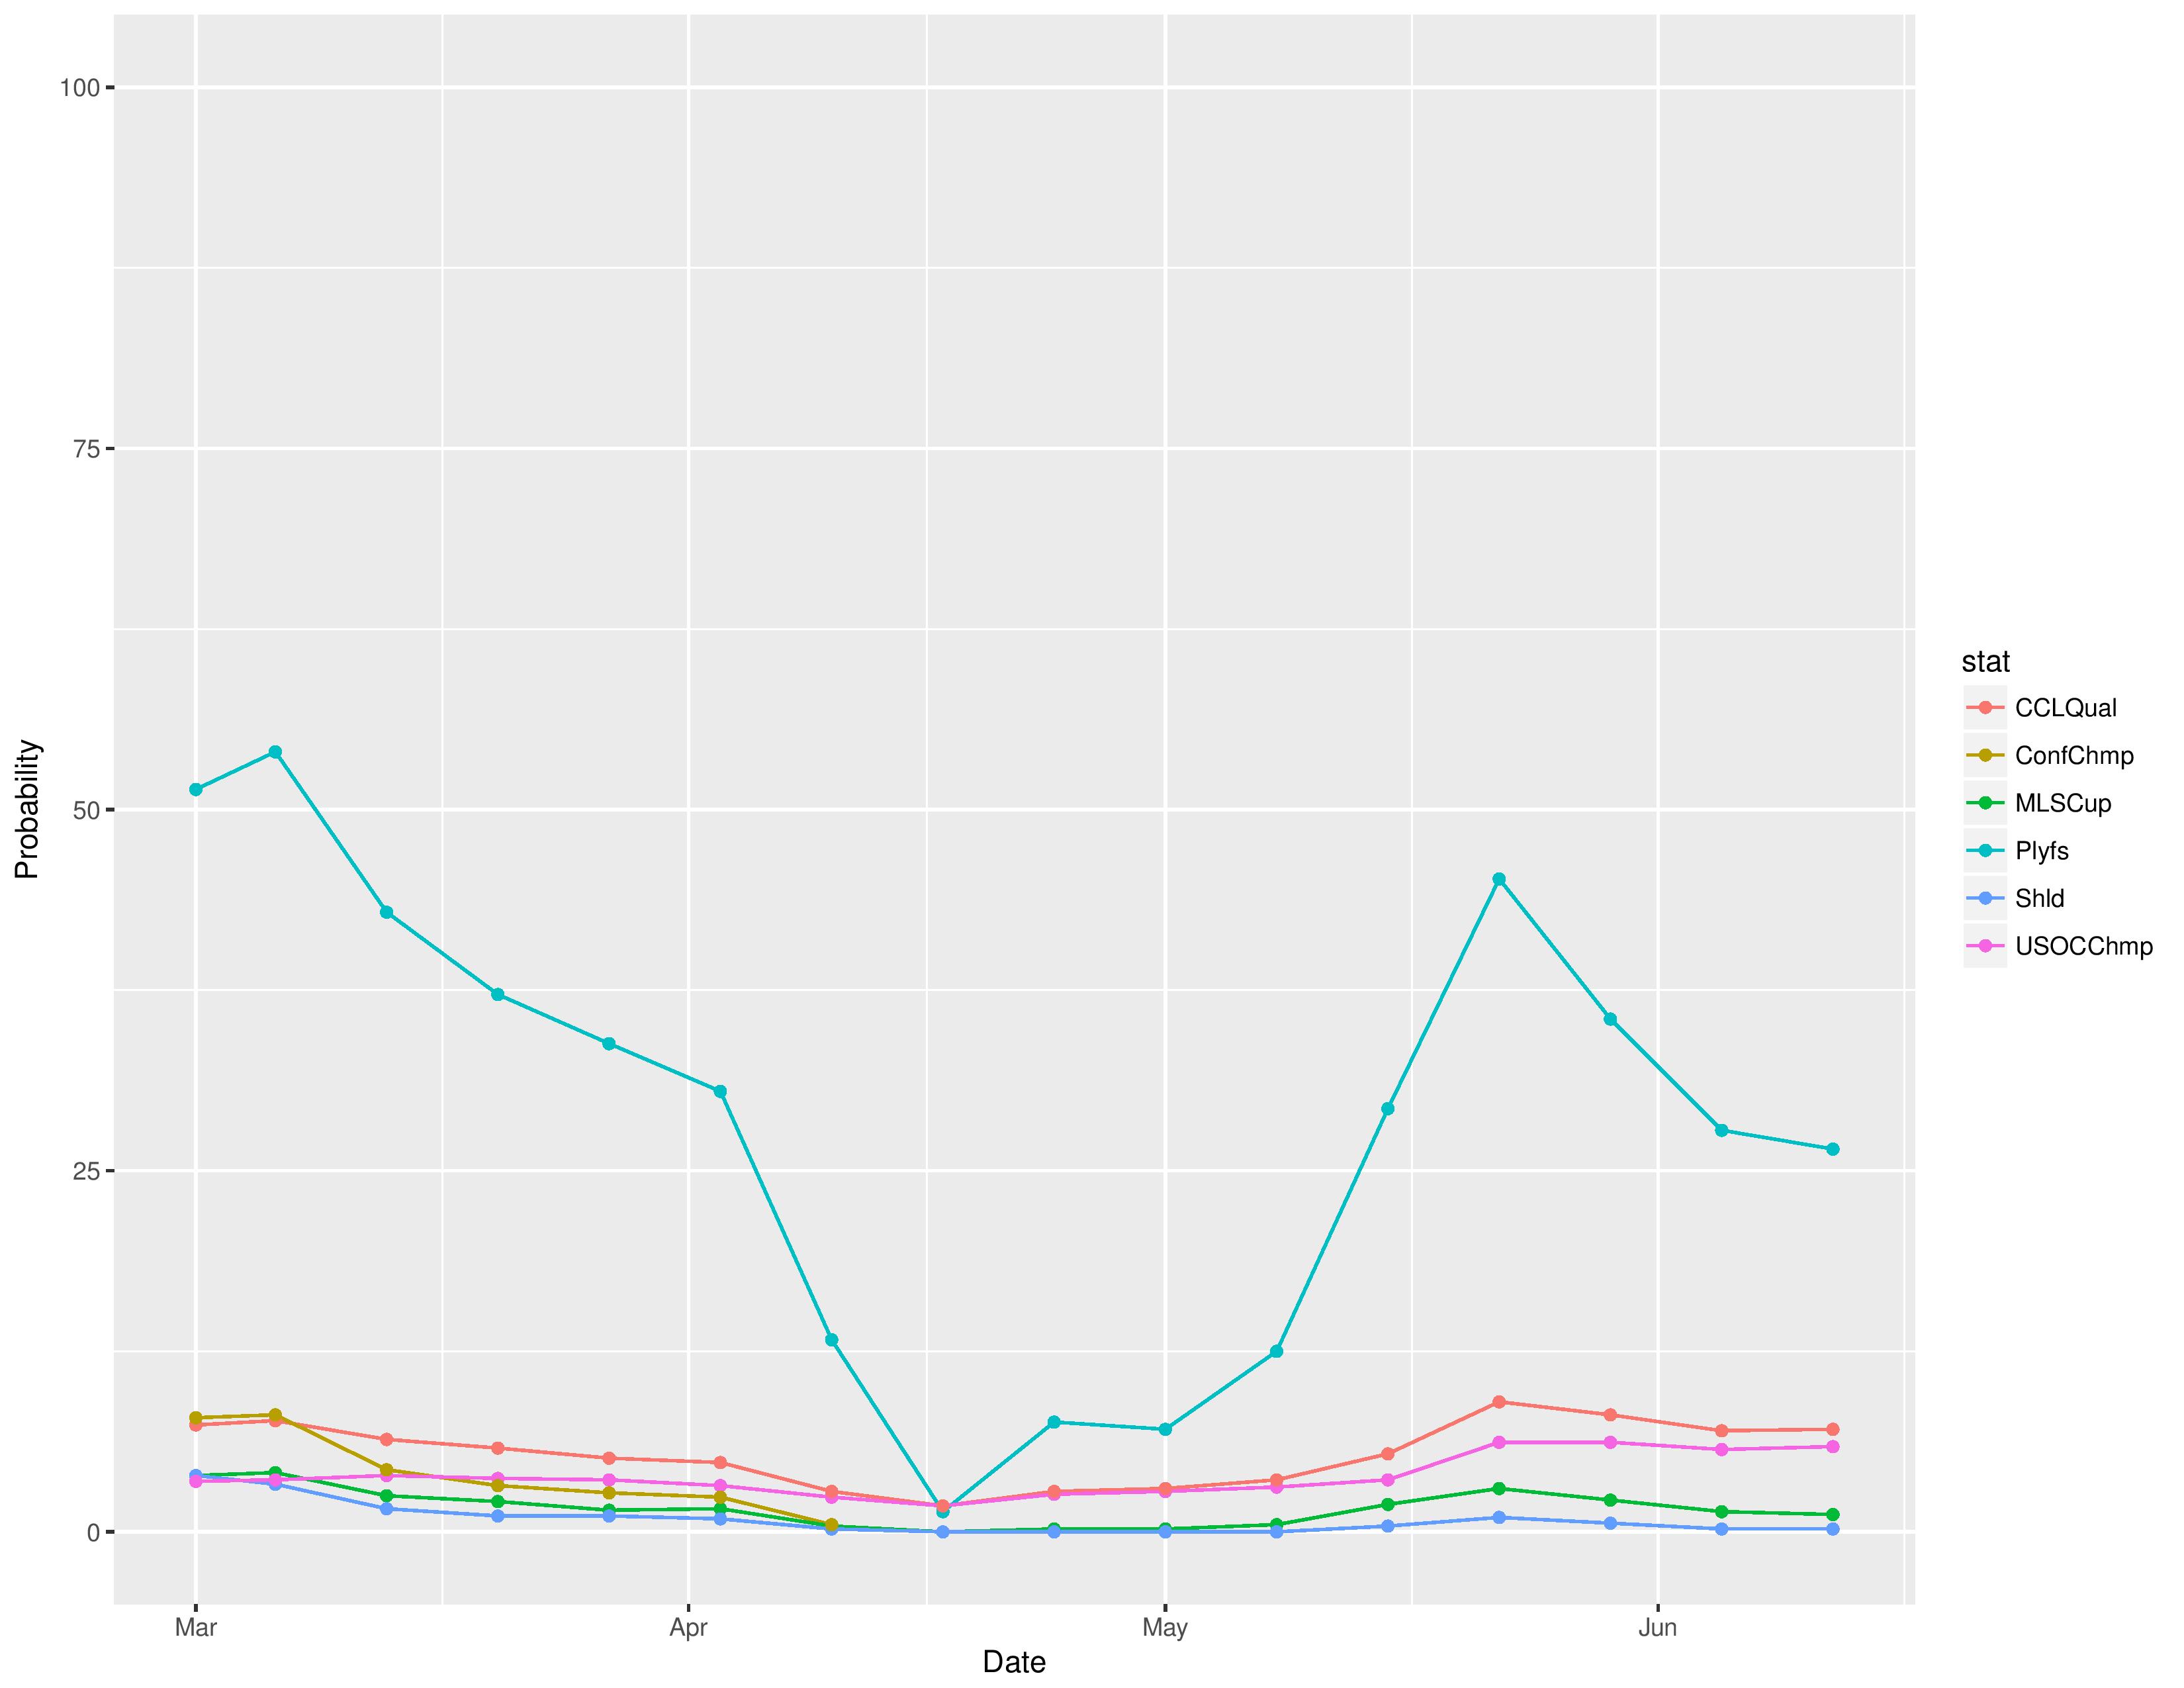
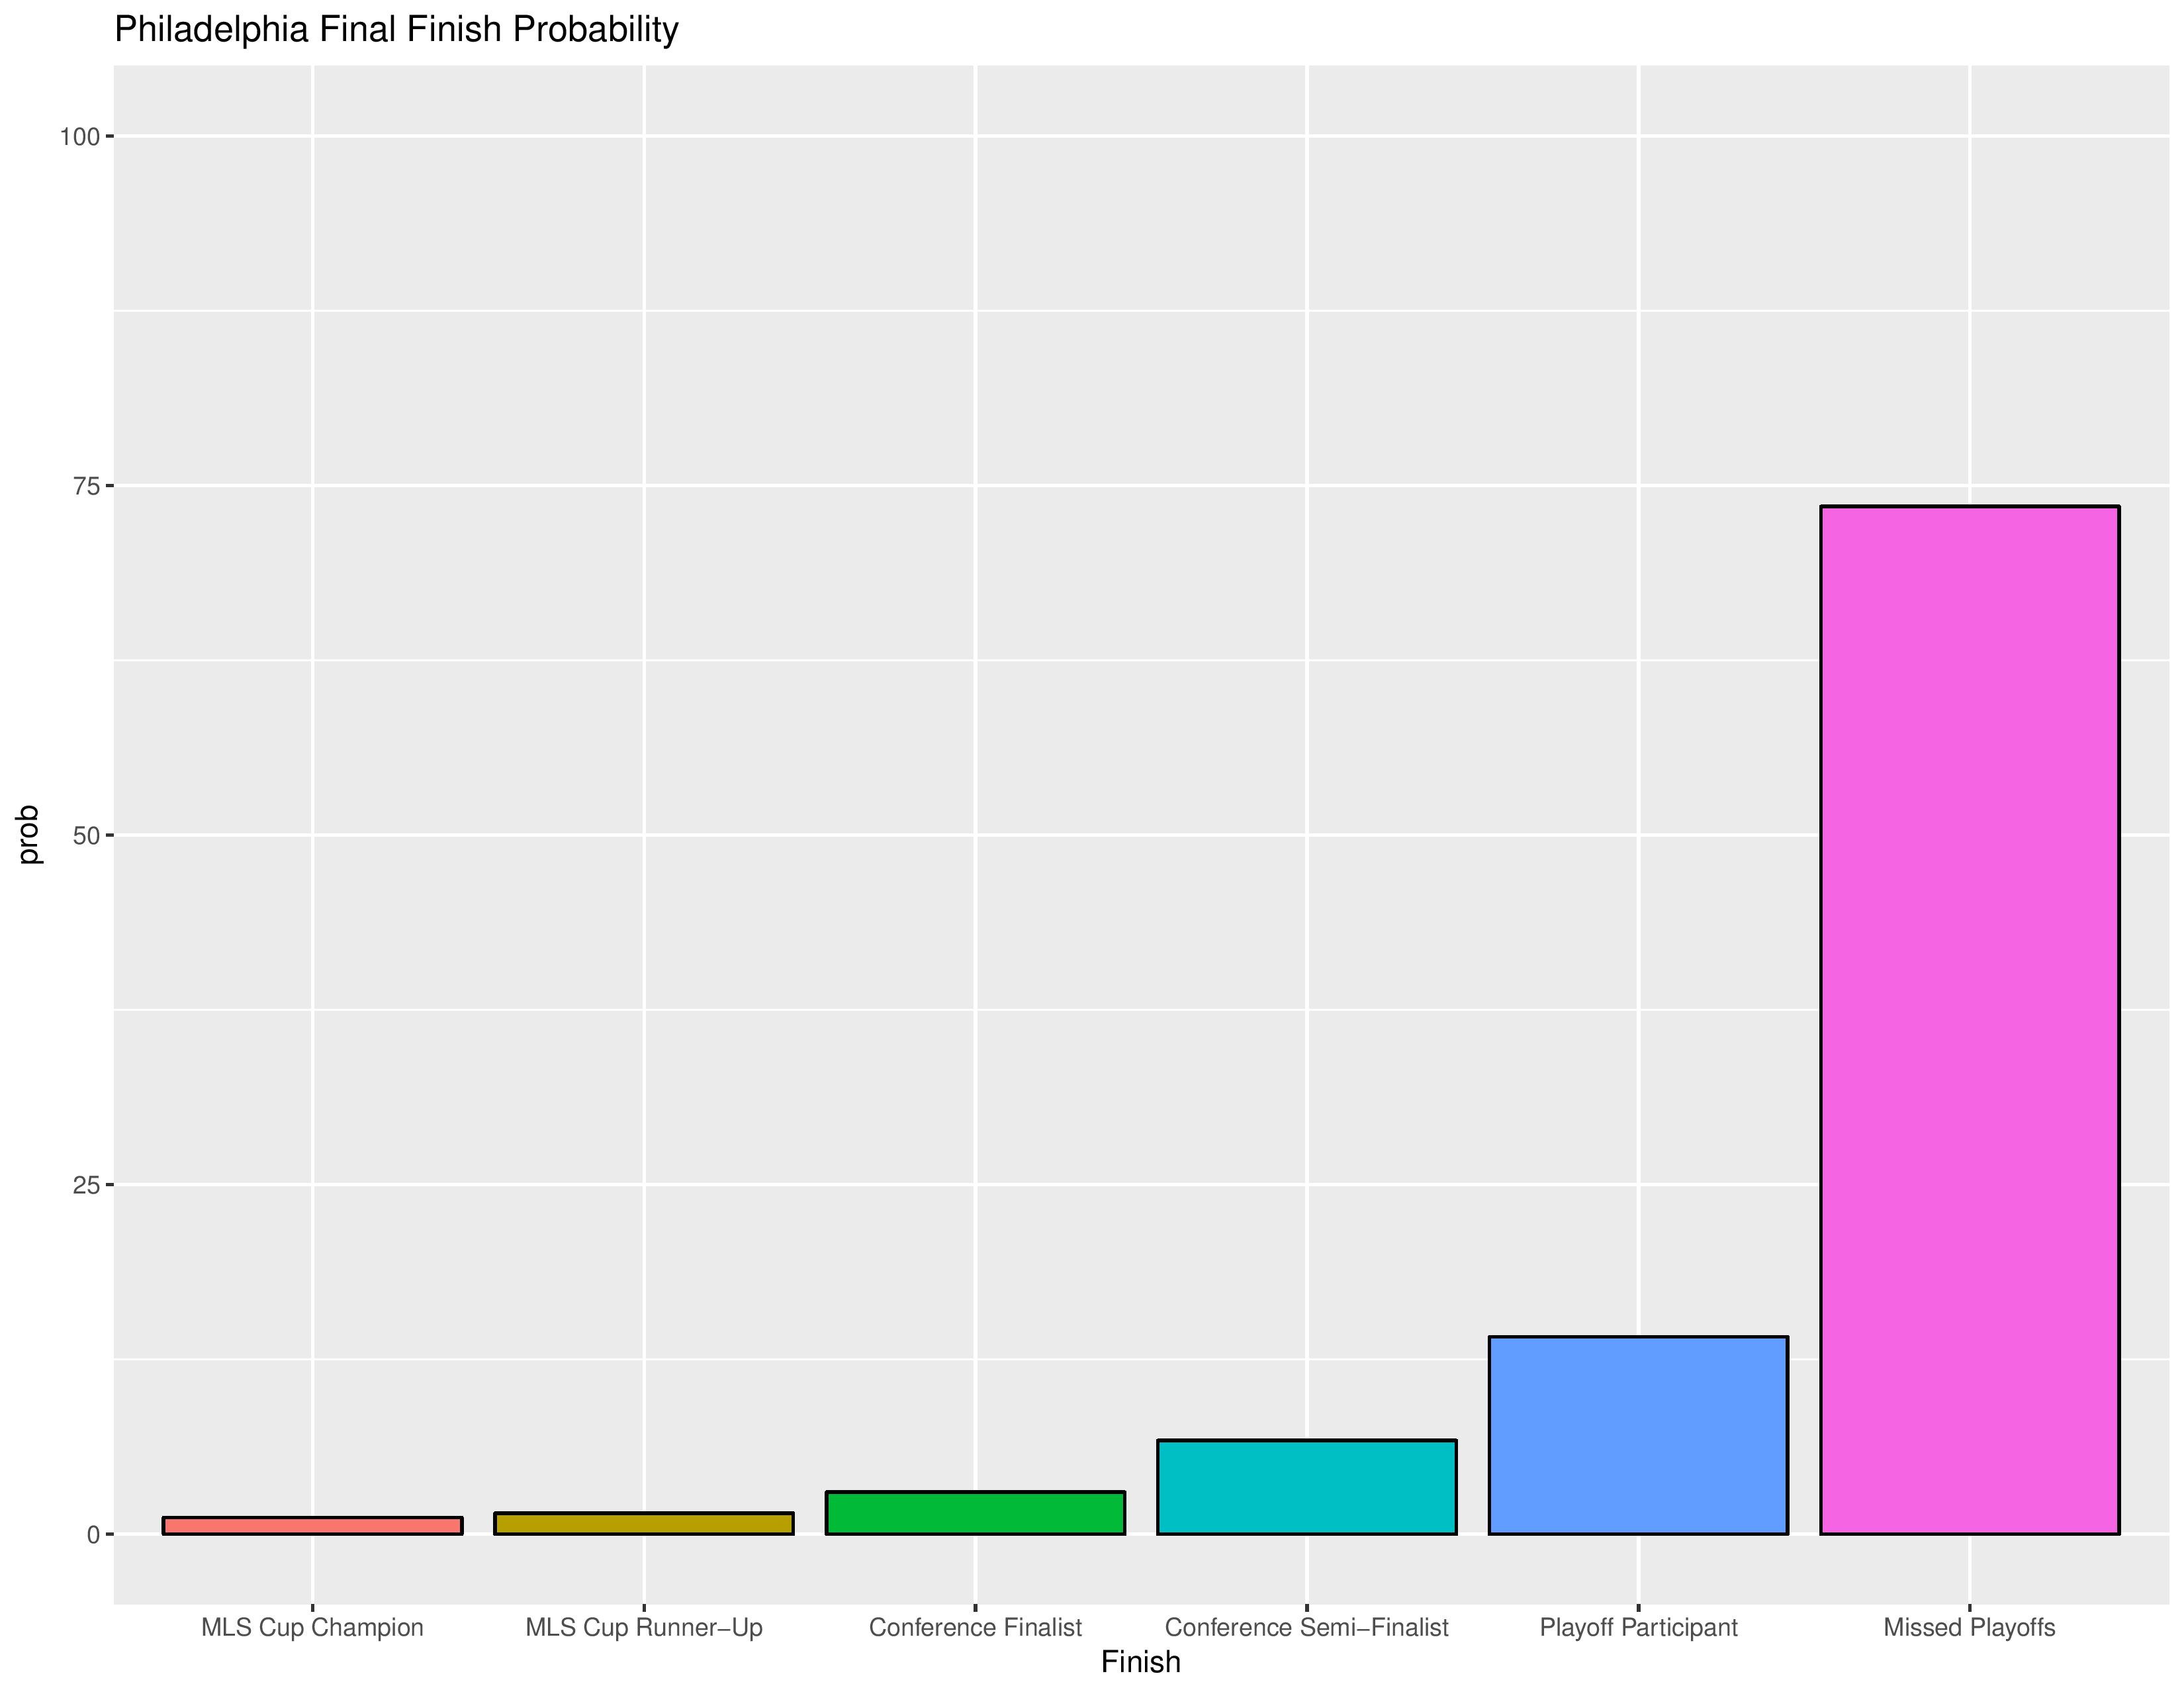
The following are probabilities for each category of outcomes for Philadelphia:
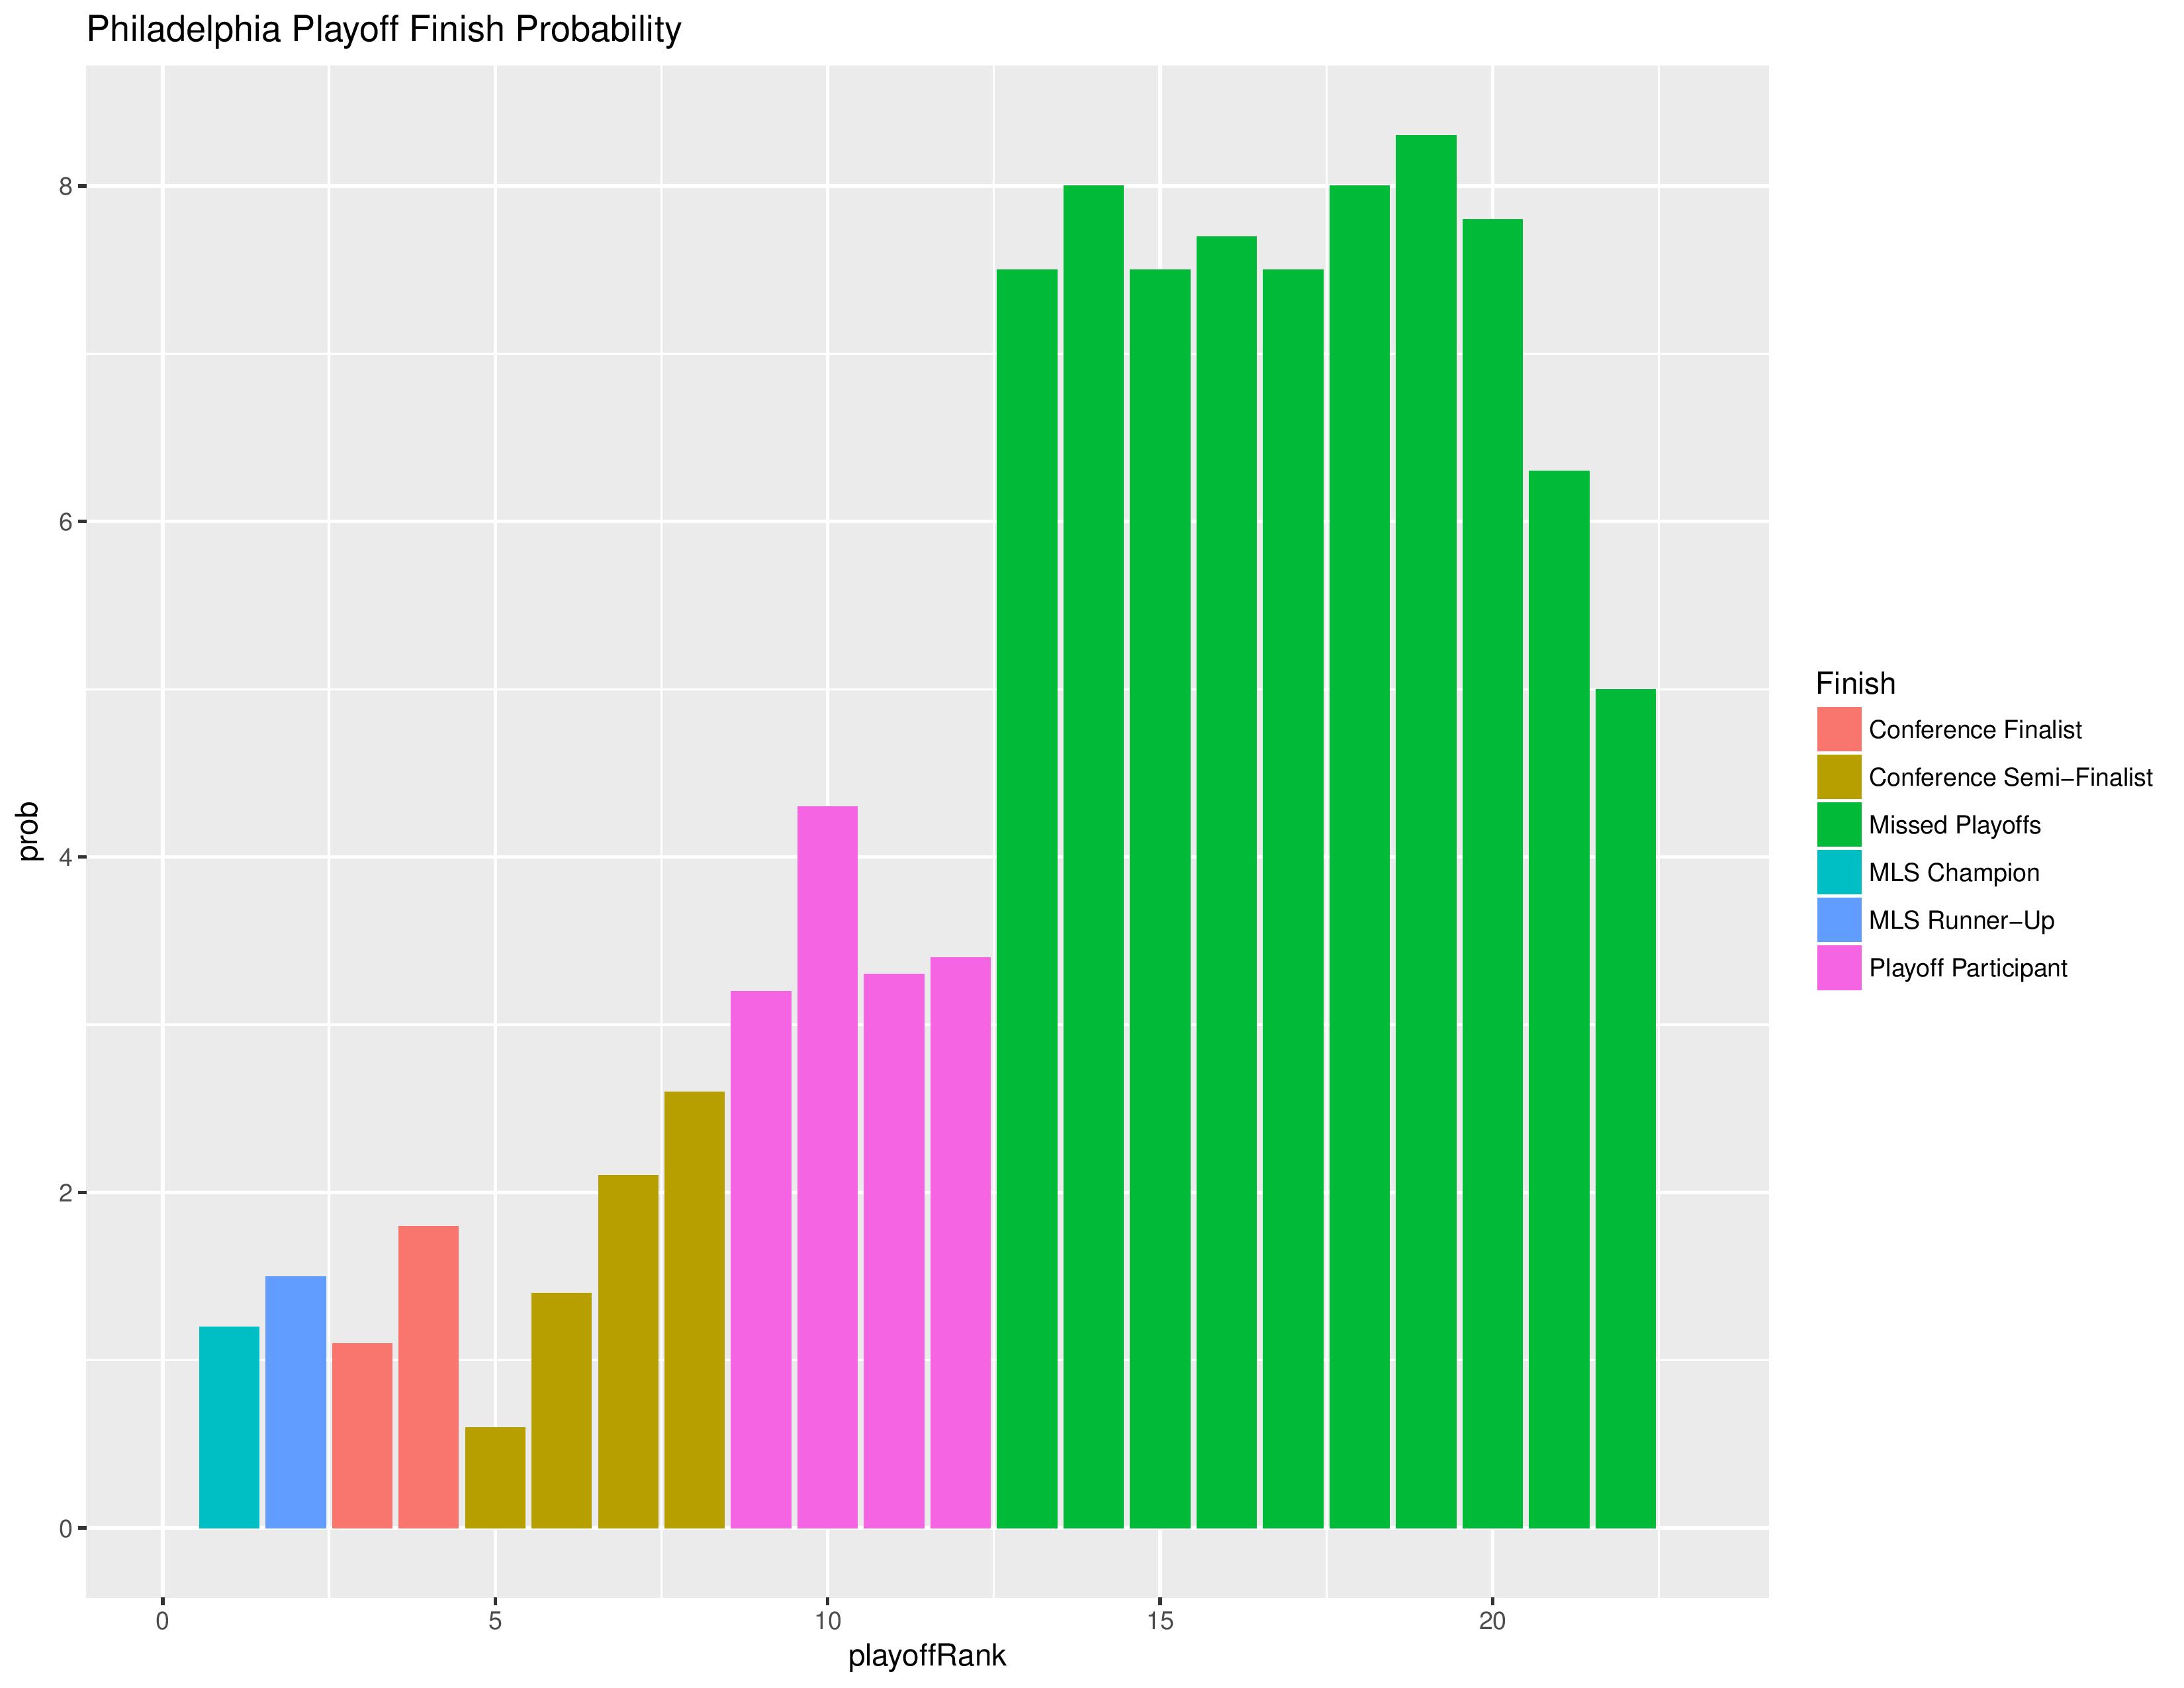
The following shows the probability of each post-playoff ranking finish.
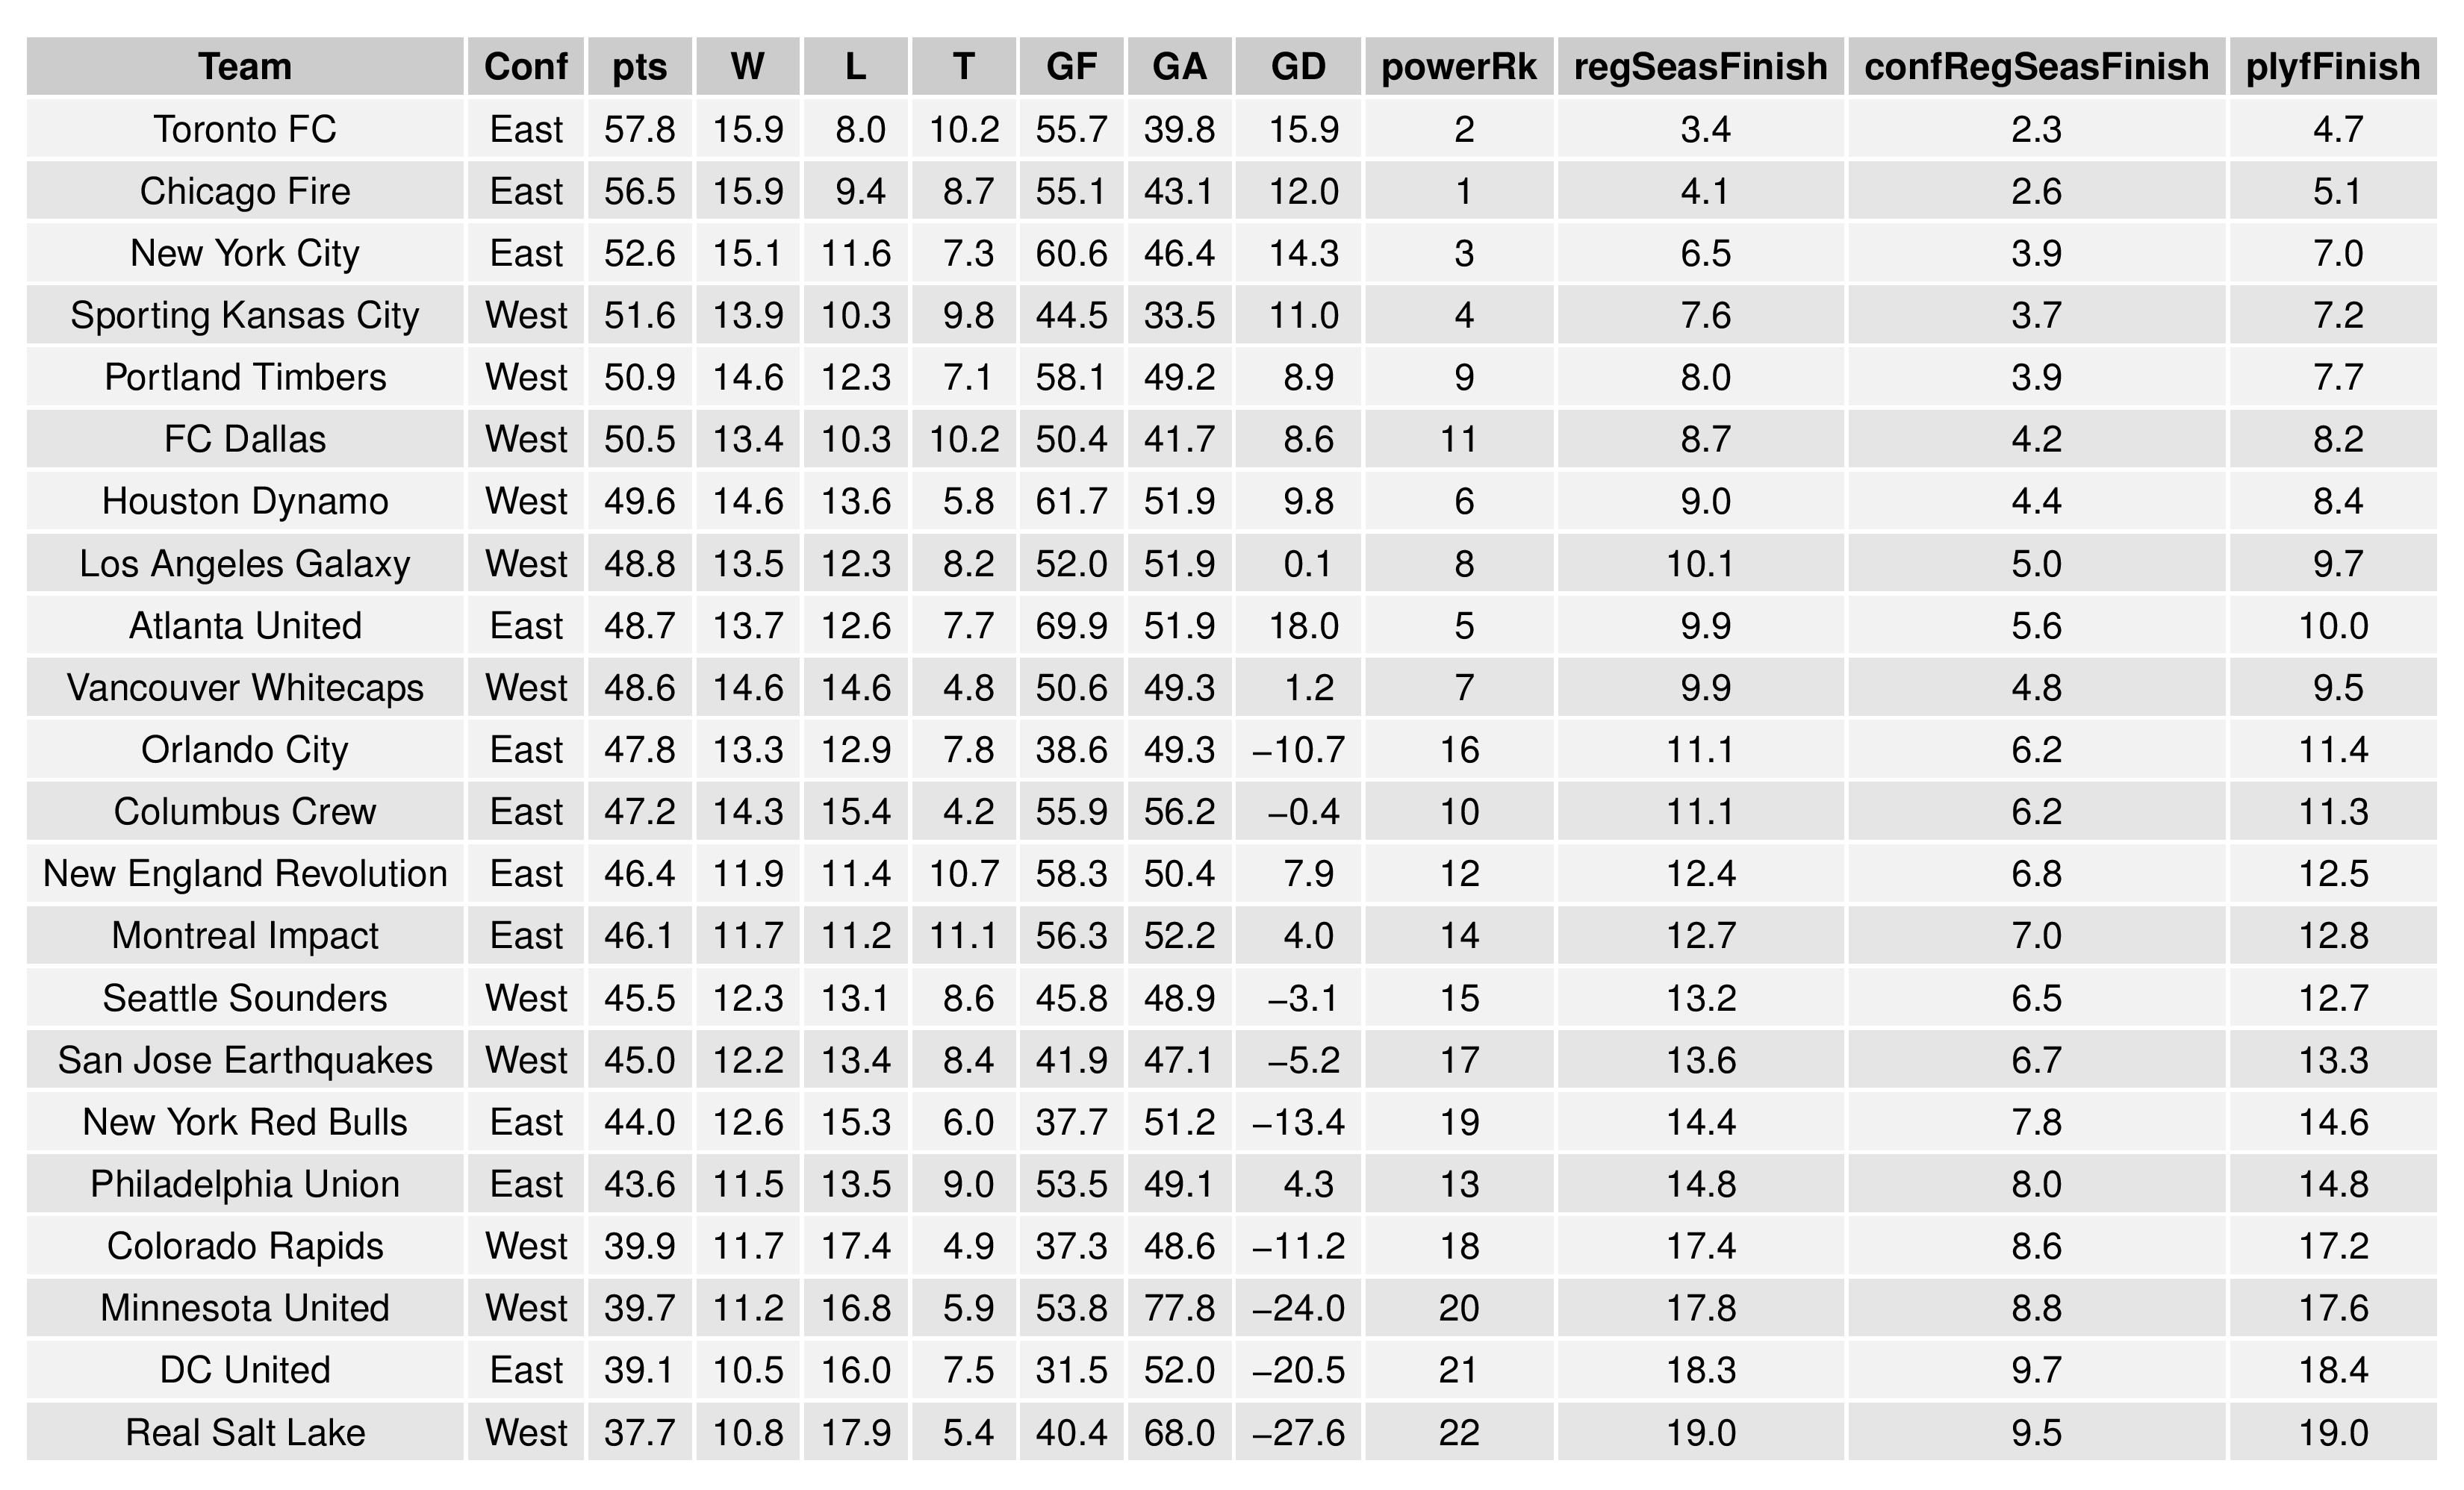
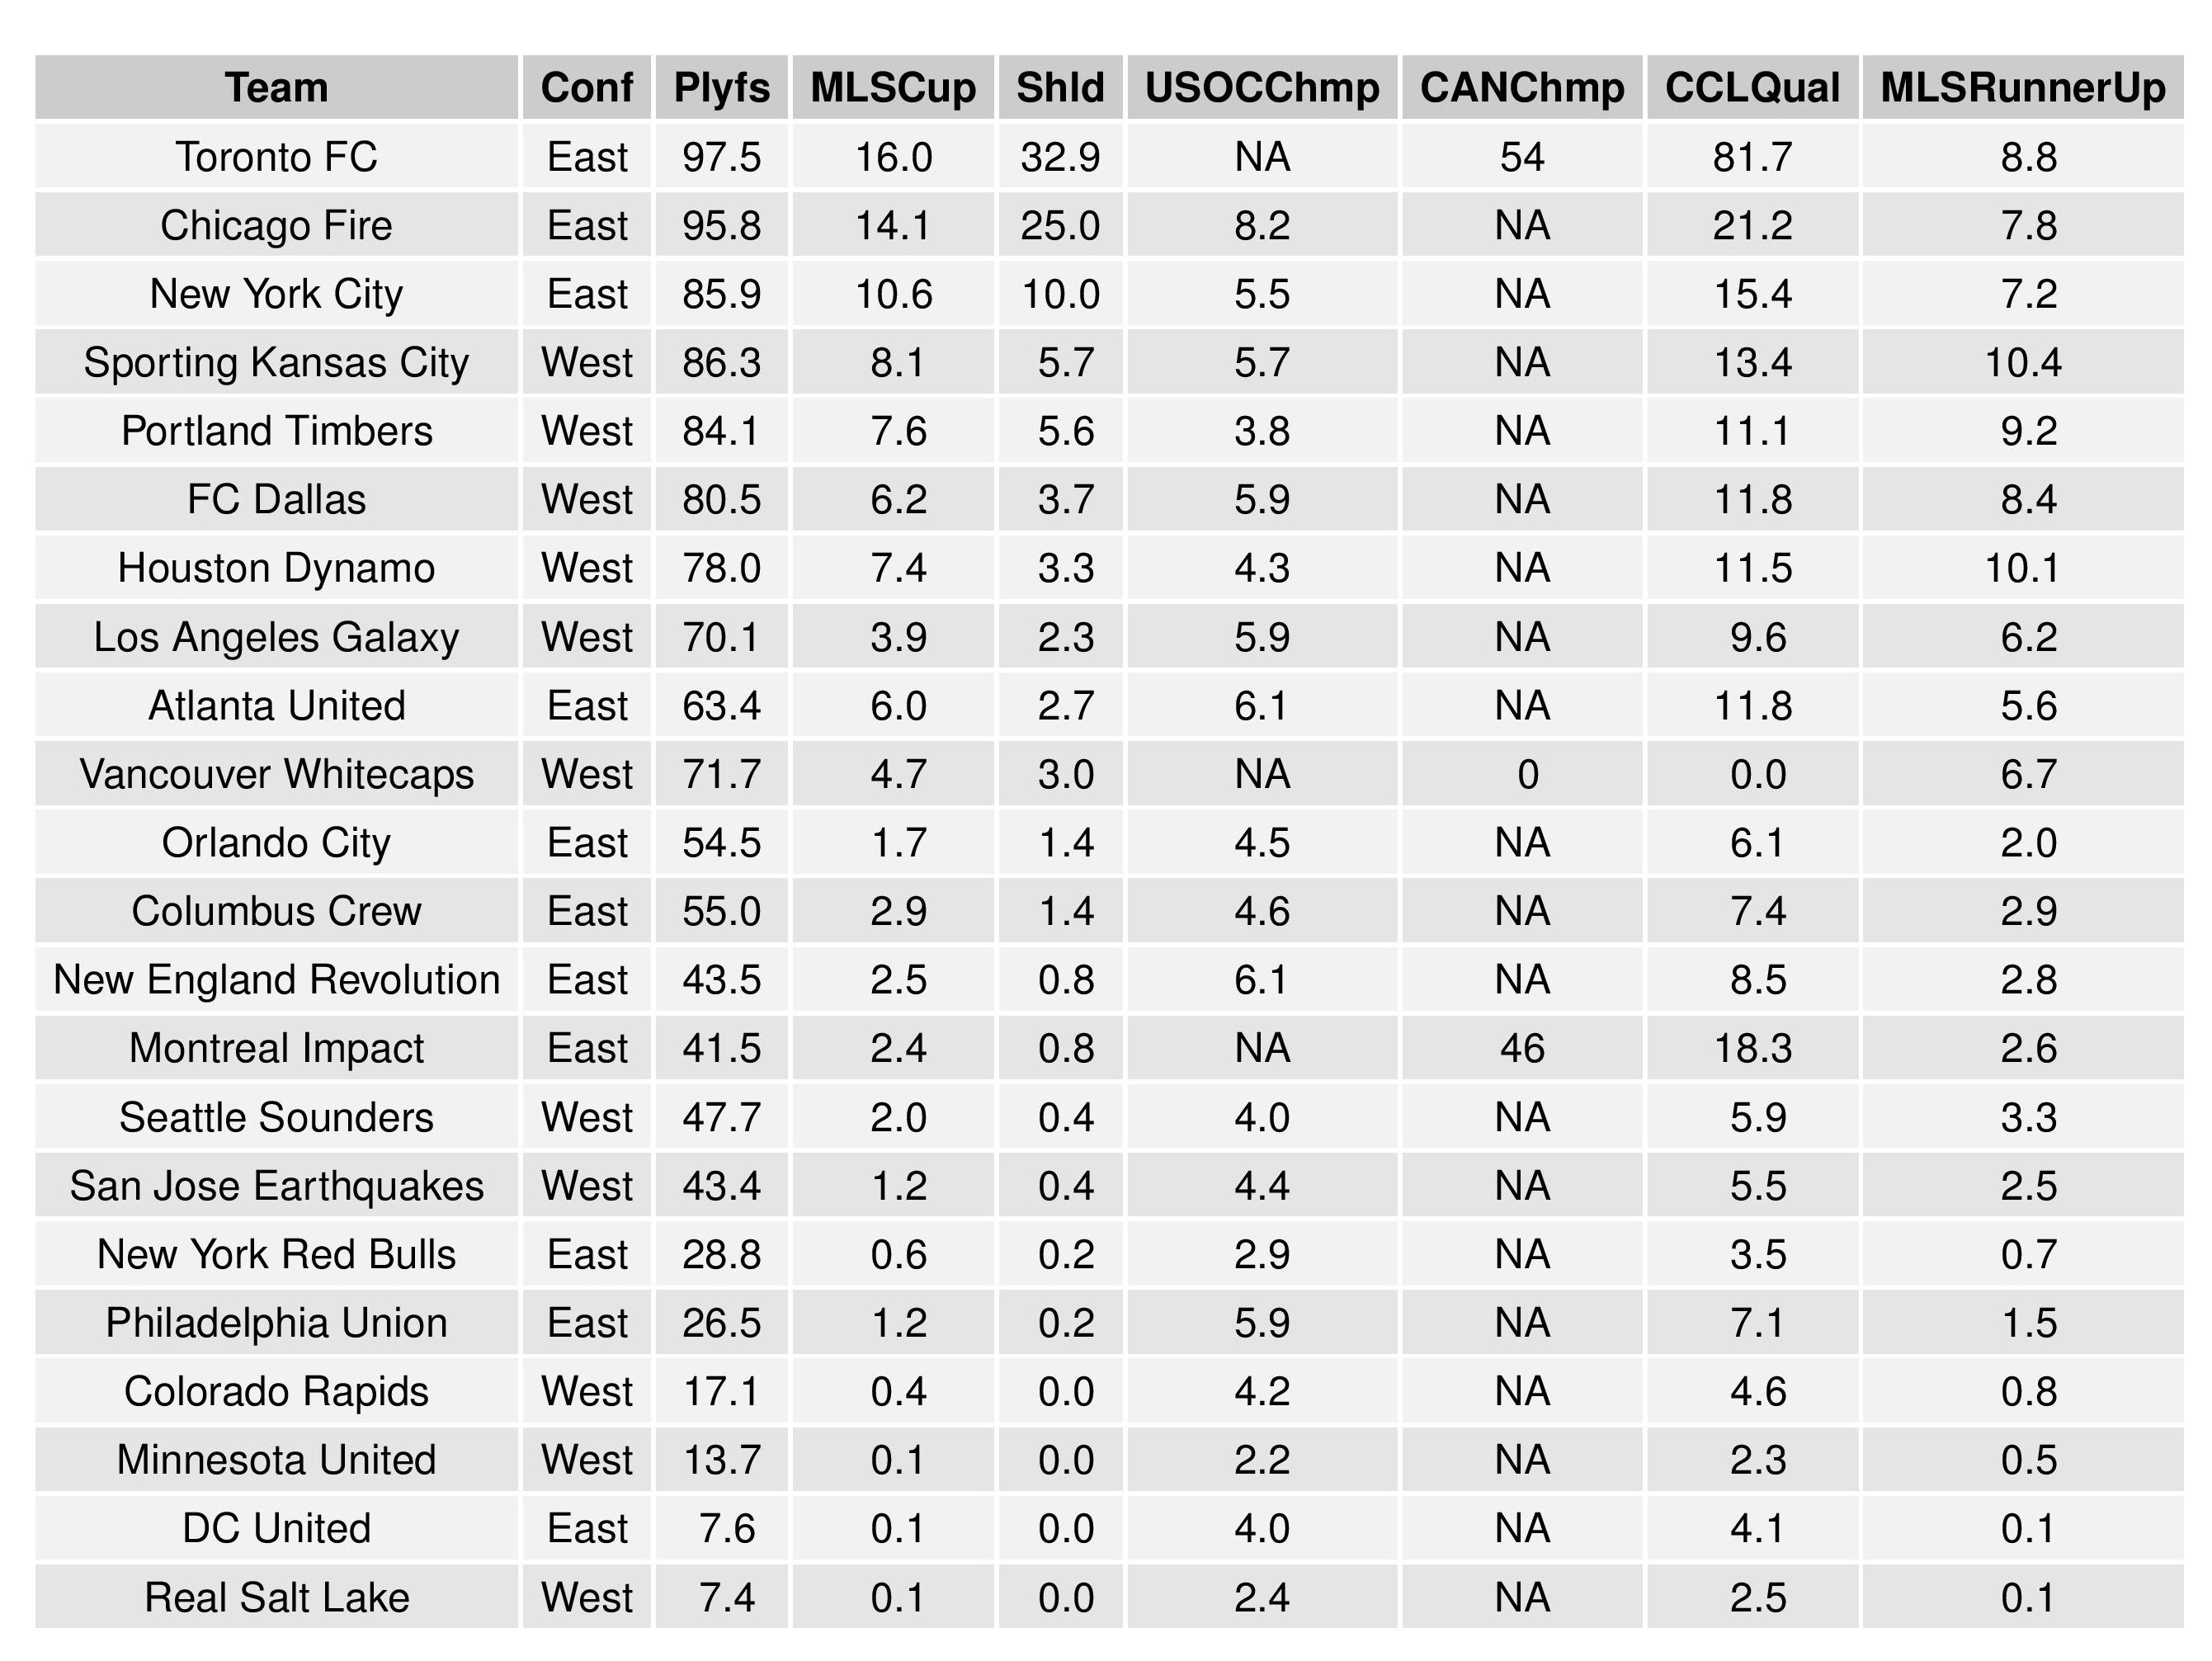
The following shows the summary of the simulations in an easy table format.
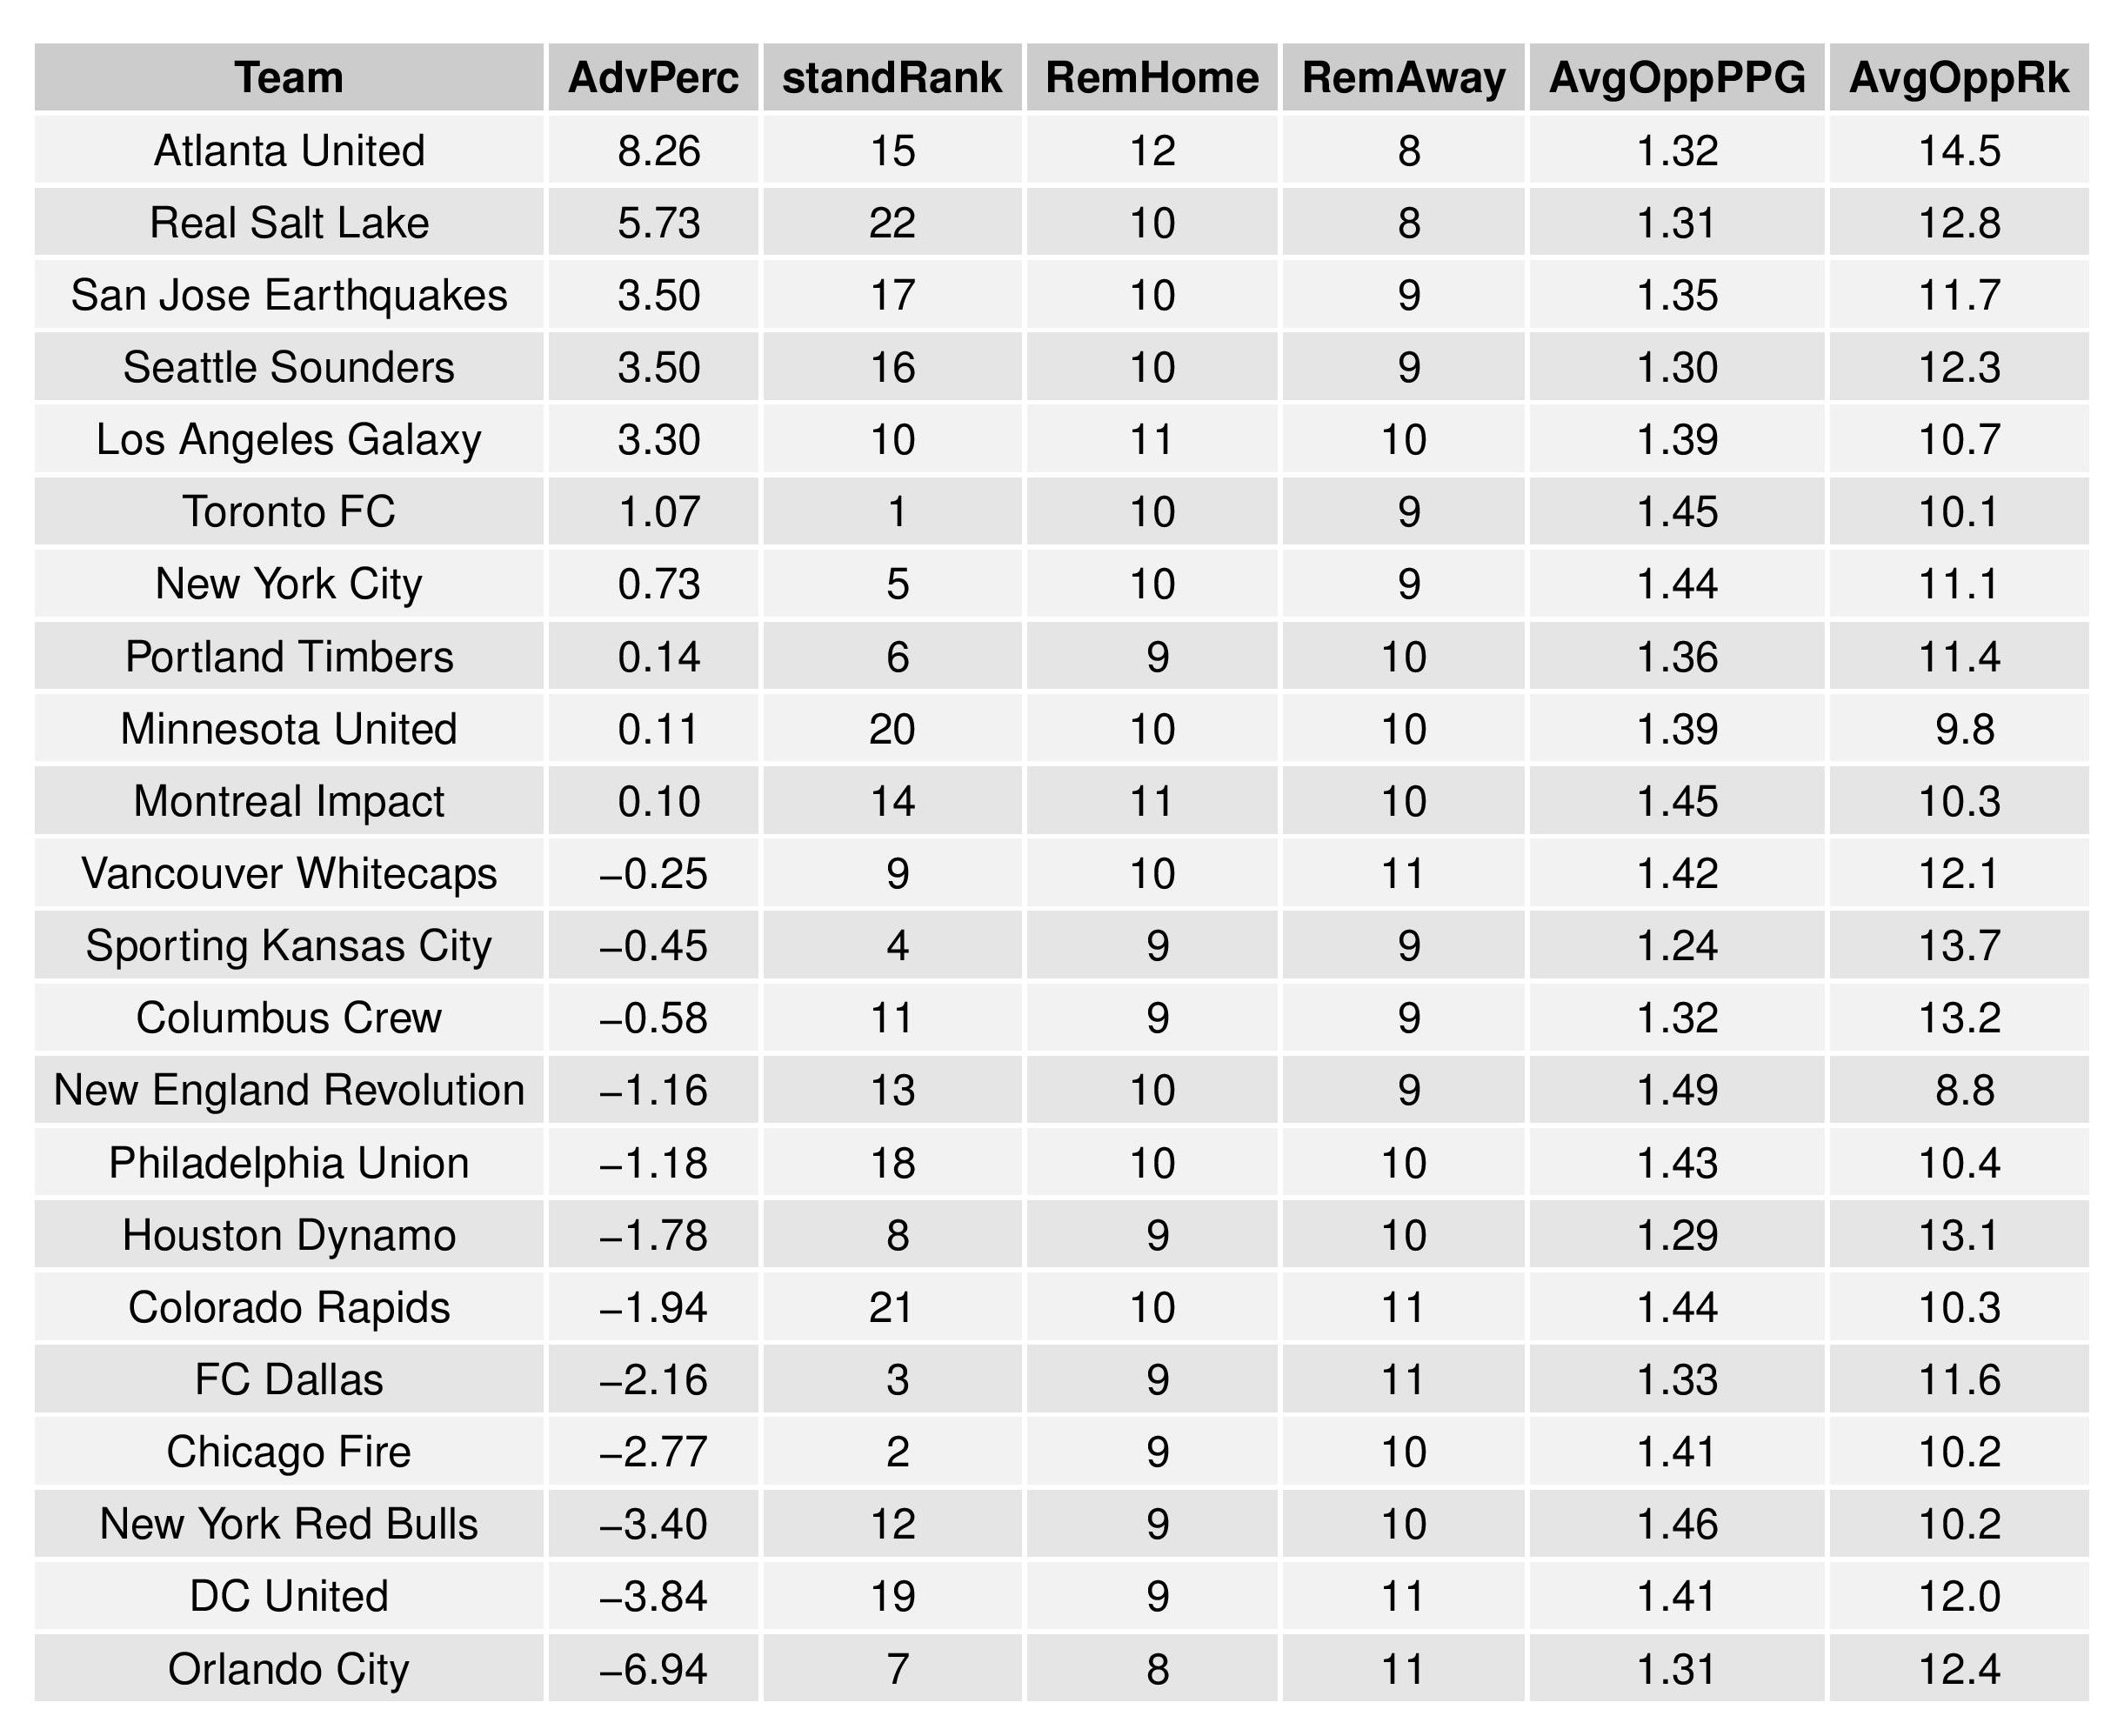
Next, we show how the Remaining Strength of Schedule affects each team.
The “Points Percentage Advantage” shown on the X-axis represents the percentage of points expected over the league average schedule. This “points expected” value is generated by simulating how all teams would perform with all remaining schedules (and therefore judges a schedule based upon how all teams would perform in that scenario).
In short, the higher the value, the easier the remaining schedule.
It might also be true that a better team has an ‘easier’ schedule simply because they do not have to play themselves. Likewise, a bad team may have a ‘harder’ schedule because they also do not play themselves.
The table following the chart also shares helpful context with these percentages.

Accompanying the advantage percentage in the following table is their current standings rank (right now ties are not properly calculated beyond pts/gd/gf; I may fix that, but maybe not for a while), the remaining home matches, the remaining away matches, the current average points-per-game of future opponents (results-based, not model-based), and the average power ranking of future opponents according to SEBA.
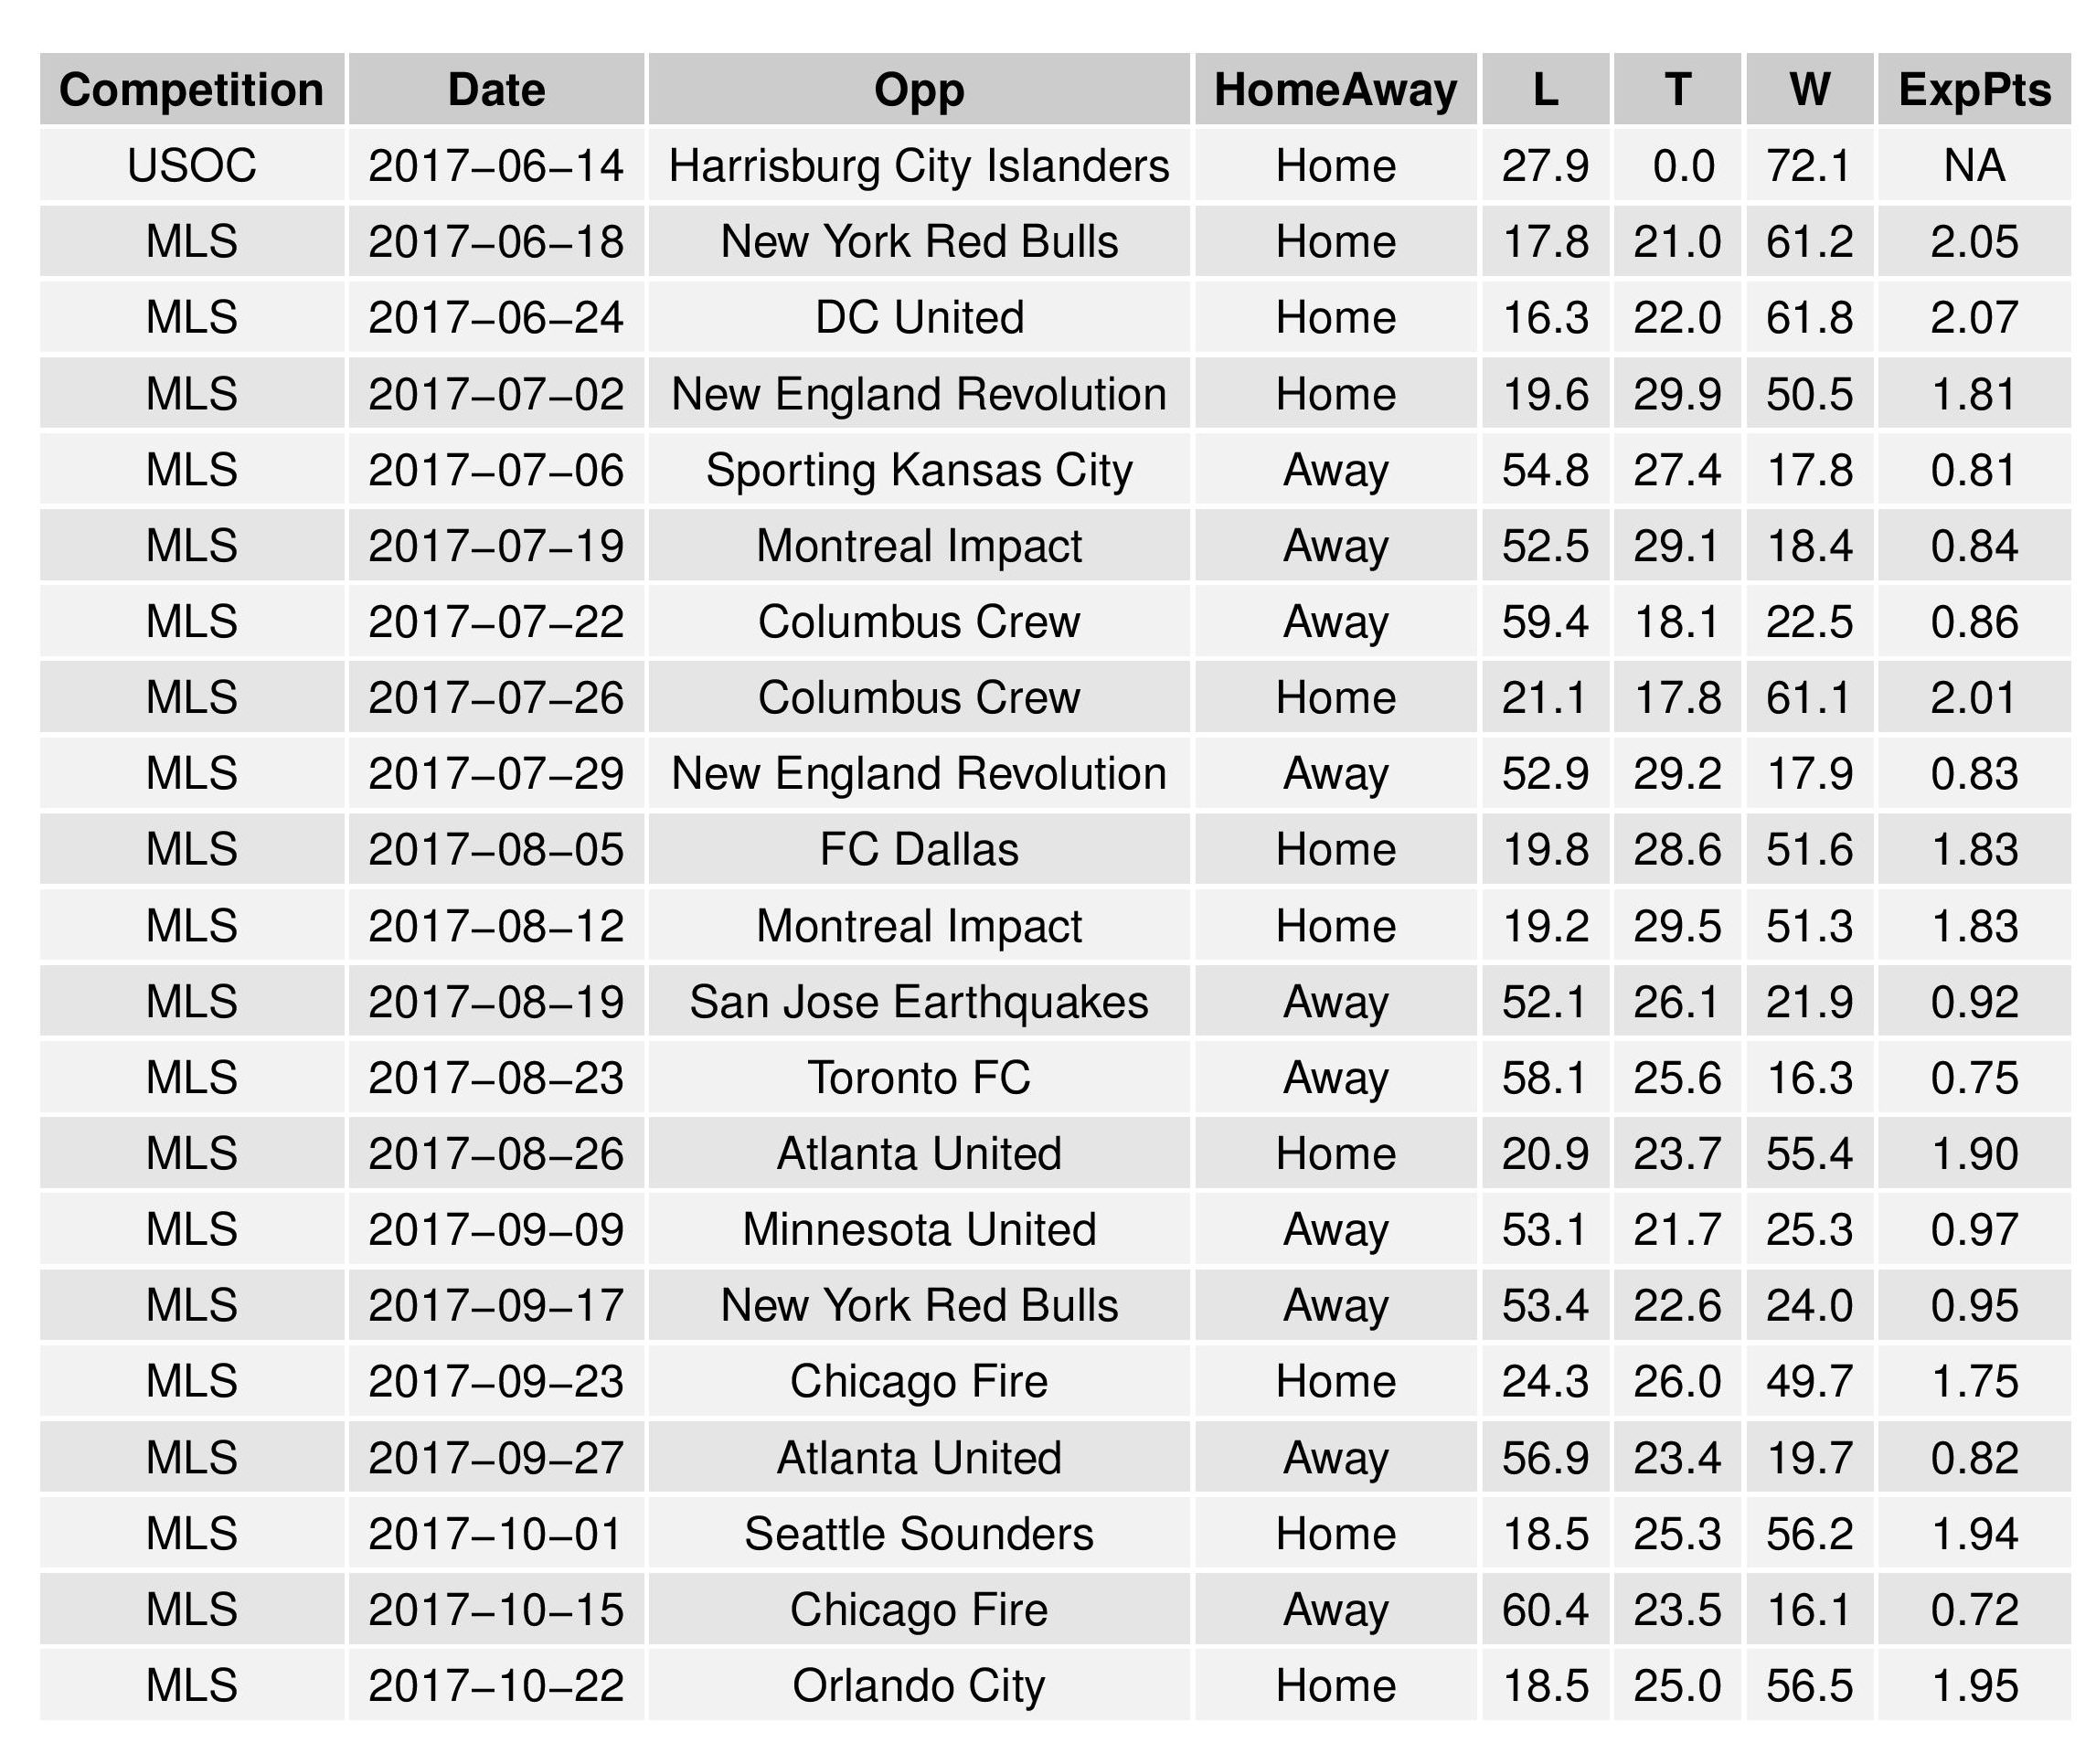
The following shows the expectations for upcoming Philadelphia matches:
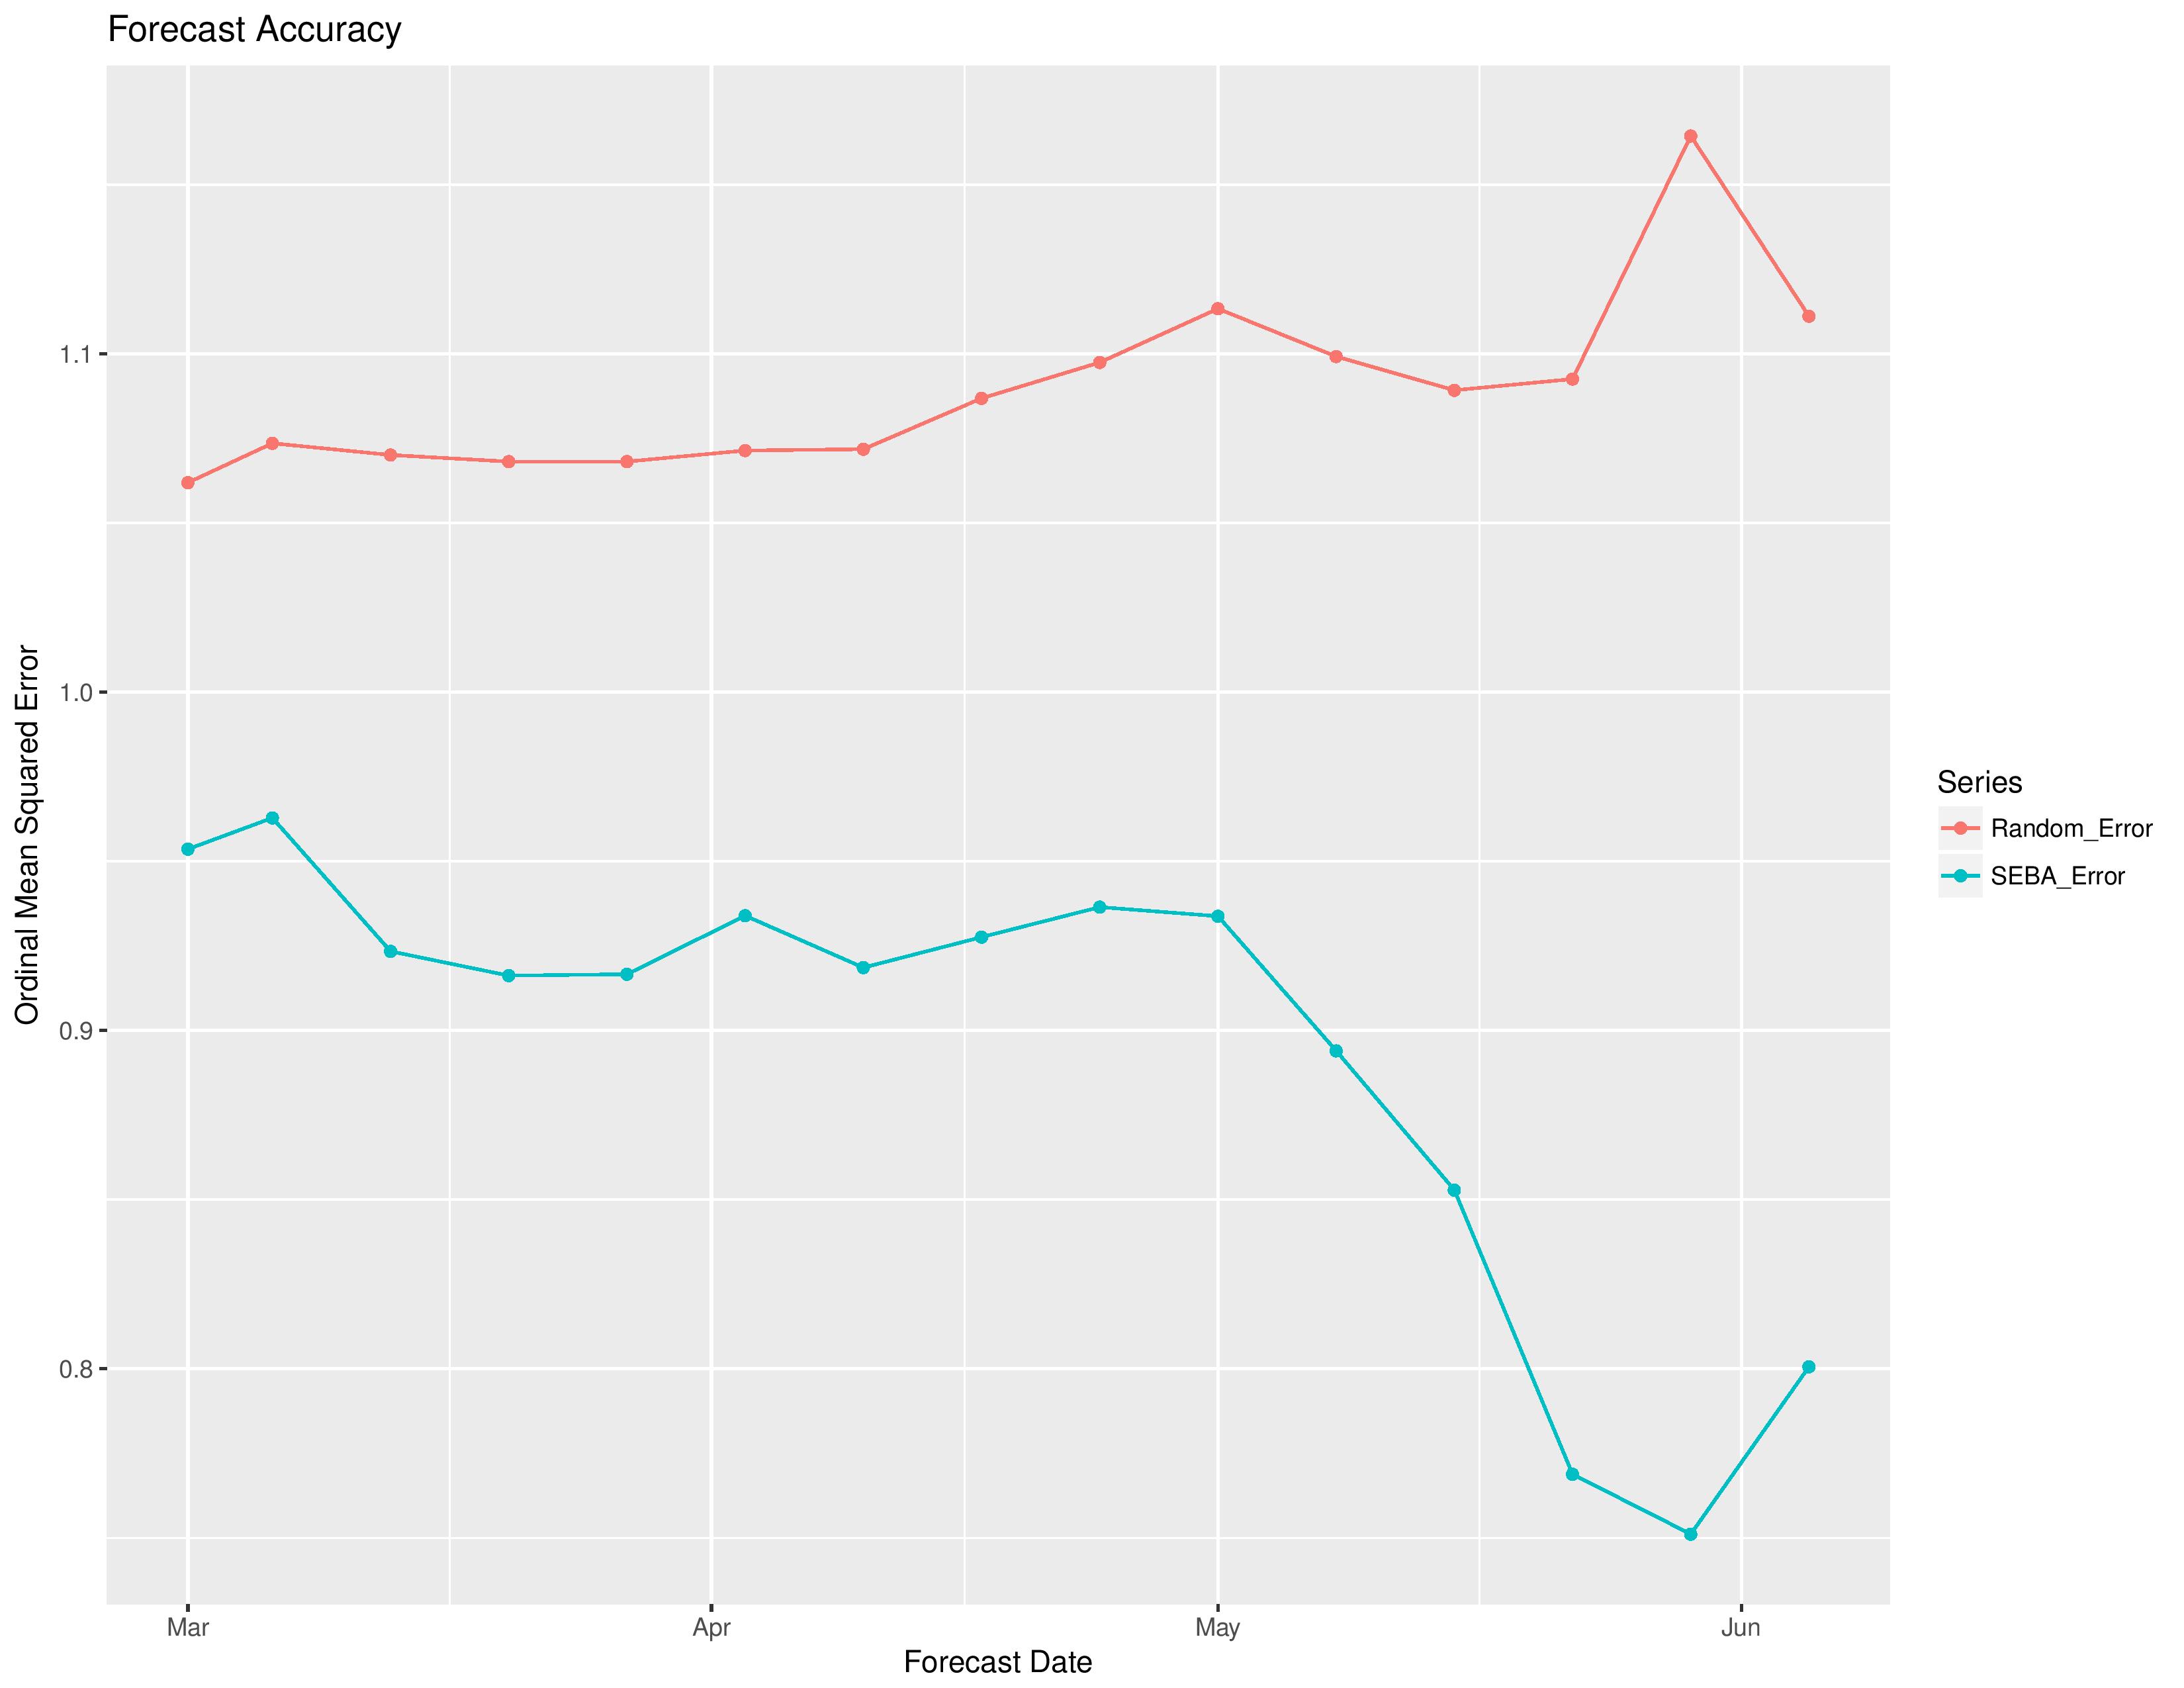
Model Validation
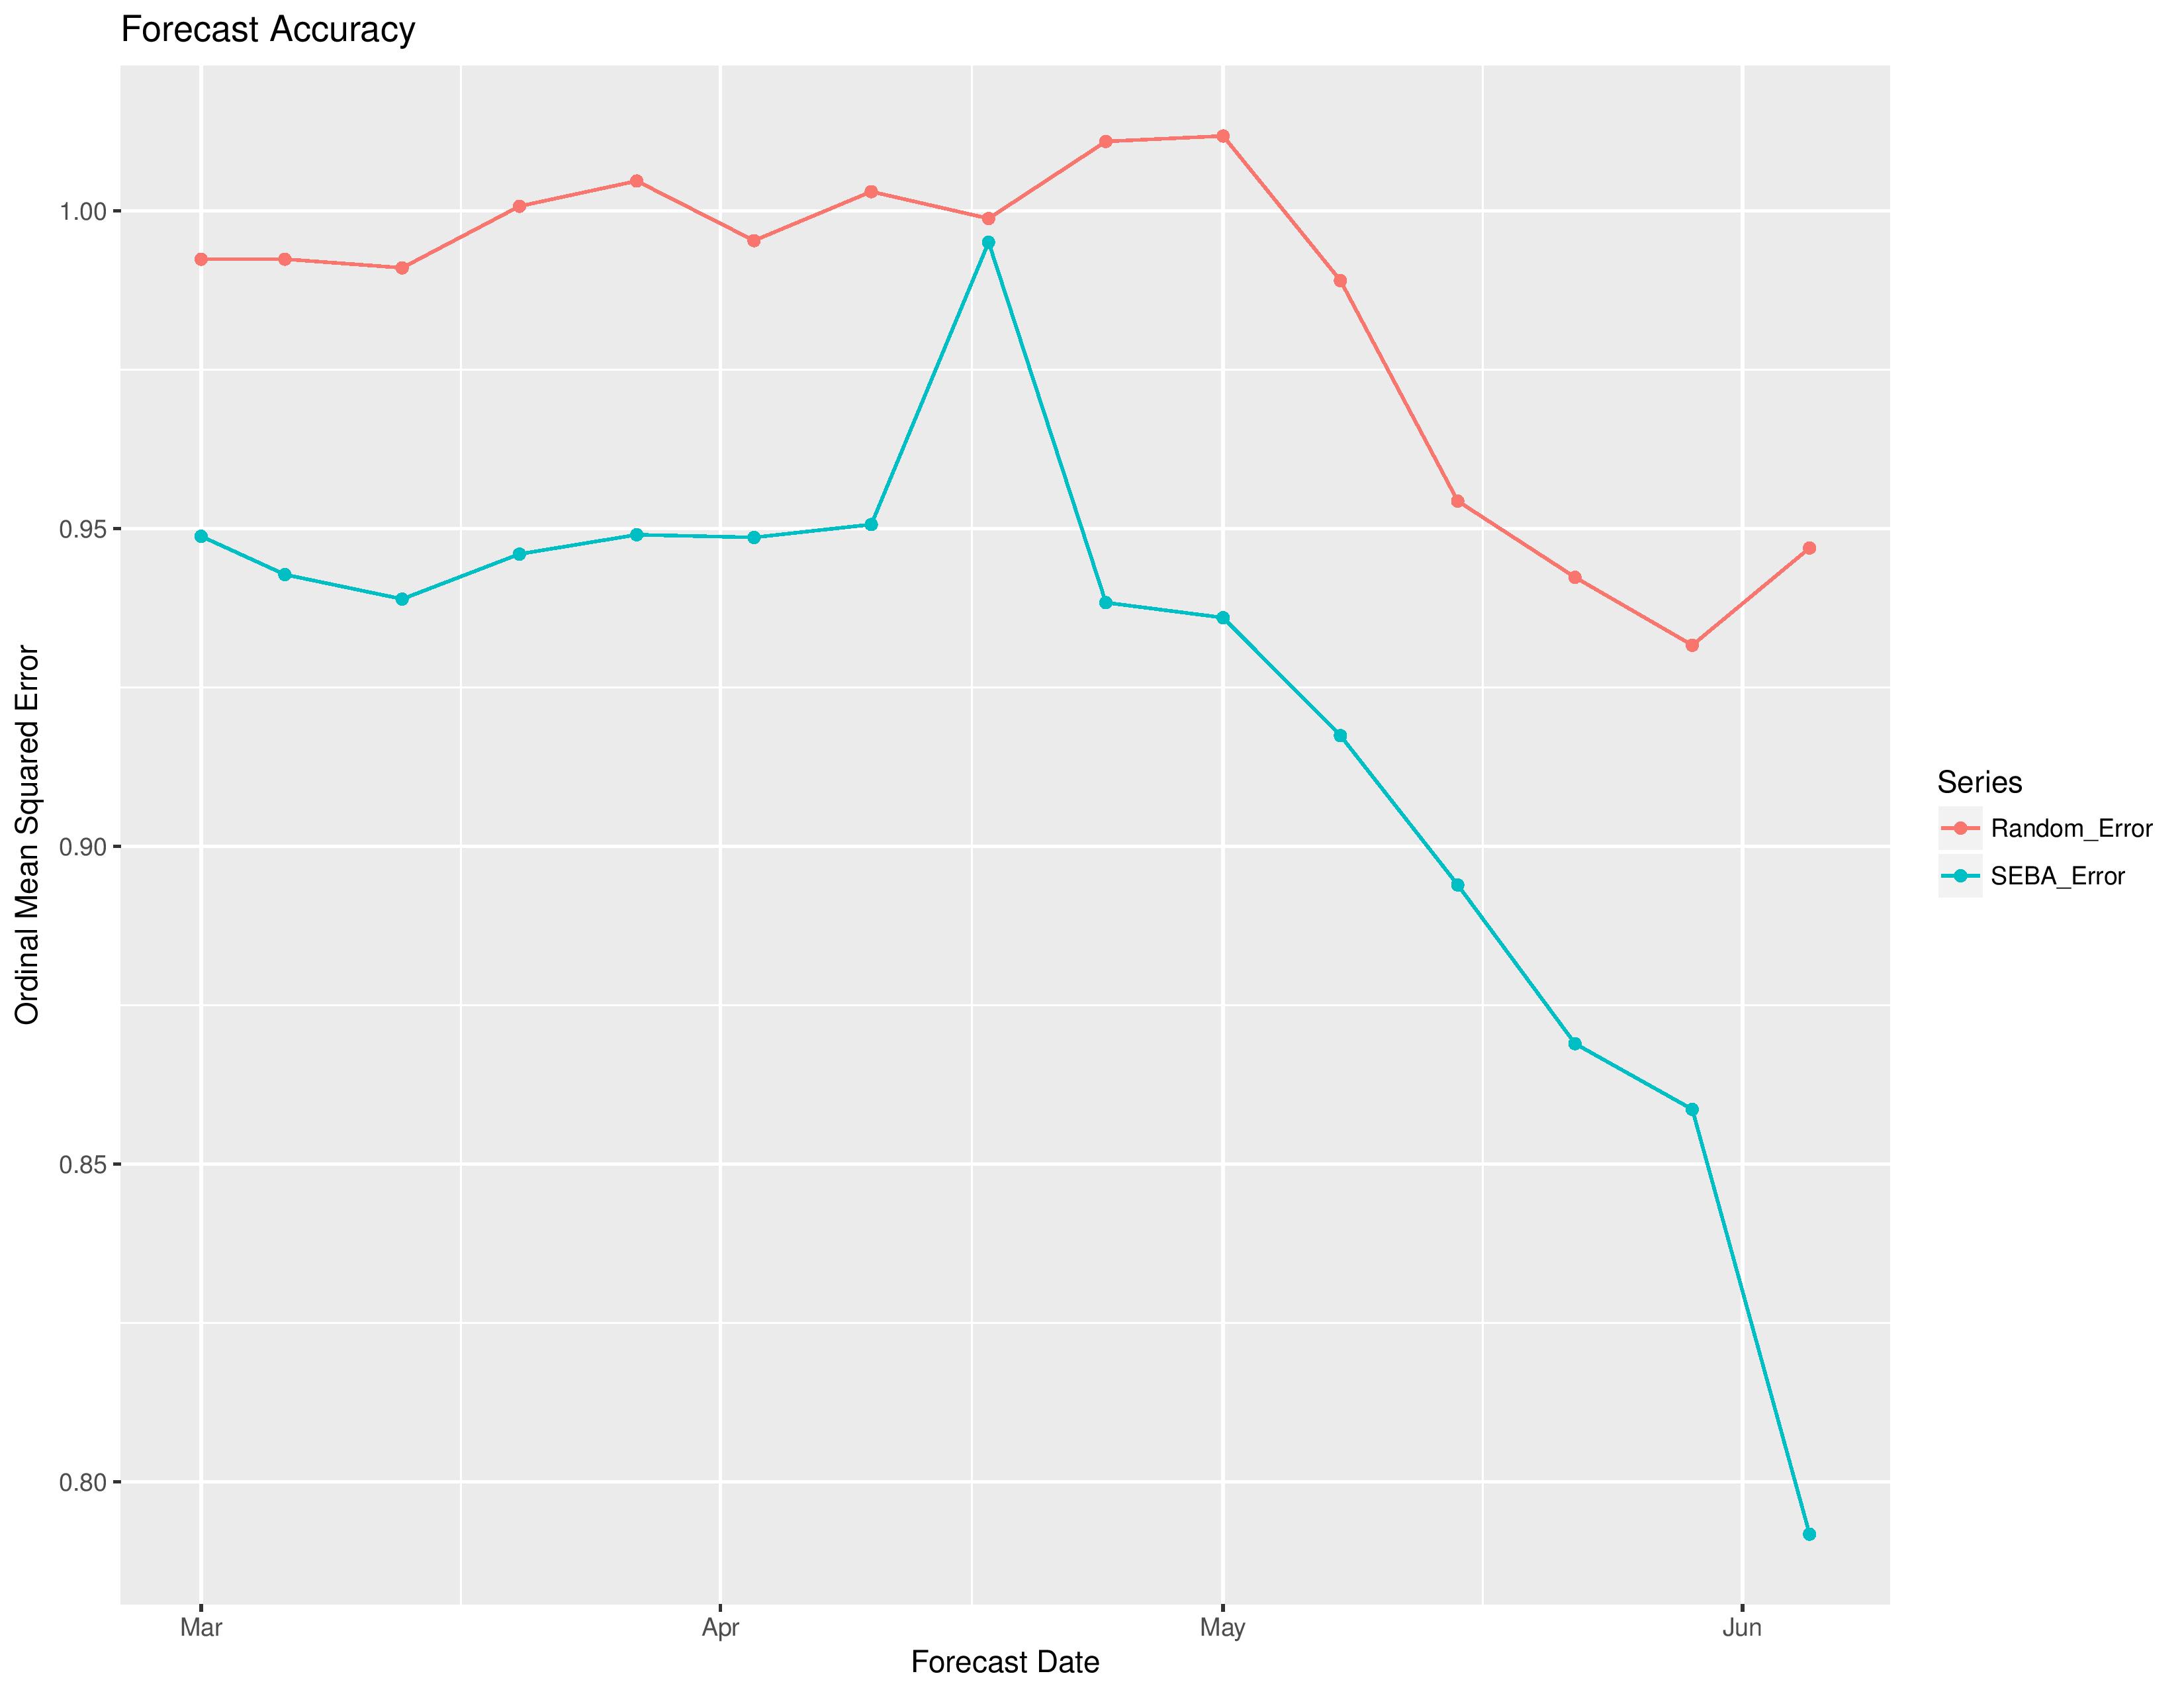
The following shows the degree of error by the model vs the error if the model was purely random without intelligence. The x-axis is based on the date from which the forecast was made (this will update throughout the season as more results are finalized and compared with predictions). The ordinal squared error metric (not a traditional metric) is calculated as:
(ProbW – ActW)^2 + (ProbT – ActT)^2 + (ProbL – ActL)^2 +
((ProbW + ProbT) – (ActW + ActT))^2 +
((ProbL + ProbT) – (ActL + ActT))^2
where Prob[W/T/L] is the model’s probability of resulting outcomes and Act[W/T/L] is a 1 or 0 representation of whether it actually happened.
Random error will decline when more ties occur, as there is a less severe penalty for ties.
These data points are not fixed until the end of the season due to additional matches adding to them.
USL
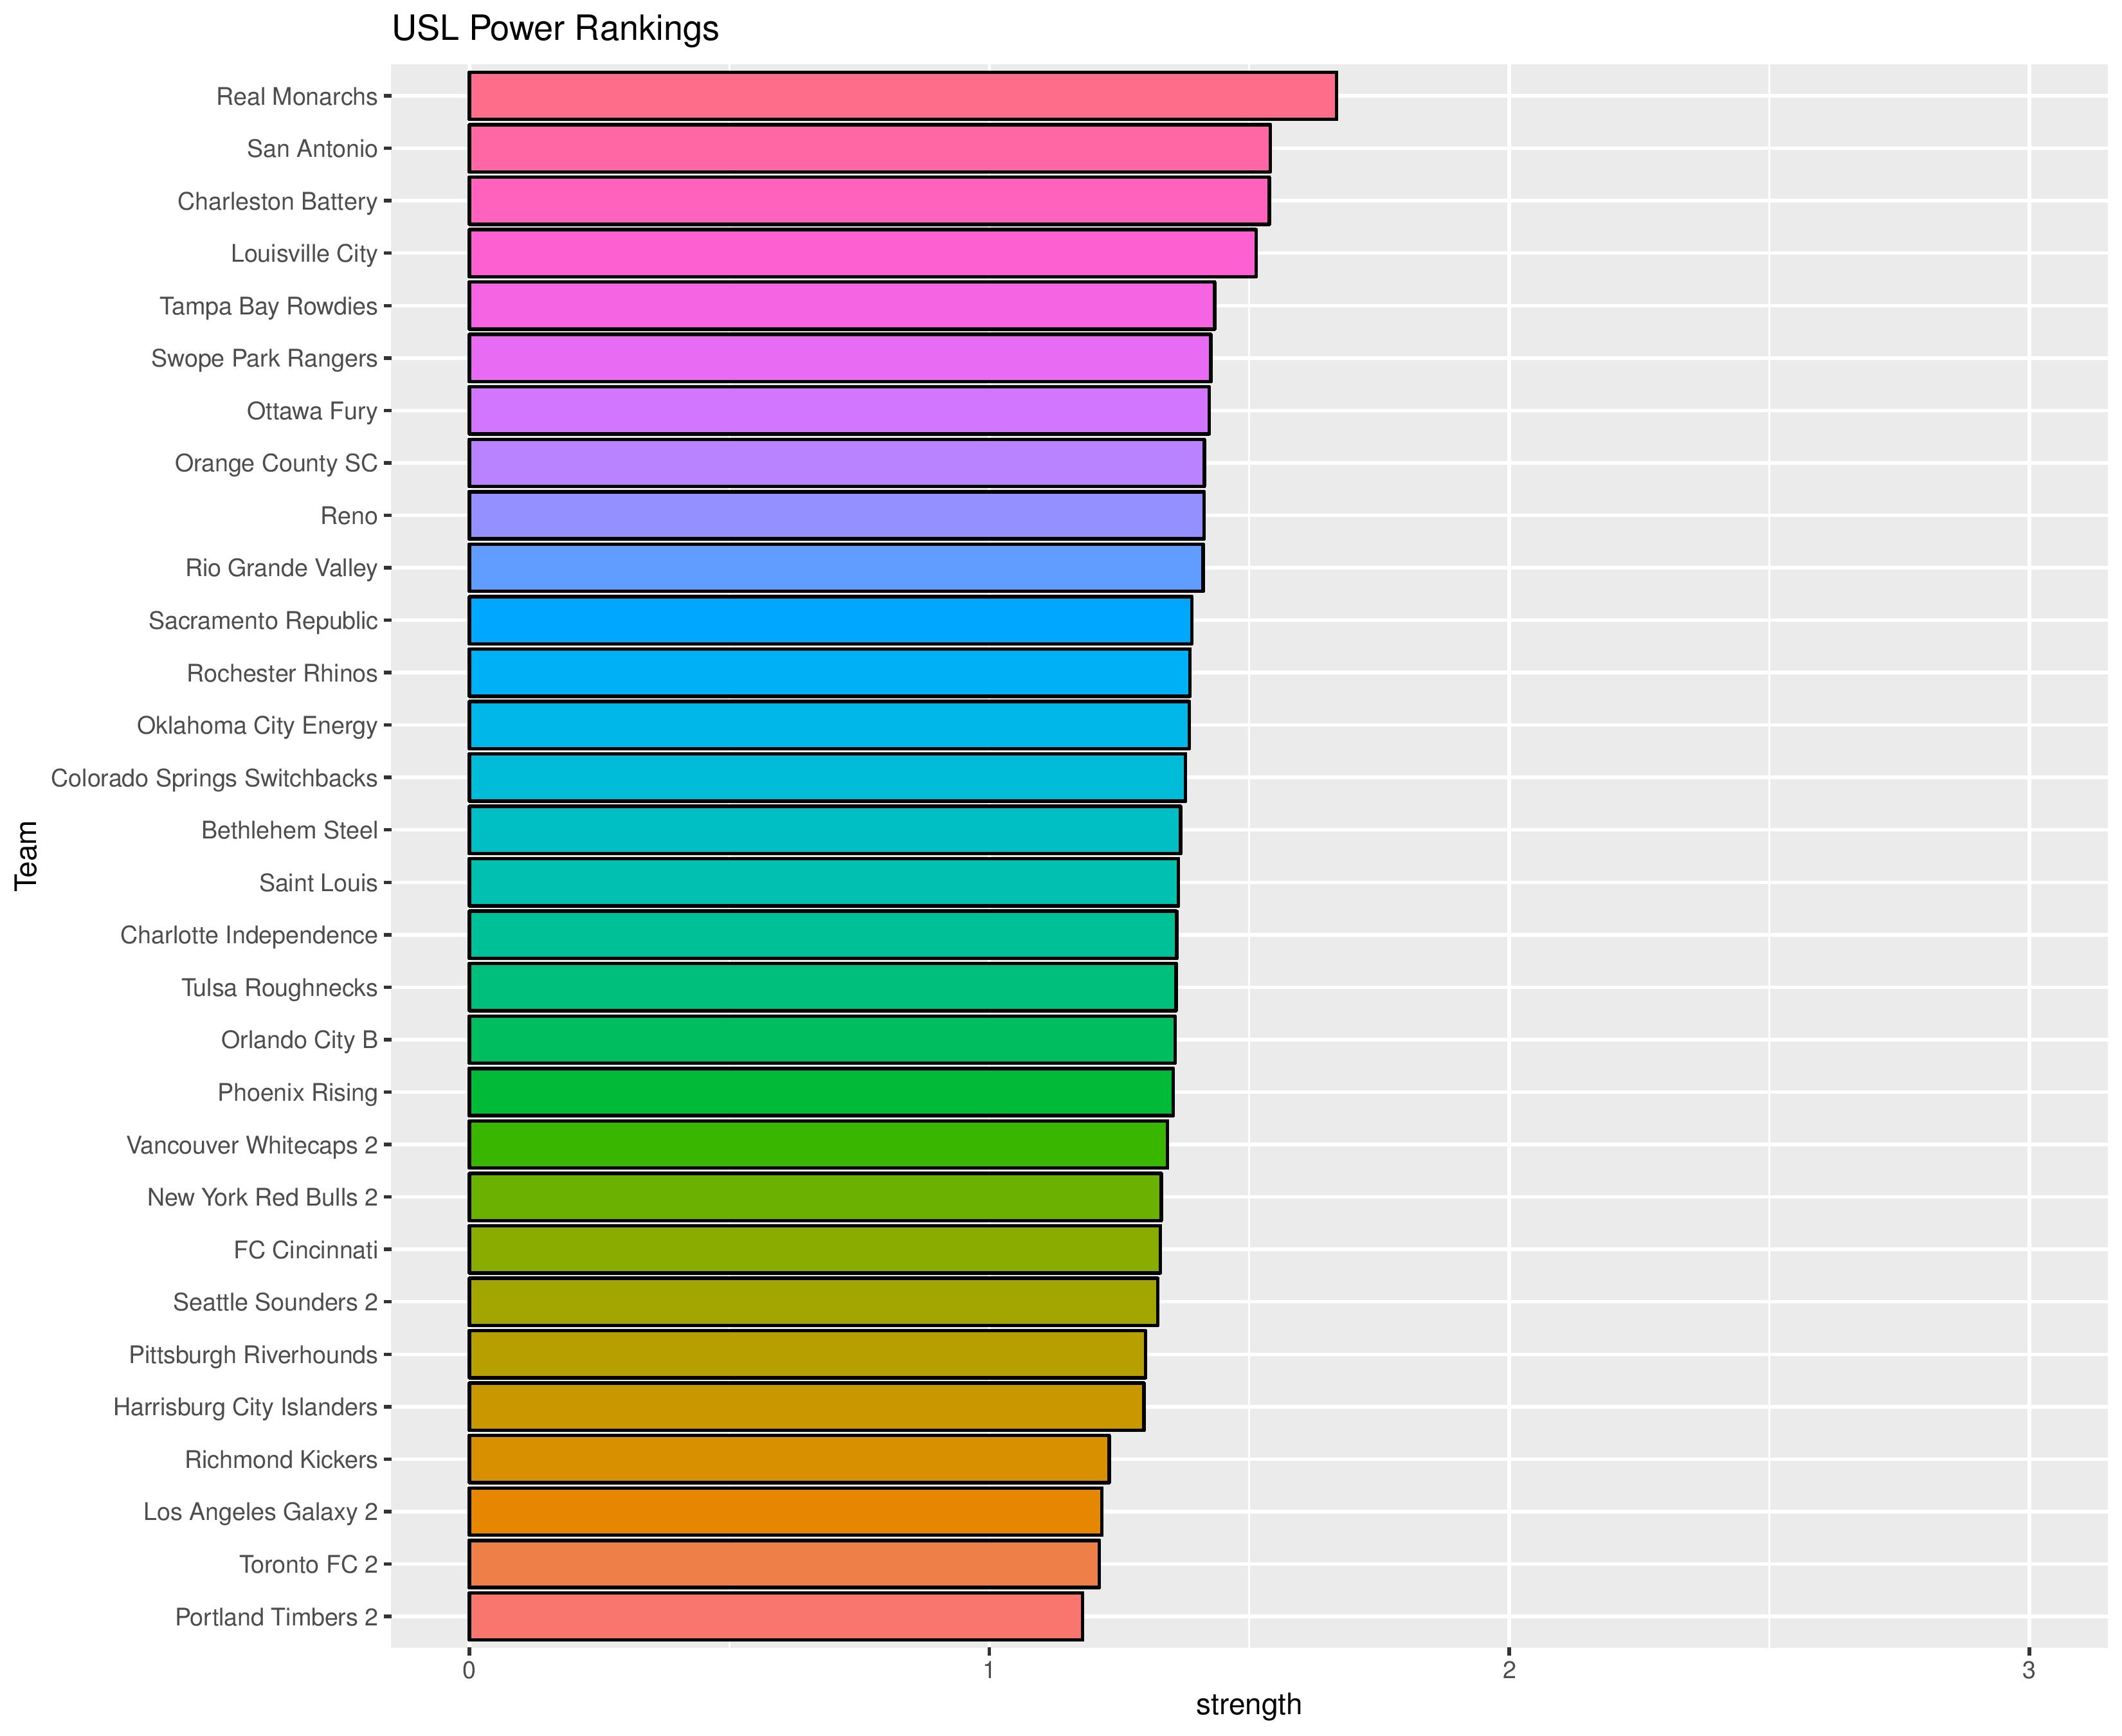
Power Rankings
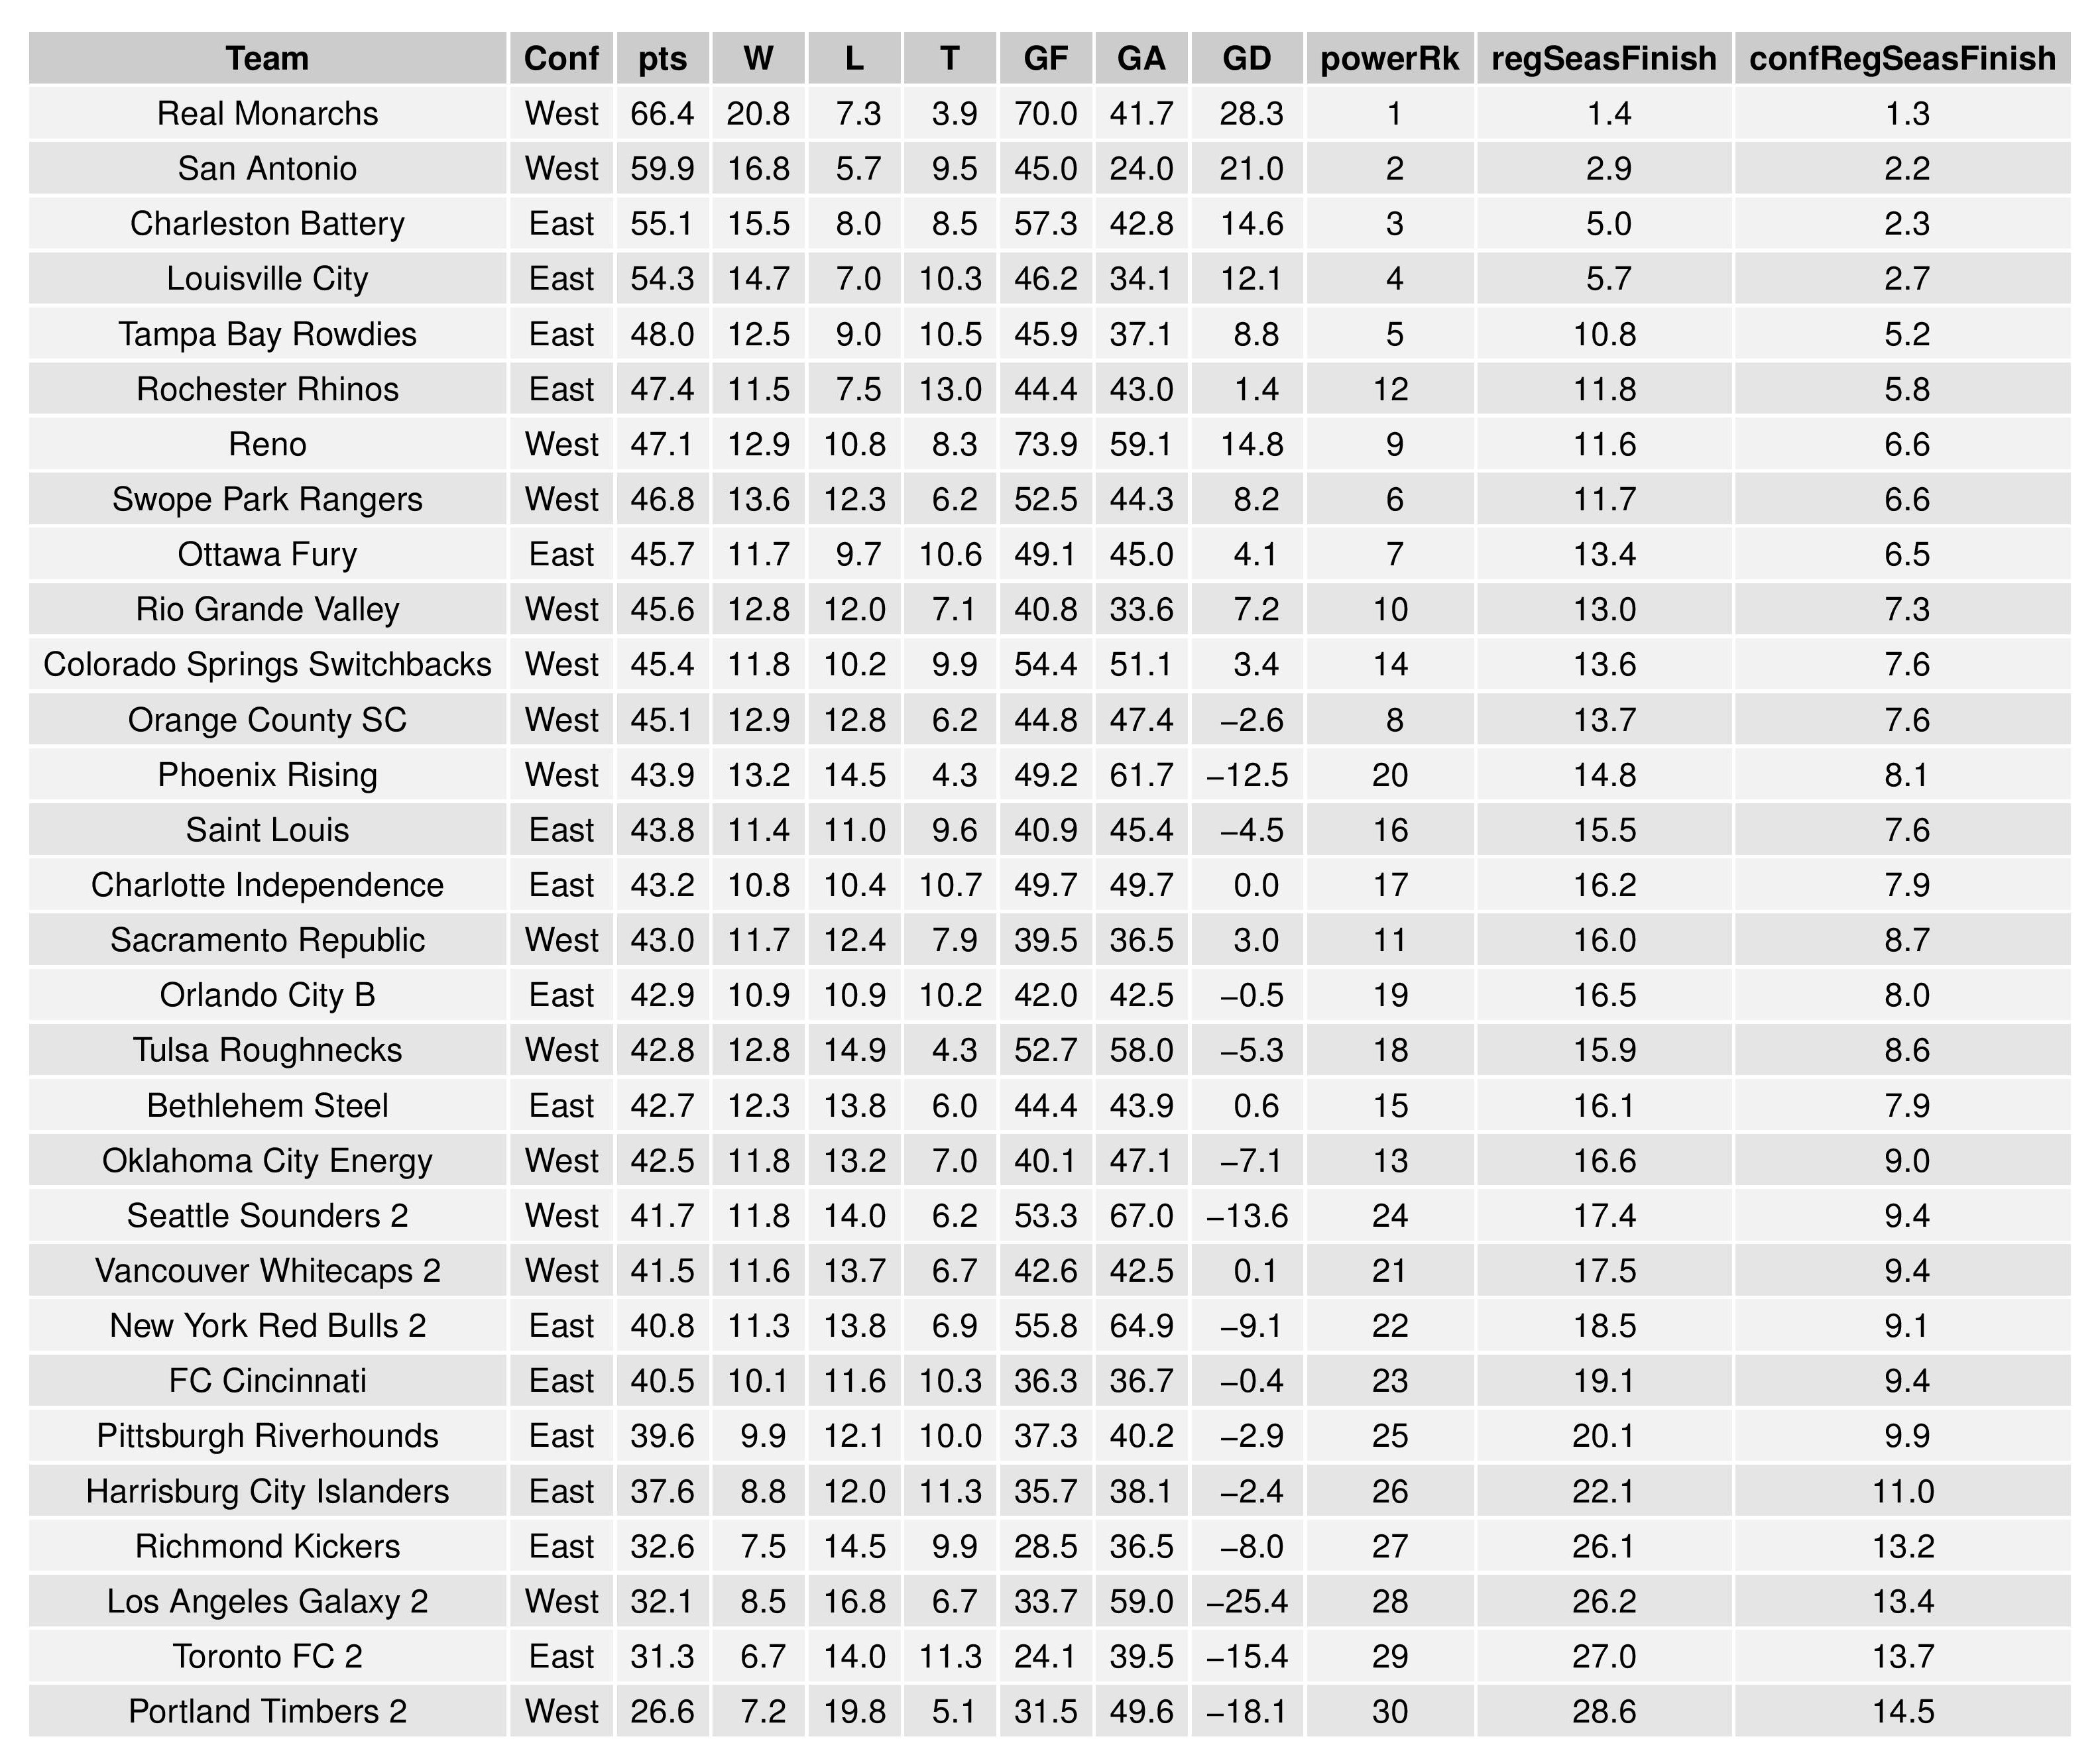
SEBA has the Bethlehem Steel increase from 24th to 15th. It has Harrisburg City decreasing from 25th to 26th.
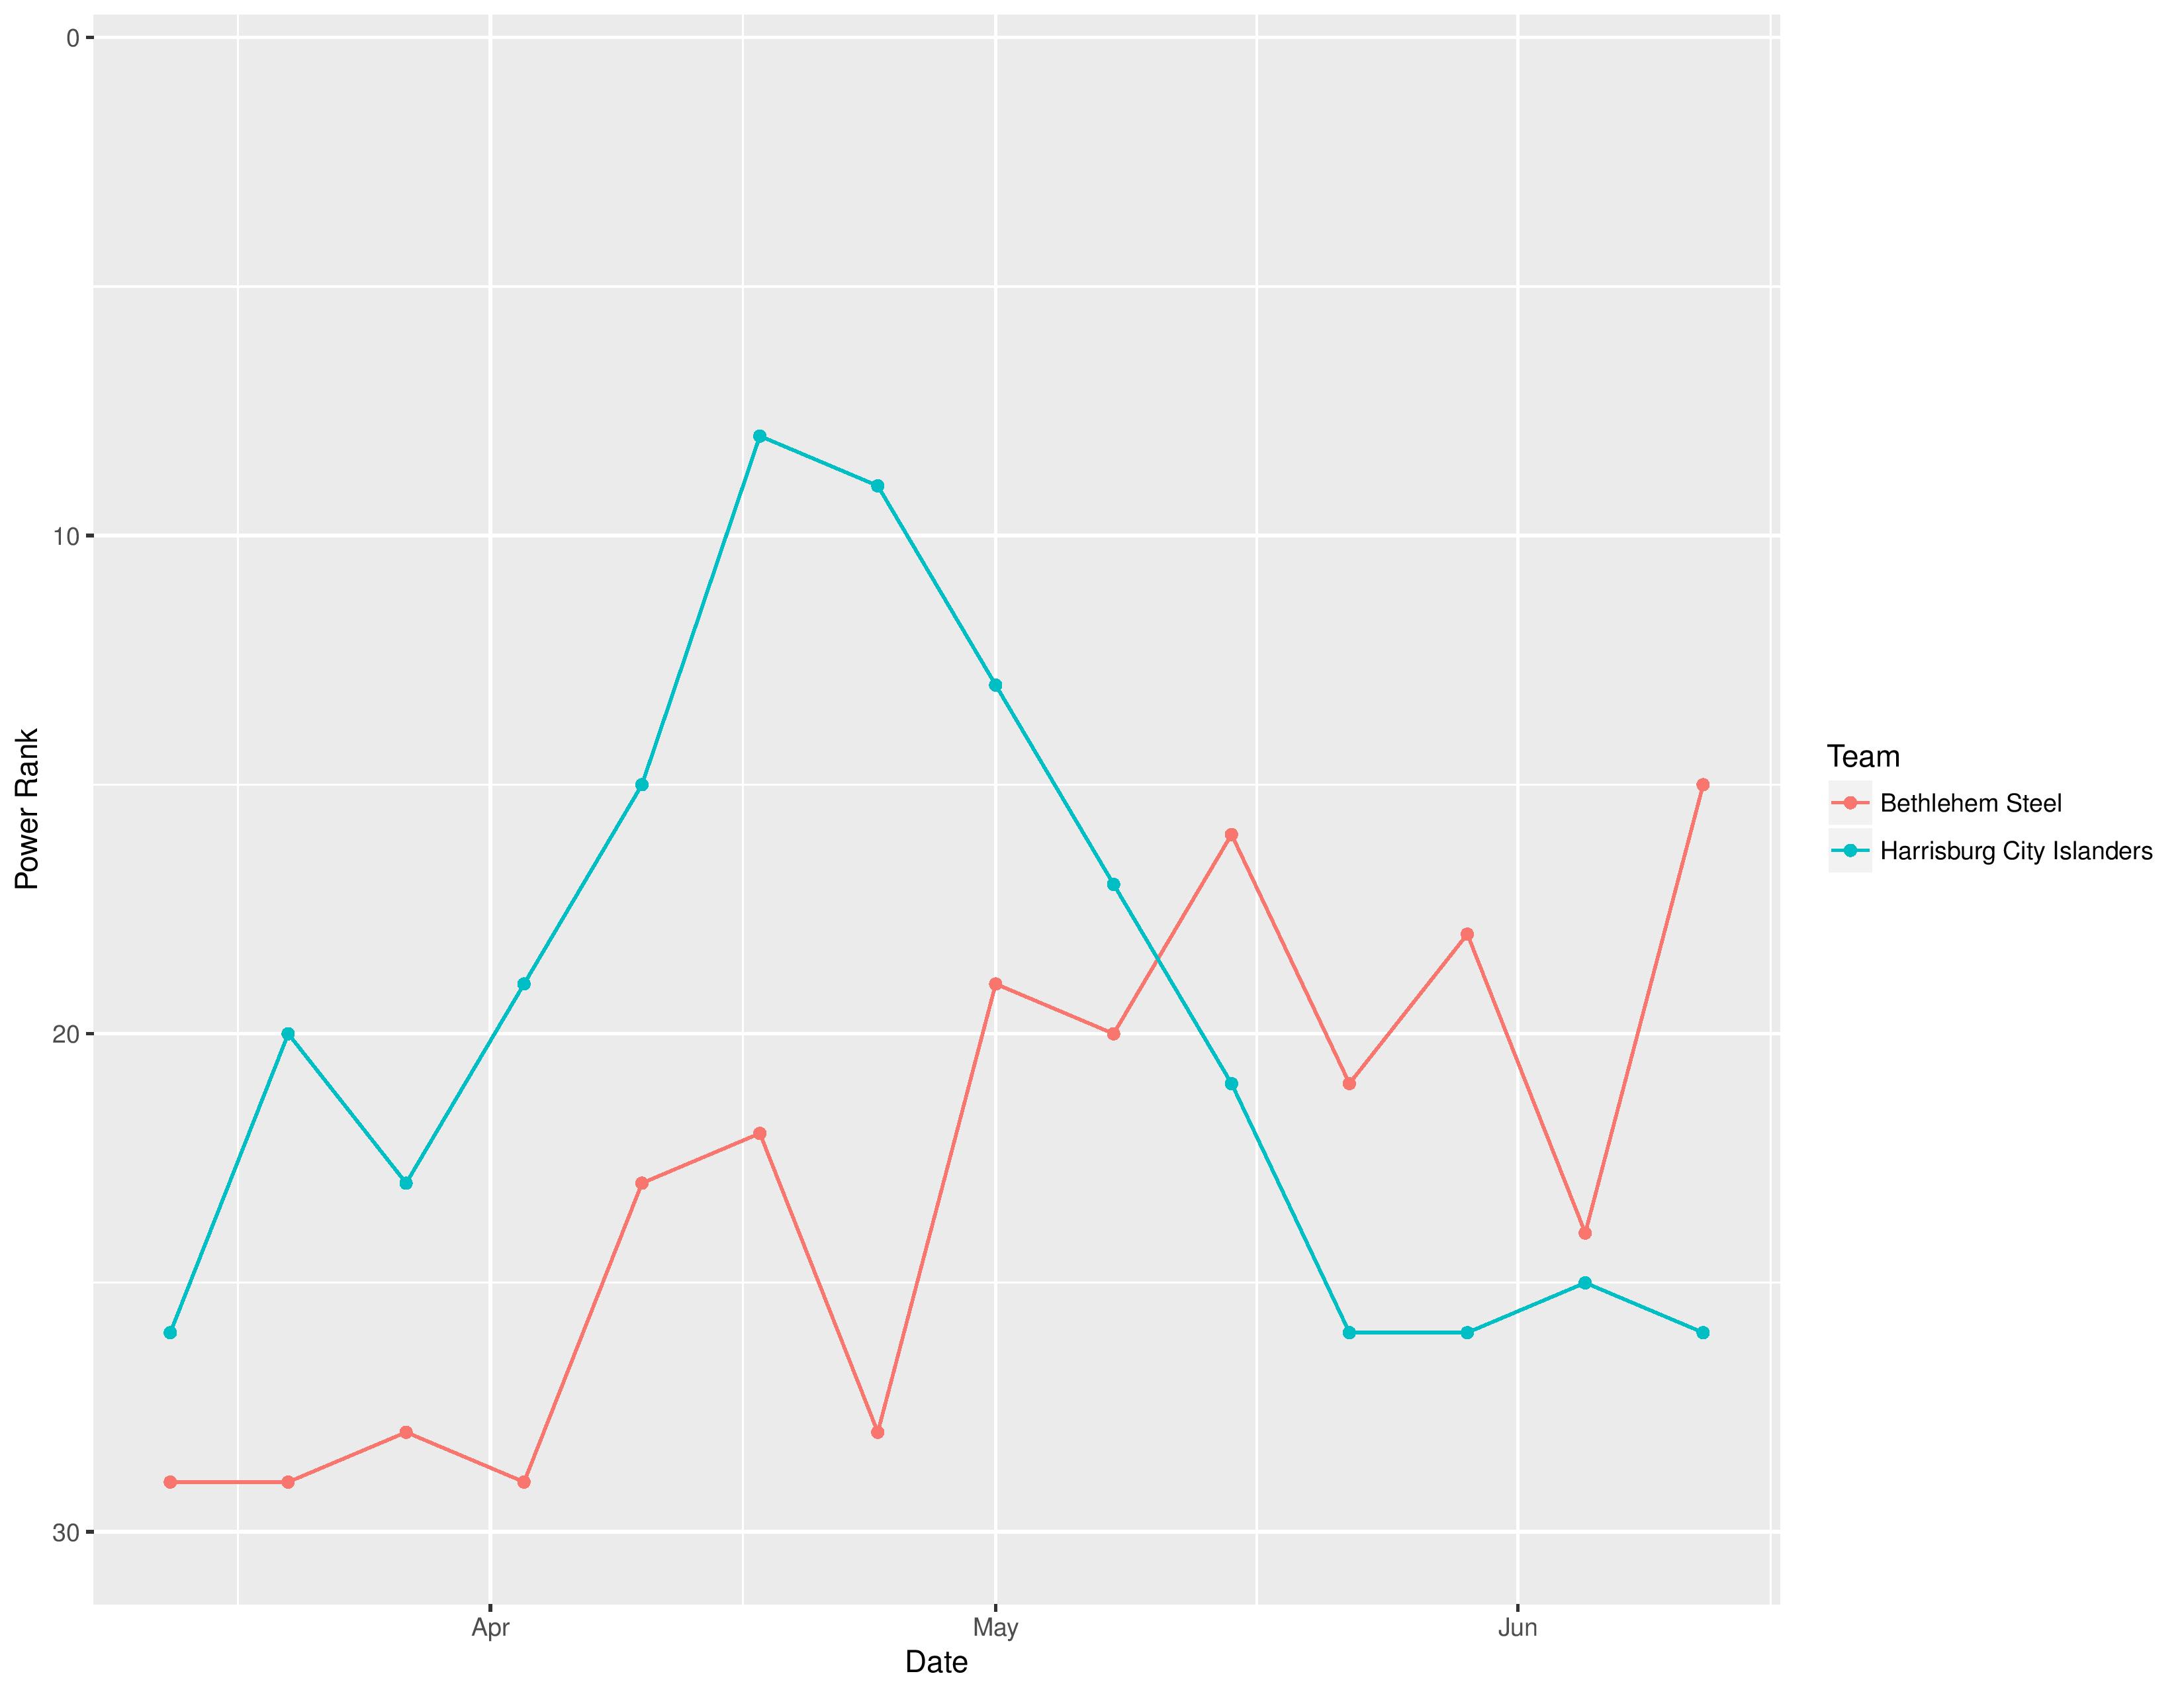
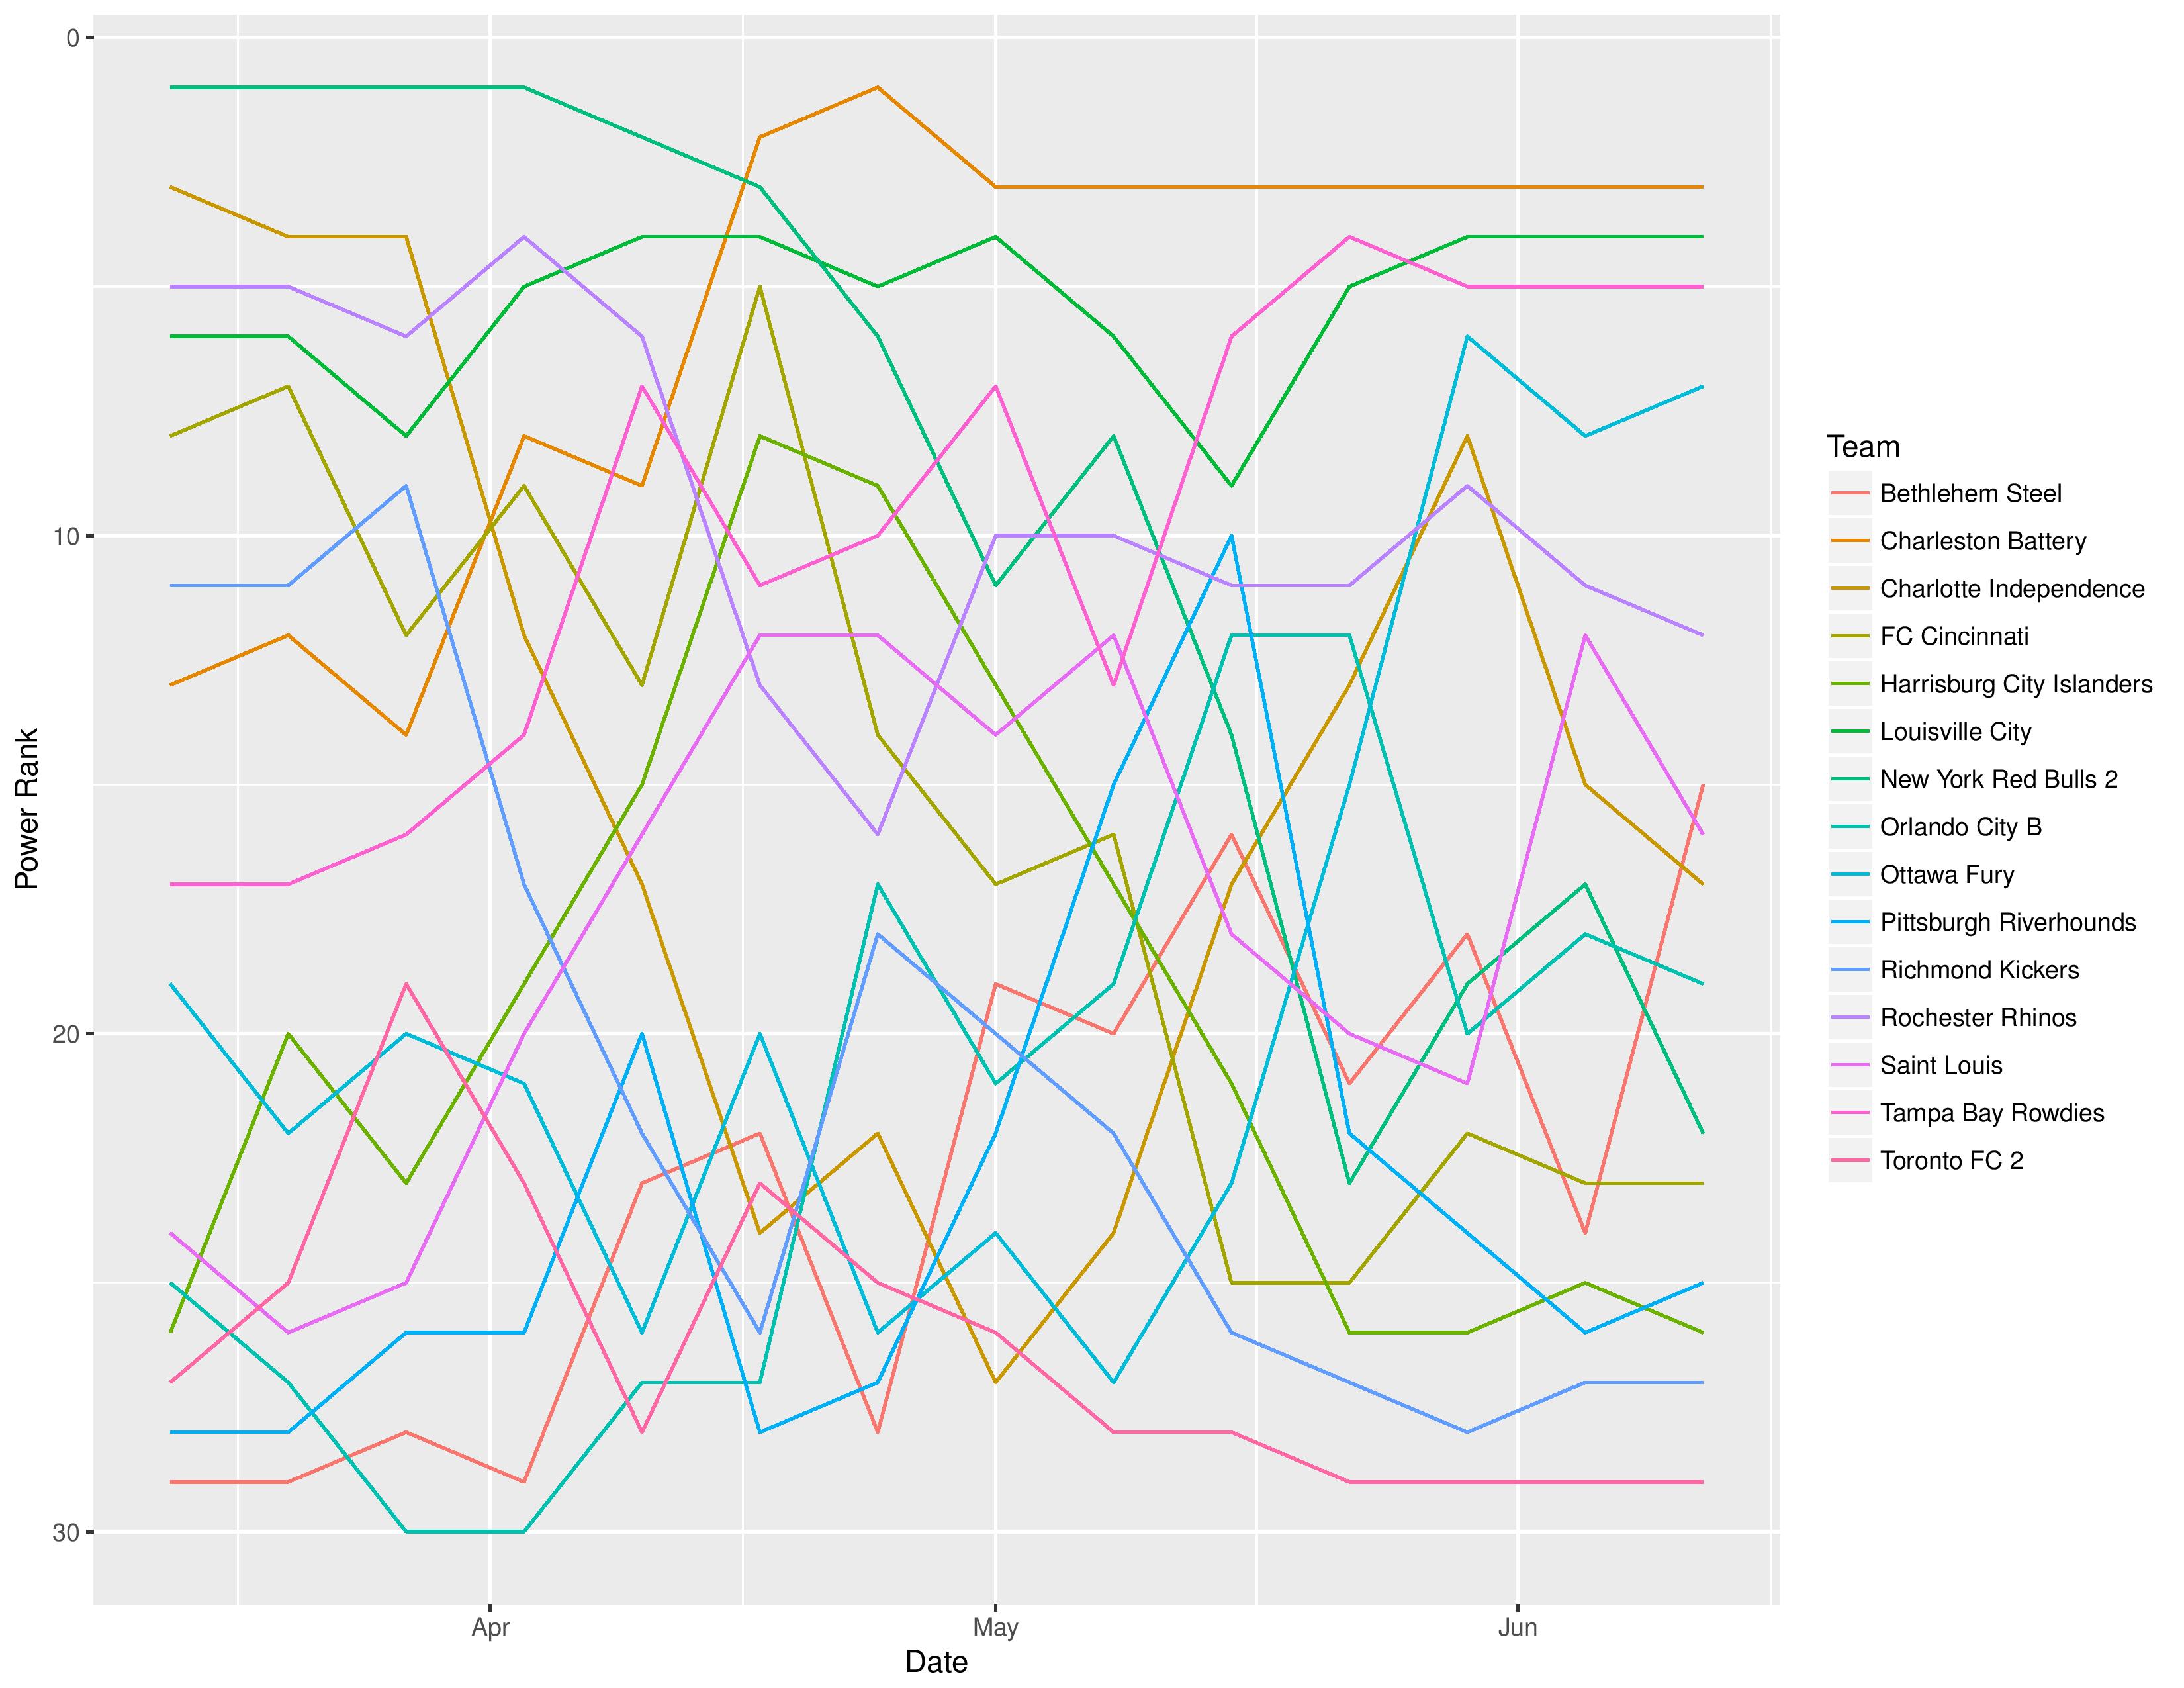
The following shows the evolution of SEBA’s power rankings for the USL East over time.
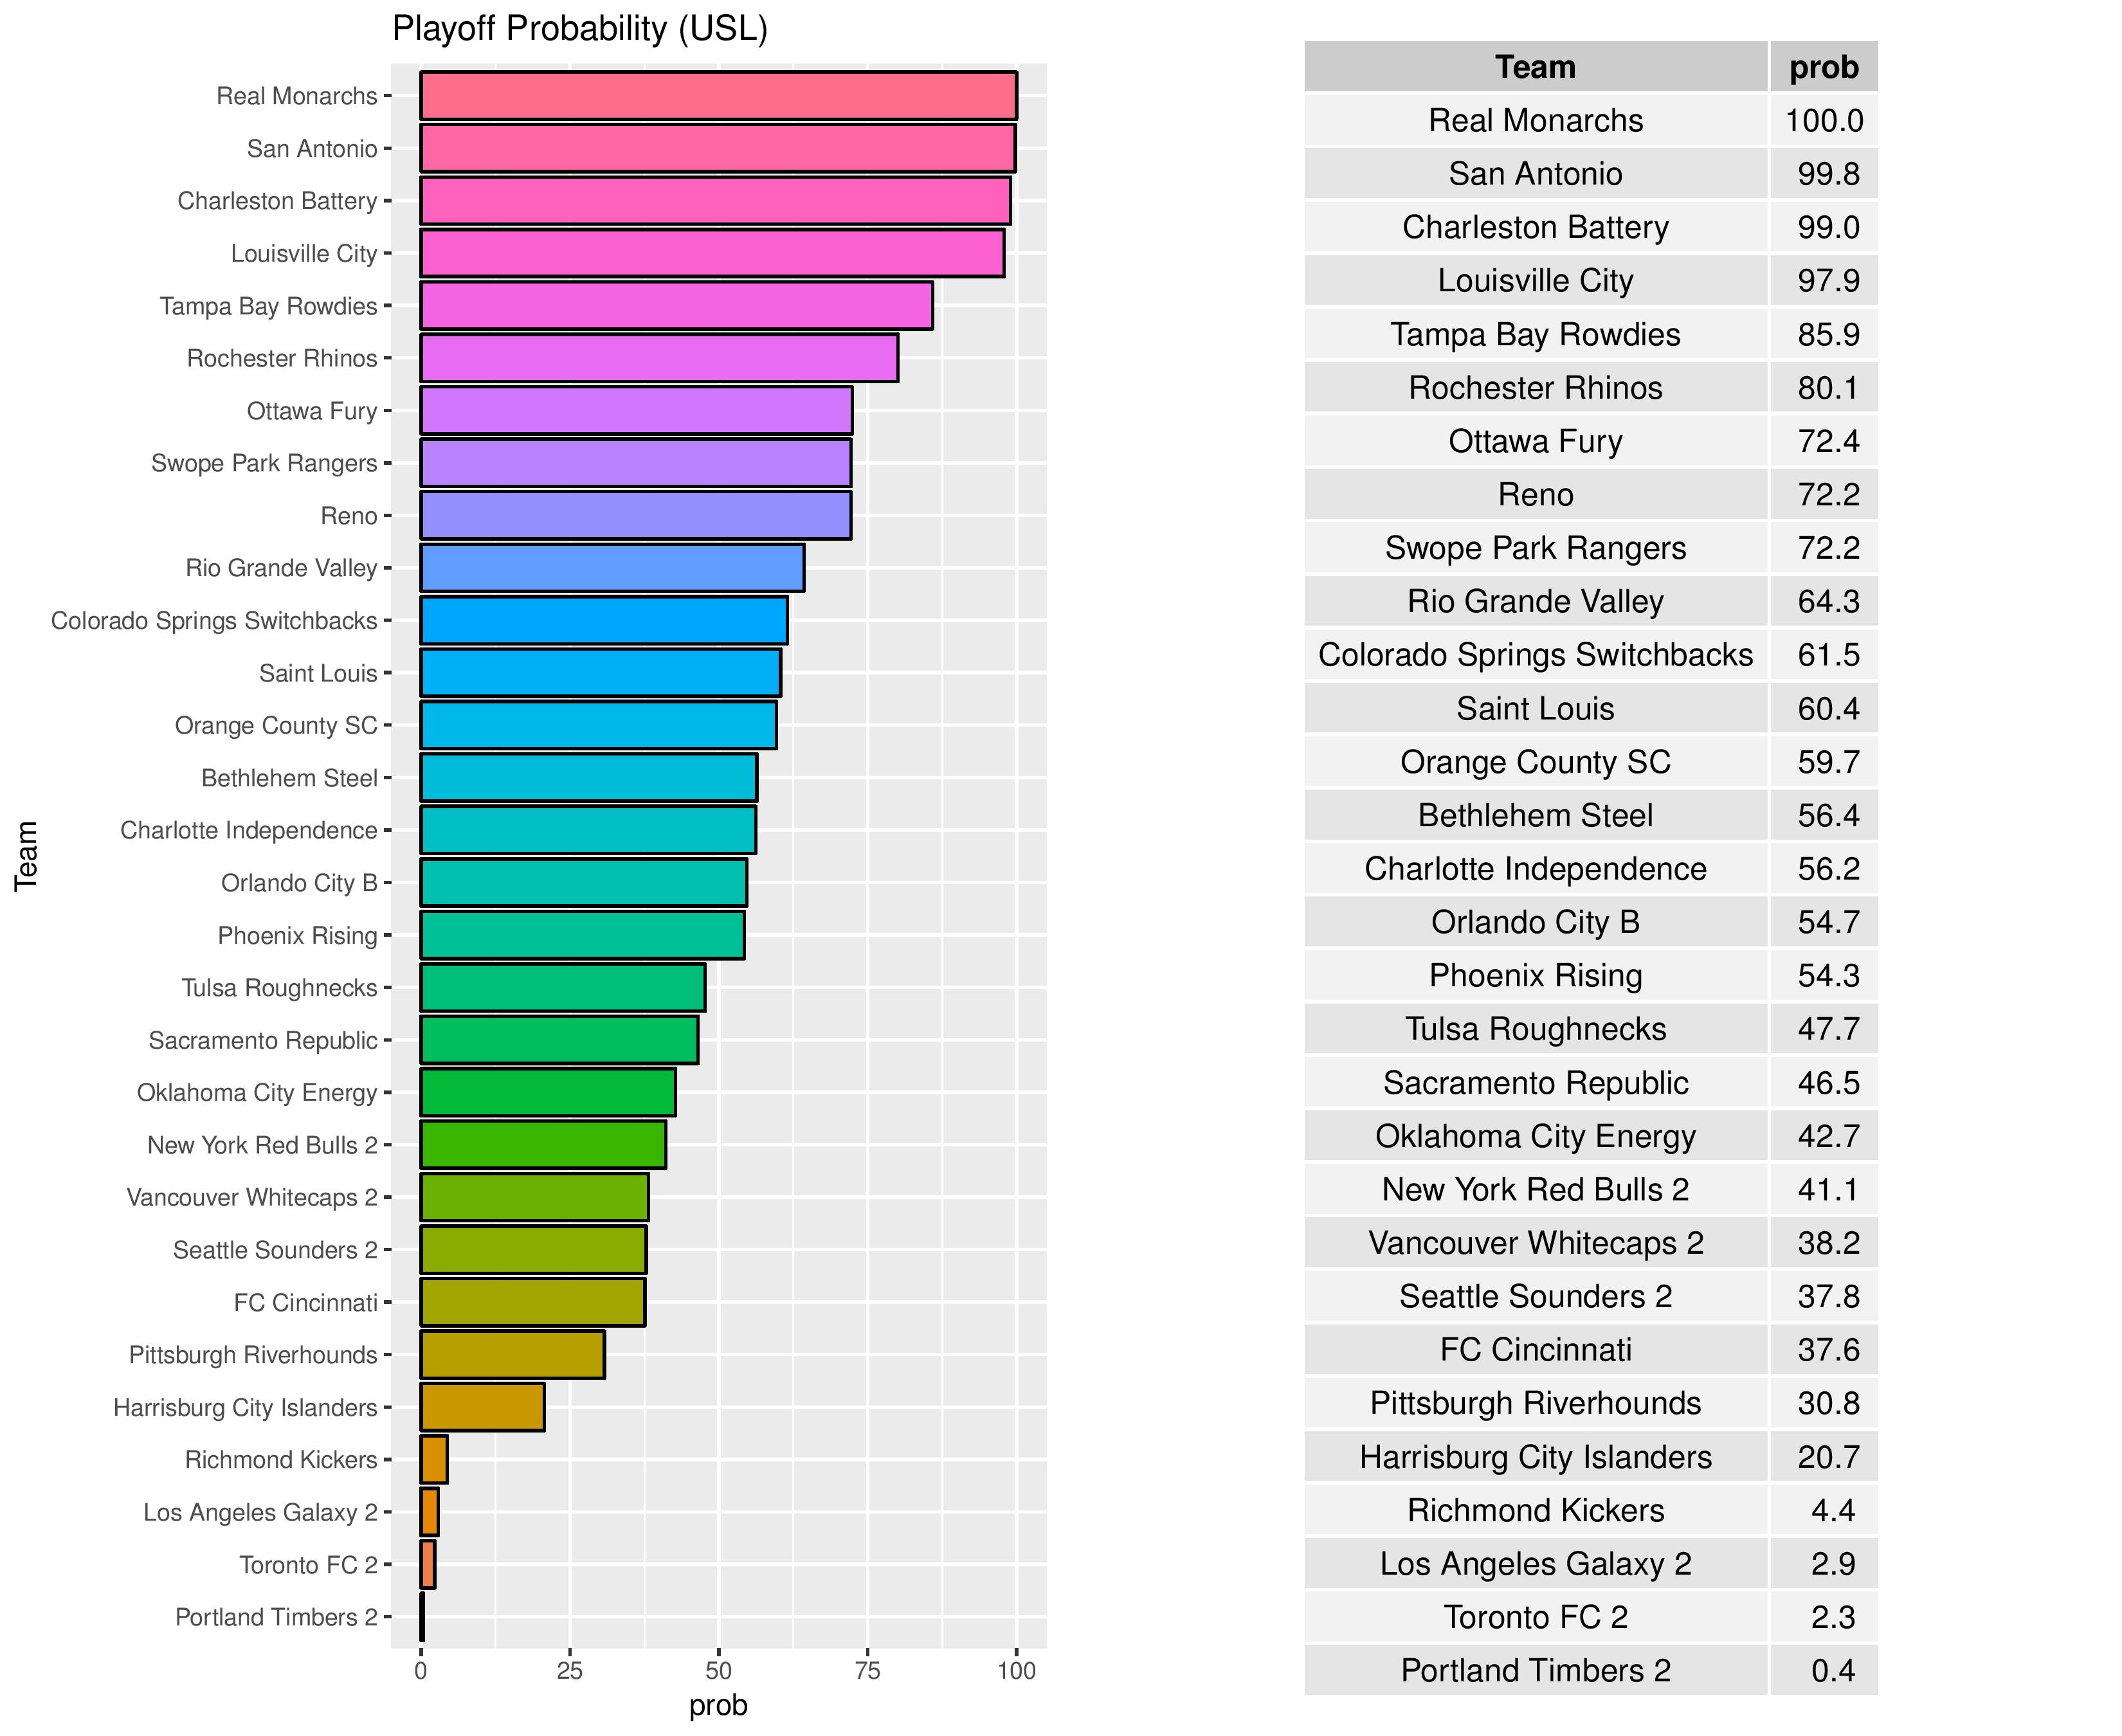
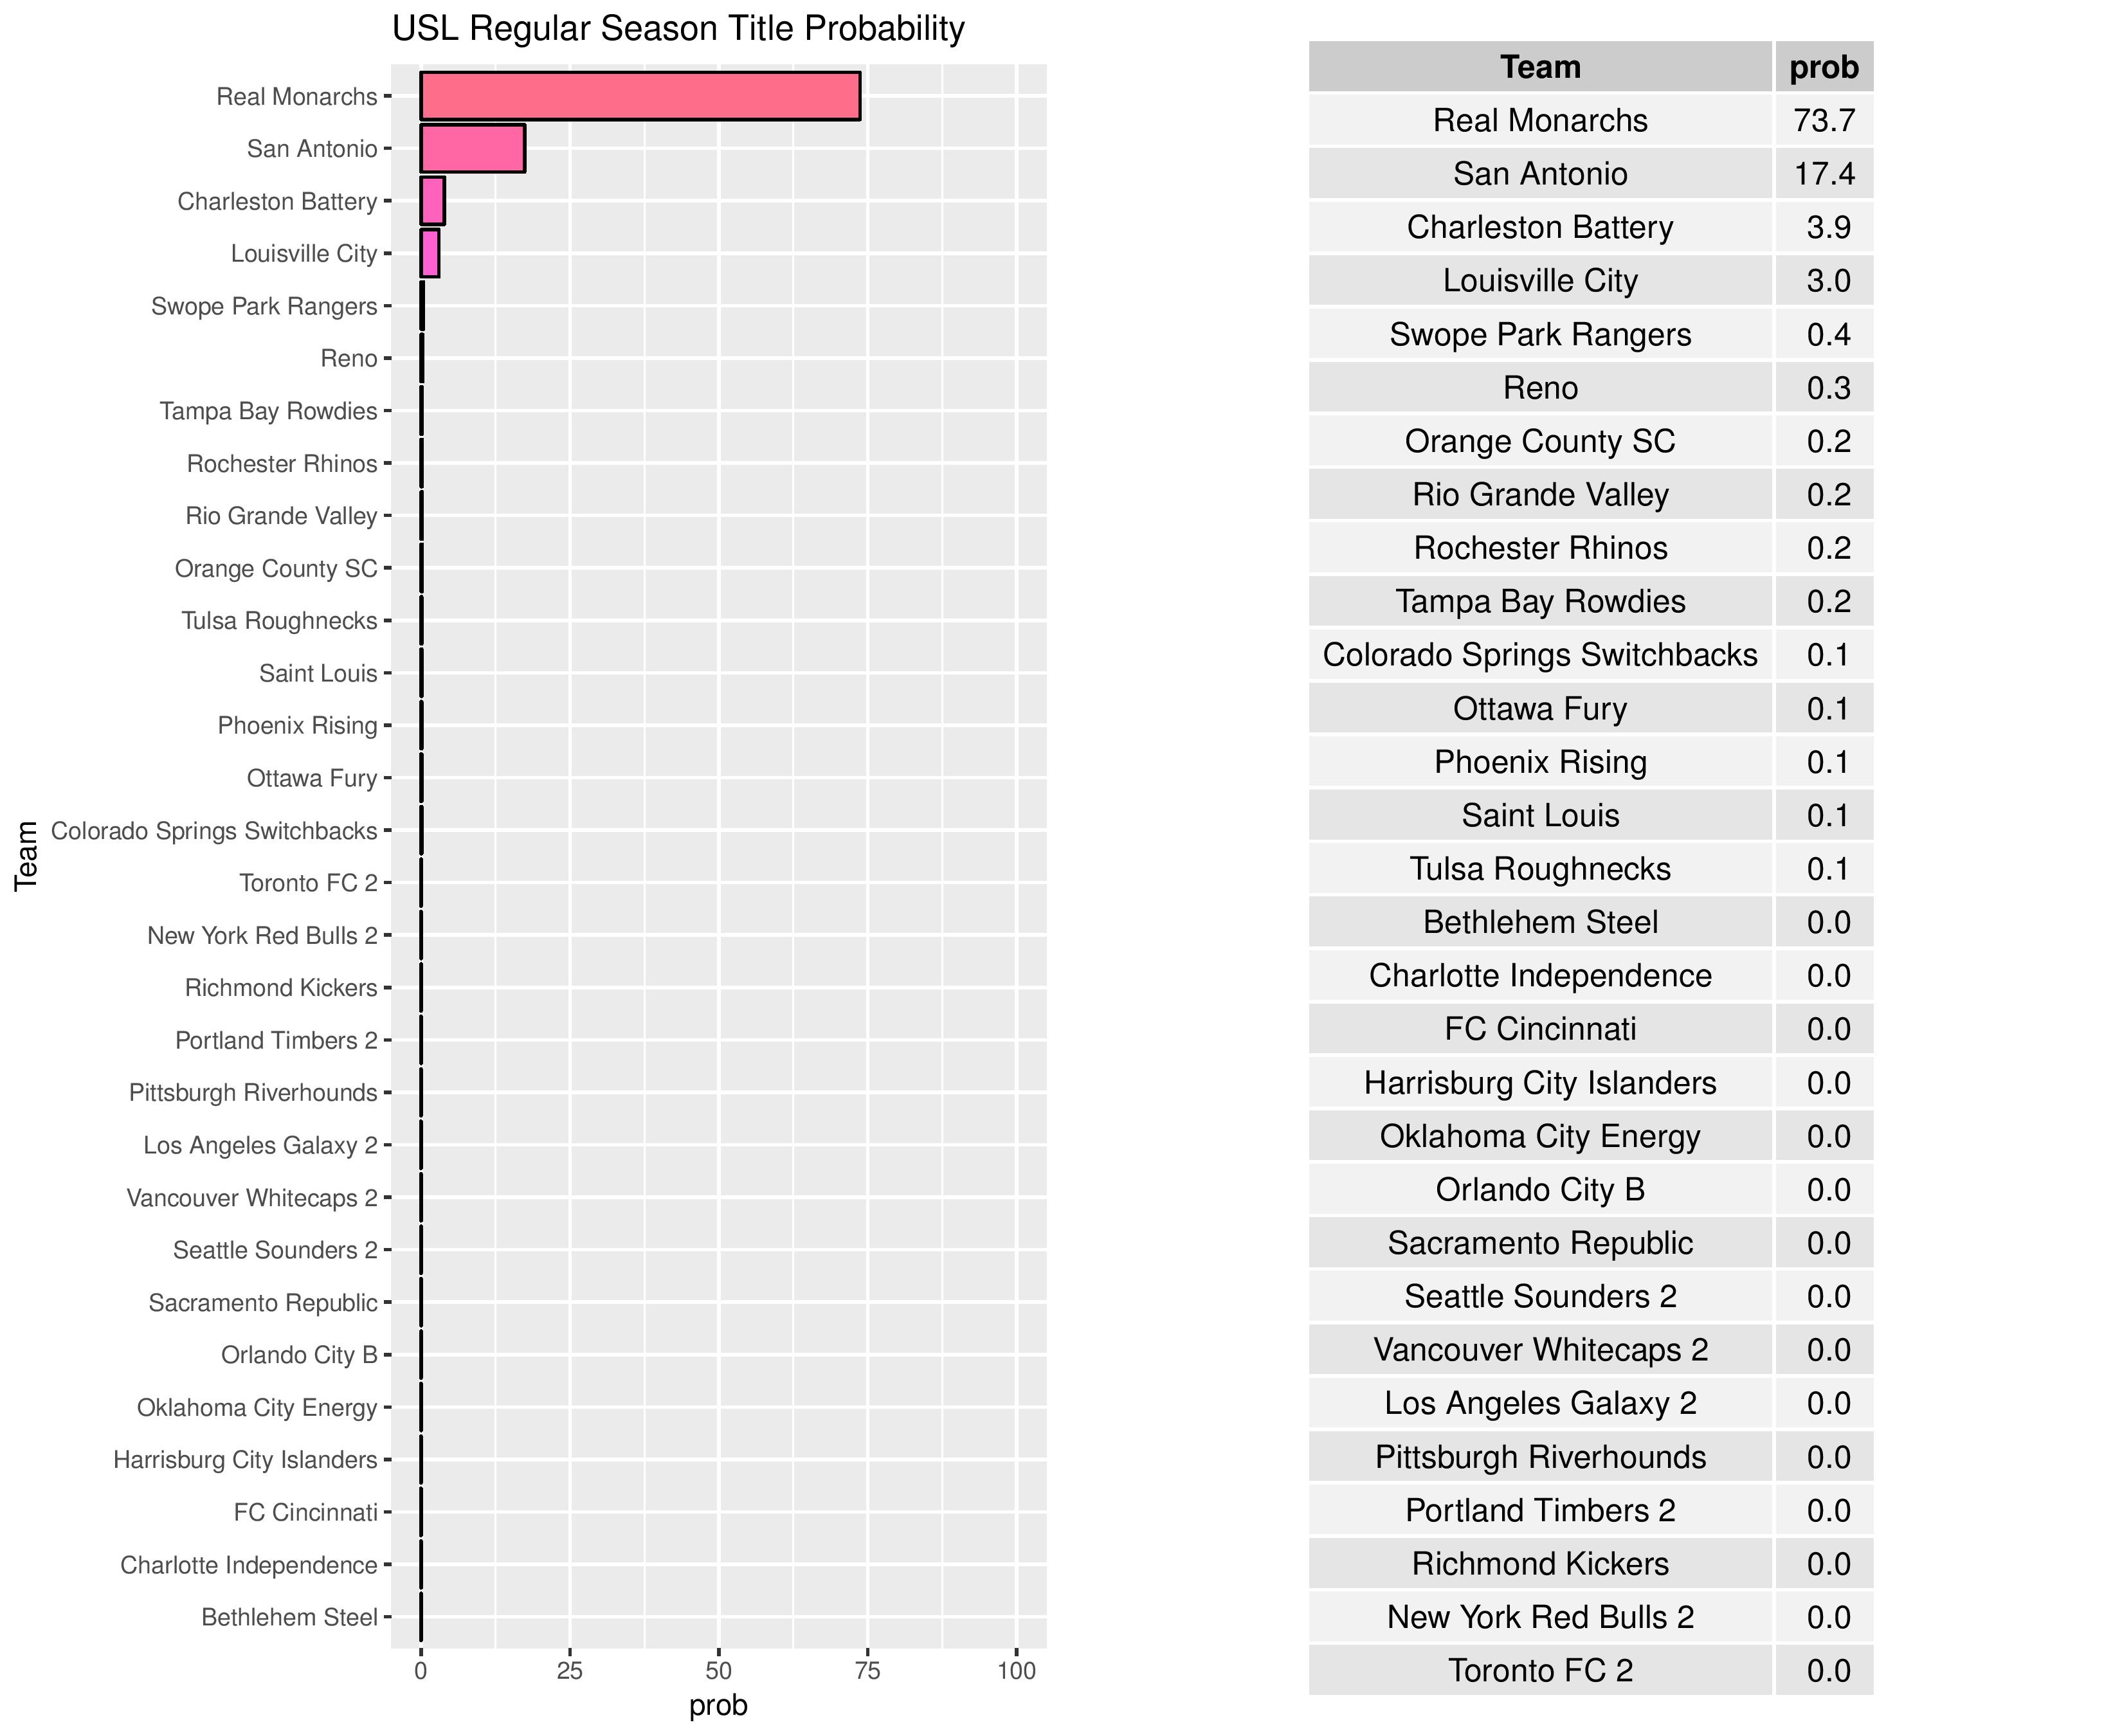
Playoffs probability and more
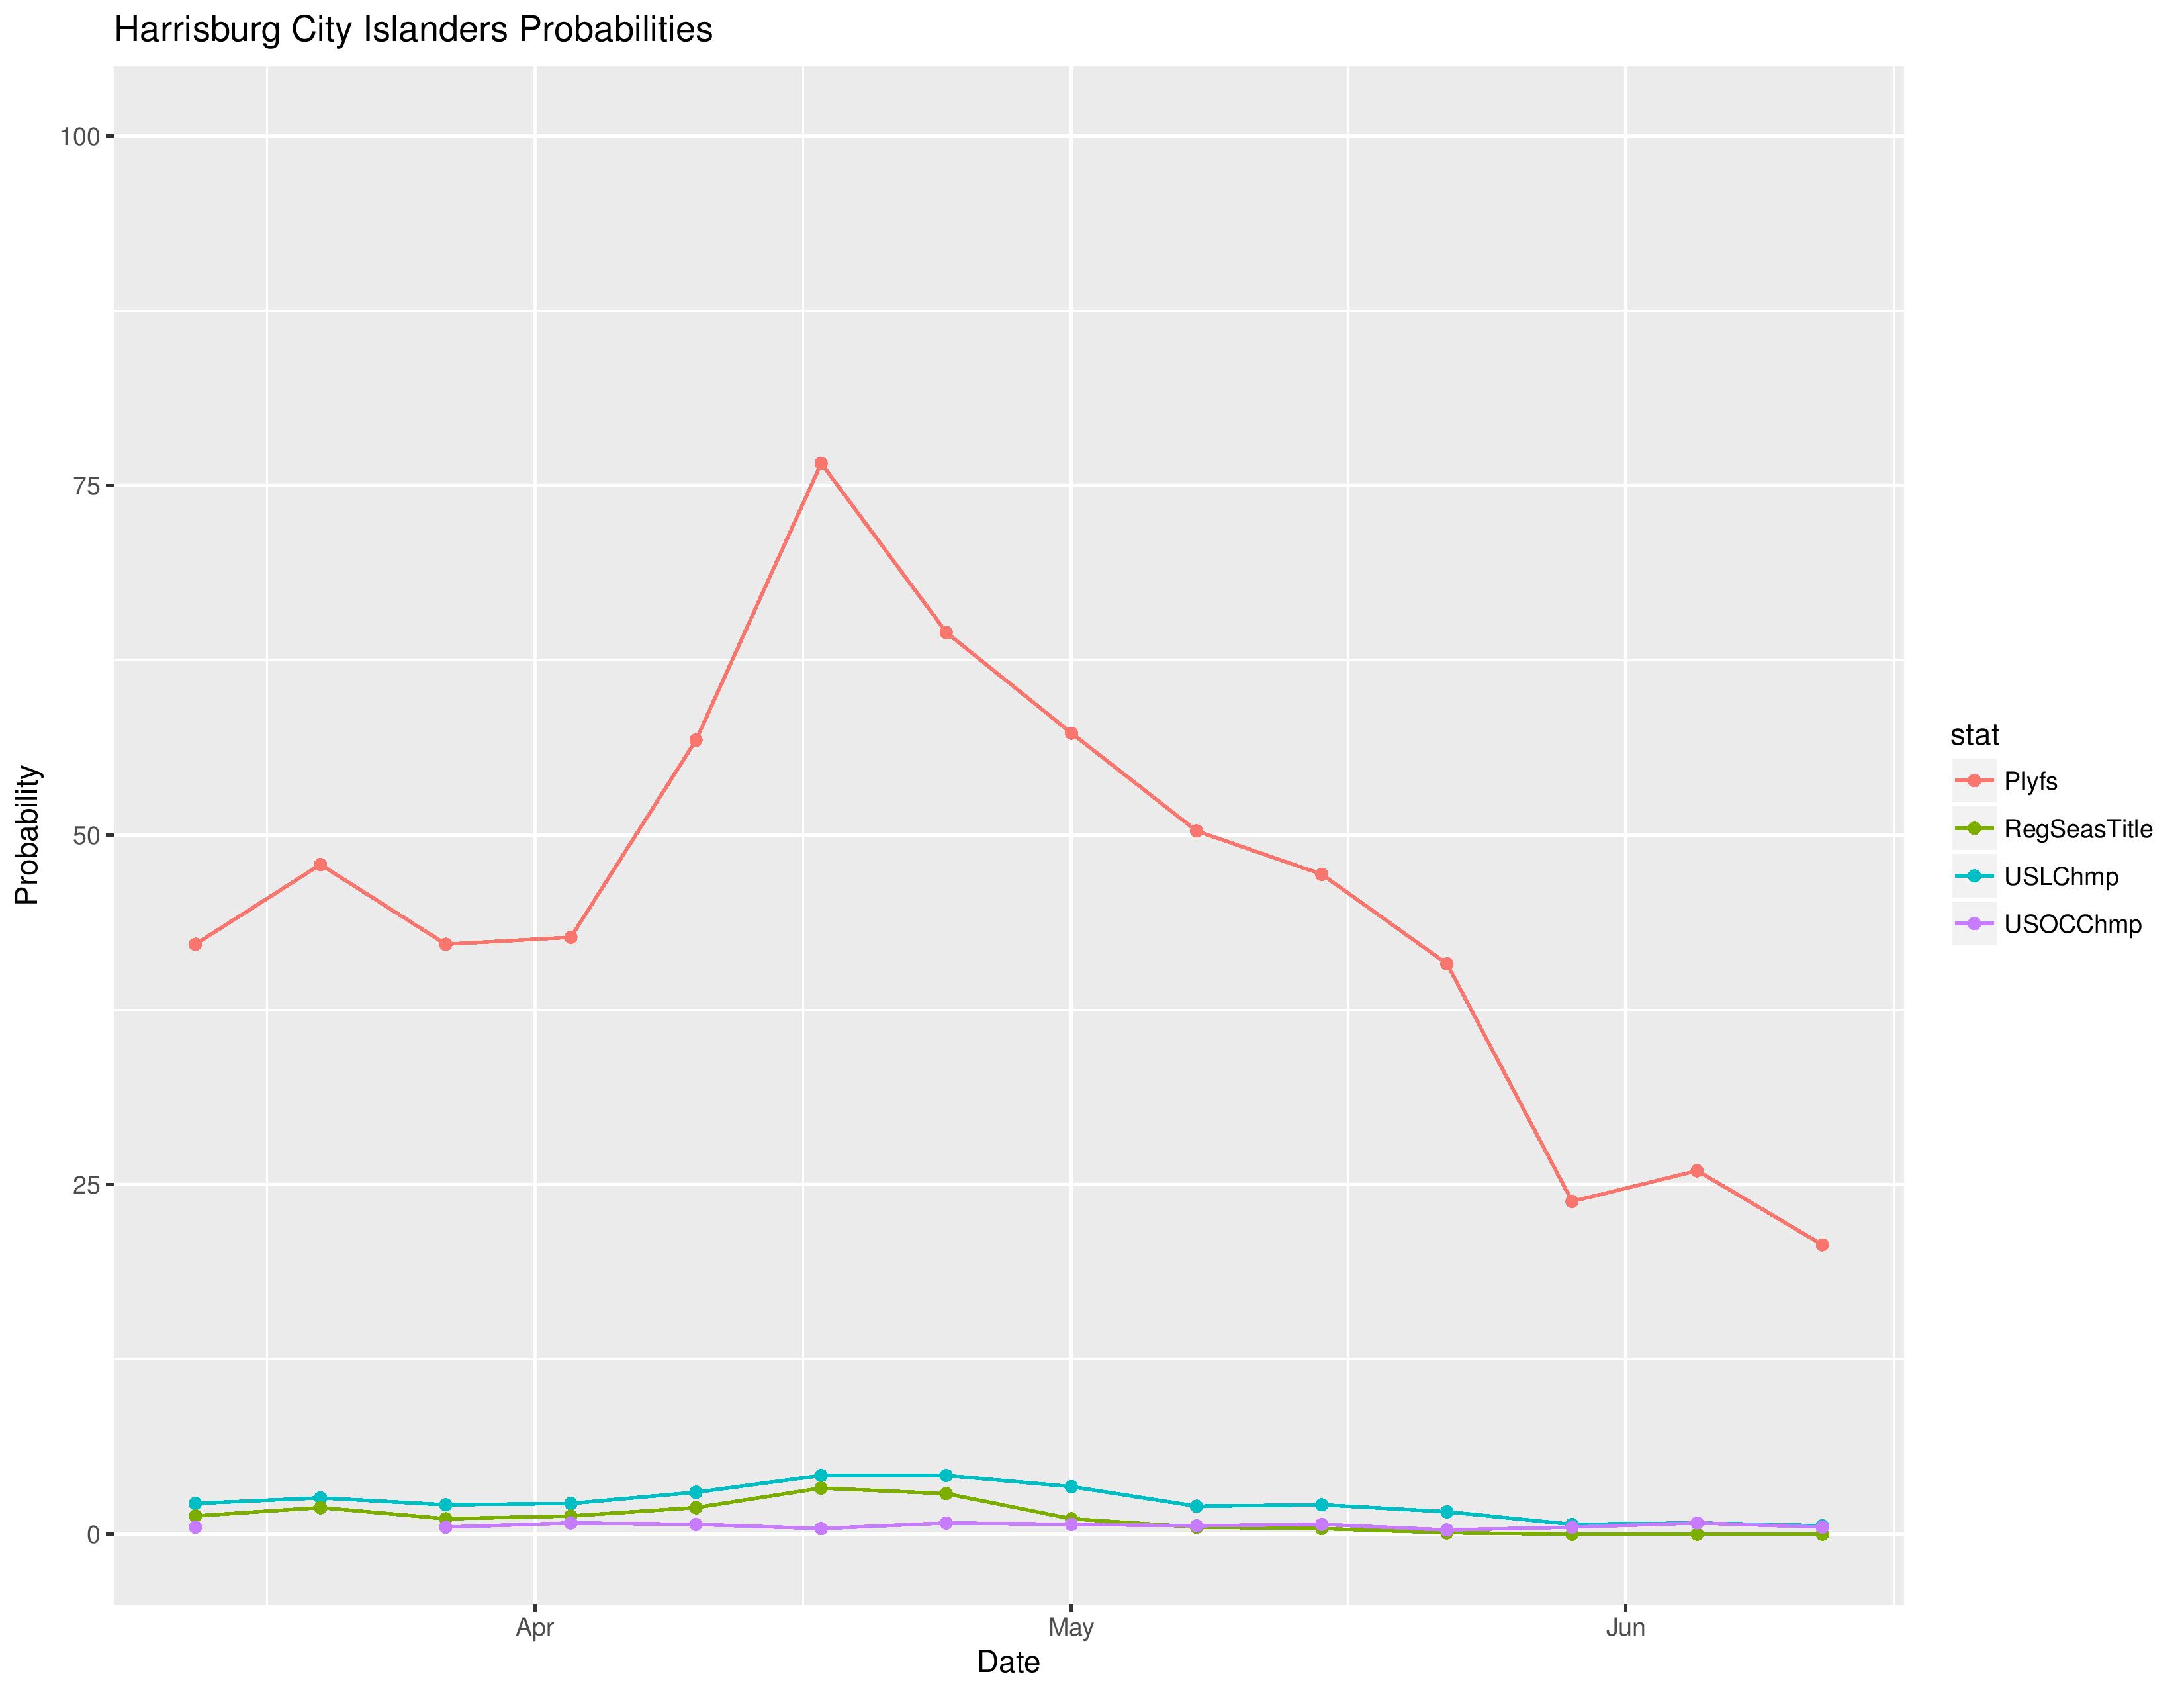
Bethlehem’s playoff odds have increased from 36.8% to 56.4% and Harrisburg City’s odds of making the playoffs have decreased from 26.0% to 20.7%.
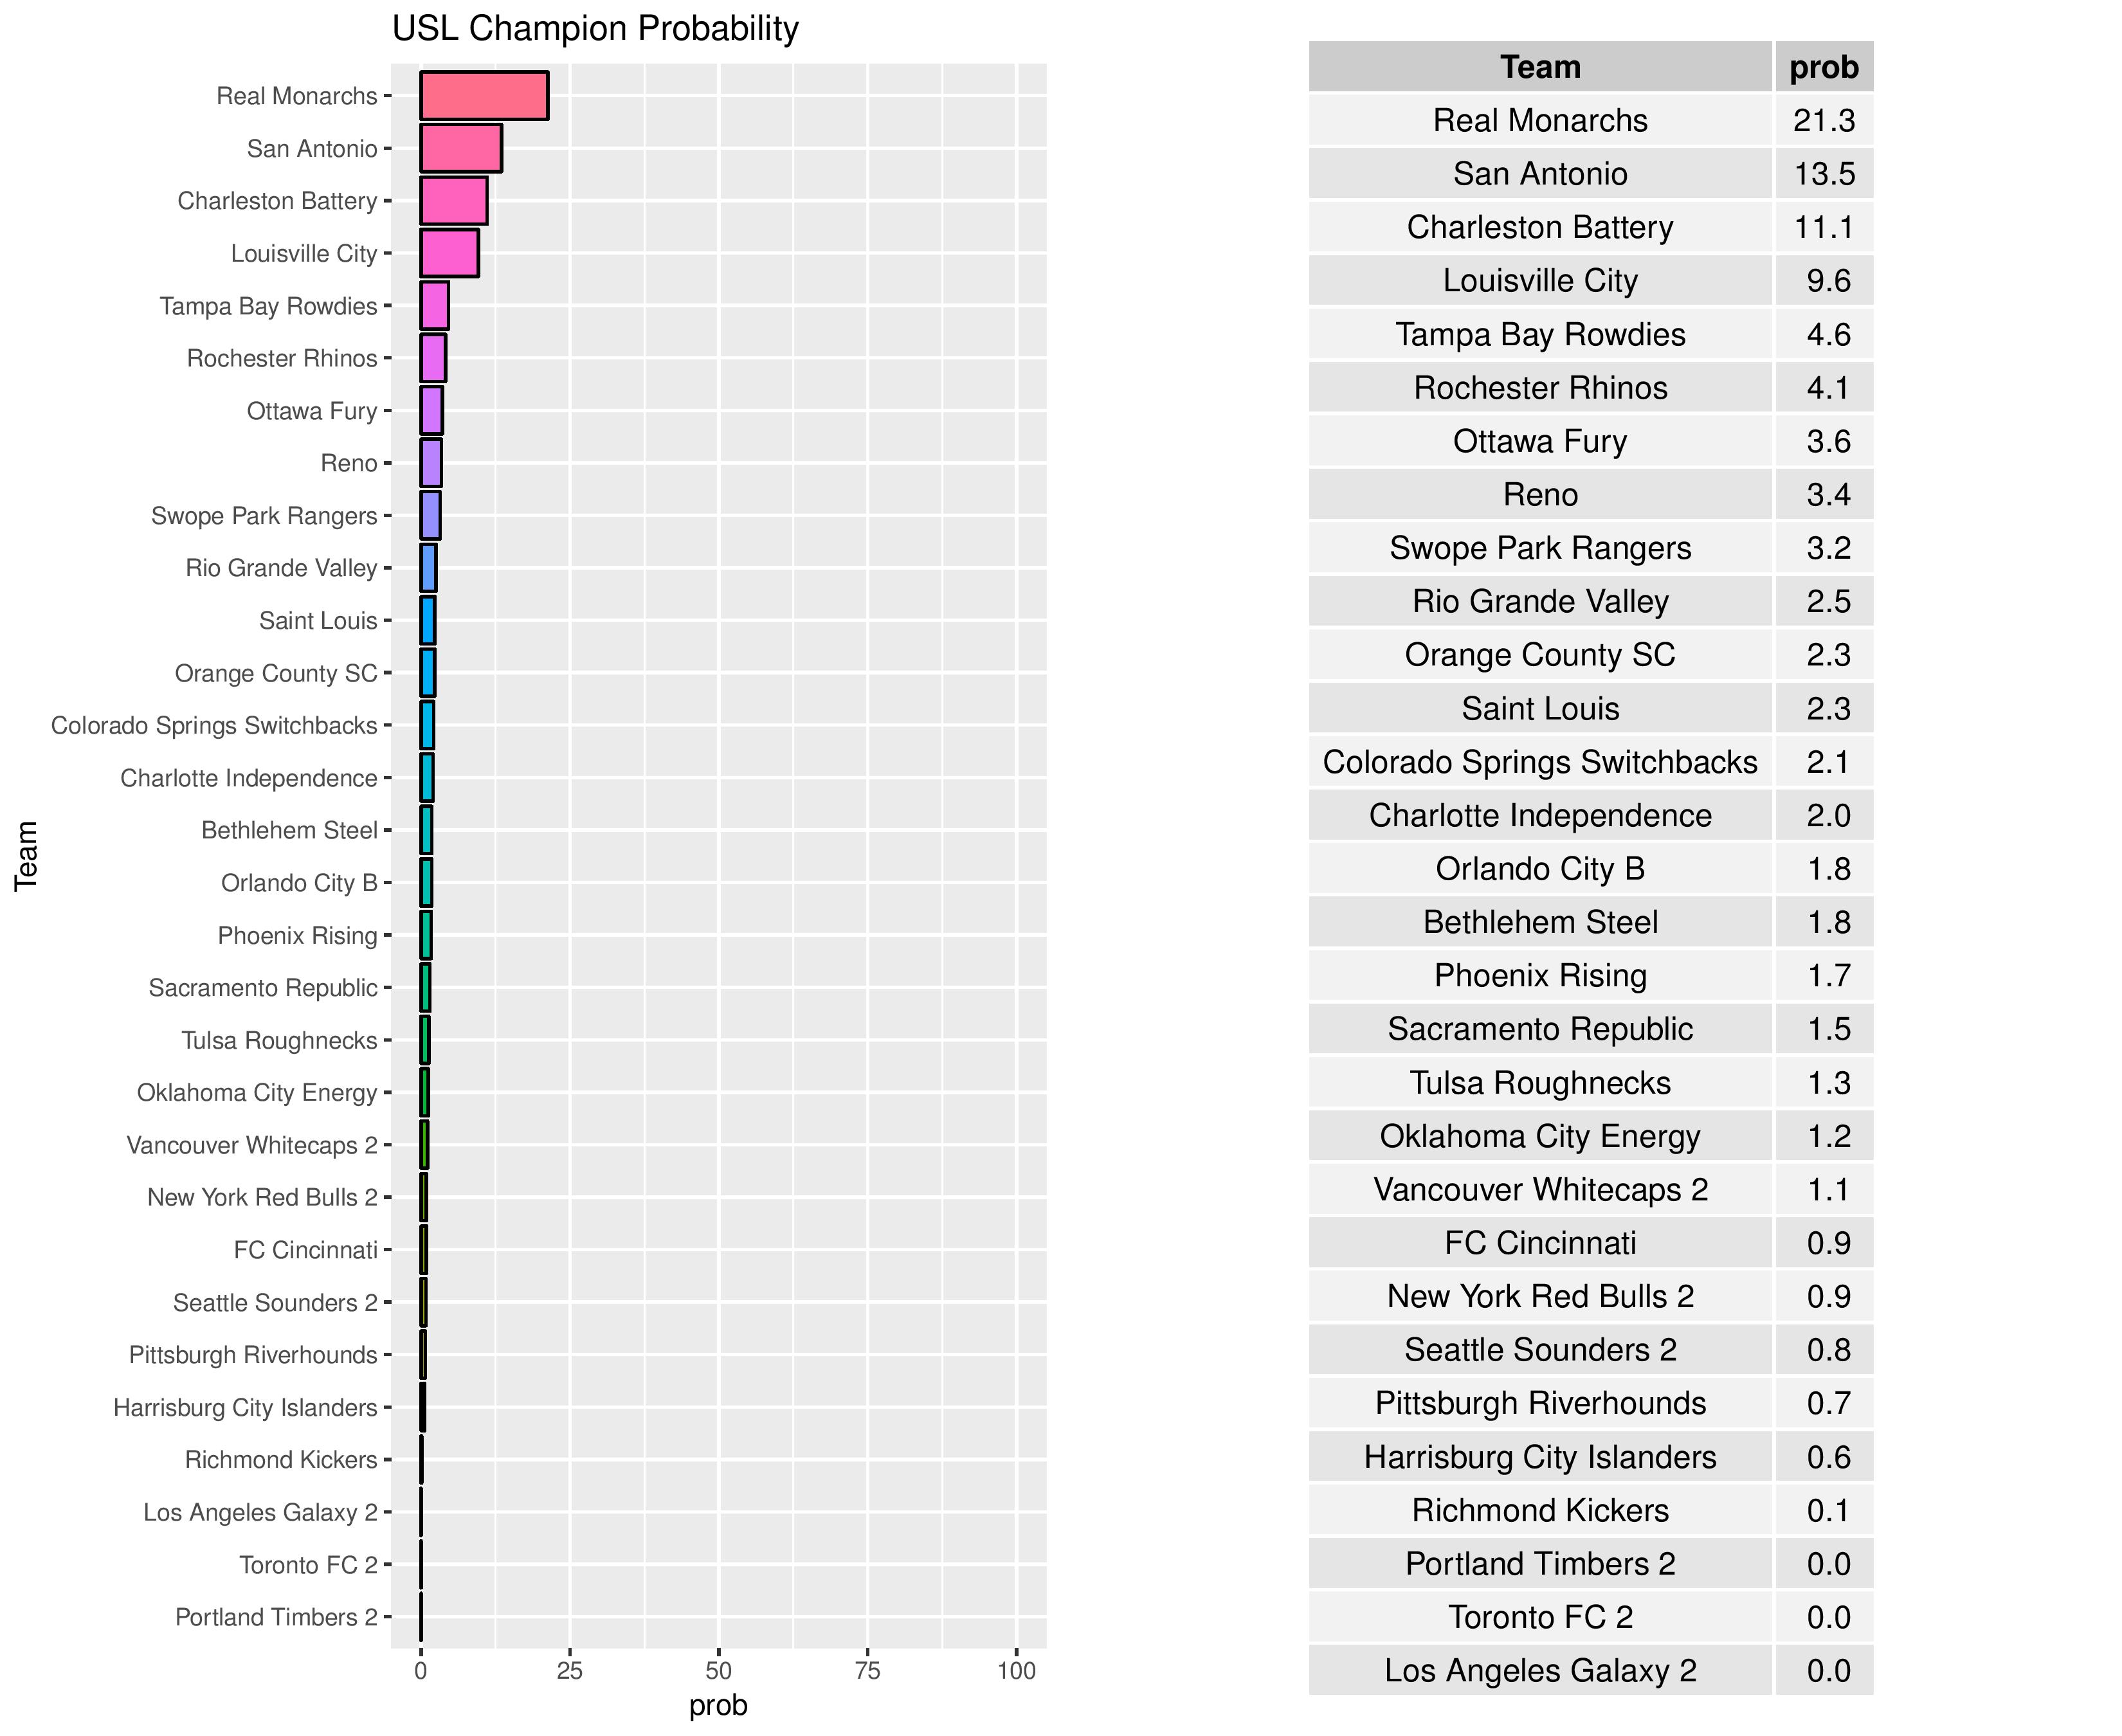
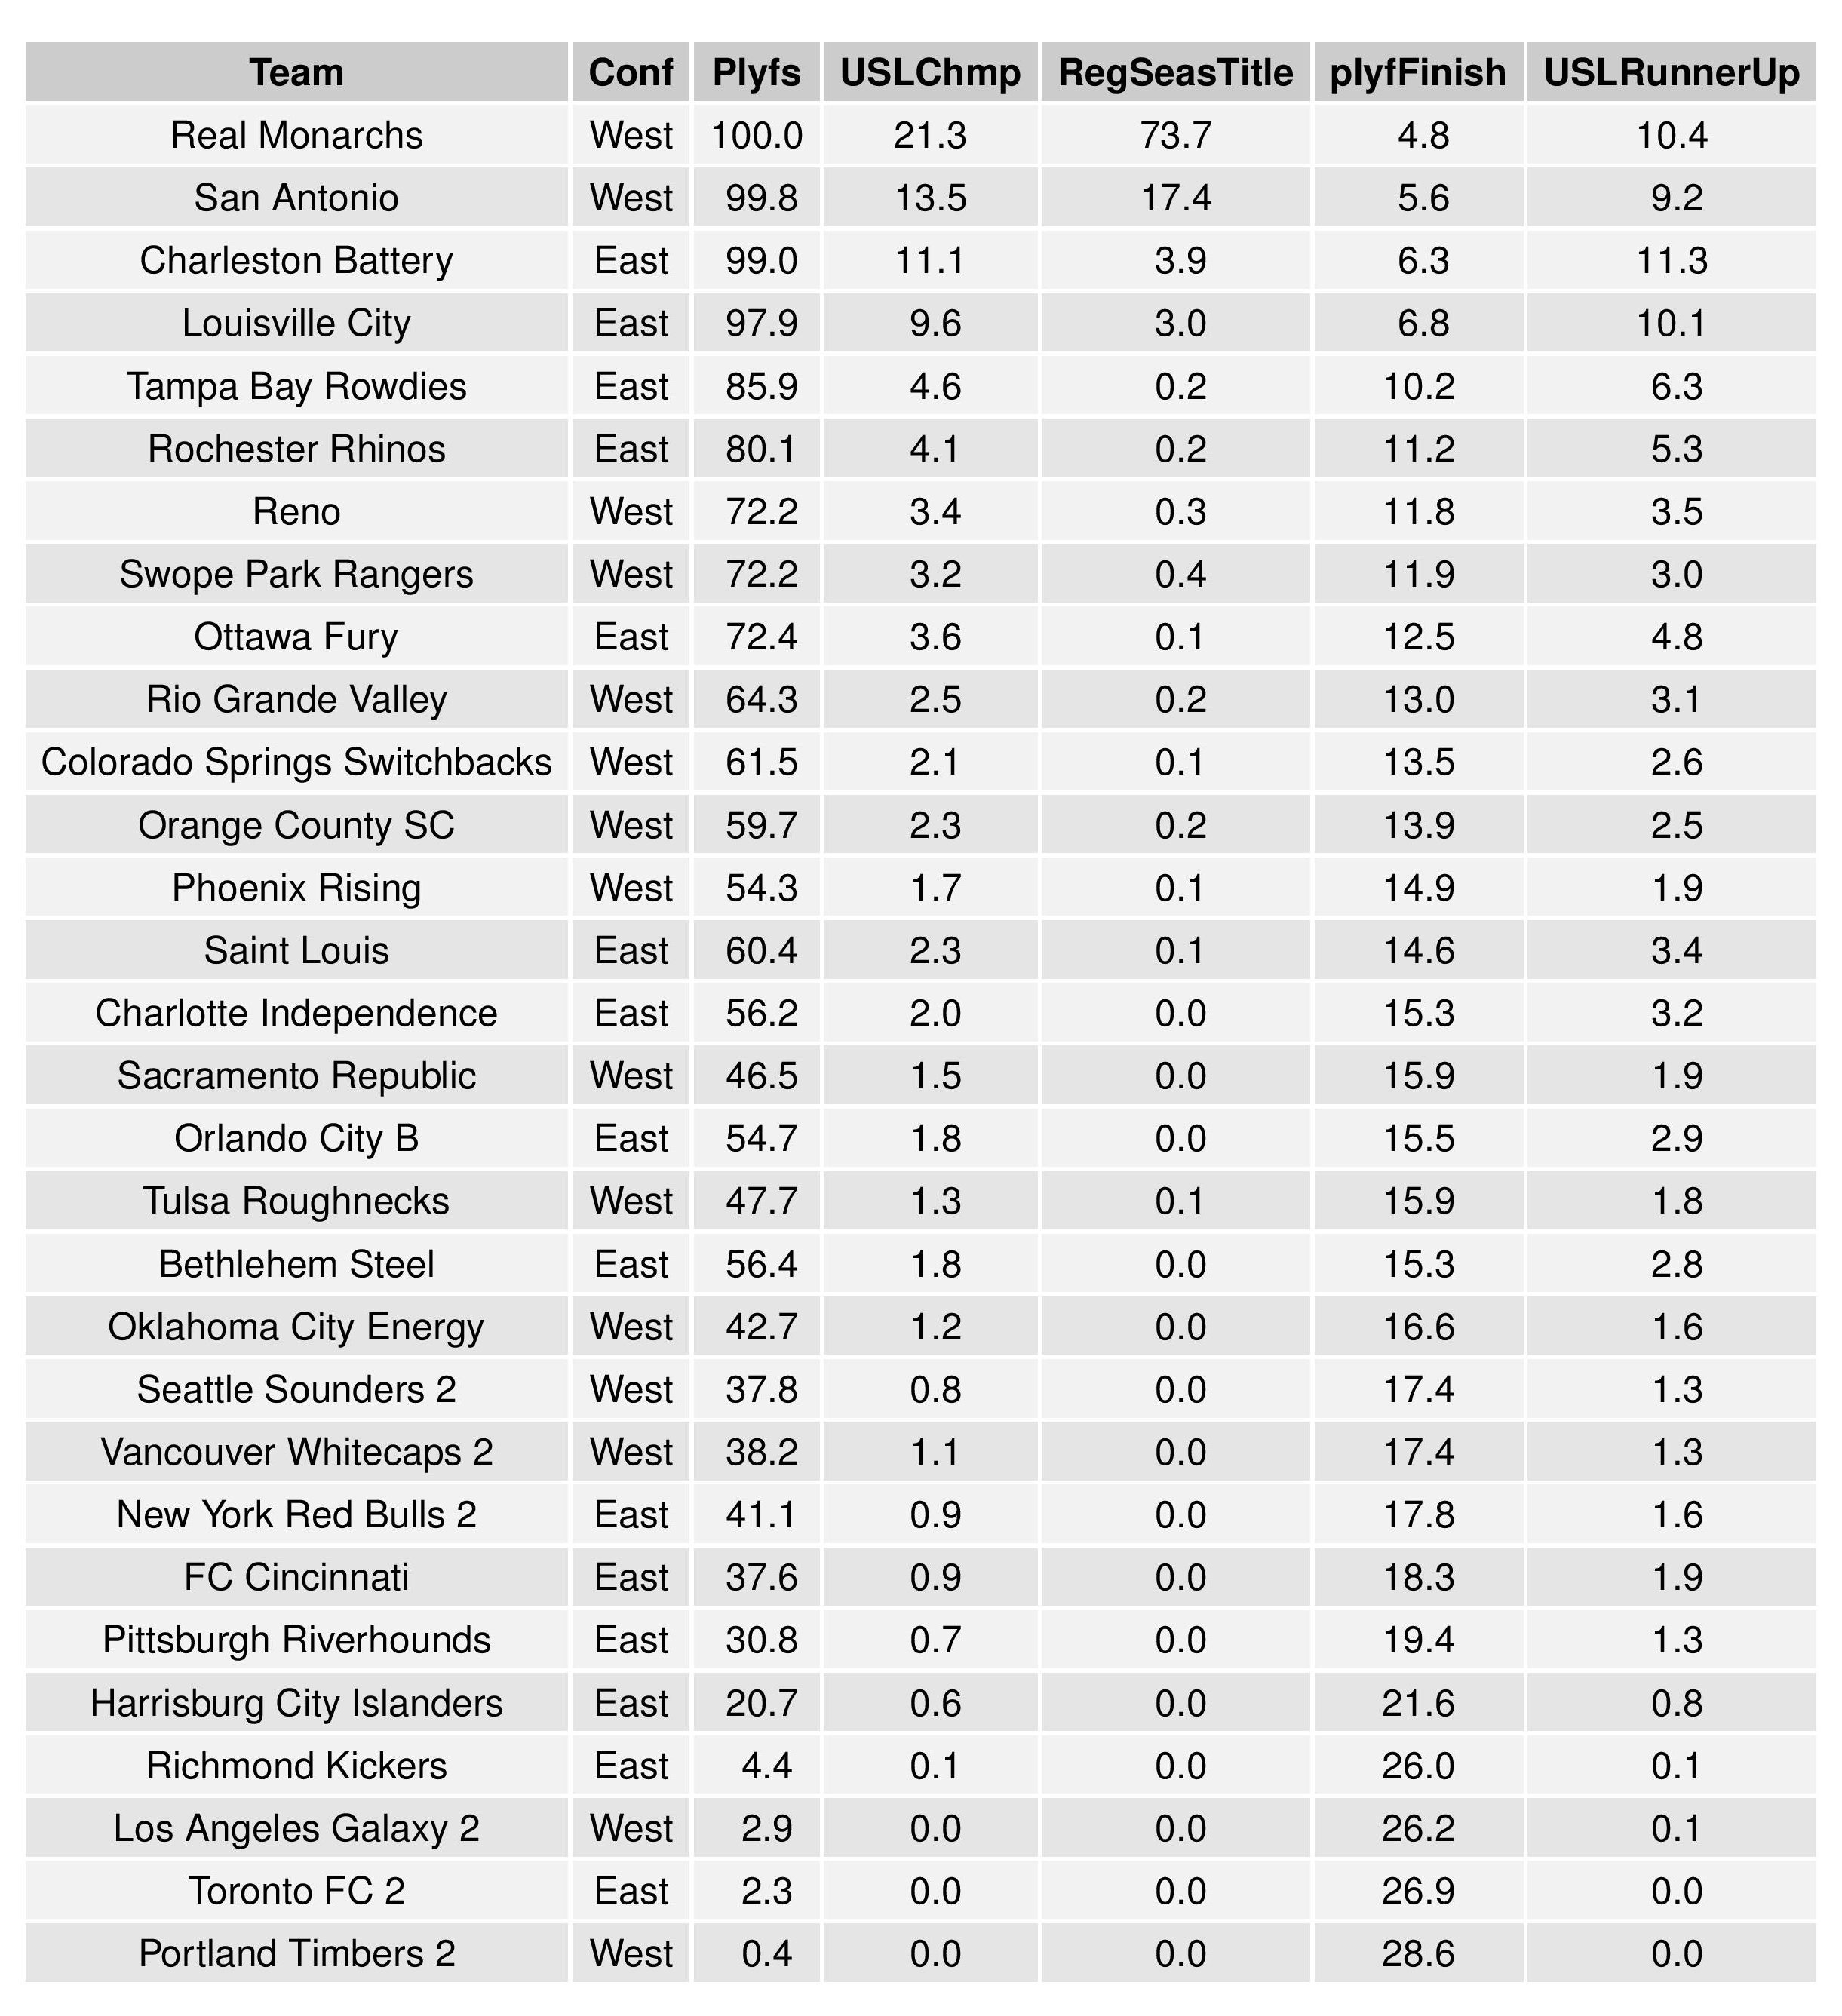
Bethlehem’s odds at becoming the USL Champion increased from 1.1% to 1.8% while Harrisburg City’s decreased from 0.8% to 0.6%:
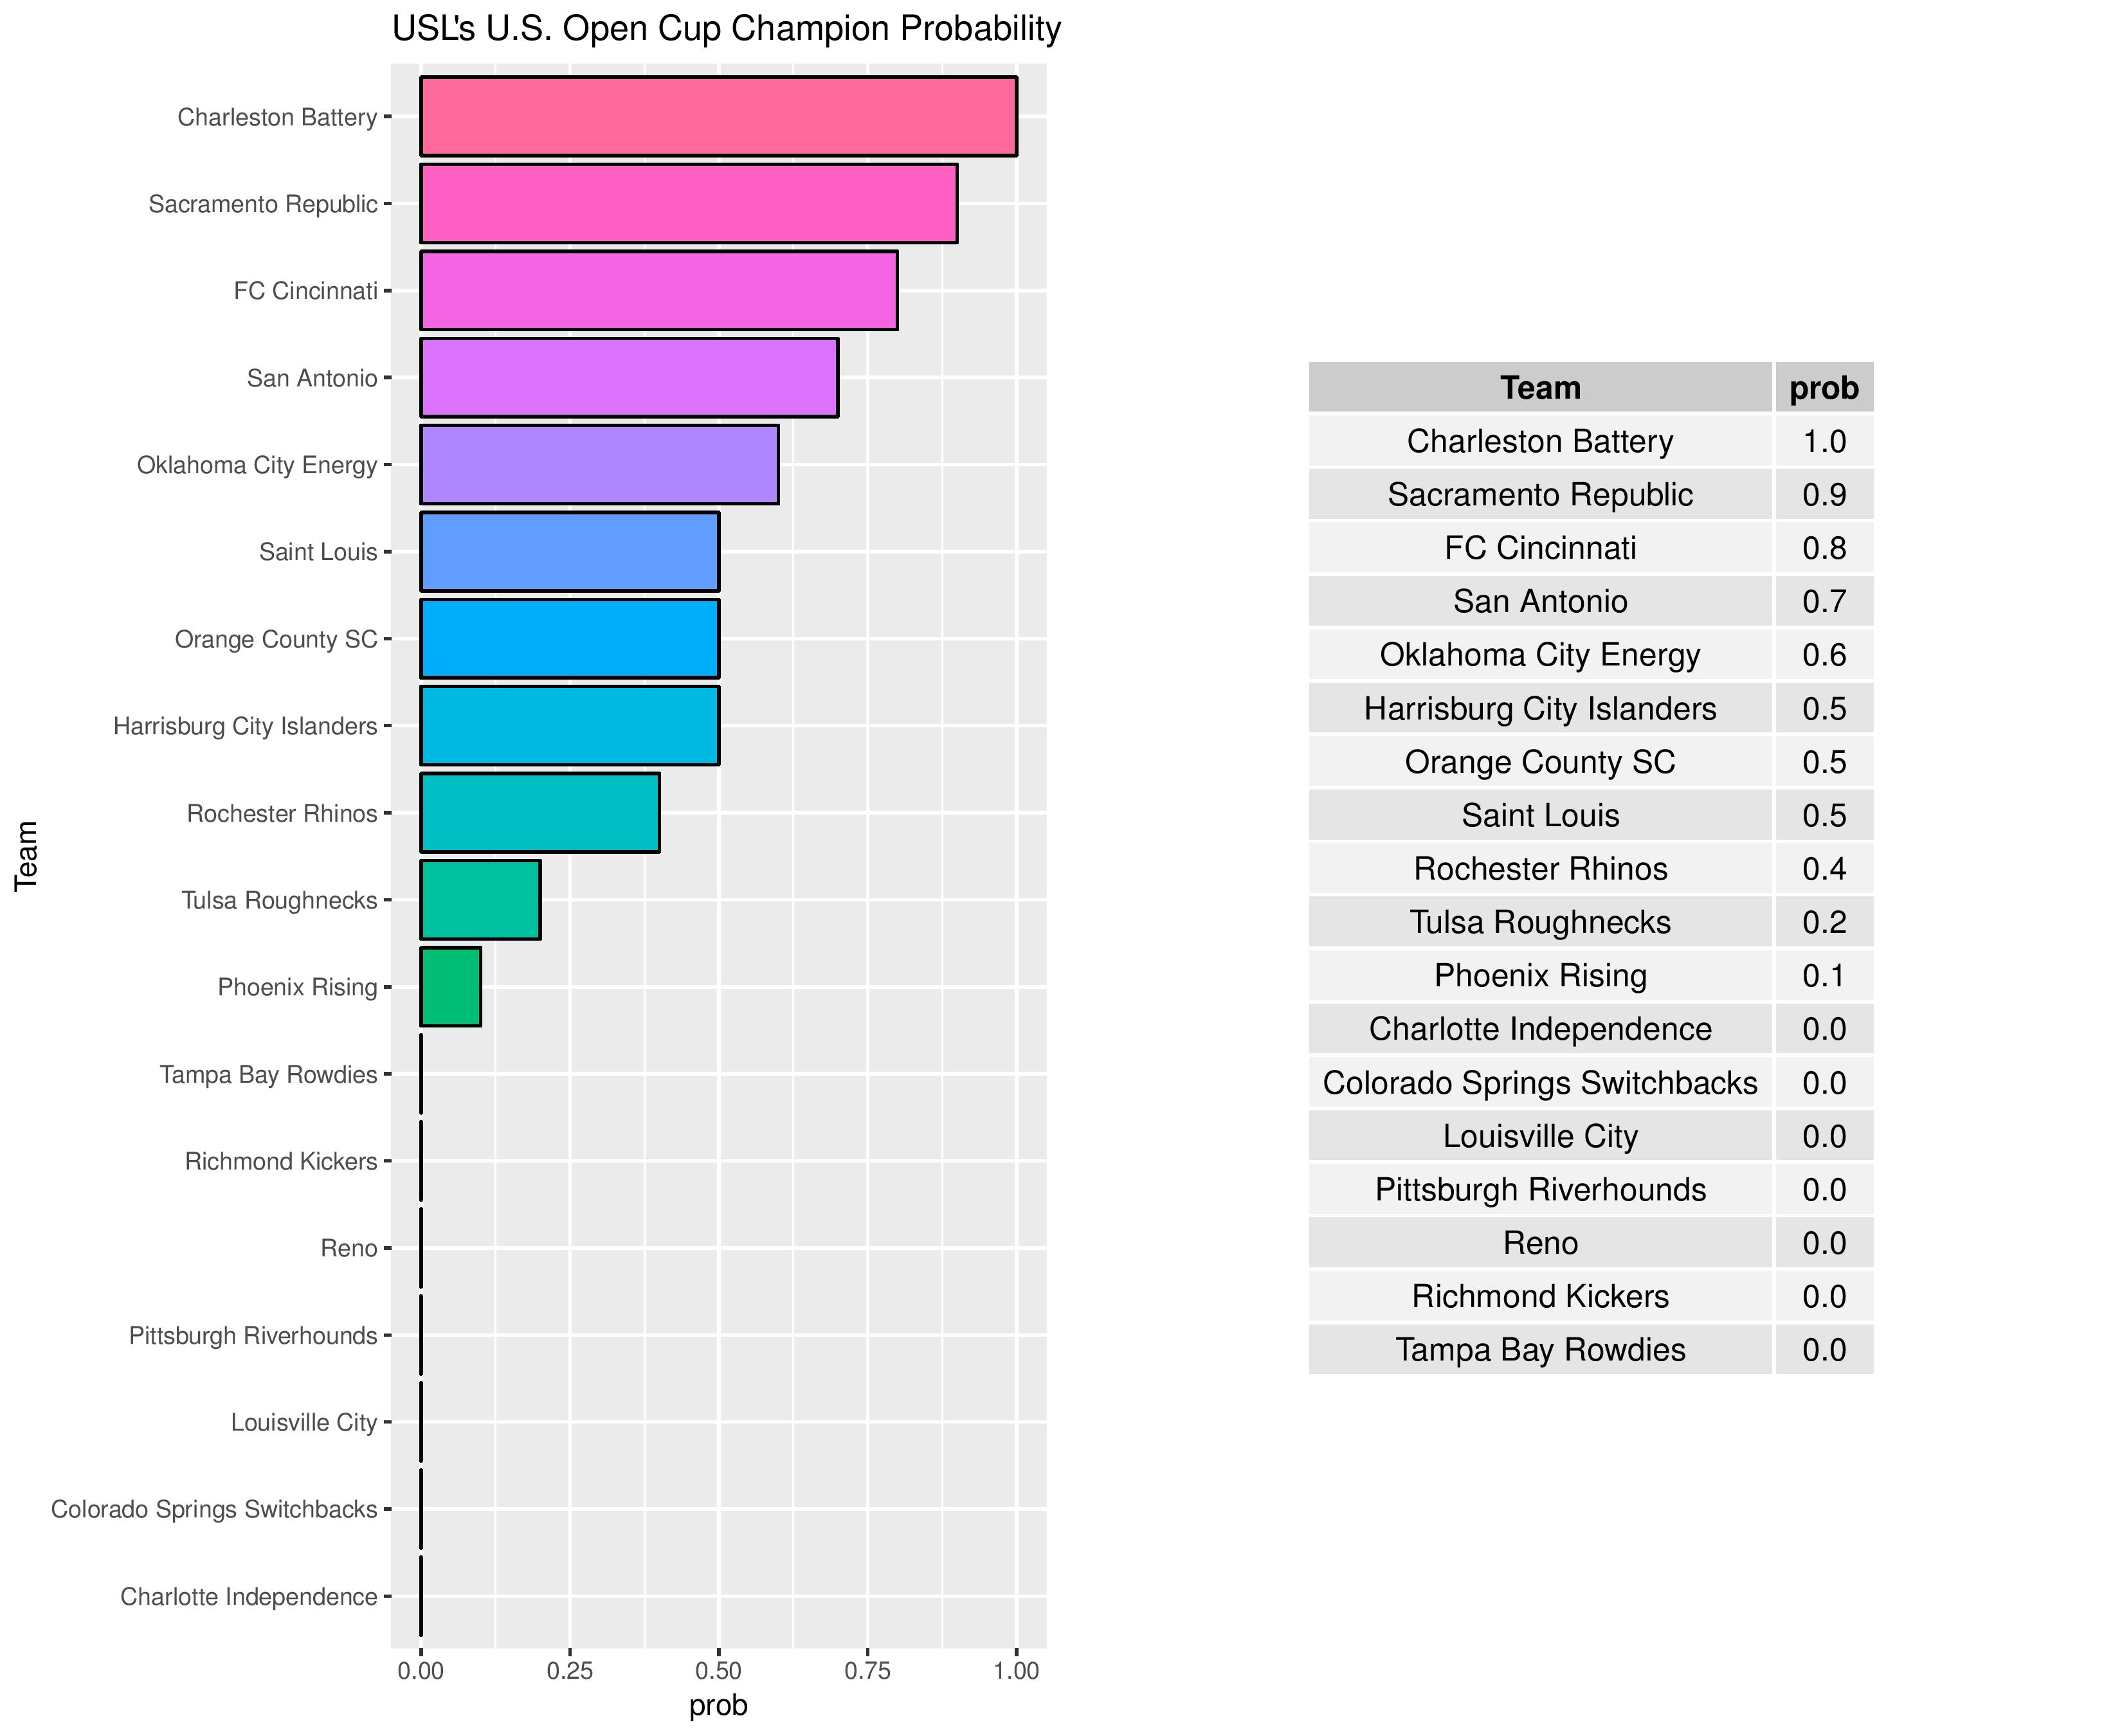
The USOC odds for USL clubs alone are as follows.
Harrisburg’s odds remain at 0.5%. They will face Philadelphia away today.
Over time, we can see how the odds for different prizes change for Bethlehem and Harrisburg.
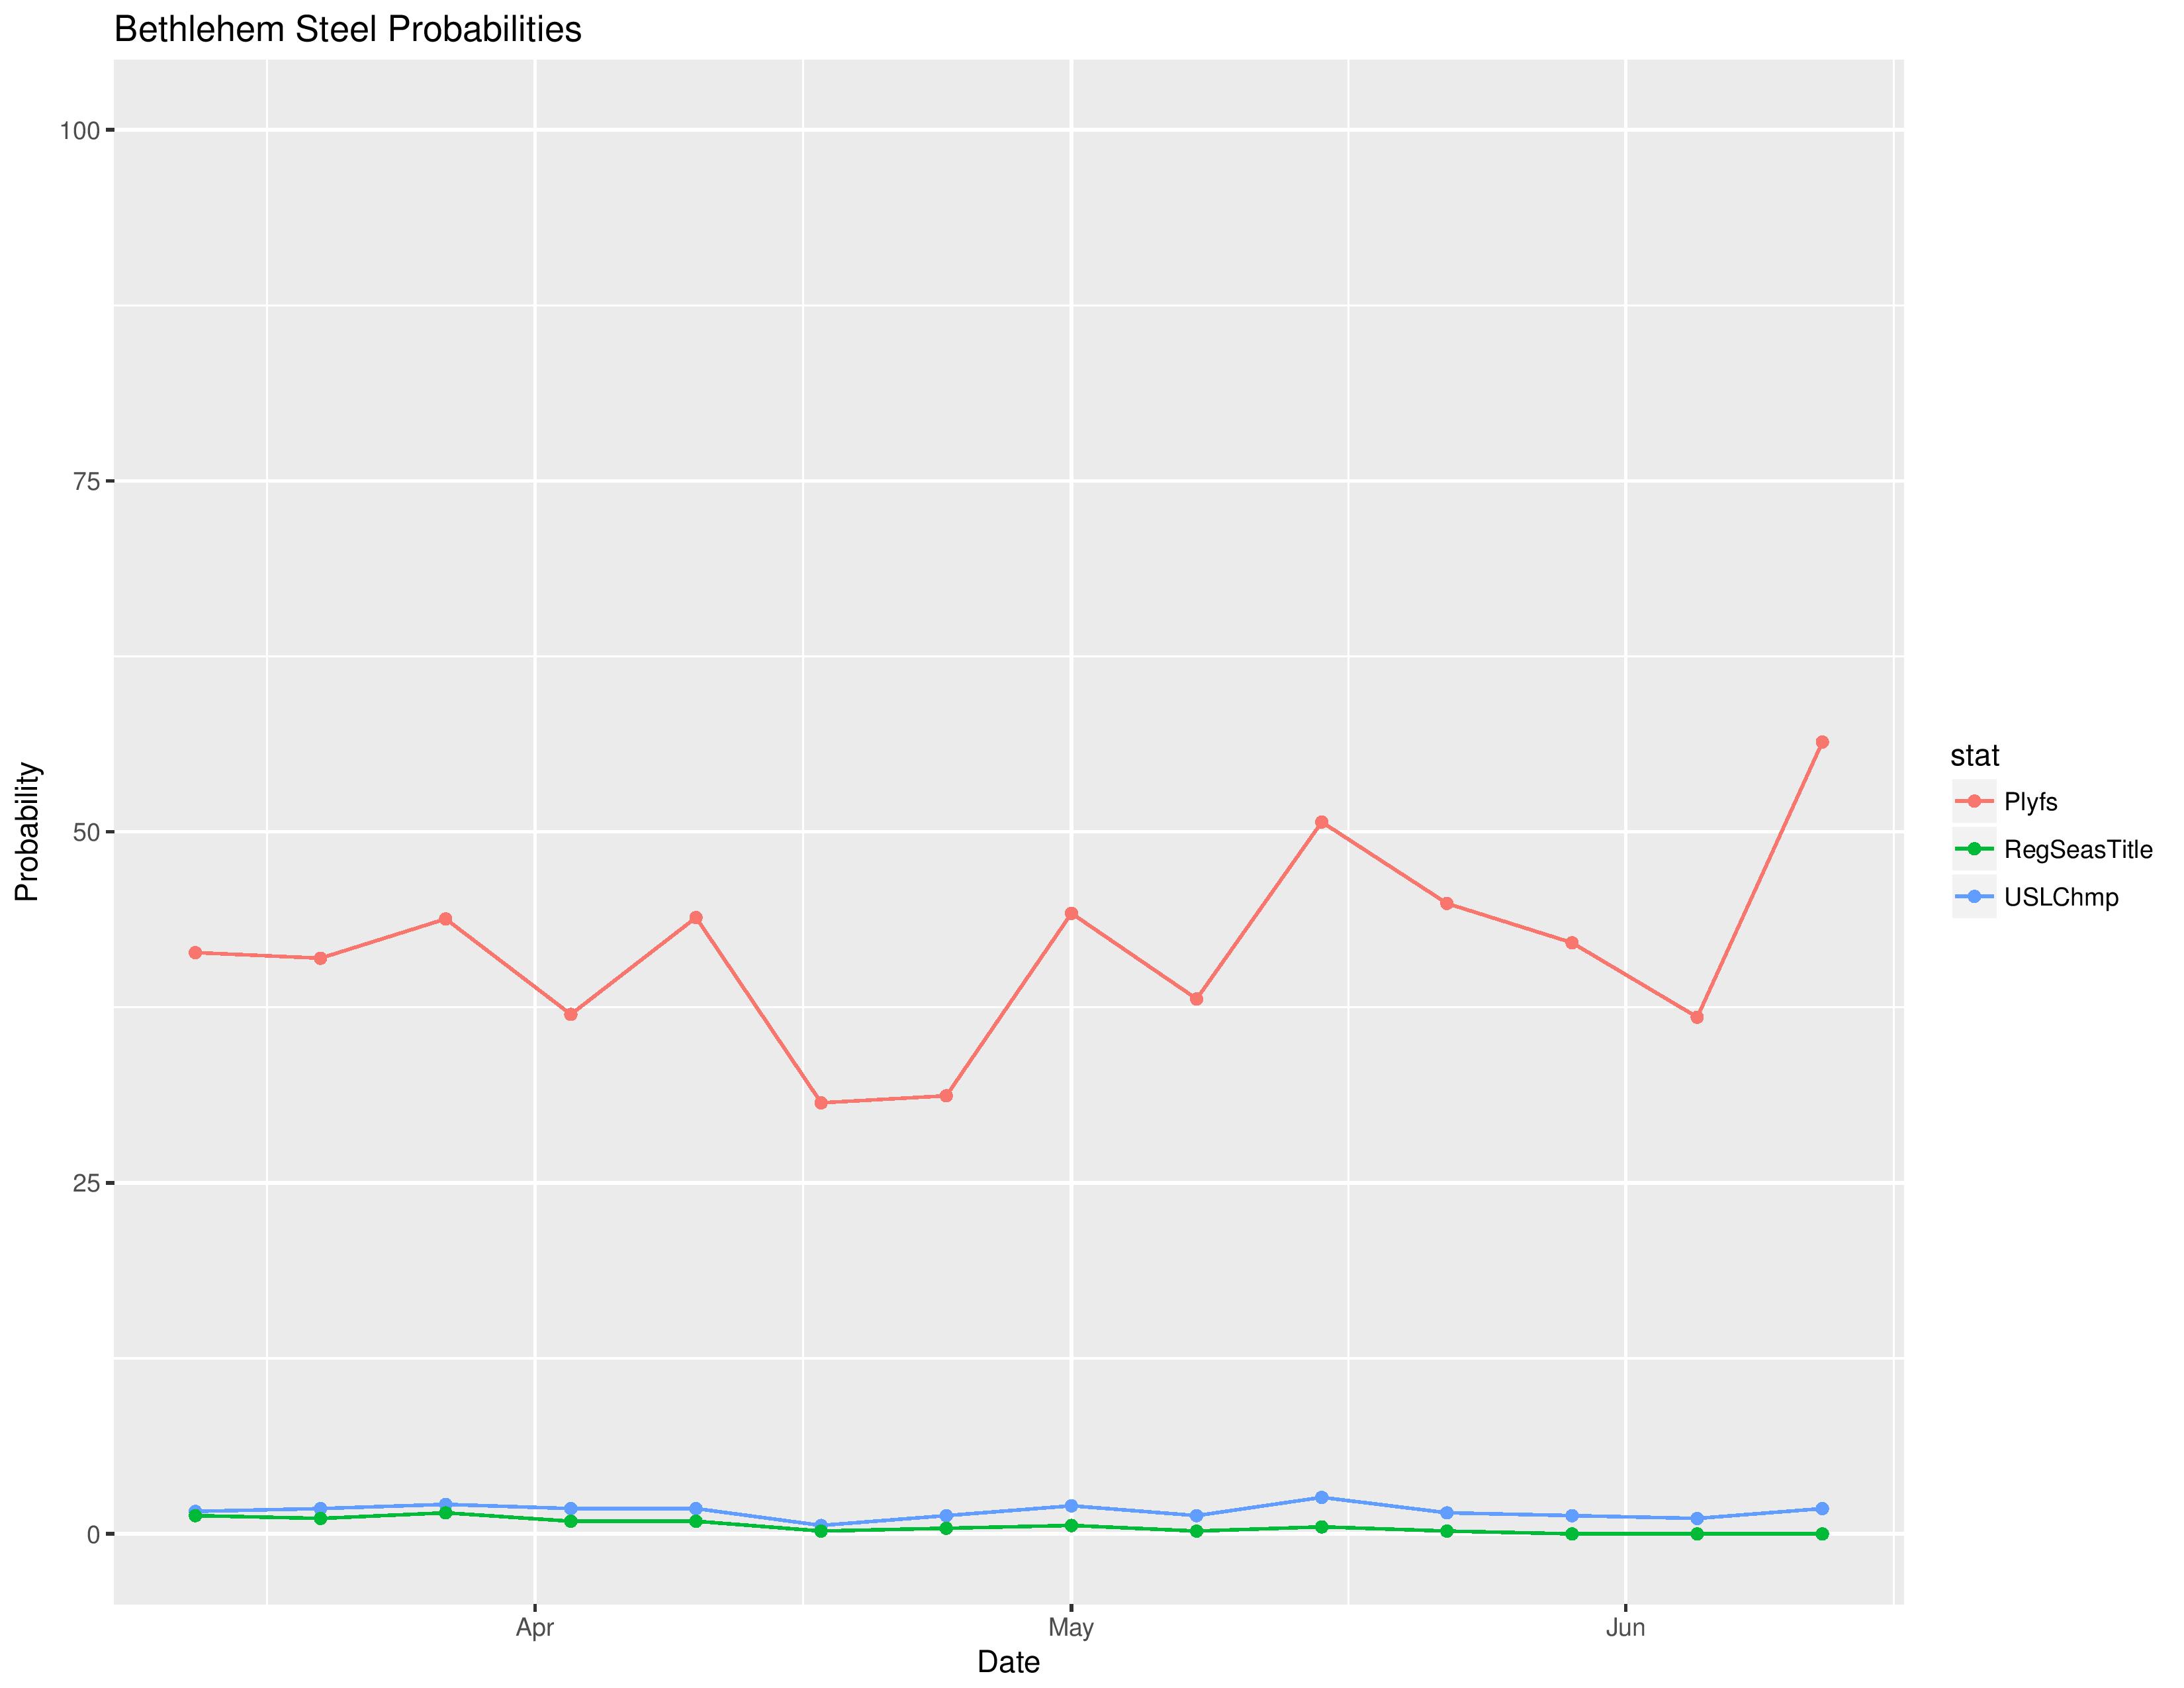
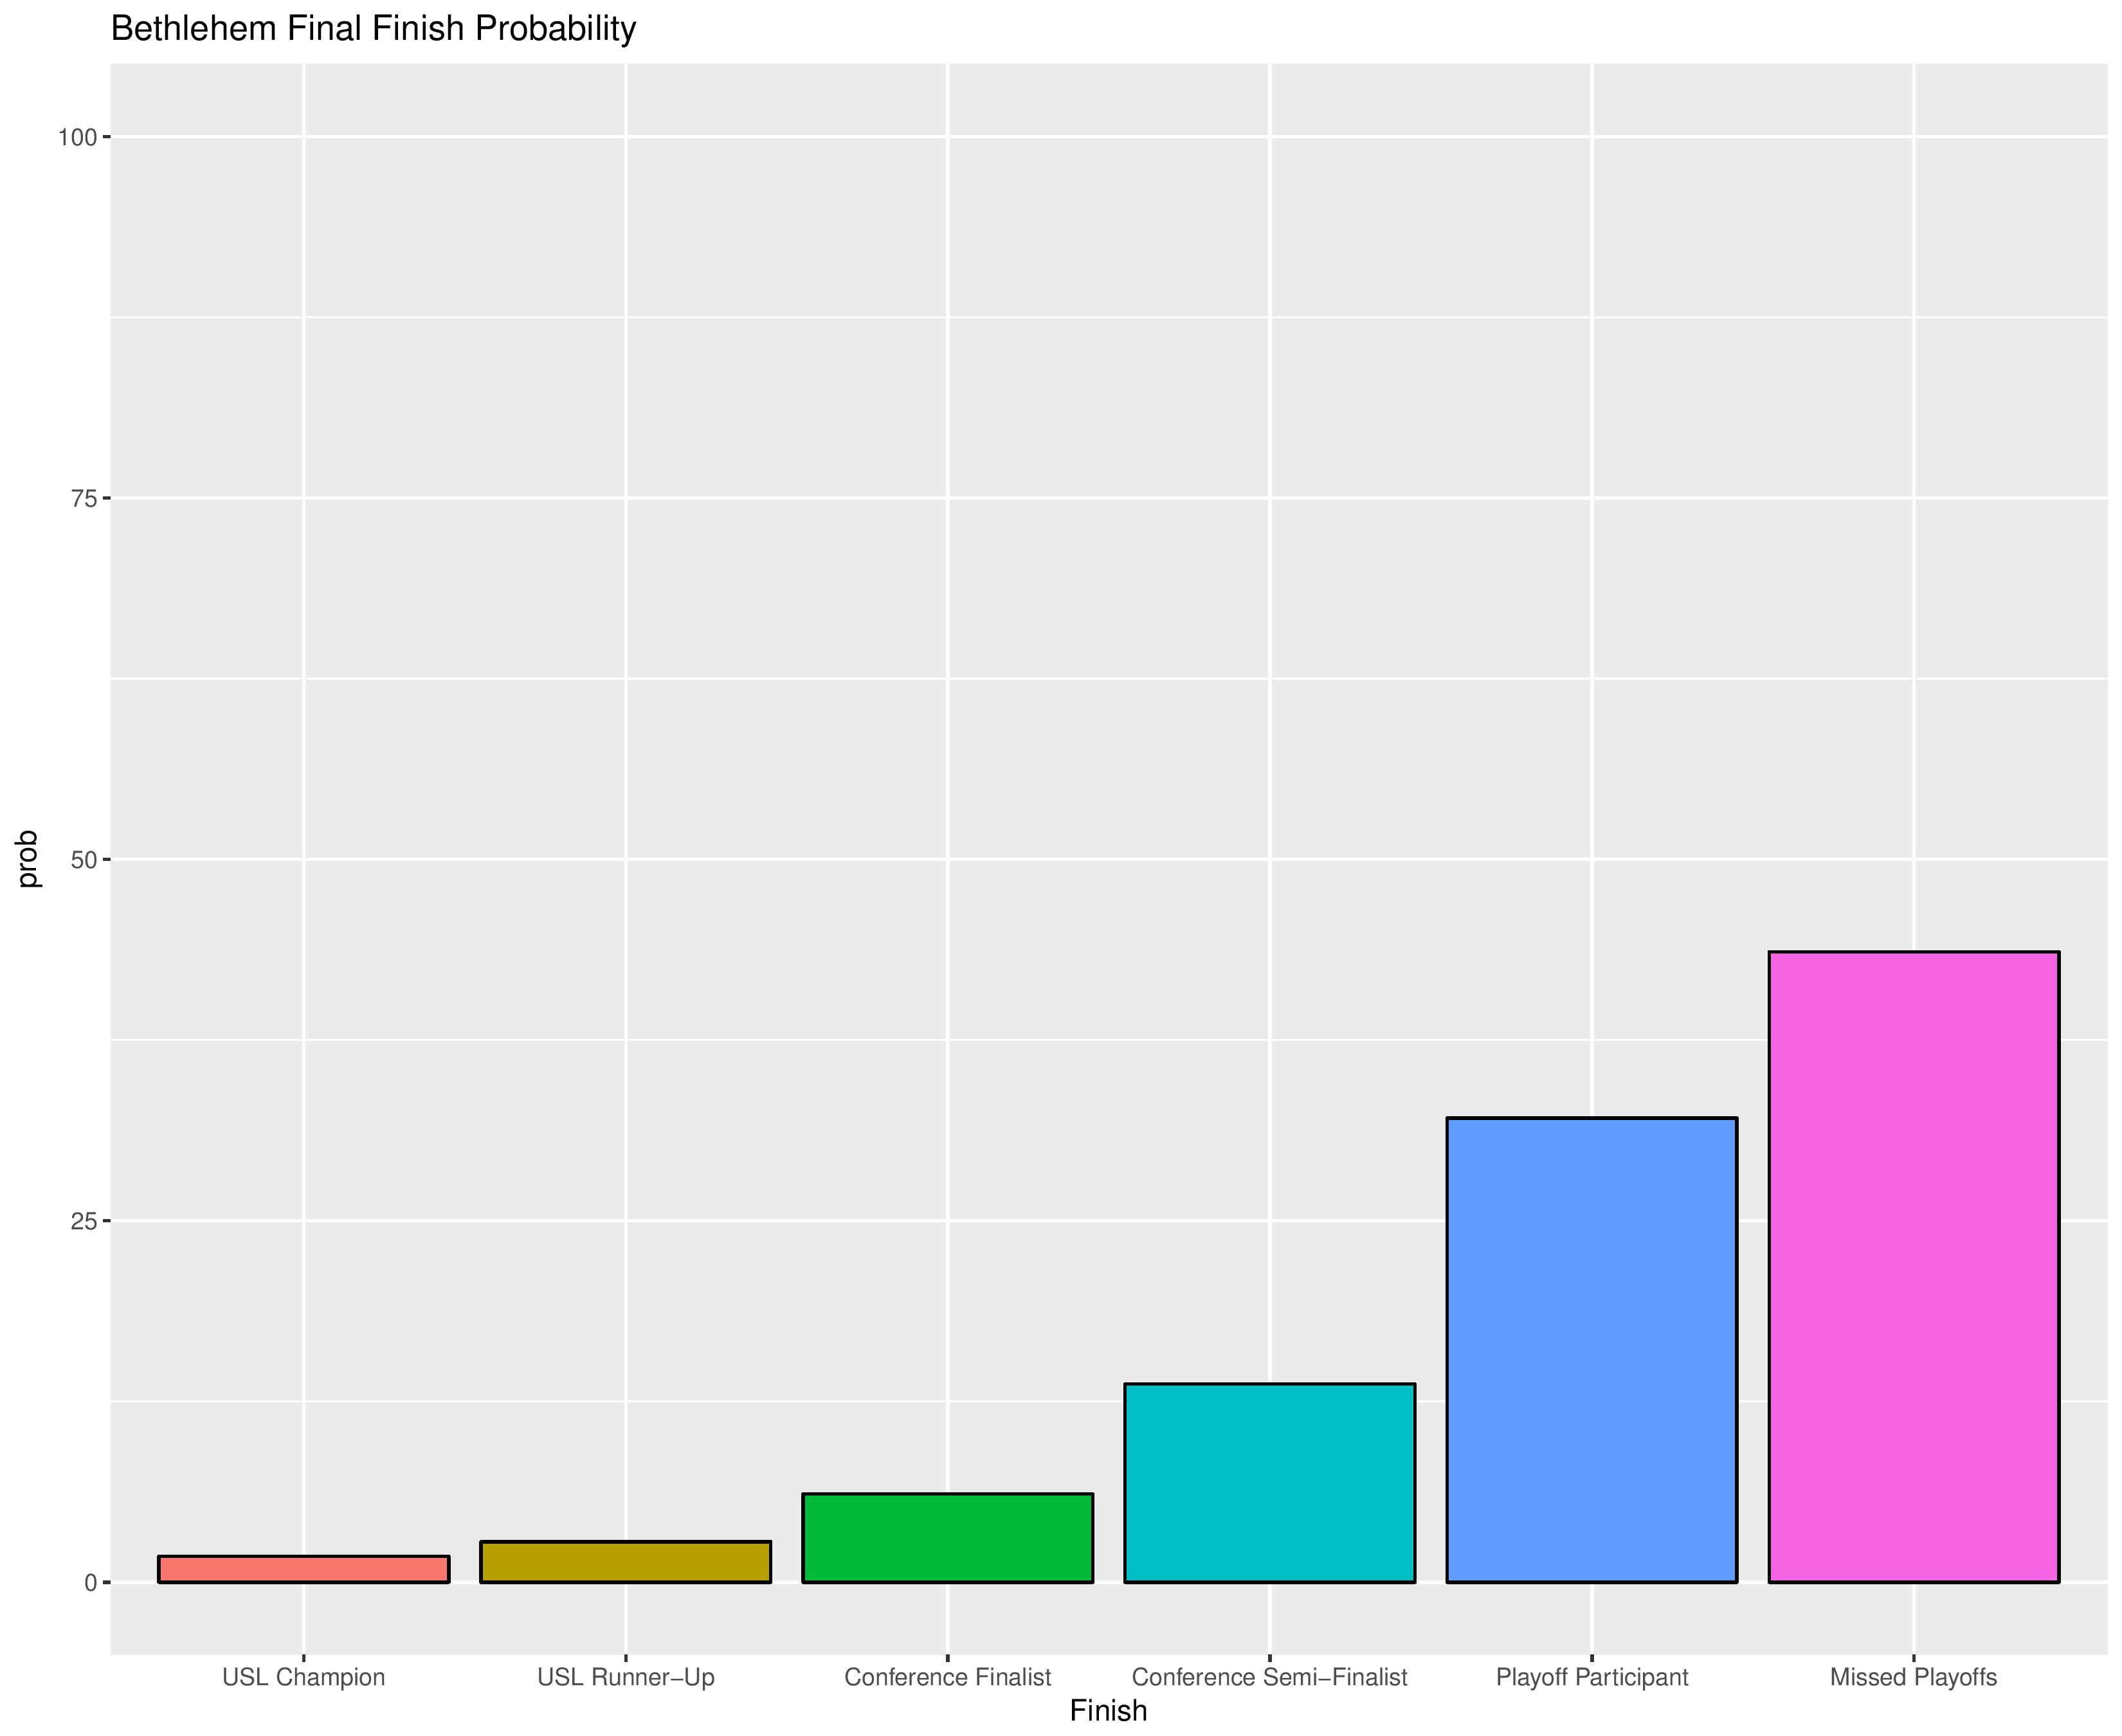
The following are probabilities for each category of outcomes for Bethlehem.
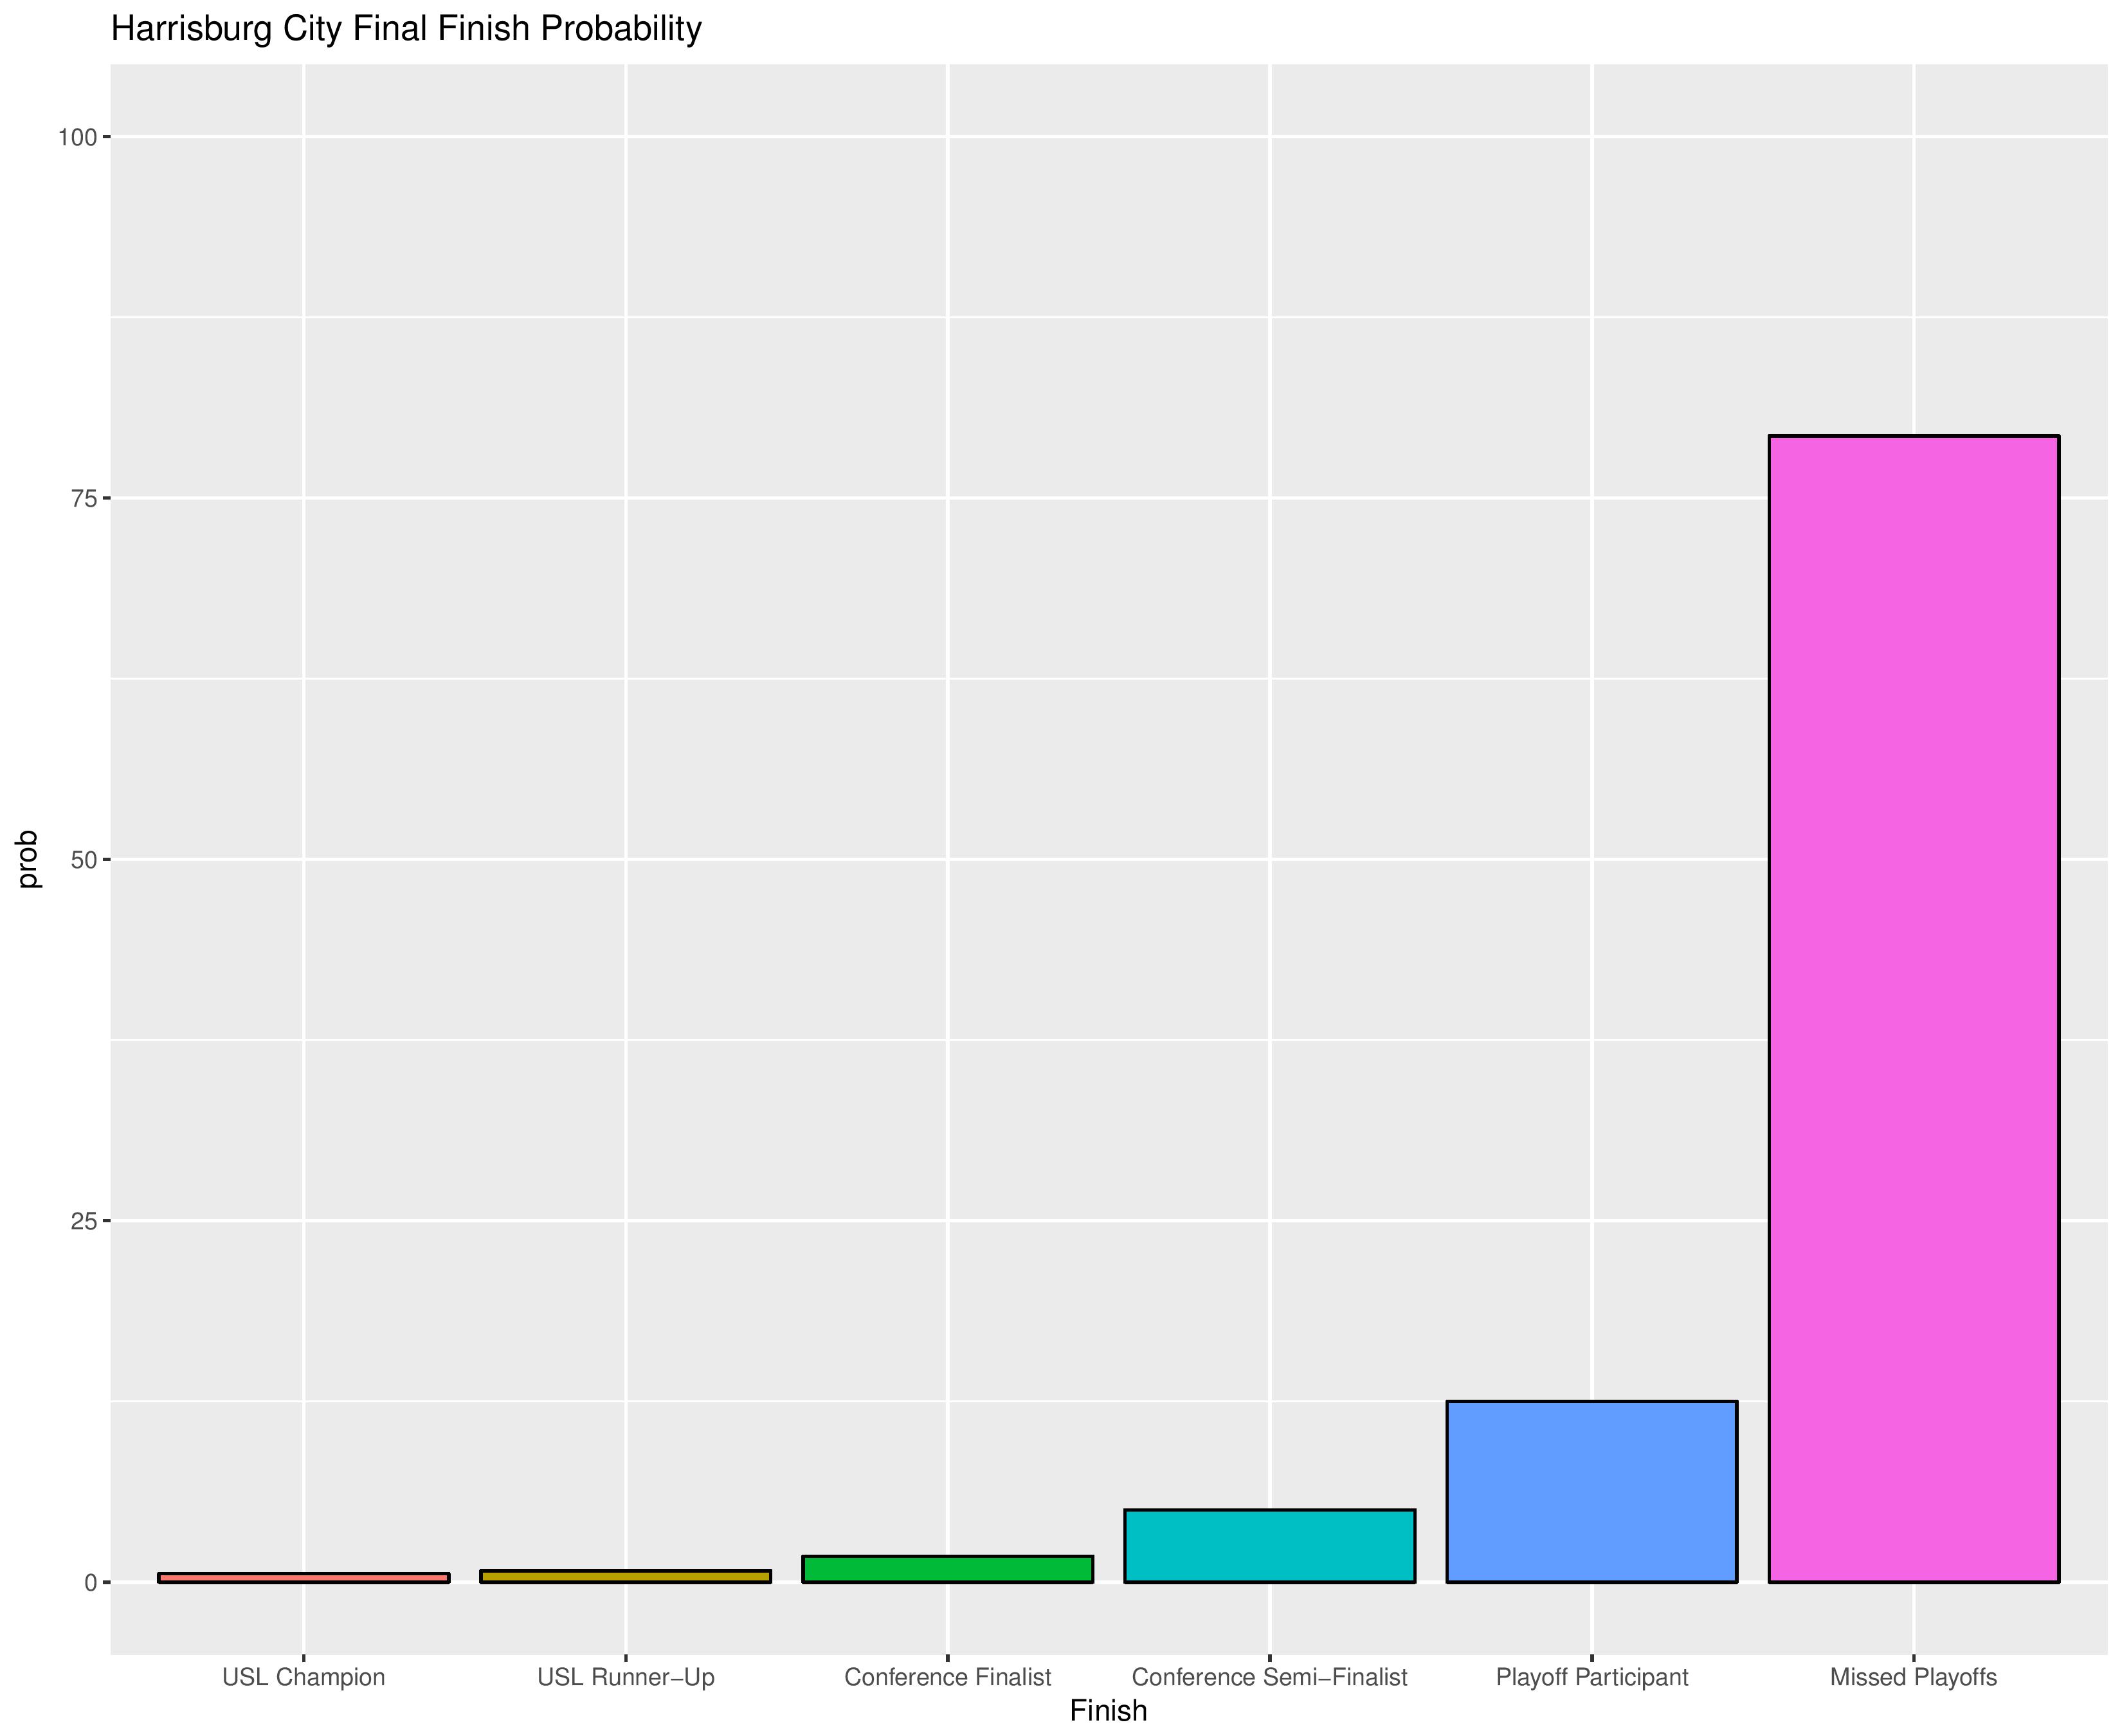
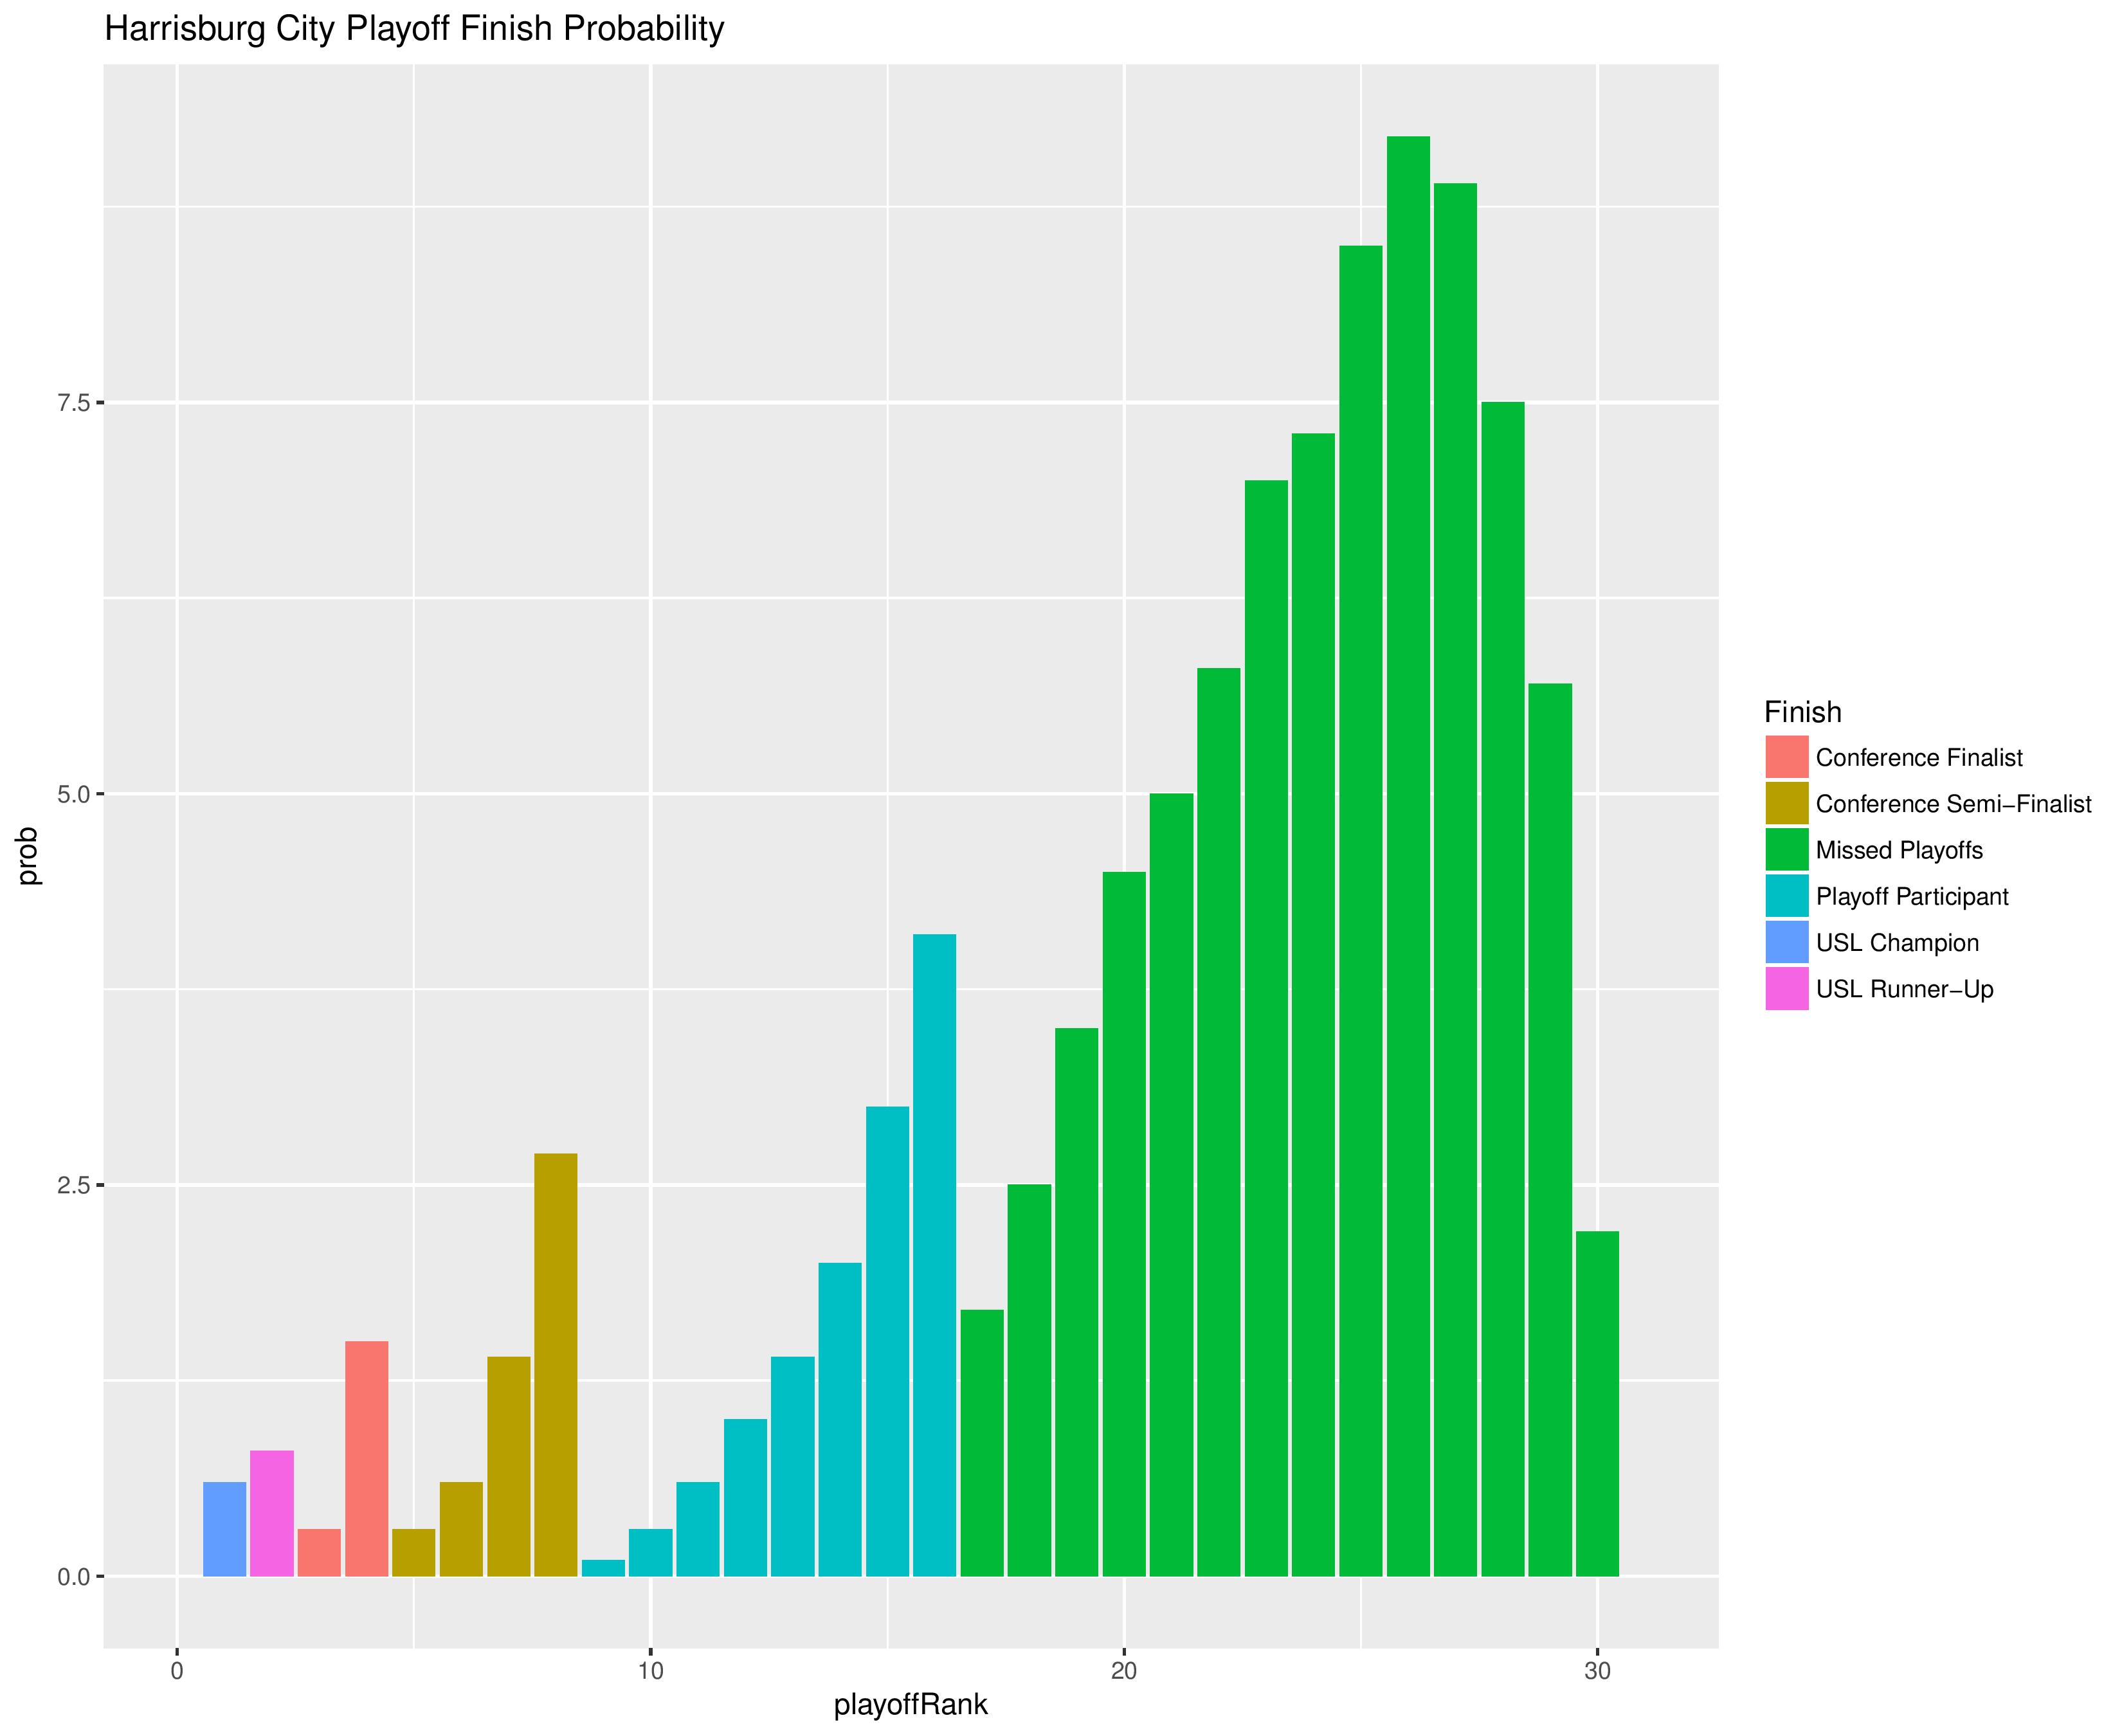
The following are probabilities for each category of outcomes for Harrisburg City:
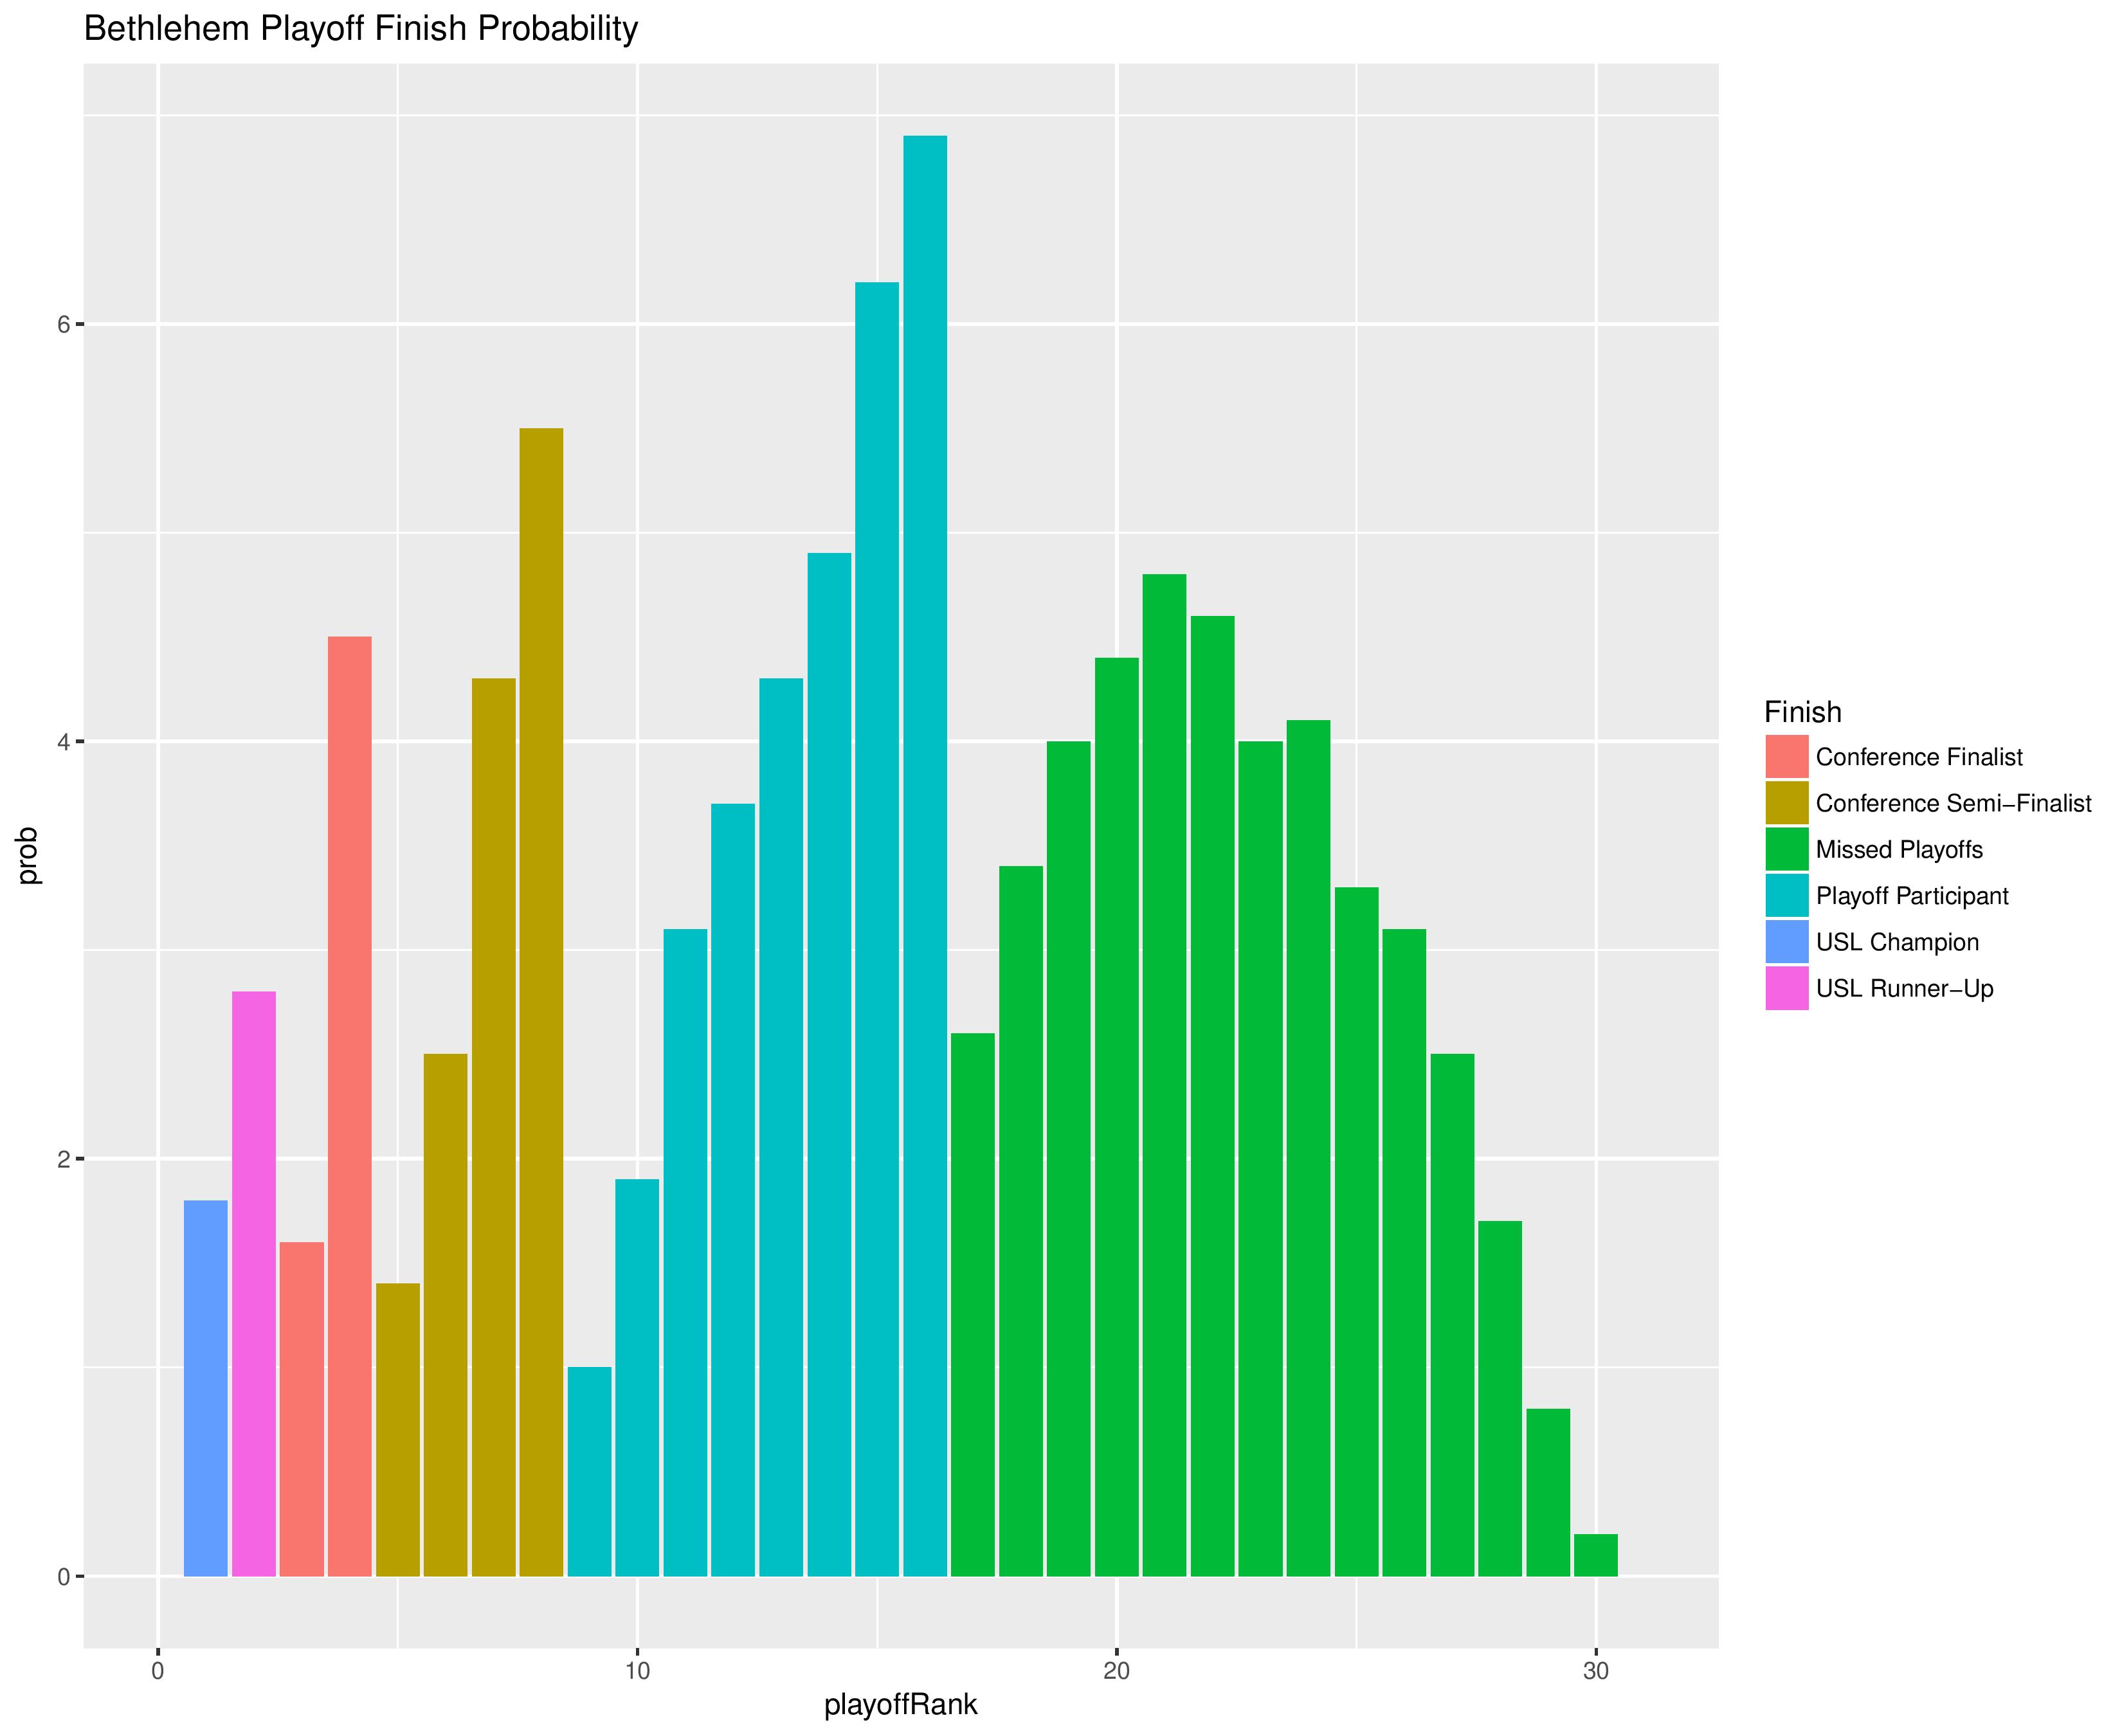
The following shows the probability of each post-playoff ranking finish:
The following shows the summary of the simulations in an easy table format.
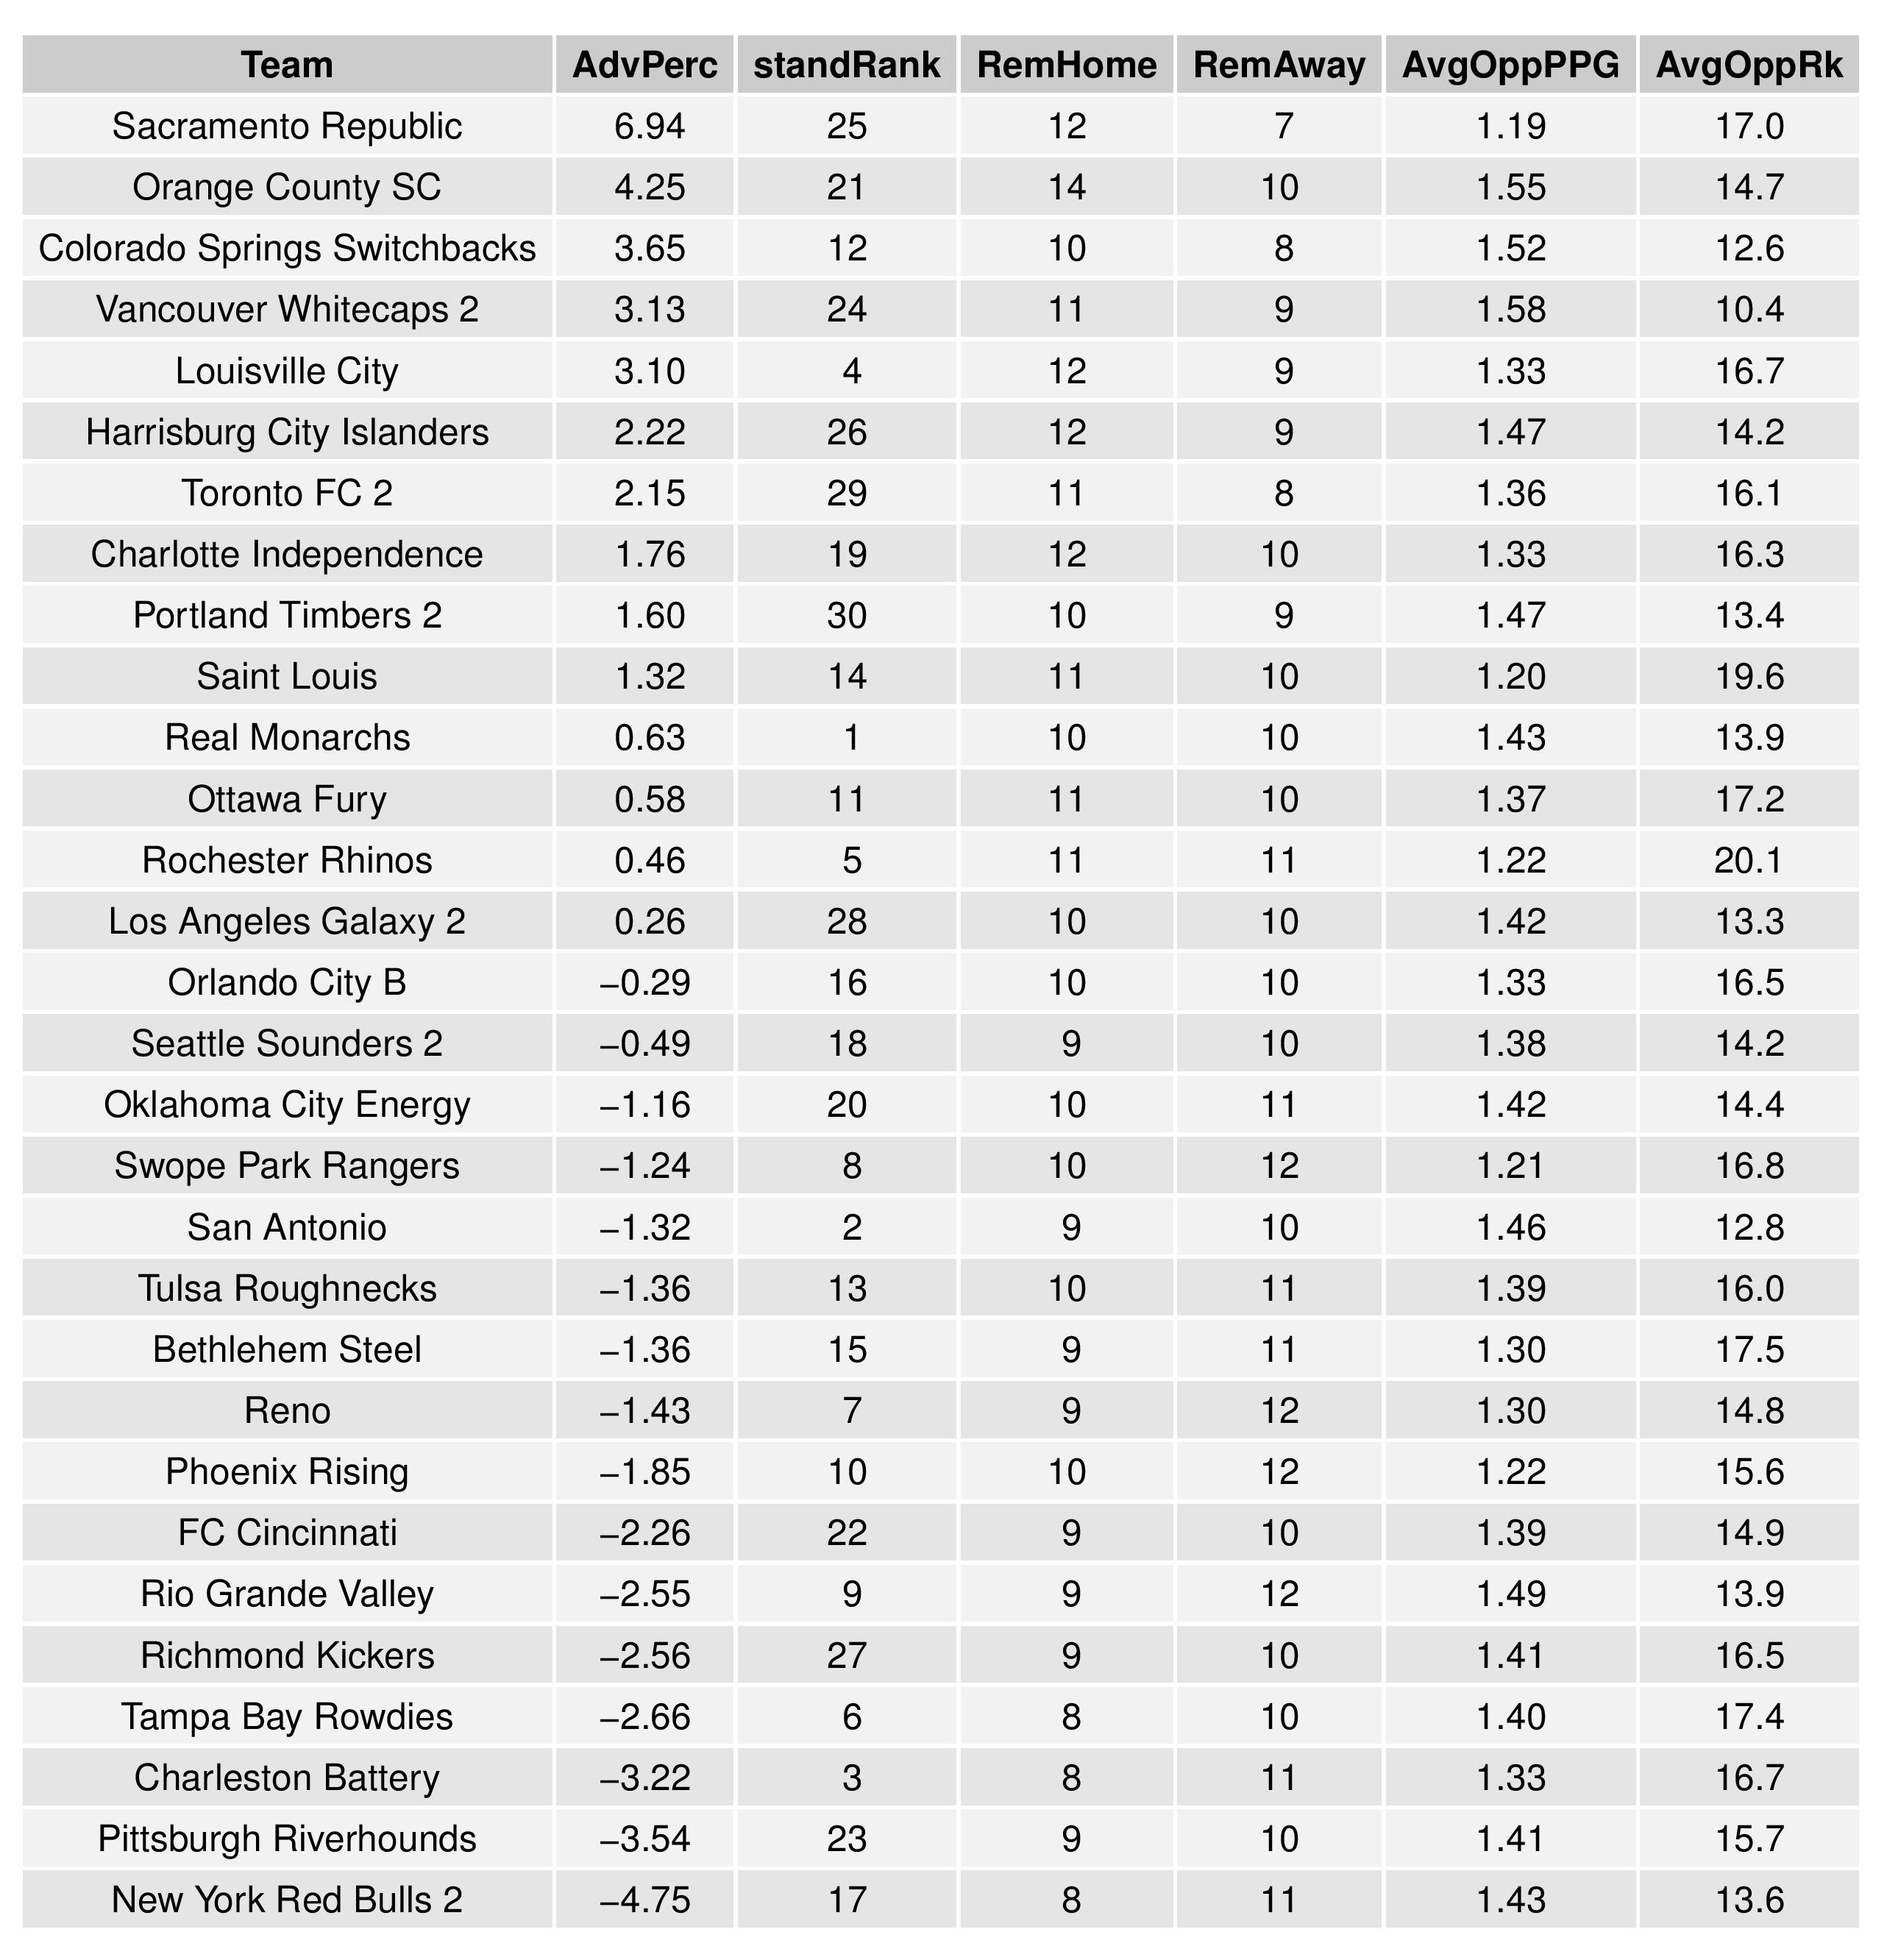
We can also show how the Remaining Strength of Schedule affects each team.
The “Points Percentage Advantage” shown on the X-axis represents the percentage of points expected over the league average schedule. This “points expected” value is generated by simulating how all teams would perform with all remaining schedules (and therefore judges a schedule based upon how all teams would perform in that scenario).
In short, the higher the value, the easier the remaining schedule.
Remaining home field advantage will make a large contribution here. It can also be true that a better team has an ‘easier’ schedule simply because they do not have to play themselves. Likewise, a bad team may have a ‘harder’ schedule because they also do not play themselves.
The table following the chart also shares helpful context with these percentages.
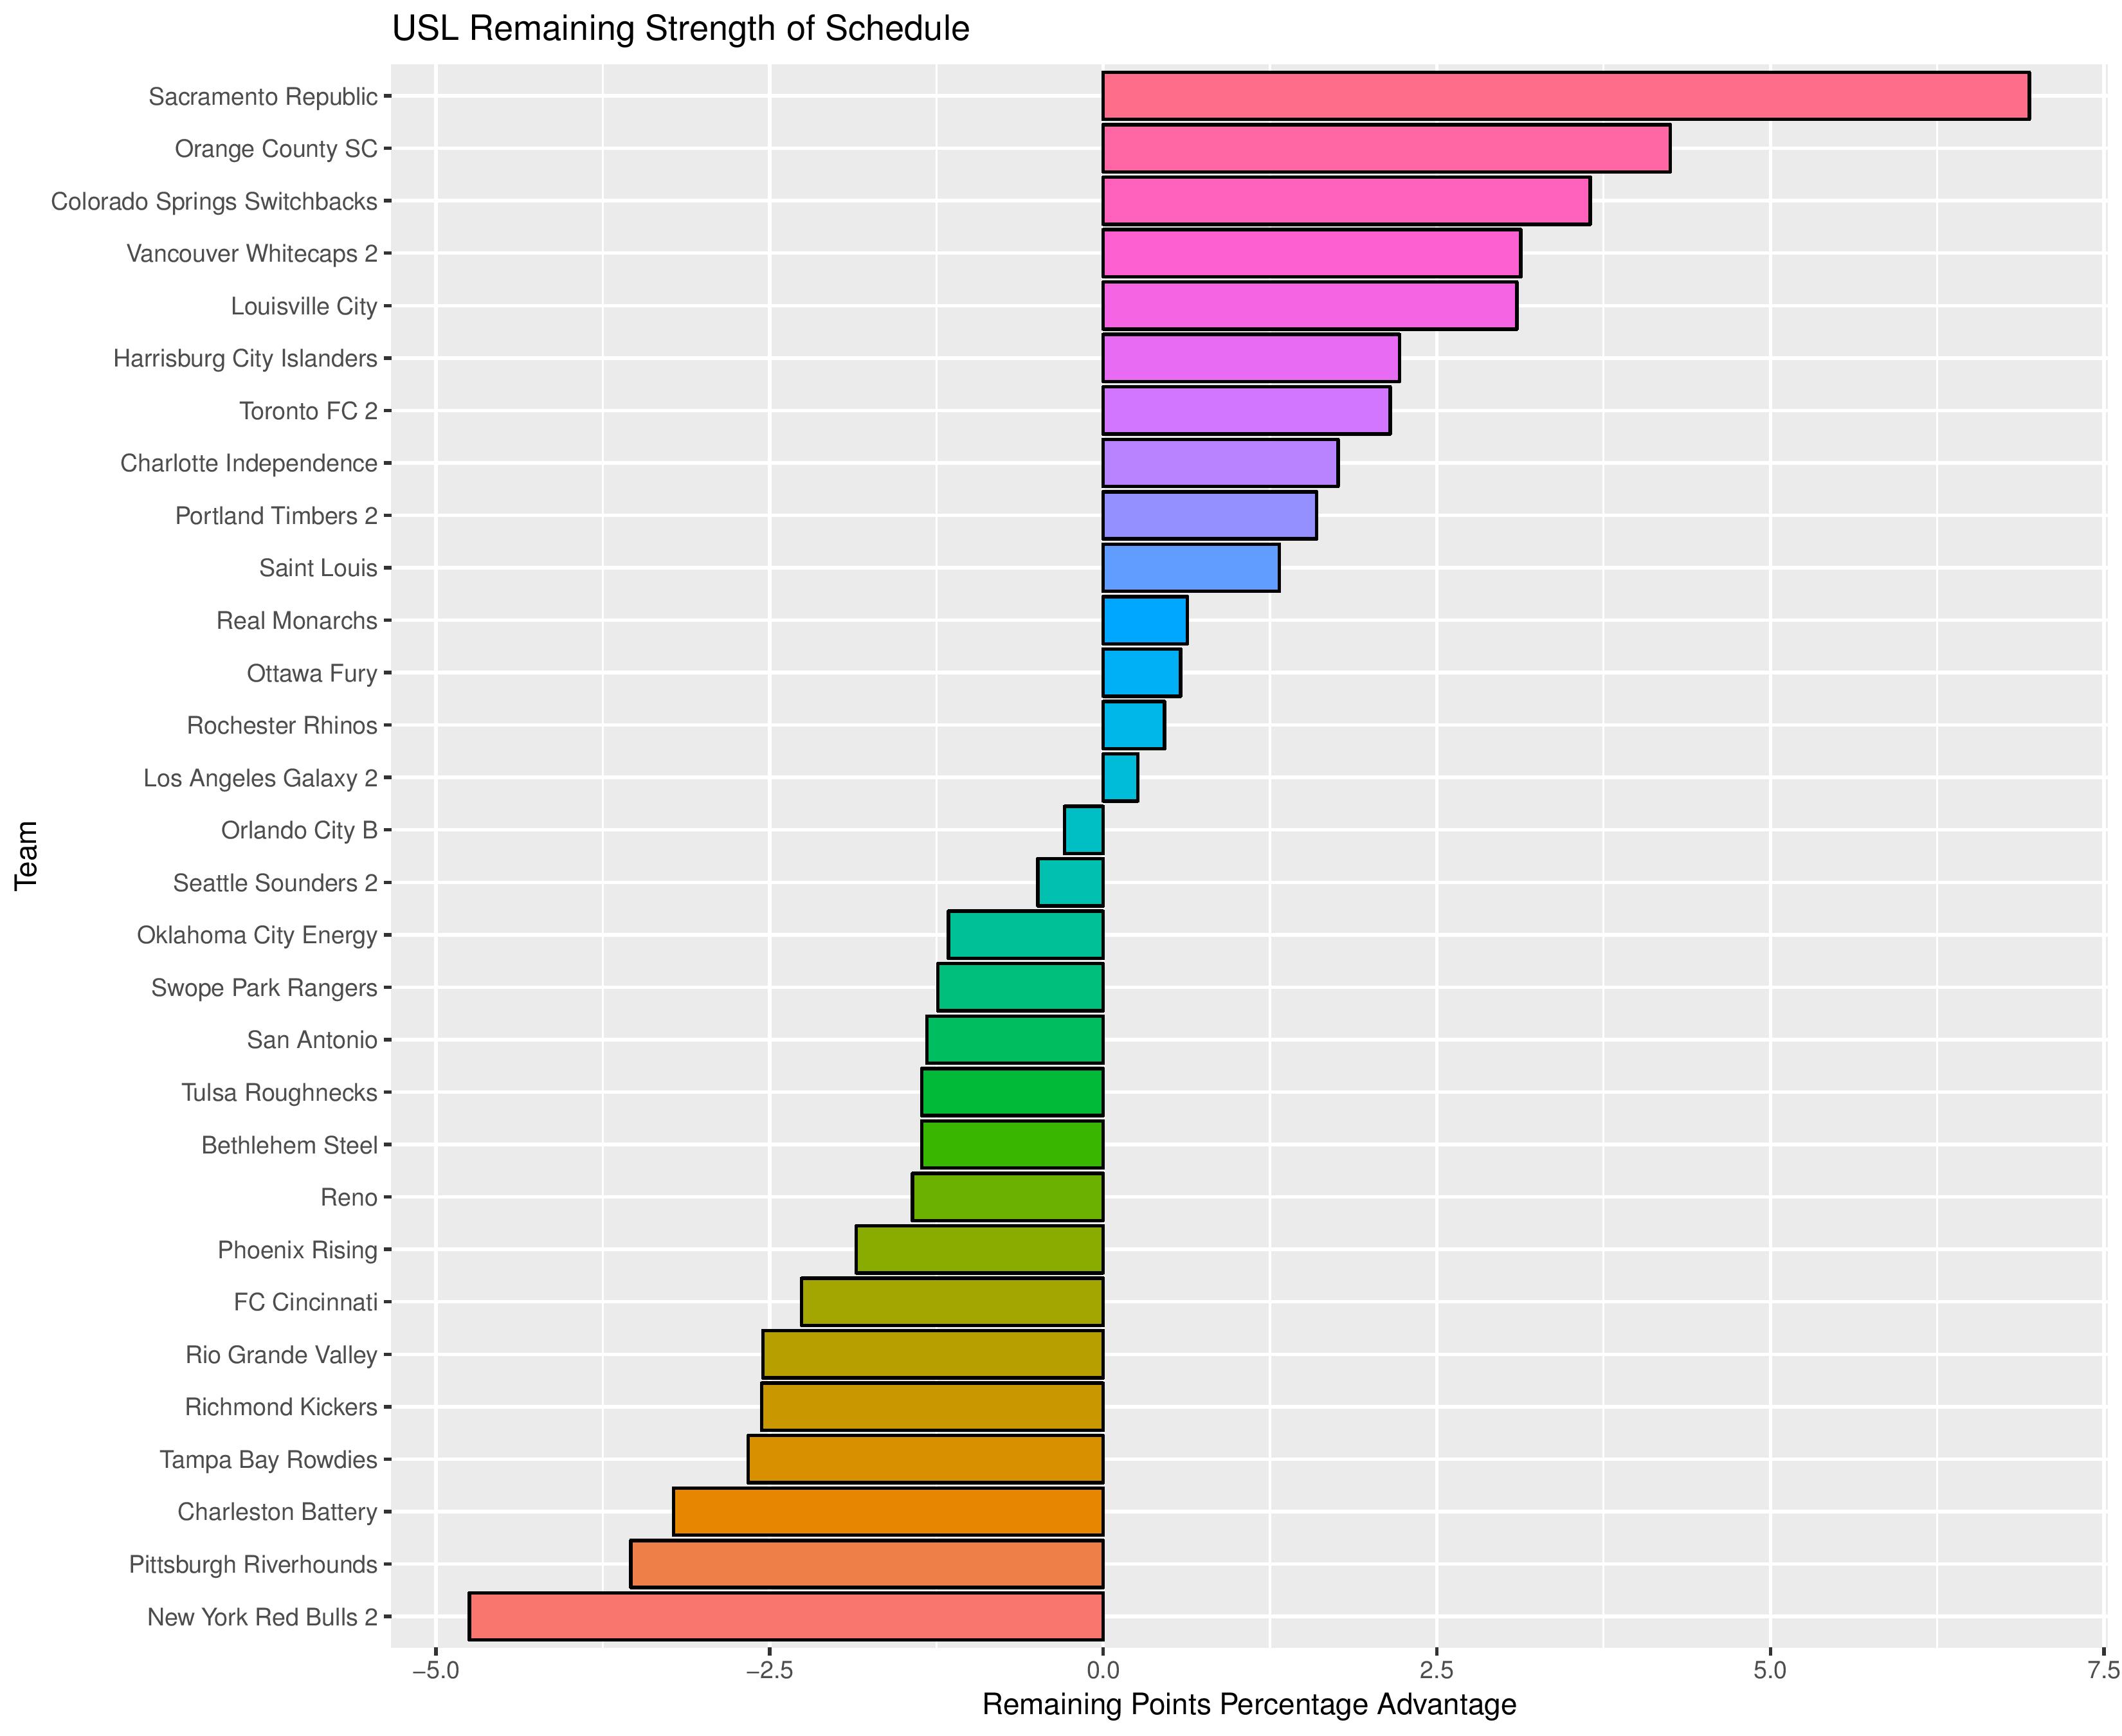
Accompanying the advantage percentage in the following table is their current standings rank (right now ties are not properly calculated beyond pts/gd/gf), the remaining home matches, the remaining away matches, the current average points-per-game of future opponents (results-based, not model-based), and the average power ranking of future opponents according to SEBA.
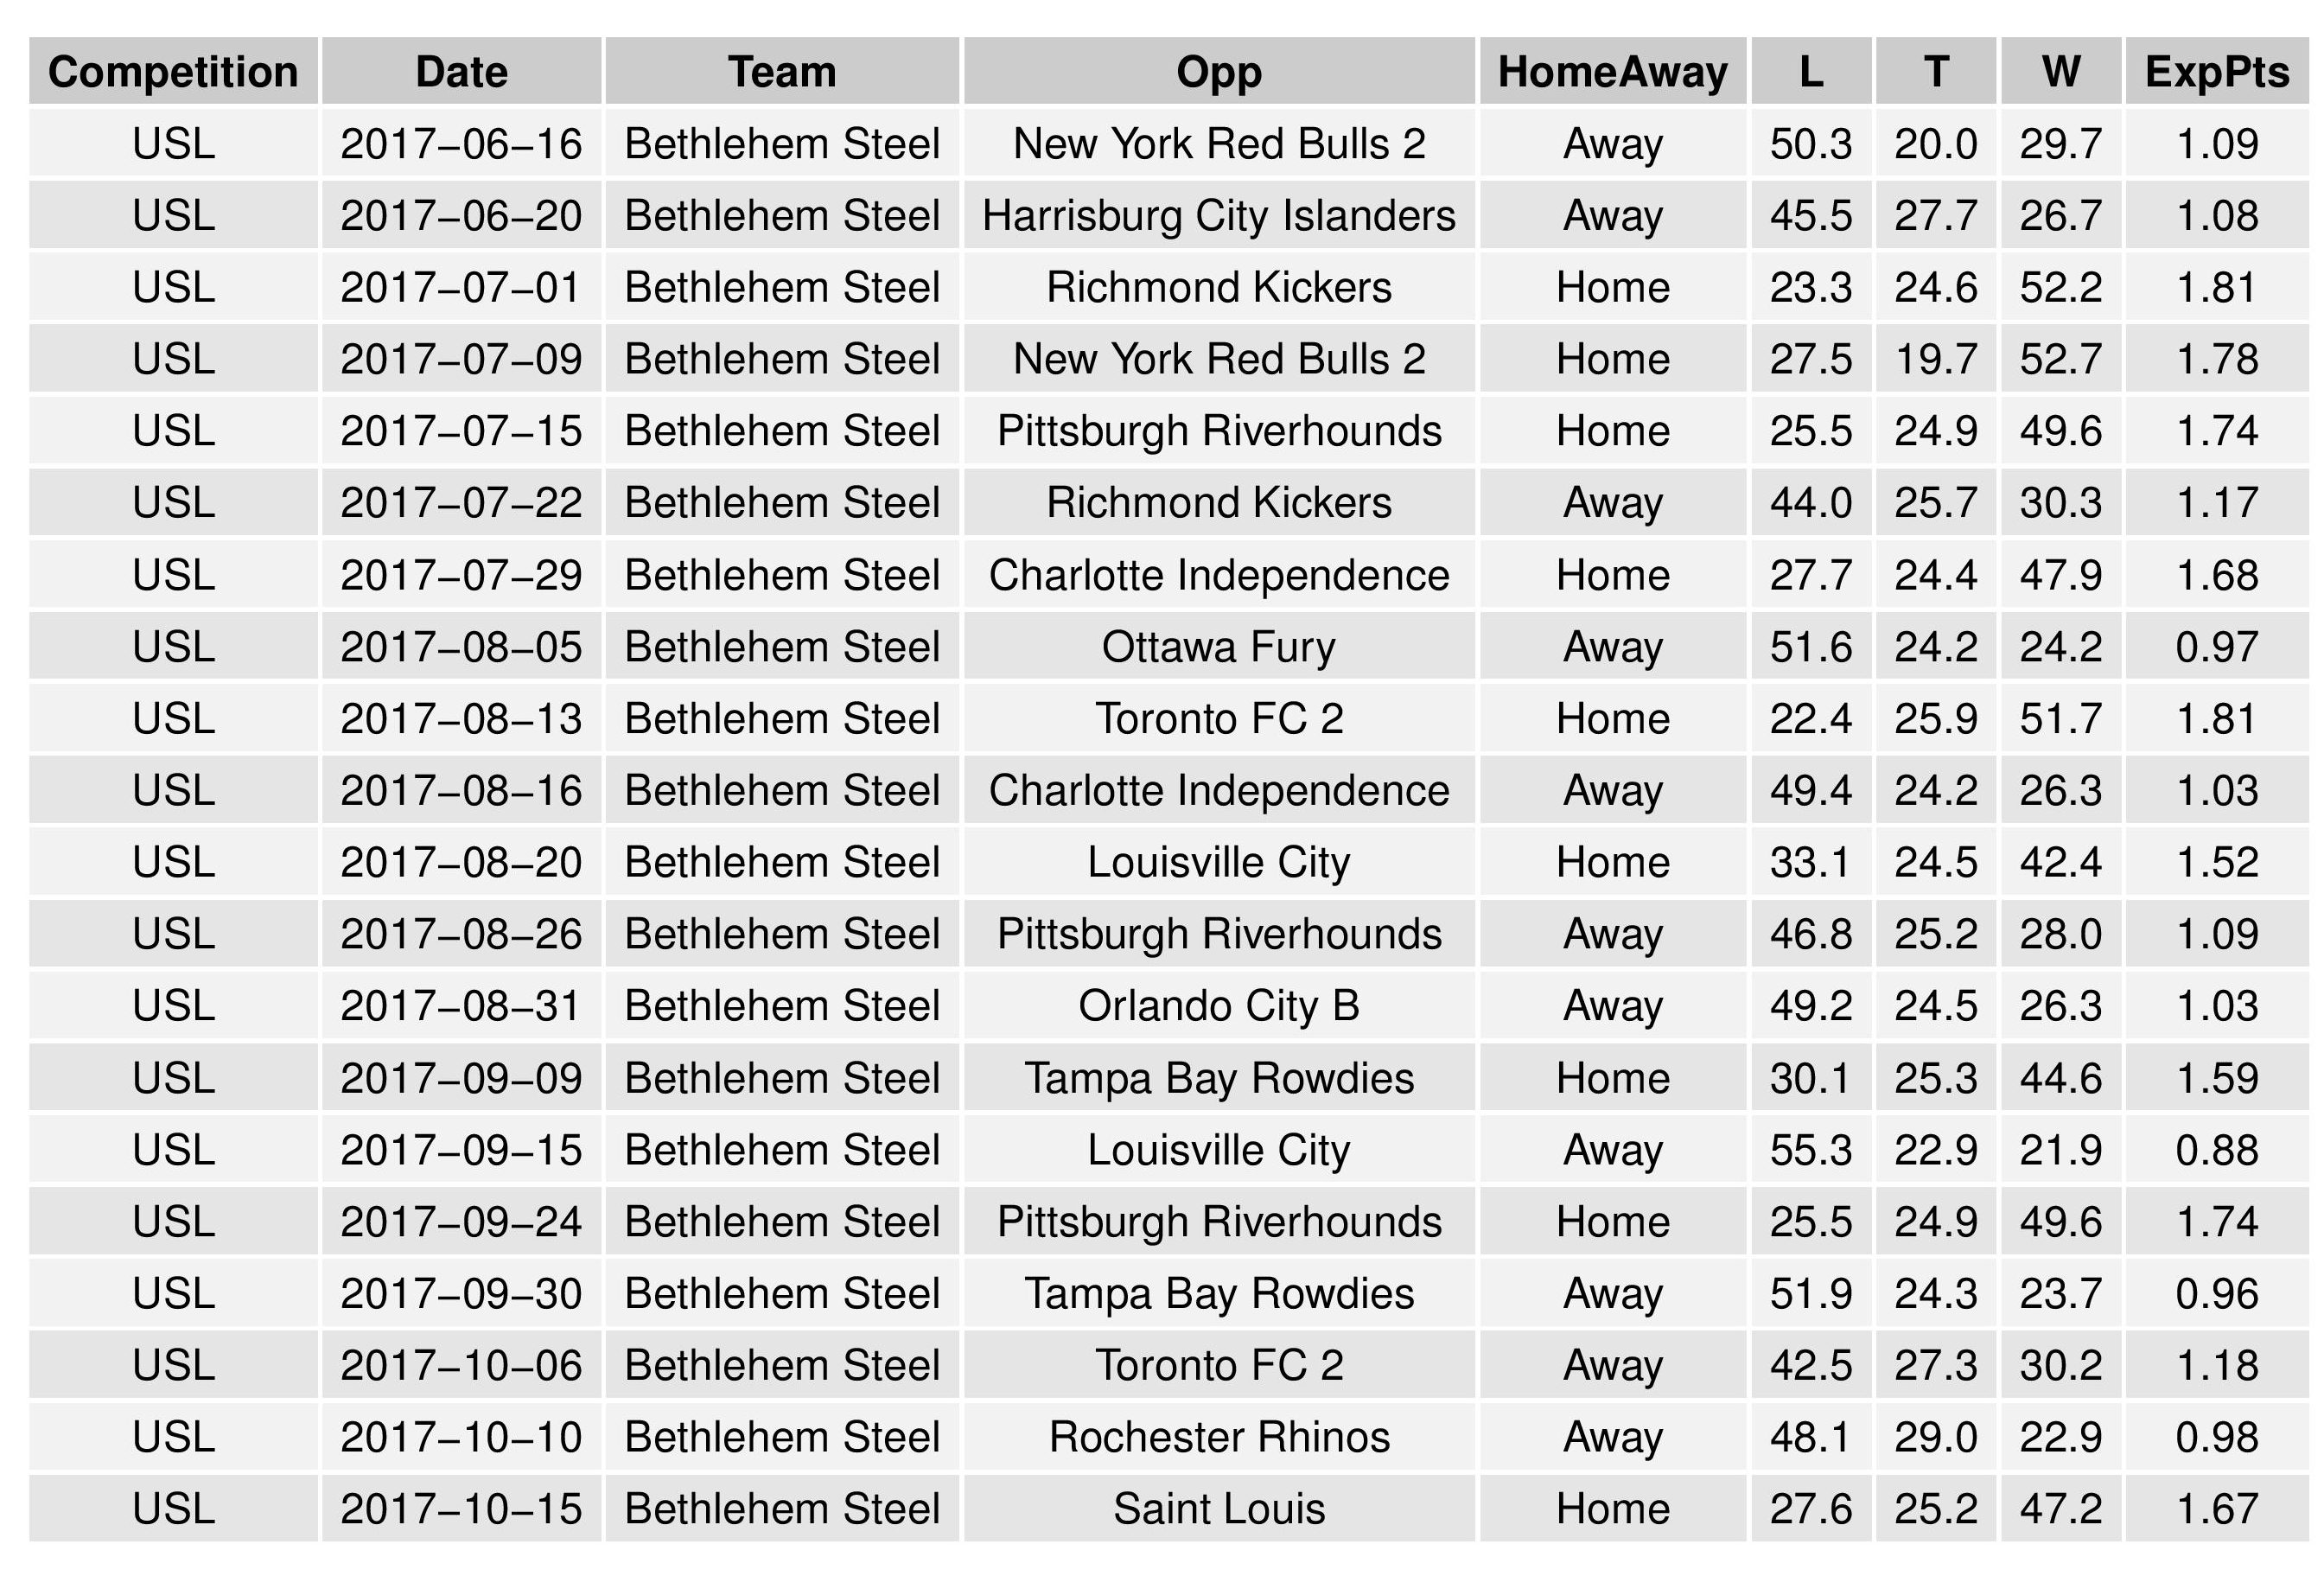
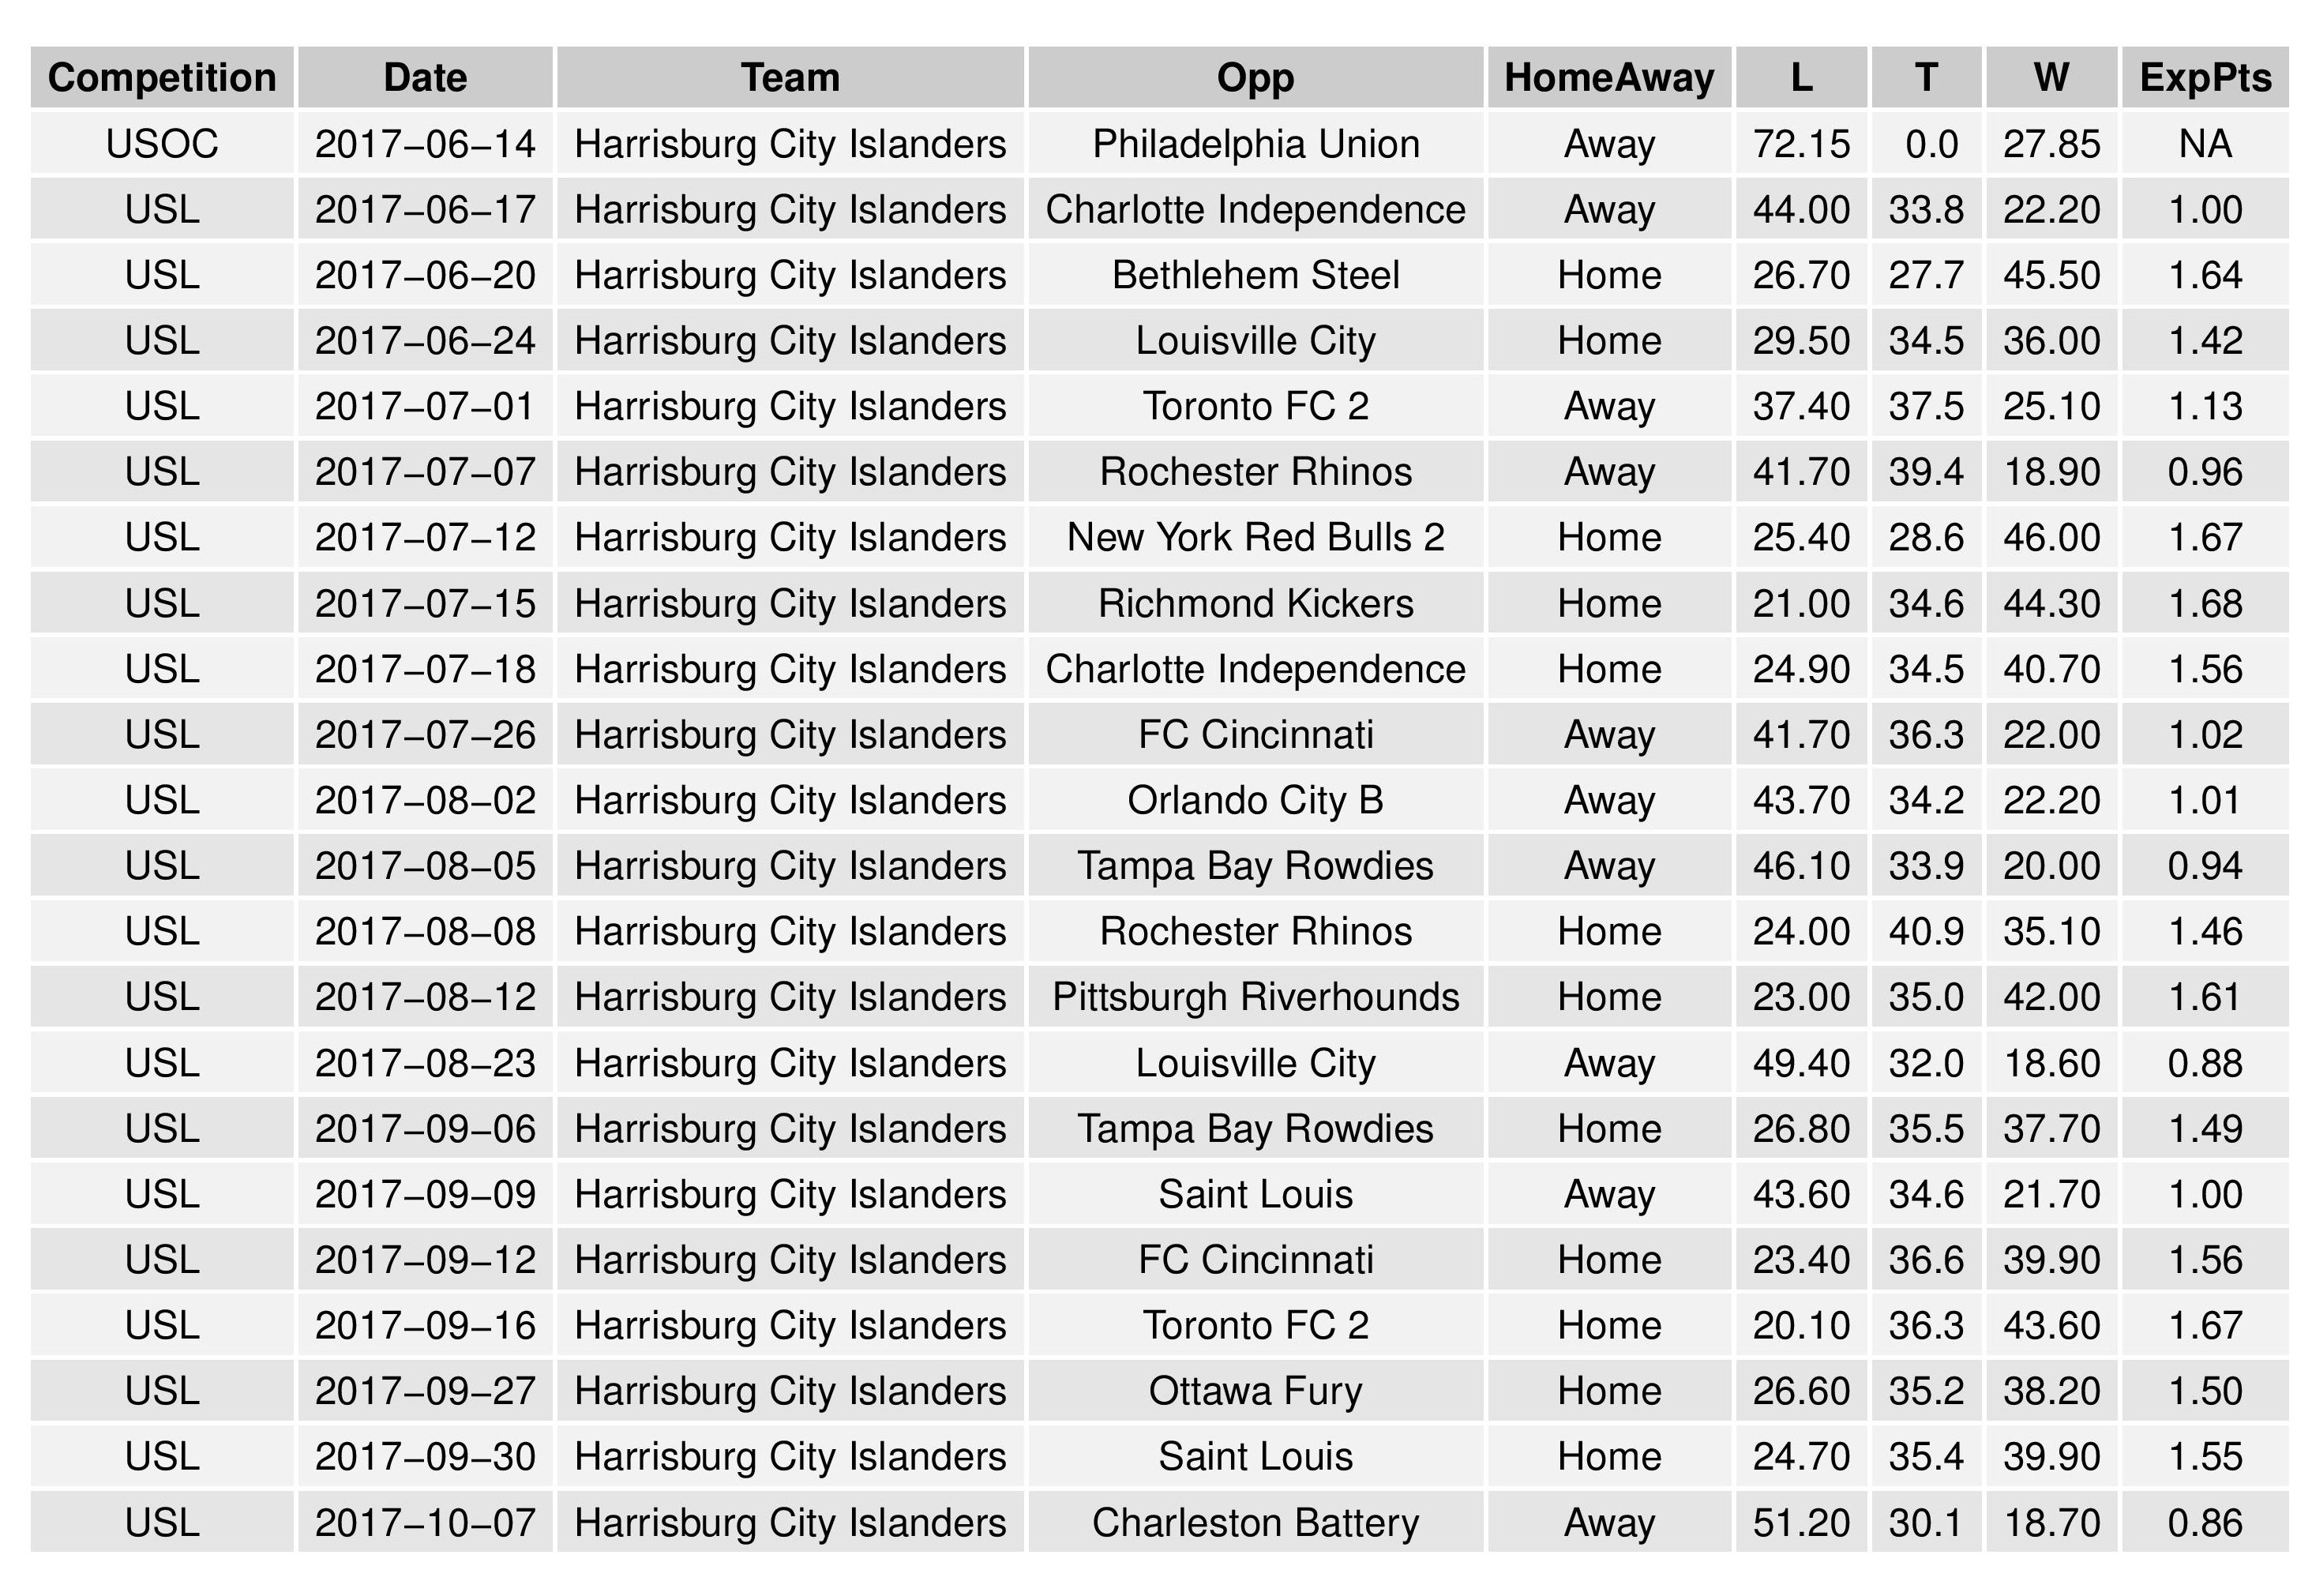
The following shows the expectations for upcoming matches for both Bethlehem and Harrisburg:
Model Validation
This chart is the same as that in the MLS forecast (except for USL matches instead of MLS).
Remember that these data points are not fixed until the end of the season.
NWSL
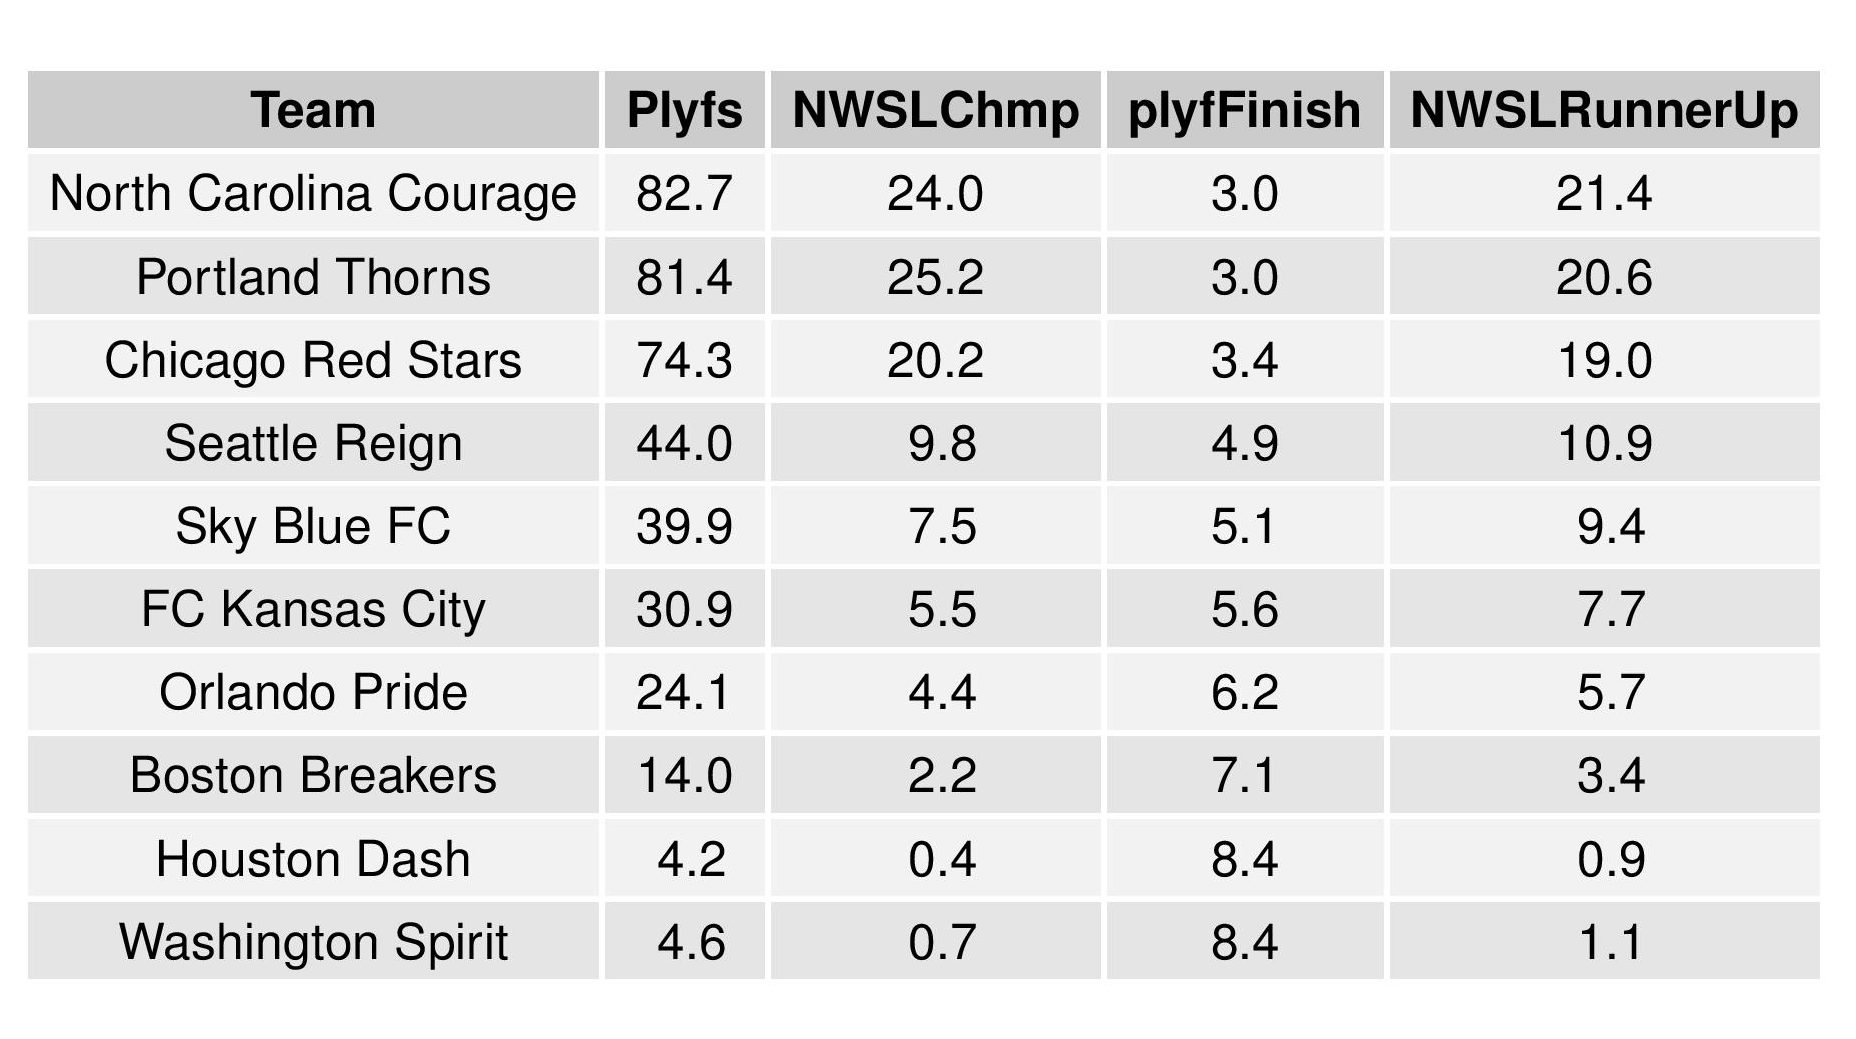
Power Rankings
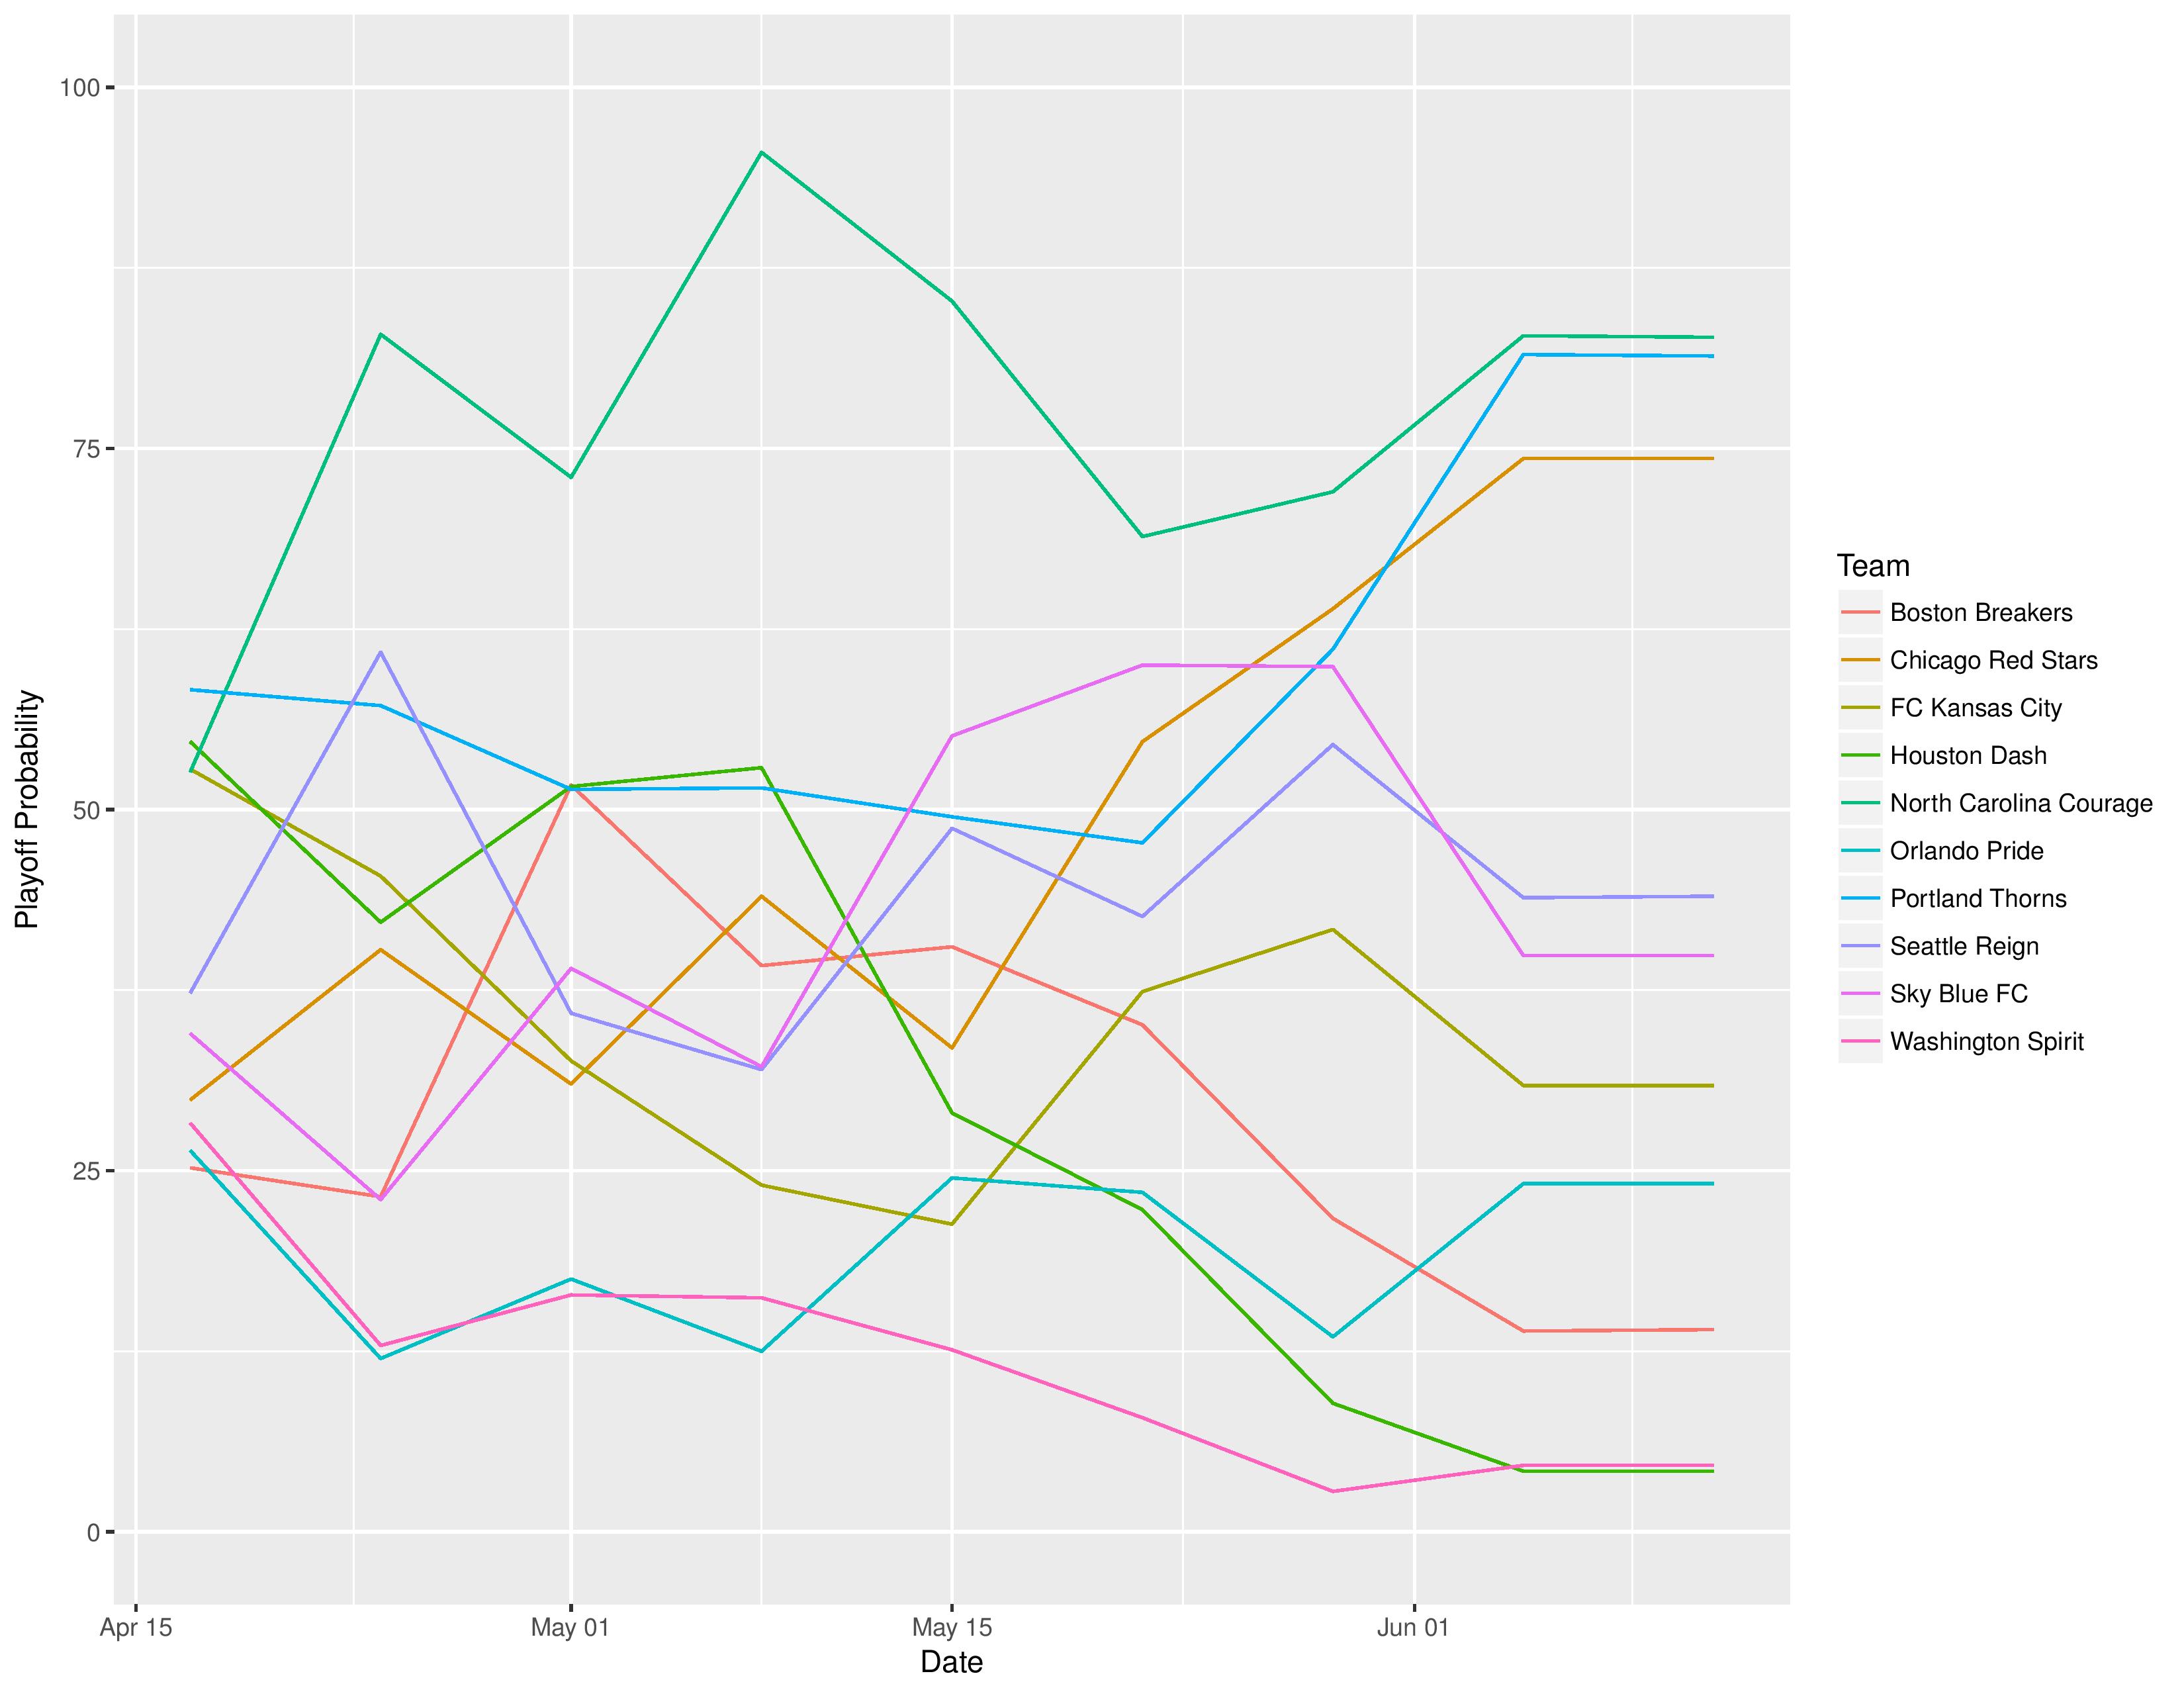
Playoffs probability and more


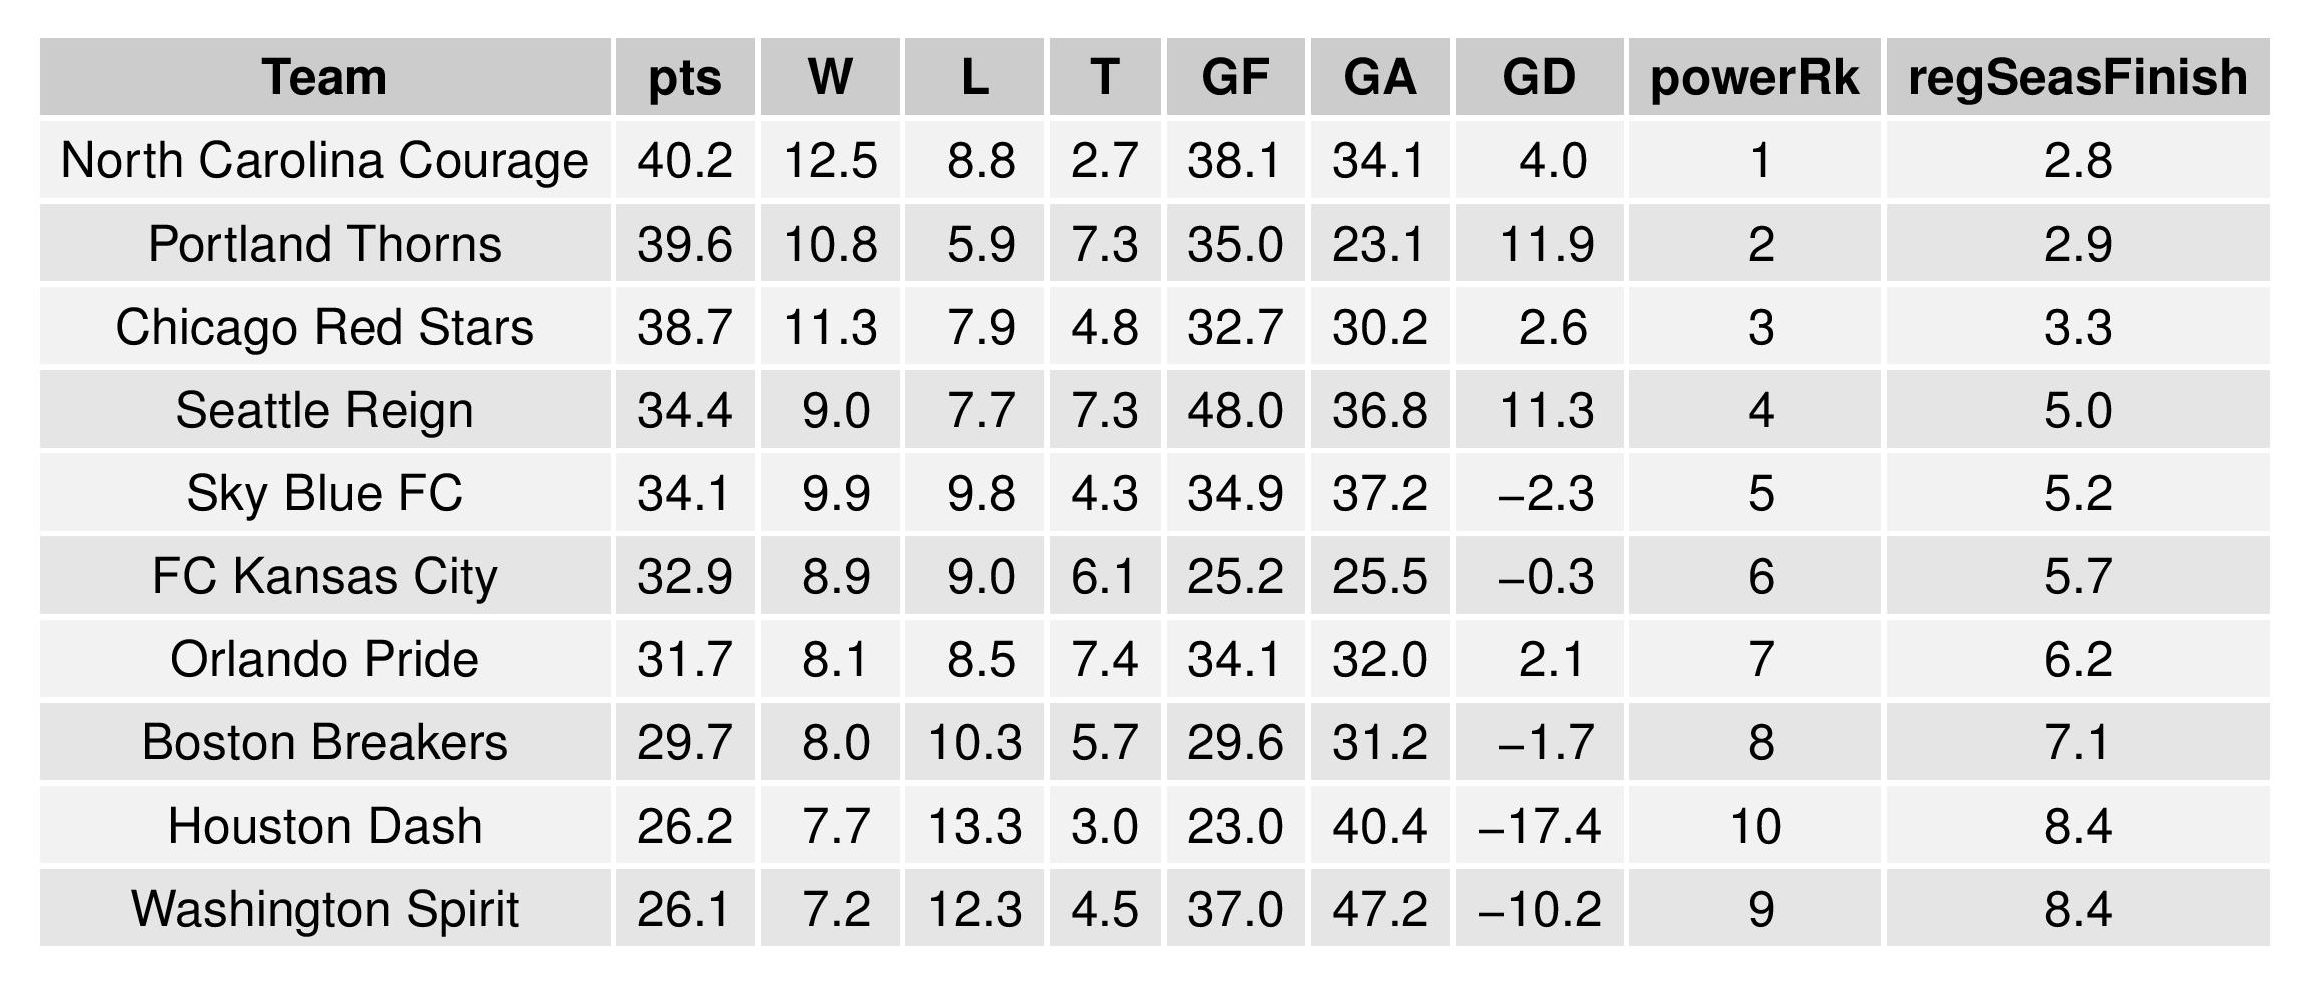
The following shows the summary of the simulations in an easy table format.
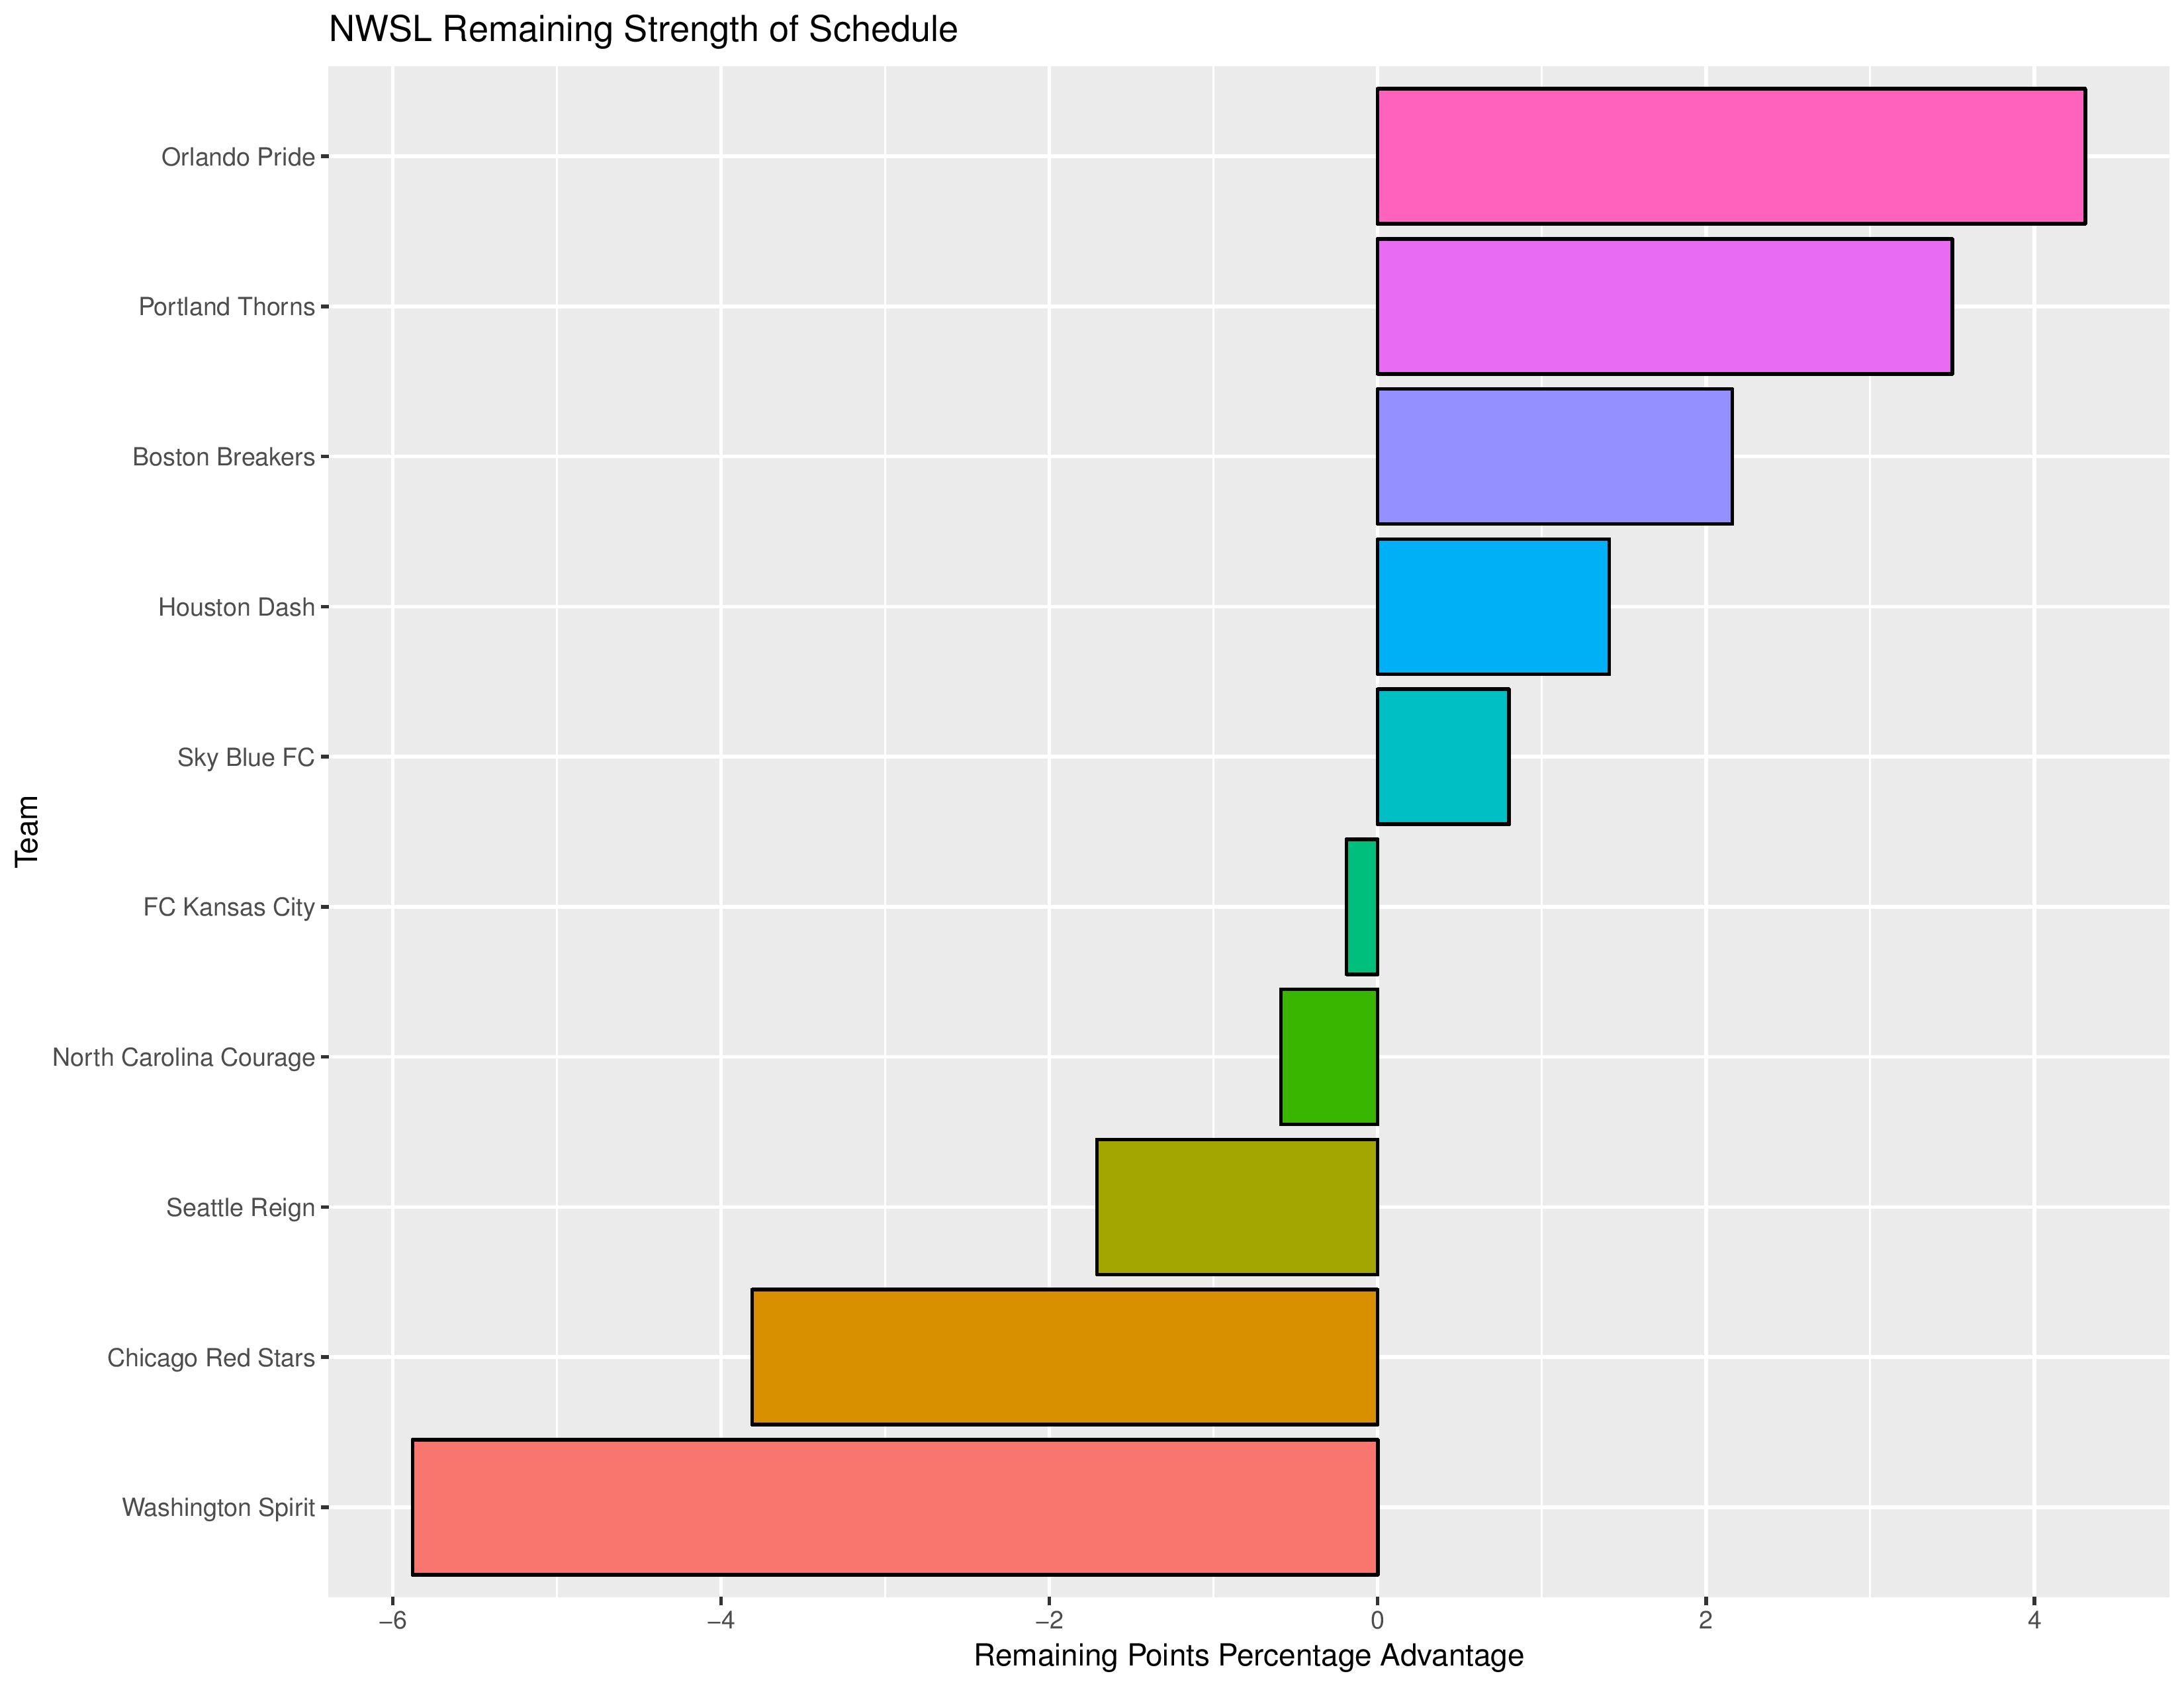
As a new feature, we can also show how the Remaining Strength of Schedule affects each team.
The “Points Percentage Advantage” shown on the X-axis represents the percentage of points expected over the league average schedule. This “points expected” value is generated by simulating how all teams would perform with all remaining schedules (and therefore judges a schedule based upon how all teams would perform in that scenario).
In short, the higher the value, the easier the remaining schedule.
It can also be true that a better team has an ‘easier’ schedule simply because they do not have to play themselves. Likewise, a bad team may have a ‘harder’ schedule because they also do not play themselves.
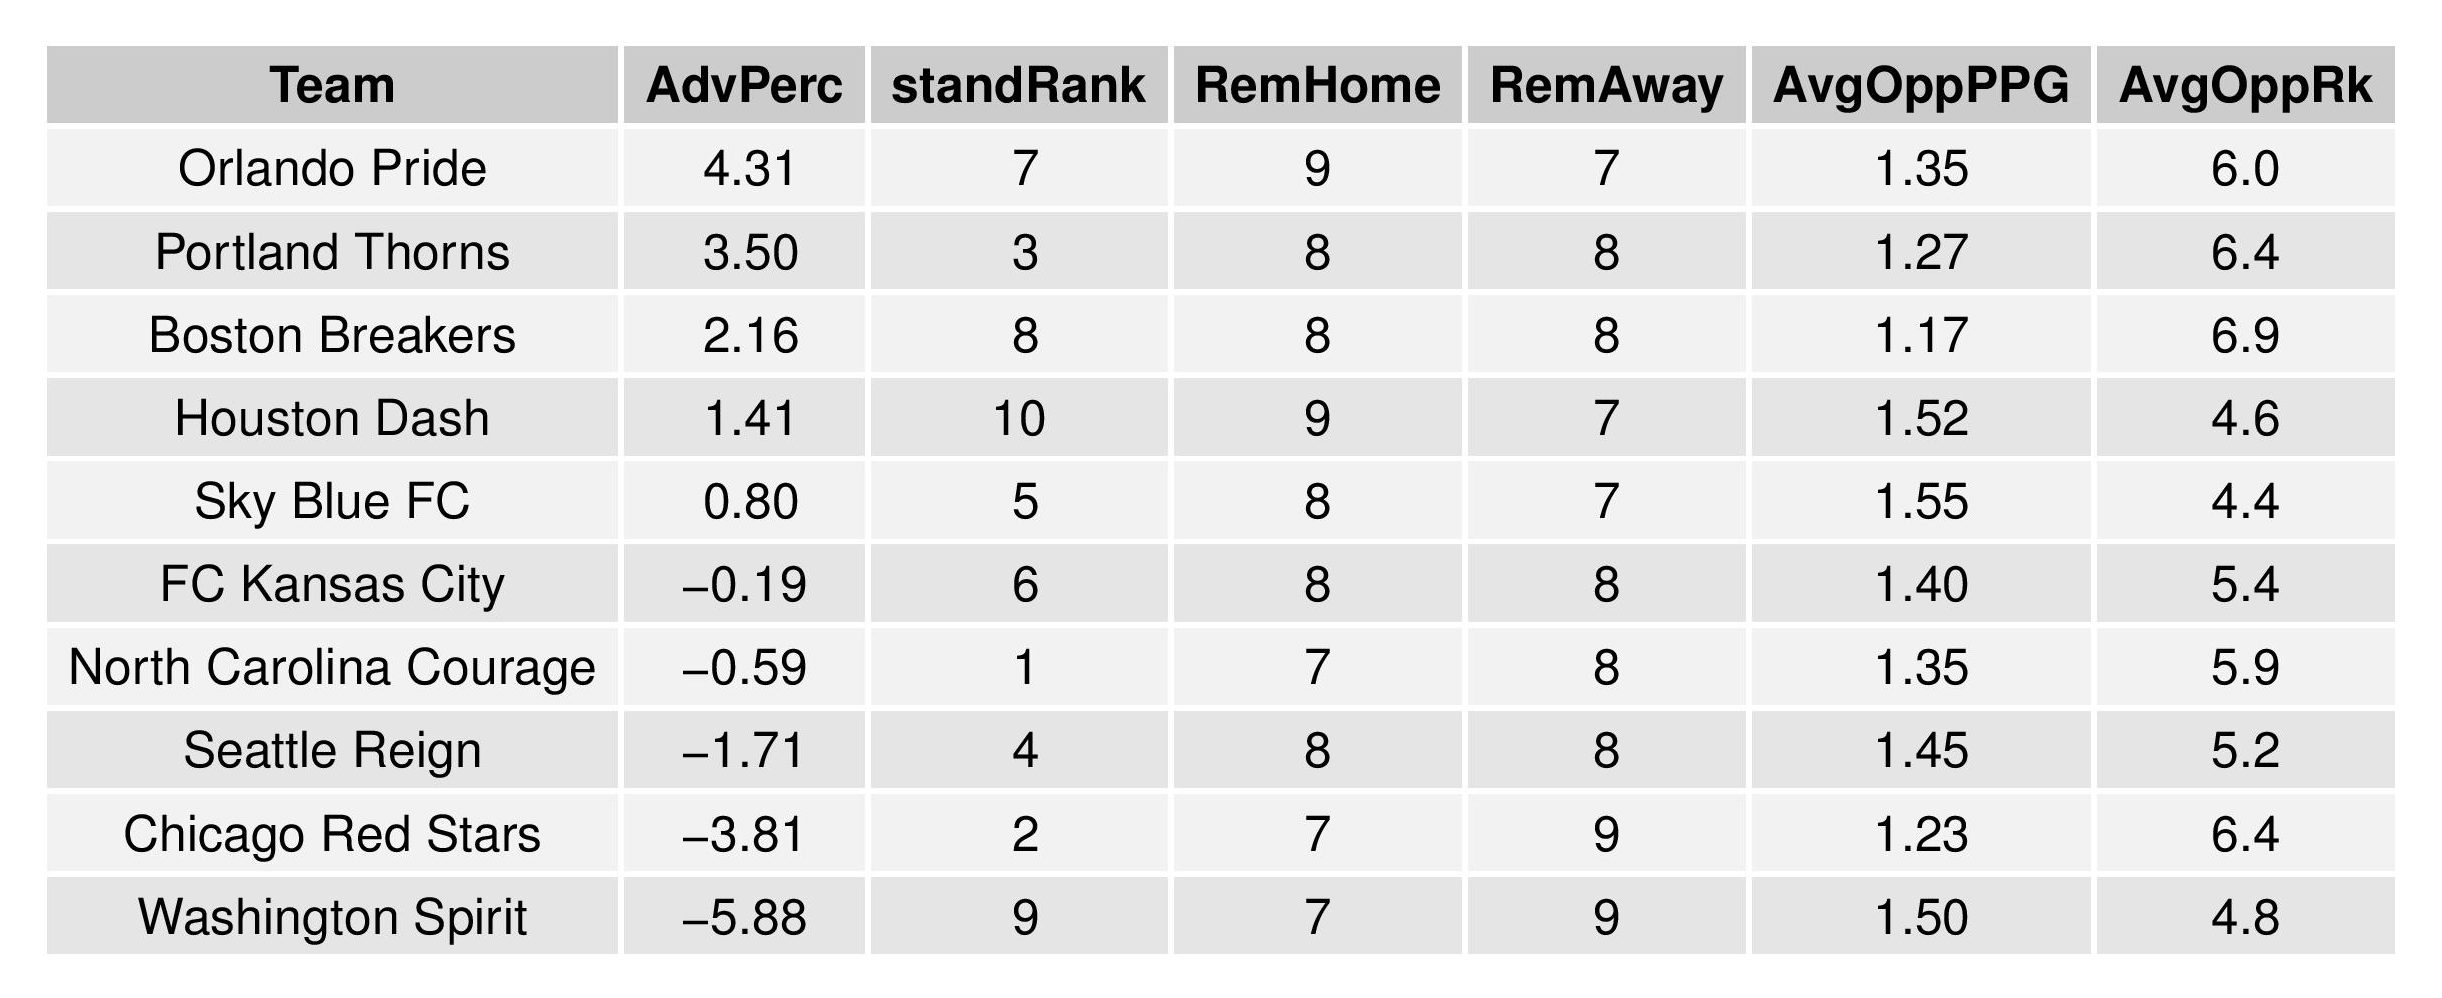
The table following the chart also shares helpful context with these percentages:
Accompanying the advantage percentage in the following table is their current standings rank (right now ties are not properly calculated beyond pts/gd/gf), the remaining home matches, the remaining away matches, the current average points-per-game of future opponents (results-based, not model-based), and the average power ranking of future opponents according to SEBA.
The SEBA Projection System is an acronym for a tortured collection of words in the Statistical Extrapolation Bayesian Analyzer Projection System. Check out the first season’s post to find out how it works (https://phillysoccerpage.net/2017/03/03/2017-initial-seba-projections/)

Thanks as always, Chris. I’m guessing the draw last night in Panama helped the US chances of qualifying for Russia (along with Sunday’s draw at Azteca). I’m curious to see what SEBA says about that before the Gold Cup numbers start flowing in (since the Gold Cup somewhat dilutes reality as it will probably not be the full A team for the US.)
Hey Andy. An update on USMNT will be coming out tomorrow. I’ll also probably shoot out another one ahead of the Gold Cup, to reflect Mexico’s enhanced data following the Confederations Cup.
–
I don’t pay too close of attention on which squads are A/B (and when Tim Ream is starting vs. Mexico in WCQ, I’m not sure who is A-team anymore either), but I’d be surprised if the US trotted out a B team (maybe a skewed-younger team?) for the Gold Cup, given its importance in getting to the 2021 Confederations Cup, especially since Mexico’s busy schedule might force them to play a truly-B-team.
I didn’t check the preliminary roster that carefully but my guess is that some of the European based players won’t play given that it is at the tail end of their off season and that they gave part of the off season up for the qualifiers.
Antoinett Kroatien MichelleL
KTZCierra Turkiet VickeyCon
AlyssaHor Danmark ChunMusci
JudiFreyt Chile Gladyskjm
BernieRas Ukraina HayleySwa
Fredrickq Olympique Lyonnais Kerstinxo
WarrenBeh Elfenbenskusten RalfVjbs
Kristophe Everton Eulaliair
TwylaUzb Danmark BenDasns
AnthonyAb Osterrike DeborahSo
ReganGuer Spanien LinaBenne
StantonBo Ukraina QOGIndiae
WarrenBeh Elfenbenskusten RalfVjbs
ReynaldoS Everton JamiPrieu
ClairCoov Chelsea MicheleFe