Last week we tried to introduce some basic soccer sabermetrics, courtesy of Rob Jovanovic’s Moving The Goalposts (Pitch Press, 2012), to determine which era of U.S. professional D1 soccer was the most competitive, and which produced the greatest teams.
As we saw, the results were surprising—and, frankly, raised as many questions as answers. For instance, while the concept of “Competitive Index” and its use to determine “Greatness Ratings” for teams is helpful, the fact is the quality of players in U.S. soccer over the years has been too random to allow a reliable era-to-era comparison of teams. For example, high CI that season or no, there is no way that the 1972 New York Cosmos would stay on the field with the 1978 version that played in a statistically less-competitive season. While comparison of MLS-era teams is valid (as the talent pool has always been pretty much the same since 1996, as have the budgets), and we can confidently say the 2004 Kansas City Wizards are the greatest single season MLS side ever, we are still kind of in the dark when it comes to teams from other eras.
History wonk that I am, I was not satisfied with the ultimate results, and wanted to try to come up with other ways at looking at teams from other eras. Having exhausted Jovanovic’s models—and not clever enough to come up with any on my own—I had hit a dead end.
Hockey to the rescue, eh?
Then I remembered one of my favorite books involving the other great passion in my life: hockey. Hockey is the sport that is probably closest to soccer as far as tactics and that nebulous concept we call “vision” (putting aside team handball, which is virtually invisible in the United States). Also like soccer, it is not a sport that lends itself to easy statistical analysis: traditionally, hockey limited itself to goals, assists, and goals-against-average for goaltenders. Plus/minus—a very useful stat—did not enter the fray until the late 1960s (although the Montreal Canadiens had been keeping such numbers privately for about 10 years prior to that).
As far back as the 1980s, I was frustrated by the fact hockey did not provide the statistical orgasms baseball could. Apparently, I wasn’t alone—Jeff Klein and Karl Eric Reif had the same frustrations, prompting them to write the seminal work on statistical analysis of hockey, The Hockey Compendium (McClelland & Stewart, Ltd., 2001 (2d Ed.)).

The Compendium introduced a lot of new concepts—“adjusted” plus/minus to take into account the “rising tide floats all boats” effect a bad player might enjoy with a good team, for instance. One of those concepts—using save percentage instead of GAA as a true measure of goaltender ability—is now universally applied in leagues around the world.
The similarities between hockey and soccer make many of the Compendium concepts readily adaptable to the kicking game. Of course, hockey gives a better statistical sampling for evaluating individual players, as the smaller surface and increased number of “touches” ice hockey players get makes it harder to “hide” in games. Still, hockey measures give us a good place to start. By way of example, you can check out my 2008 attempt to import save percentage factors into soccer, using Compendium concepts. (I do note that the tables appear to have disappeared from this article, unfortunately.)
Klein and Reif did not limit themselves to evaluating individual player performance. They also tried to tackle the same age-old questions we did last time out: which teams were the greatest of all time. So let’s take a look at some of those concepts now, and see what they can tell us about the great U.S. soccer teams of the past (again, “past,” for our purposes, is the original American Soccer League (1921-31), original North American Soccer League (1967-84), and Major League Soccer (1996 to present)).
The winningest teams
The Compendium starts with a most basic concept—best “winning percentage.” Of course, we remember from last time that, in a sport with ties (like soccer and hockey), “winning percentage” really means “percentage of available points won.” Either way, it’s a good measure of success, and allows comparison across seasons that did not contain the same numbers of games.
Fortunately, I had already completed the arduous task of converting every single U.S. D1 season into a “single table,” W-D-L format, with standard assignment of points for the era (i.e., “fixing” ties in the late NASL/early MLS; ignoring the NASL’s 6 points per win/1 point for each goal up to 3 per match system) for the last set of articles. As a result, the data were ready to be imported into the Compendium’s constructs.
The following is a list of the Top 20 regular season finishes based on Win Percentage—note that it is not limited to league champions or teams that would have won the Supporters’ Shield (or an equivalent, had one been offered).
| Rank | Team | League | Season | W-D-L | TP | PCT |
|---|---|---|---|---|---|---|
| 1 | New York Cosmos*§ Fall River Marksmen* | NASL ASL | 1978 1929-30 | 24-2-4 19-7-1 | 50 45 | .833 .833 |
| 3 | Fall River Marksmen* | ASL | 1925-26 | 30-12-2 | 72 | .818 |
| 4 | Fall River Marksmen* | ASL | 1923-24 | 19-6-2 | 44 | .815 |
| 5 | Philadelphia FC* | ASL | 1921-22 | 17-4-3 | 38 | .792 |
| 6 | J&P Coats* | ASL | 1922-23 | 21-2-5 | 44 | .786 |
| 7 | Vancouver Whitecaps | NASL | 1978 | 22-3-5 | 47 | 783 |
| 8 | Atlanta Chiefs* | NASL | 1969 | 11-3-2 | 25 | 781 |
| 9 | New York Cosmos*§ Bethlehem Steel* Kansas City Spurs¥ Bethlehem Steel | NASL ASL MLS ASL | 1980 1926-27 1969 1922-23 | 20-8-4 29-8-7 10-4-2 18-6-4 | 48 66 24 42 | .750 .750 .750 .750 |
| 13 | New York Cosmos* | NASL | 1979 | 19-6-5 | 44 | .733 |
| 14 | Los Angeles Galaxy* | MLS | 1998 | 22-4-6 | 70 | .729 |
| 15 | Seattle Sounders | NASL | 1980 | 20-6-6 | 46 | .719 |
| 16 | Vancouver Whitecaps* | NASL | 1983 | 17-9-4 | 43 | .717 |
| 17 | Bethlehem Steel | ASL | 1925-26 | 29-5-10 | 63 | .716 |
| 18 | New Bedford Whalers* Bethlehem Steel | ASL ASL | 1931 Fall 1923-24 | 14-2-5 18-4-6 | 30 40 | .714 .714 |
| 20 | Ft. Lauderdale Strikers* | NASL | 1977 | 17-3-6 | 47 | .712 |
(*–table champions; §–playoff champions (where applicable); ¥–champions by virtue of league system of computing points)
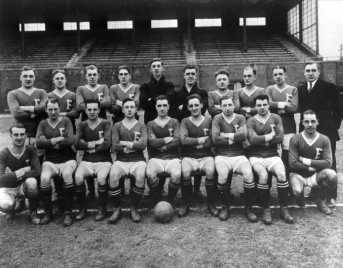
Looking at this list, we can see where sides like New York Cosmos, Fall River Marksmen, and Bethlehem Steel earned their reputations, as they consistently trotted out the most dominant sides of their eras. While Fall River’s placing teams in the top three is impressive, take note of poor Bethlehem Steel—three of its entries finished in second in those seasons. (You can see footage of Fall River in US Open Cup play from 1924 at the end of this article.) Still, the Steelmen put five teams in the top 20 (including the year they masqueraded as “Philadelphia FC” in 1921-22), Fall River places three (all at the top), and the Cosmos grab two spots. Along with Bethlehem Steel for those three seasons, the 1978 Vancouver Whitecaps and 1980 Seattle Sounders get special mention as all-time best also-rans. Finally—in a testament to its successful attempts at maintaining strict parity—MLS only places one team on the list.
Also, in a continuing indictment of playoffs as a means to determine a league champion, note that four of these teams did not win the league championship after having finished at the top of the table.
When winning isn’t enough—The most devastating teams
As noted last time, using straight Win Percentage is useful, but deceiving—we have already seen how some of these teams ran up their records in shockingly uncompetitive seasons. In fact, the Compendium acknowledges as much, mentioning a “Spread Of Competition” factor (using the exact formula Jovanovic used for his “Competitive Index”). Reif and Klein did not try to use their “Spread of Competition” as a multiplier against Win Pct the way Jovanovic did, however, presumably noting the inherent flaws in such an approach. Instead, they looked to other criteria to try to determine which might have been the truly strongest team.
One factor they created was the Devastation Scale. In their words:
Another thing common to the teams with the best records ever is that they led their league, or were well up among the leaders, in both offence and defence. It’s only common sense, again, really; you don’t win as consistently as those teams did by playing a one-dimensional game. It is possible, of course, to win every game by 3-2 or 4-3, although living on the edge like that would probably necessitate the team hiring an ulcer specialist by the end of the season. But were the winningest teams of all time the teams that squeaked through the tight ones night after night, or were they teams that routinely blew away the opposition and had their next opponent shaking in their skates? Well, it’s easy enough to figure out which of history’s teams crushed everything in their path; all we need to do is compare the ratio of the number of goals they scored to the number they allowed (goals-for divided by goals-against).
So which U.S. soccer teams wreaked a swath of destruction over the years? Here is a Top 20 list (DR = ”Devastation Rating”):
| Rank | Team | League | Season | W-D-L | GF | GA | DR |
|---|---|---|---|---|---|---|---|
| 1 | Fall River Marksmen* | ASL | 1923-24 | 19-6-2 | 59 | 19 | 3.11 |
| 2 | Fall River Marksmen* | ASL | 1924-25 | 27-12-5 | 113 | 38 | 2.97 |
| 3 | Fall River Marksmen* | ASL | 1925-26 | 30-12-2 | 142 | 51 | 2.78 |
| 4 | Bethlehem Steel | ASL | 1924-25 | 29-5-10 | 127 | 53 | 2.40 |
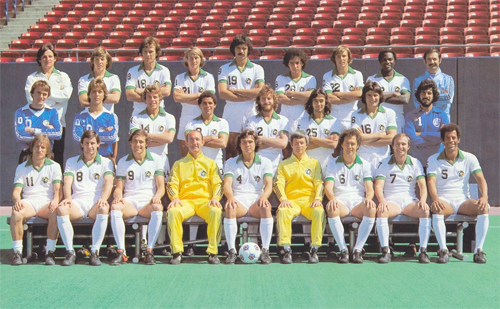
| 5 | New York Cosmos*§ | NASL | 1978 | 24-2-4 | 88 | 37 | 2.38 |
| 6 | Vancouver Whitecaps | NASl | 1978 | 22-3-5 | 66 | 28 | 2.36 |
| 7 | Atlanta Chiefs* Seattle Sounders | NASL NASL | 1969 1980 | 11-3-2 20-6-6 | 46 69 | 20 30 | 2.30 2.30 |
| 9 | J&P Coats* Bethlehem Steel | ASL ASL | 1922-23 1922-23 | 21-2-5 18-6- | 68 59 | 30 26 | 2.27 2.27 |
| 11 | New York Nationals | ASL | 1929 Fall | 10-3-8 | 52 | 23 | 2.26 |
| 12 | Real Salt Lake | MLS | 2010 | 15-11-4 | 45 | 20 | 2.25 |
| 13 | New York Cosmos*§ | NASL | 1980 | 20-8-4 | 83 | 37 | 2.24 |
| 14 | Bethlehem Steel* | ASL | 1926-27 | 29-8-7 | 114 | 52 | 2.19 |
| 15 | Seattle Sounders | NASL | 1974 | 10-4-6 | 34 | 16 | 2.13 |
| 16 | Fall River Marksmen* | ASL | 1929-30 | 19-7-1 | 84 | 40 | 2.10 |
| 17 | Philadelphia Atoms§ | NASL | 1973 | 9-8-2 | 29 | 14 | 2.07 |
| 18 | New York Cosmos* | NASL | 1976 | 16-2-6 | 65 | 32 | 2.03 |
| 19 | Philadelphia FC* Boston Wonder Workers | ASL ASL | 1921-22 1929 Fall | 17-4-3 12-3-6 | 72 44 | 36 22 | 2.00 2.00 |
(*–table champions; §–playoff champions (where applicable))
Once again, we have a list dominated by teams from the “Golden Age”—ASL teams make up eleven of the 20 teams. Notably, two teams—the New York Nationals and Boston Wonder Workers in the Fall 1929 season—make the list despite finishing fourth and third, respectively, in the table that year. The true greatness of the Fall River and Bethlehem sides of the era notwithstanding, the relative non-competiveness of the early ASL is no doubt a factor in the devastation wreaked by the top teams ASL teams on this list.
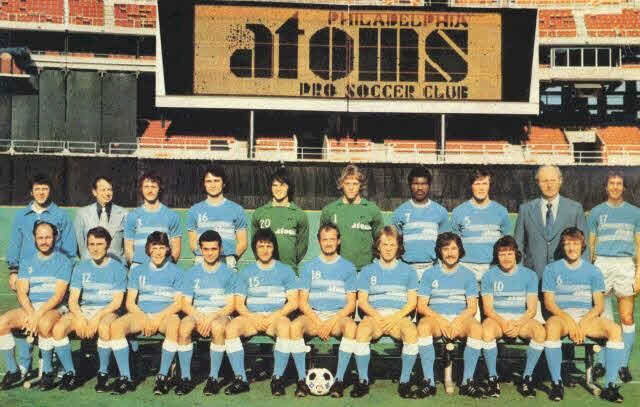
Once again, the near-absolute parity of MLS is apparent, as only one team—the 2010 Real Salt Lake side—makes the list. Interestingly, the Royals won neither the Supporters’ Shield nor the MLS Cup that year. As far as the NASL, we once again find several Cosmos’ sides, and victims of bad timing 1978 Vancouver and 1980 Seattle (although we note the latter was more “devastating” than the Cosmos were that year). Two teams not seen on the last list are your 1973 Philadelphia Atoms, who won the NASL playoffs that year after finishing second in the overall standings, and the 1974 Seattle Sounders, who finished in second in the overall table and did not even make it to the finals that year. Both teams devastated teams more through stifling defense than overwhelming offense. The fact that both were also expansion teams also says a lot about the level of quality of the NASL in the pre-Pelé years.
Looking at these numbers, we are again confronted with the same issue we met last time: given their druthers, would American soccer fans prefer the “glamor” of the ASL and NASL, where truly dominant teams would win title after title while running roughshod through substandard competition? Or do they prefer the stifling parity of MLS, where any given team has a chance of winning hardware?
Given our views of history—the continued love of the New York Cosmos immediately comes to mind—it is certainly clear that we tend to recall more fondly the staggeringly dominant teams of a season than we do champions like Real Salt Lake in 2009, who won the MLS Cup despite an unimpressive .444 winning percentage that year. The two tables above at least confirm that the teams from the past we remember as great truly were great, and not just remembered because of a few stars.
Still, the ultimate answer still eludes us—which was the best U.S. team ever? Next time out, we’ll use some more Compendium concepts to further examine the question as we inch closer towards a conclusion.
The Fall River Marksmen in action against Vesper Buick of St. Louis in the 1924 US Open Cup final

In that vein – Castrol put together the top XI all time US nats – http://tinyurl.com/abgaewu – who do you see making that list? Did they get it right?
I notice this blog places a lot importance on the past, as does the Castrol team – do we just always look back on rose-colored lenses?
I think nostalgia is a powerful lure, and we do tend to romanticize the past. As has been remarked by others, the “golden age” of any given sport always tends to be the age of when the “ruling generation” happened to be kids.
As noted in the first article of the “greatest team” series, though, I wasn’t trying to look back with rose colored glasses so much; rather, I was hoping to better connect U.S. soccer with a past that, quite frankly, MLS is all-too-happy to ignore.
Fantastic beat ! I wish to apprentice while you amend your website, how
could i subscribe for a blog site? The account helped me a acceptable
deal. I had been tiny bit acquainted of this your broadcast
offered bright clear idea
Greetings! This is my first comment here so I just wanted to give a quick shout out and tell you I truly enjoy reading your blog posts.
Can you recommend any other blogs/websites/forums that cover the same subjects?
Thanks for your time!