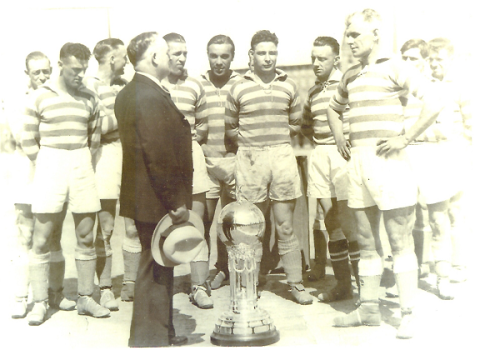
Featured image: The ASL’s Fall River Marksmen, National Challenge Cup winners in 1931.
Last time out, we examined some of the statistical constructs created by Rob Jovanovic in his book, Moving The Goalposts (Pitch Press, 2012). Specifically, using his “Competitive Index” (explained in detail in our last article), we examined the three major D1 soccer leagues in U.S. history (original American Soccer League (1921-31), original North American Soccer League (1967-84), and Major League Soccer) and determined that MLS’ salary cap and player allocation rules have resulted in the highest level of parity and competitiveness in American soccer history, while the “golden age” of the 1920s actually featured a number of seasons where the haves completely dominated the have-nots.
This time out, we are going to answer the obvious follow-up question: as MLS is a stable and “boringly-competitive” league, has it thus failed to produce the best clubs in U.S. history, leaving those honors to storied clubs like New York Cosmos and Fall River Marksmen?
The Greatness Rating
Regardless of sport, trying to compare teams from different eras is always problematic. Rule changes, equipment improvements, better players, and a variety of other factors make it impossible to do an apples-to-apples comparison. Does anyone really think the dominant Cleveland Browns NFL teams of the 1950s could stay on the field with even the worst modern gridiron team, for instance?
Jovanovic recognizes the problem, and creates a formula to try to address the question of rating teams from different eras in his chapter, “By Far The Greatest Team”:
“And it’s [insert your suitably-syllabled team name here, repeat], we’re by far the greatest team you’ll ever see.” It’s a song that’s been sung for decades, mostly by fans of teams who are far from the greatest team that their opponents will ever see, it’s more a declaration of undying commitment to the cause. But who, at club level, could really sing the song with any chance of it being remotely appropriate?
For this section I decided to try to deduce the greatest club side in English football history. Bill Shankly famously said “first is first, second is nowhere,” so I’ve been through each league champion and worked out their Win Pct. Then I had to try and put each one in some kind of context because a team might win more games if they were playing against more weak teams, so I had to use the Competitive Index (CI) as previously discussed, for each season….
The calculation I decided on was a simple one. I adjusted the CI from a percentage by dividing by 100 to get it into the same scale as the Win Pcts. Then I divided the Win Pct by the CI to give me, for want of anything better to call it, the Greatness Rating of each club. If two sides had the same Win Pct but one was playing in a season which was twice as competitive as the other, the side in the more competitive division would have a greatness rating twice as big as the other one. In plain language, the teams getting the most points in the most competitive divisions are the best.
Using his “Greatness Rating,” Jovanovic determined that the 1929-30 Sheffield Wednesday side was the best single-season team in English history, with a 2.40 rating (achieved by a .740 win percentage in a league with a 29.7 CI). According to his calculations, the 1999-2000 Manchester United side was the second greatest (although I note he appears to have erroneously calculated Man U’s Win Pct that year).
The author provides some perspective for these ratings, however: this “doesn’t automatically mean that the 1929/30 Wednesday side would beat the 1999/00 Manchester United team…, but it means, at the time they played, Wednesday were ahead of a tougher bunch of opponents than United were 70 years later. But if the Wednesday players had had the same access to the training methods, equipment and nutrition that the modern players had, there is no reason to think they couldn’t beat them though.”
Who’s great in the US?
Applying the “Greatness Rating” to U.S. soccer teams throughout the three eras produces some interesting results. Before we get to them, however, let’s discuss a few issues unique to U.S. soccer, some of which Jovanovic did not have to consider when creating his rating.
First, it must be recalled that “Win Pct” actually represents “percentage of available points won.” The presence of ties in soccer means that there can never be a pure “winning percentage.” However, “Win Pct” remains useful shorthand for the concept.
Second, very rarely have U.S. leagues played balanced schedules. While, in the grand scheme of things, the advantages gained in 2012 by a team fortunate enough to play Toronto FC three times instead of two is relatively slight, the edge must nevertheless be kept in mind.
Third, we are going to apply the Greatness Rating to teams that won the Supporters’ Shield, or would have won the equivalent were one offered in the ASL and NASL. In other words, champions produced by playoffs are ignored if they would not have also been the champion of a single-table league. (As noted last time, I have converted all historical standings of U.S. leagues to single, W-D-L tables, adjusting results in the latter-day NASL/early MLS where shootouts were used to break ties).
Finally, even considering that CI and “Greatness Ratings” are designed to level the playing field, the fact that U.S. leagues have been prone to considerable rapid expansion and contraction, and varying degrees of talent pools, also makes the approach less-than-perfect. Stated another way, regardless of era we know that major league baseball was being played by the best available players in the world (putting aside the issue of the “color bar” pre-1947). While all soccer leagues suffer from world-wide competition, the U.S. has generally worked at a particular disadvantage. Essentially, the ASL fared best, as the FA was its only real competition for talent in that era, while MLS’ tight salary cap makes it the least competitive of the three U.S. leagues we’re looking at as far as ability to secure the best available talent.
Enough of the caveats—who were the best U.S. teams, using this system? Following is a Top 15 list:
| Team | Season | CI | Win Pct | Greatness Rating |
|---|---|---|---|---|
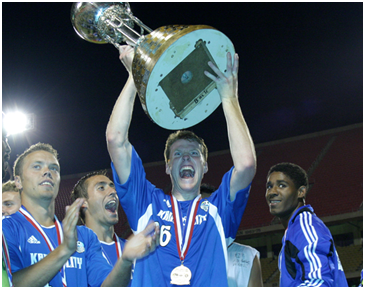
| Kansas City Wizards | 2004 | .178 | .544 | 3.06 |
| Toronto Blizzard | 1984 | .208 | .583 | 2.80 |
| Fall River Marksmen | 1930 Fall | .226 | .630 | 2.78 |
| Los Angeles Galaxy | 2002 | .226 | .607 | 2.68 |
| DC United | 2006 | .229 | .573 | 2.50 |
| Columbus Crew | 2008 | .267 | .633 | 2.38 |
| Fall River Marksmen | 1929-30 | .352 | .833 | 2.37 |
| DC United | 1997 | .280 | .615 | 2.36 |
| Fall River Marksmen | 1928-29 | .295 | .670 | 2.27 |
| Oakland Clippers | 1967 (NPSL) | .297 | .672 | 2.26 |
| Tampa Bay Mutiny | 1996 | .292 | .635 | 2.18 |
| New York Giants | 1937 Spring | .301 | .647 | 2.15 |
| Chicago Fire | 2000 | .292 | .594 | 2.04 |
| New York Cosmos Dallas Tornado | 1972 1973 | .321 .342 | .643 .684 | 2.00 2.00 |
The list reveals a number of surprises.
First, it is interesting to note that the only New York Cosmos team to break the list is the low-budget 1972 version, three years before Warner Brothers opened up its corporate wallet and started acquiring Pelé, Giorgio Chinaglia, Franz Beckenbauer, and all of the other stars that made them famous.
Second, while MLS teams make up a majority of the list, only three of those teams (D.C. 1997, Los Angeles 2002, and Columbus 2008) also went on to win the playoffs. This will likely confirm what most people already believe—the playoffs are a poor way to determine a true champion.
Finally, it appears the Fall River Marksmen have earned their lofty reputation, putting three teams on the list in a three-year period. This period also happened to during the infamous “Soccer War” and Great Depression; nevertheless, Fall River were able to hold it together and remain dominant, even as the rest of the league retrenched and, with contraction, got stronger.
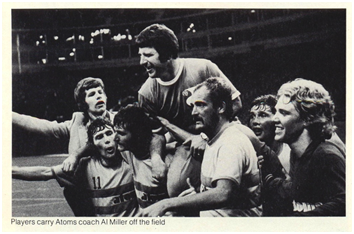
(One side note: the 1973 Philadelphia Atoms also achieved a 2.00 Greatness Rating, but would have finished second in the overall table that year because of having fewer wins than Dallas. However, Philly fans can take solace in the fact the Atoms trounced the Tornado in the final, winning the title.)
(Resemblance to U.S. Open Cup merely coincidental)
Some may question a formula that gives a barely-above .500 team like the 2004 Kansas City Wizards (14-9-7) a greatness rating of over 3. However, consider the year—2004 was the last year of the 10-team MLS, itself three years from the contraction of two teams–and, as we saw last time, the most top-to-bottom competitive season in U.S. soccer history. In the season before the beginning Great Expansion of the league, and the eventual arrival of the Designated Player rule, it is not surprising that MLS would be so fiercely competitive—with everyone operating under the same salary cap with no exceptions, such parity was inevitable. Thus, winning 54% of the points available in such a tough league is a feat much more impressive than winning 80% in a dismal league.
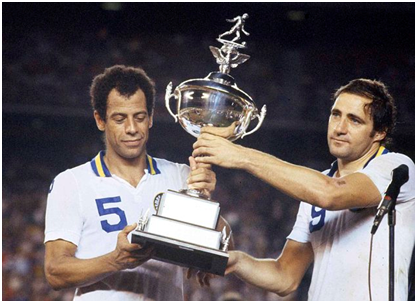
About that: the mark for highest single season Winning Percentage recorded by a U.S. team is shared the 1978 New York Cosmos. In the first year after Pelé’s retirement, the Cosmos managed to take 83% of the points available (if the NASL had been a 2 point win, 1 point tie league). In fact, even under the NASL’s convoluted system of six points for a win and one bonus point for each goal scored up to a maximum of three per match, New York still earned 79% of all possible points (212 out of a possible 270). So how are they not in the Top 15?
Easy—the NASL was total crap in 1978. This was the season the league expanded by six teams, even though it already had a number of teams that were far from solid, secure, or competitive. This resulted in a massive competition gap—the NASL’s CI in 1978 was 56.7, the second-highest of the modern era.
In contrast, the 1928-29 Fall River Marksmen also posted a .833 Win Pct, but in a significantly more competitive league. While the Cosmos got to fatten up on cream puffs like bottom-dwellers Los Angeles Aztecs (.267), Houston Hurricane (.333), and the infamously-attired Caribous of Colorado (.283), the Marksmen’s idea of an easy match was against last place Bethlehem Steel (.481).
Once again, the data reveal this surprising result: MLS is providing us with the best soccer in U.S. history as far as overall competitiveness and great teams able to break through the restrictions of parity. It might be time for the league to get a little love from fans who prefer to watch the EPL and La Liga.
Does all this really mean that a 1978 New York Cosmos side featuring extremely talented (but aged) players like Chinaglia, Beckenbauer, Carlos Alberto, and Dennis Tueart would get thumped by a non-descript 2004 Wizards team with Tony Meola and a just-as-aged Preki? Obviously, we’ll never know. However, we do know that, throughout a season, Kansas City was able to do more, week in and week out, against tougher competition. So who knows?
Next time out, we’ll take a closer look at the teams on the Top 15 list. In the meantime, this hopefully will generate a lot of discussion. More important, and as noted in our first segment, it is hoped that statistical analysis such as this will help “link” the three broken eras of U.S. soccer and allow us to appreciate the same type of heritage enjoyed by fans of other sports.

This looks like a fun exercise – and thanks for the book idea! Castrol does an exercise – similar concept – of putting together the best all-time lineup of US soccer players who played in a World Cup – http://tinyurl.com/abgaewu