Photo: Earl Gardner
The theme leading up to the current international break for the Philadelphia Union has been finishing. Actually, it’s been the theme, with rare exception, throughout much of the season.
As was described in a post last week, the Union are currently bottom of the Eastern Conference in goals, assists, shots, and shots on goal. The only reason they’re not bottom of the league in each of those categories is because Chivas USA have scored an even more paltry 21 goals than the Union’s already inconsiderable 25, which equals an average of exactly one goal per game. With such a scoring record, it comes as no surprise that the Union find themselves in ninth place in the Eastern Conference, 18th in the league.
One year ago, it was a much different story. Well, sort of. Heading into the 26th game of the season, the Union were on a six-game winless streak. Coming off of two losses in a row, they had scored 7 goals while allowing 10 for 3 points. The winless streak would increase to eight games with 2 more draws, including that crazy 4–4 game against New England, before the Union finally snapped it with a 1–0 win over Columbus on Sept. 17.
 Fast forward to 2012 and the Union are again on six-game winless streak in which they have also managed 3 points, with 3 goals scored and 8 allowed. What’s the different story part, you ask? Aside from the fact that the Union were managing to score goals at the same point in 2011, they also were firmly in playoff contention, thanks to some excellent, if generally low scoring, early season form. After the draw with Columbus, they would be back in third place in the East.
And while it wasn’t to be known at the time, a certain French guy had embarked on what would become a goalscoring tear, tallying 8 goals over the final 10 games of the season
Those were the days.
25 games in
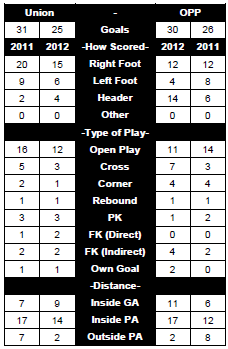
In the chart to the left, you can see the Union’s goals for and against stats after 25 games in 2011 and 2012. Aside from the differences in goal totals—the Union have scored 25 goals so far in 2012, one more than they allowed at this point in 2011, while conceding 30, one fewer than they had scored after 25 games last season—the stat that jumps out of the chart is the number of headed goals the Union have allowed this year, which at 14 is nearly half the total of goals allowed. That’s 8 more goals from headers than was allowed in 2011, an increase of 133 percent. Some 11 goals, or 37 percent, have come from a cross or a corner, a 57 percent increase from last year’s total of 7. Both of these increases are reflected in the increase in opposition goals from inside the penalty area (IPA) and inside the goal area (IGA), and the decrease in goals from outside the penalty area (OPA).
While the Union have doubled the number of headers they recorded in 2011 to 4 in 2012, the number of goals from a cross or a corner has decreased 43 percent from 7 to 4. This is partially, but not entirely, reflected in the sharp decline in the Union’s OPA goals, a 71 percent decrease from 7 in 2011 to 2 in 2012. Quite simply, the Union haven’t been taking advantage of shooting opportunities from distance.
 Union goals for
As the stat chart indicates, the Union have 9 goals from inside the goal area (one of which was a Chicago own goal), 14 from inside the penalty area (3 of which came from penalty kicks), and 2 from outside the penalty area. If we use the penalty spot as the demarcation point for goals scored from the left or the right side of the pitch, where are the Union goals coming from?
Overall, we see balance, with 11 goals coming from the left and 11 goals from the right. The 2 goals from outside of the penalty area? Both came from free kicks on the left side of the field. That increase in headers? 3 were IPAs from the right of the penalty spot, 1 was an IGA from the left.
 Goals against
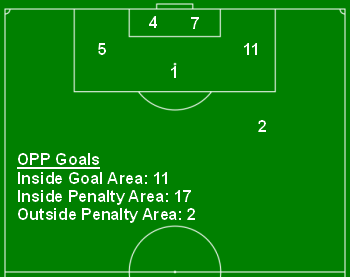
Turning to goals against, opponents have 11 IGA goals, 16 IPA goals, and 2 OPS goals. It is glaringly apparent that opponents have found success scoring from the right, which is to say by attacking the Union’s left, with 19 goals—or 63 percent—being struck from that side. It is worth noting that opponents scored 5 times from the Union’s left, including 3 headed goals, in the first 3 games of the season when Porfirio Lopez was starting at left back. In other words, 25 percent of the goals scored from that area, and 30 percent of the headed goals, came in those 3 games (Lopez was hauled off in the 45th minute of his fourth and final start, the scoreless draw against Vancouver.)
The 11 goals from inside the goal area, up from 6 at this point in 2011, is noteworthy if only for suggesting either a lack of decisiveness in MacMath coming off of his line and/or in defenders’ marking or in clearing balls out of danger. (It should be noted that the single goals scored against Harrison and Konopka in the away games at Dallas and Toronto also were both IGA goals.) This is underscored by the increase of IPA goals allowed from 12 in 2011 to 17 in 2012.
 Headed goals against
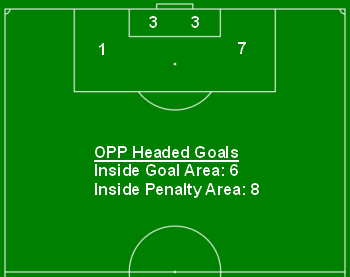
The preponderance of opposition goals being struck from the Union’s left is even more clear when we look at headed goals, 6 of which have been scored against the Union at home, 8 on the road. As we can see from the illustration to the right, 10 of the 14 headed goals allowed—71 percent of headed goals—in 2012 have been struck from the left side of the Union’s defense. (2 of the headed goals were Union own goals, 1 from the right and 1 from the left. Both were IGA goals.) In 3 different games, the Union conceded 2 headed goals.
Looking at the type of play in which the headed goals were scored, 8 came from set pieces (4 from a free kick, 4 from a corner kick, including 1 own goal each) and 6 came from open play. Of the set piece headed goals, 3 were headed from the left, 5 from the right. Of headed goals from open play, 1 was headed from the left, 5 from the right.
That 7 of those headed goals came on the left side of the defense inside the penalty area again points to a grave problem with marking, which is itself related to the Union’s lack of height on the backline, not to mention a lack of defensive pressure from Union players on the right on opposition players attempting to cross the ball. In case you’re wondering, 7 of the headed goals happened under Peter Nowak, 7 under John Hackworth, including both own goals. Looking at the season so far, the Union are 1–9–1 when they have allowed a headed goal.
Conclusion
The various statistics discussed above will for most Union fans merely underscore what they already know. In the simplest terms, the Union need to score more goals and allow fewer.
It is the same with the specifics. Going forward, the Union need to take more shots, whether from within the penalty area or without. Whether or not a Union player goes on an end of the season tear like Le Toux did last year, it is clear that a prime offseason need is the acquisition of an experienced and confident forward. Defensively, more size in the back will presumably be on the way whenever Bakary Soumare is fit enough to play. Further additions wouldn’t hurt. In the meanwhile, tactics can be adjusted in order to limit the relative freedom with which opponents are able to put crosses into the area. After all, the first defense begins with minimizing opponents’ opportunities to exploit the Union backline’s lack of size.


Great analysis. The well placed graphics and metrics seem to highlight our problems. 14 goals conceded in the air? Ouch! I don’t care how fast we are. If we can’t defend crosses (or set pieces) we’re doomed. Size matters!
Carlos Ruiz scored again for Guatamala in World Cup qualifying last week….just sayin. And boy oh boy do I miss Seba right about now. I clearly did not appreciate his prowess when he was here. I think we are really missing Veljko too. Our guys just need more seasoning….way more seasoning. And they need a couple veteran guys (like Pauno) on the field who can show them the way.