Photo: Nicolae Stoian
The joy of the Philadelphia Union making it into the playoffs for the first time in only their second year in existence was somewhat dampened by the fact that the match against Toronto ended as a 1–1 draw. Sure, we all wanted the last regular season home game to end in victory for the team that has provided us all with so much over the course of a season that in many ways has exceeded all reasonable expectation for such a young club.
More than that, though, there have just been too many draws this season.
The Union does not currently hold the distinction of having the most draws in MLS this season—their 15 is topped by 16 each for New York and Chicago with Toronto at 14. In fact, the Eastern Conference total of 117 draws tops the Western Conference total of 89 by a whopping 28 ties. Nevertheless, the second half of the Union’s season is positively littered with them. In the first 17 games, the Union was 7–4–5. In the last 16 they are 4–3–10. To put it another way, the Union had more wins in their first 11 games with a 6–3–2 record then in the following 22 games, during which they have a 5–4–13 record. While the first third of the season was characterized by wins, it is draws that have dominated the last two thirds.
Drawing an overview
 Of the Union’s 15 draws so far, eight have come at home, seven on the road. Three matches were scoreless draws, two at home and one on the road. Nine matches were 1–1 draws, five at home and four away. Two matches were 2–2 draws, one each at home and on the road. The 4–4 draw happened at home.
Aside from the three scoreless draws, the Union came from behind six times and conceded an equalizer six times. Of the six come from behind draws, three occurred at home and three on the road. The Union conceded an equalizer four times at home and twice on the road. Four times the Union came from behind to secure a draw in the last ten minutes of the game, three times at home and once on the road. They conceded an equalizer three times in the last minute of a game, twice at home and once on the road.
What is in a draw
I wanted to see how the Union’s performance in a draw differed compared to a win or a loss in five categories: possession, passing accuracy, passing accuracy in the final third of the field, shots on goal/ attempts on goal percentage and goals/shots on goal percentage. Would there be a simple correlation in these categories? In other words, would the averages for these categories be best in wins, worst in losses, with draws somewhere in the middle?

Interestingly, the Union’s 54 percent possession average when they lose is higher then the 46 percent average when they win. As might be expected, their possession percentage when they draw is in between those two numbers at 50 percent.
While their passing accuracy percentage when winning and losing is the same at 74 percent, their passing accuracy when drawing is at 72 percent. The Union’s passing accuracy percentage in the final third when winning is highest at 60 percent, as would be expected. But their passing accuracy average in the final third when losing is still higher at 58 percent compared to the 56 percent passing accuracy when they draw.
It is in the numbers for shots on goal from shots and goals from shots on goal that the expected simple correlation emerges. Looking at shots on goal percentage, an almost perfect range separation of ten percent can be seen, with the Union recording an average of 42 percent of shots on target when winning, 32 percent when drawing, and 23 percent when losing.
While the symmetry is not as even when looking at goals from shots on goal averages, the simple correlation remains. When the Union win, 44 percent of their shots on goal find the back of the net. When they lose, only 12 percent of the shots on goal make it past the keeper. When drawing, the number is 34 percent.
Drawing at home vs. drawing on the road
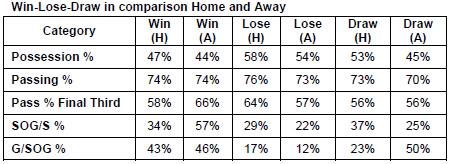
How do the Union’s number breakdown when we compare wins–losses–draws home and away averages?
Across the board, the Union have better possession averages at home than on the road. The difference is greatest when the Union draw at home, where they average 53 percent possession, compared to the road average of 45 percent possession. (It should be noted that the Union lost at home only once this year, so a comparison of home and away averages when they lose does not have much depth.)
Passing accuracy between home and away games when the Union wins remains at 74 percent. When losing or drawing at home, the Union have better passing accuracy than when they are on the road.
Looking at the difference between the home and away averages for passing percentage in the final third yields some interesting results. While the home and away numbers when drawing are level at 56 percent, the Union’s passing accuracy of 66 percent in the final third is actually higher on the road than the 58 percent accuracy at home. The home advantage when they lose at home is as expected, 64 percent at PPL compared to 57 percent on the road. That the 64 percent average when losing at home is higher than the 58 percent when they win at home probably speaks as much to opponents conceding possession as they bunker in to protect their lead as to the Union needing to press forward in search of an equalizer.
The unexpected advantage seen in passing accuracy in the final third when playing away is also present in the shots on goal percentage and goals from shots on goal percentage. The very significant difference in the goals from shots on goal average of 23 percent at home compared to 50 percent on the road can be explained by the draw down effect of the two scoreless results at home compared to one on the road. The low away goals from shots on goals percentage when the Union lose on the road of 12 percent reflects the fact that the Union were held scoreless in four of their six away losses.
Come from behind vs. conceding
If we next look at the averages when the Union equalizes compared to when they concede an equalizer, will the first group’s averages be better than the second group’s? Will there be much difference between those numbers and the overall averages when the Union draws?
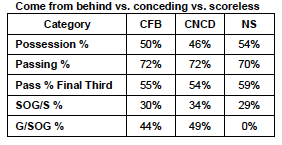
Overall, the Union’s possession average when they equalize for a draw is the same as the average for all draws at 50 percent. The 46 percent when they concede is lower than the overall average and the 54 percent when there is no score is higher. The passing accuracy average when they equalize and when they concede is the same as the overall average of 72 percent while the average when there is no scoring is slightly lower at 70 percent. The passing averages in the final third when they come from behind of 55 percent, and the 54 percent when they give up an equalizer, are both slightly lower than the overall average of 56 percent. The 59 percent average when the final result is scoreless is higher than the overall average of 56 percent.
Looking at the shots on goal average, the 30 percent when the Union come from behind is lower than the overall average of 32 percent while the 34 percent average when they concede is higher. The average is lowest when there are no goals at 29 percent.
The most significant difference can be seen in the goals from shots on goal average where both the 44 percent when the Union come from behind and the 49 percent when they concede are significantly higher than the overall average of 34 percent. Those three scoreless draws explain the difference. Most interestingly, the 49 percent average for goals from shots on goals when the Union concede an equalizer is the highest average for that category, higher even than the 44 percent average when the Union win.
Come from behind vs. conceding at home and on the road
When the Union come from behind to draw, concede an equalizer, or record a scoreless draw, is there a notable difference in the averages at home compared to on the road?
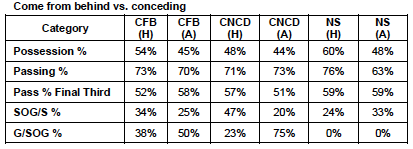
When the Union come from behind to draw at home, their possession average of 54 percent is better than the overall possession average of 50 percent while the average on the road is lower at 45 percent. At 73 percent, the passing accuracy averages when they come from behind and when they concede an equalizer on the road are slightly better than the overall average of 72 percent. Accuracy of passing in the final third is slightly better when the Union come from behind at 58 percent compared to the overall average of 56 percent, as is the 57 percent average when they concede at home.
 The shots on goal average difference of 34 percent when the Union come from behind at home is slightly better than the overall average of 32 percent but is significantly lower when the Union come from behind away (25 percent) and concede away (20 percent). It is significantly higher when they concede at home at 47 percent. While the average for goals from shots on goal is marginally higher when the Union come from behind at home at 34 percent, the 50 percent average when they come from behind on the road is significantly higher, as is the average of 75 percent when they concede away. The average when they concede at home is significantly lower at 23 percent.
Conclusion
The Union offense’s averages are generally better at home and this is generally true when they draw. Shots on goal averages and goals from shots averages follow an expected ranking with averages being highest when winning, lowest when losing, and the numbers when drawing being in between.
With one game to go in the regular season, 53 percent of the Union’s draws have come at home, 47 percent on the road. All of the goals the Union has conceded for a draw have been scored in the second half, as have all of the goals they have scored to come from behind for a draw. In matches where the Union has come from behind to draw, 67 percent of the tieing goals have been scored in the last ten minutes of the game. When the Union has conceded an equalizer, 50 percent have come in the last ten minutes. In terms of shots on goal and goals from shots on goal percentages, the Union’s highest numbers have come when they have conceded a second half equalizer. In fact, the 49 percent goals from shots on goal average is higher than the 44 percent when the Union win. The focus then should shift away from the fact that a goal was conceded to just why weren’t more goals scored by the Union. Similarly, looking at the high possession and passing averages in the three scoreless draws, the question becomes why wasn’t the Union able to turn those numbers into higher shots on goal averages to score?
Divide those games up any way you like—offensive dominance, home vs. away, if a late goal hadn’t been conceded—and it is very hard not to wonder how different the Union’s point total might be right now.


RECENT COMMENTS