MLS has recently seen a growing spending inequality with big-spenders such as Toronto, Atlanta, LAFC and others, compared with the smaller budgets coming from clubs including our own Philadelphia Union.
When Philadelphia doesn’t seem to spend like the big boys, it begs the question from many of us as to how much we can expect the club to accomplish?
The current homegrown academy investment is a reasonable strategy to help out-perform spending deficits. We see some of that investment paying off in the form of inexpensive talents in Auston Trusty, Mark McKenzie, and possibly Anthony Fontana and Derrick Jones. However, we also see some disappointments in those who slipped through the academy’s limitations, such as Christian Pulisic and Zach Steffen moving straight to Europe, side-stepping Philadelphia’s claim to them. We also see what happens when poor planning causes Keegan Rosenberry to cost the Union a first-round-pick instead of a free pickup. This strategy also begs the question as to how long we can expect homegrown starters to remain inexpensive, since we don’t know much about the structure/length of their contracts.
I was planning to do some salary data collection when the new report came out anyway, but our own Jim O’Leary’s excellent article a while ago inspired me to investigate this topic thoroughly.
*A few notes right up at the top.
- I only have access to the twice-yearly players union reports on compensation combined with match data.
- This includes only the earnings of players, not of the transfer fees/costs.
- I used the Total Compensation column within these reports, rather than the Salary column.
- At the bottom of the article, I will detail the methodologies I used to match the compensation data to the match data.
- It is not possible for this to have achieved perfect results, but I put a significant effort in to make sure it was highly accurate.
- While I have salary and match data going back as far as 2010, I only have player-level data to 2013, so I decided to limit the data to 2013 through 6/31/2018 to make the data-set consistent throughout this article.
- This only utilizes MLS match data, and does not factor in USOC, Canadian Championship, or CCL data.
MLS Spending
We’ve all seen how MLS spending has increased, especially as MLS makes new rules to get around the salary cap and big-budget newcomers join the league dropping money all over the place.
The chart below shows how compensation across all teams in MLS has risen over the past 5.5 years.
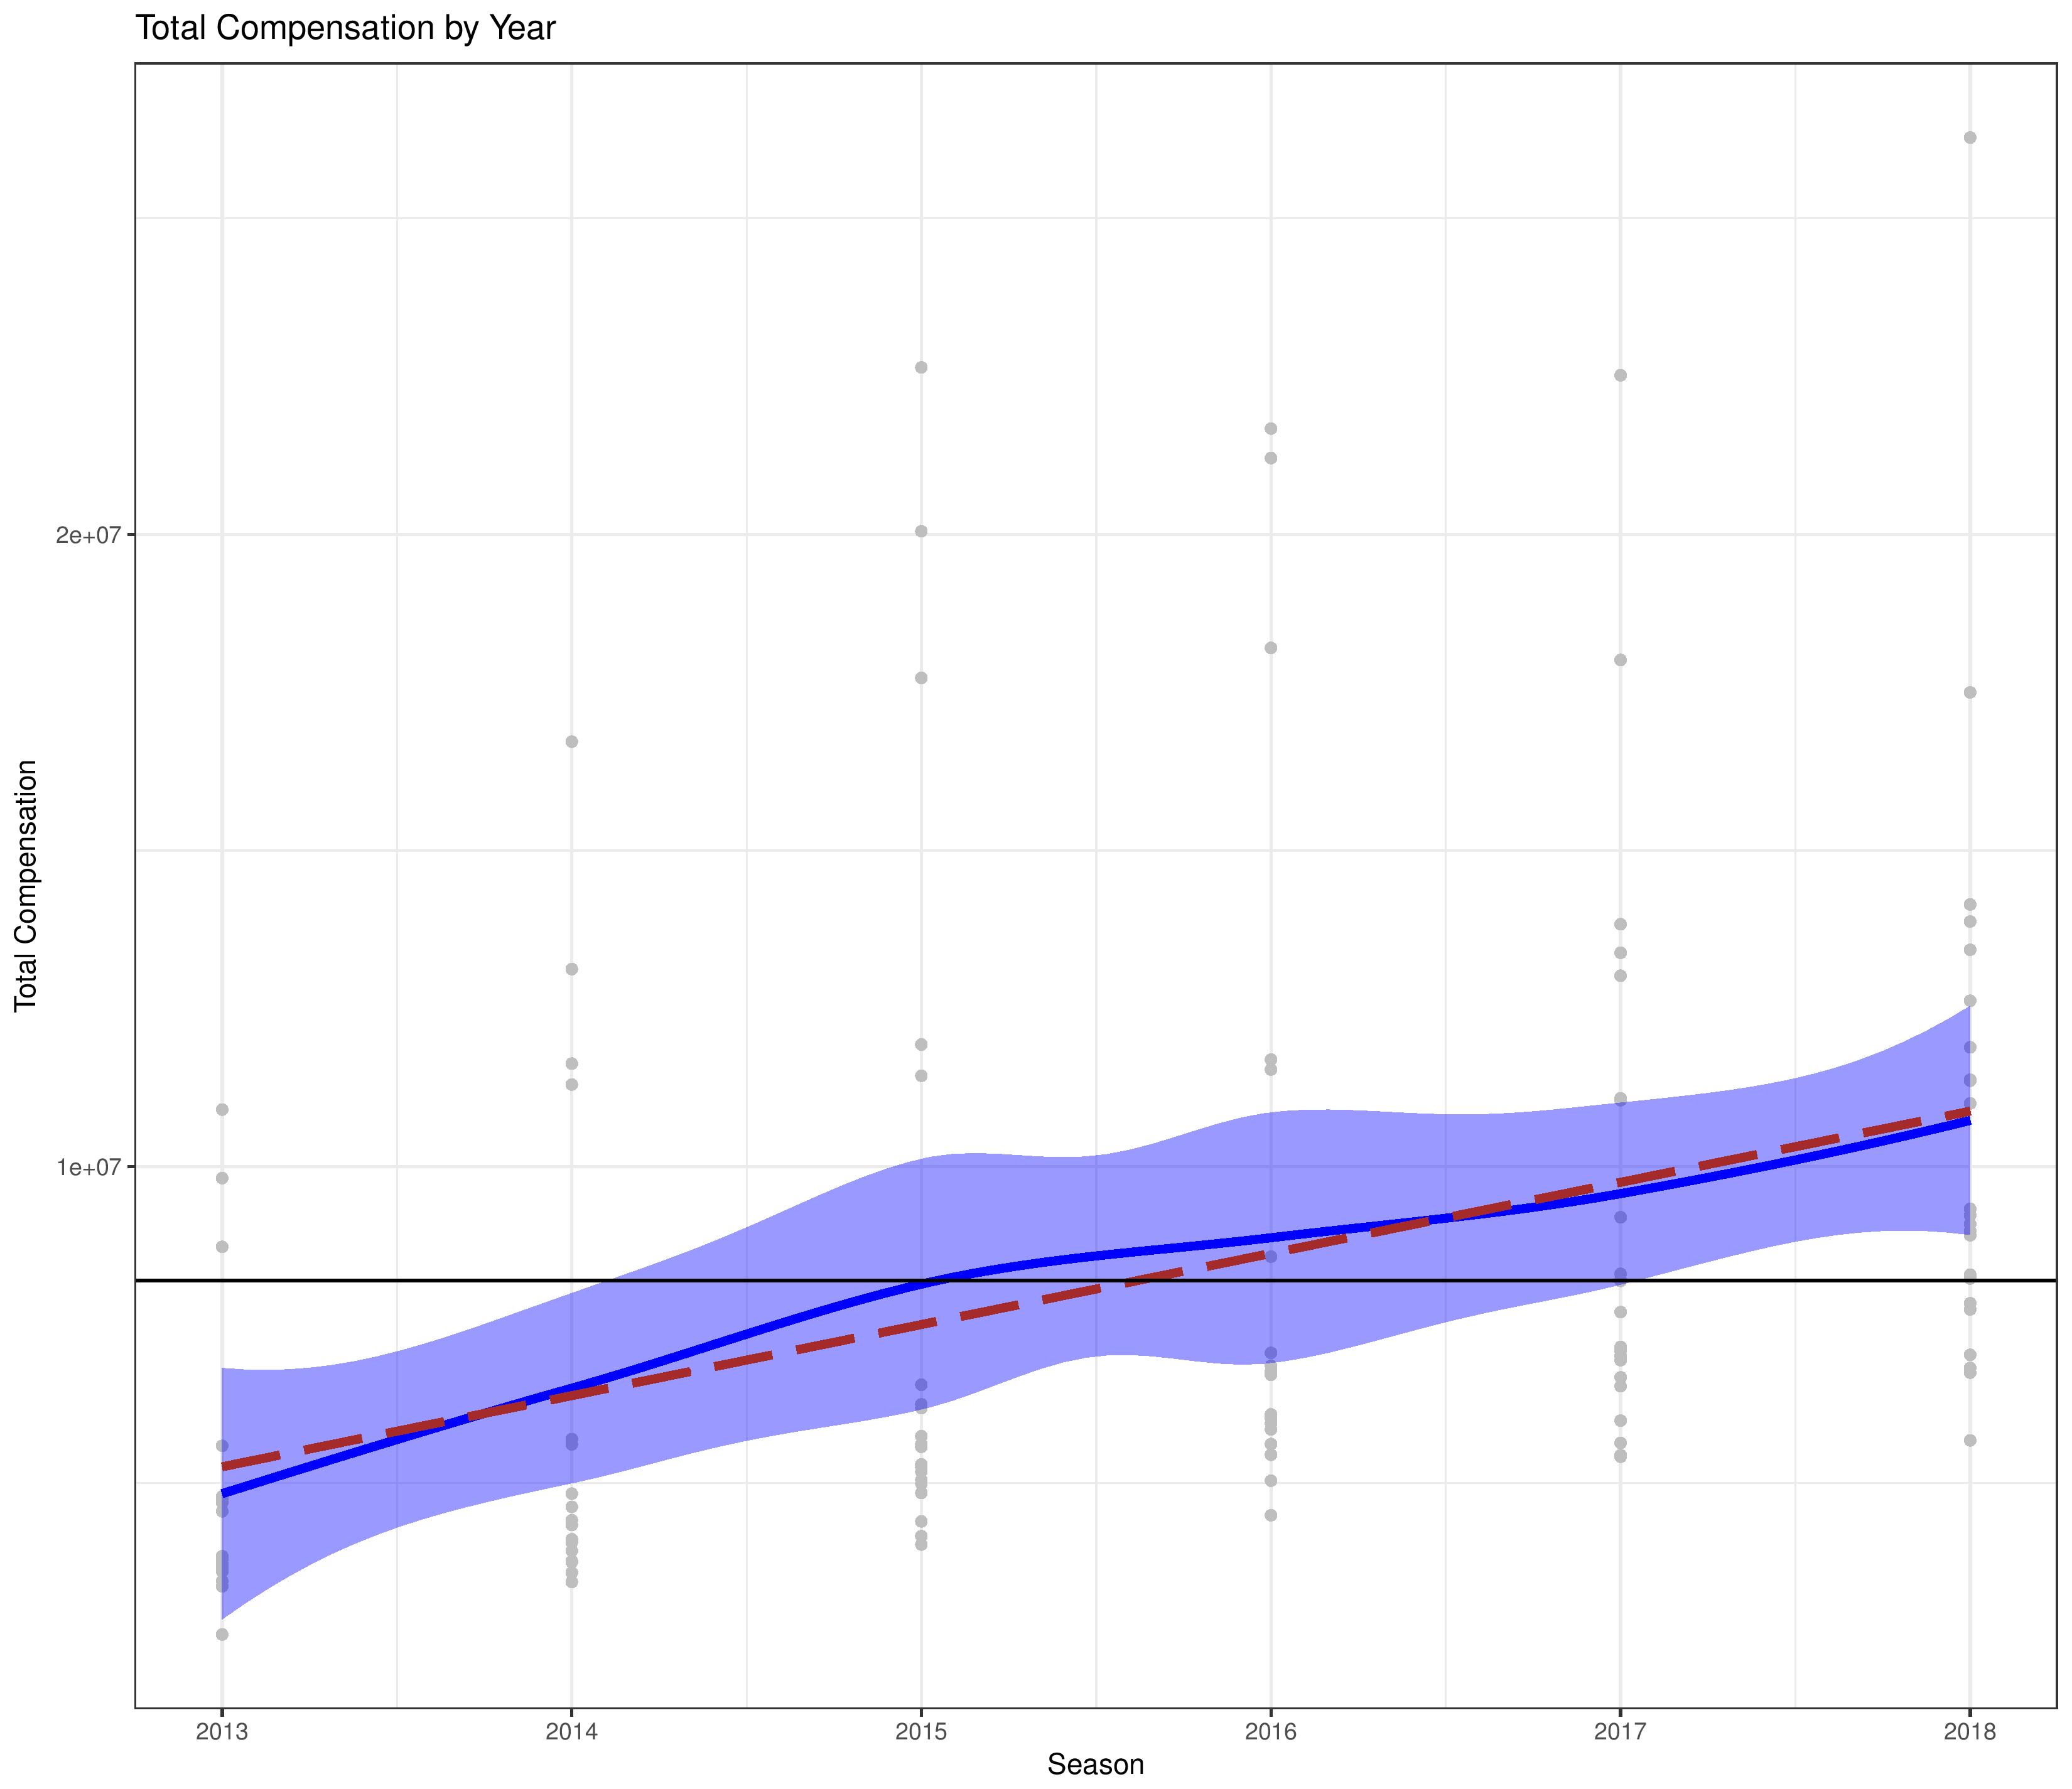
We follow that up with how Philadelphia’s compensation spending has changed over the same time period.
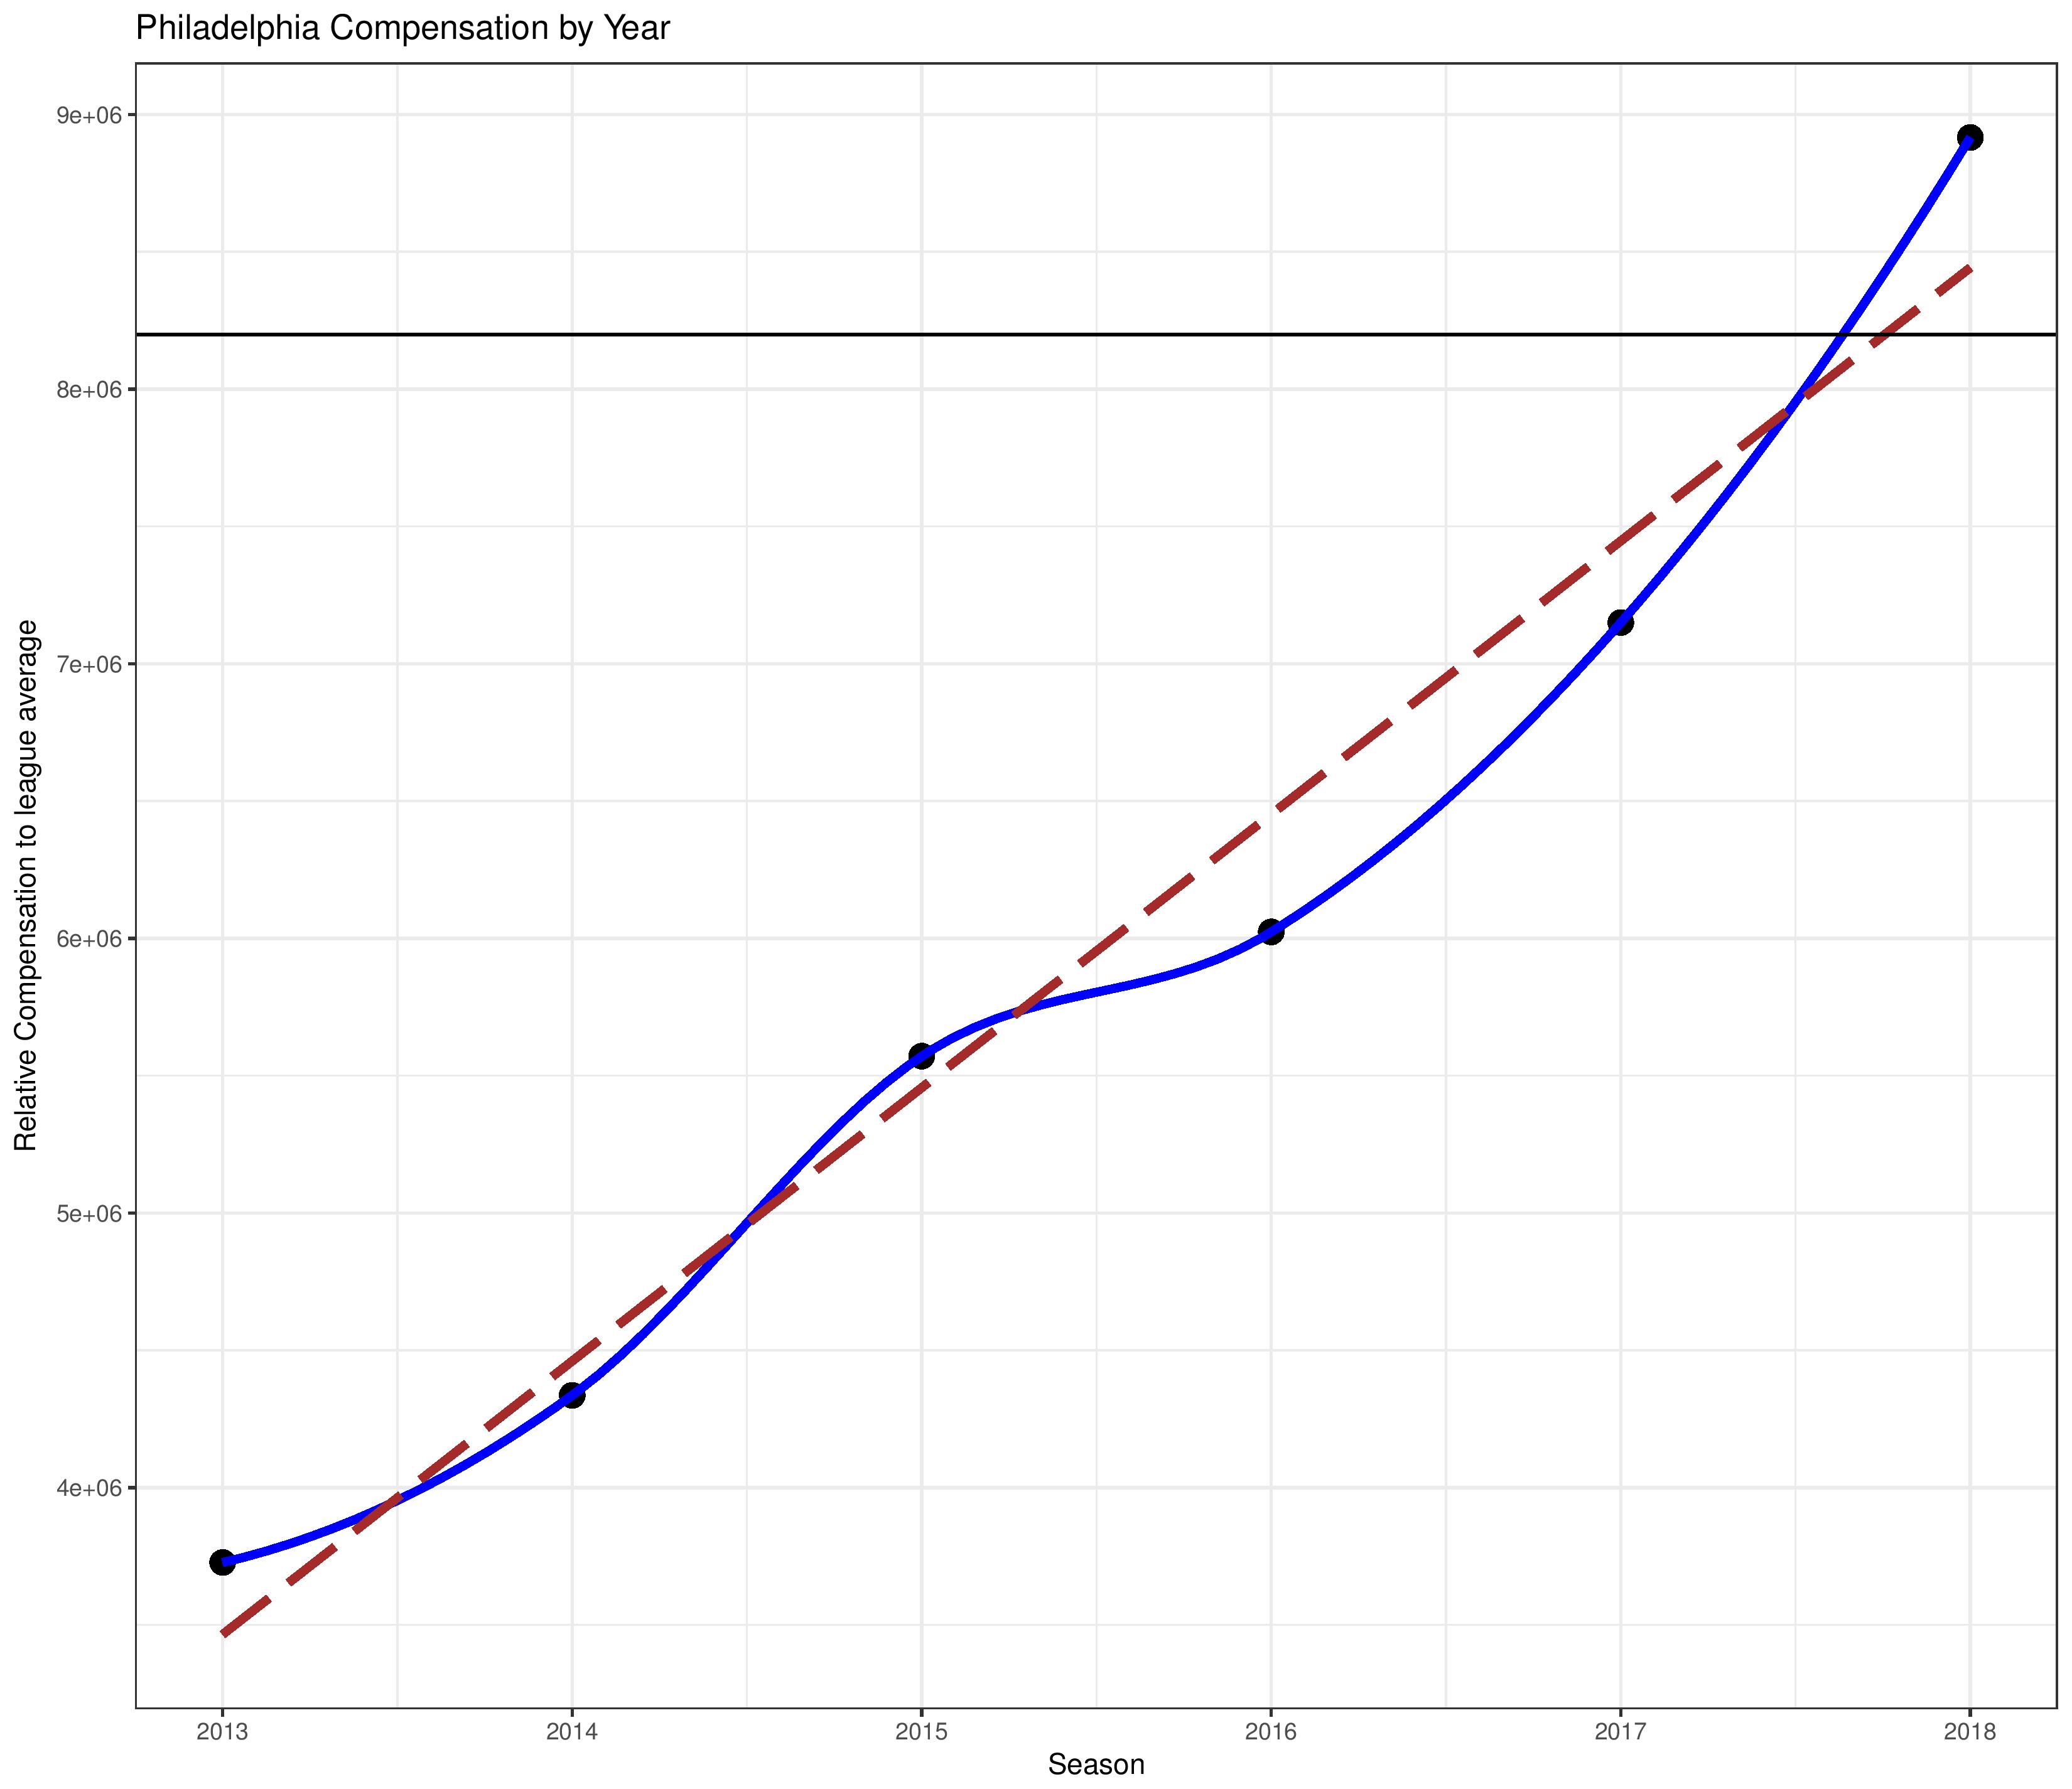
Wow, that wasn’t what I expected to see. Over this time period, Philadelphia’s spending has increased from less than $4M to nearly $9M. Given how often they are (often by me) casually described as a cheap club, they’re not exactly standing pat when they’ve more than doubled their on-field-investment.
What is far more illuminating, however, is to see how Philadelphia’s spending compares with the median team spend in each of these seasons.
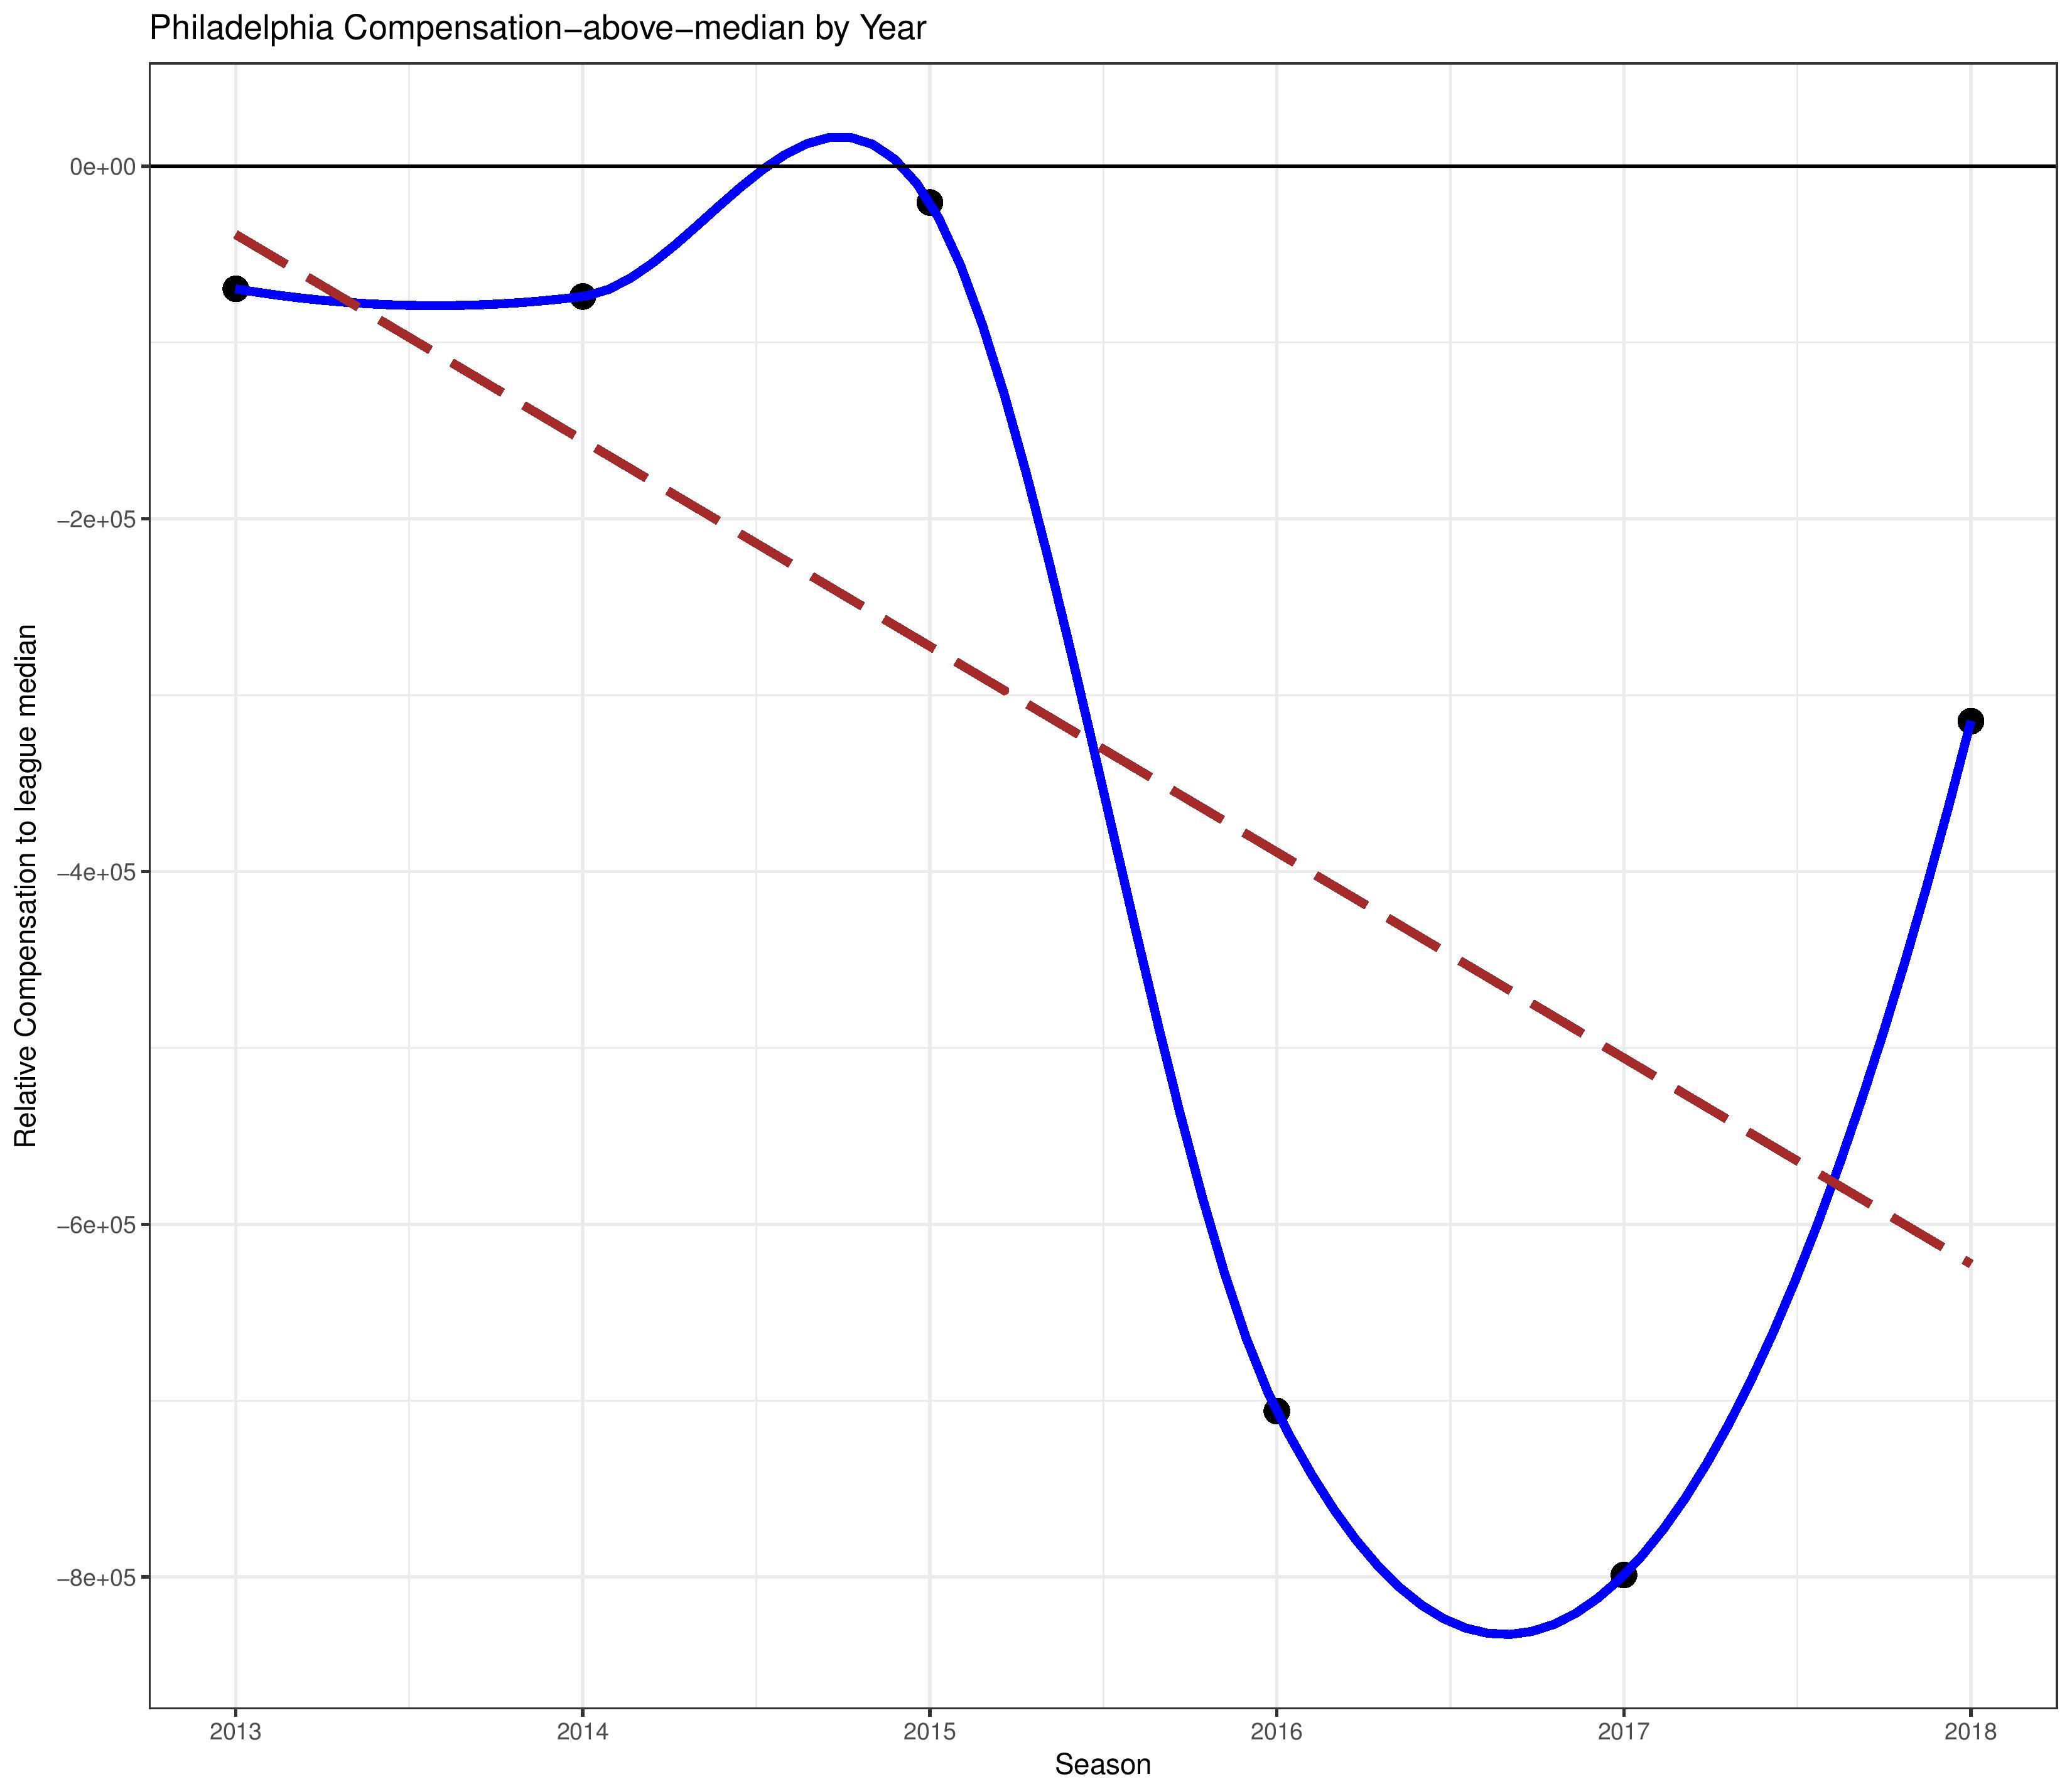
This helps me understand why I feel like our wallets are so outmatched comparatively, seeing as the Union have not had an above-median-spending season since 2012 or earlier (perhaps never). While the Union have increased their spending substantially since 2014, it still doesn’t come close to keeping up with the league median, especially for 2016 and 2017 ($700k & $800k under the league median, respectively).
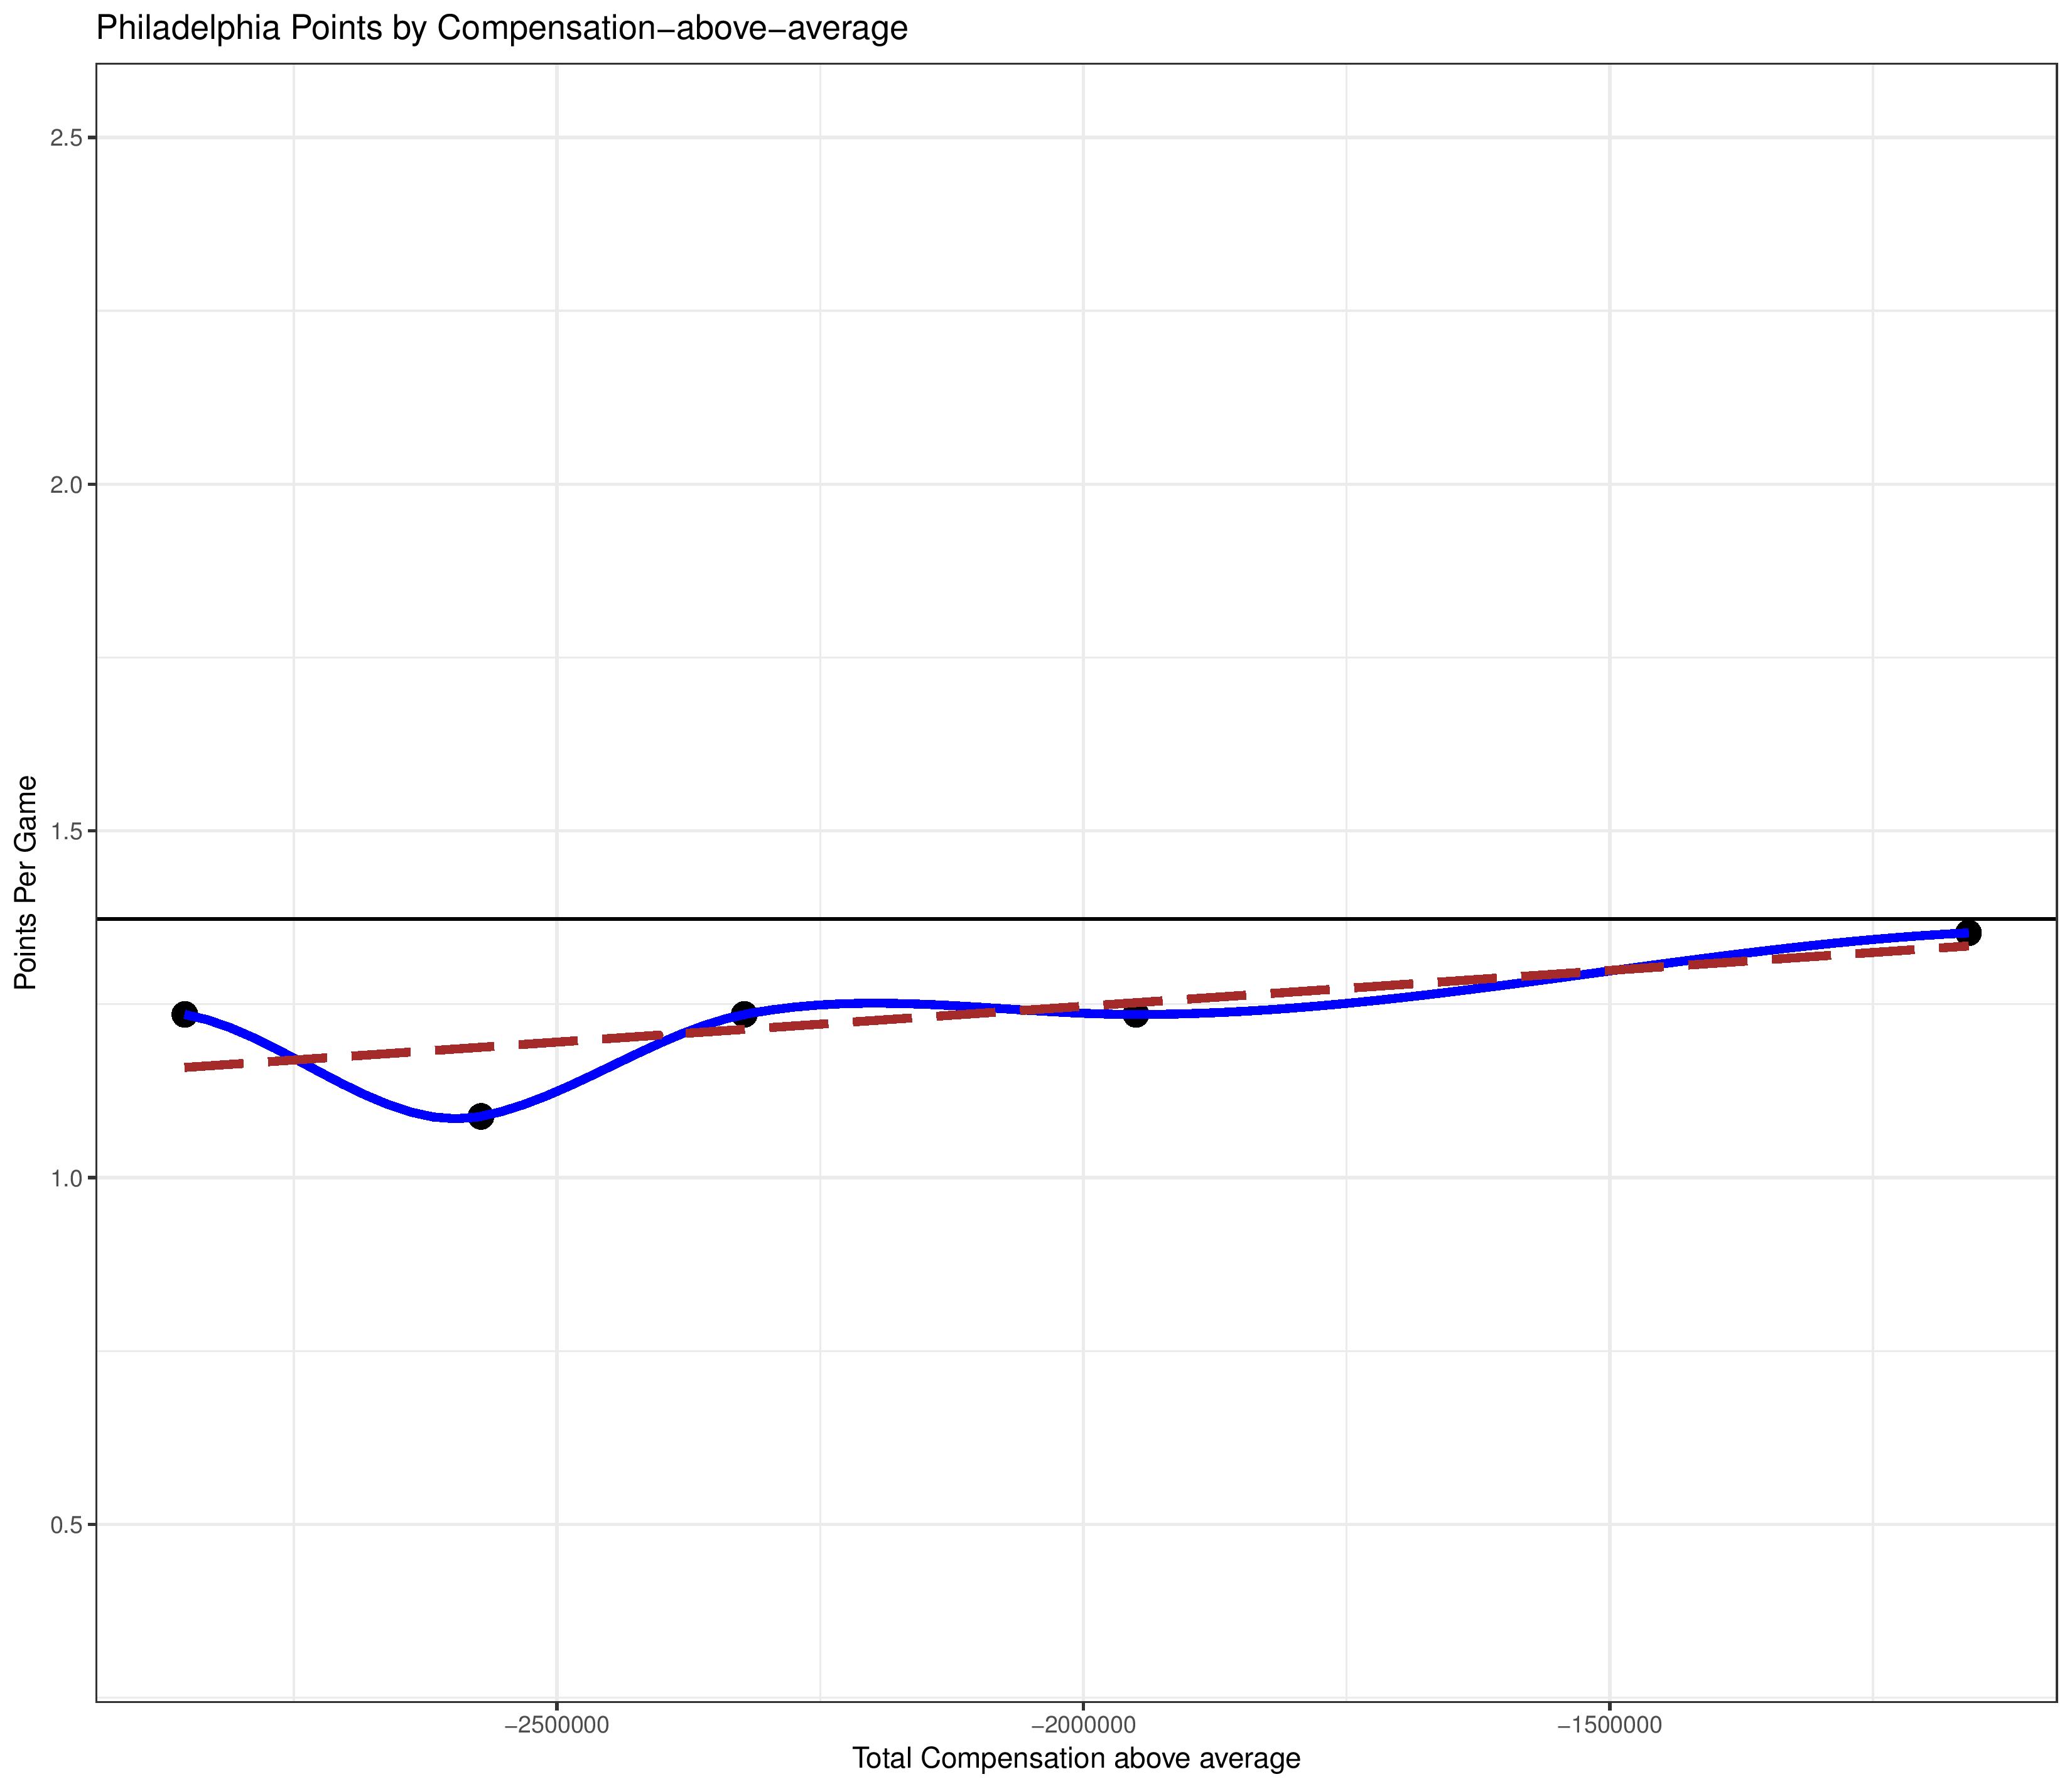
Spending vs. results
Next, we see how the regular season points-per-game lines up with a club’s spending compared with the median for that season.
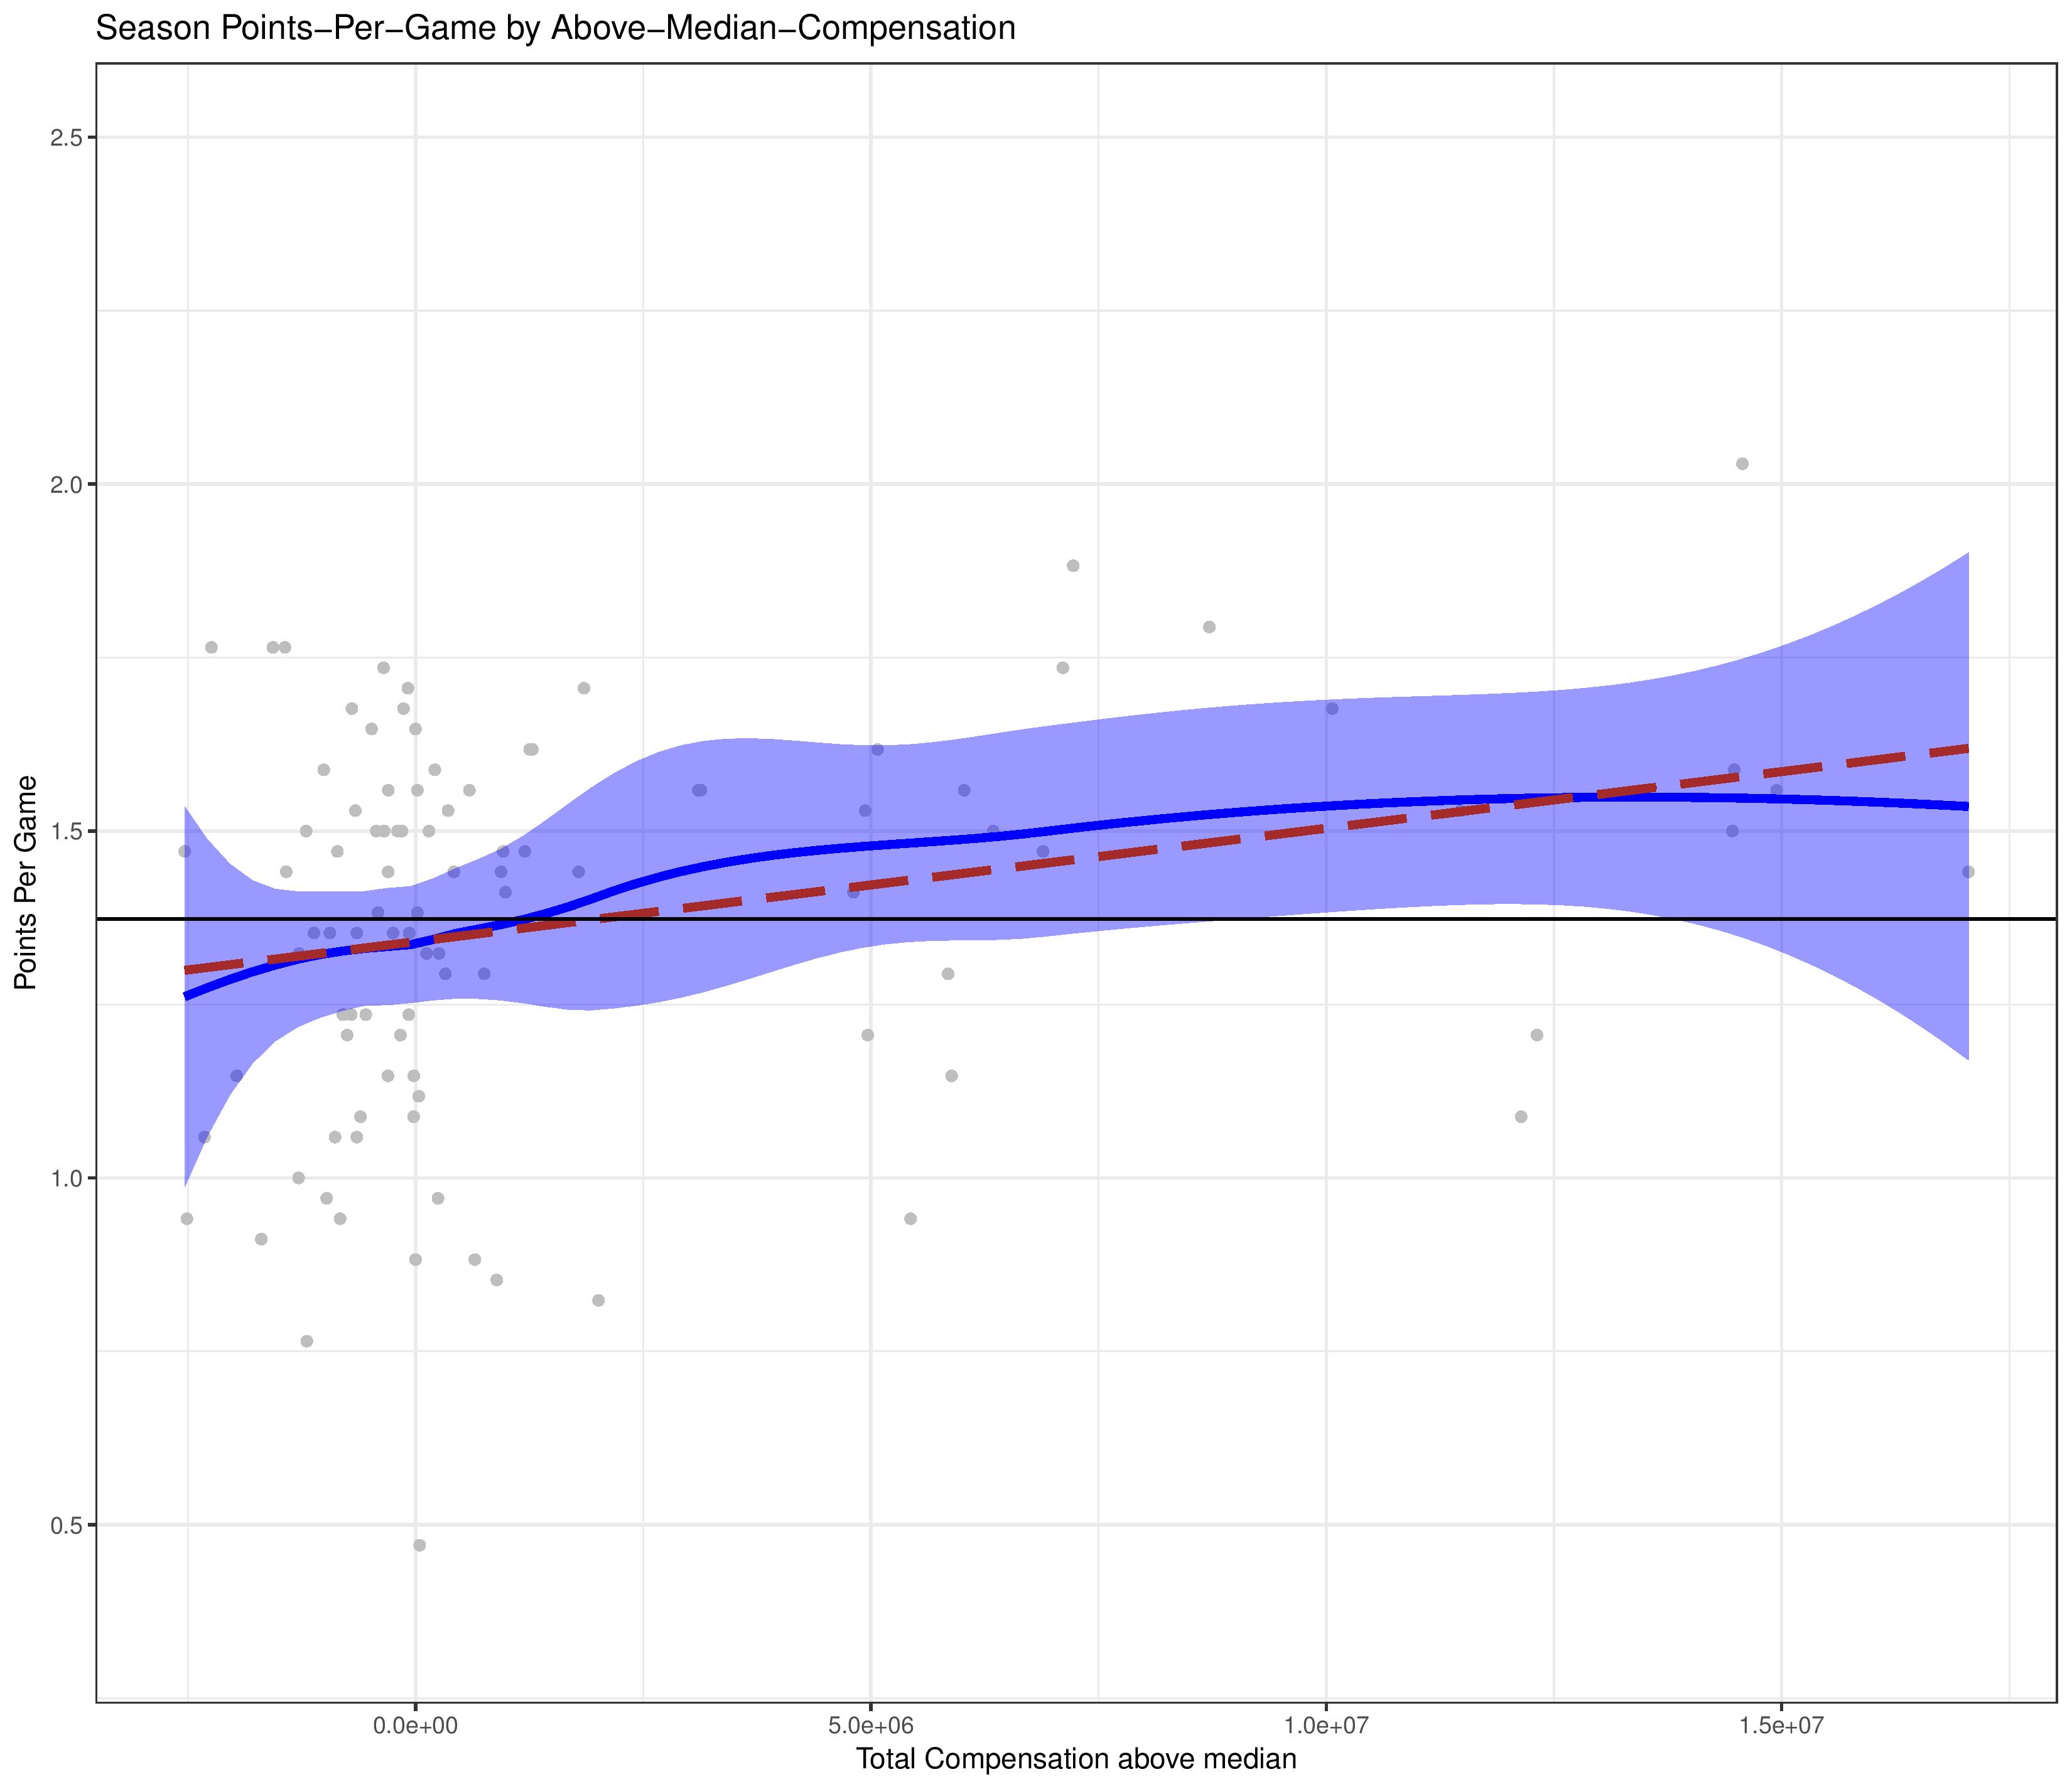
Above we can see a clearly positive trend with spending more money leading to a better performance, although it appears as there are diminishing returns at the higher end.
How much of a difference? A linear projection indicates that an additional $1M investment would lead to…. about 0.4 additional points spread out over the course of a 34-game-season. An extra $15M next season, in addition to next season’s expected league-median increase, might be expected to earn a club only a lousy 6 extra points on the regular season table.
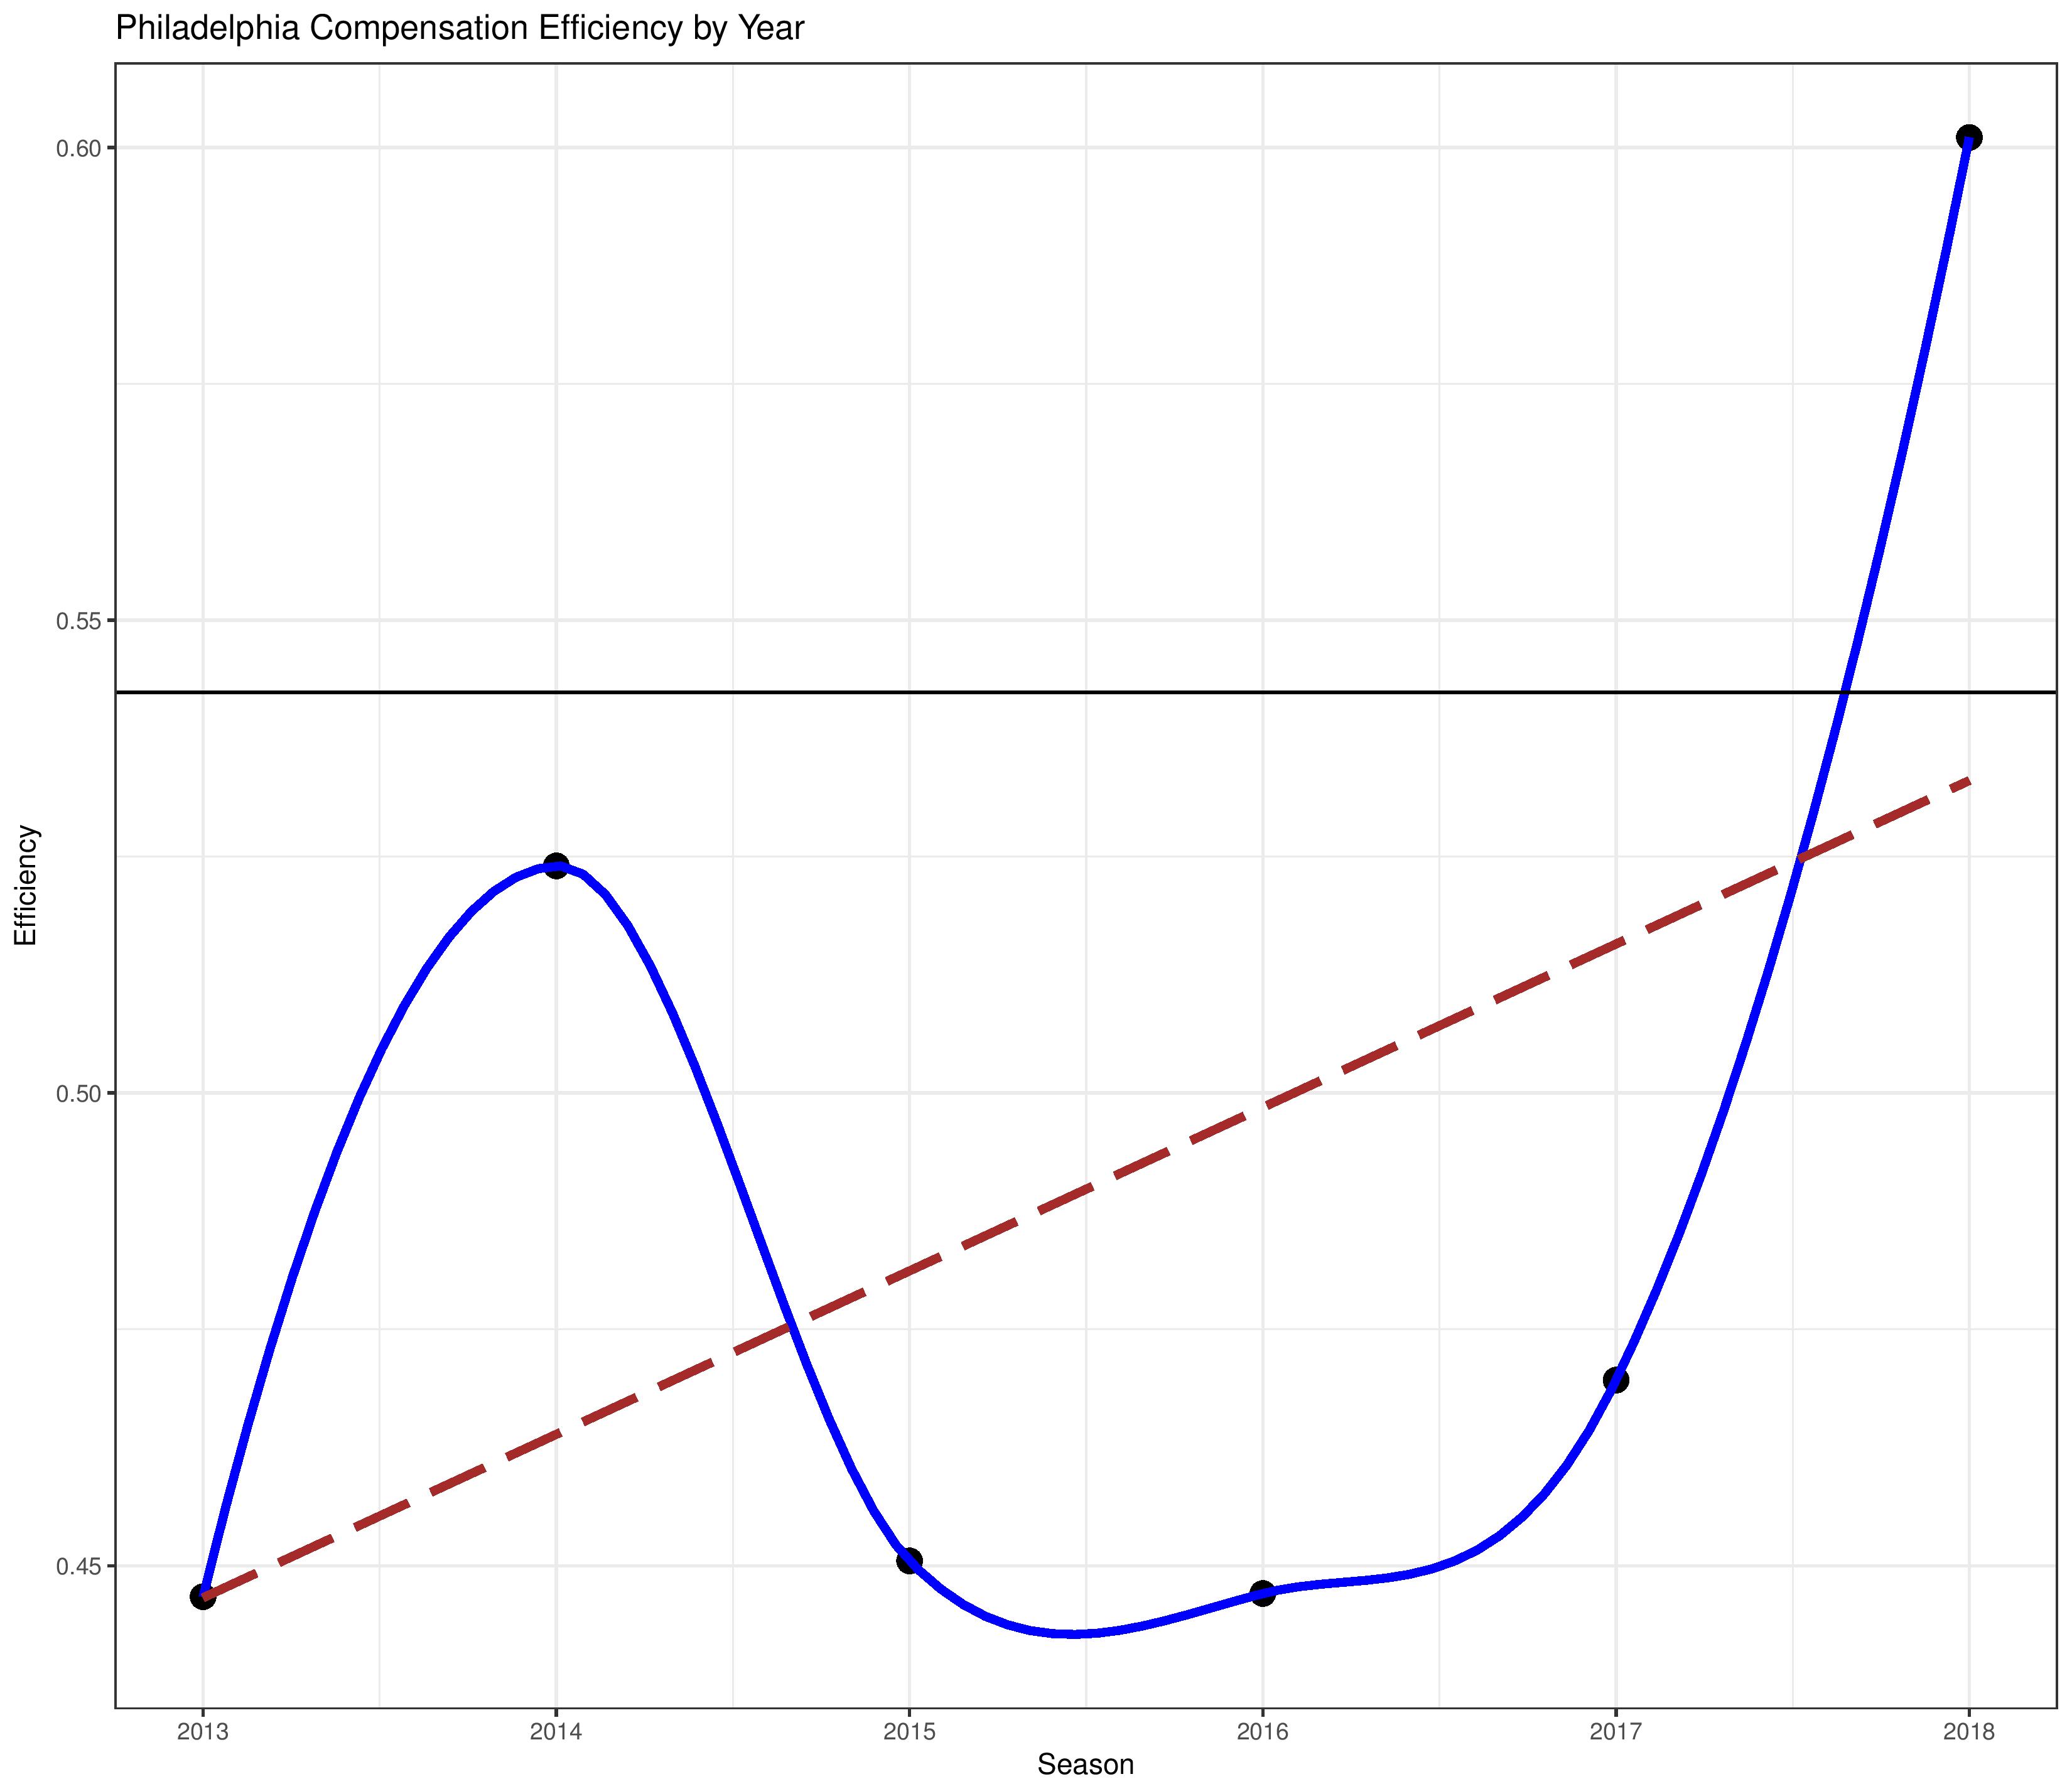
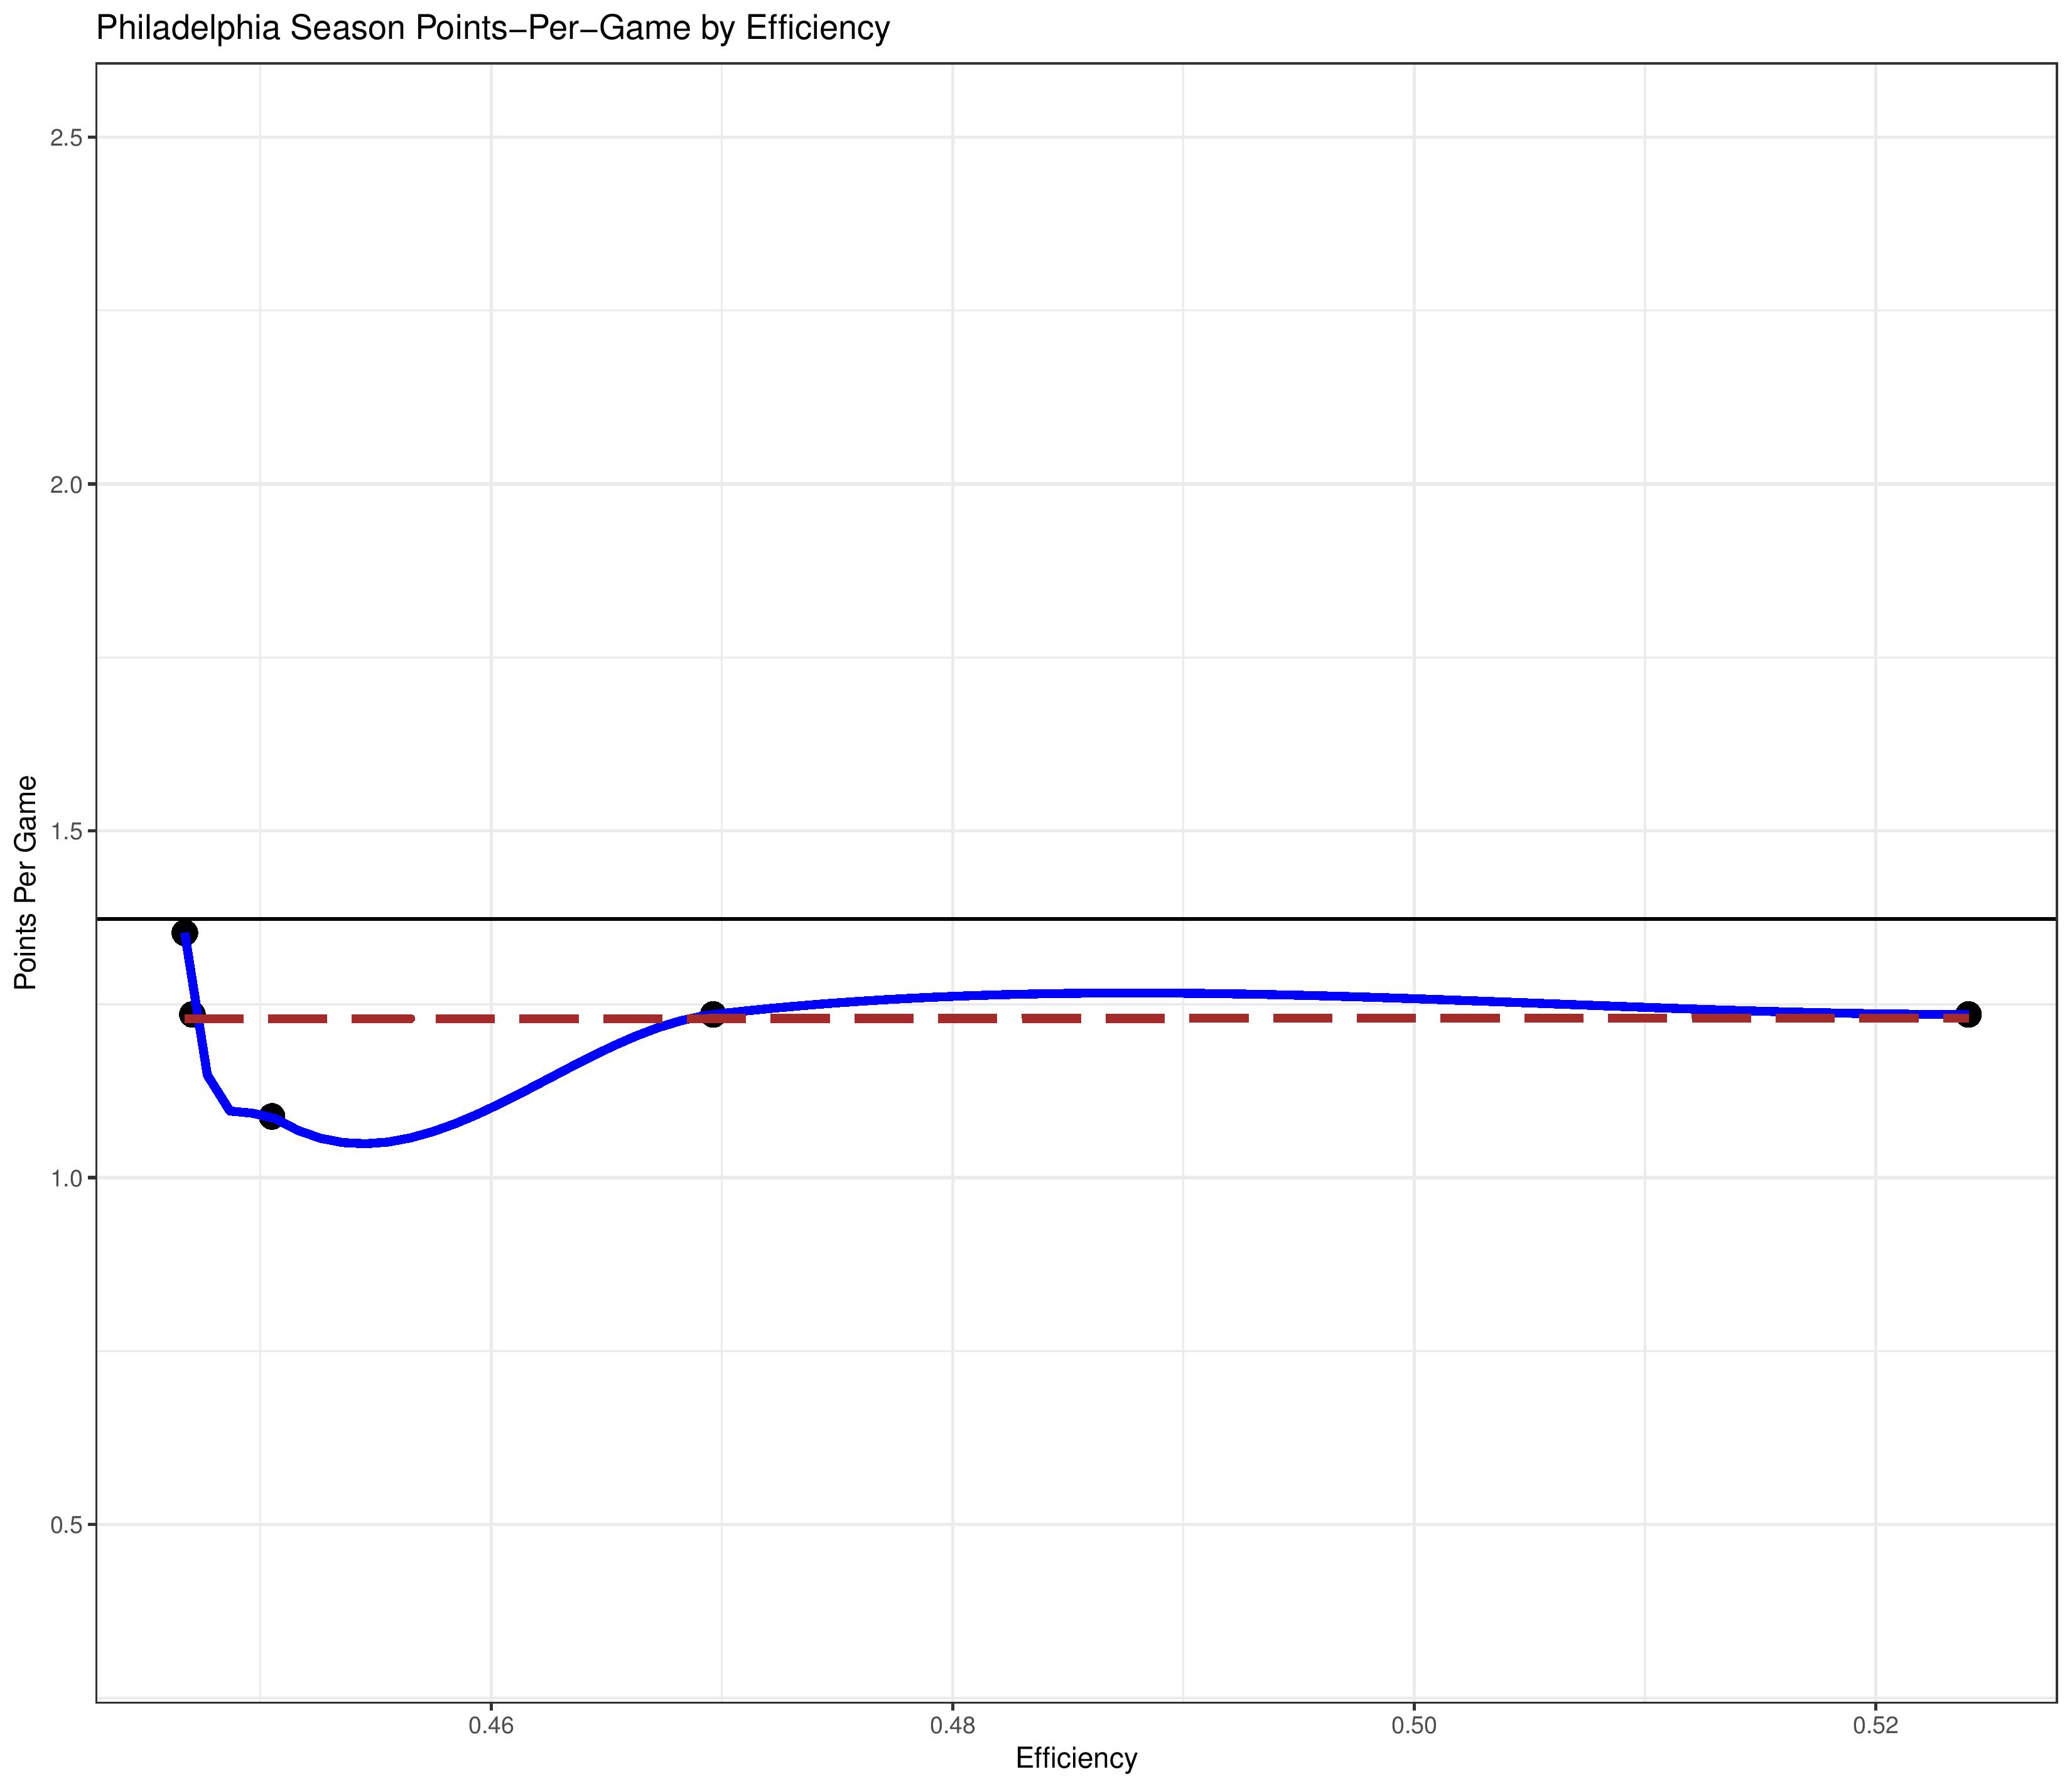
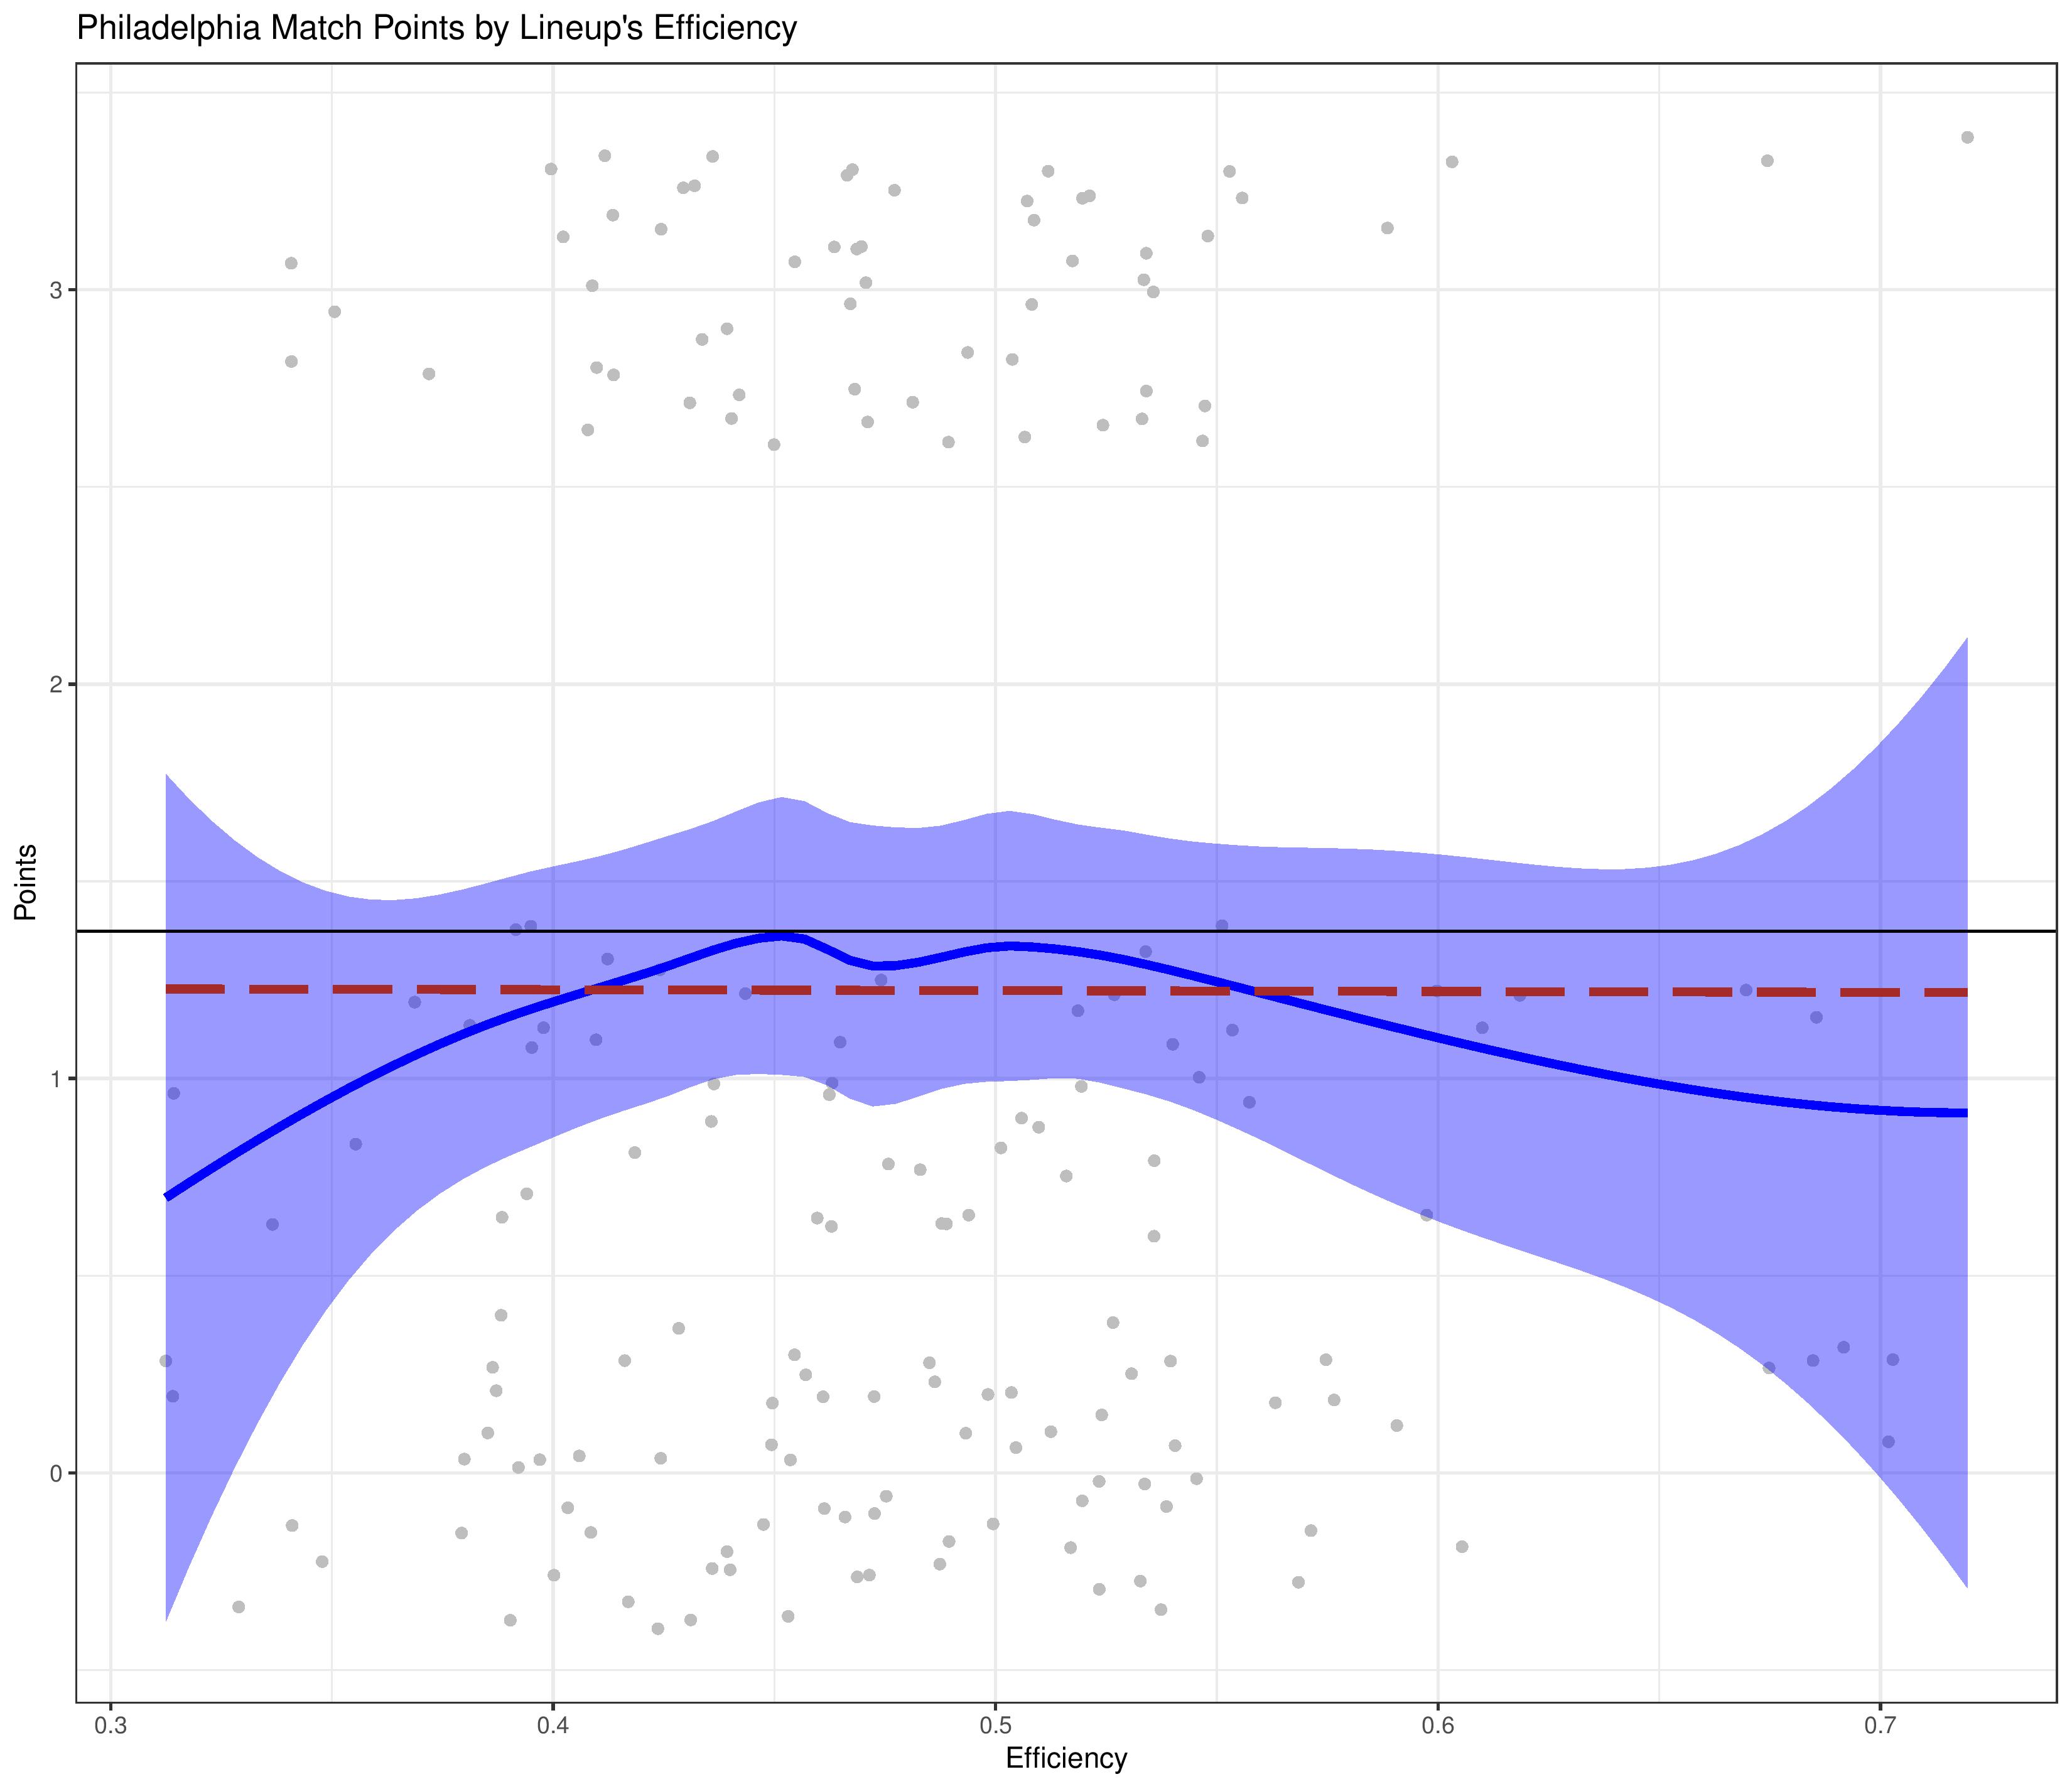
Spending efficiency vs. results
Seeing that moderate spending differences matters so little was very surprising. Could it still matter how much a club spends, but only within the context of how much a club actually uses their expensive players?
I developed an efficiency measure, which compares player compensation with how much they played, to determine what percentage of a club’s spending is actually out on the field.
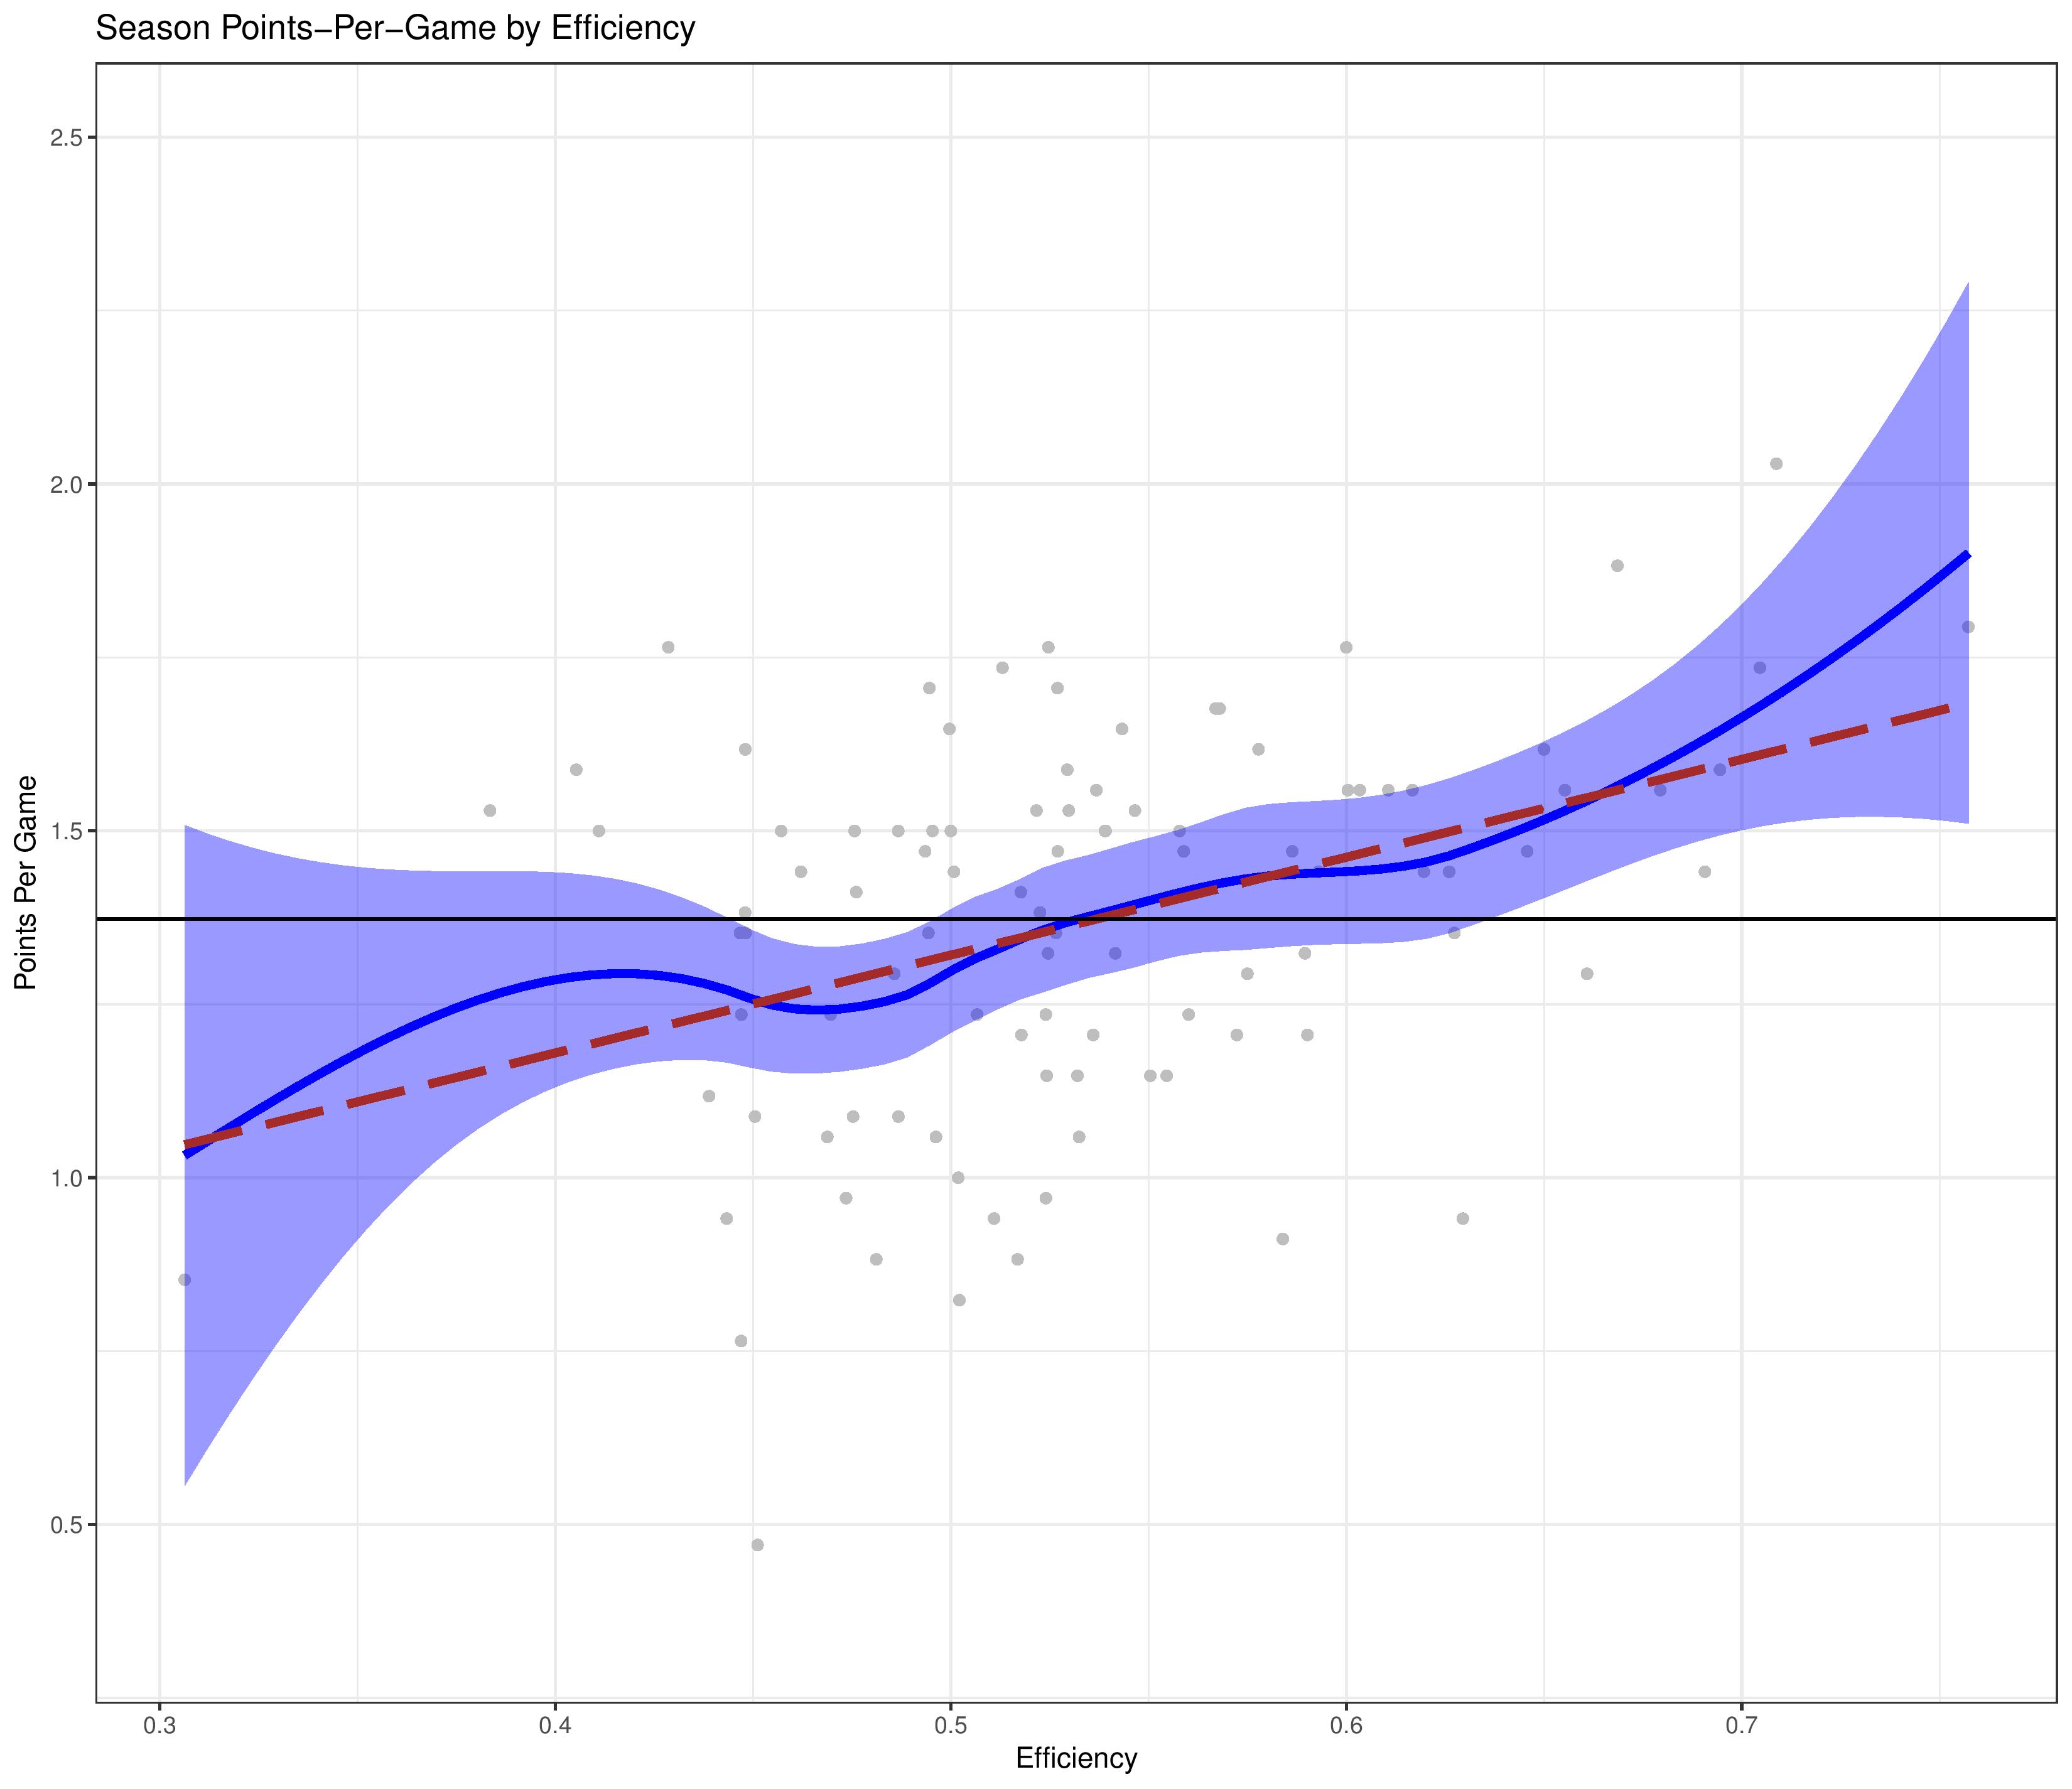
This indicates that a boost in efficiency from 40% to 60% would represent an expected 9.2 points improvement over a 34-game-season.
This shows some promise into helping explain the lack of advantage a high-spending club receives. If they don’t spend the money on players who are likely to see the field, it doesn’t matter how much they spend.
It is also worth mentioning that clubs with highly-expensive starters have a greater potential for high efficiency because a Clint Dempsey salary is efficiently using a large chunk of payroll every time he steps onto the field.
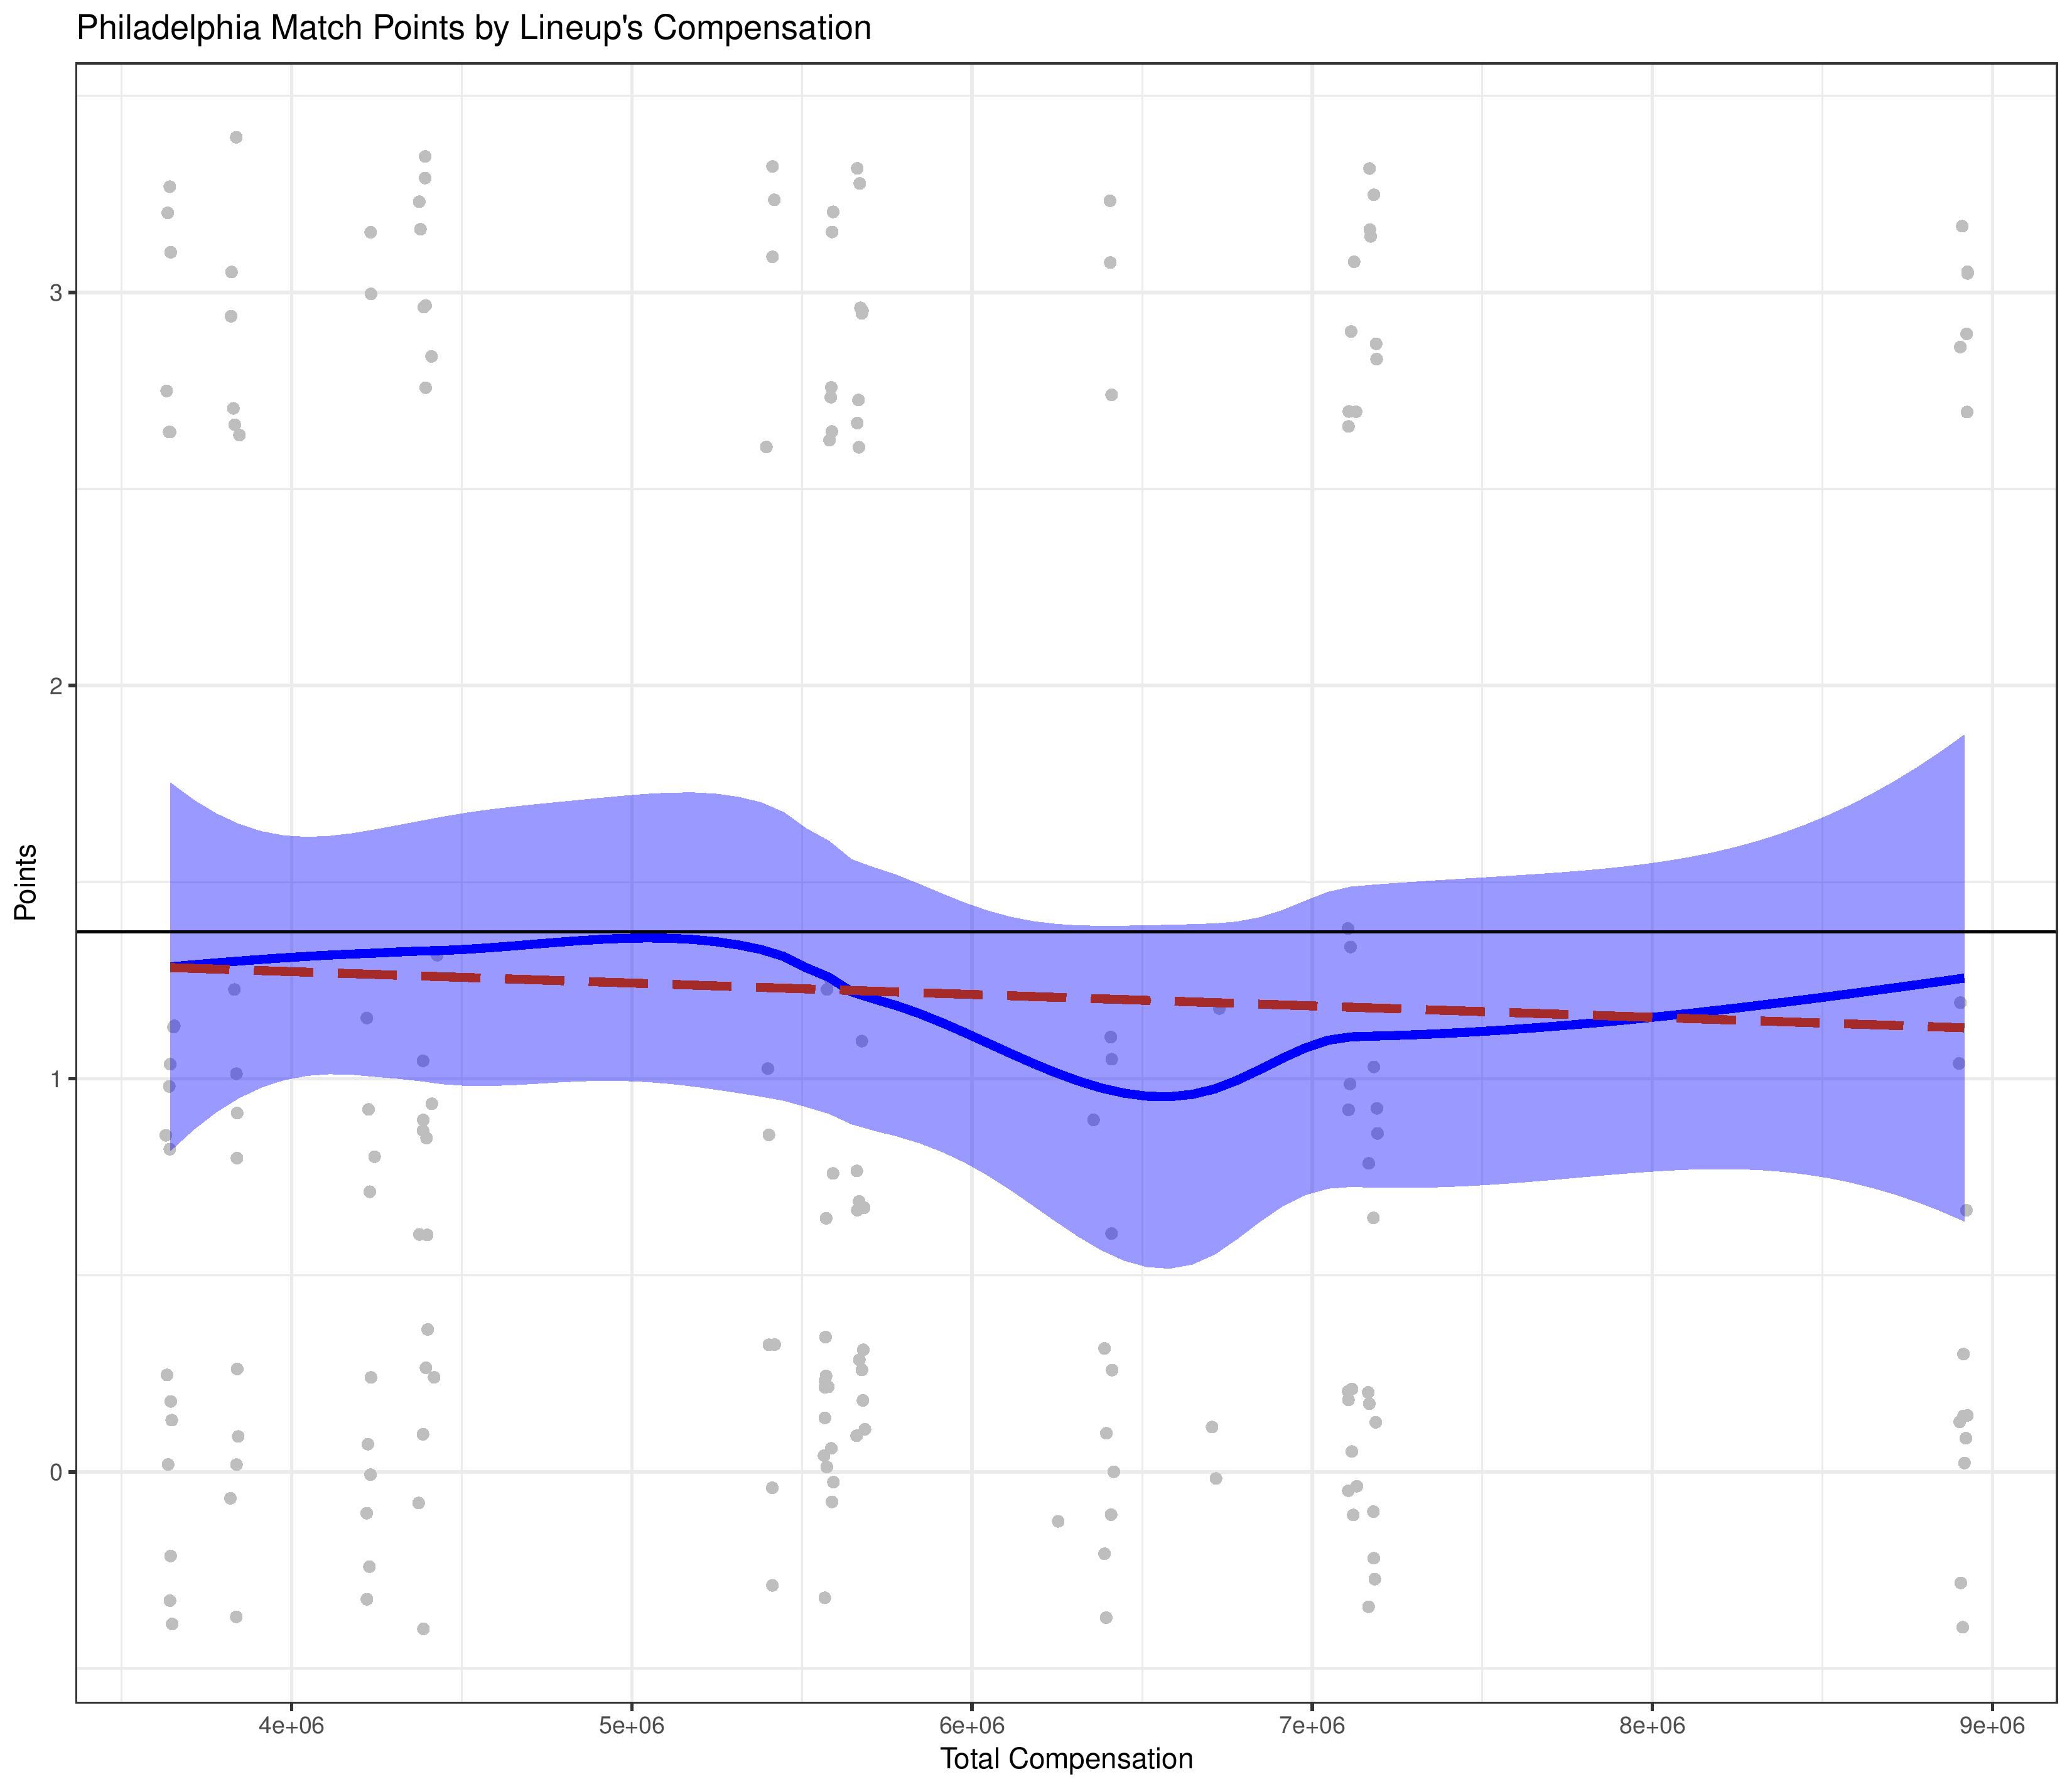
By match
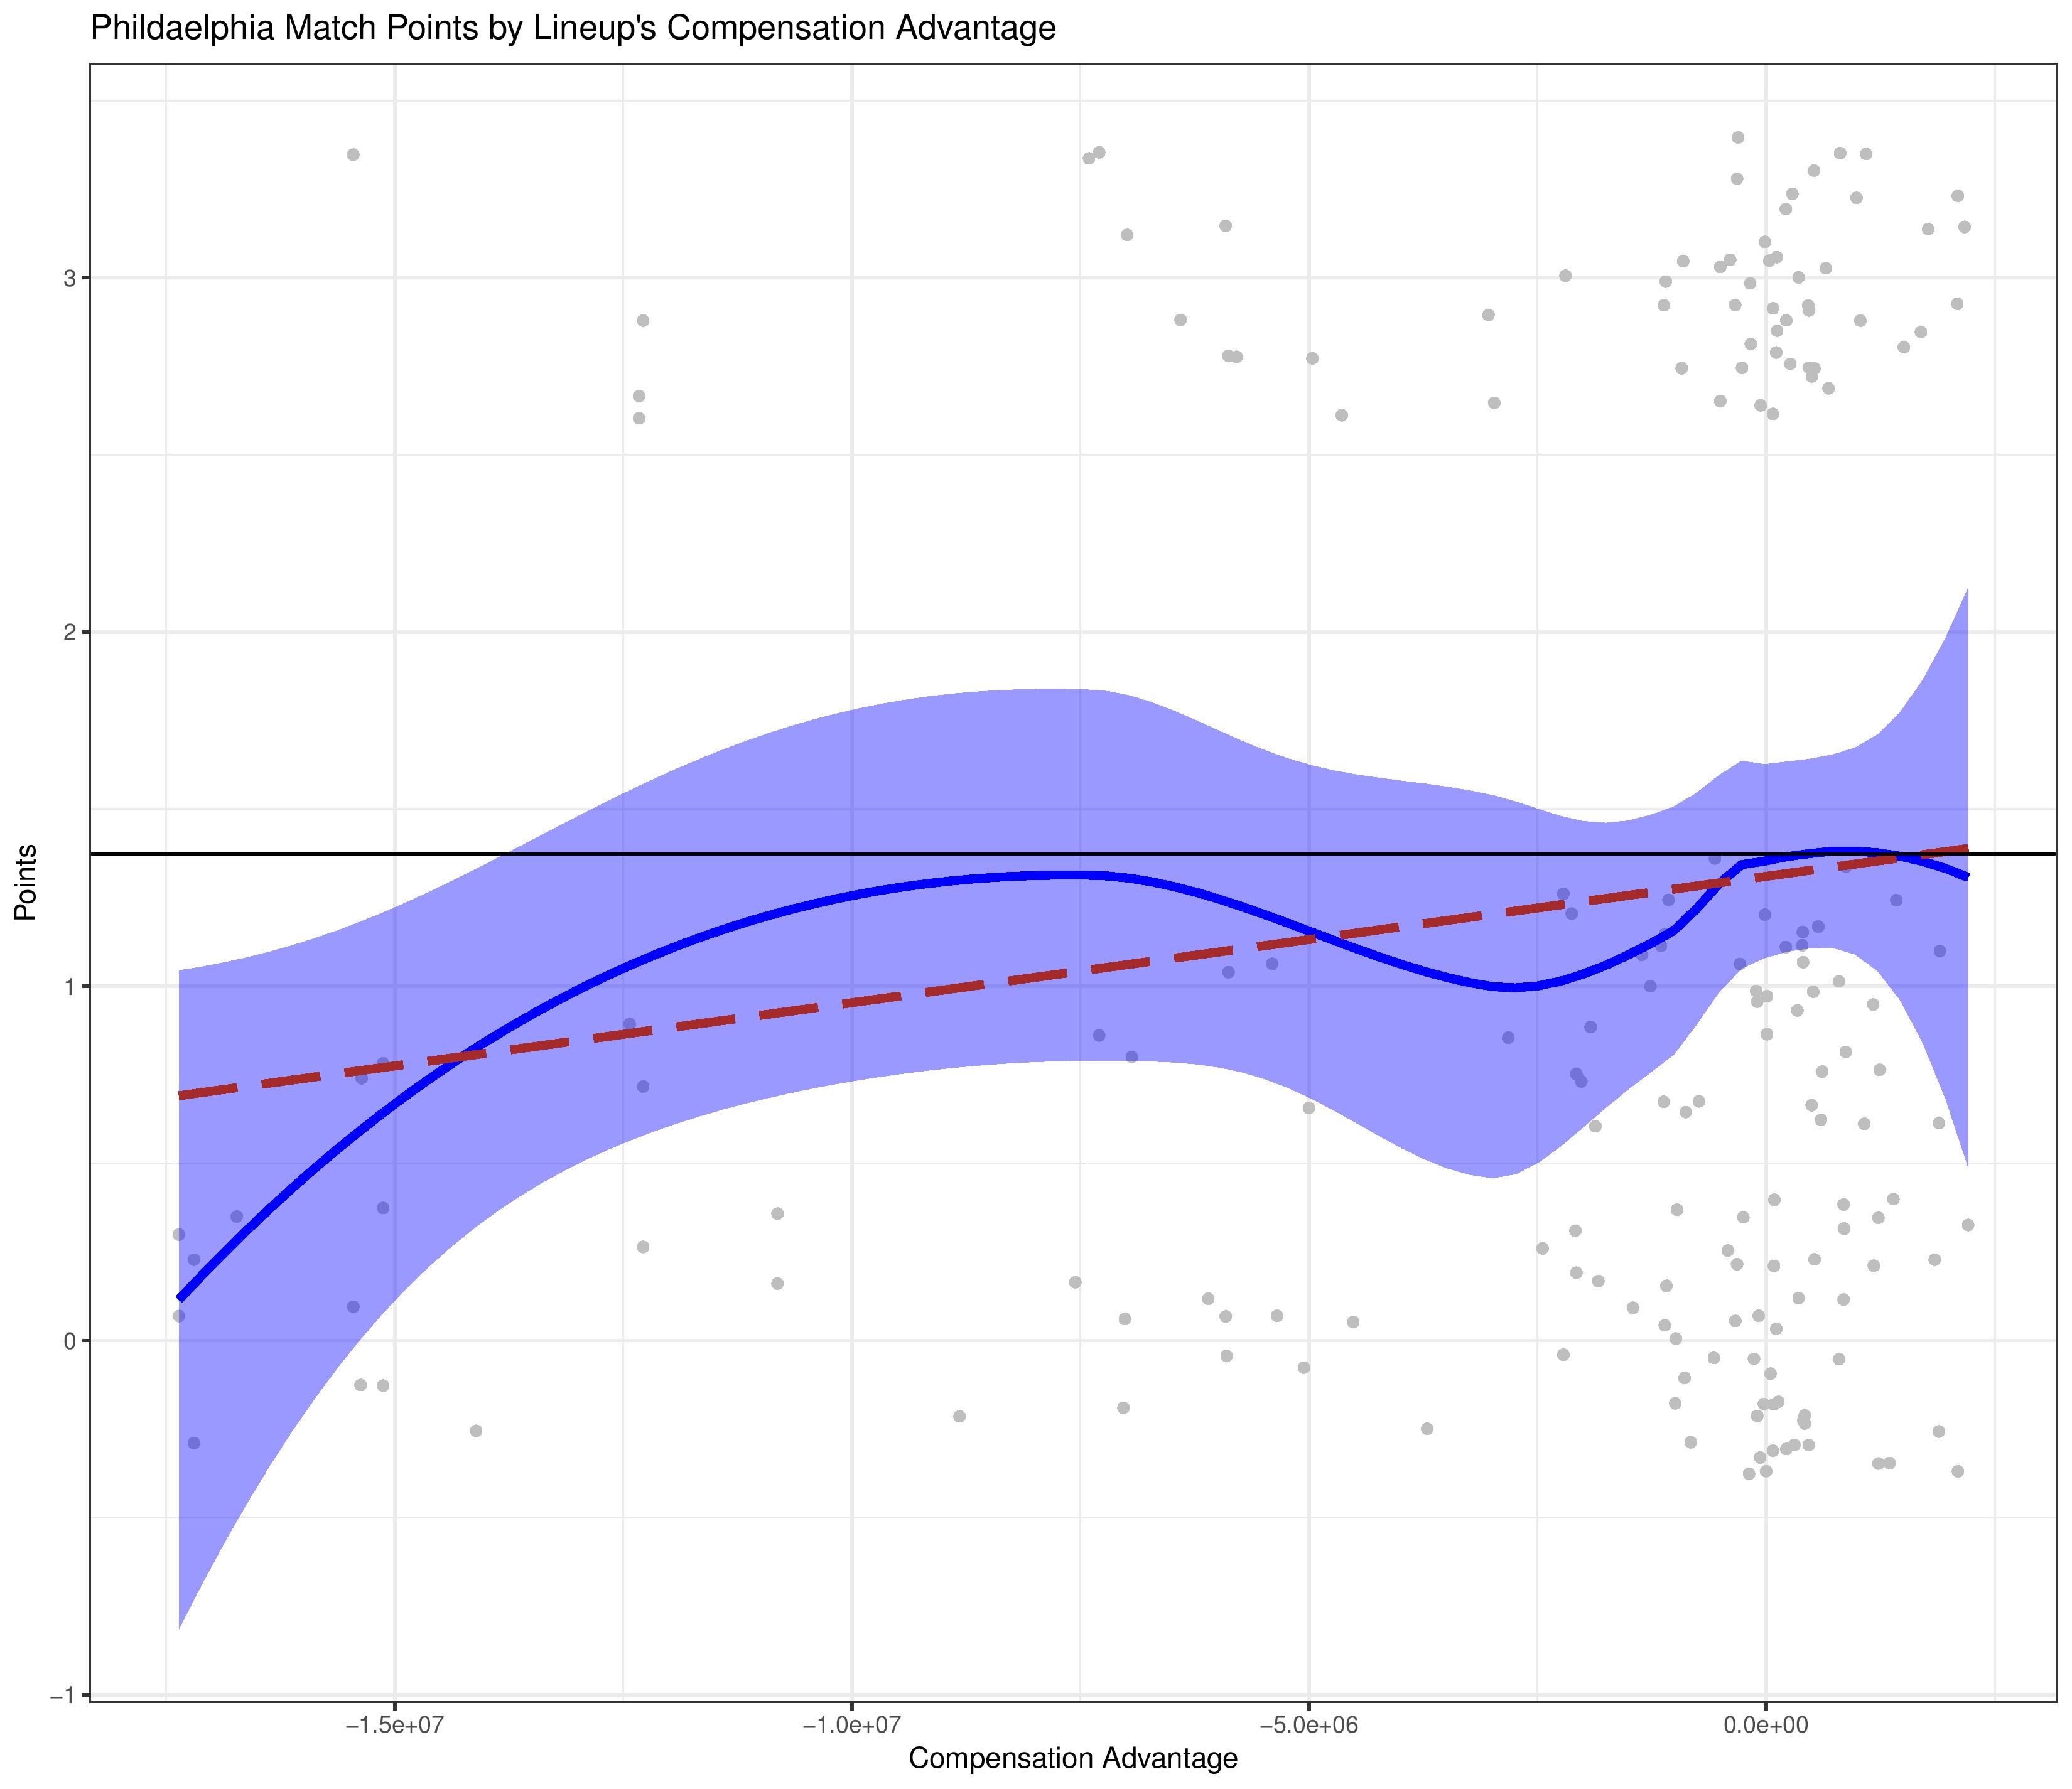
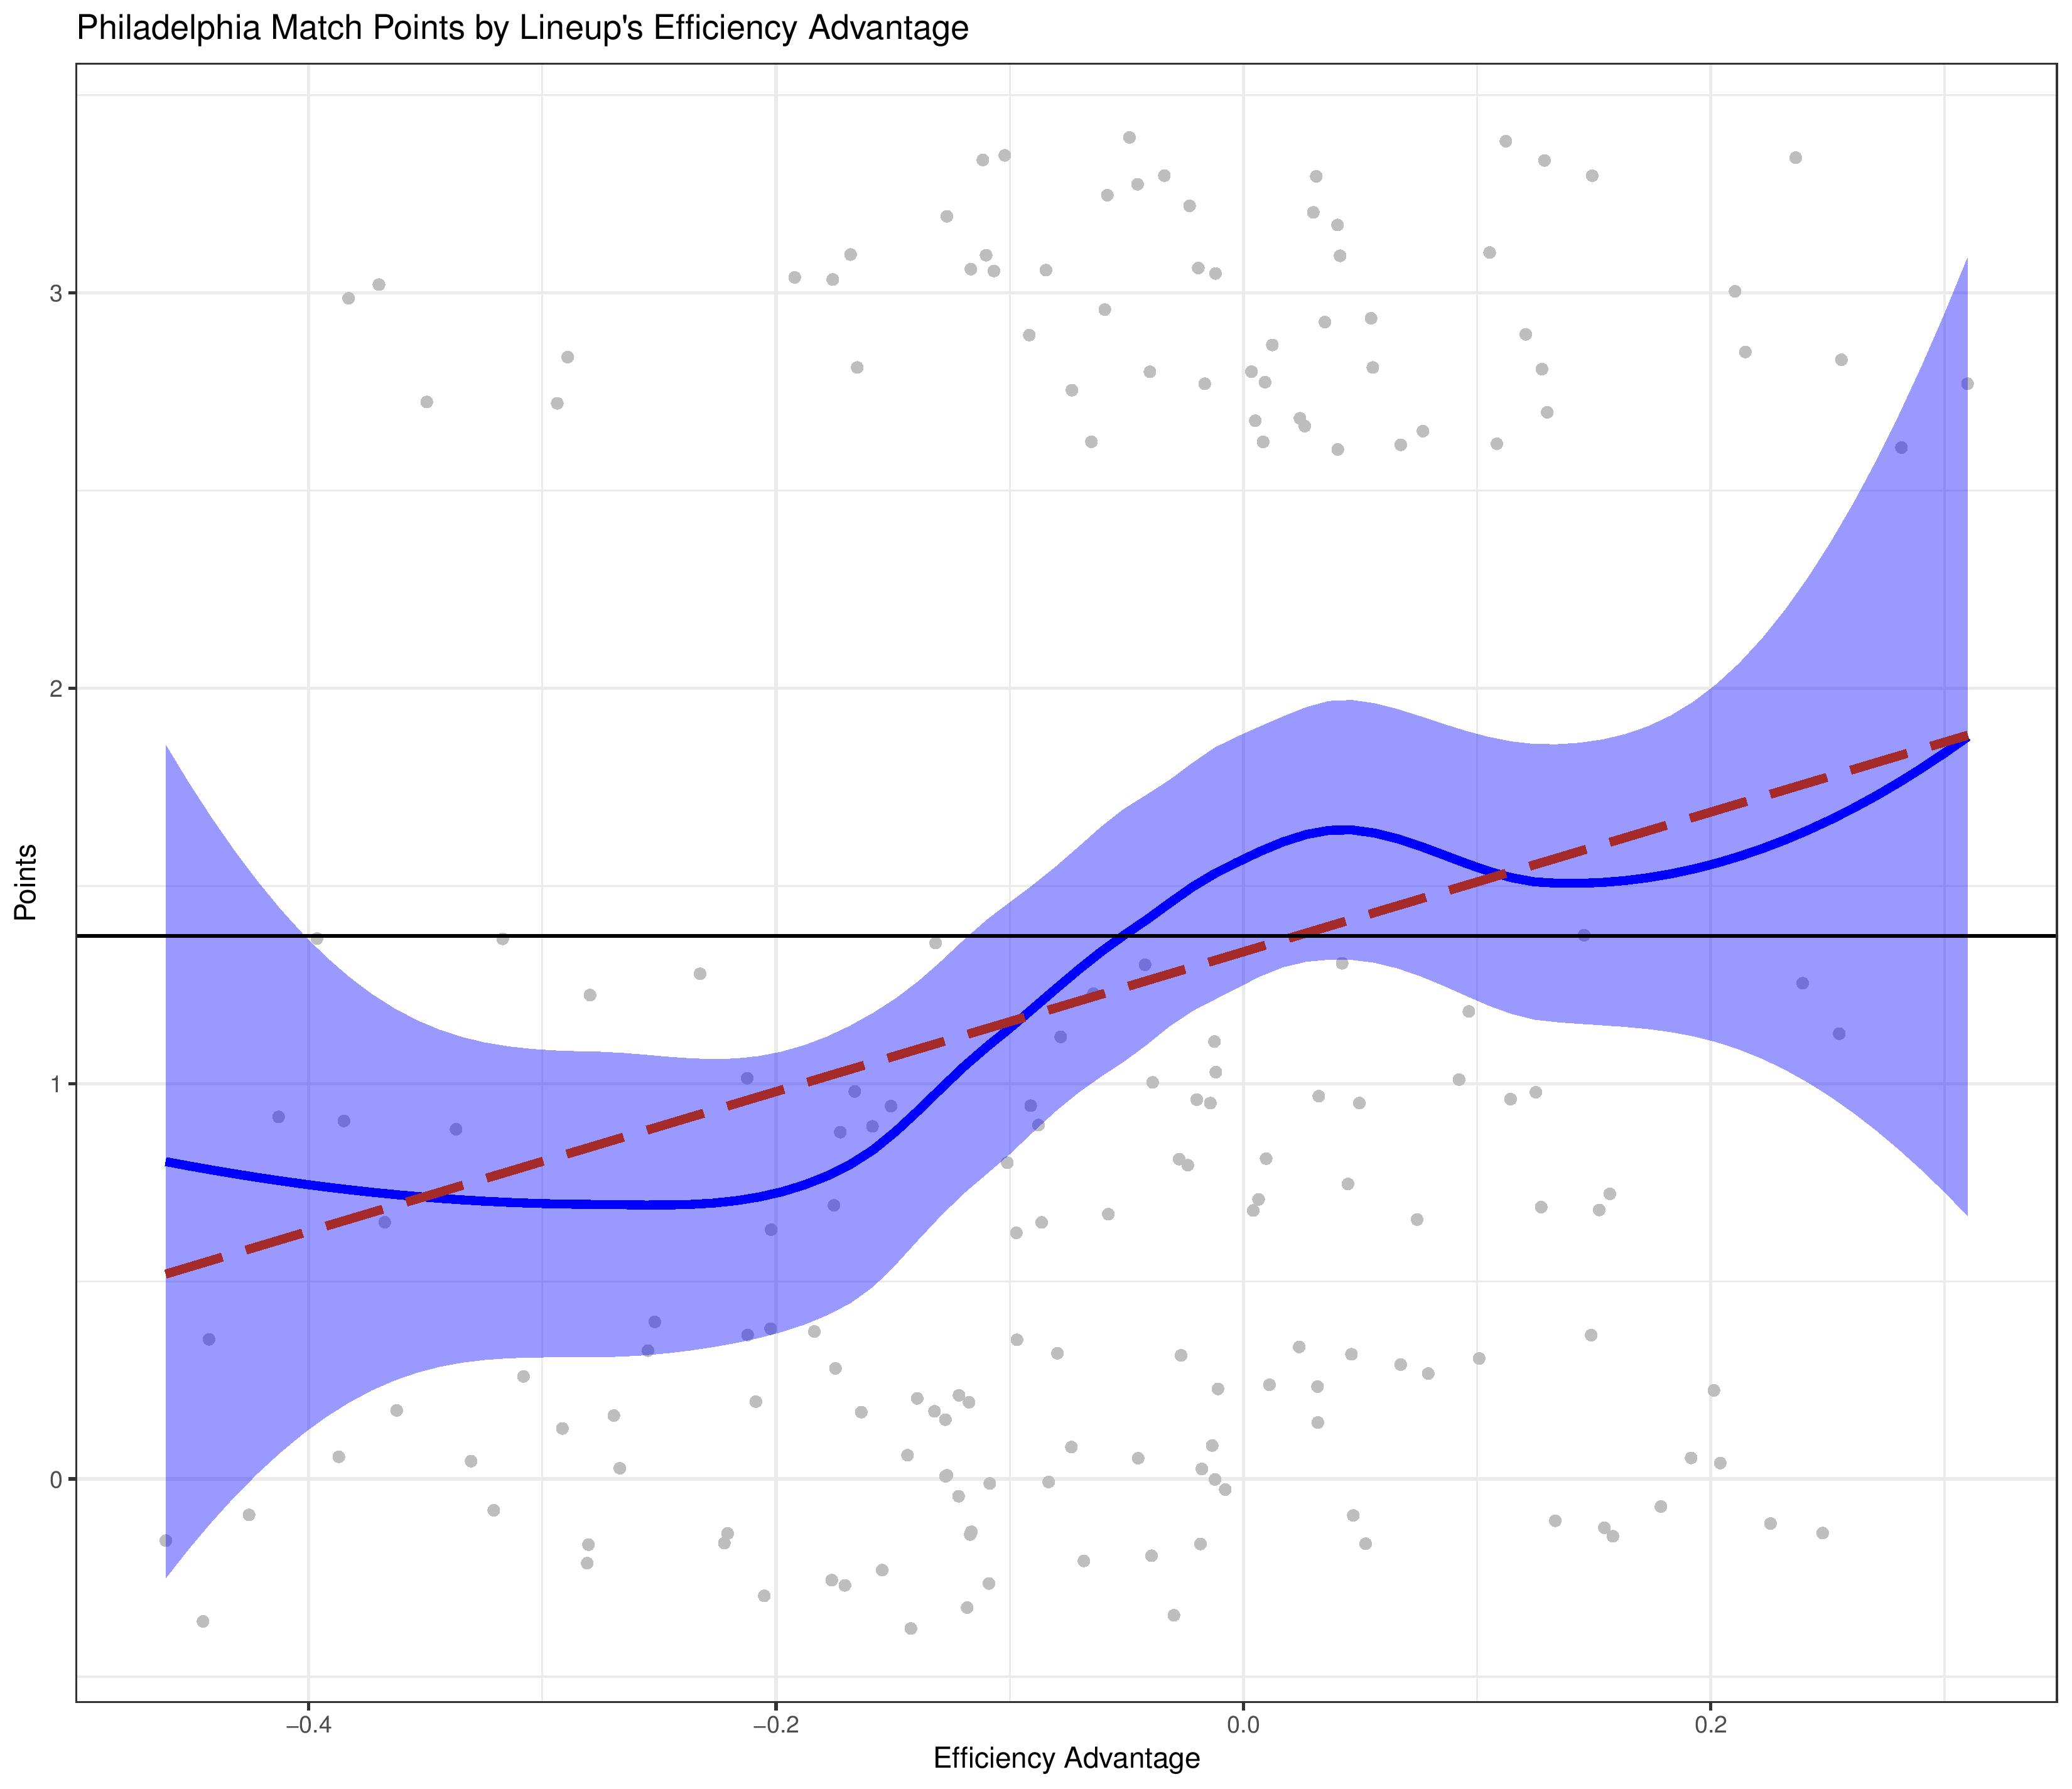
We can also break it down to the match level. If we do this, we may want to see whether having a more expensive lineup than your opponent contributed to anything.
*Lineup’s Compensation is the sum of each player’s annual compensation, pro-rated by what percentage of minutes they played out of 90 in the match. We are also showing only one side (the advantage), since the other side is a reciprocal (and throws off the trend lines).
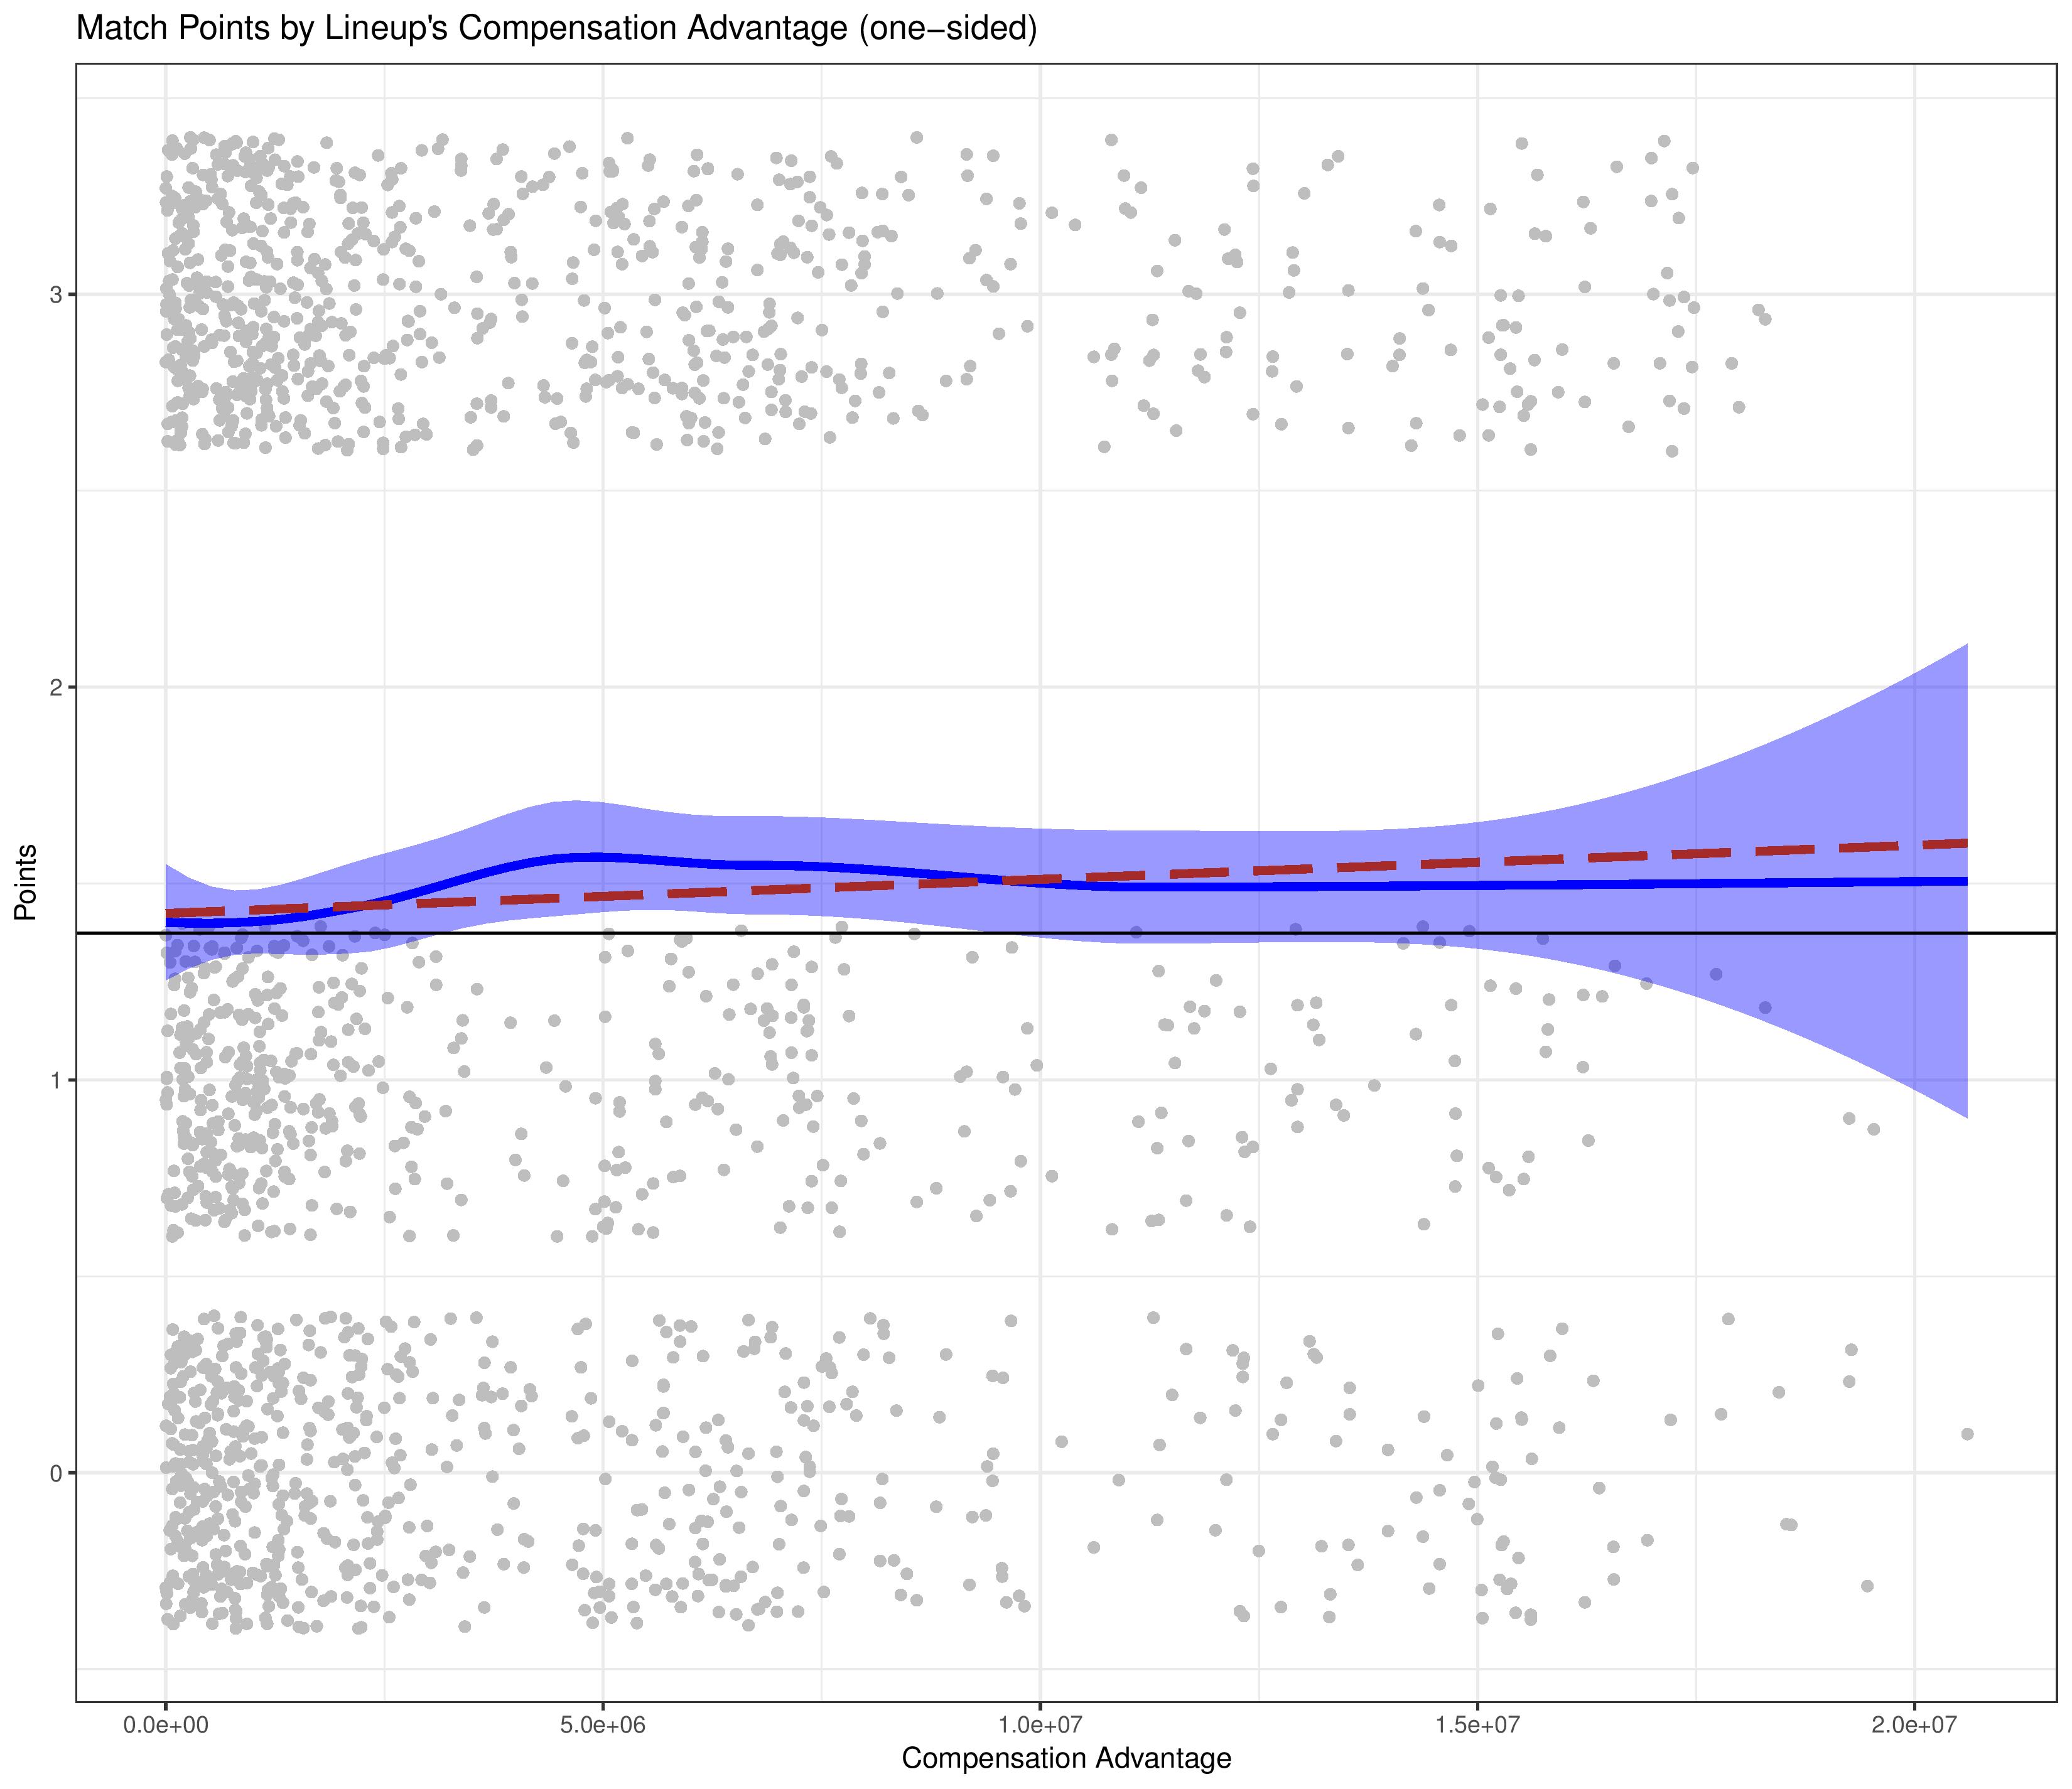
As we can see, there is, indeed, a bonus to having a more expensive lineup than your opponent, although it seems that having an advantage of around $4M is roughly the same benefit as an advantage of $20M. This advantage also appears to only offer an extra 0.27 points per match on average (9.2 points per 34-game-season if your lineup out-earns every opponent by at least $4M).
As this combines both compensation and efficiency, this might explain why clubs with money do better as long as they are efficient. Clubs spending more money, with enough efficiency to still field a more expensive lineup, are simply more likely to have this advantage against more of their opponents.
Compensation vs. objectives
Ok, so differences in spending between clubs have a more limited effect than we normally have expected with regards to points in the regular season table, but how does this relate to season objectives, such as making the playoffs or being an MLS Cup contender?
*Next is a box-and-whiskers plot for teams making the playoffs vs. not making the playoffs. The box portion for each of the playoffs/not-playoffs represents the middle 50% of the data points for that result (between the 25th and 75th percentiles). The horizontal line within each box is the median. The vertical lines extending from each of the boxes represents an extension of the box’s boundaries, but mostly serves to show that beyond those lines are likely outliers.
Playoffs
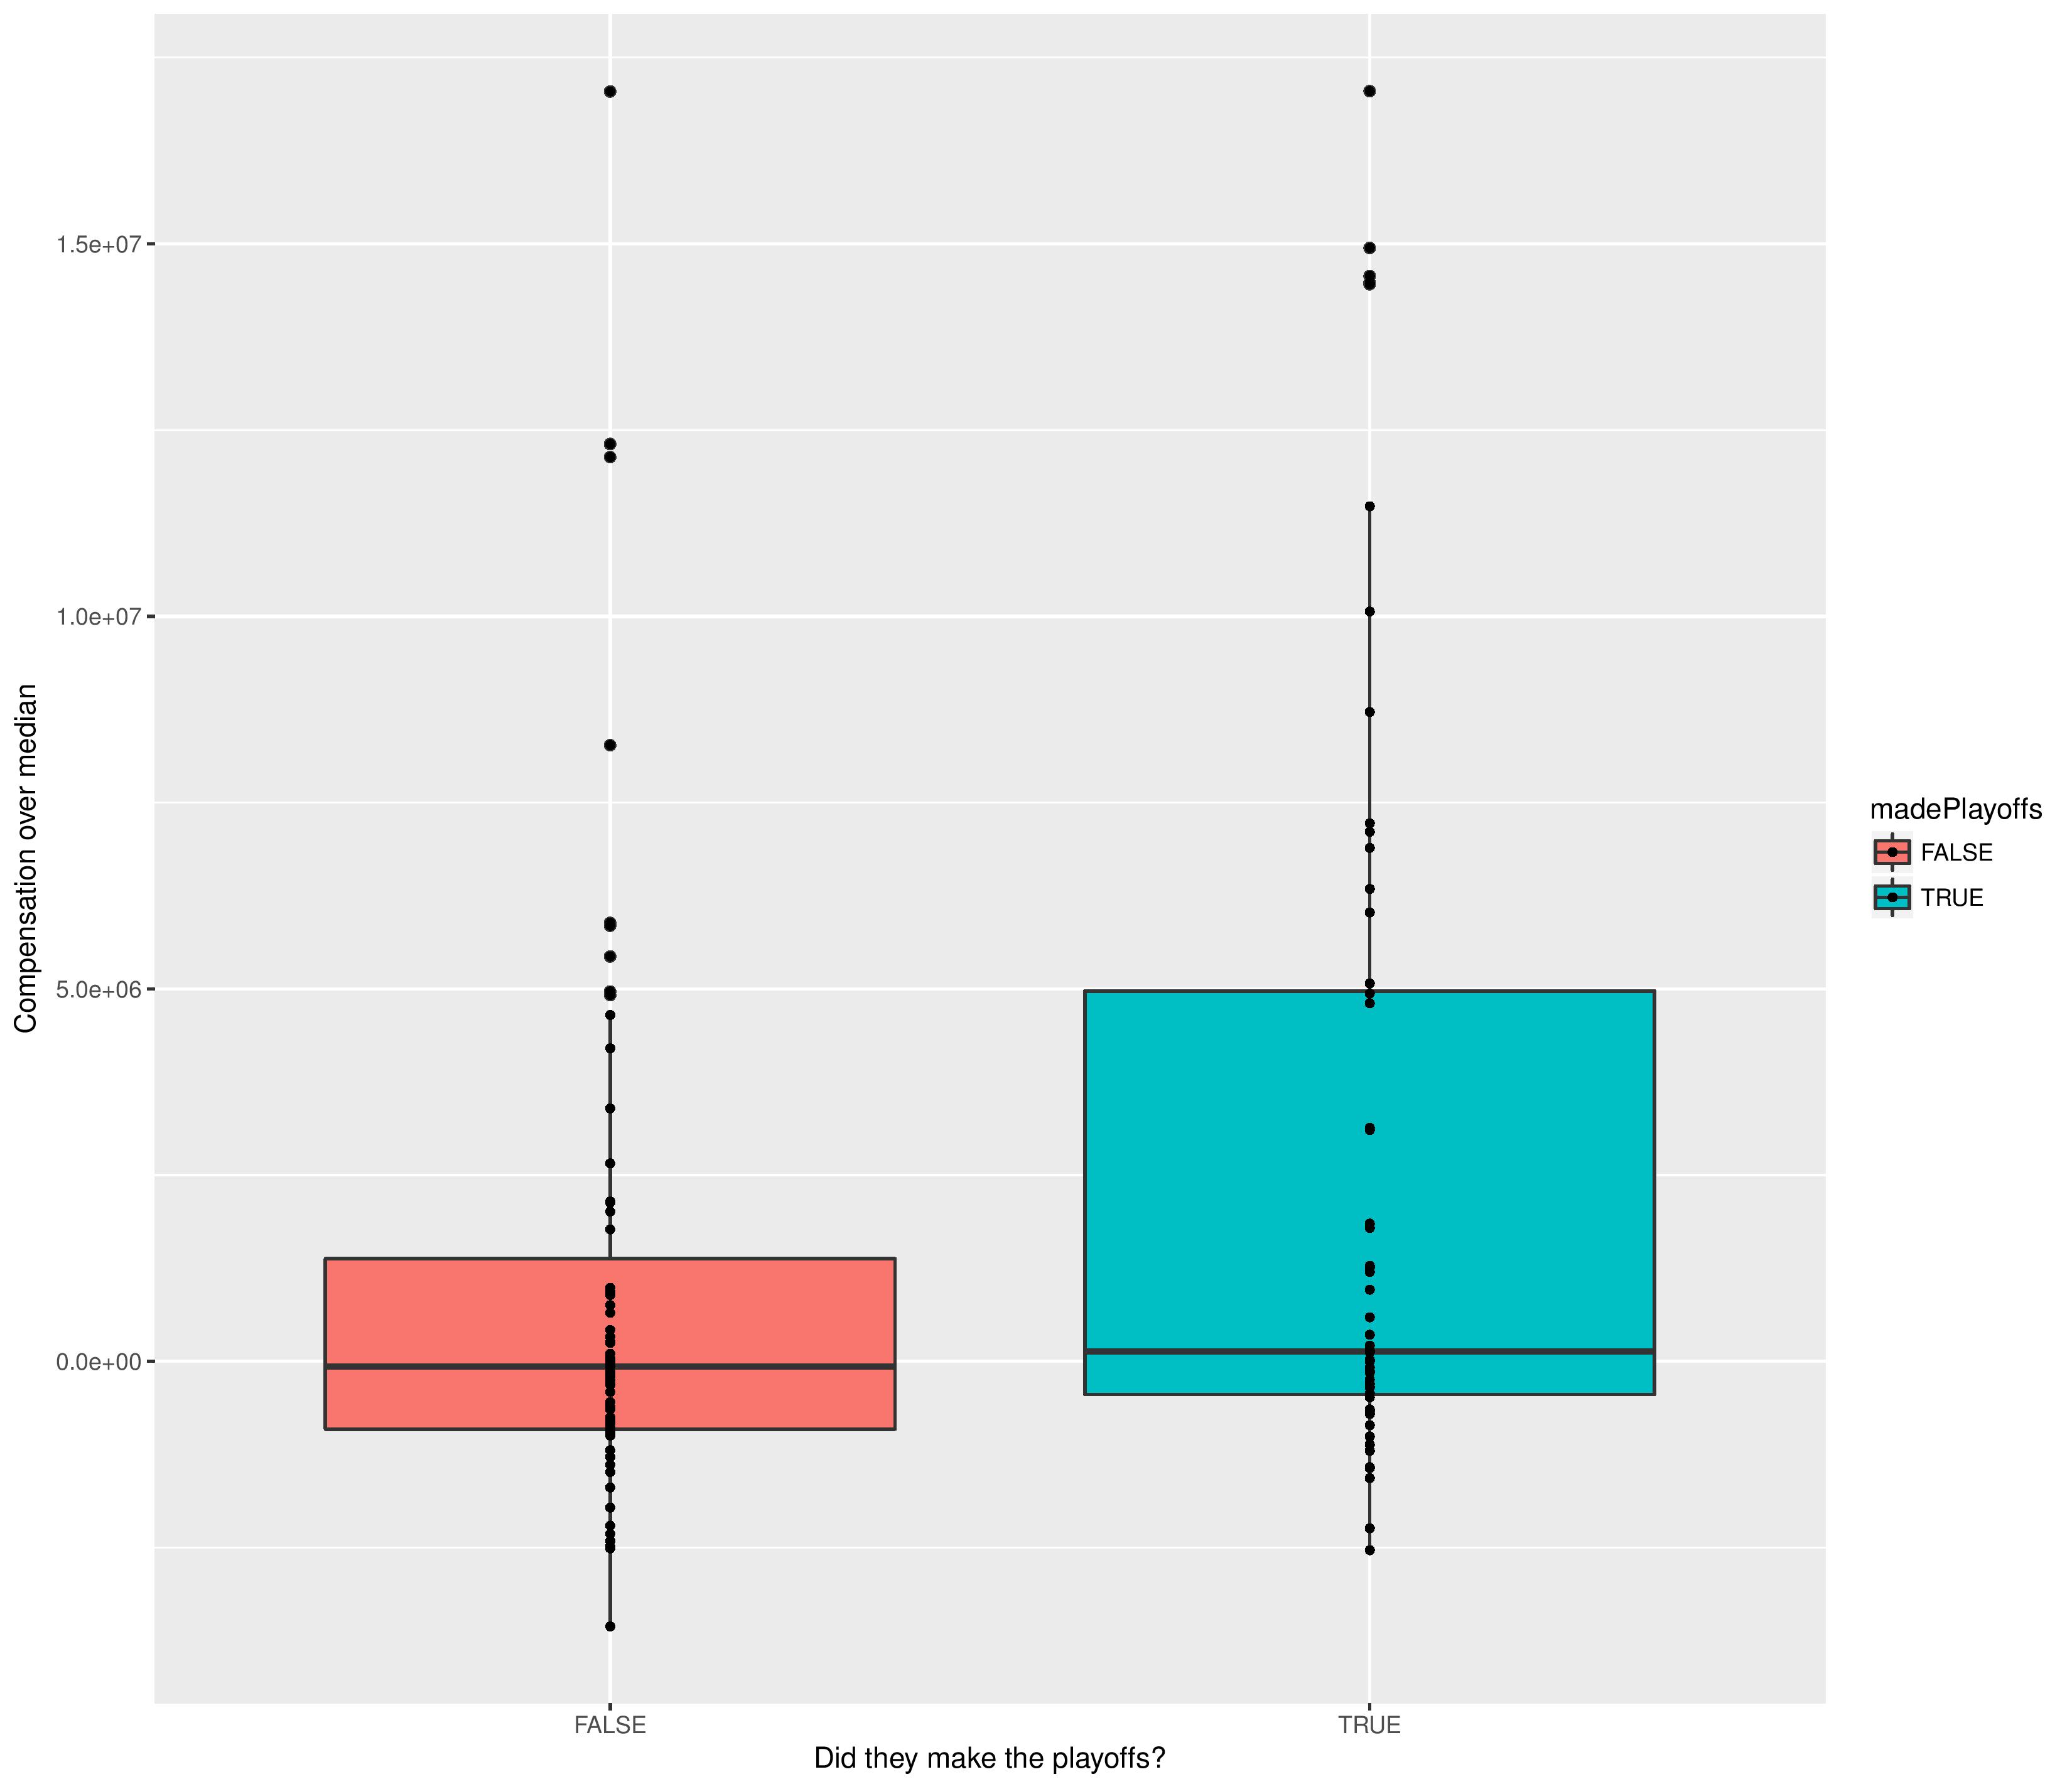
In this chart, we see that the medians for the two groups are nearly the same, with a slight advantage towards clubs with more money. While smaller-budget teams do not appear overly strained to make the playoffs, big-spenders get into the playoffs often.
Next is the same type of plot, but for efficiency rather than compensation.
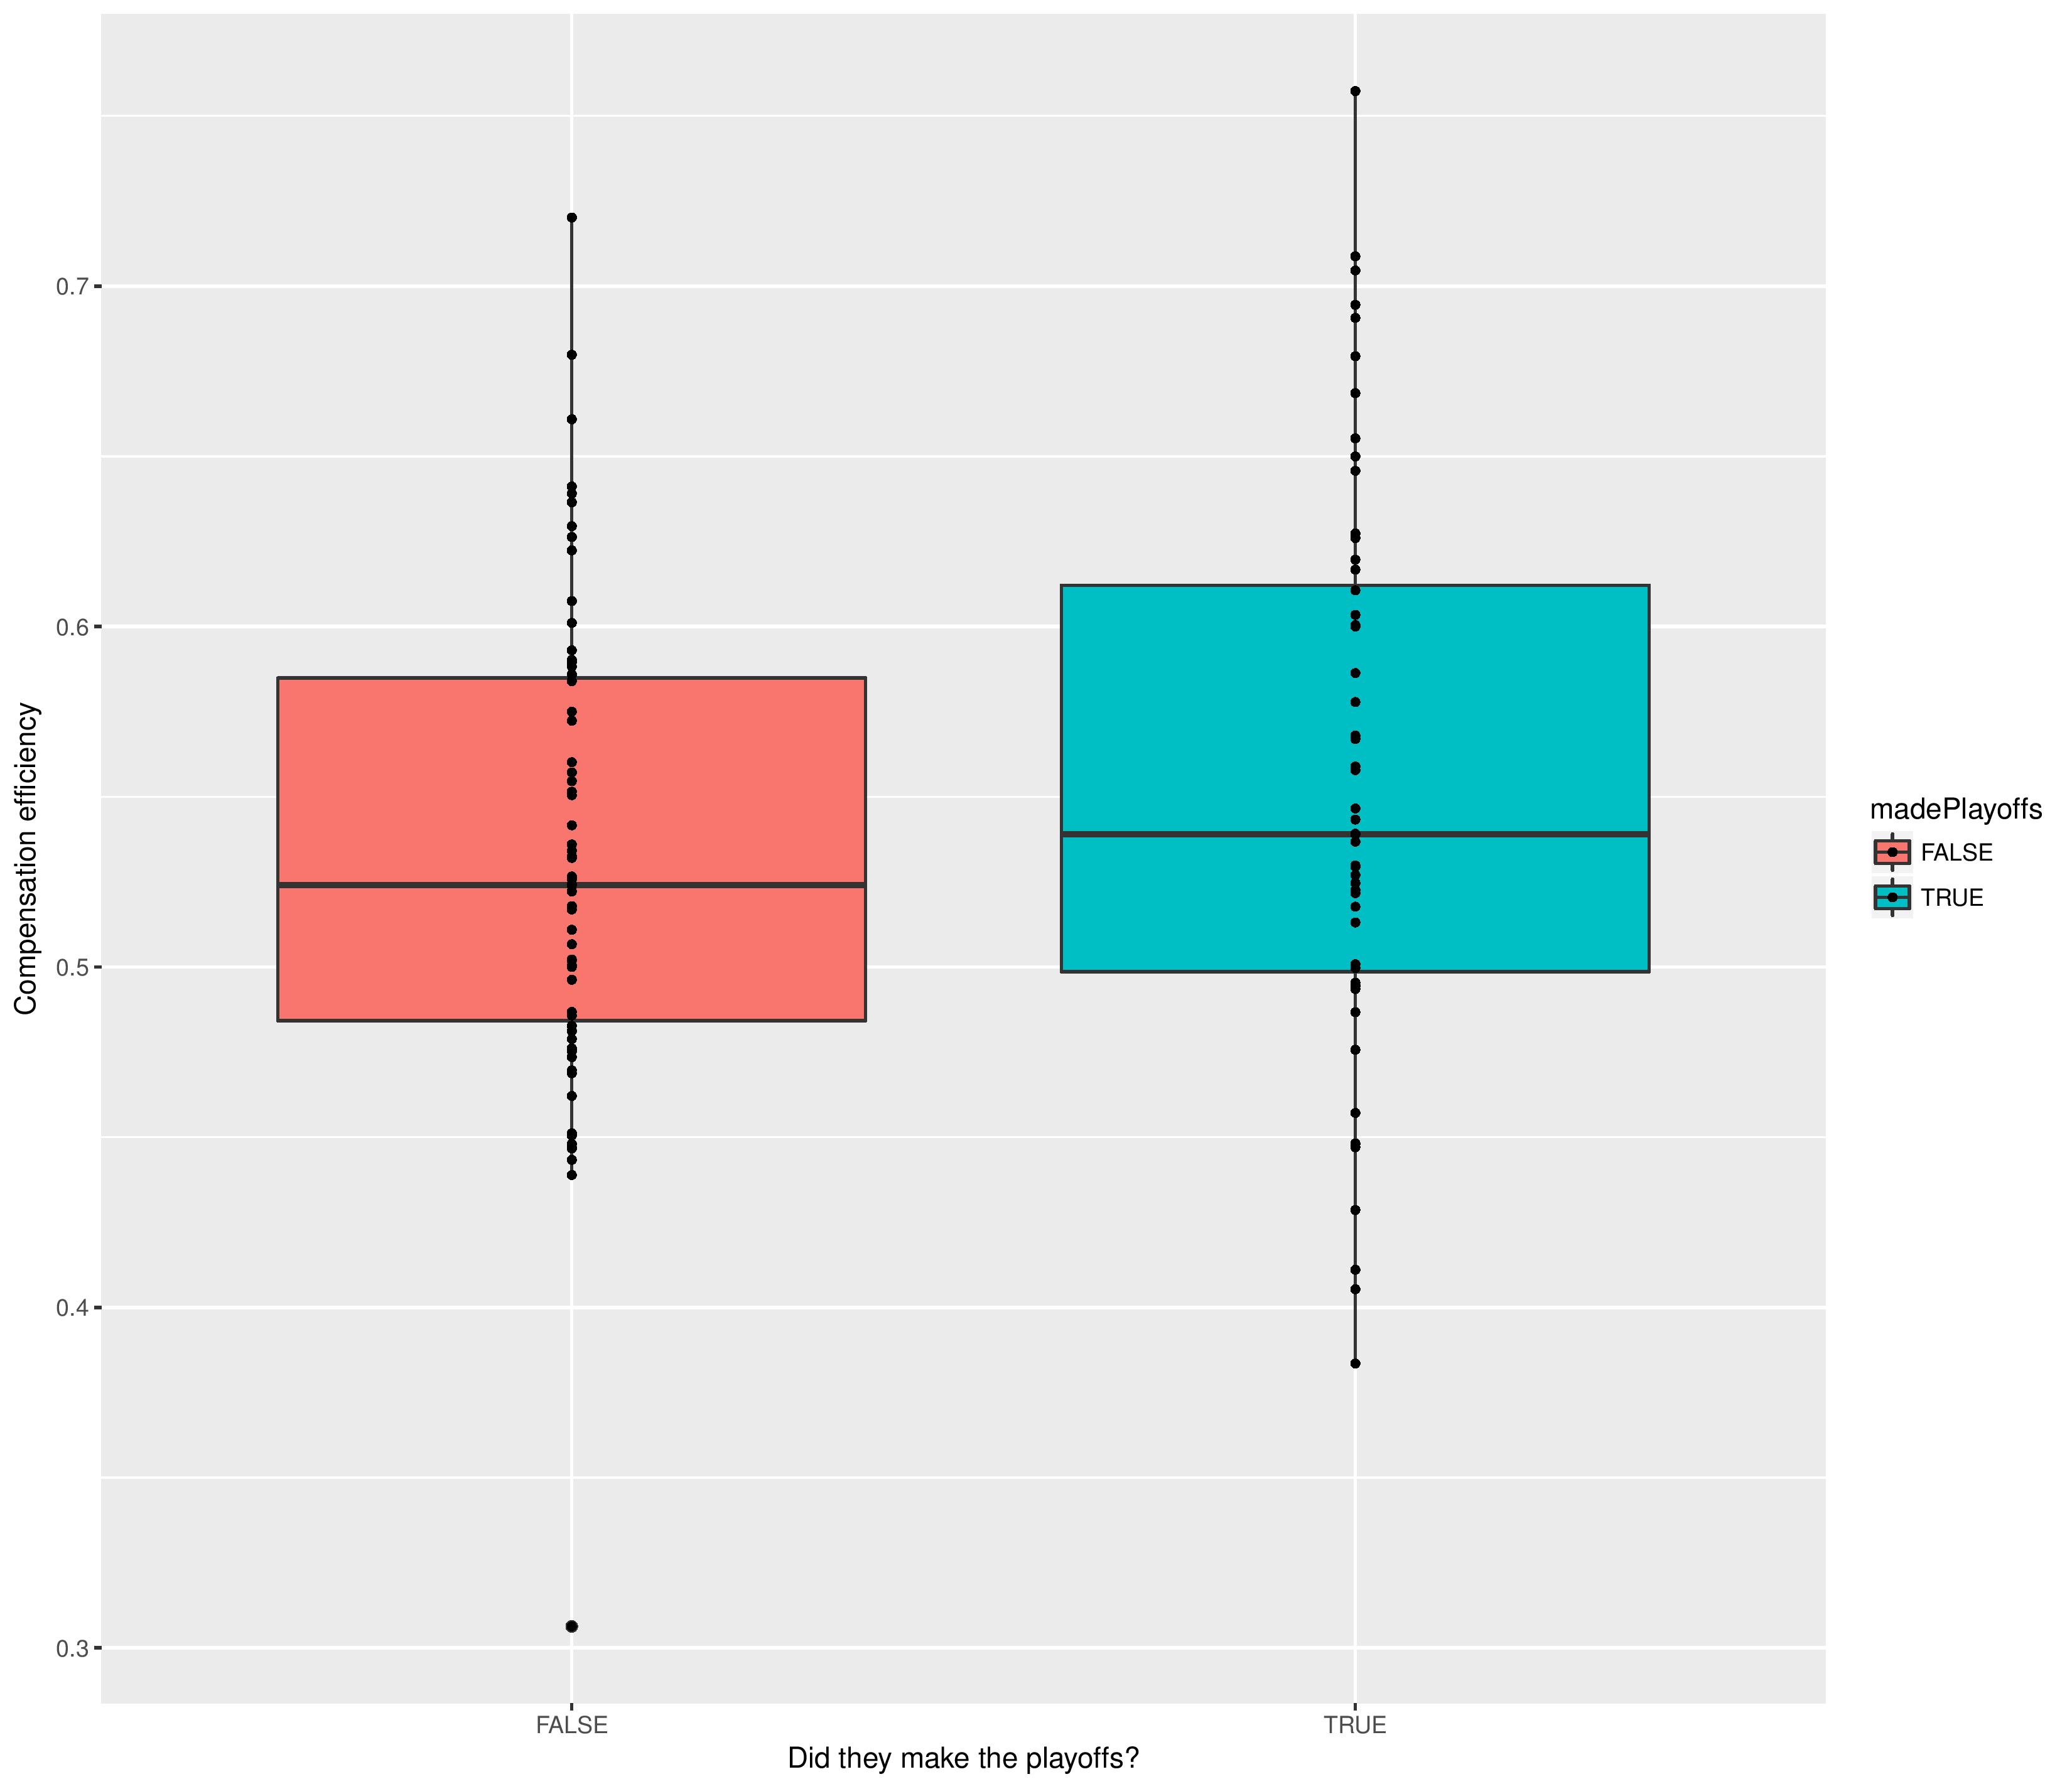
Efficiency also seems to matter for making the playoffs, but not necessarily as much as one might expect. The high-efficiency clubs are more likely to make the playoffs, but are far from guaranteed.
Supporters Shield
While this only includes five data-points for the winner’s class, I still thought it would be interesting to compare.
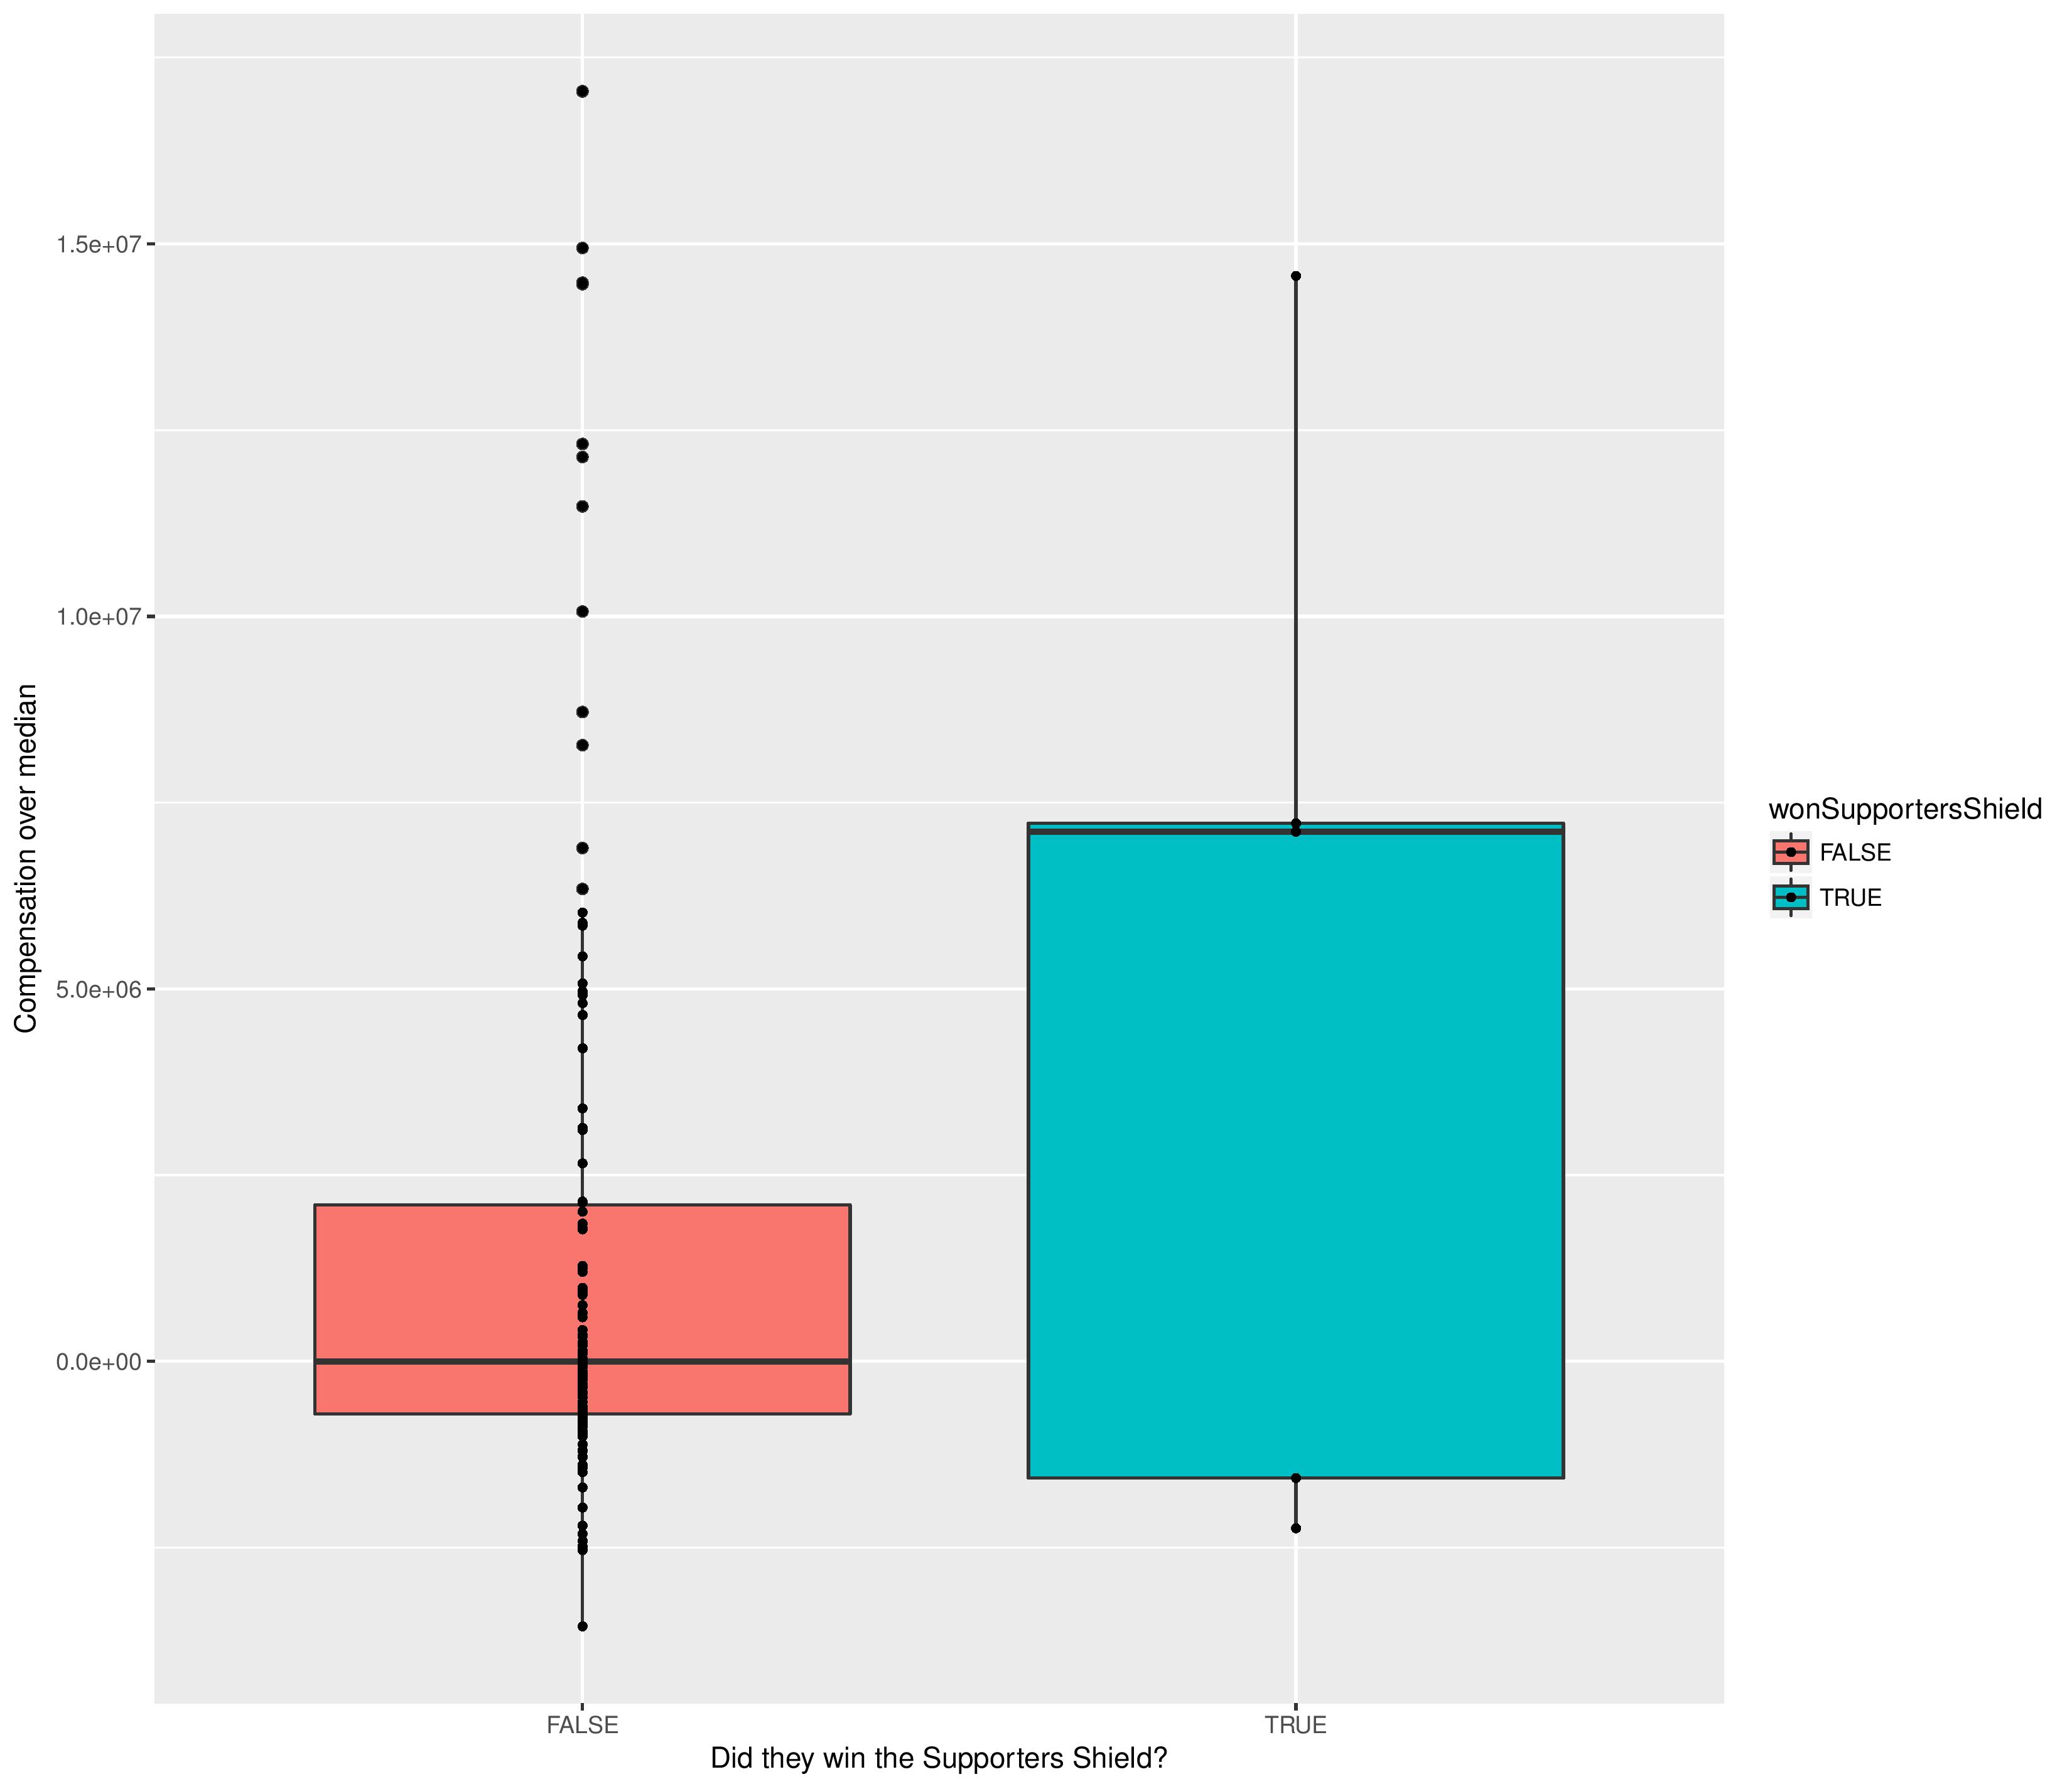
The median compensation for clubs who won the Supporters Shield is much higher than for those who failed, but I did find it interesting that 2/5 winners were spending less than the league-median at the time.
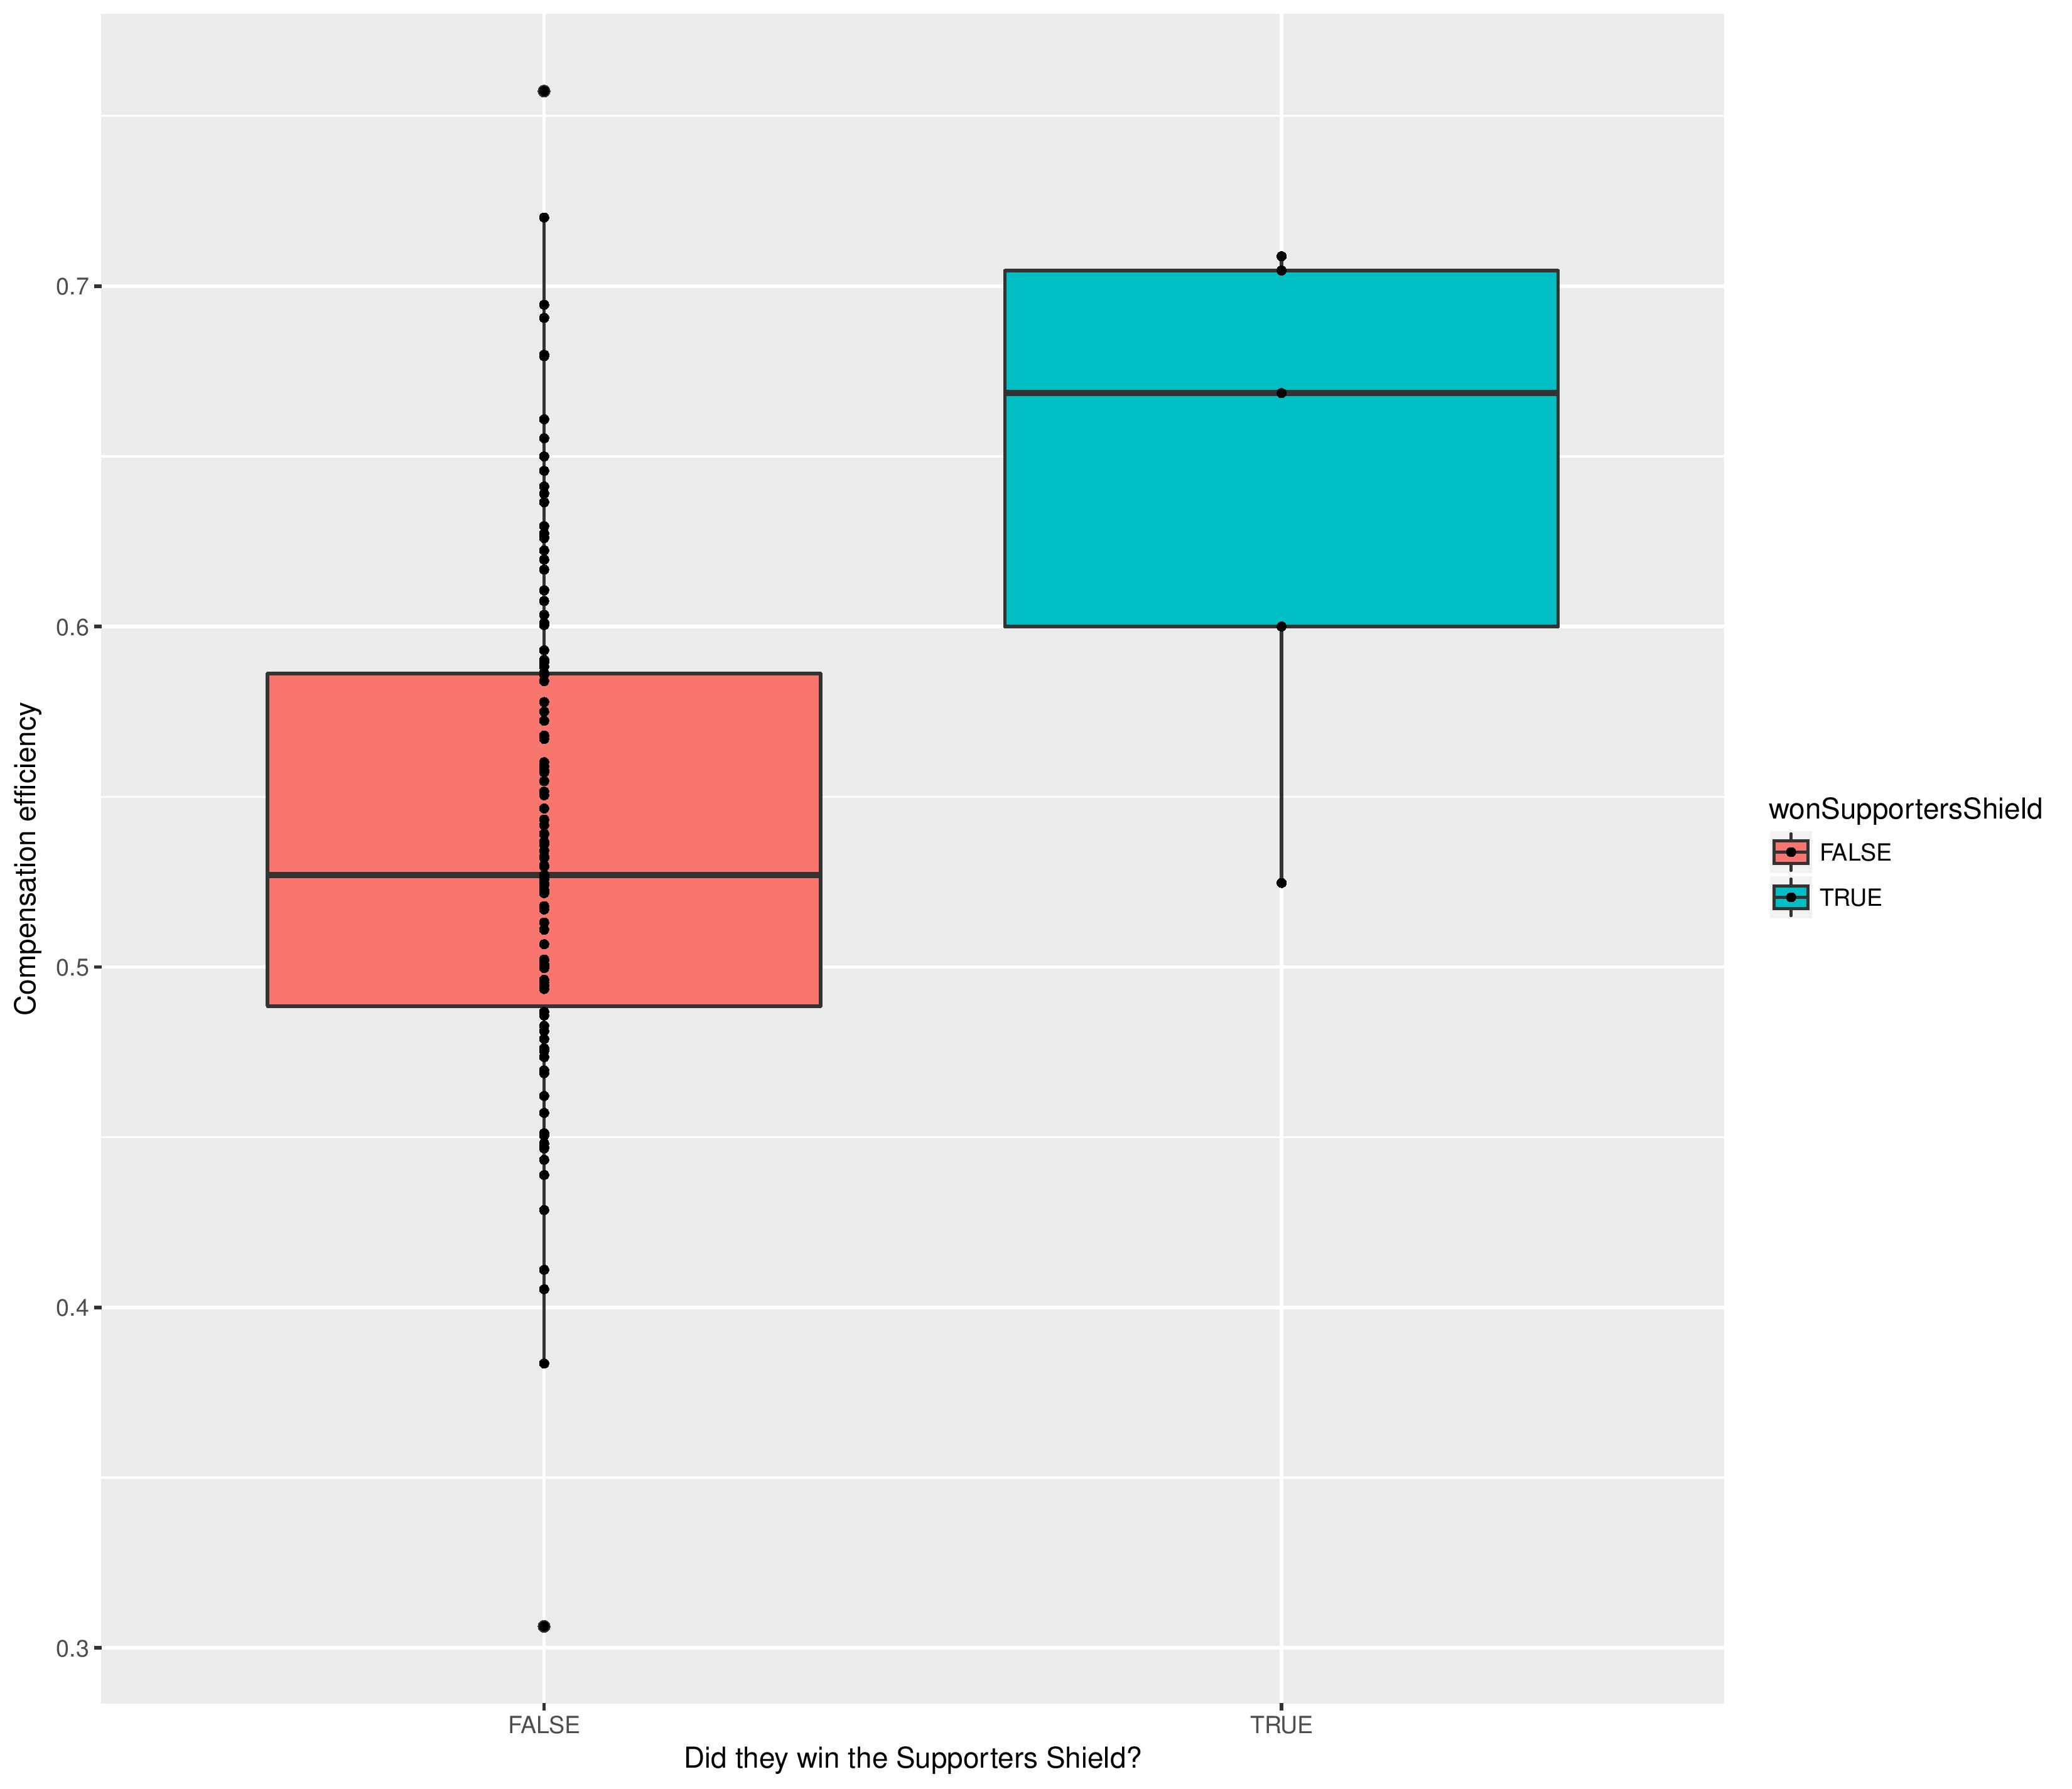
It is clear, however, that to win the Supporters Shield, a club likely has to be highly efficient with their payroll.
MLS Cup Final
In an attempt to gain a few more data-points, I’m lumping together clubs that made the MLS Cup Final, rather than just the winners.
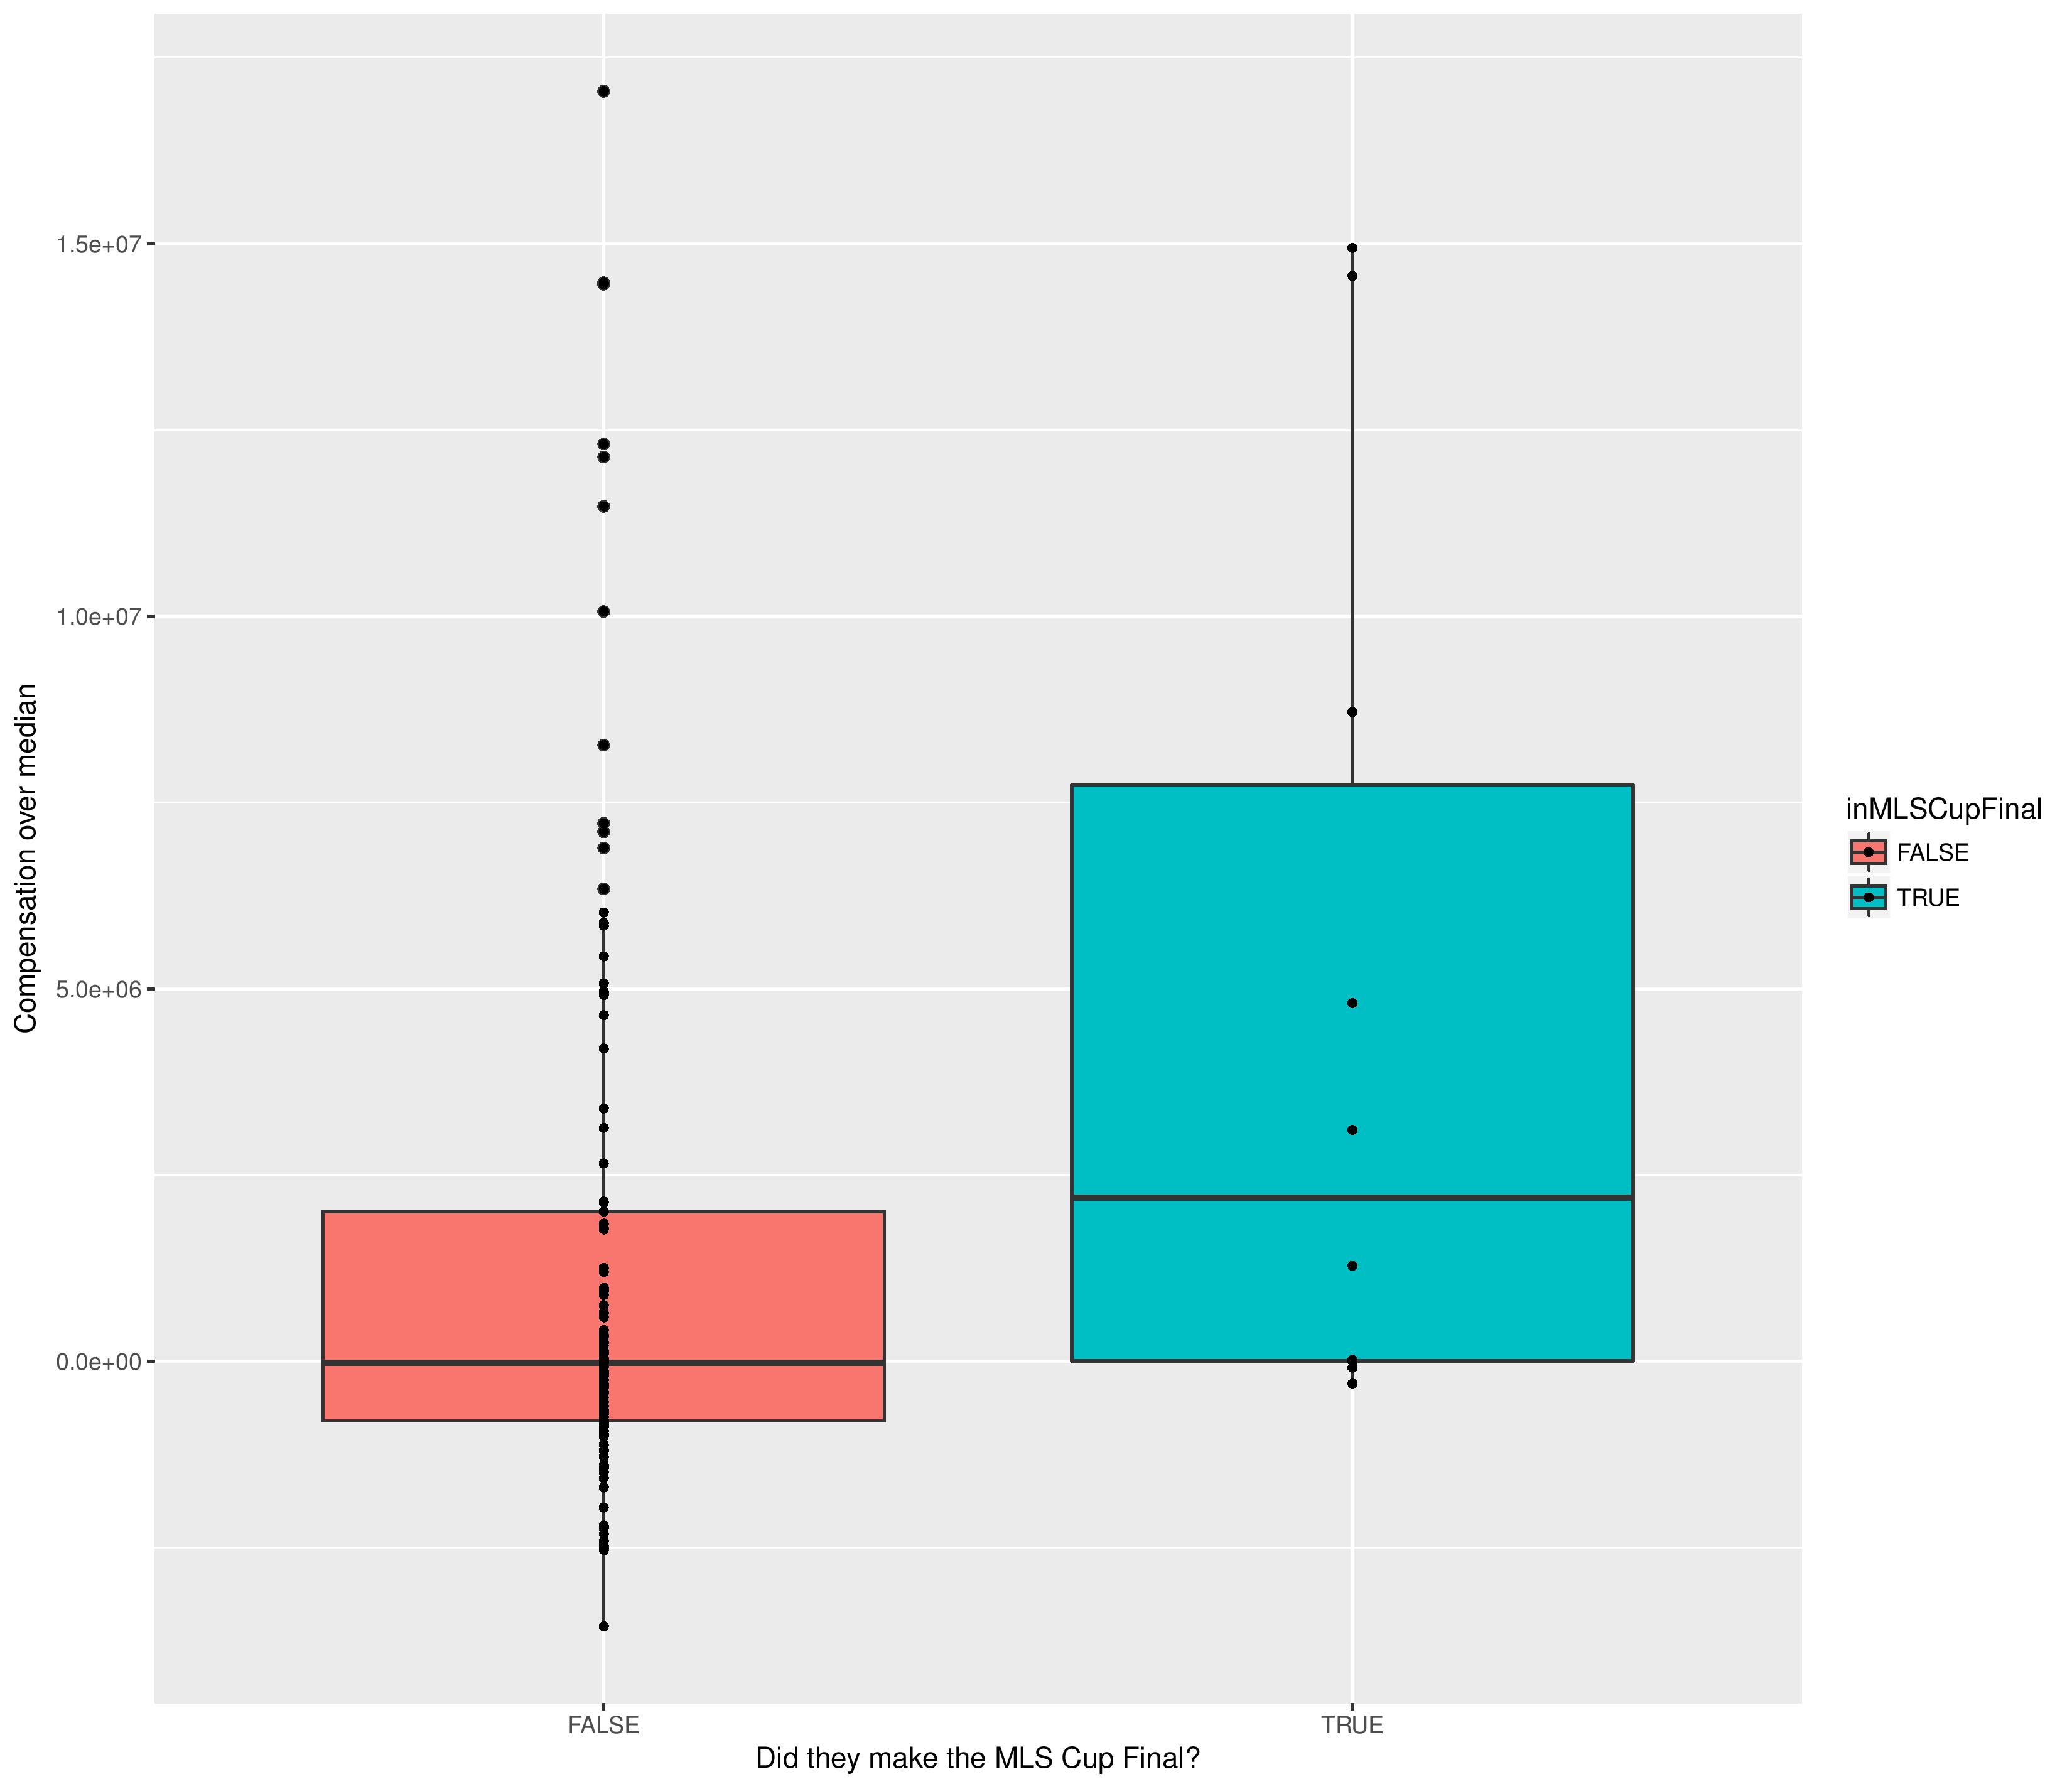
Here the difference is more clear. No team in the past 5 years has made the MLS Cup final without spending at least about the league median, and is usually much larger. Not every team with a big budget is guaranteed to make the championship, but it does appear that it is hard to do so with a small budget.
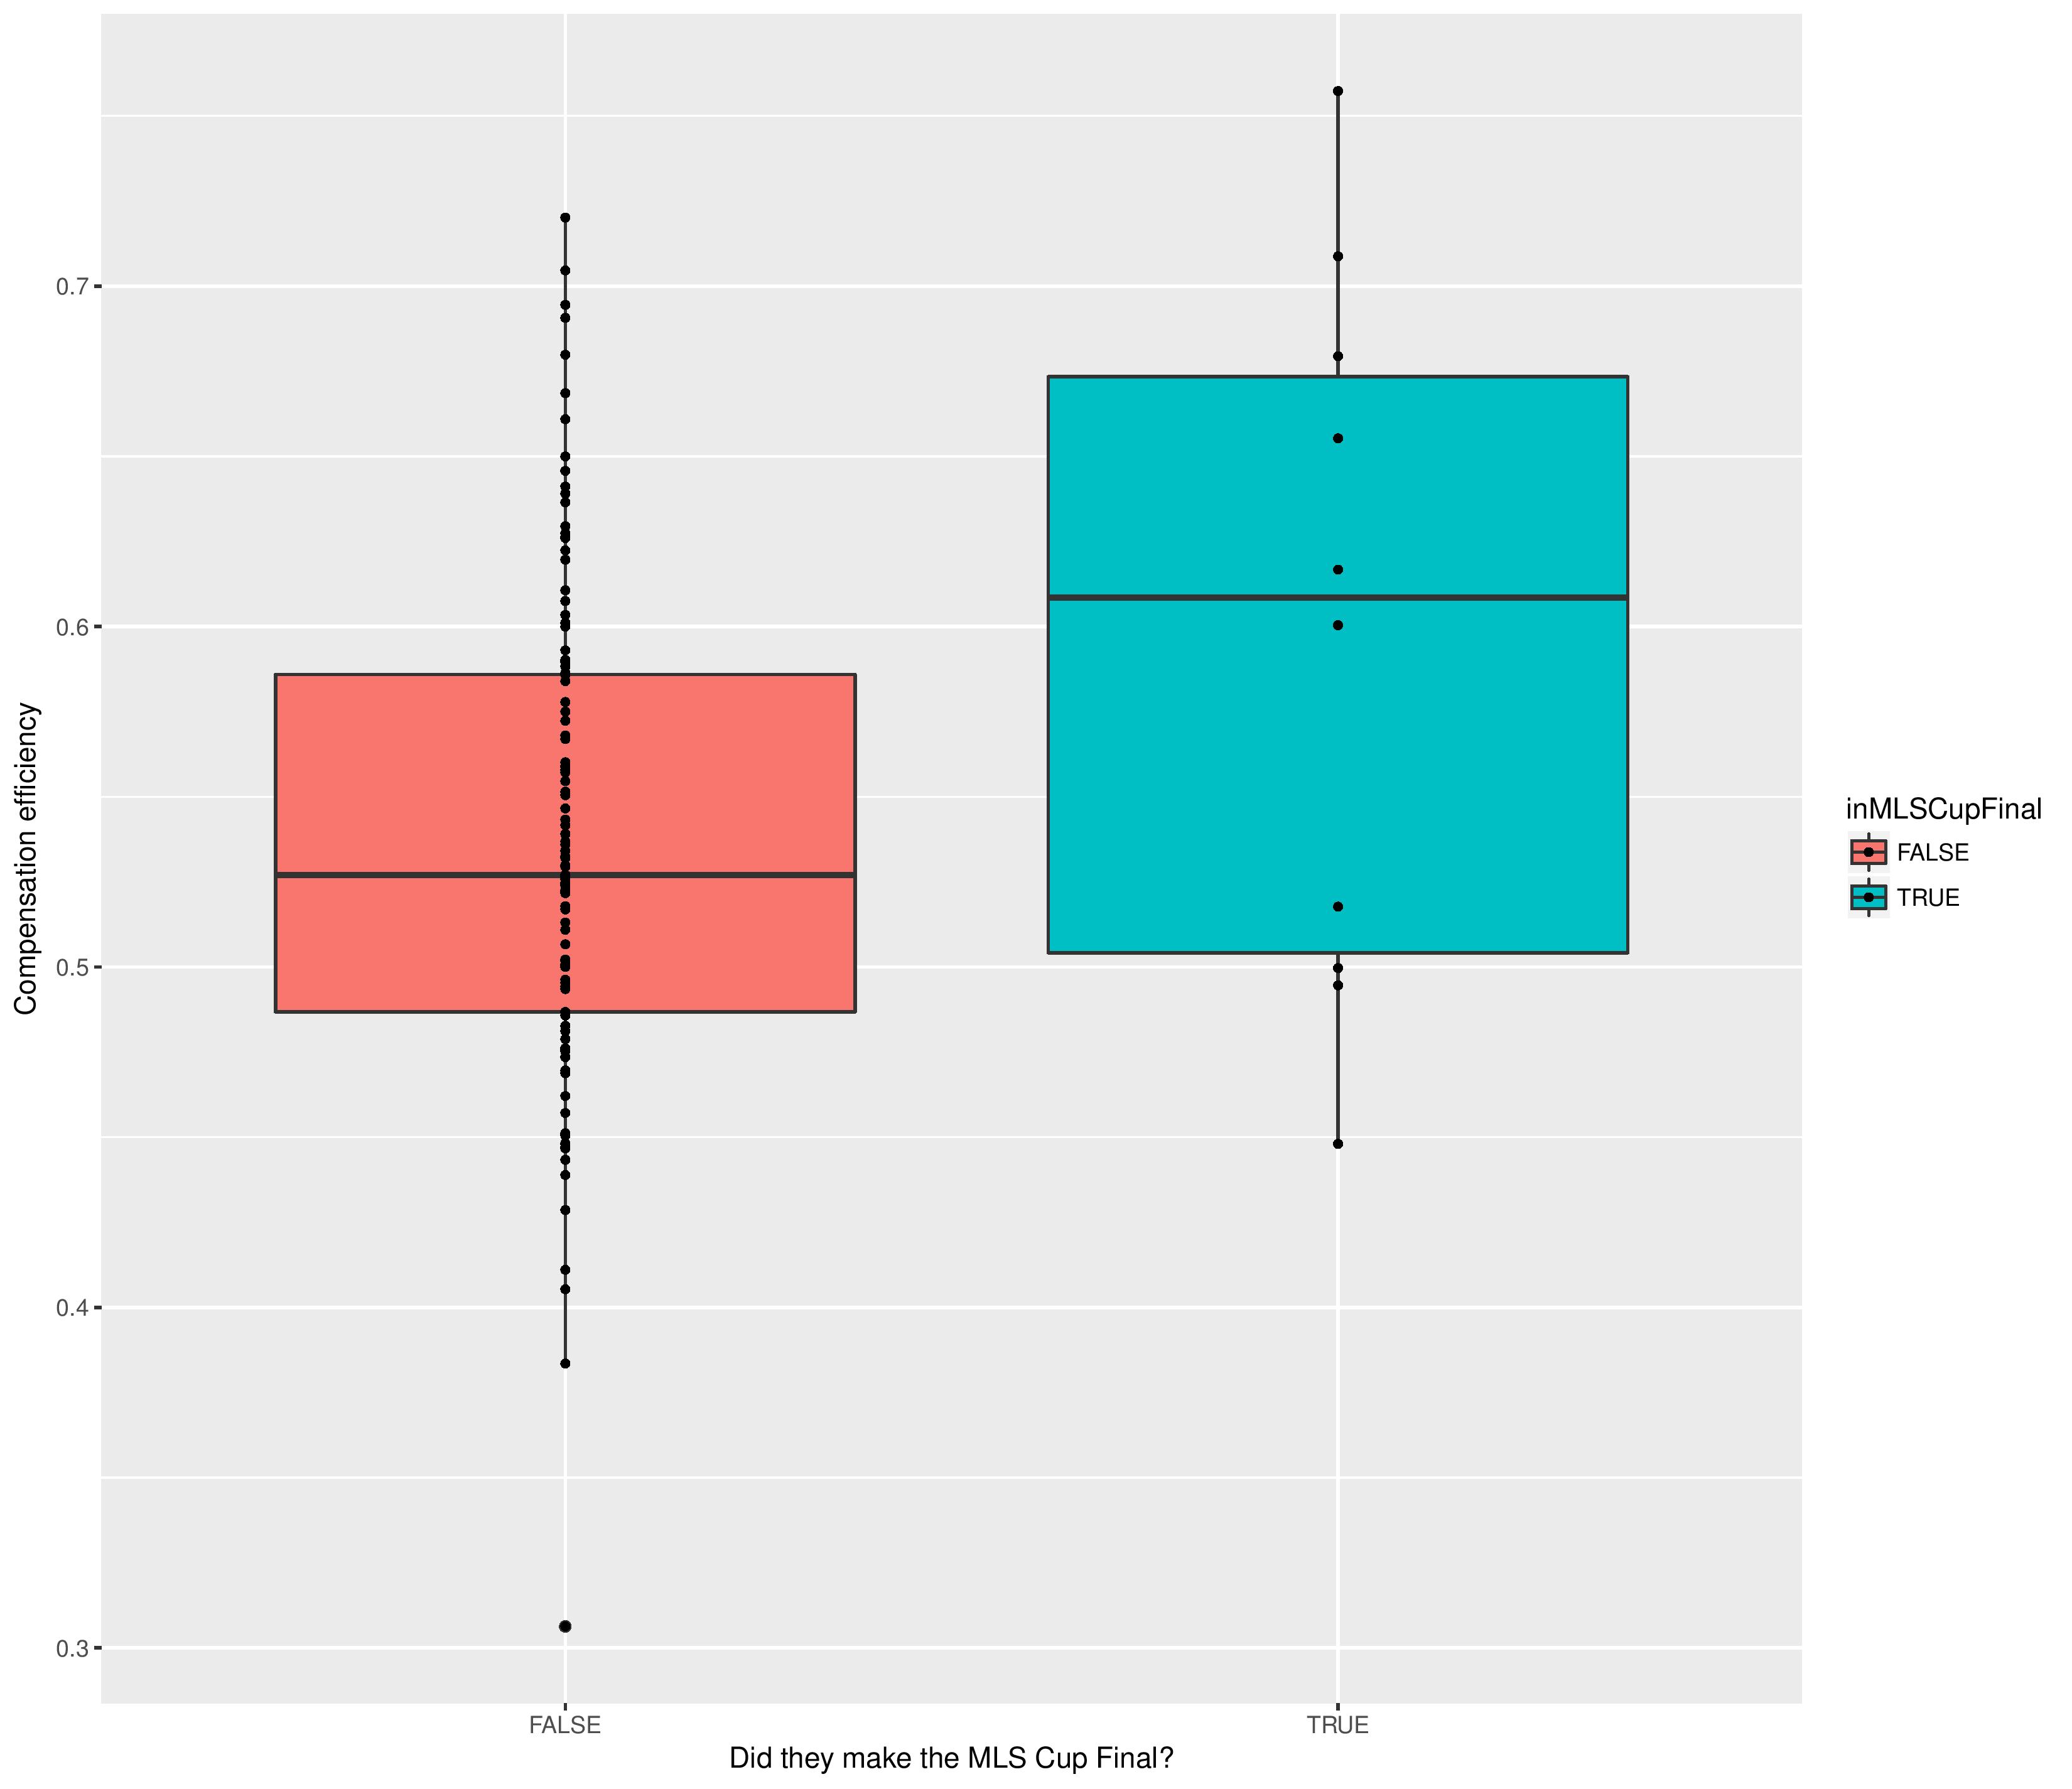
Efficiency is hugely important to make the MLS Cup final. Clubs that can’t put their expensive players on the field appear to struggle to make it into the championship.
US Open Cup Final
As with the MLS Cup, to get more data points, we are including both clubs who make the final, as opposed to just the winner.
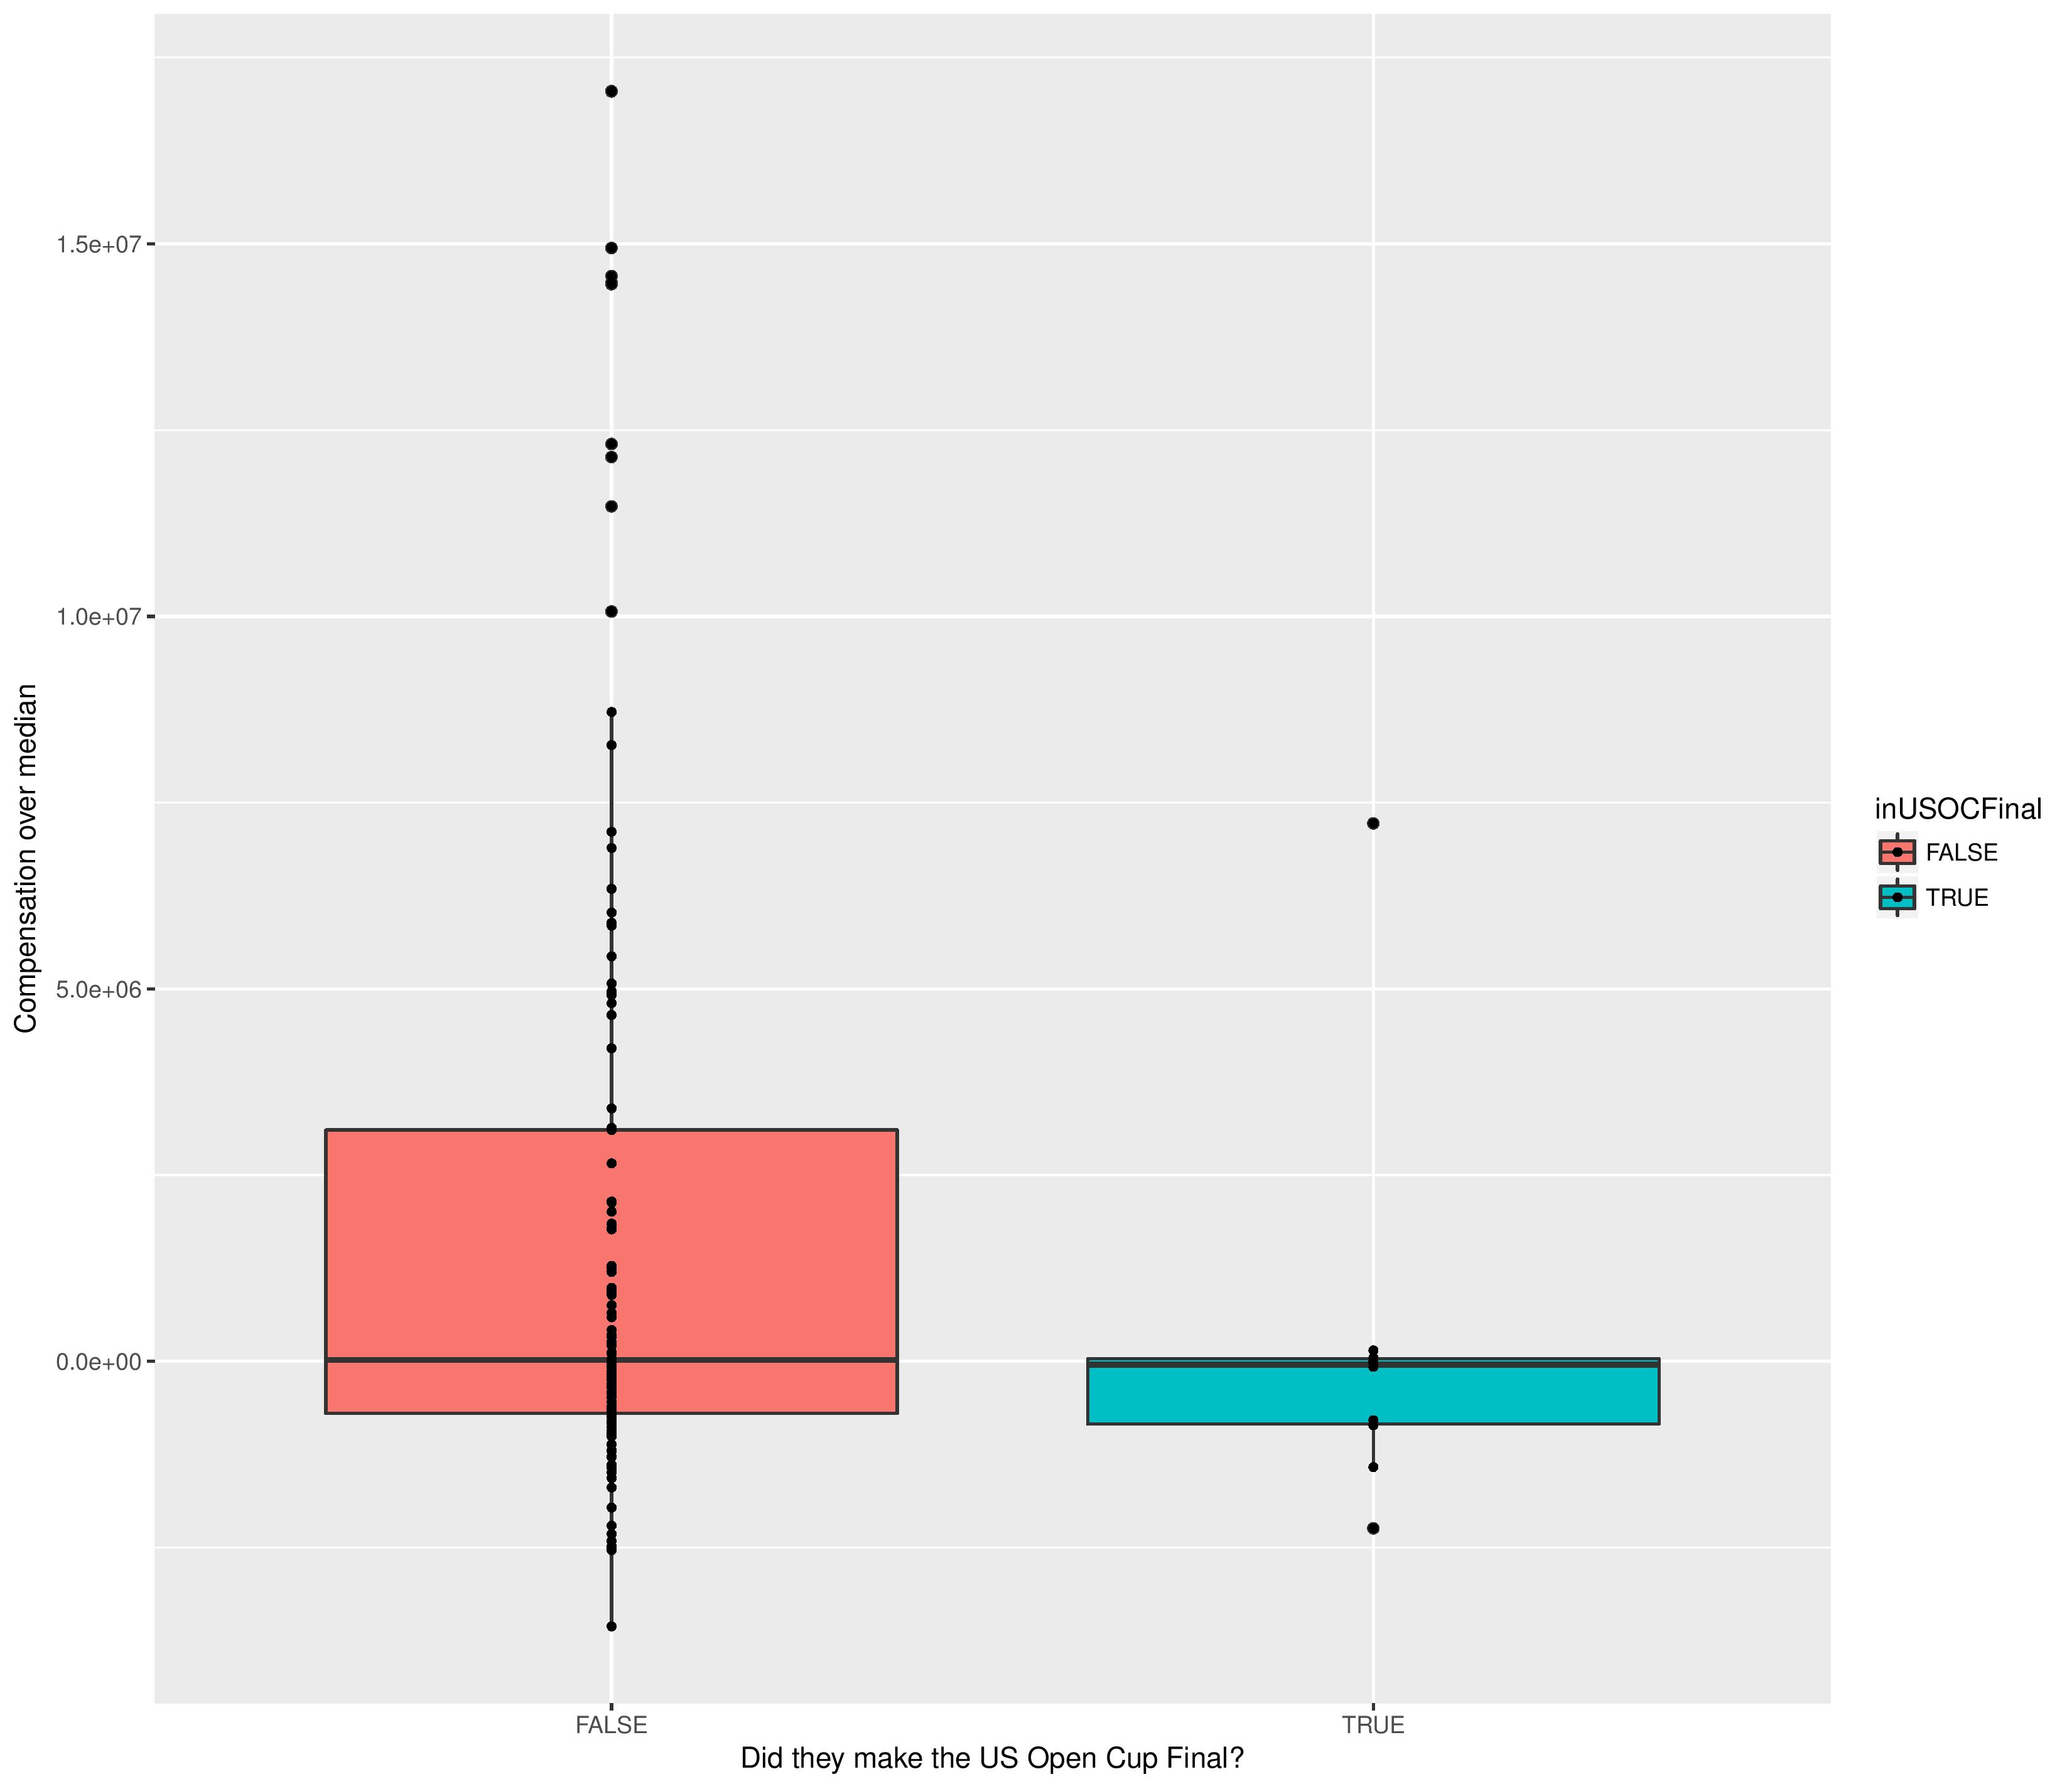
Yikes. It is evidently more beneficial to NOT spend money if attempting to win the US Open Cup. Nine out of ten finalists in the US Open Cup over the past five years spent no more than the league-median on their roster.
Beyond the initial surprise factor, this makes some sense to me for the following reasons:
- The US Open Cup has a lot of randomness in it (home/away, opponent draws with minor leagues, single-elimination, PK’s, etc.), so advantages granted by spending money are minimized when the luck takes a larger share of the outcome.
- Teams must put at least 13 Americans (or green-card-holders, etc.) on their 18-game-day-roster, which can limit the amount of expensive, foreign players who can participate.
- Big-money-clubs are more likely to be ahead in the MLS table and therefore treat the USOC as a mid-week nuisance, whereas small-money-clubs are more likely to be behind in MLS and therefore treat the USOC as their primary objective.
Conclusion
So does money matter? Yeah.
Does picking the right players to spend money on? Most certainly.
Does money tell us who will win a match? Not at all. Among other things, home field advantage is way more predictive.
Can low-budget teams compete? …. yes…but it’s harder.
Yes, a team can always compete. A mid-table position, if that’s what you’re competing for, is not at all hard to accomplish for a low-budget team running well. Luck is also part of the game, and the playoffs system contributes lots of luck by allowing more than half of teams to compete within it. Additionally, smart moves are obviously major impacts. New York Red Bulls, as much as I hate to admit it, have had some success both when spending $1.5M below the league median and when spending $7M over the league median, which indicates smart moves or mediocre moves depending on which situation they were in.
Still, a big budget can (sometimes) provide cover for poor moves and bad luck. Avoiding dumb moves with a big budget is much easier than finding smart deals with a small budget, particularly when everyone in the world is looking for those market inefficiencies.
The data doesn’t guarantee results, one way or the other, for big or small budget clubs. Nonetheless, it certainly looks like small-budget-clubs like Philadelphia are primarily likely to be competing for the US Open Cup and the last couple of playoff slots in MLS…. which is exactly what Philadelphia has been doing for their entire existence.
Over the past 5.5 years, three lower-budget teams have managed to (relatively) consistently over-perform their budget. Those would be FC Dallas, Sporting Kansas City, and New England Revolution. I won’t get too technical, but I built a model to predict success based upon spending and efficiency, and averaged the points earned vs. points expected for all clubs. For those with low budgets, I had:
- FC Dallas: 1.58 pts-per-game vs. 1.31 expected (good times were 2014+)
- New England: 1.46 pts-per-game vs. 1.32 expected (good times were 2013-2015 and 2018)
- SKC: 1.51 pts-per-game vs. 1.38 expected (good times were 2013-2015 and 2017+)
While FC Dallas and Sporting Kansas City have well-regarded academy systems I’ve heard about, I’ve not heard much about New England’s, so there may be lessons there on quality signings.
I’m hopeful for the homegrown-investment strategy to pay off. It certainly provides better odds of becoming a contender than trying to outsmart the transfer market for the bulk of your starters. I just wish, with the growing spending inequality around the league, that Philadelphia, as the fourth largest sports market in America, didn’t have to rely upon such gambles and luck to make a serious push.
Unused Player Compensation
This section has less to with the analysis topic, and more to do with providing data I assume others will be interested in.
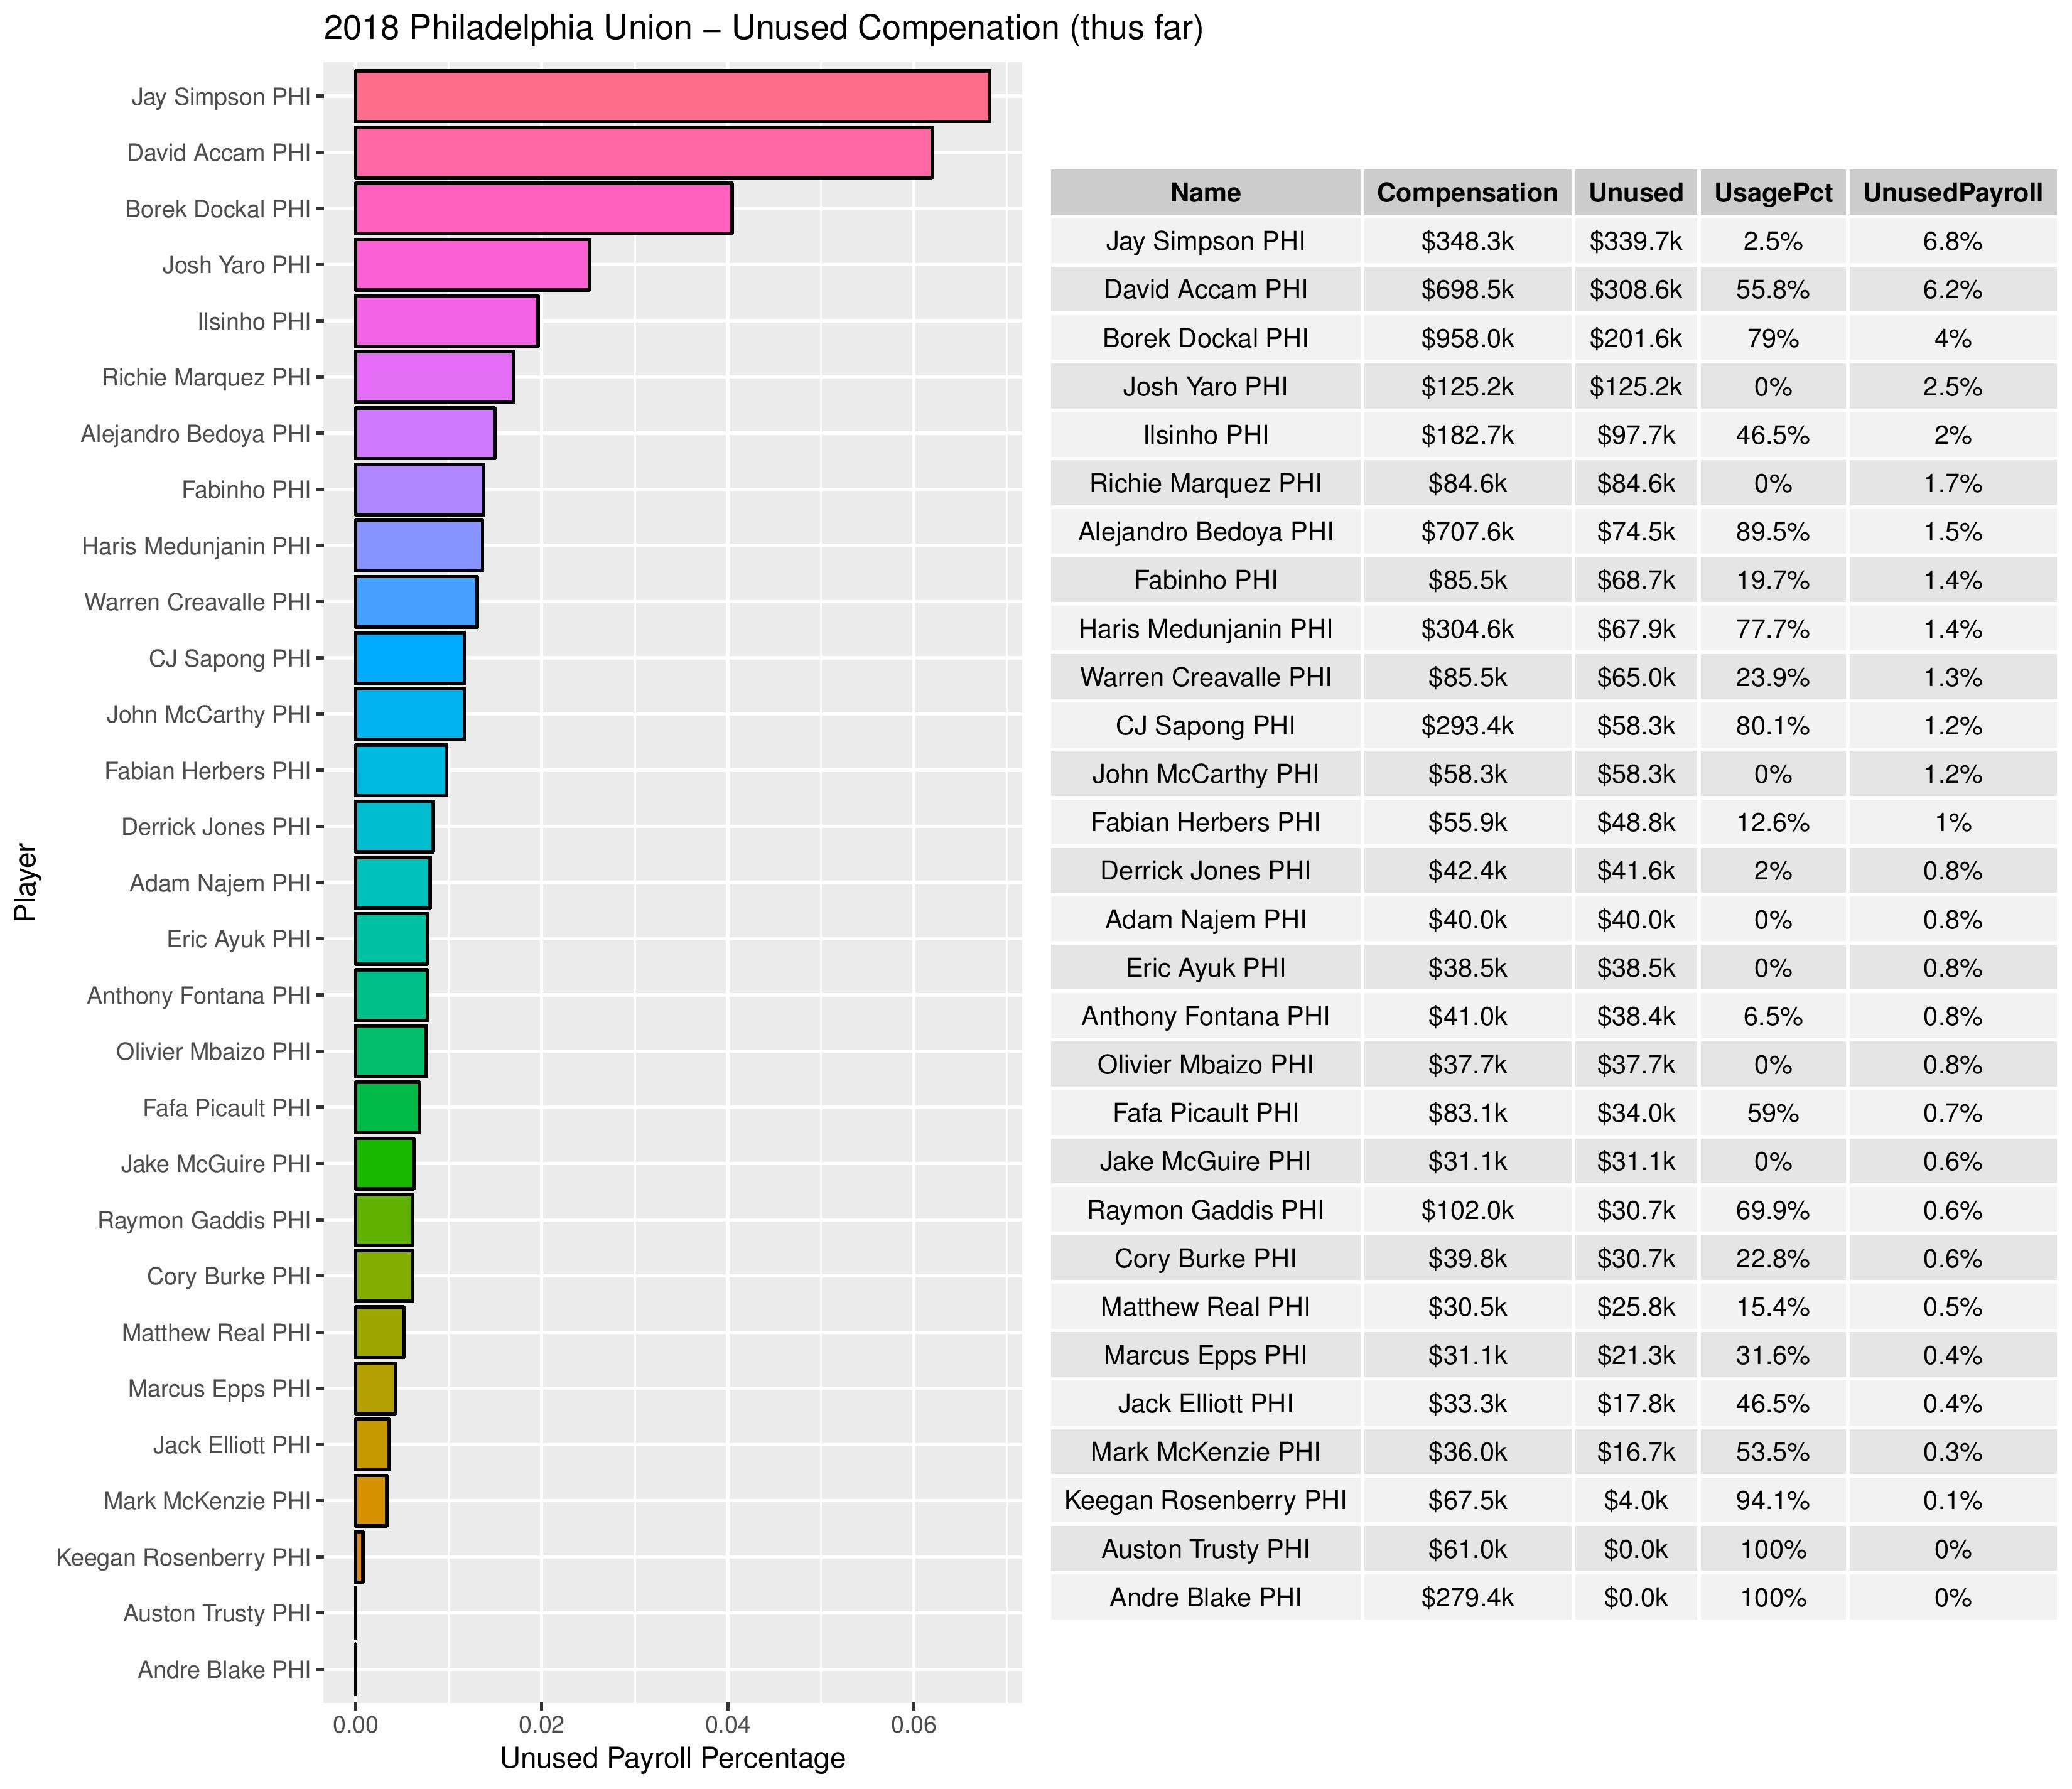
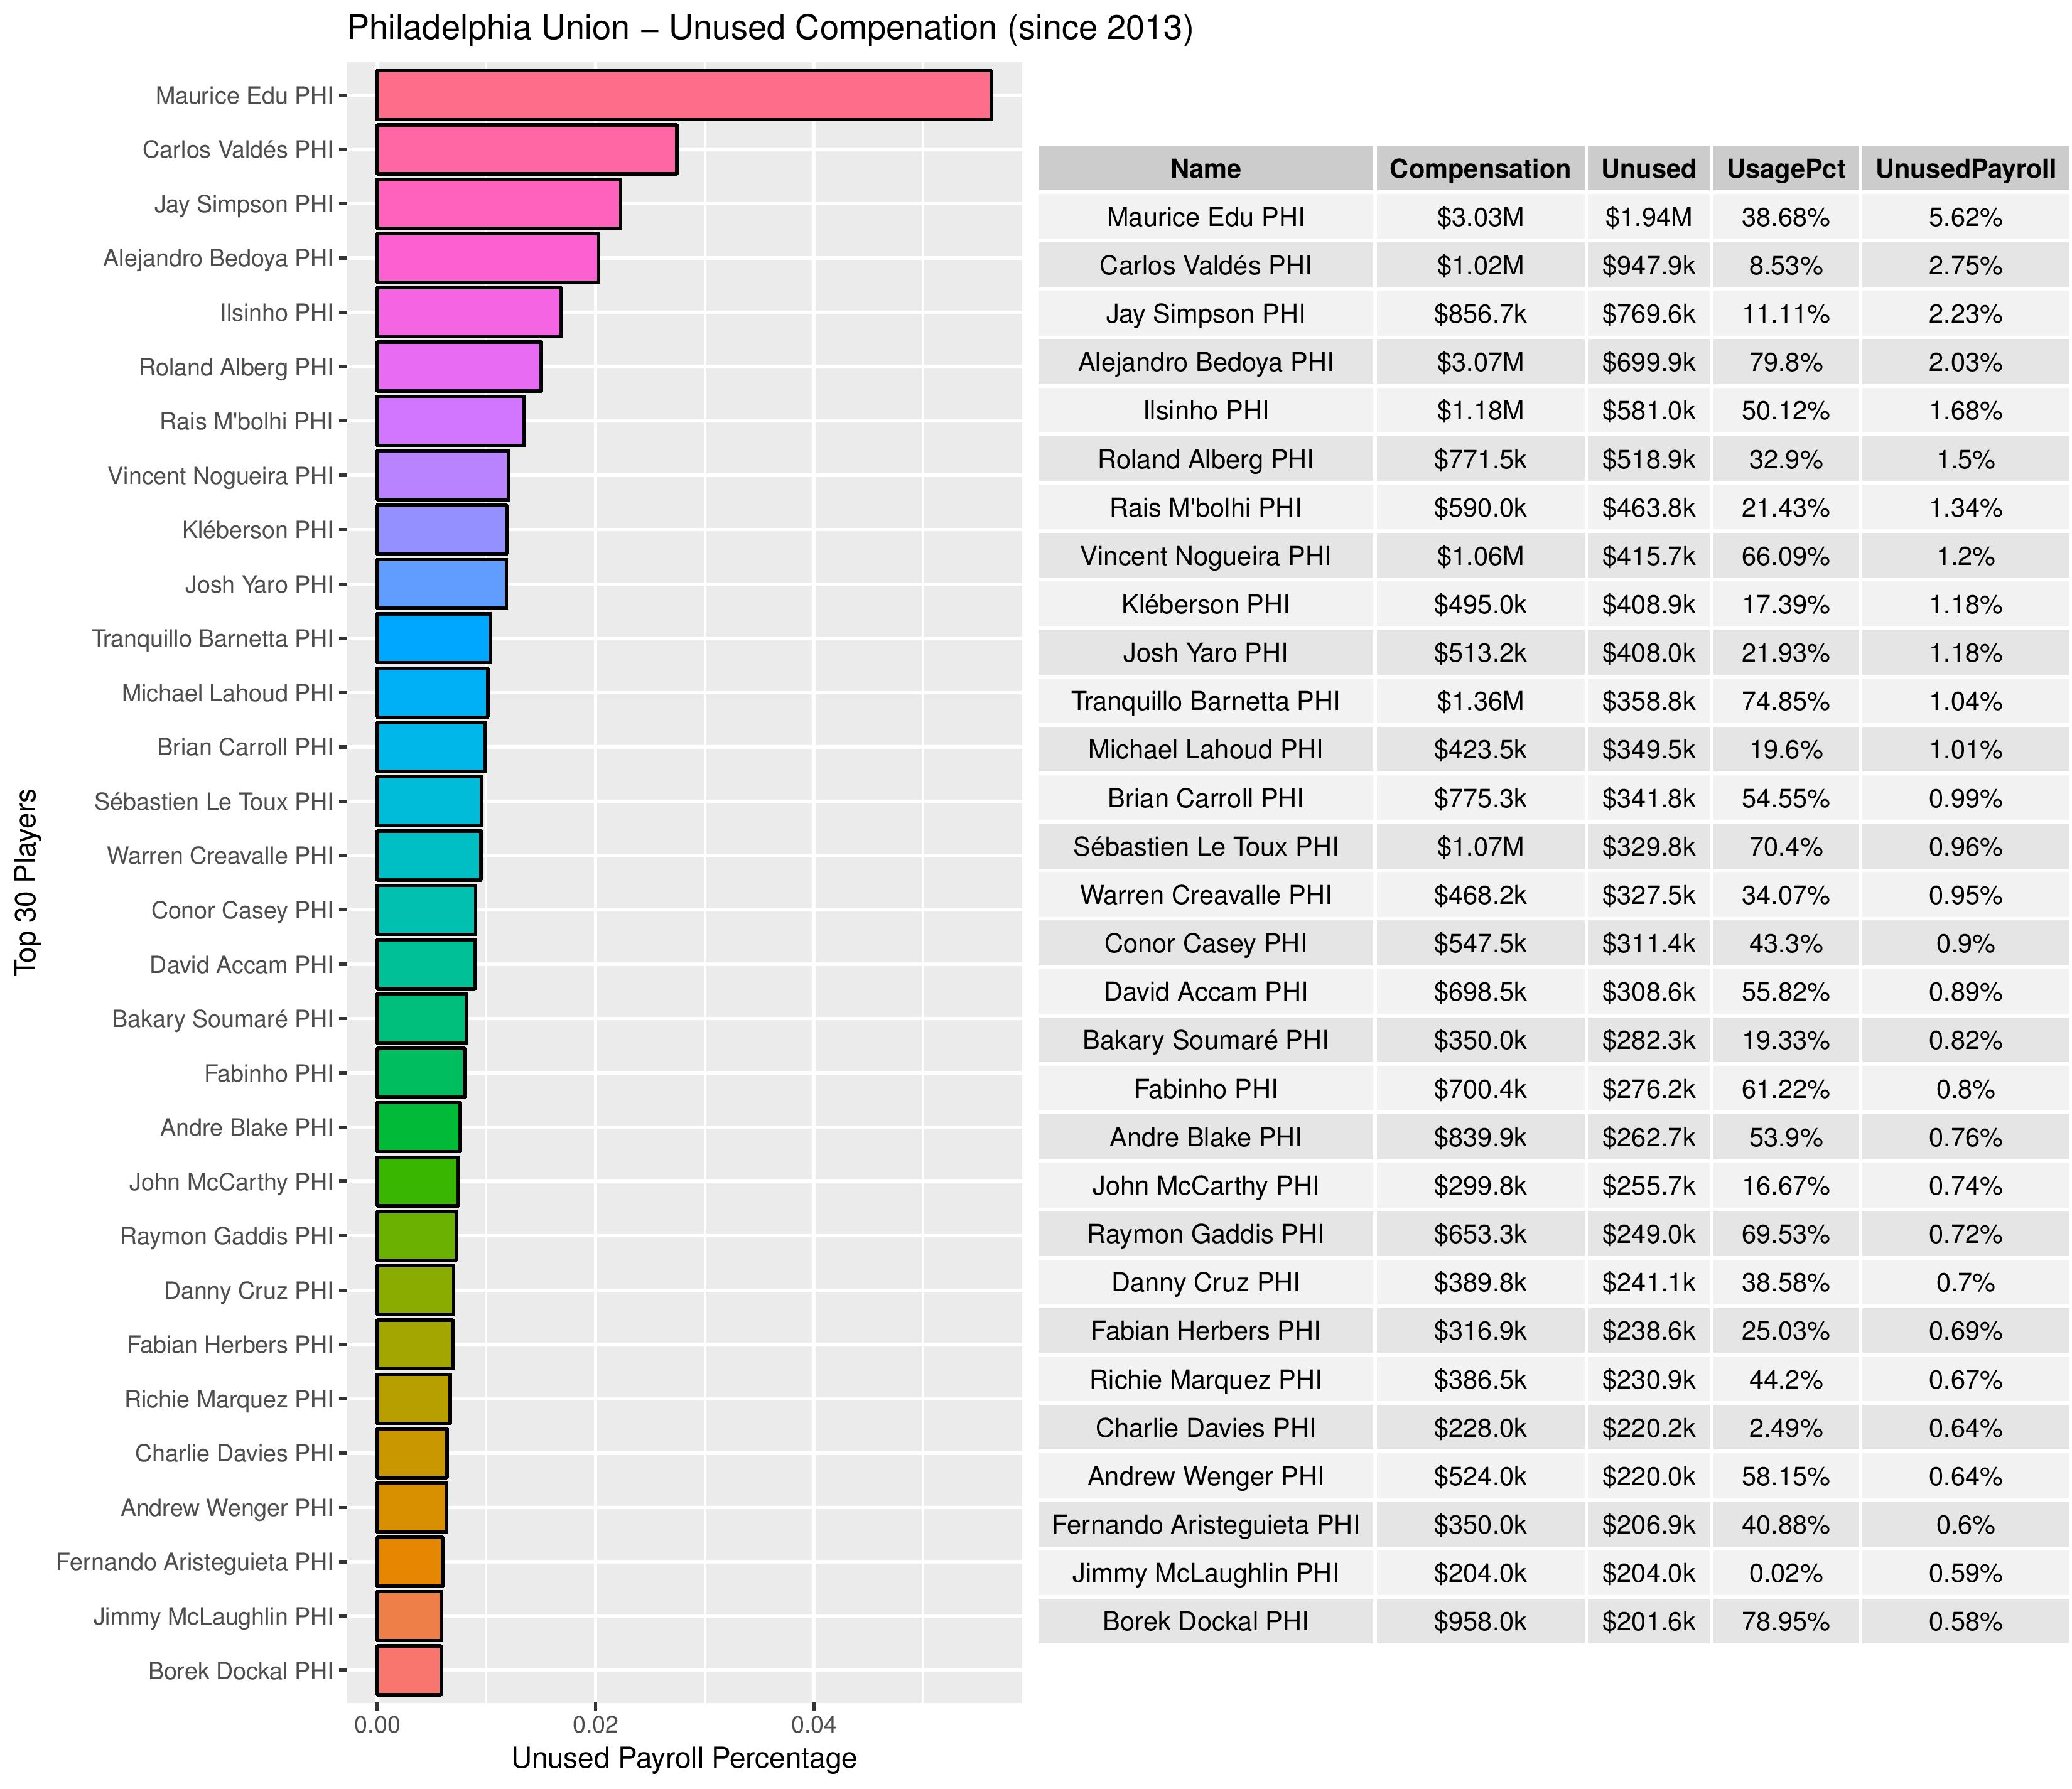
This next chart shows the inefficiency of each player for the 2018 Union. The numbers listed are pro-rated through 7/1/2018 based upon a team’s completed matches vs. their 34-game-schedule.
- Compensation is their overall earnings thus far
- Unused is the amount of that compensation not utilized via minutes in games
- UsagePct is what percentage of the player’s potential minutes ended up with the player actually on the field.
- UnusedPayroll is what percentage of the team’s payroll (a proxy for budget) the player’s unused compensation absorbs.
- These are sorted in descending order based upon the UnusedPayroll percentage.
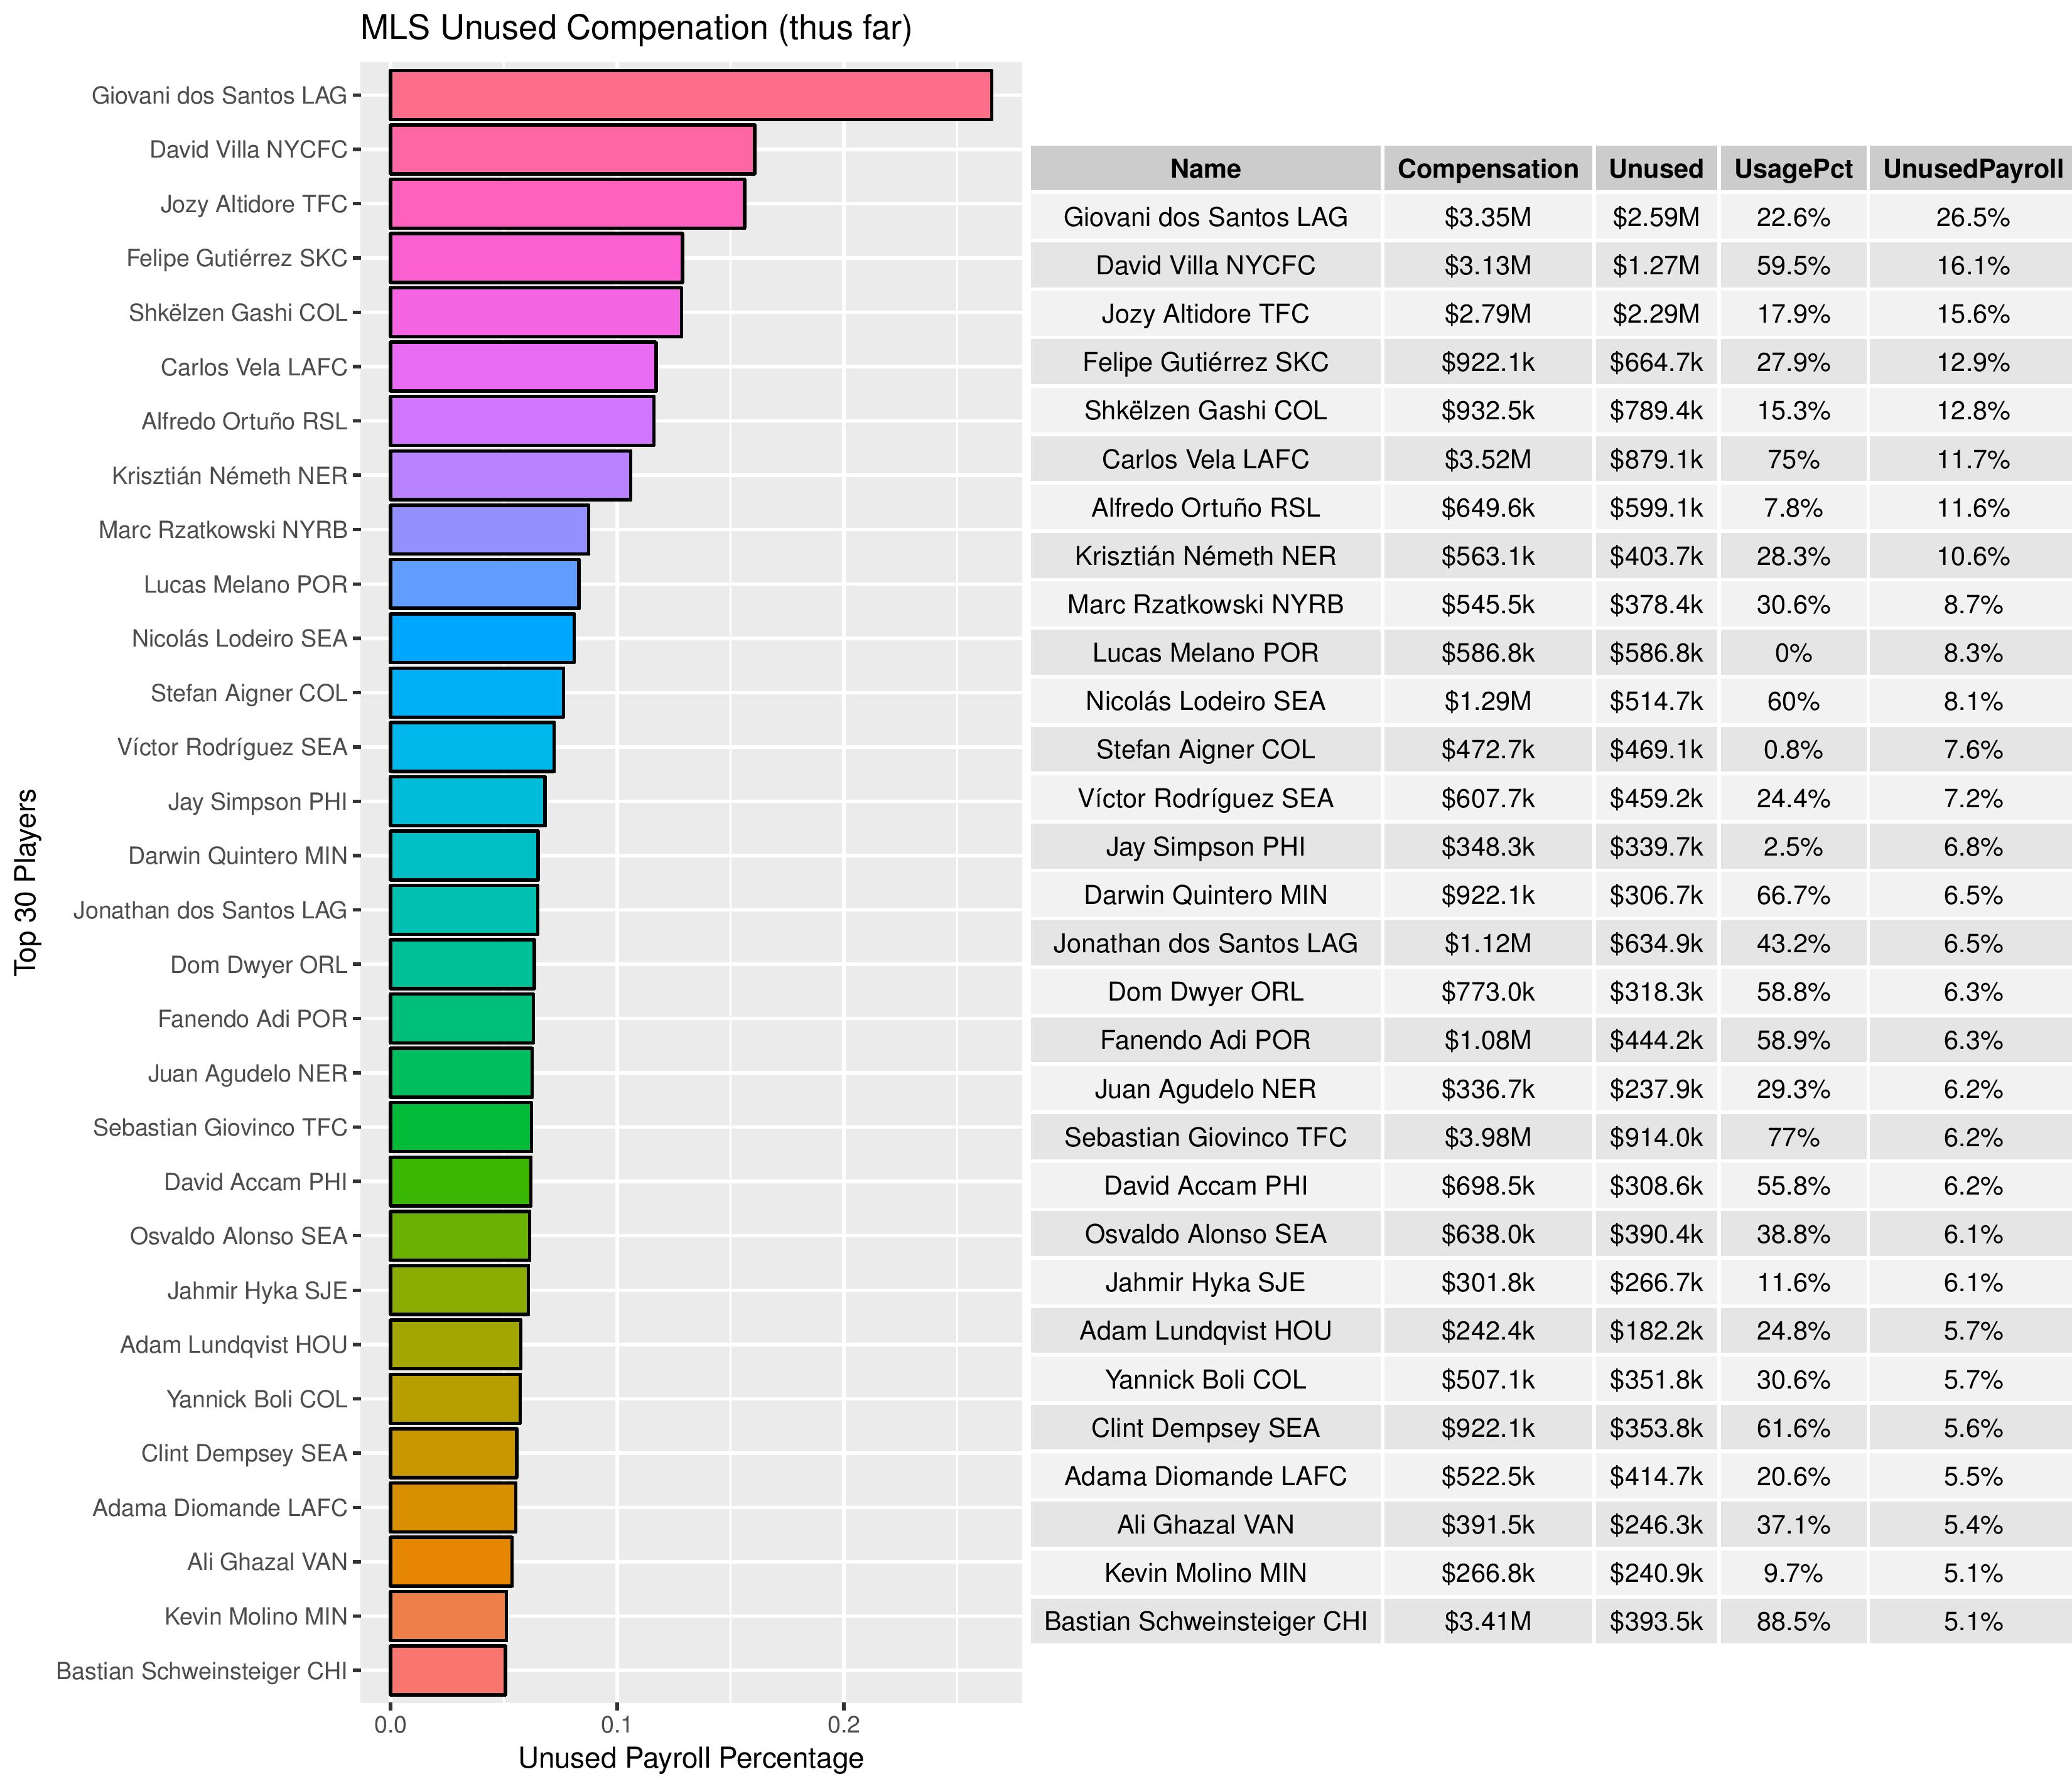
The next chart is the same as above, but for the “top” 30 players in all of MLS.
Jay Simpson ranks 14th in this list, with David Accam in 21st.
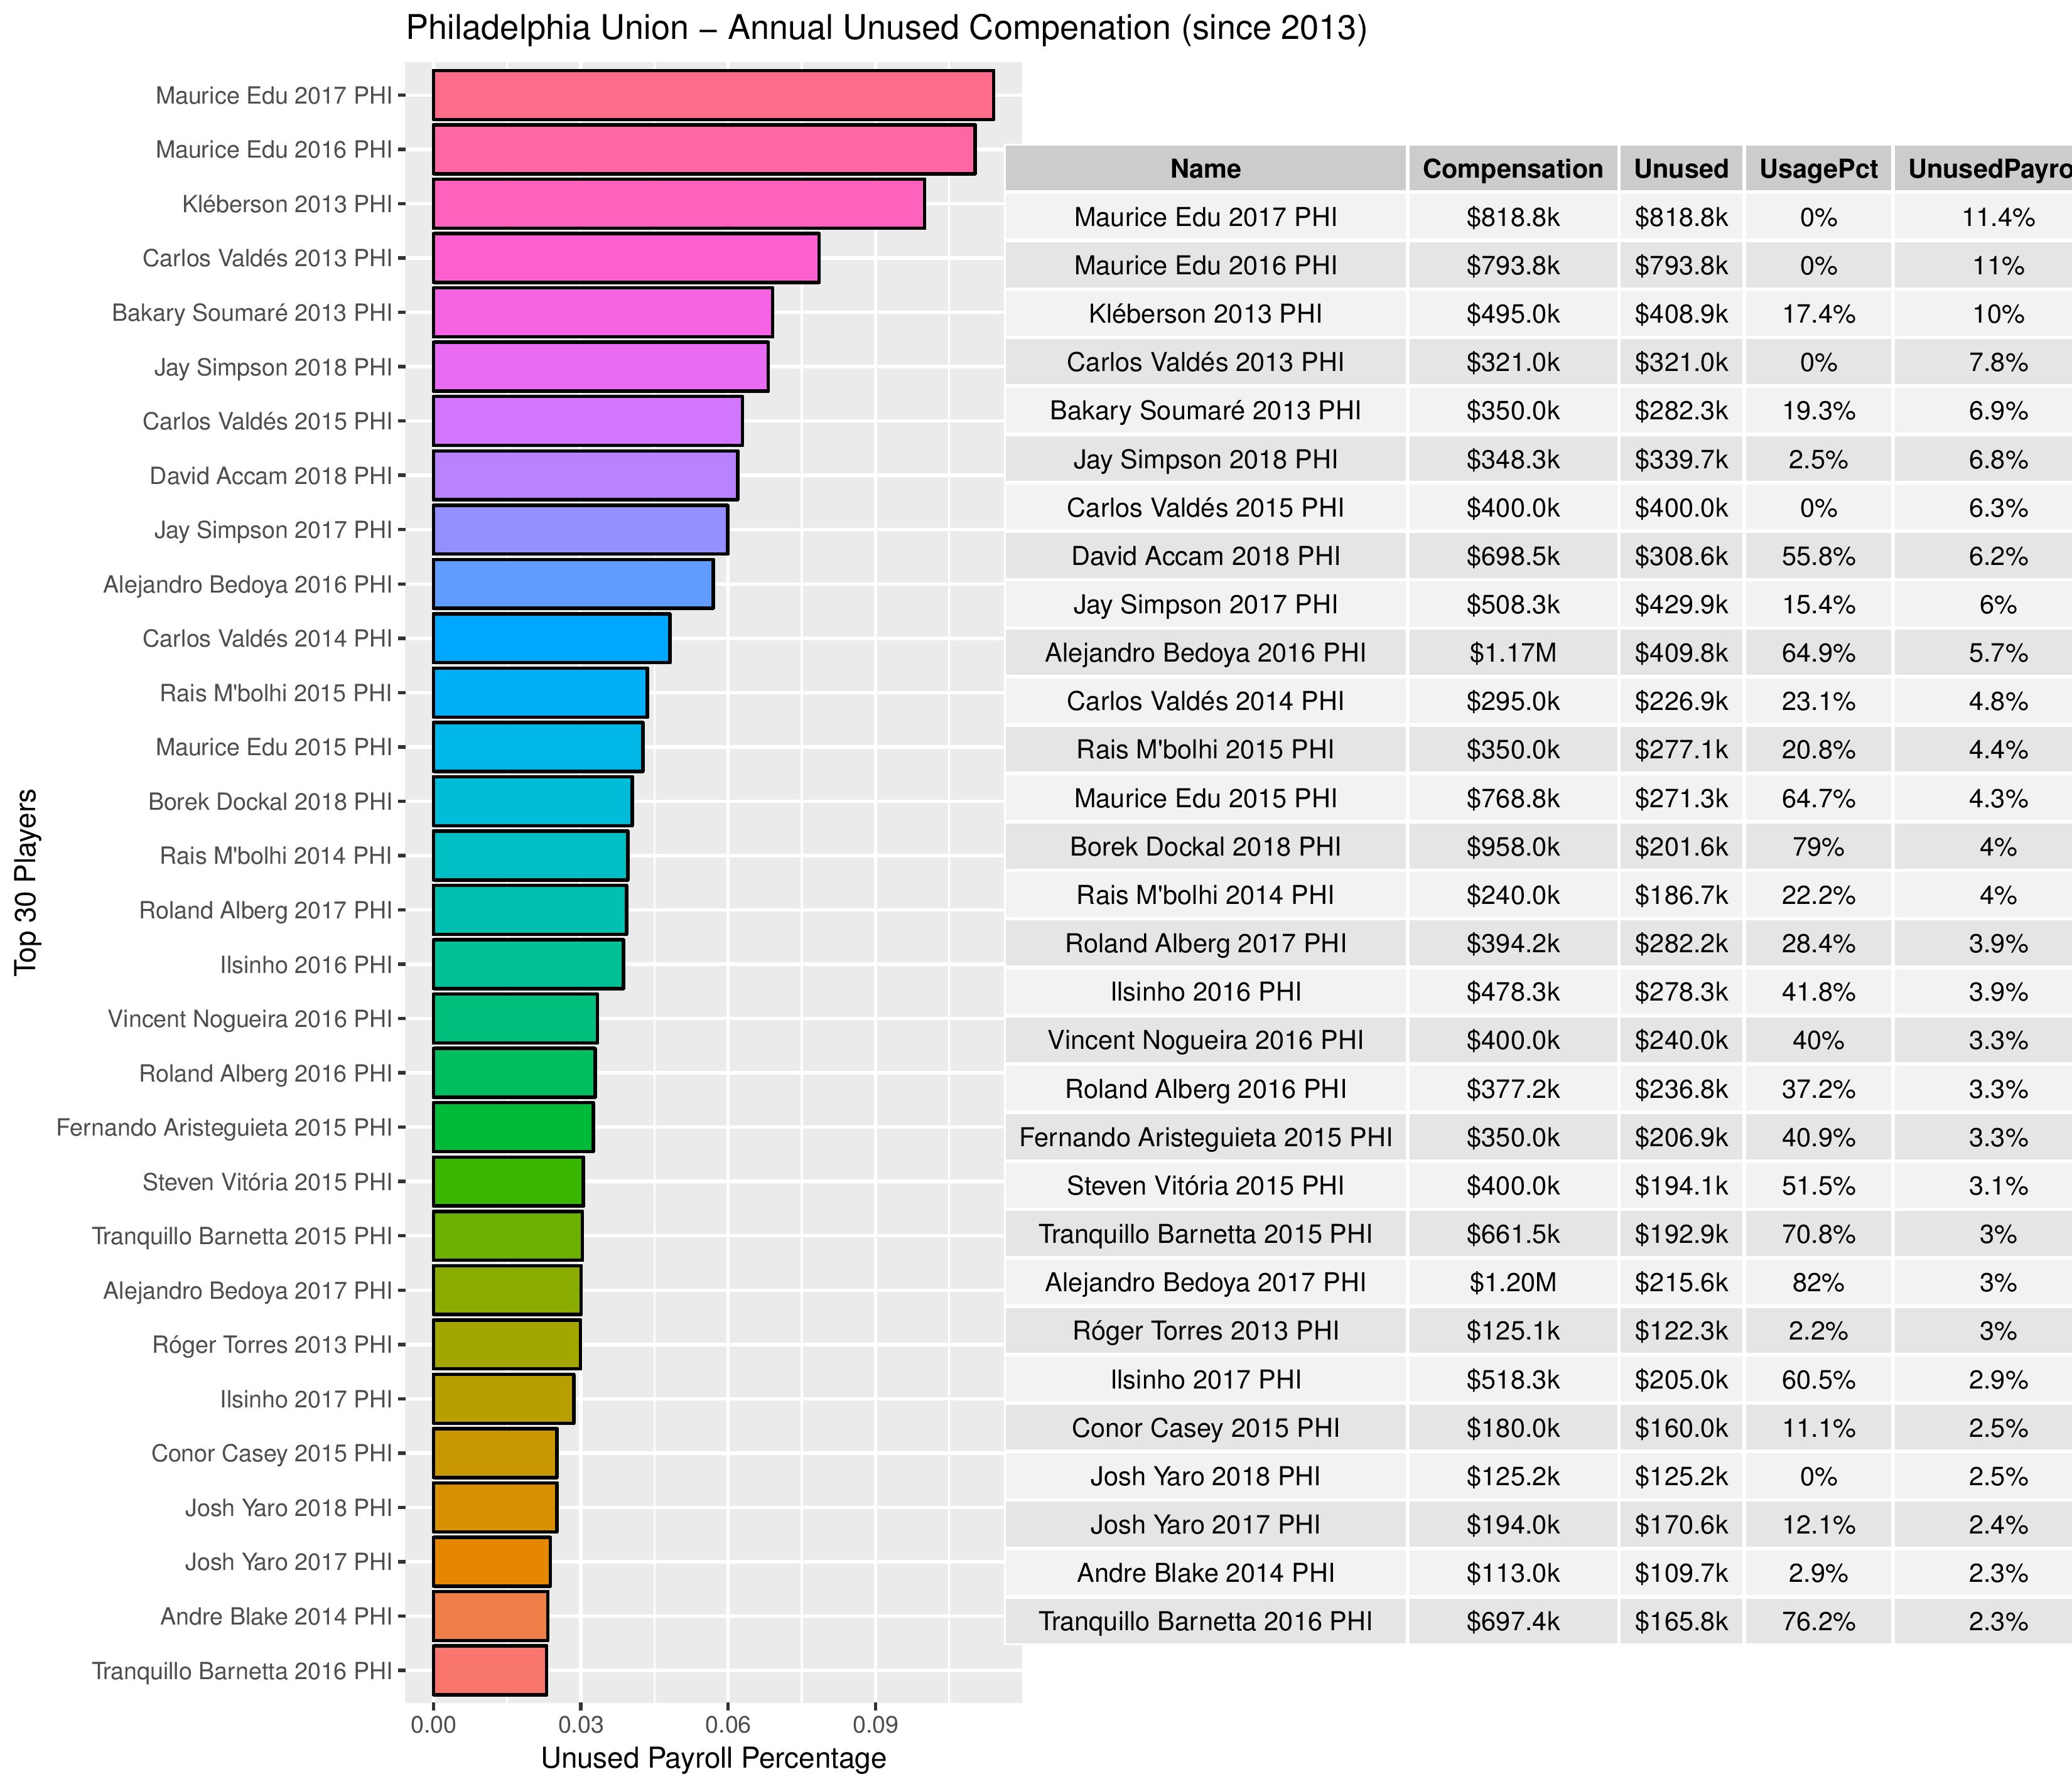
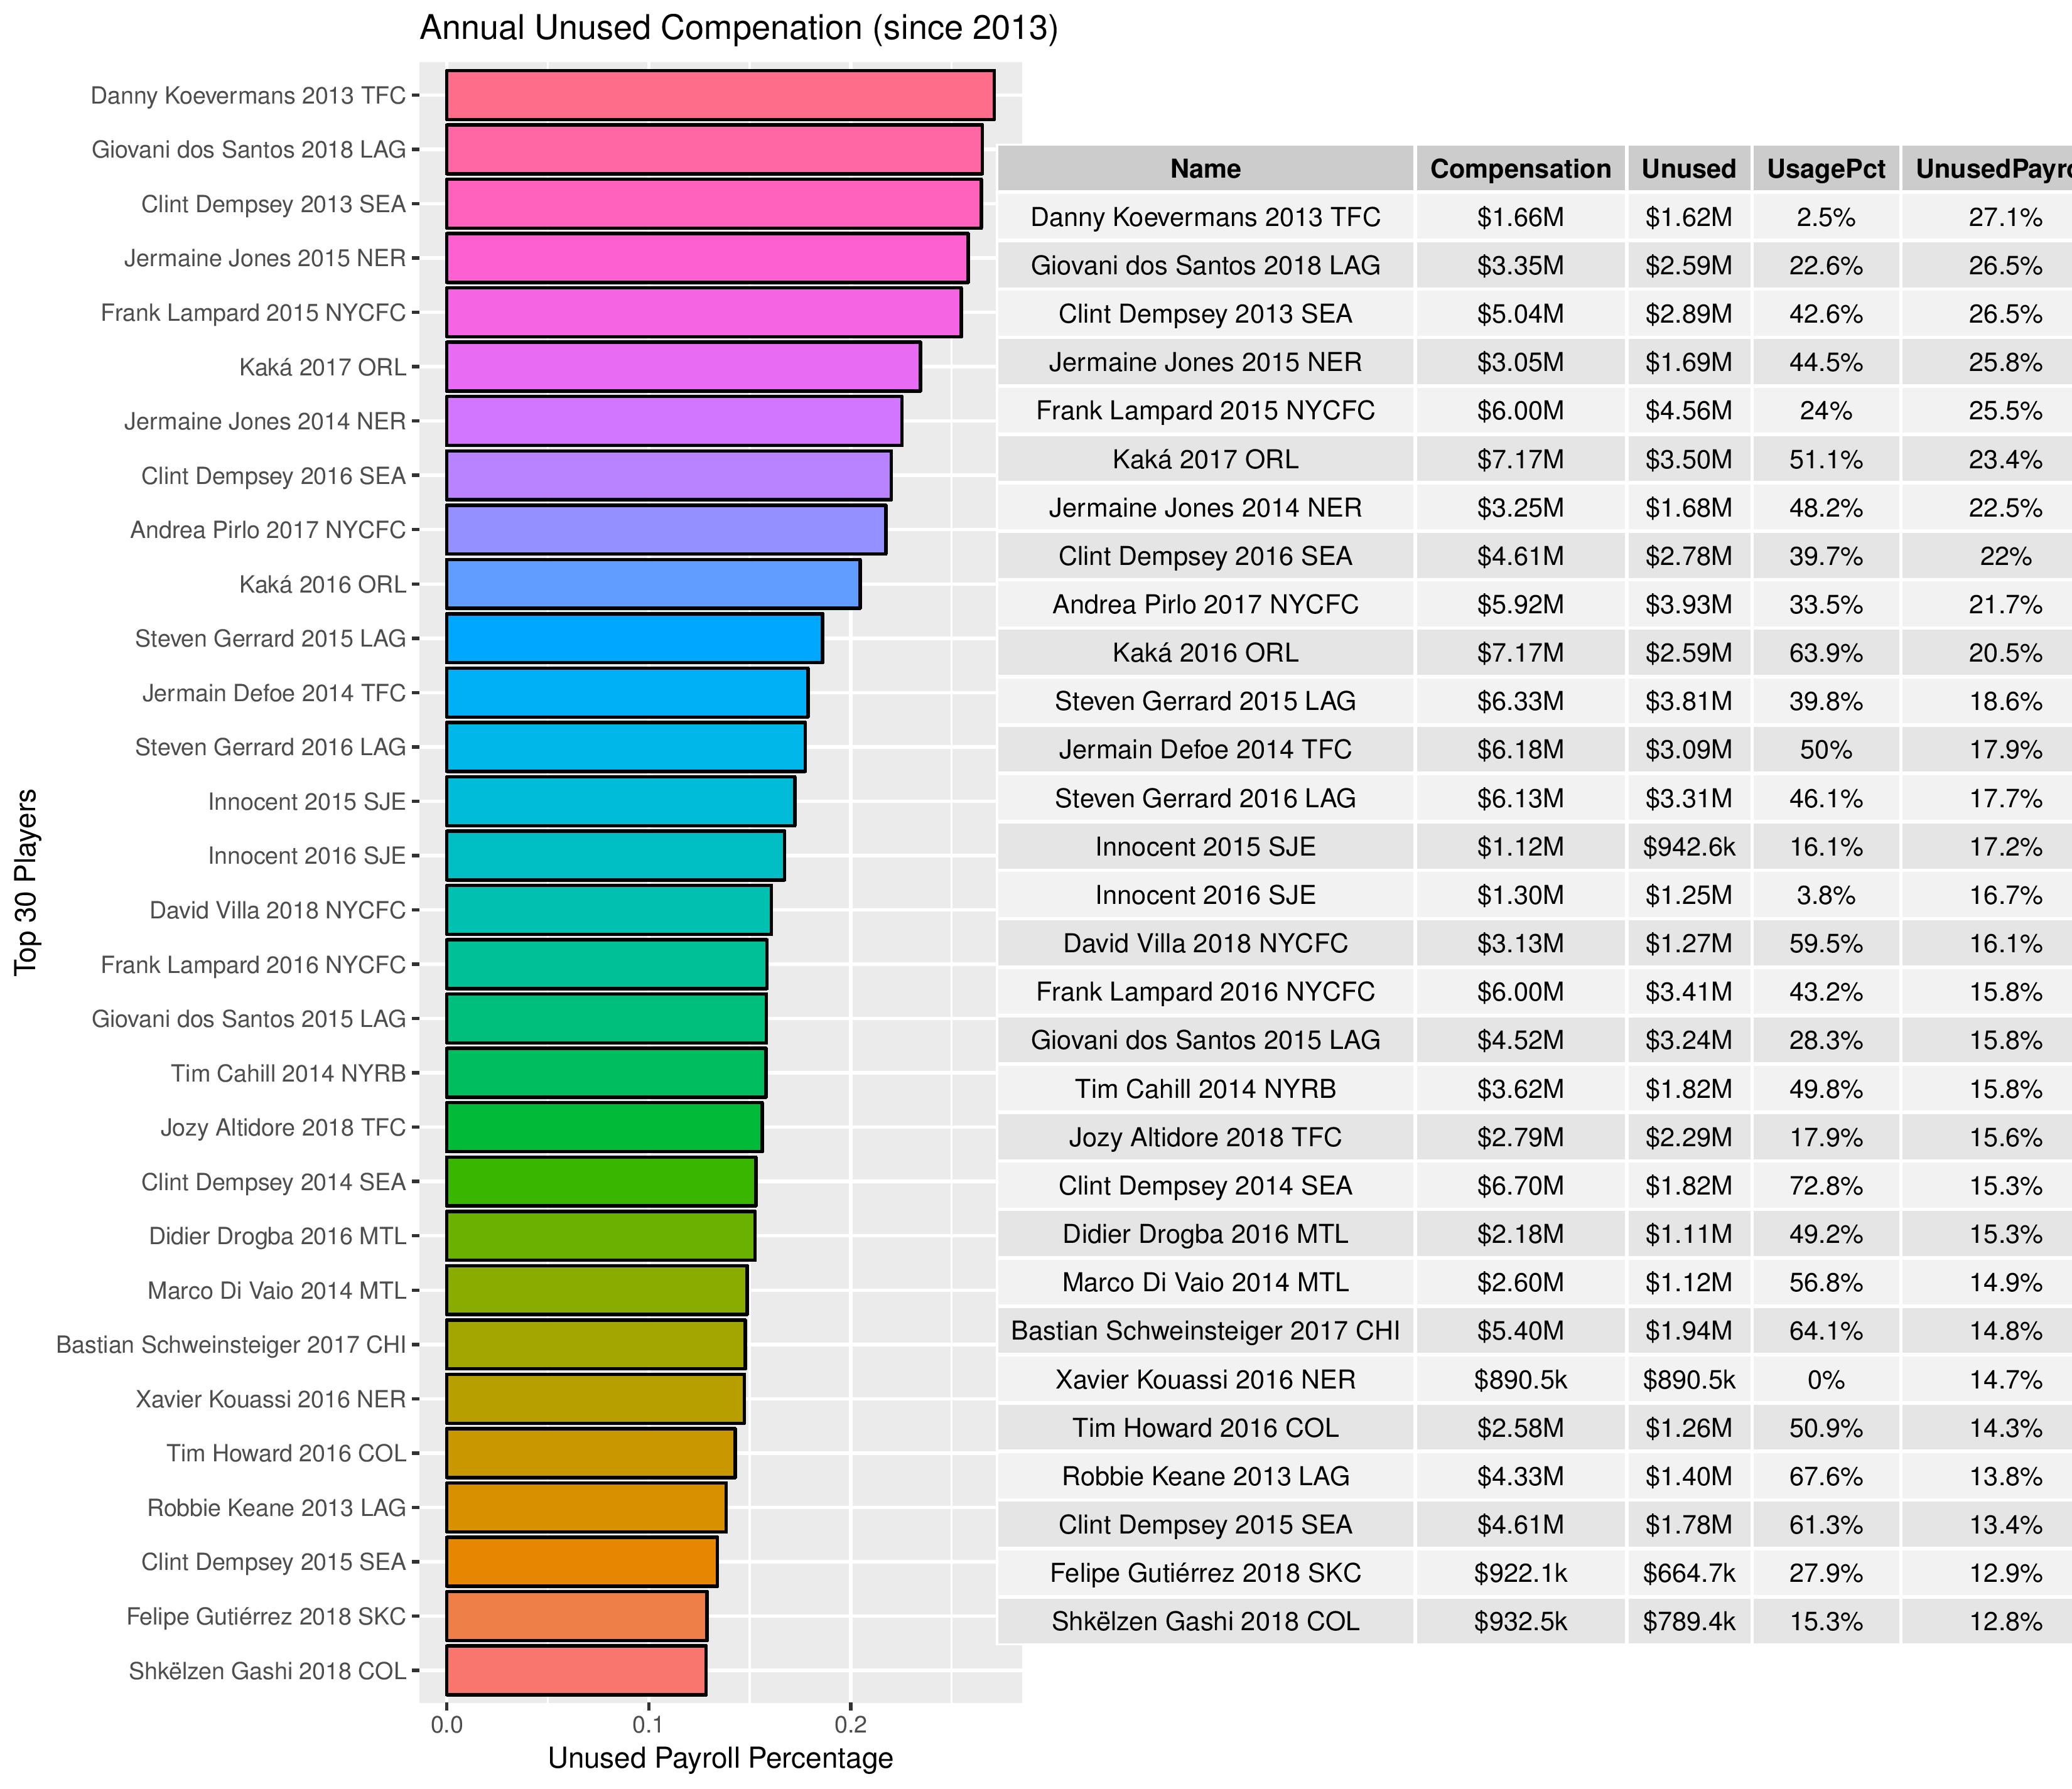
Going back further, these next two charts are the same as before, except that they are for each, individual year going back to 2013.
It shows only the “top” 30 players with regards to their unused payroll percentage (to their respective club & season).
The following shows the yearly version for all of MLS.
No Philadelphia players make this list.
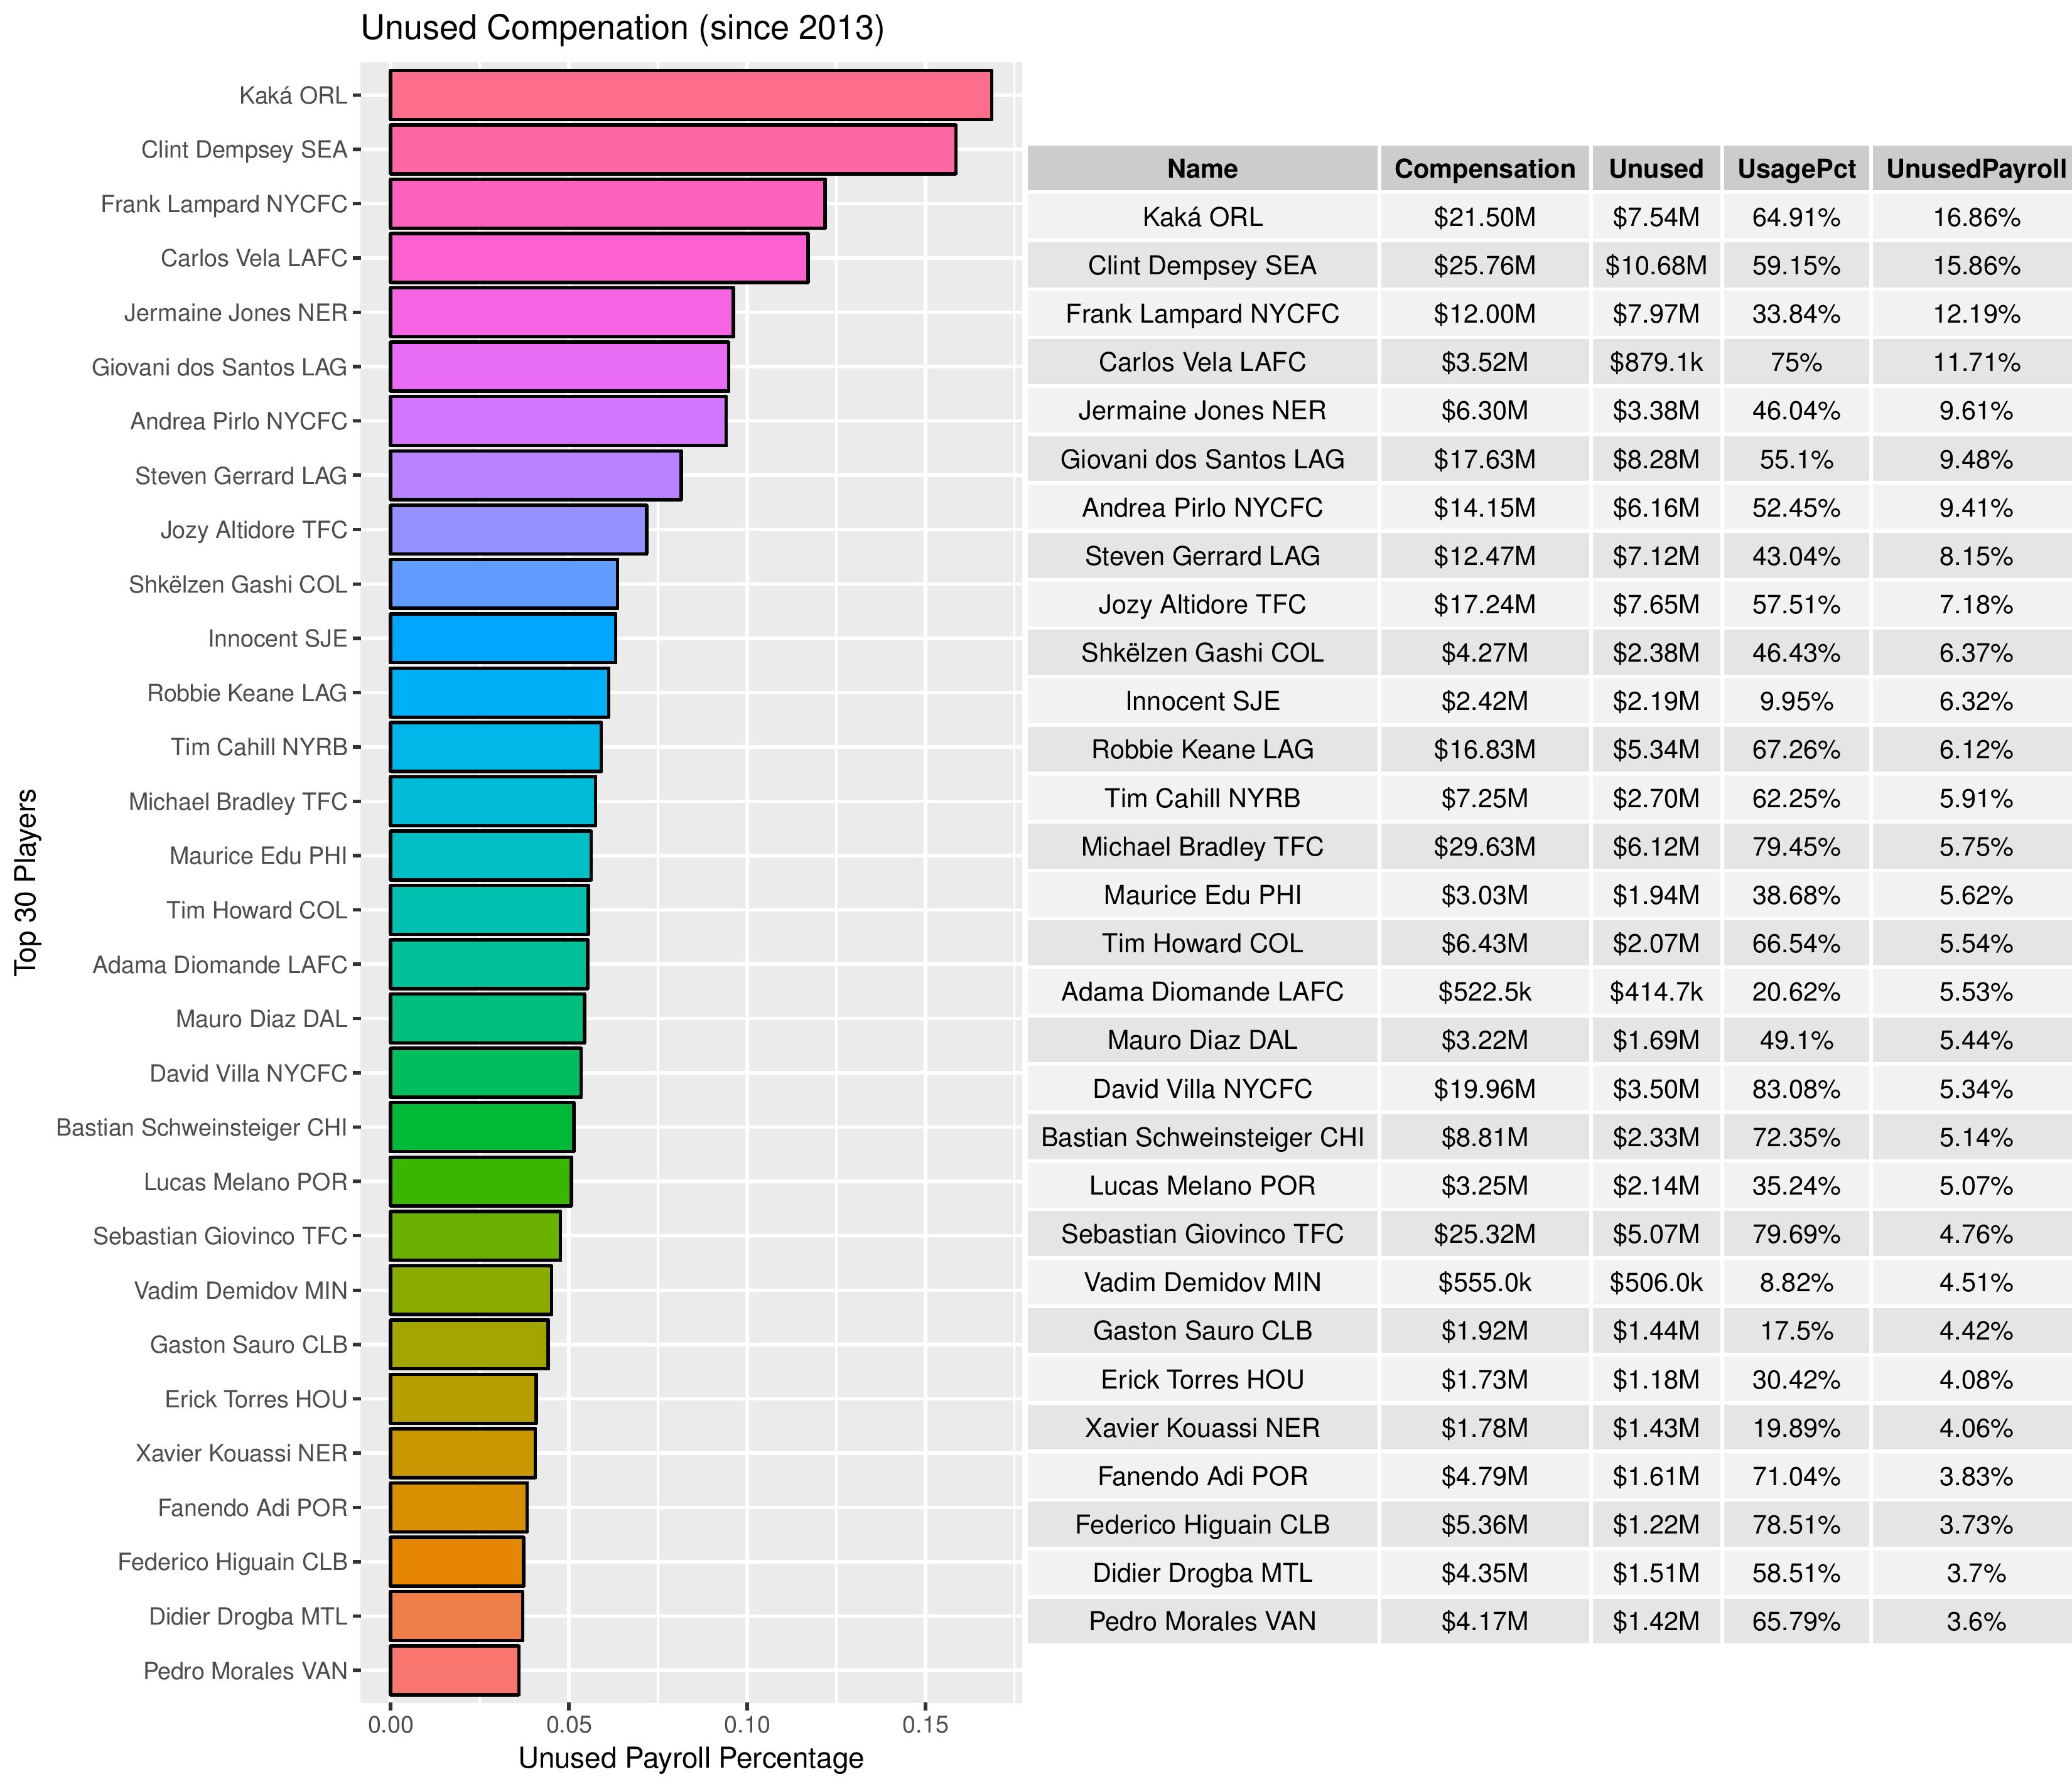
Finally, next 2 charts show the cumulative totals for each player/club combination since 2013, with regards to how many of their team’s cumulative budget was absorbed by the player’s under-utilized minutes.
Again, it shows the “top” 30 players only.
Next is for all of MLS.
Maurice Edu ranks 15th in this list.
Appendix
If you wanted to look at the “bottom” (most-efficient) 30 Philadelphia players annually with regards to the unused payroll percent.
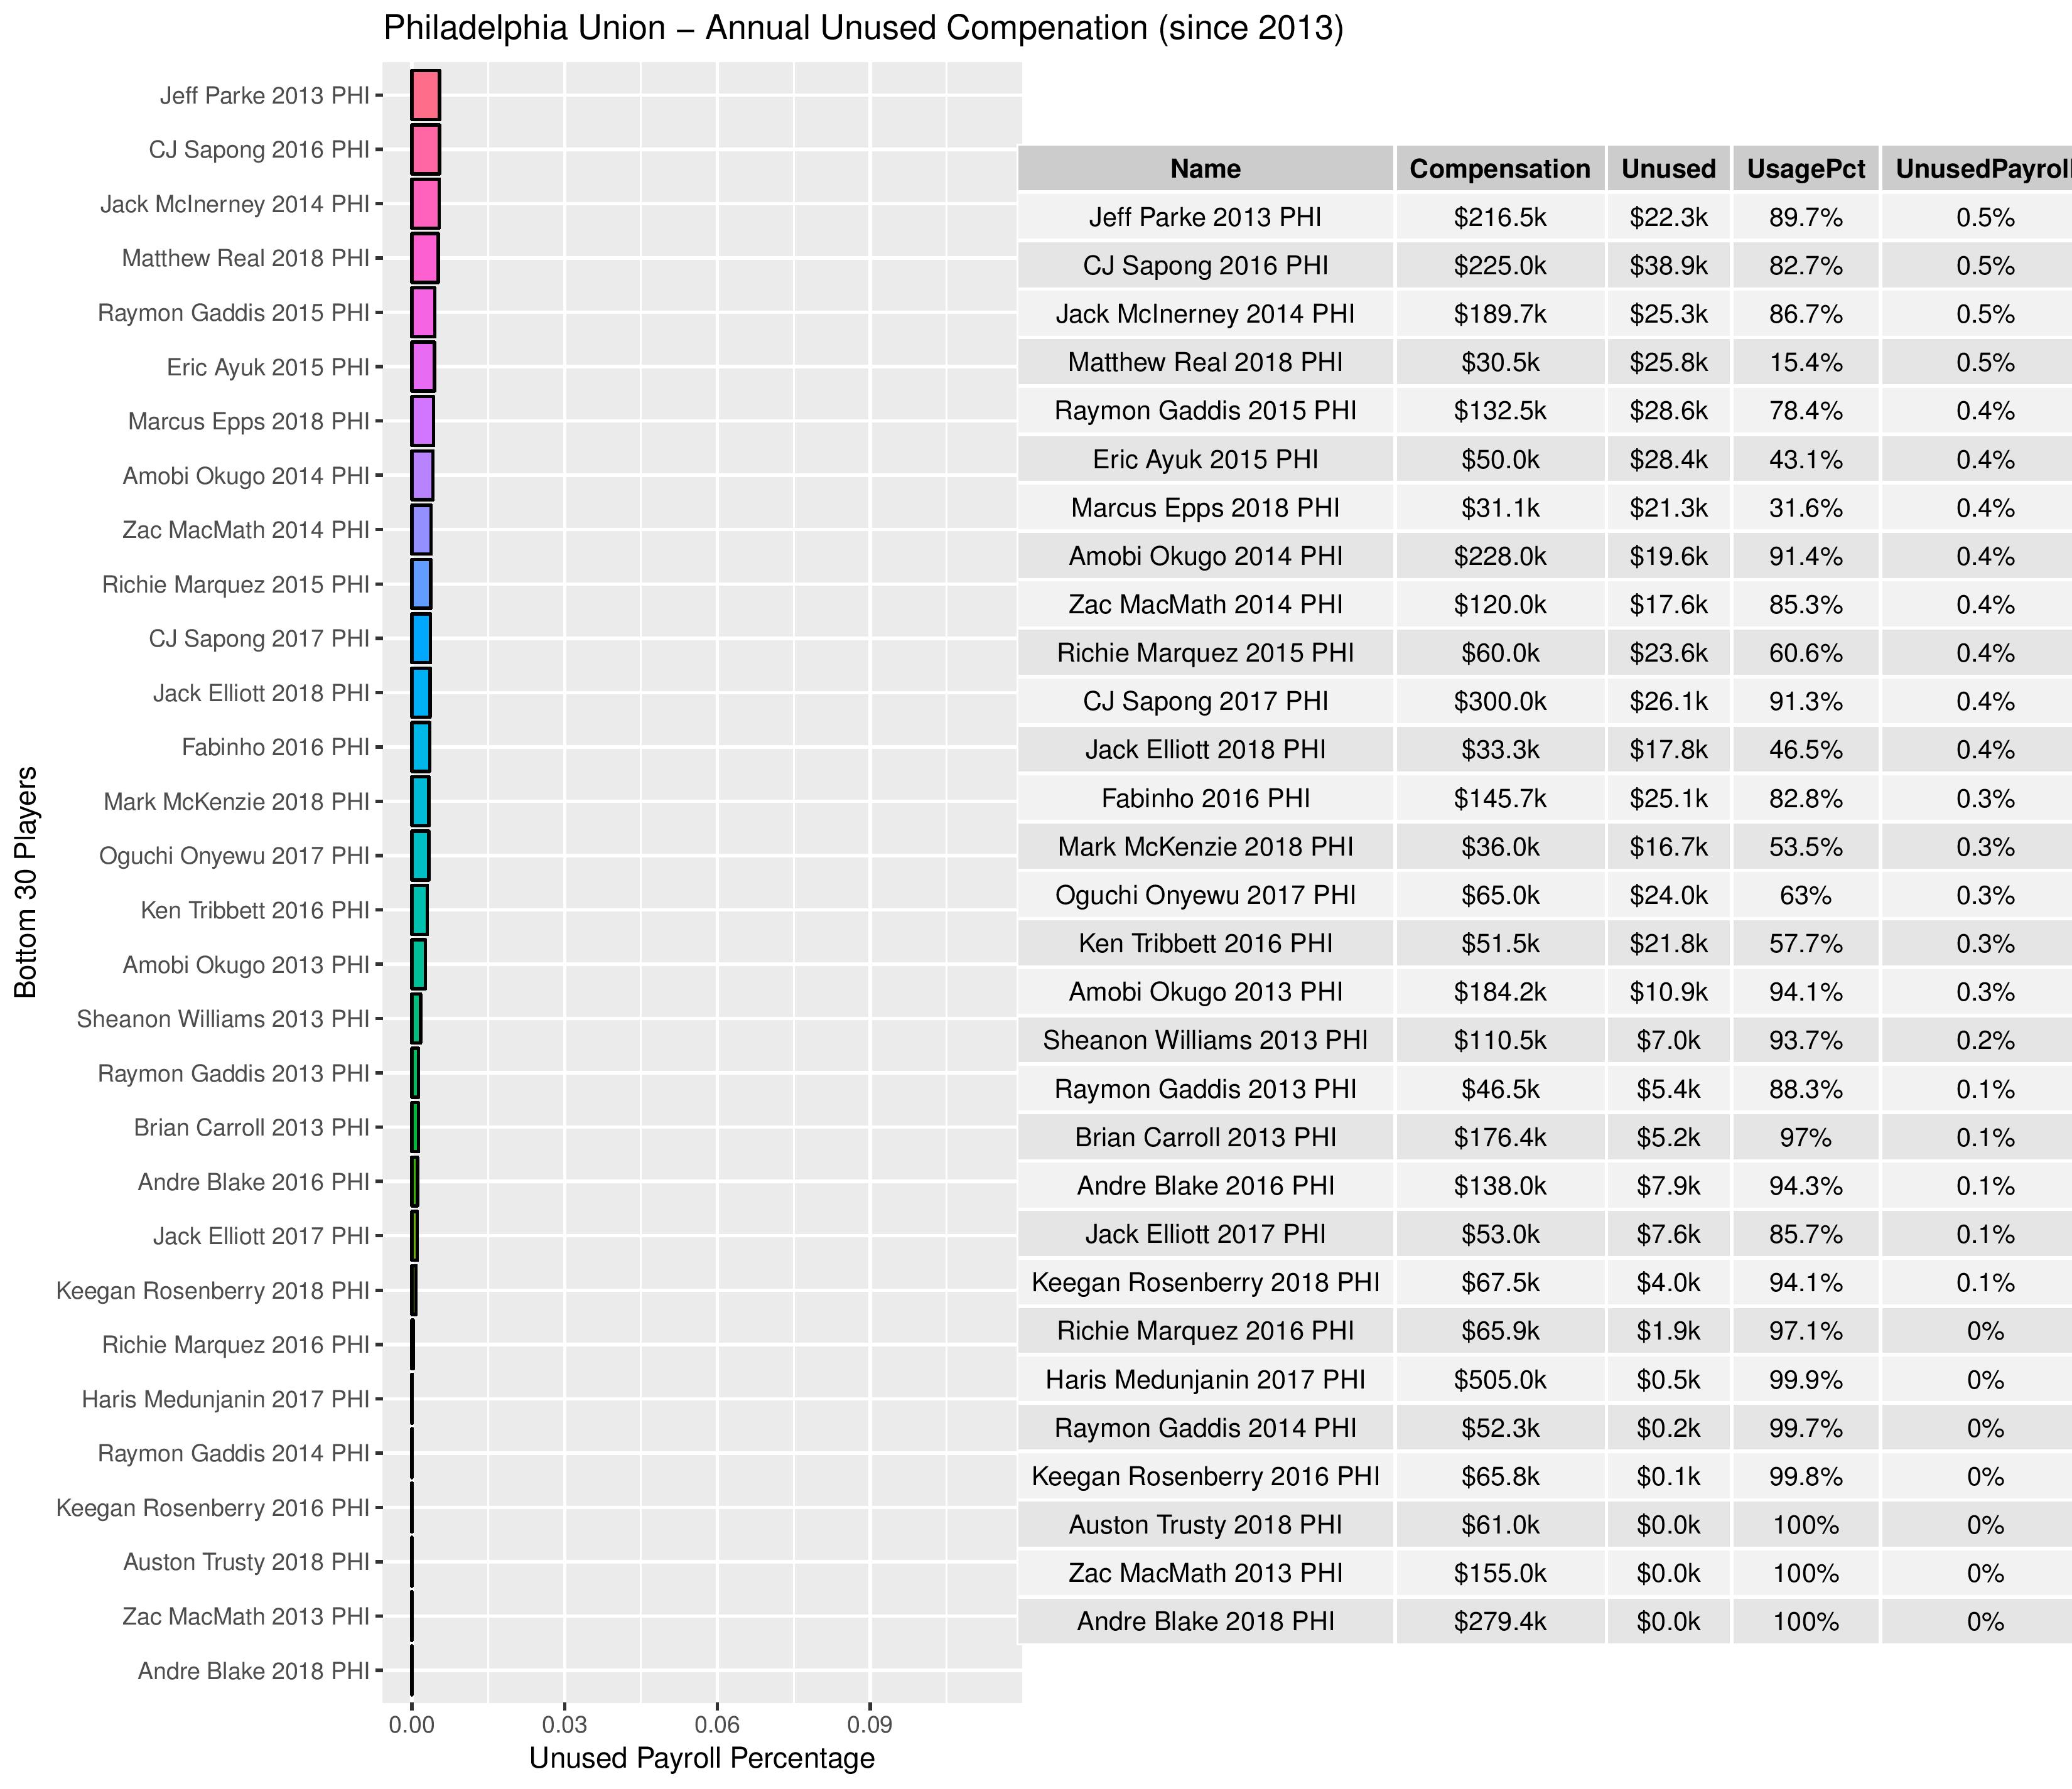
Philadelphia’s trends:
Data Methodology
This is just for transparency, since there is not a perfect way to match salary and player data given the non-public nature of the contracts. This will probably be a bit dry.
- I took all players from all salary reports and excluding any MLS-pool players.
- I matched those players with all match reports by the player and team (even if that player isn’t in the match report because they didn’t make the 18-player-roster or if they weren’t on the team at the time).
- There were lots of manual effort to standardize name formats between these sources and between salary reports.
- The result is that the each player-game will often match with multiple player-salary reports
- I filtered down the duplicates to just the one where the salary report is fewest days away from the game’s date. If there is a tie (equally distant from two reports, one before and one after the game), I chose the report that happened prior to the game.
- If the player-game matched to a report that came out before the match, I filter out those matched to a report that came out earlier than the previous report (i.e. if a player-game on 7/1/2018 matched to a report from 4/19/2014, these are dropped, since the player would have been on a more recent report if they were on the team at the time).
- If the player had minutes, this exception is waived.
- I do the same as in step 4, except making sure that the player-game matched to the next available report, and not one further.
- Any player that I failed to match to a salary report (most likely because they were signed and cut in between salary reports) were assigned the league minimum for the season.
- These records are now ready to be aggregated to match-level, season-level, player-level, etc.

“This includes only the earnings of players, not of the transfer fees/costs.”
.
“Over this time period, Philadelphia’s spending has increased from less than $4M to nearly $9M. Given how often they are (often by me) casually described as a cheap club, they’re not exactly standing pat when they’ve more than doubled their on-field-investment.”
.
If you don’t include transfer fees or player acquisition costs (# of scouts on staff etc), do you feel this is a hole in your data? It’s a salary budget single entity league. They’ve doubled their investment because MLS gave them more TAM/GAM. They ARE a cheap club. They do not spend on player acquisition and are getting praise for “investment” when it’s merely the rising MLS tide lifting their boat. I appreciate you made a lot of charts, but not quantifying their player acquisition costs vis-a-vis the rest of the league muddies the waters. I think such a chart would indict this FO.
I’m a little surprised you focused on that one statement, as I feel like the rest of the article generally describes the Union as being too frugal to compete without some luck. The very next chart was showing how the Union’s spend compared with the league median plummeted in 2016 & 2017.
–
However, yes, it would be ideal to have cost of transfer factored in to describe club ambition, but:
1. I’m not aware of a data source other than individual news reports.
2. Quantifying that data would be subjective (how much is a 1st-round-draft-pick worth? While a homegrown pickup is ‘free’, what was the cost-of-goods-sold to produce that player in homegrown academy? etc.)
–
Also, I haven’t done any analysis on this, but shouldn’t transfer cost and salary be correlated, which would come to the same conclusions as above? The only reason I’d think they’d be different is if the player was under long-term-contract when their value increased, am I wrong?
Sorry for the delay, I think transfer costs and salary aren’t correlated because they’re funded by two different groups. Salaries are paid by the league and transfers by team in conjunction with the league through the TAM mechanisms. So while I think your premise is good-that is there’s a sweet spot for effective spending as it results in points- there needs to be additional metrics. Like, size of FO staff, who spends the most for scouting, that sort of stuff, in addition to aggregating the data on published transfers. MLS has promised more transparency on this.
Chris,
Awesome data analysis and visualization! As a huge Union fan (founding STH) and also as a computer scientist (currently a director of IT), I have a double appreciation for your article!
Thanks!
Kris
What’s up,I check your blog named “The Philly Soccer Page – Money talks when you do it right” like every week.Your writing style is witty, keep it up! And you can look our website about proxy server list.