* – As I will be on vacation next week with limited access to my computer/programs, there will not be a new forecast next week. I will run it for over-time-graph purposes, but the next published forecast will be on the 29th.
Below are the updated season forecasts using data from games through March 12, 2017.
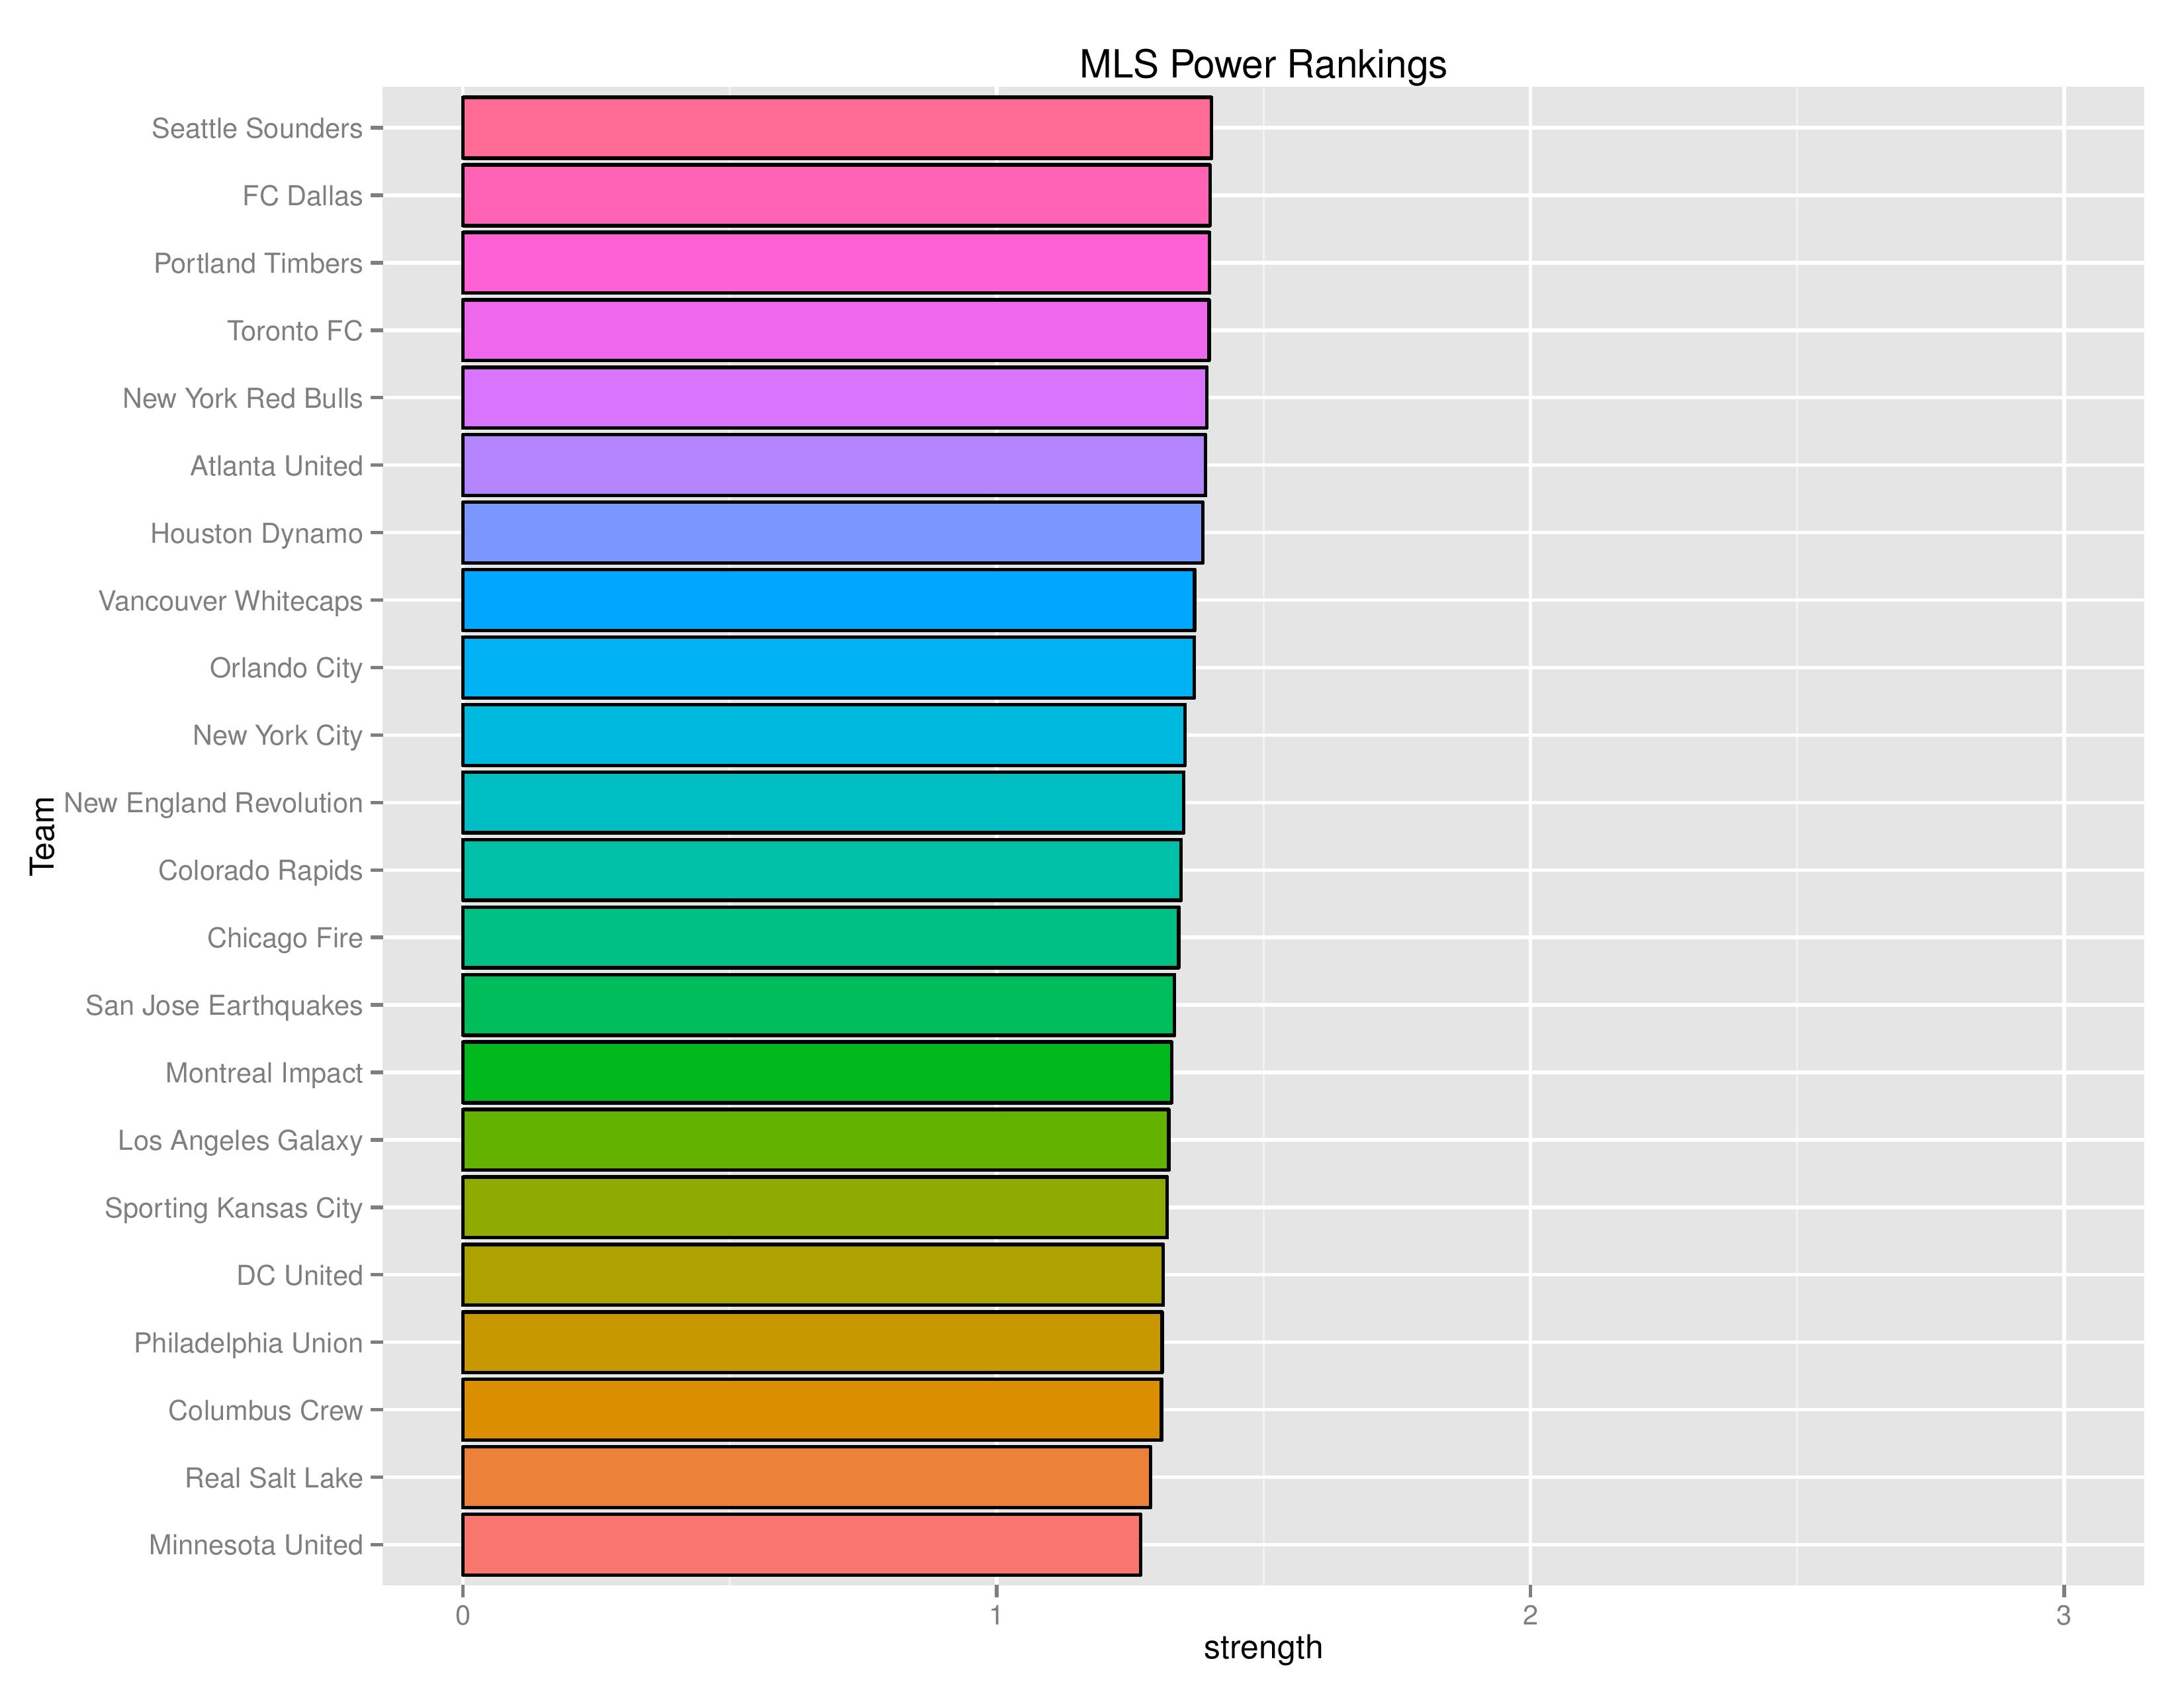
Power Rankings
The “Power Rankings” we concoct are the “strength” of the team according to competitive expectations. They are computed by forecasting the expected points (3 x win-probability + 1 x draw-probability) against every MLS team, both home and away, and taking the average per team.
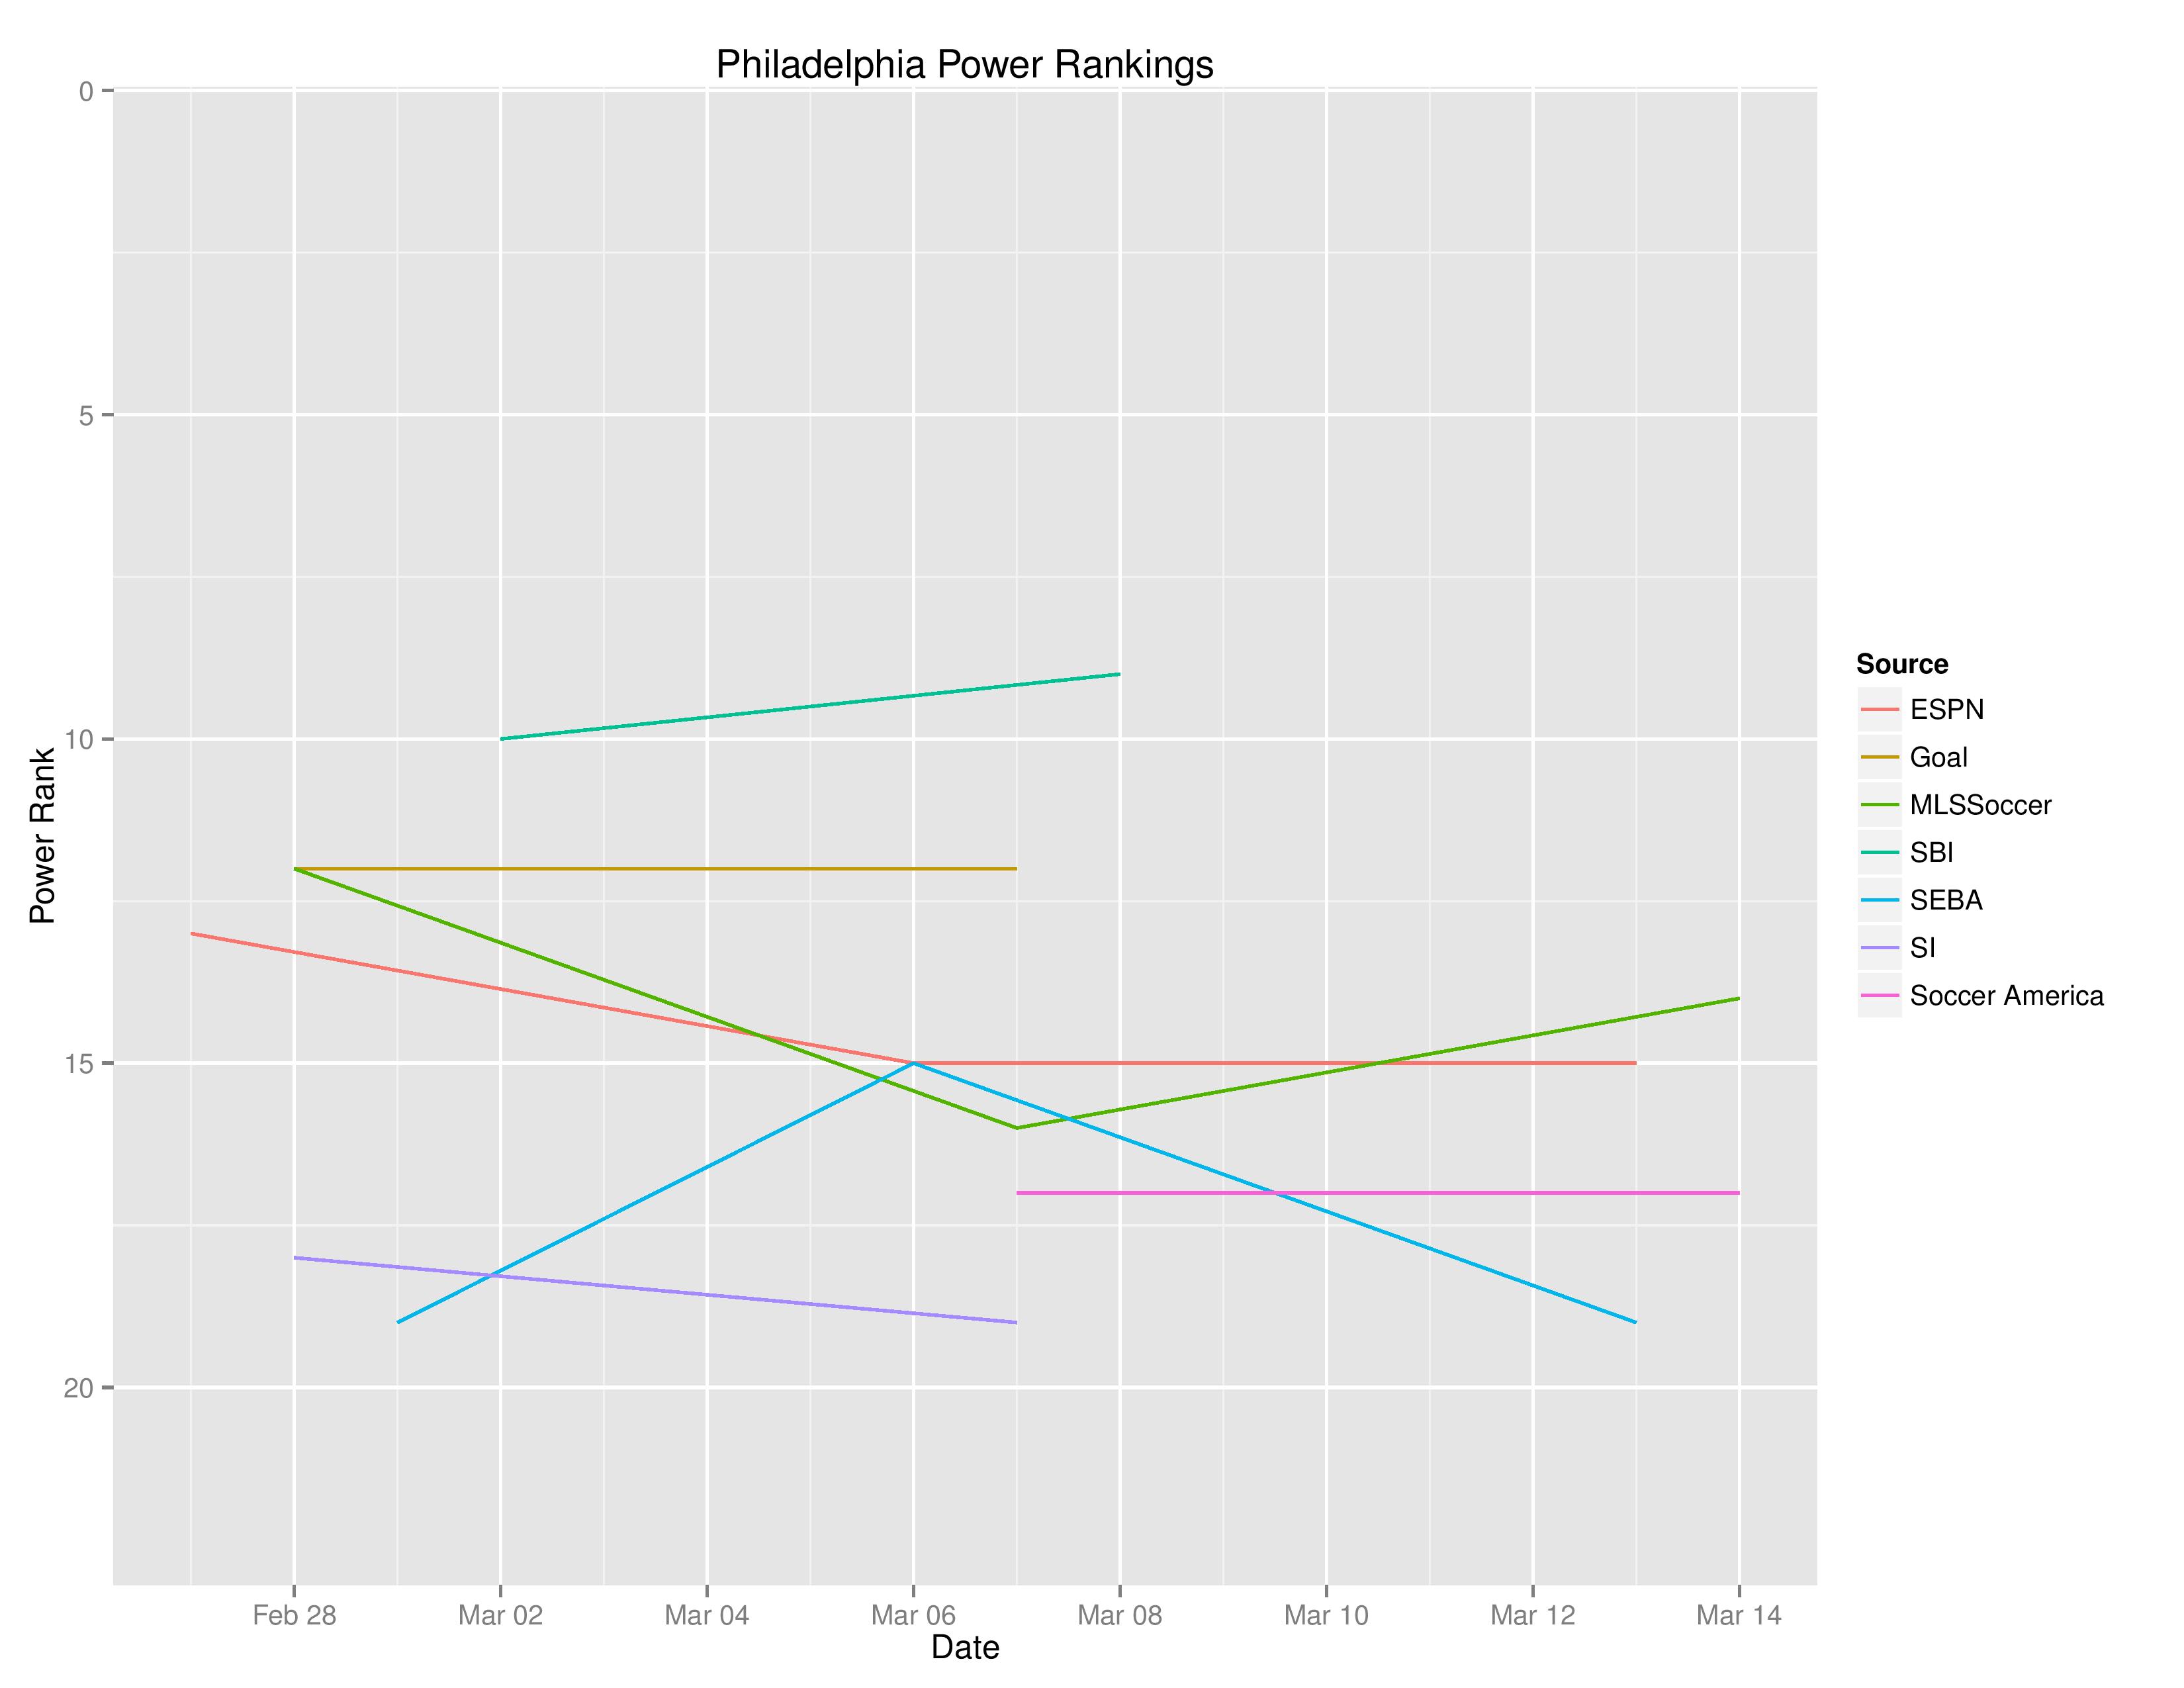
SEBA has the Union drop from 15th to 19th. This is, in part, due to performing less then necessarily expected (because of home-field-advantage), but likely more-so due to more early 2016 matches getting excluded (2 matches from the 2016 season are erased for every 1 played in 2017). As we all know too well, Philadelphia’s performance at the end of 2016 would not likely provide favorable data for the Union.
MLSSoccer.com has Philadelphia up to 14th from 16th; ESPN has the Union remaining at 15th; Soccer America has the Union remaining in 17th;
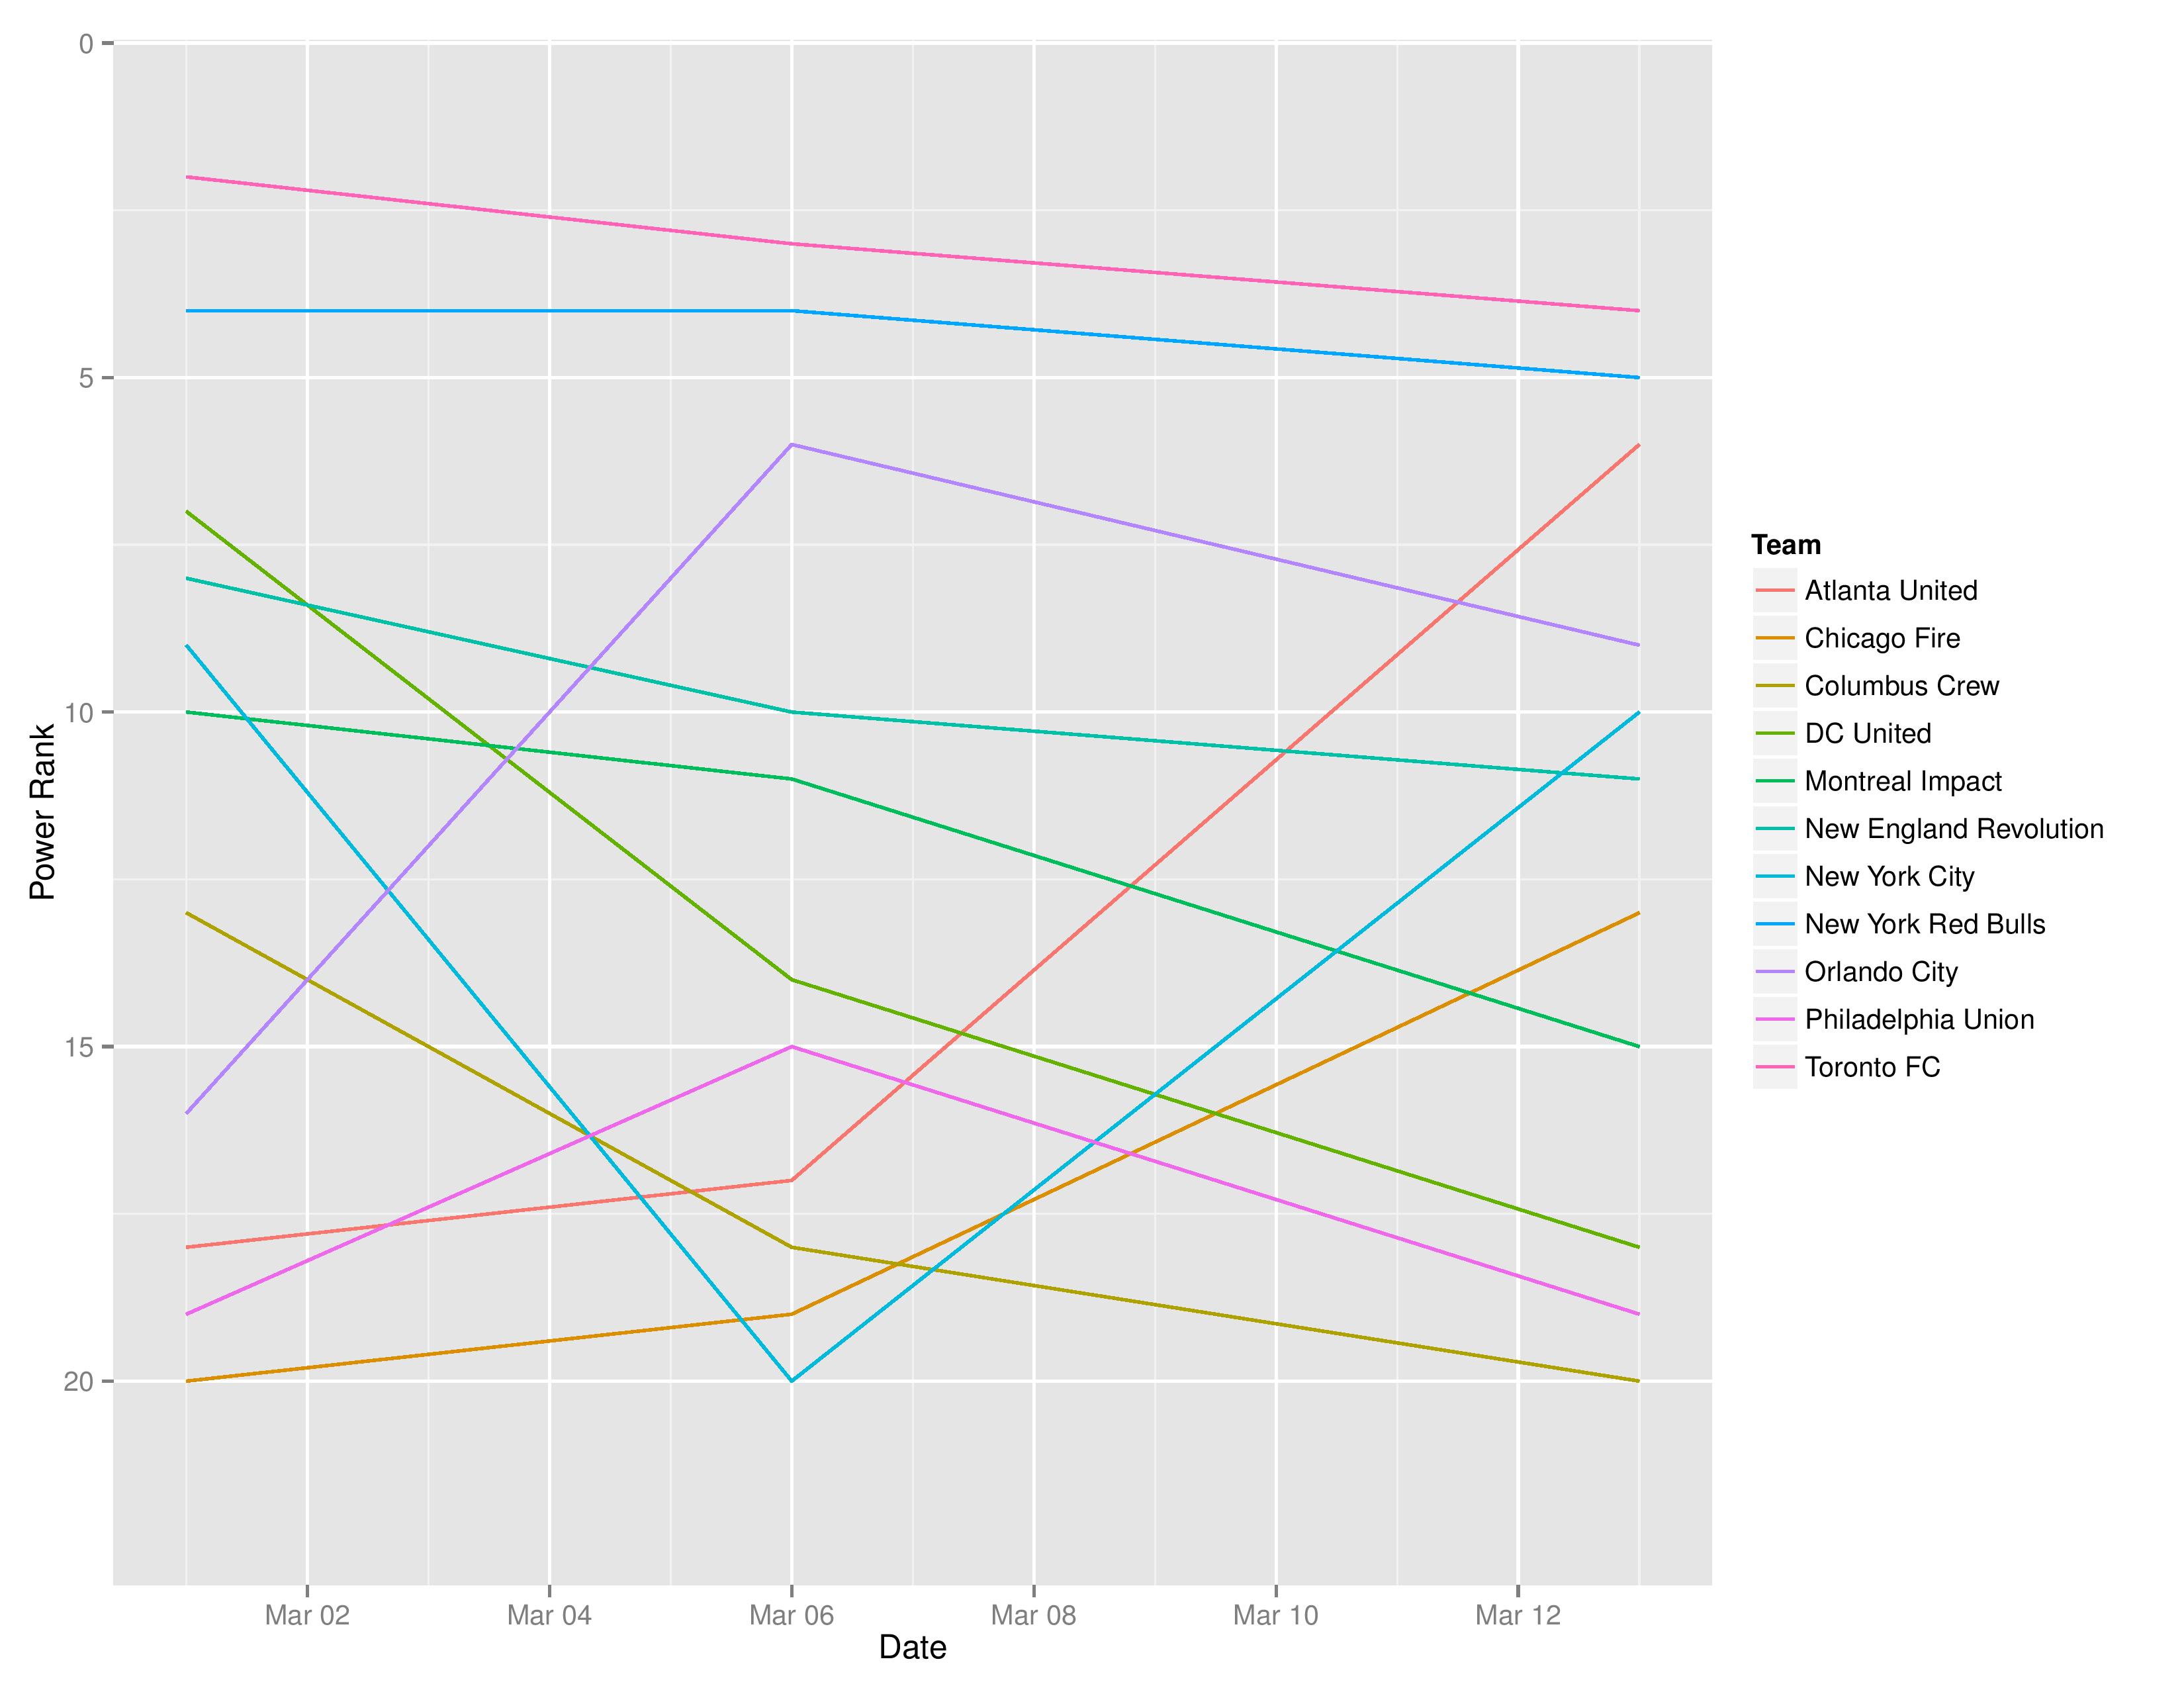
The following shows the evolution of SEBA’s power rankings for the MLS East over time.
Playoffs probability and more
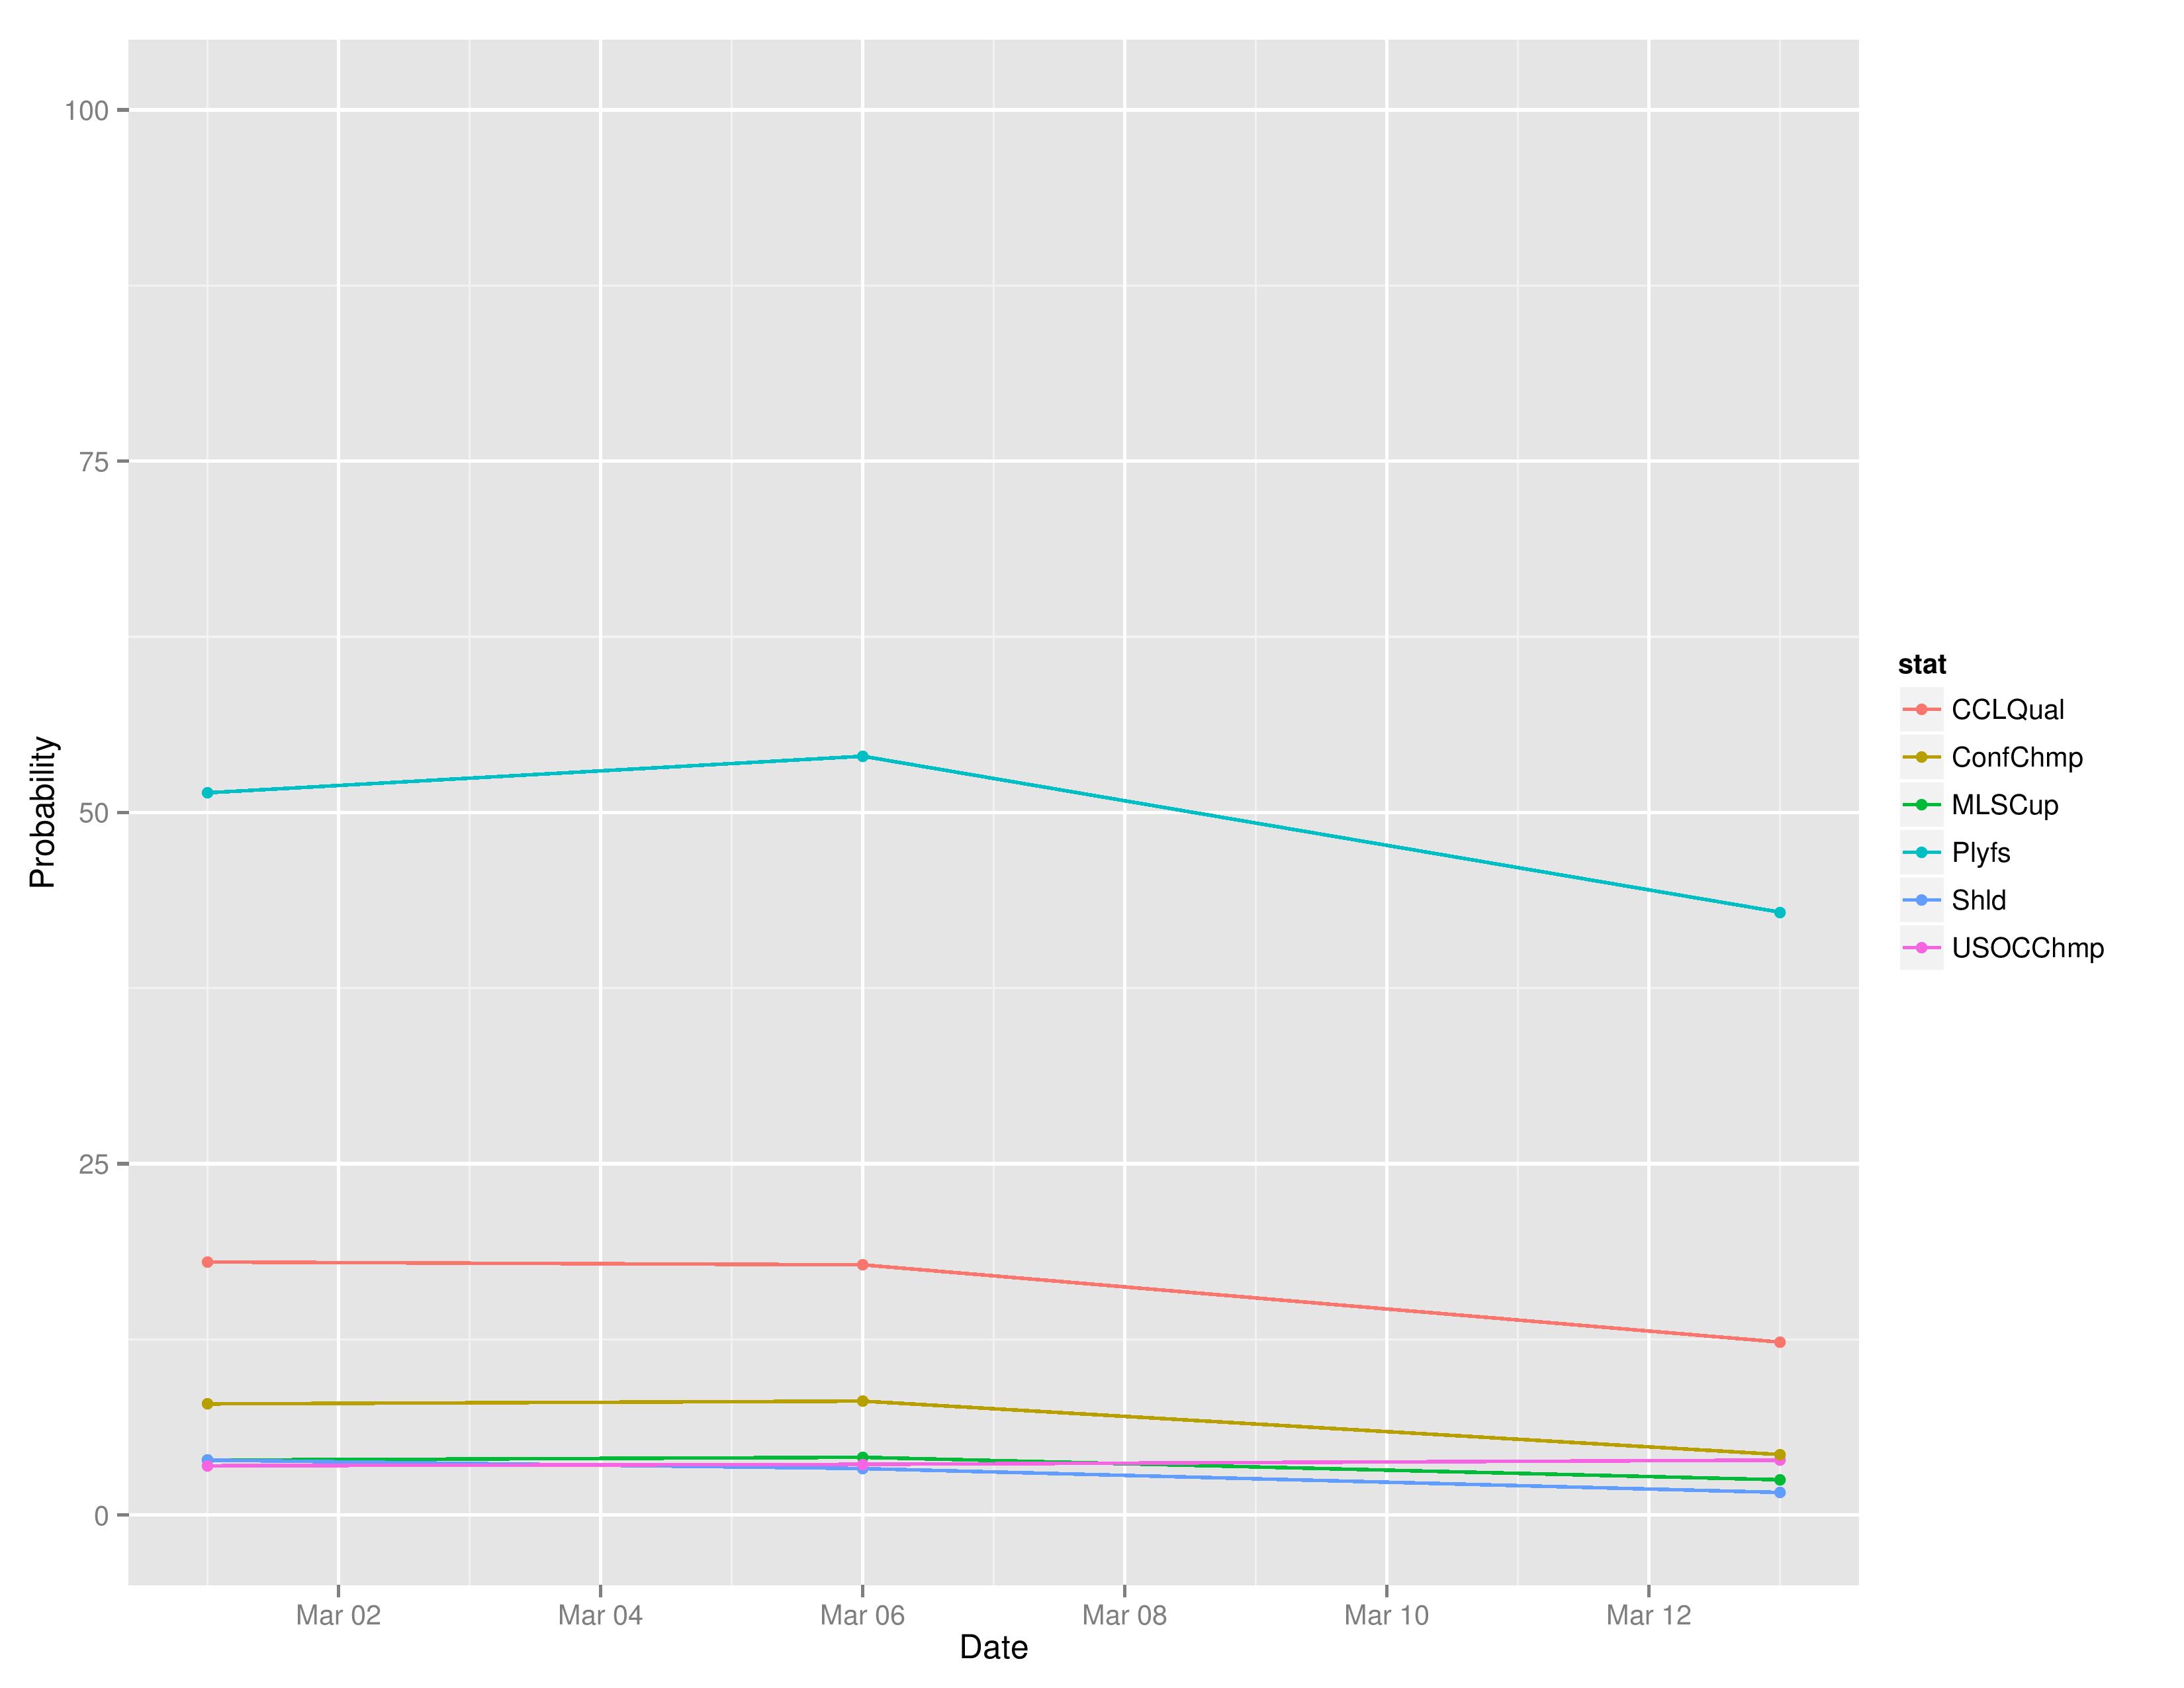
Philadelphia’s playoffs odds declined from 54.0% to 42.9%.

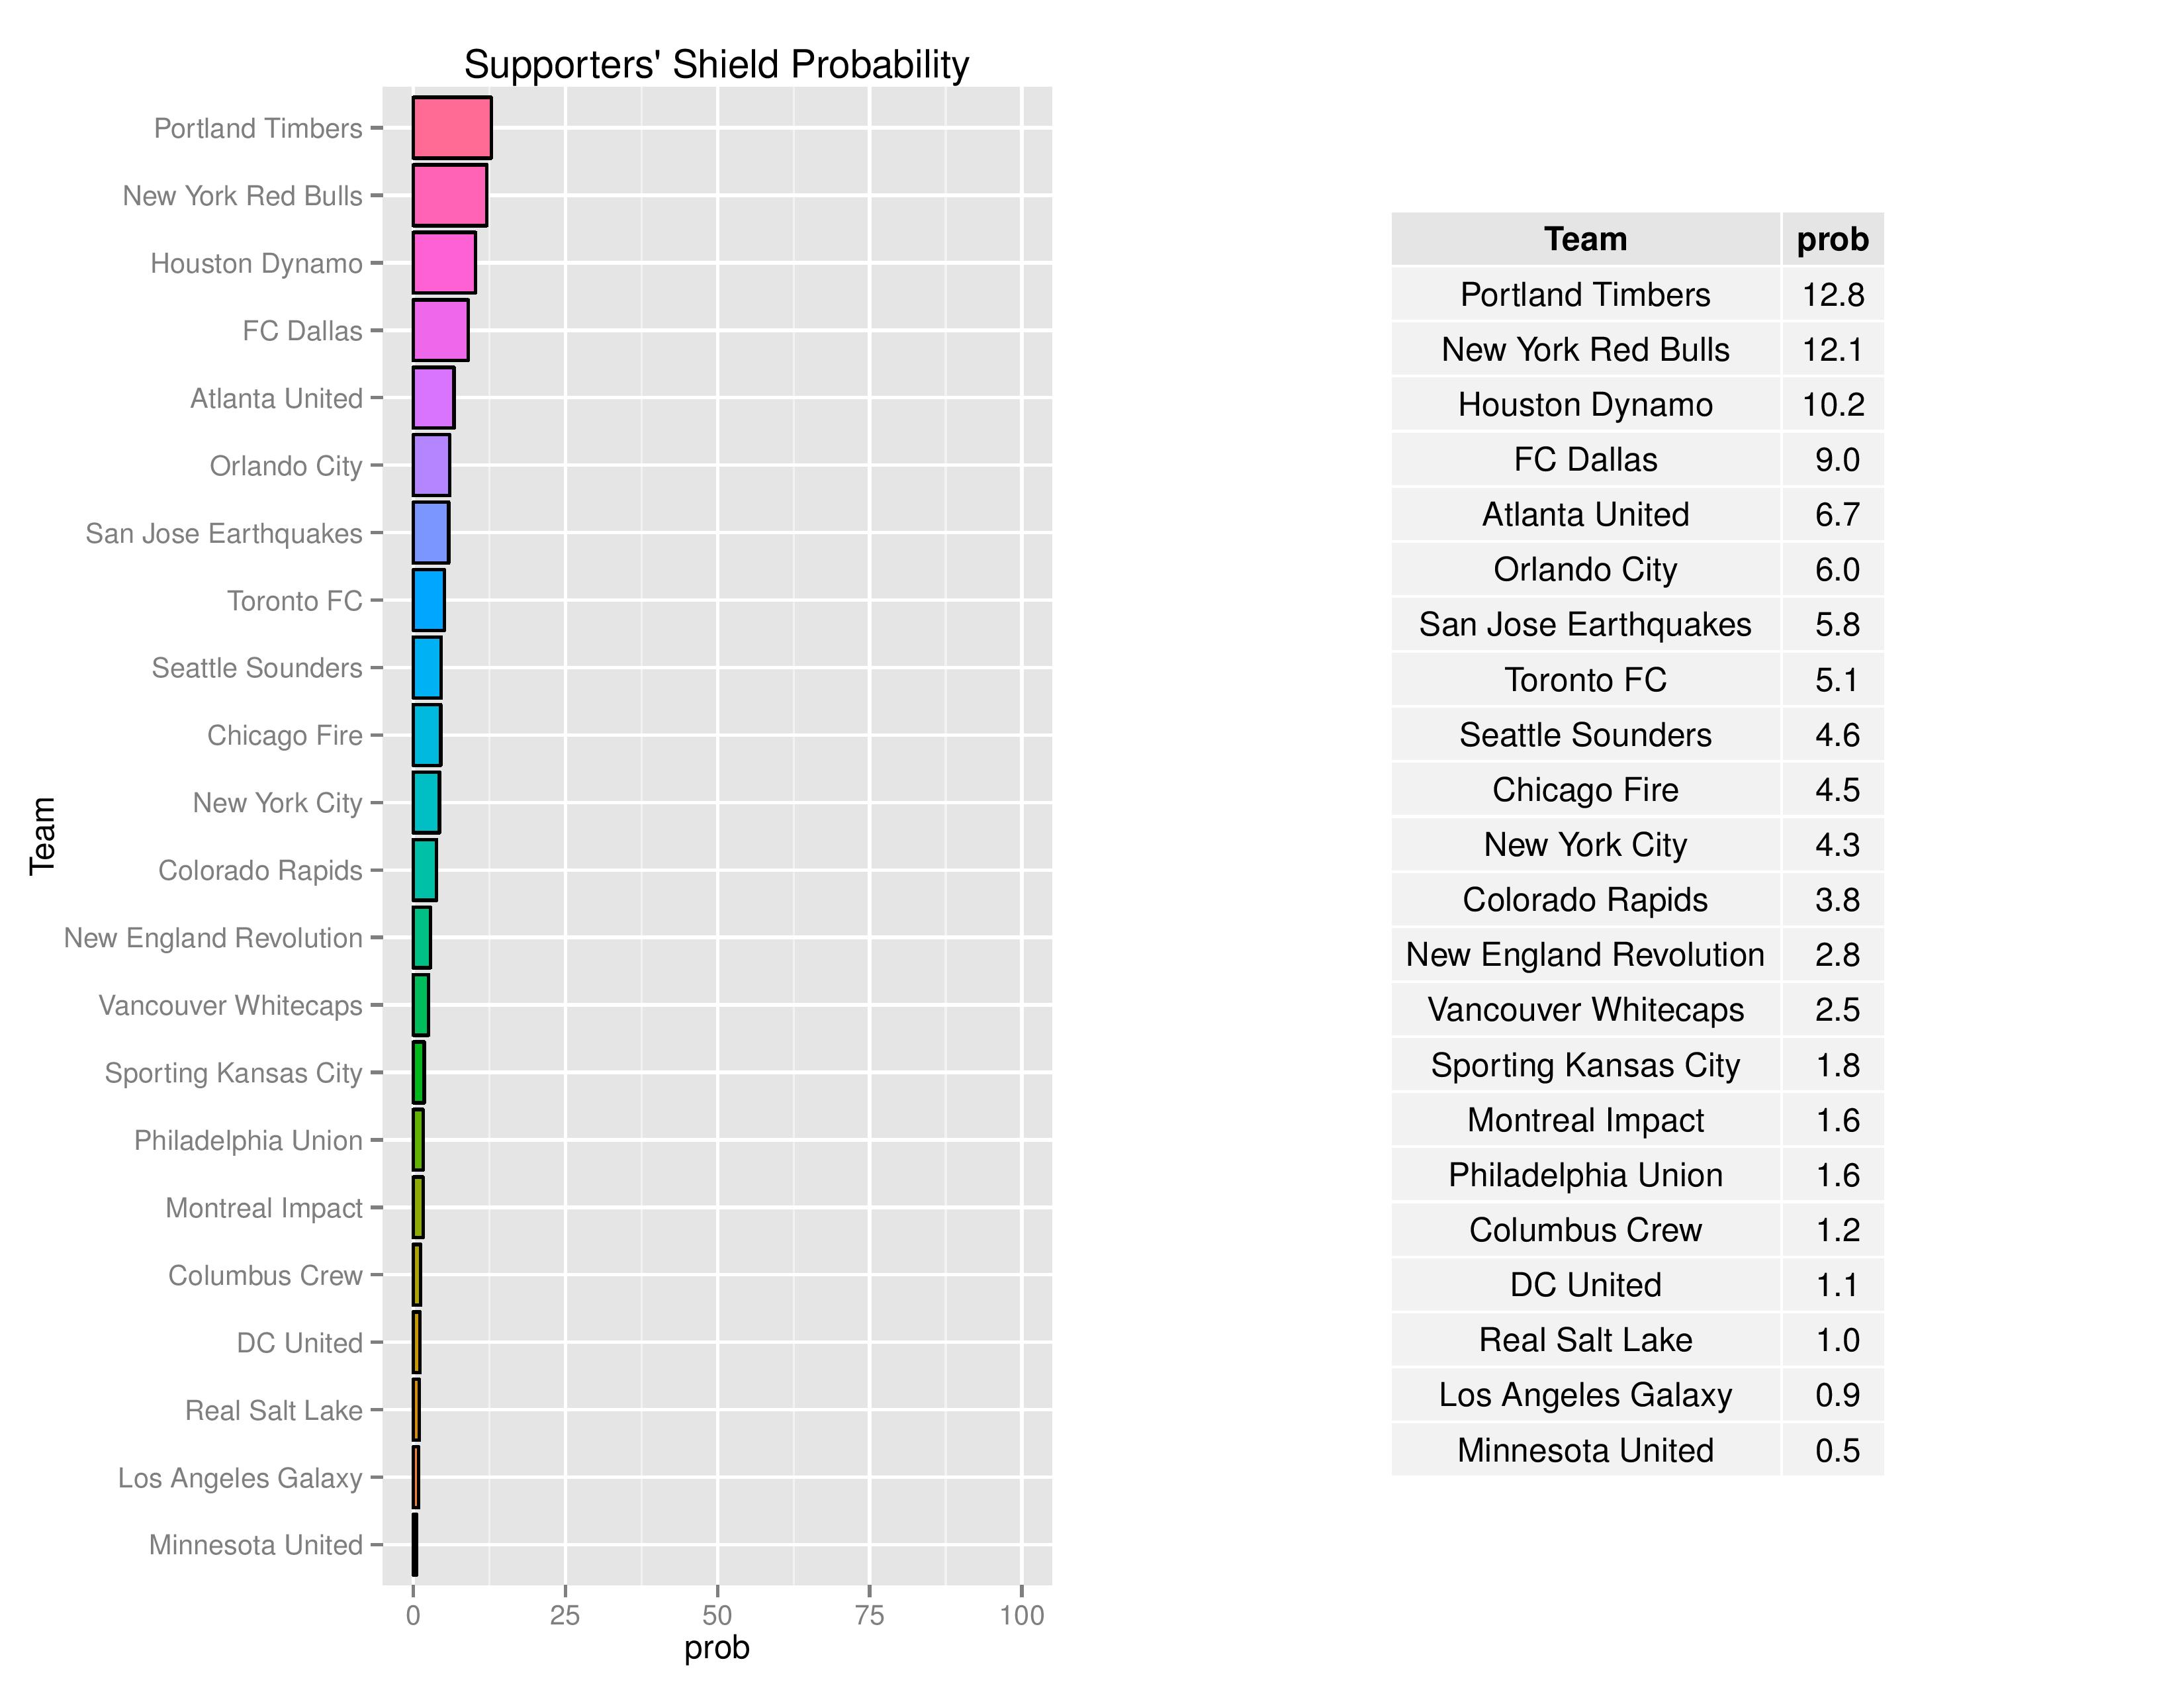
Philadelphia’s odds to win the Supporters’ Shield declined from 3.3% to 1.6%.
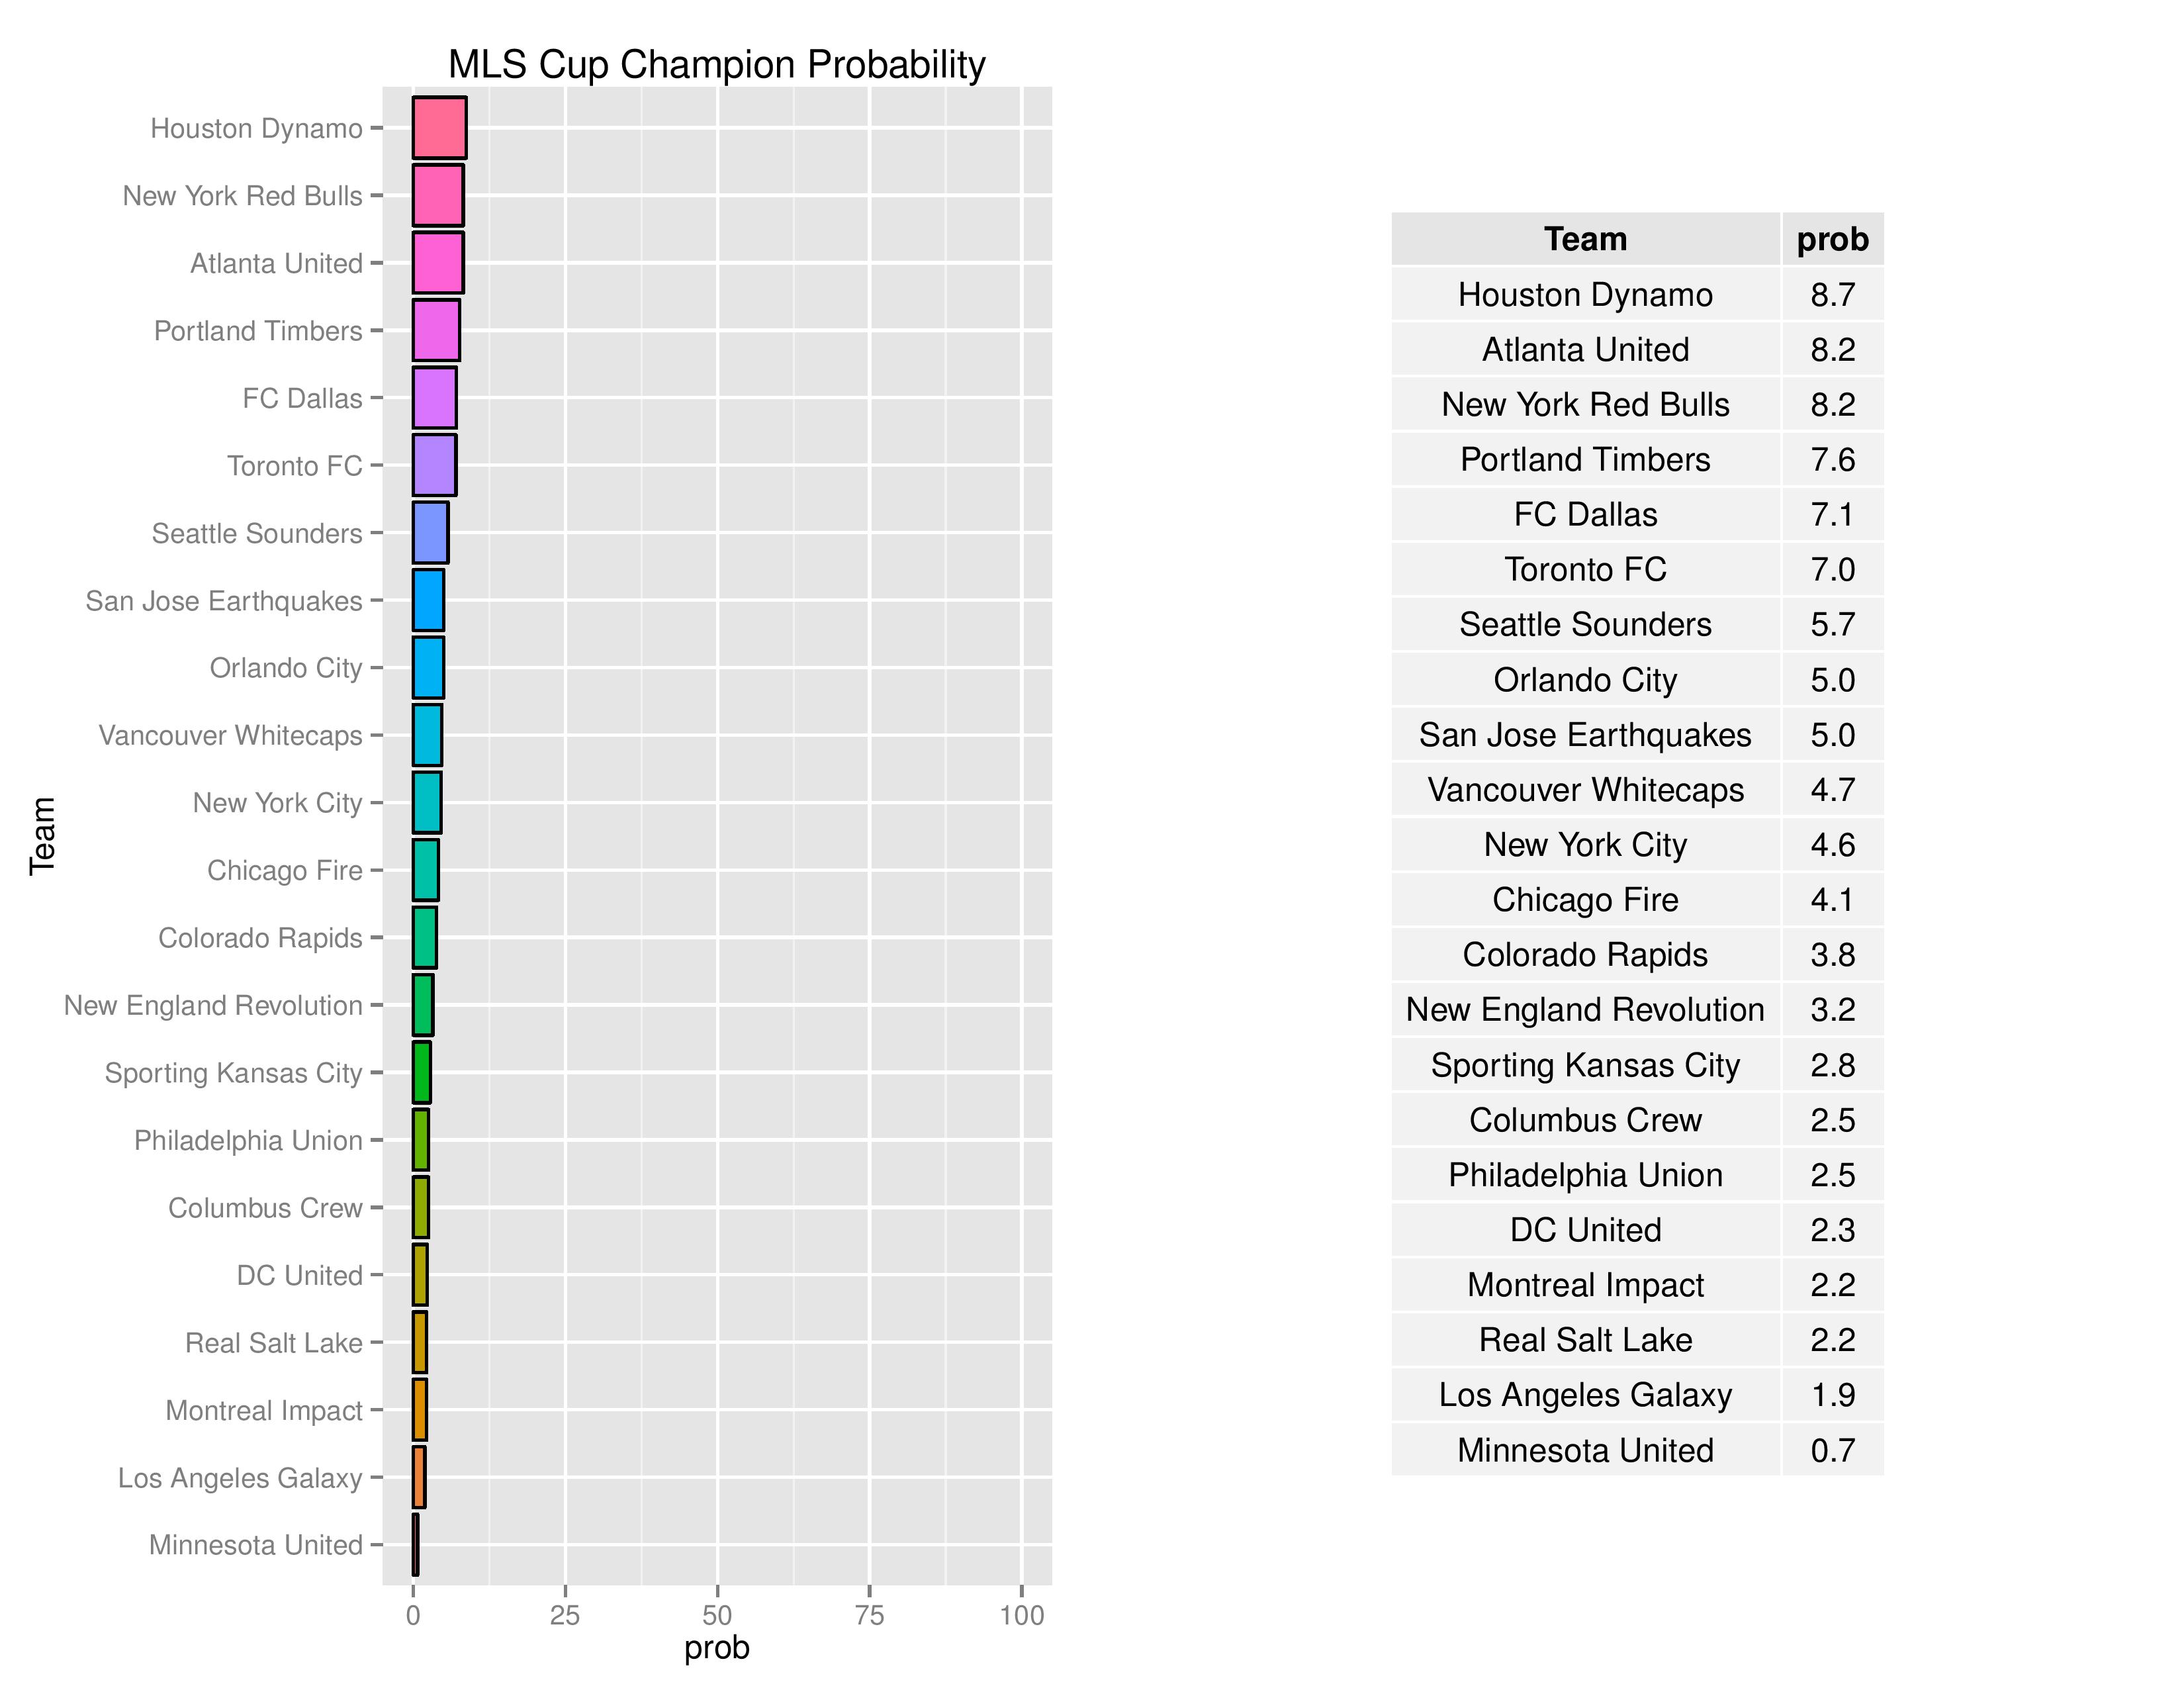
The Union’s chances of winning the MLS Cup decreased from 4.1% to 2.5%.
In part, clubs which have been obtaining large values for Goal Differential thus far, are given an advantage in MLS Cup due to the 2-leg aggregate goal format of the conference semi-finals and conference finals.
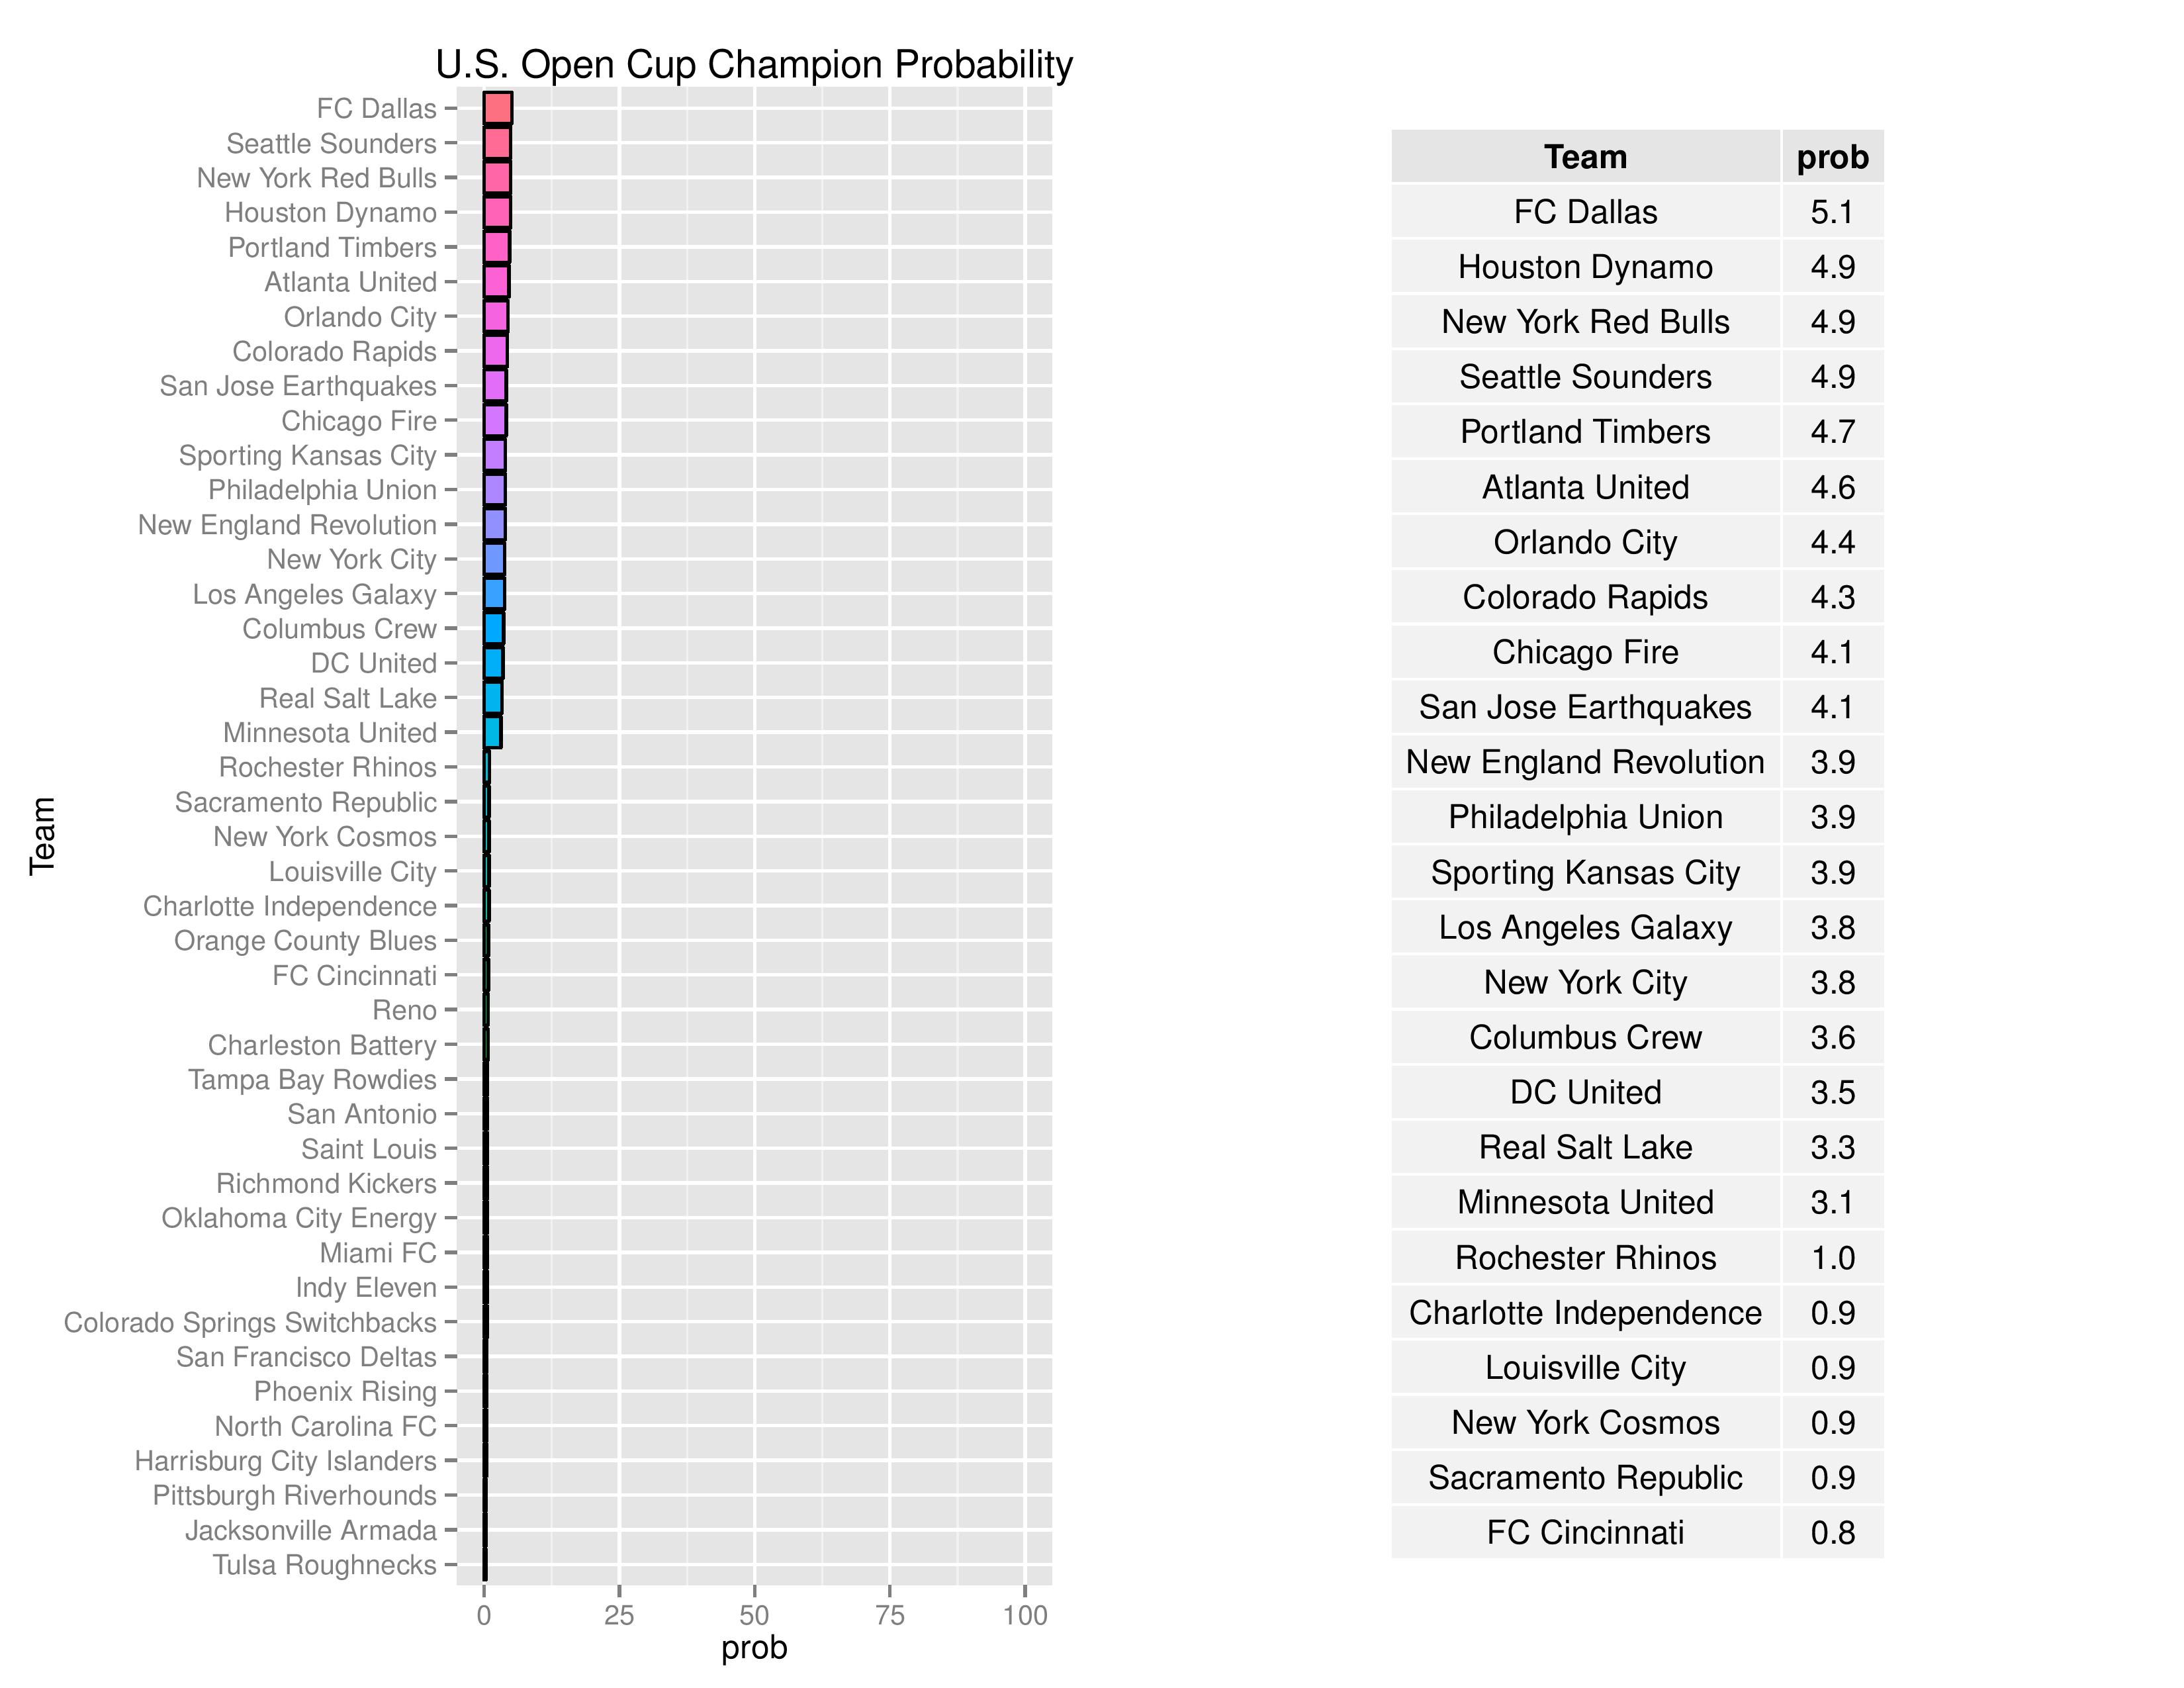
Philadelphia’s odds of winning the U.S. Open Cup increased from 3.6% to 3.9%.
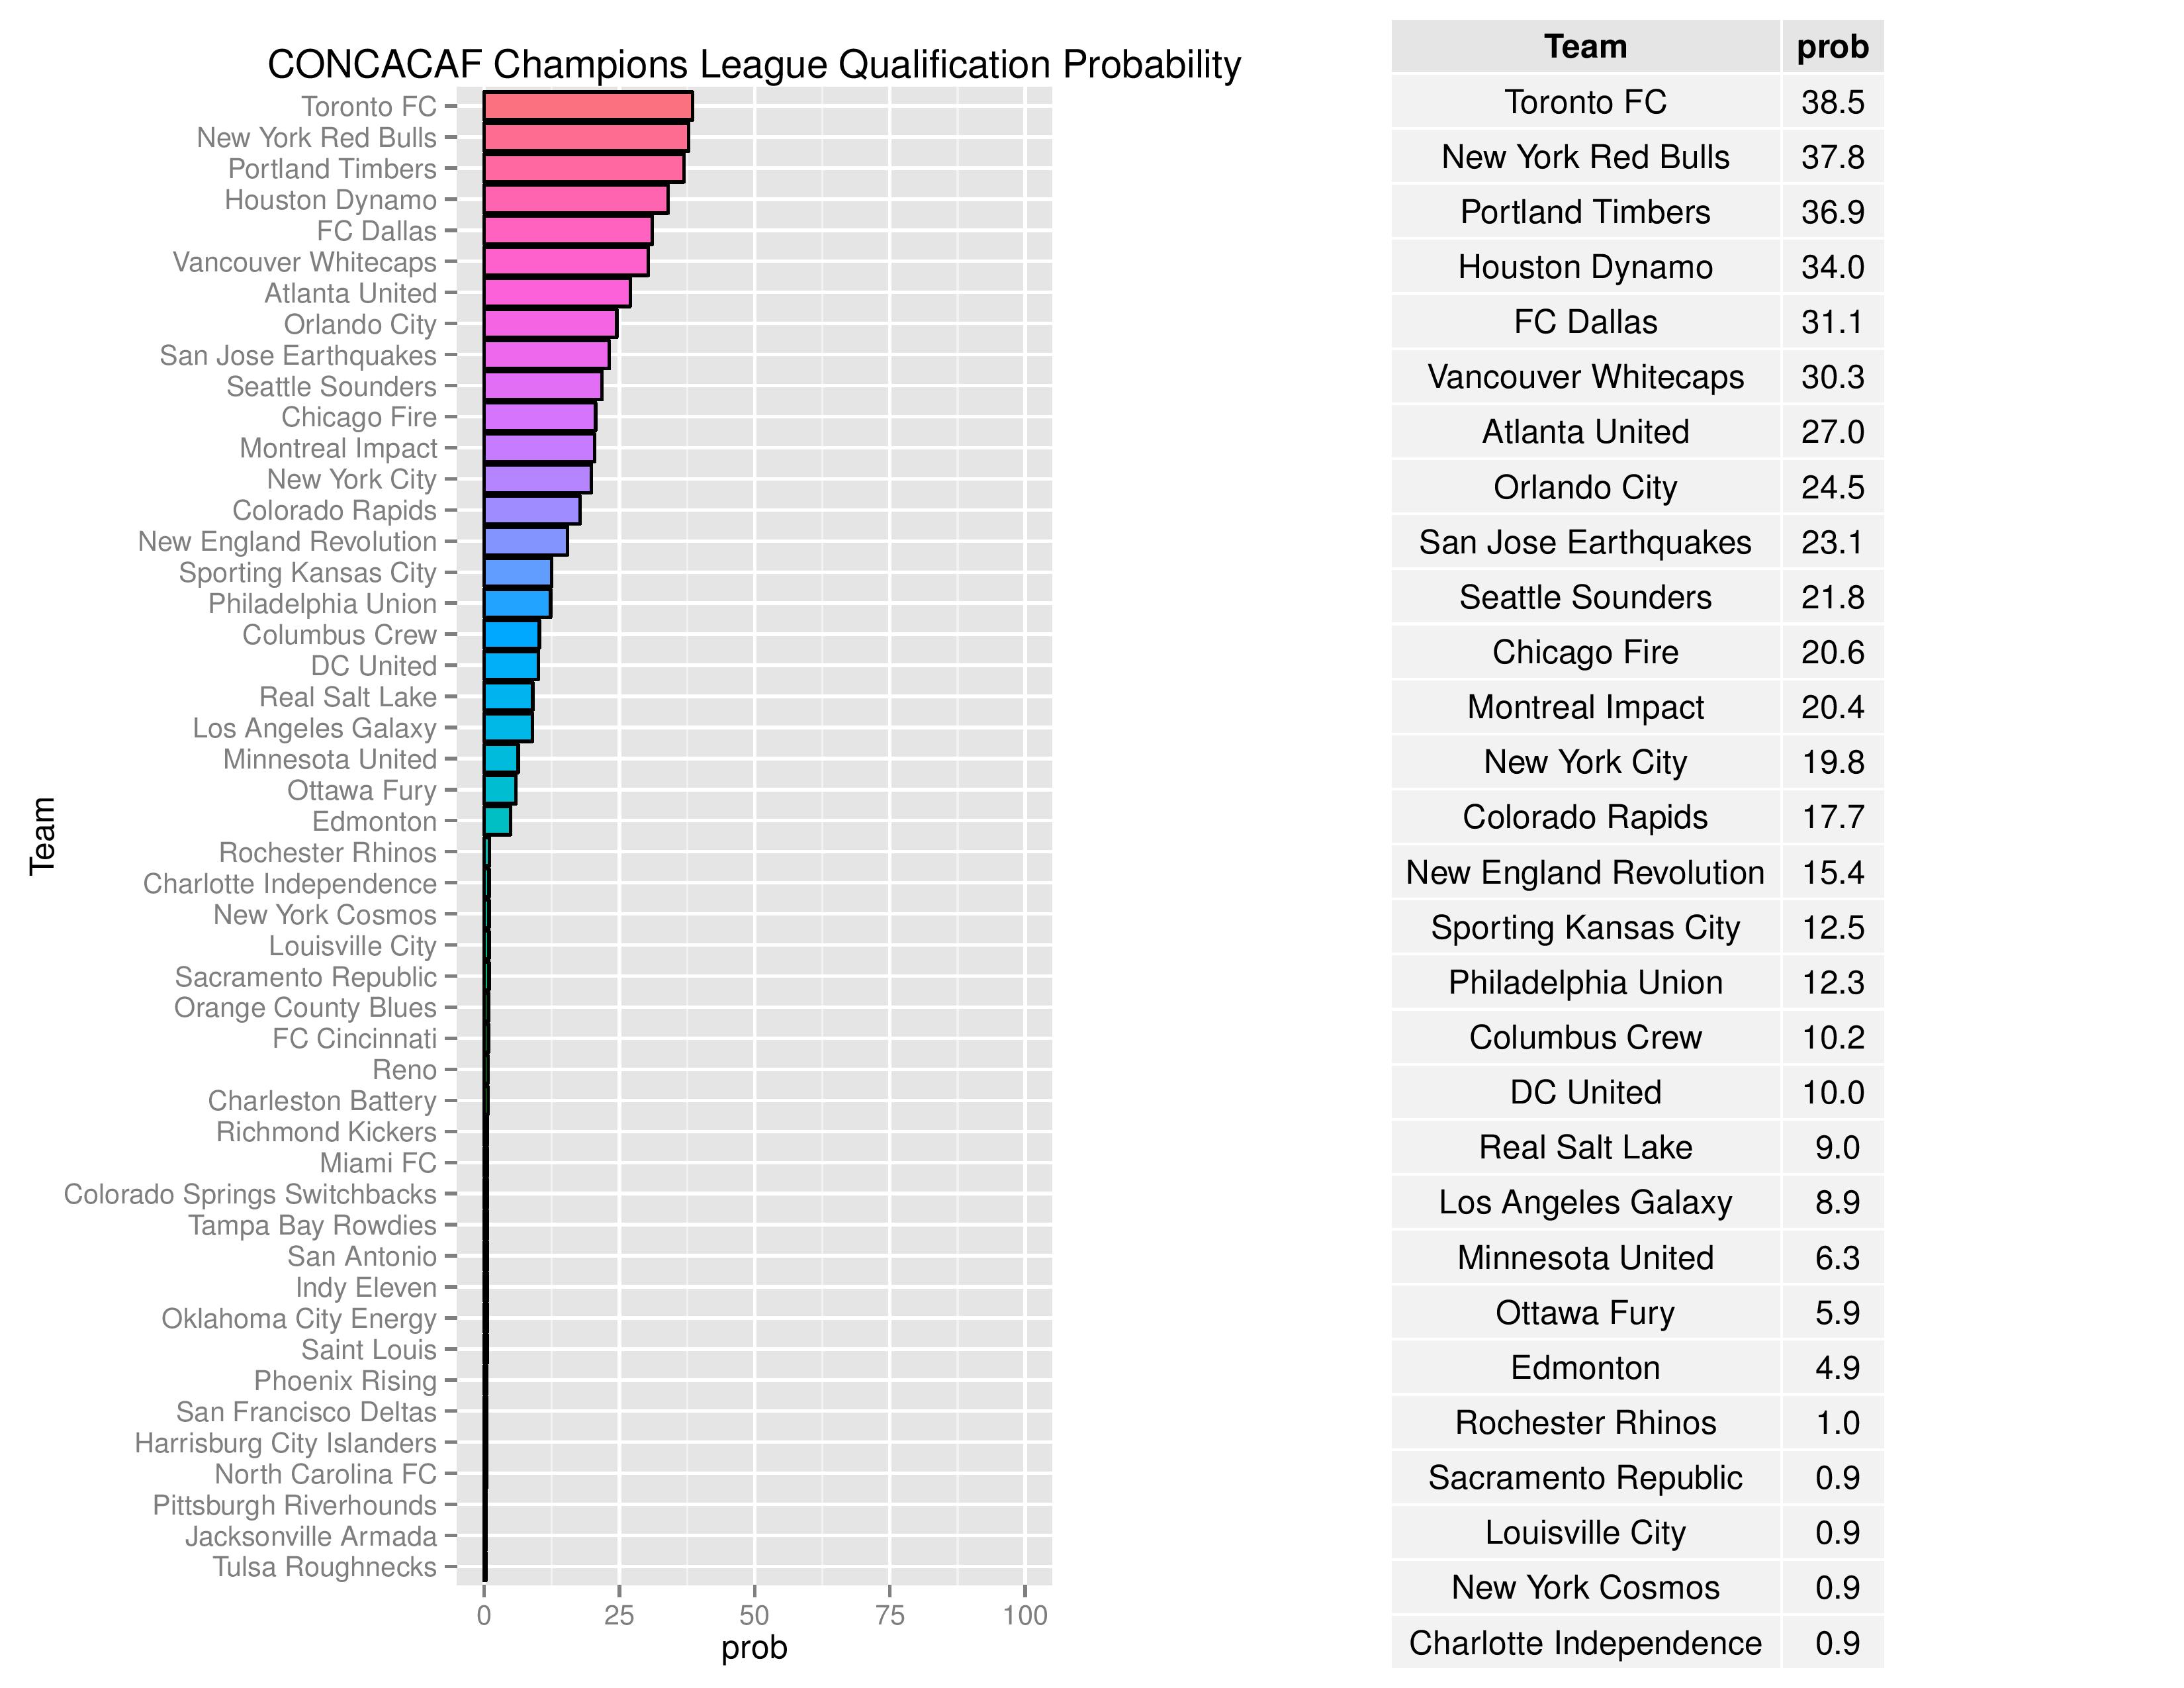
Philadelphia’s chances for qualifying for the 2018-2019 edition of the CONCACAF Champions League dropped from 17.8% to 12.3%.
Over time, we can see how Philadelphia’s odds for different prizes change.
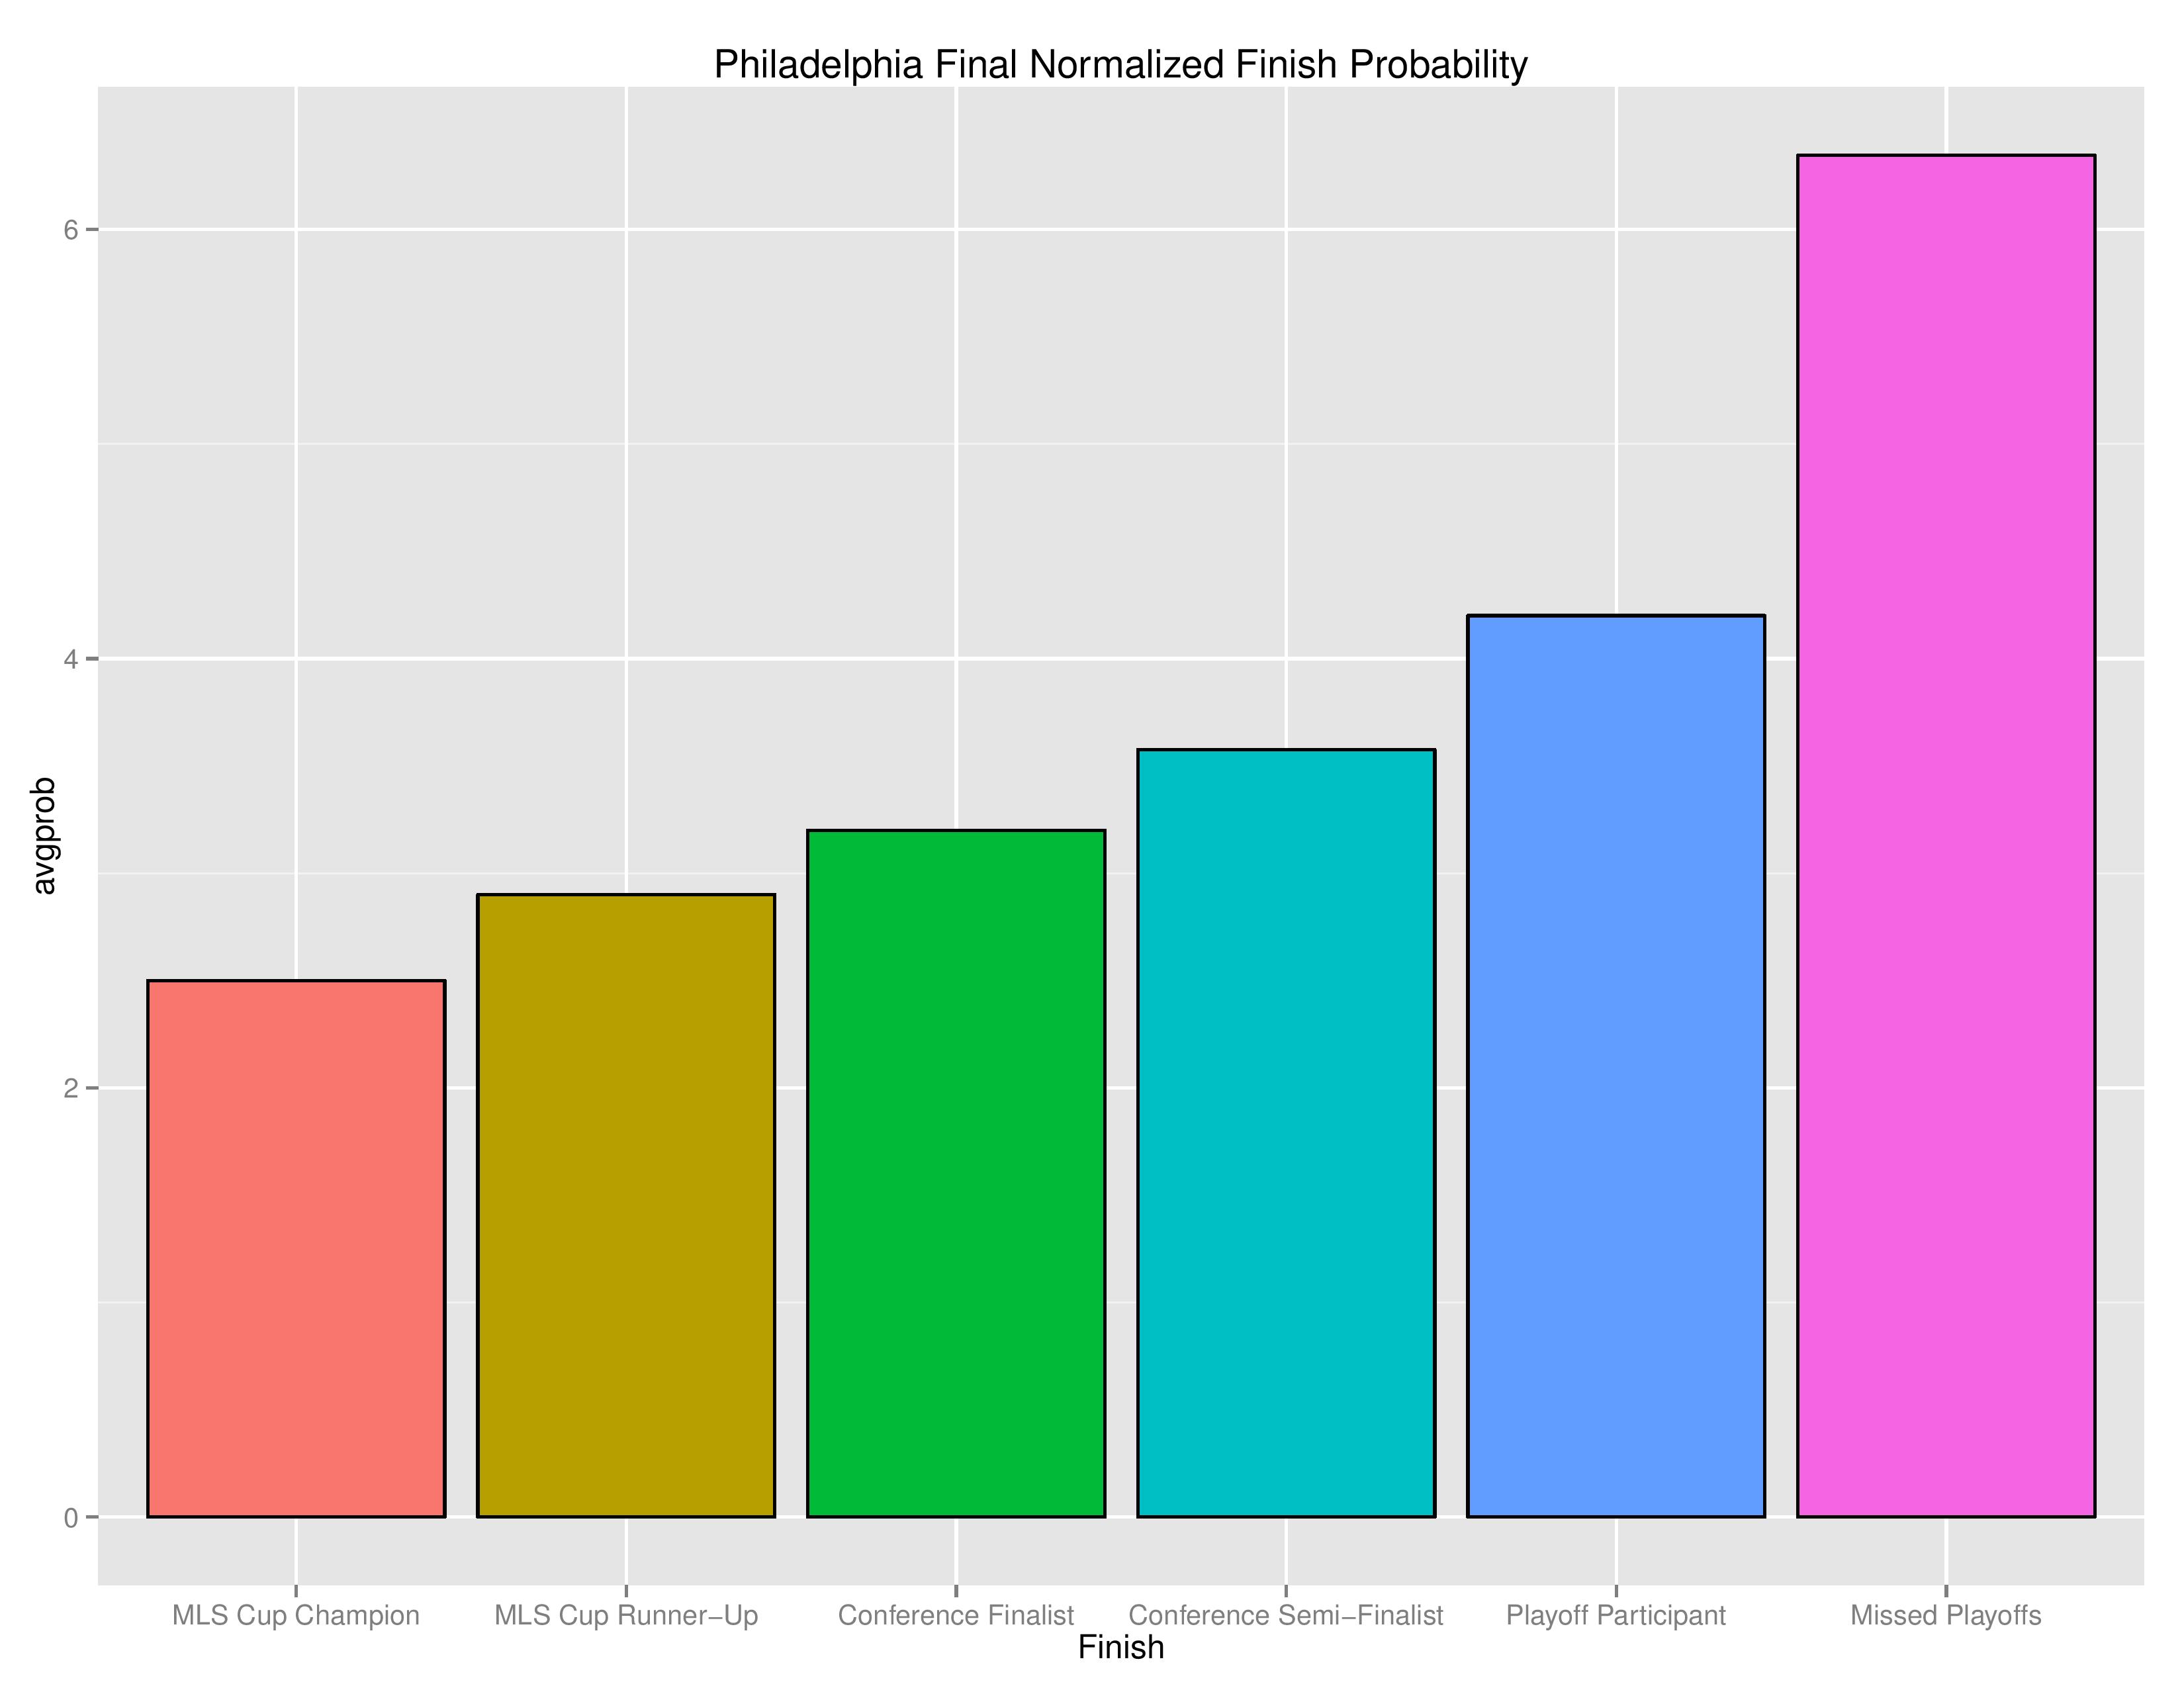
The following are probabilities for each category of outcomes for Philadelphia.

The following shows the relative probability of the prior categories. If the projection system were entirely random, these bars would be even, despite that “Missed Playoffs” is inherently 10 times more likely than “MLS Cup Champion.” The chart outlines where the club is headed.
The following shows the probability of each post-playoff ranking finish.

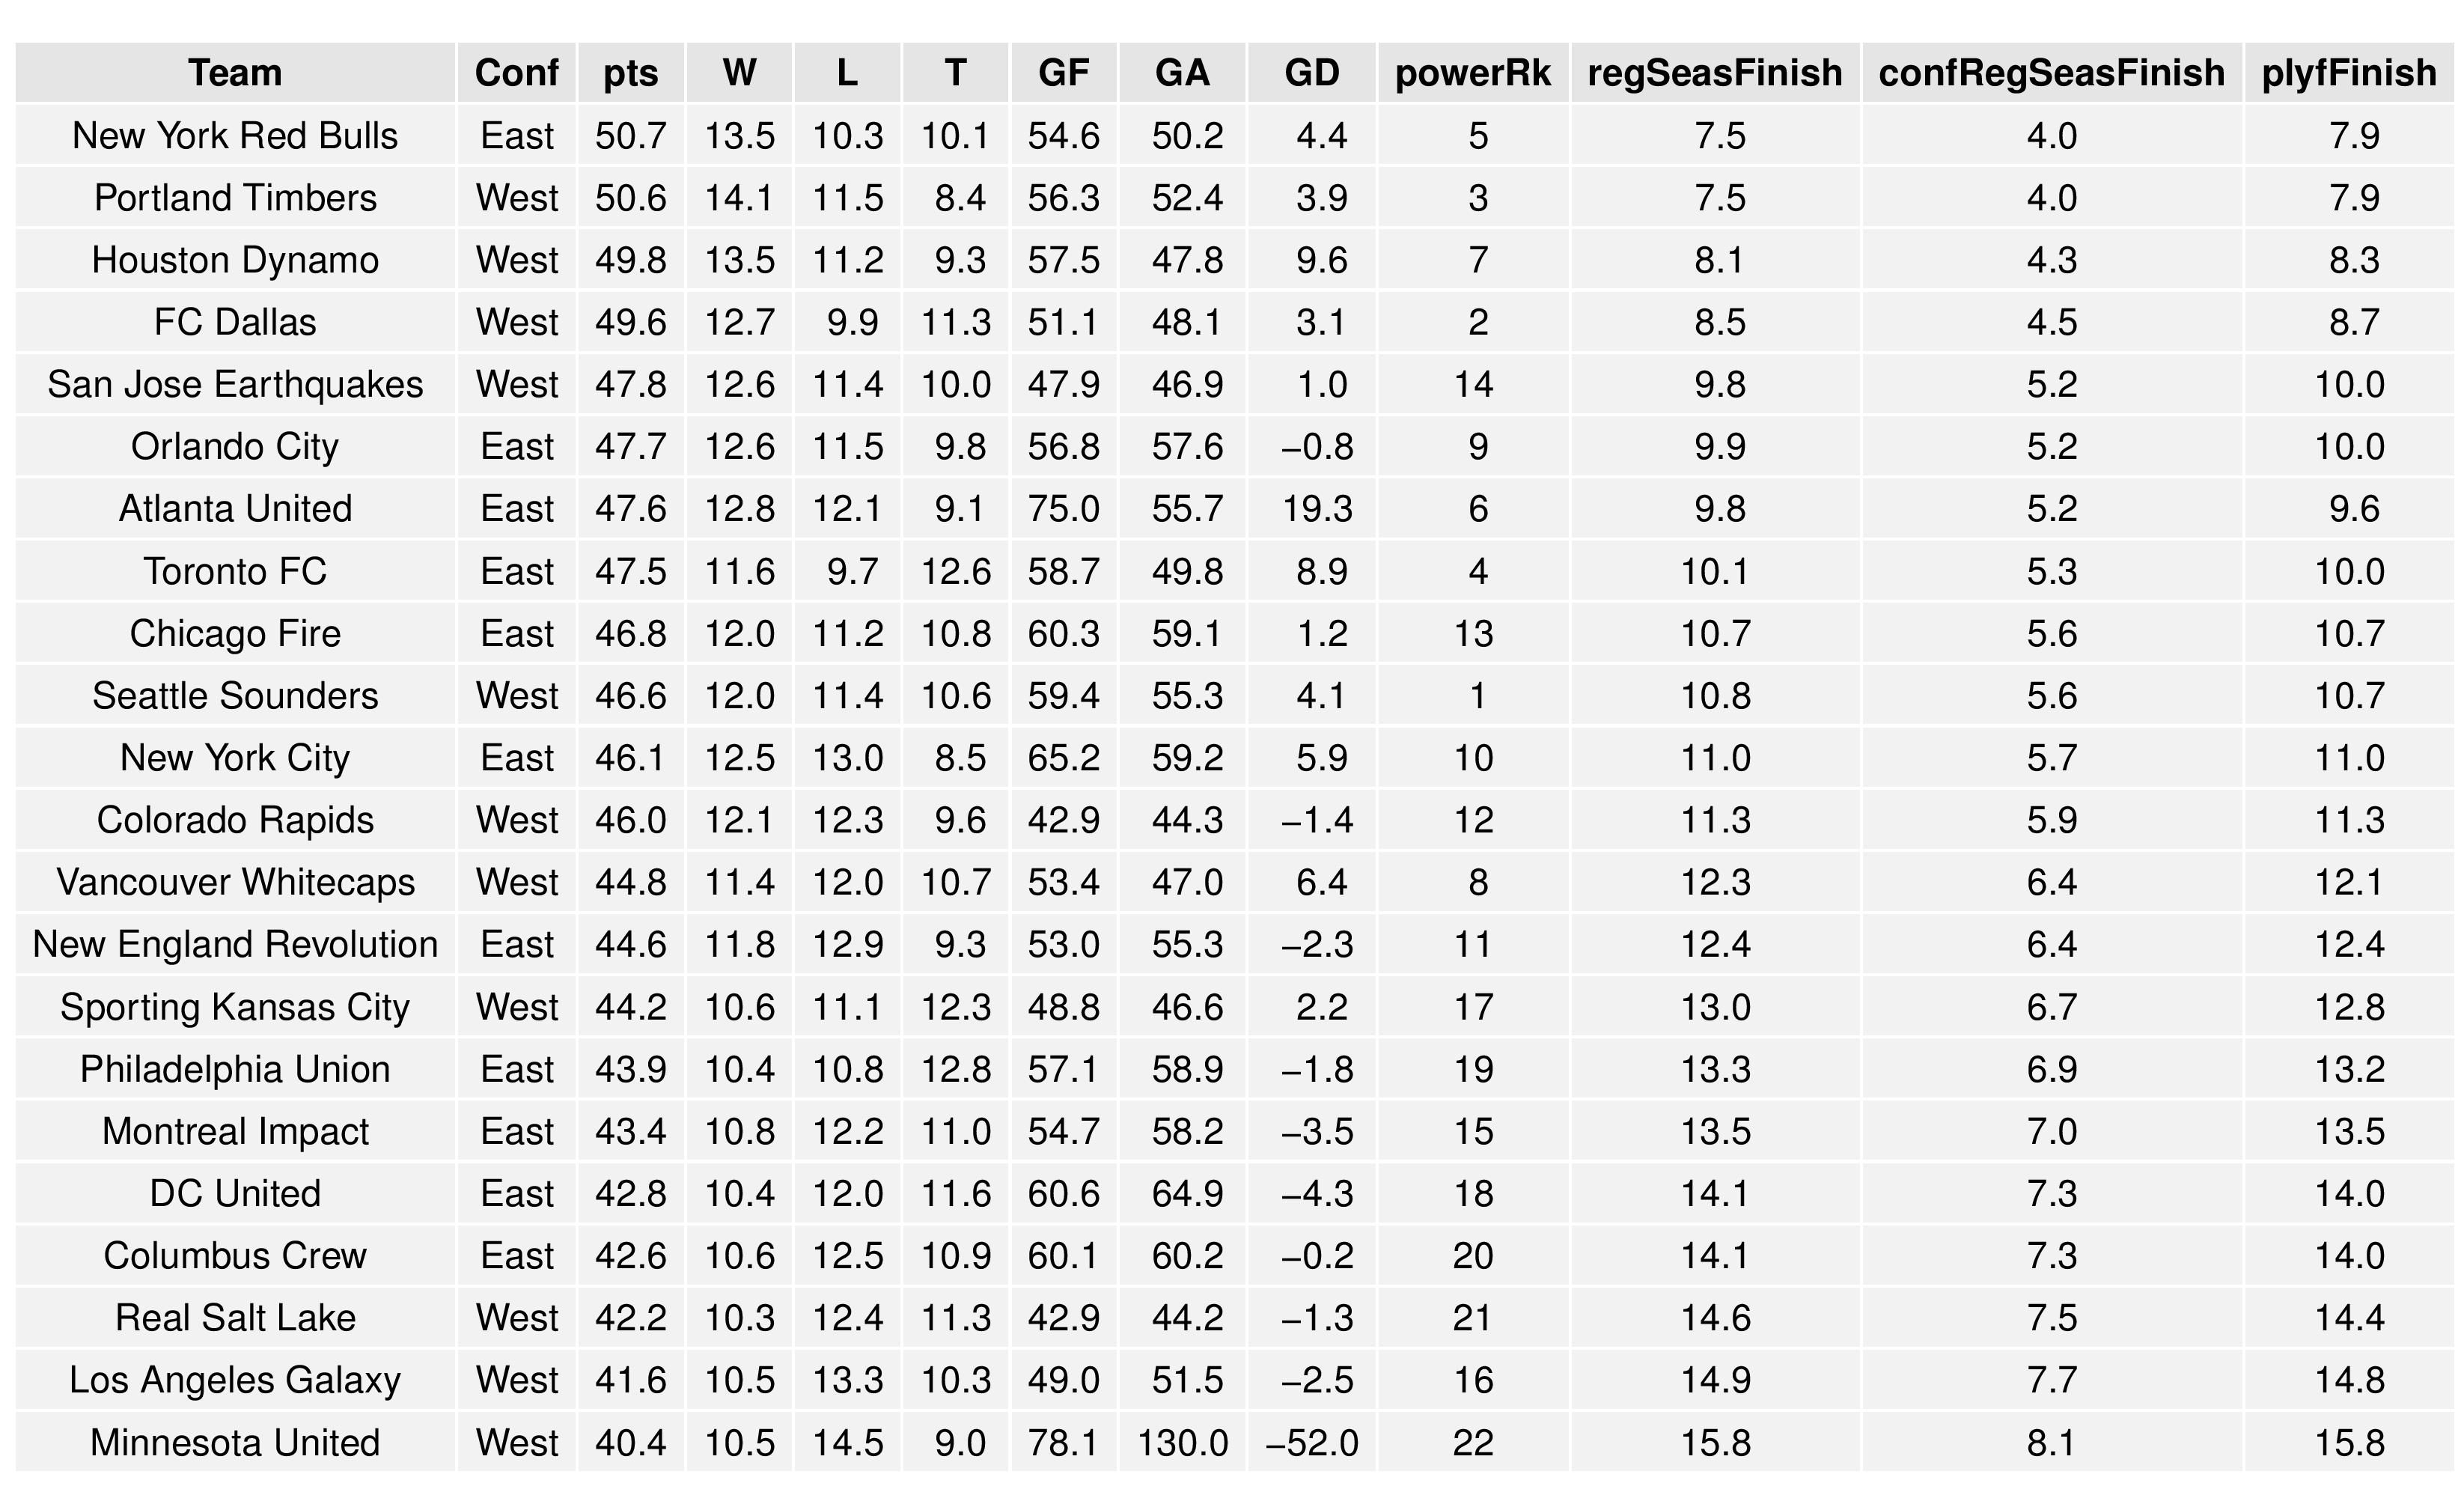
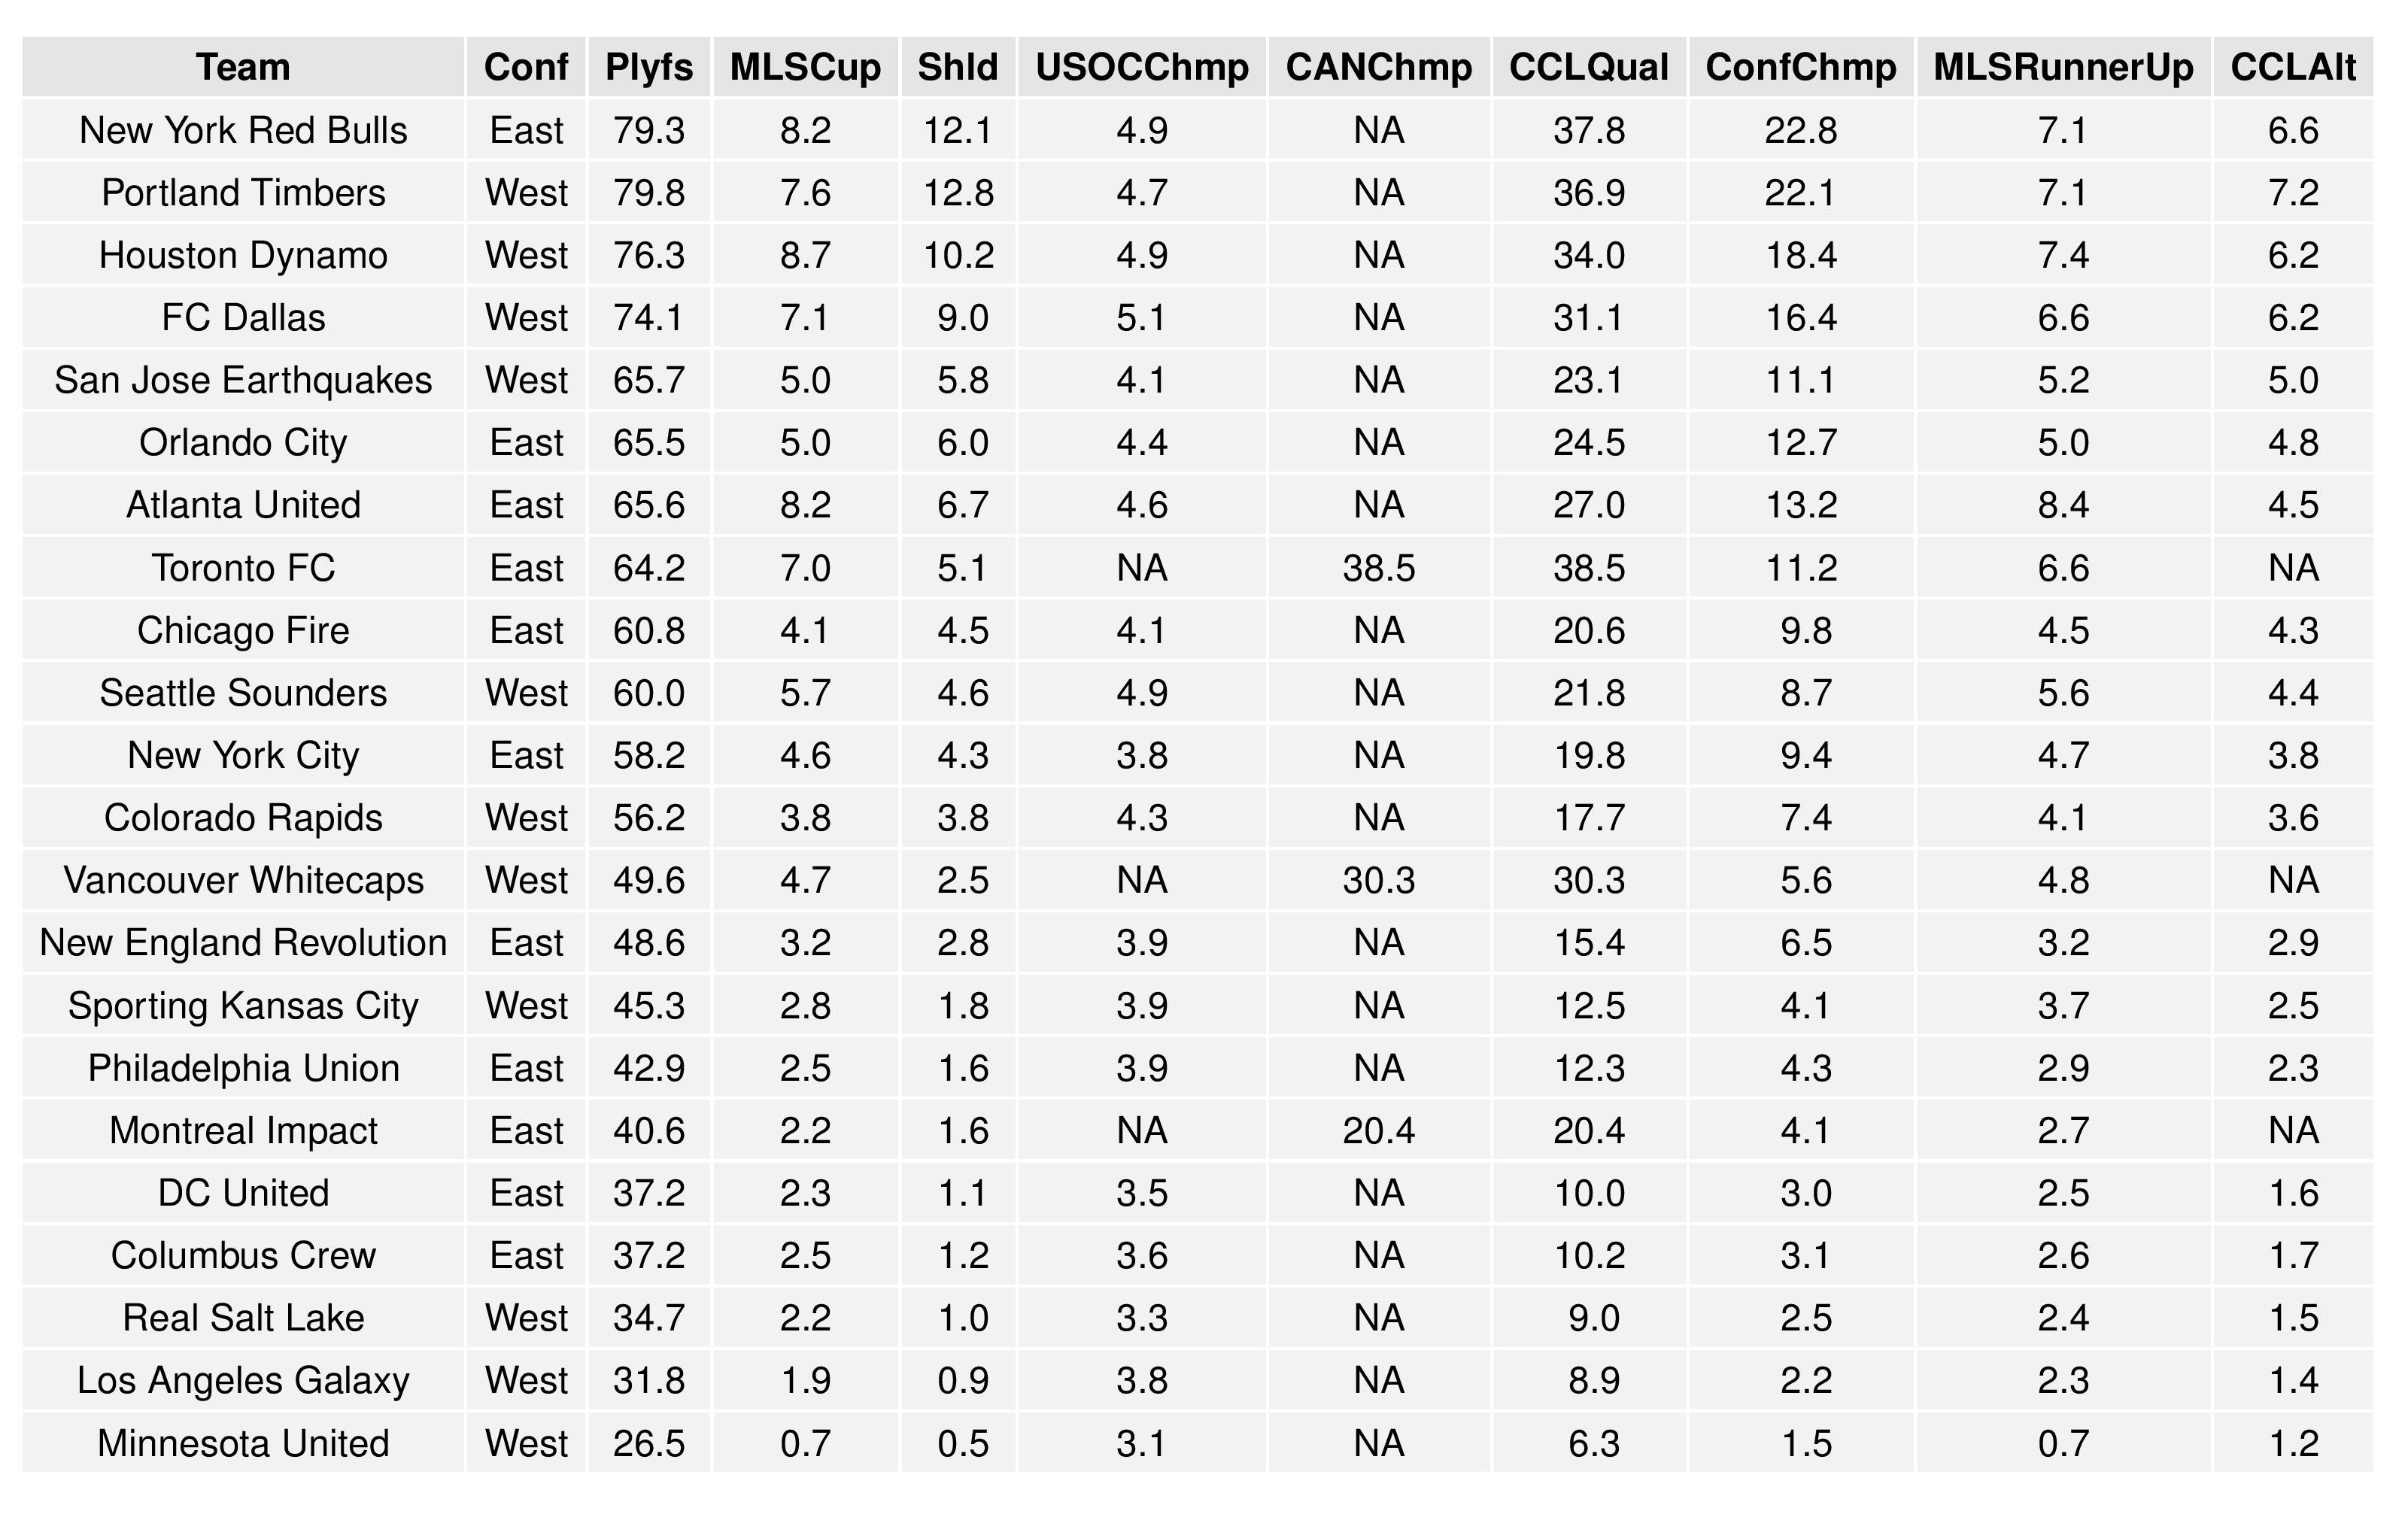
The following shows the summary of the simulations in an easy table format.
(Being expansion clubs, Minnesota’s and Atlanta’s goal data offer an extraordinarily small sample size and are therefore rather crazy at the moment. That will change soon).
Additionally, you may be wondering why power rankings don’t necessarily correspond with projected finish. While some of it is due to strength-of-schedule, there is likely another explanation making a larger contribution. As you can see from the power rankings chart earlier in the article, the model does not currently have enough evidence to judge the skill of teams as significantly different from one another. Therefore, projecting the outcome of the season is fairly reliant upon points-in-hand and home field advantage. While individual simulations can vary significantly from points-in-hand, when all sims are averaged as below, they are more likely to value the points-in-hand. At the moment, some clubs who are deemed worse have obtained points-in-hand, particularly in comparison to their home-field-advantage-expectations.
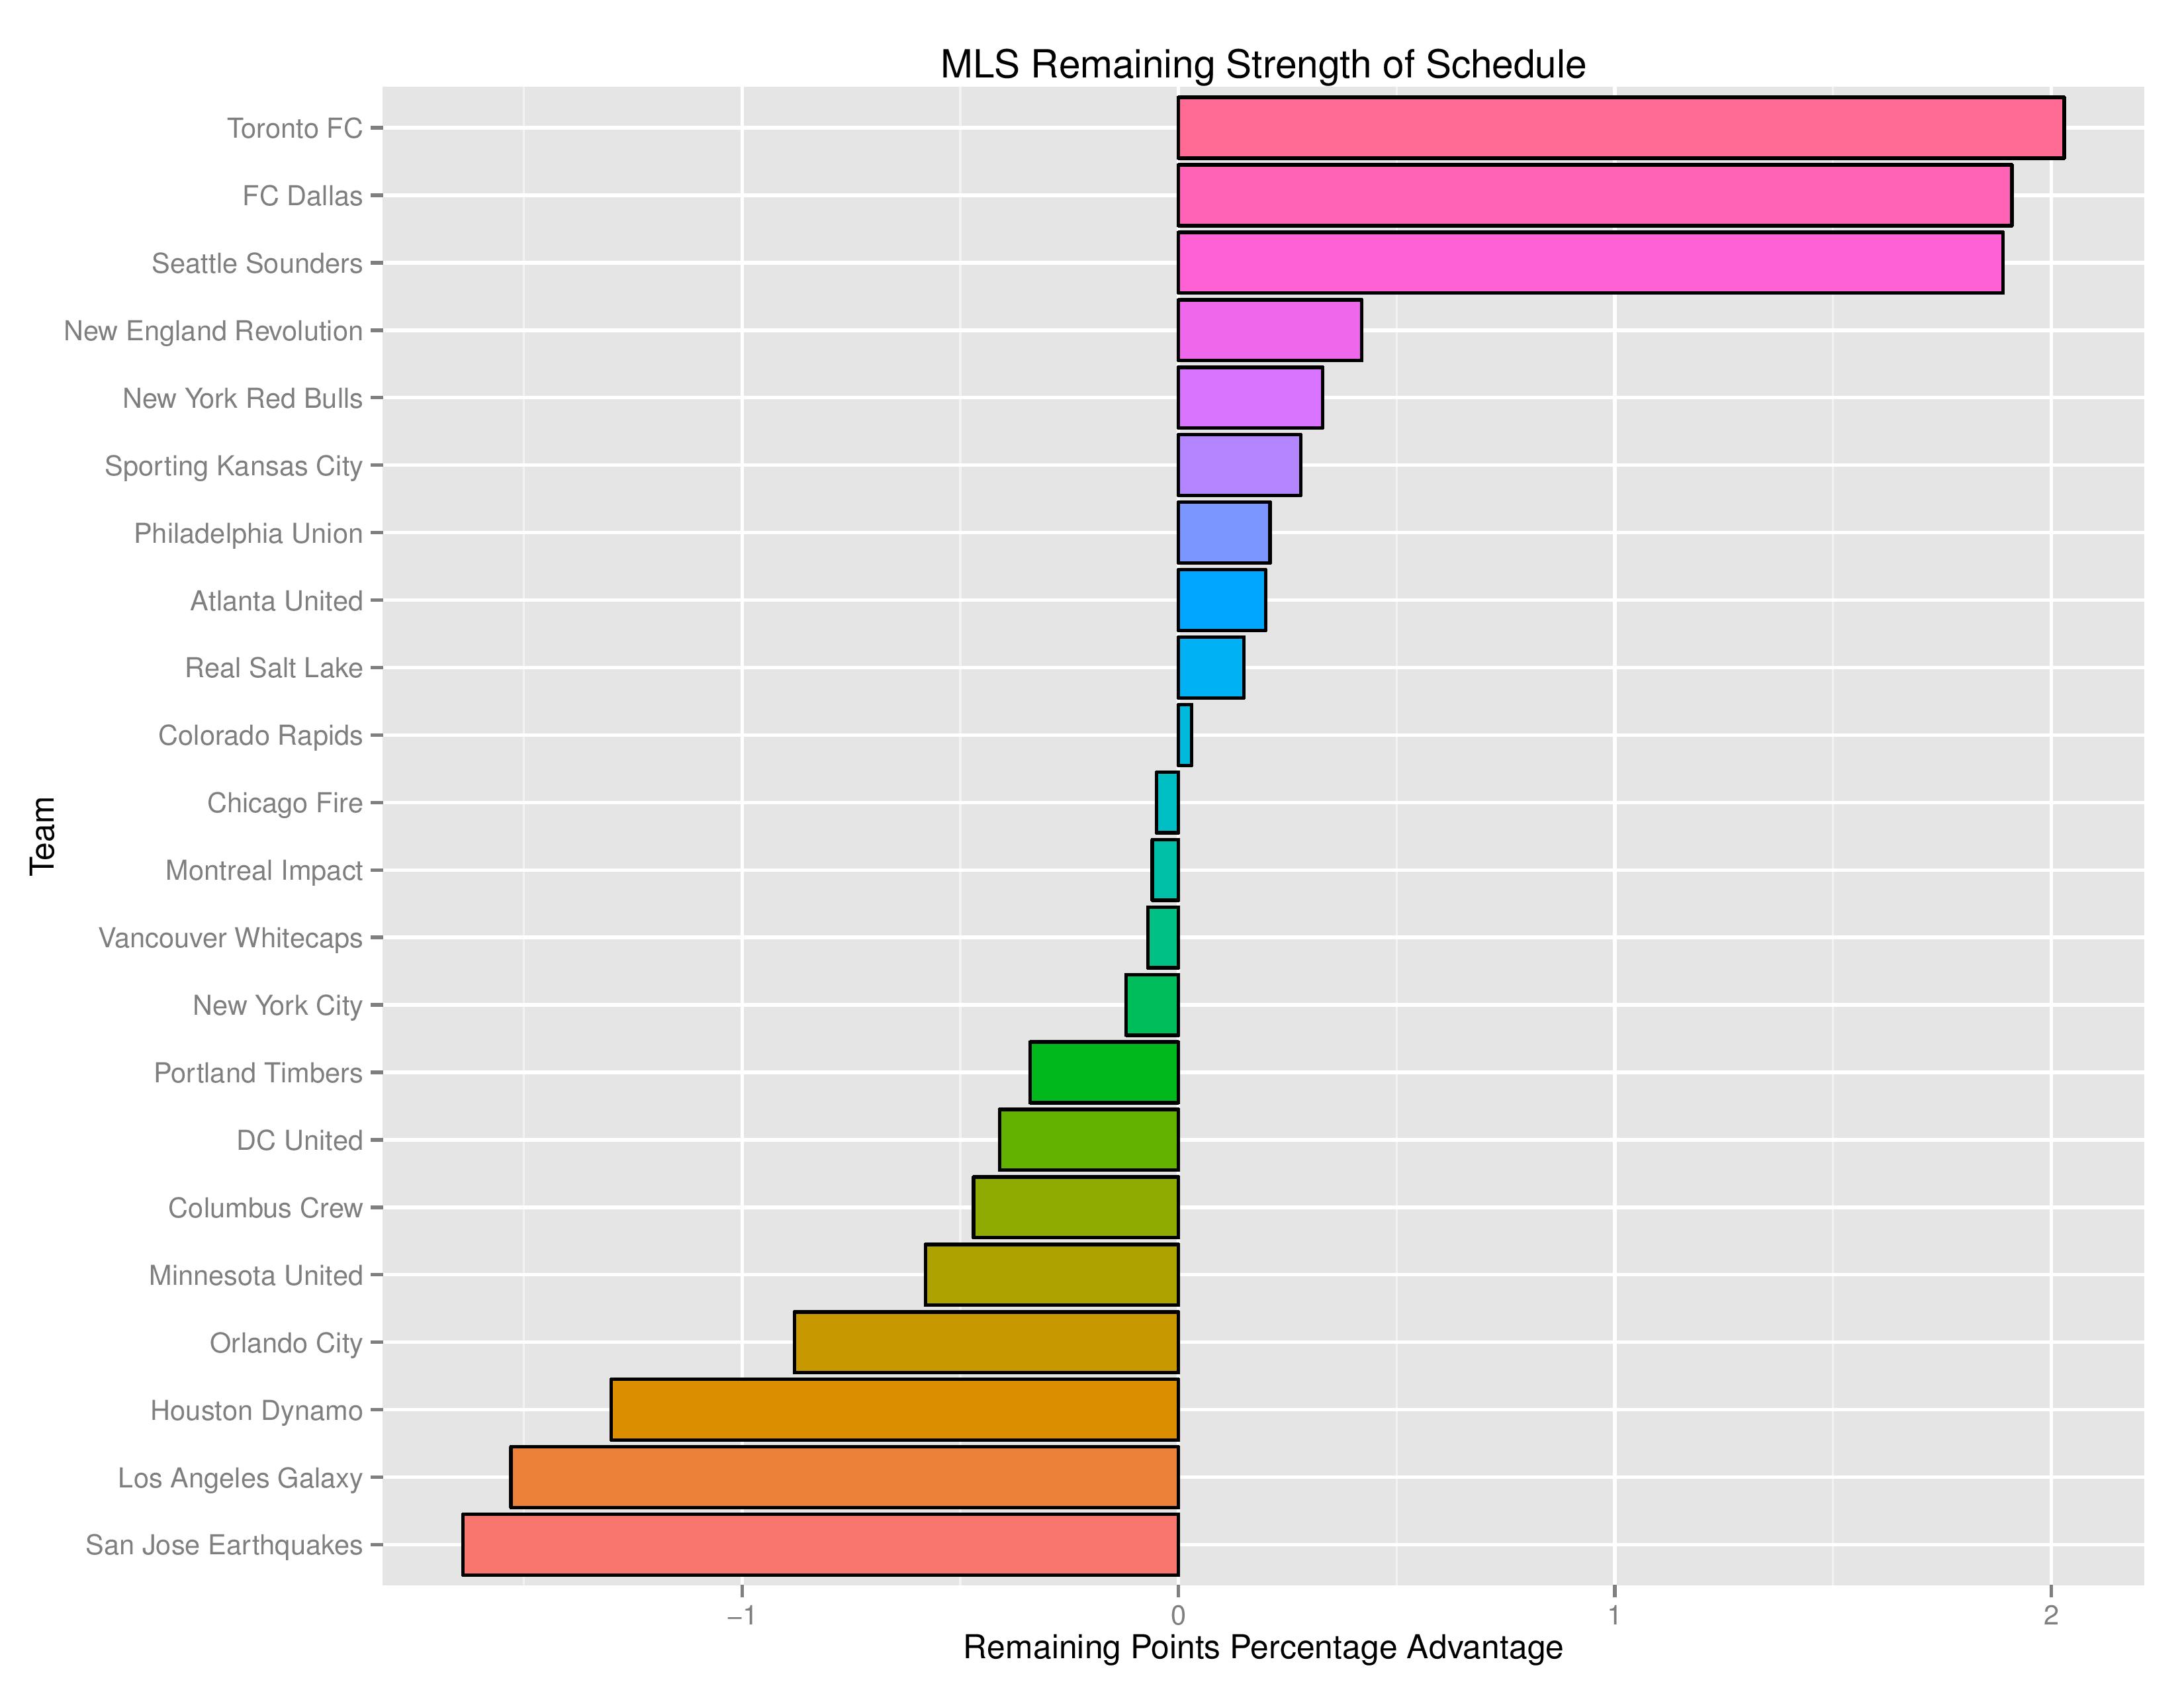
As a new feature, we can also show how the Remaining Strength of Schedule affects each team.
The “Points Percentage Advantage” shown on the X-axis represents the percentage of points expected over the league average schedule. This “points expected” value is generated by simulating how all teams would perform with all remaining schedules (and therefore judges a schedule based upon how all teams would perform in that scenario).
In short, the higher the value, the easier the remaining schedule.
Remaining home field advantage will make a large contribution here. It can also be true that a better team has an ‘easier’ schedule simply because they do not have to play themselves, which would be the case of Toronto. Likewise, a bad team like Minnesota may have a ‘harder’ schedule because they also do not play themselves.
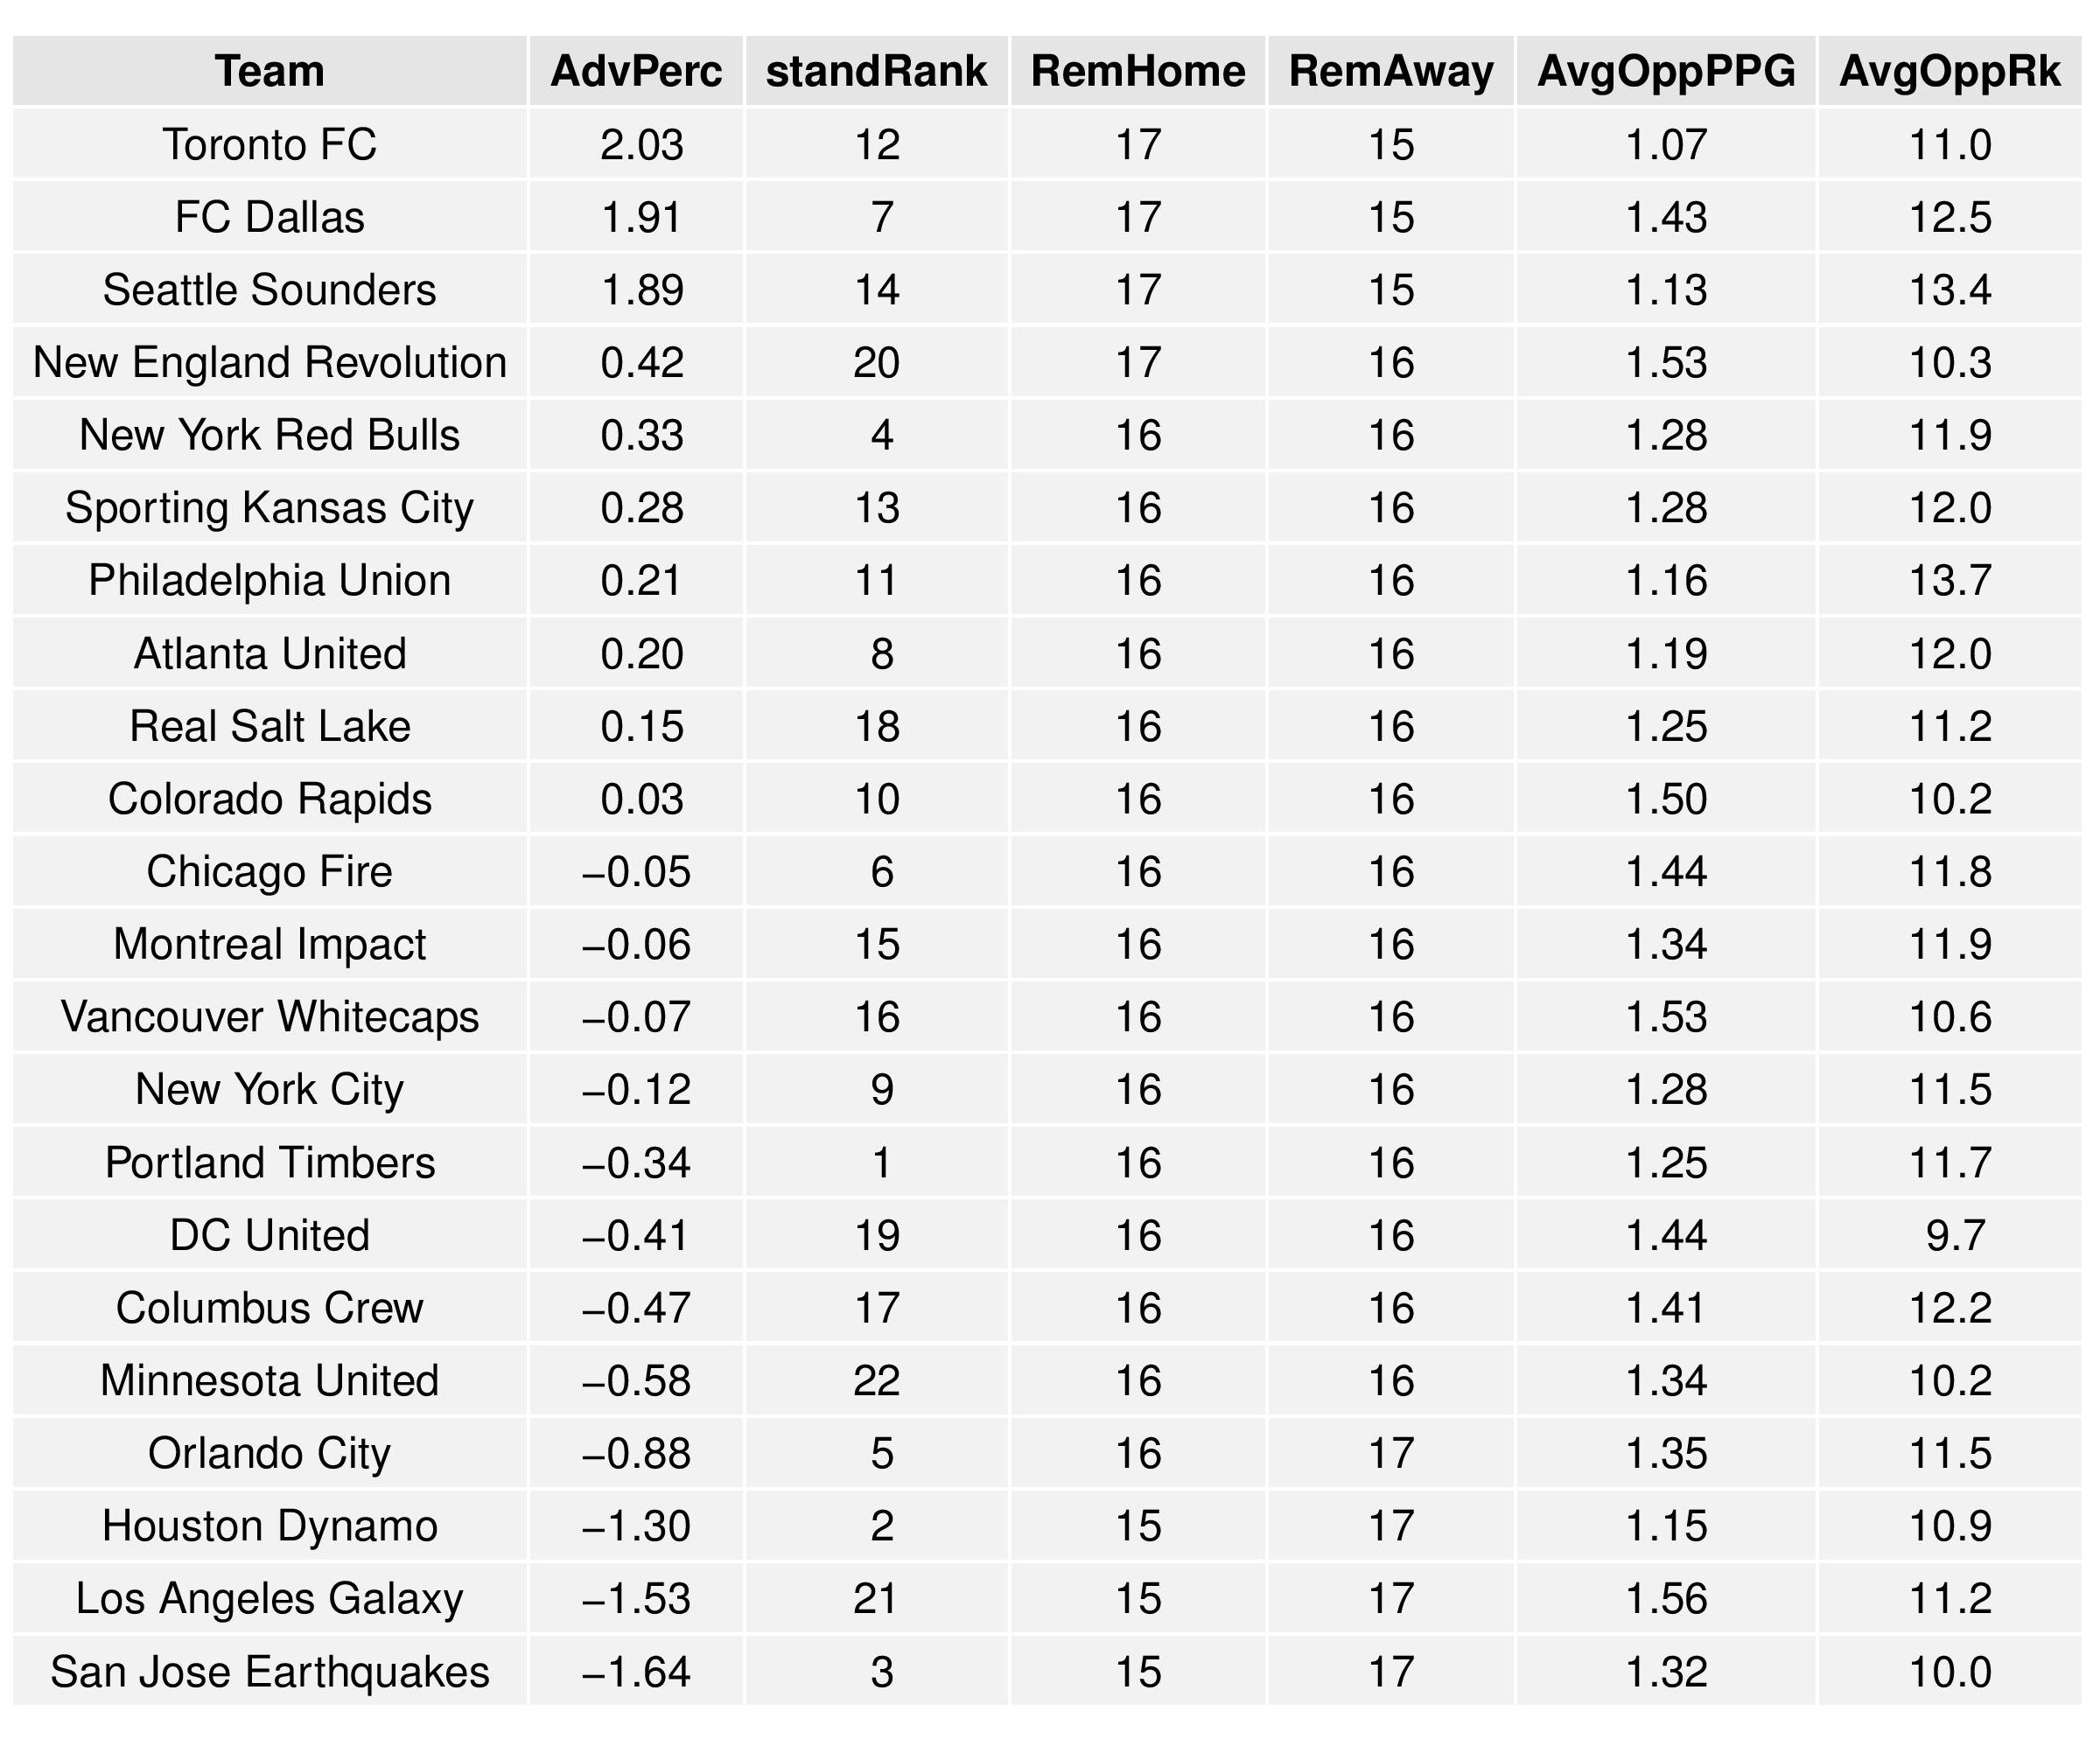
The table following the chart also shares helpful context with these percentages.
Accompanying the advantage percentage in the following table is their current standings rank (right now ties are not properly calculated; I’ll fix that), the remaining home matches, the remaining away matches, the current average points-per-game of future opponents (results-based, not model-based), and the average power ranking of future opponents according to SEBA.
In the future, I may try to do an ‘Overall’ (past and future) strength of schedule, however, given that our model now discounts matches held earlier in the season as well as those with a roster that differs from the current one being employed, this may not be straightforward.
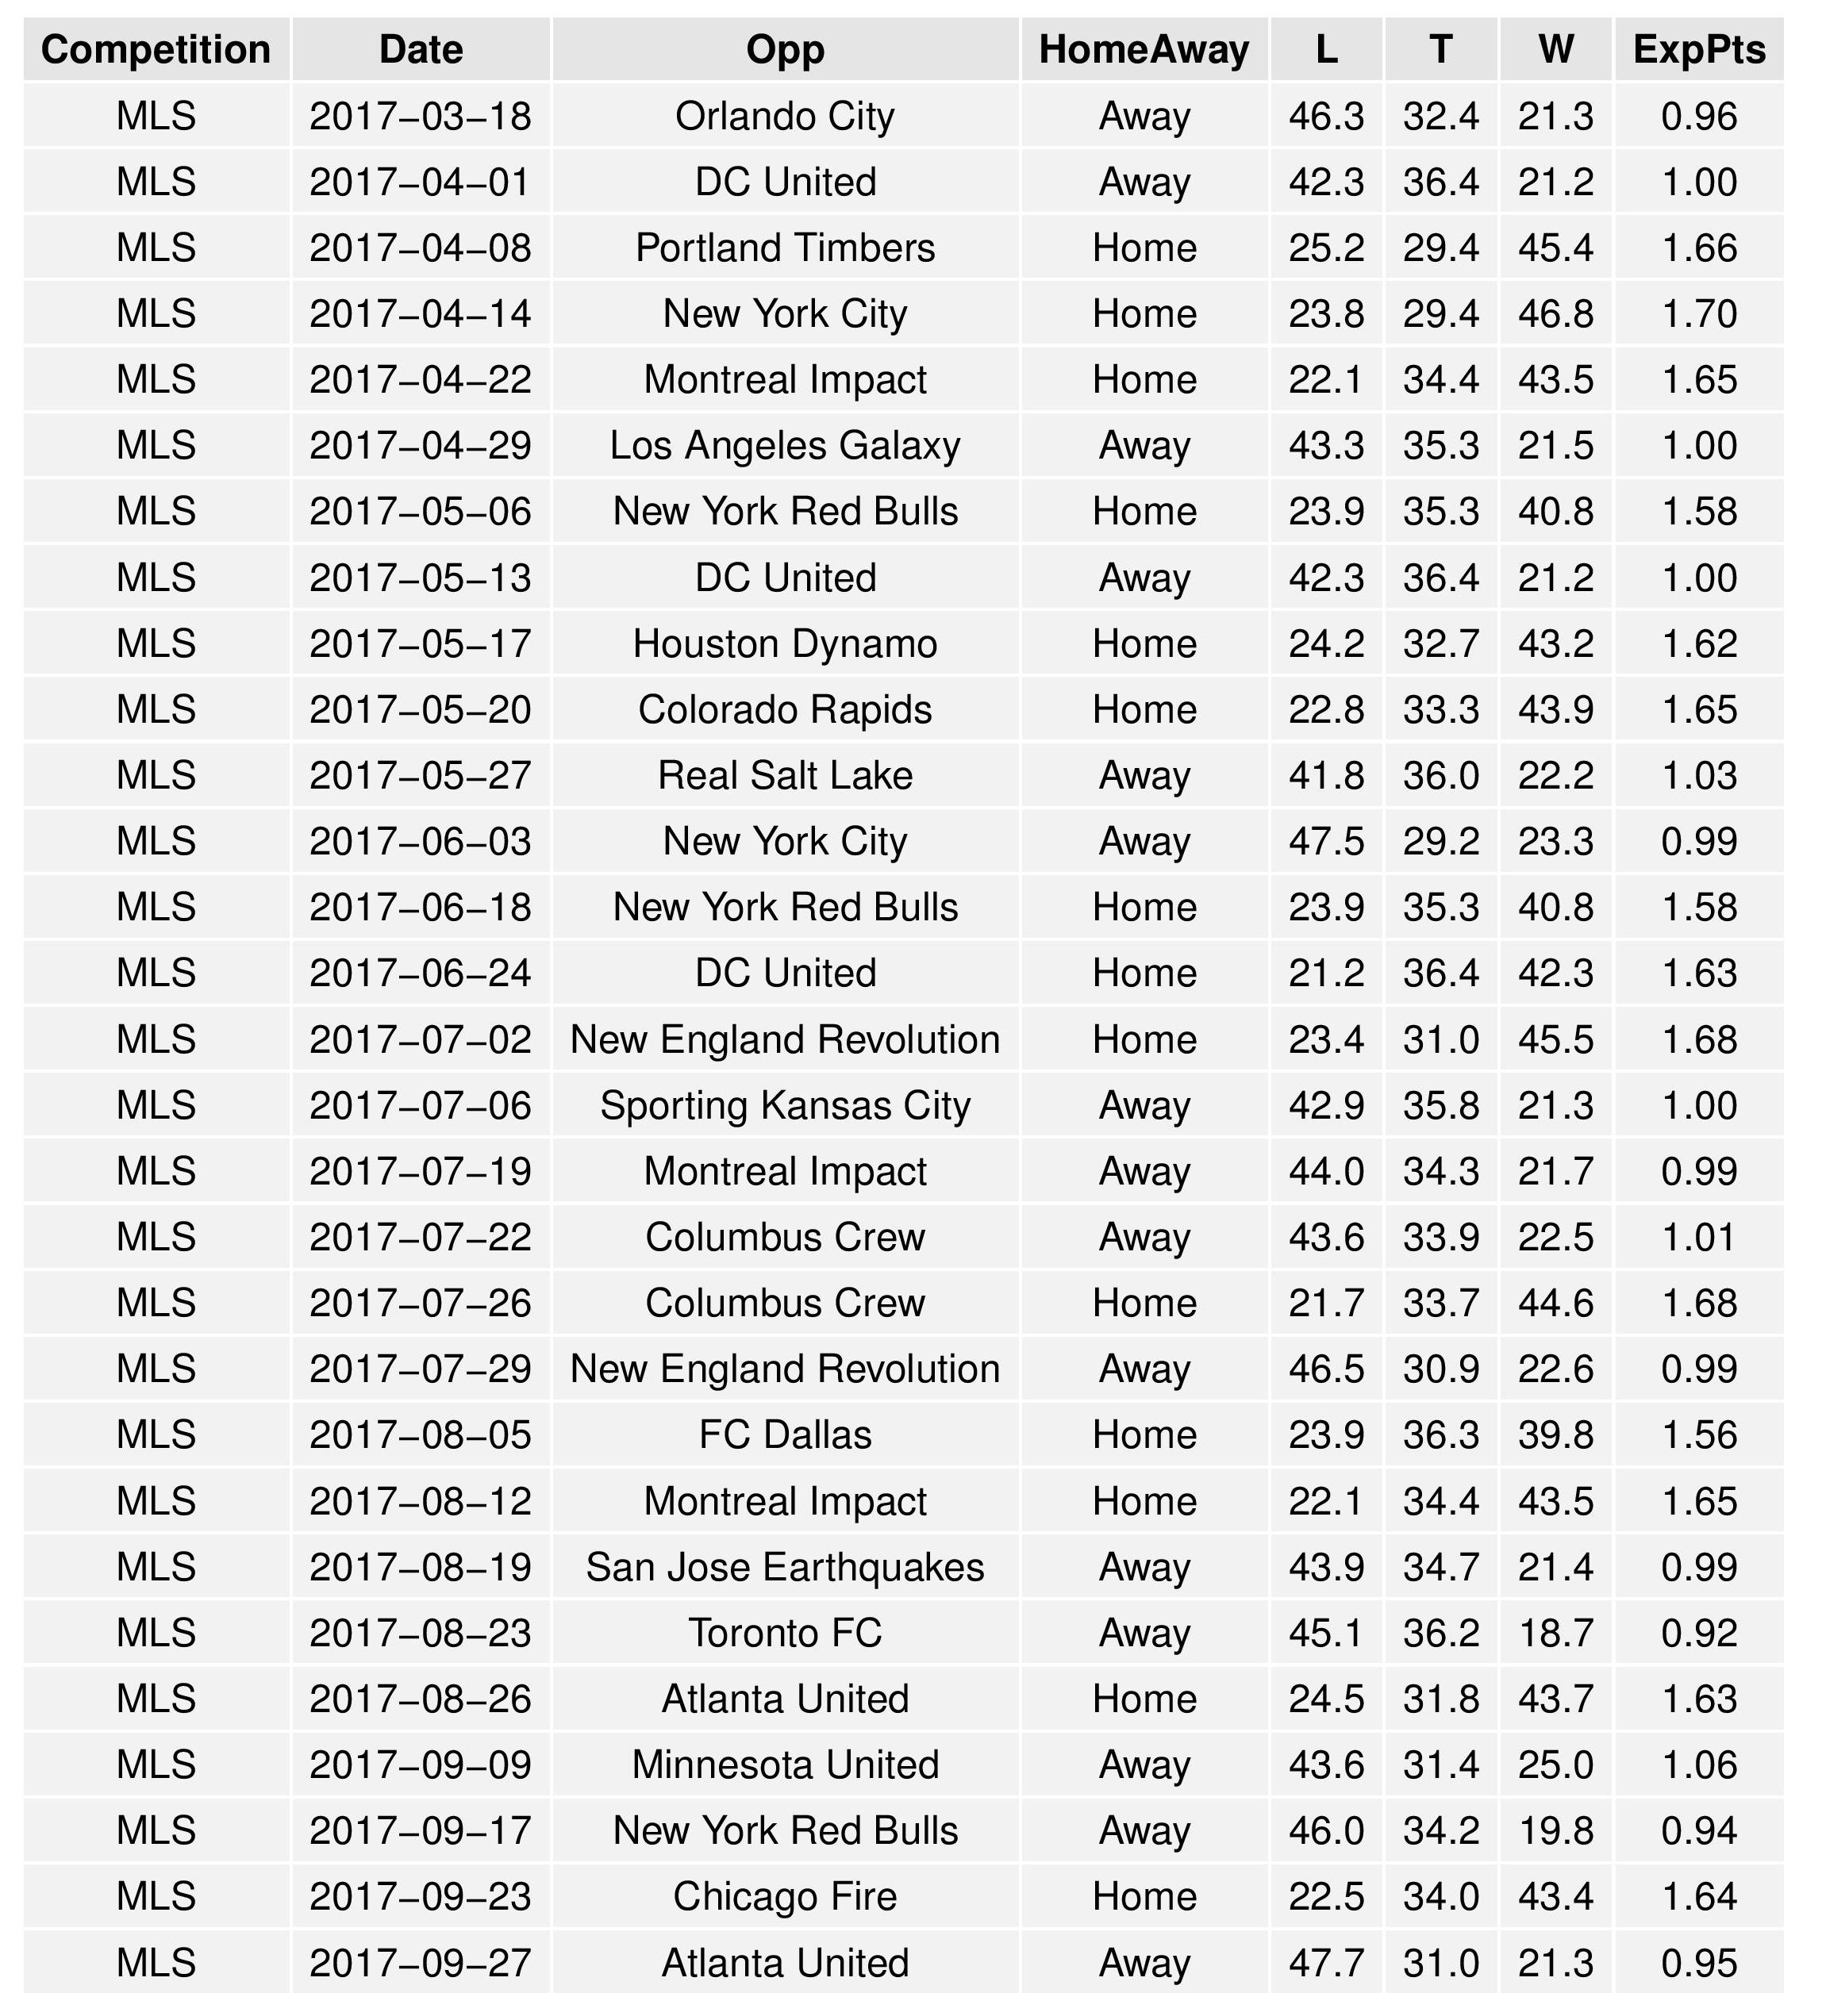
The following shows the expectations for upcoming Philadelphia matches:
USL
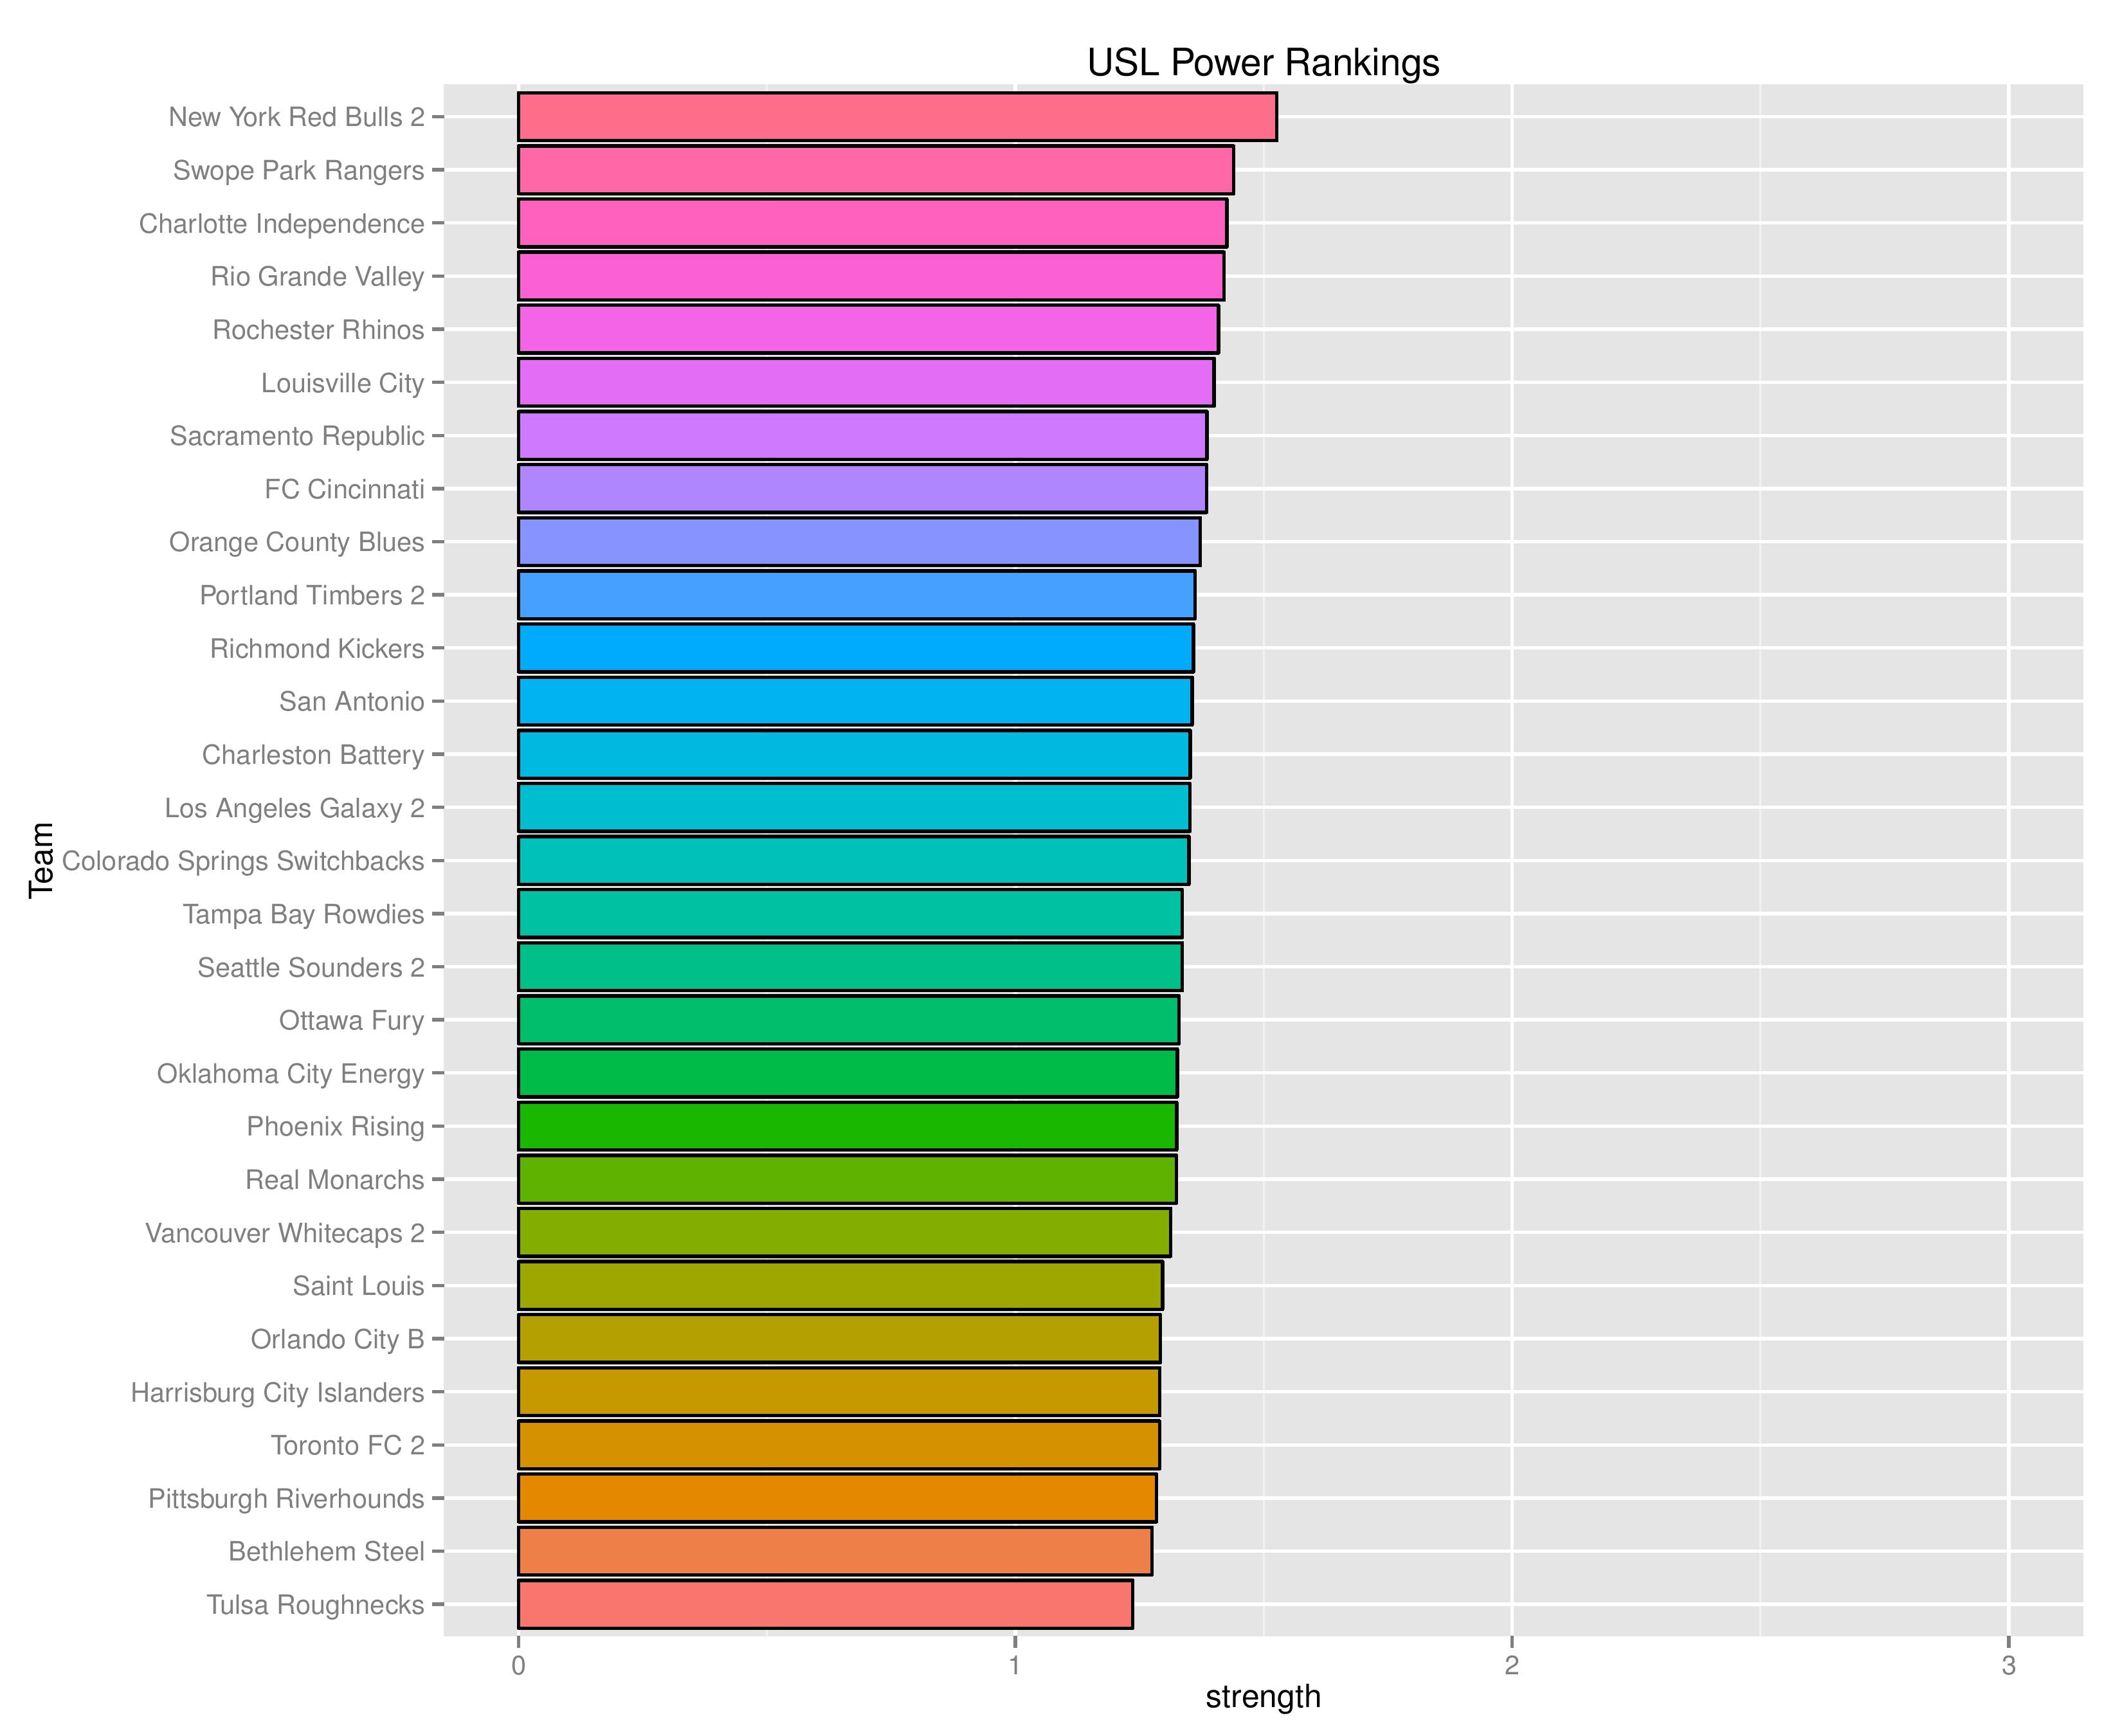
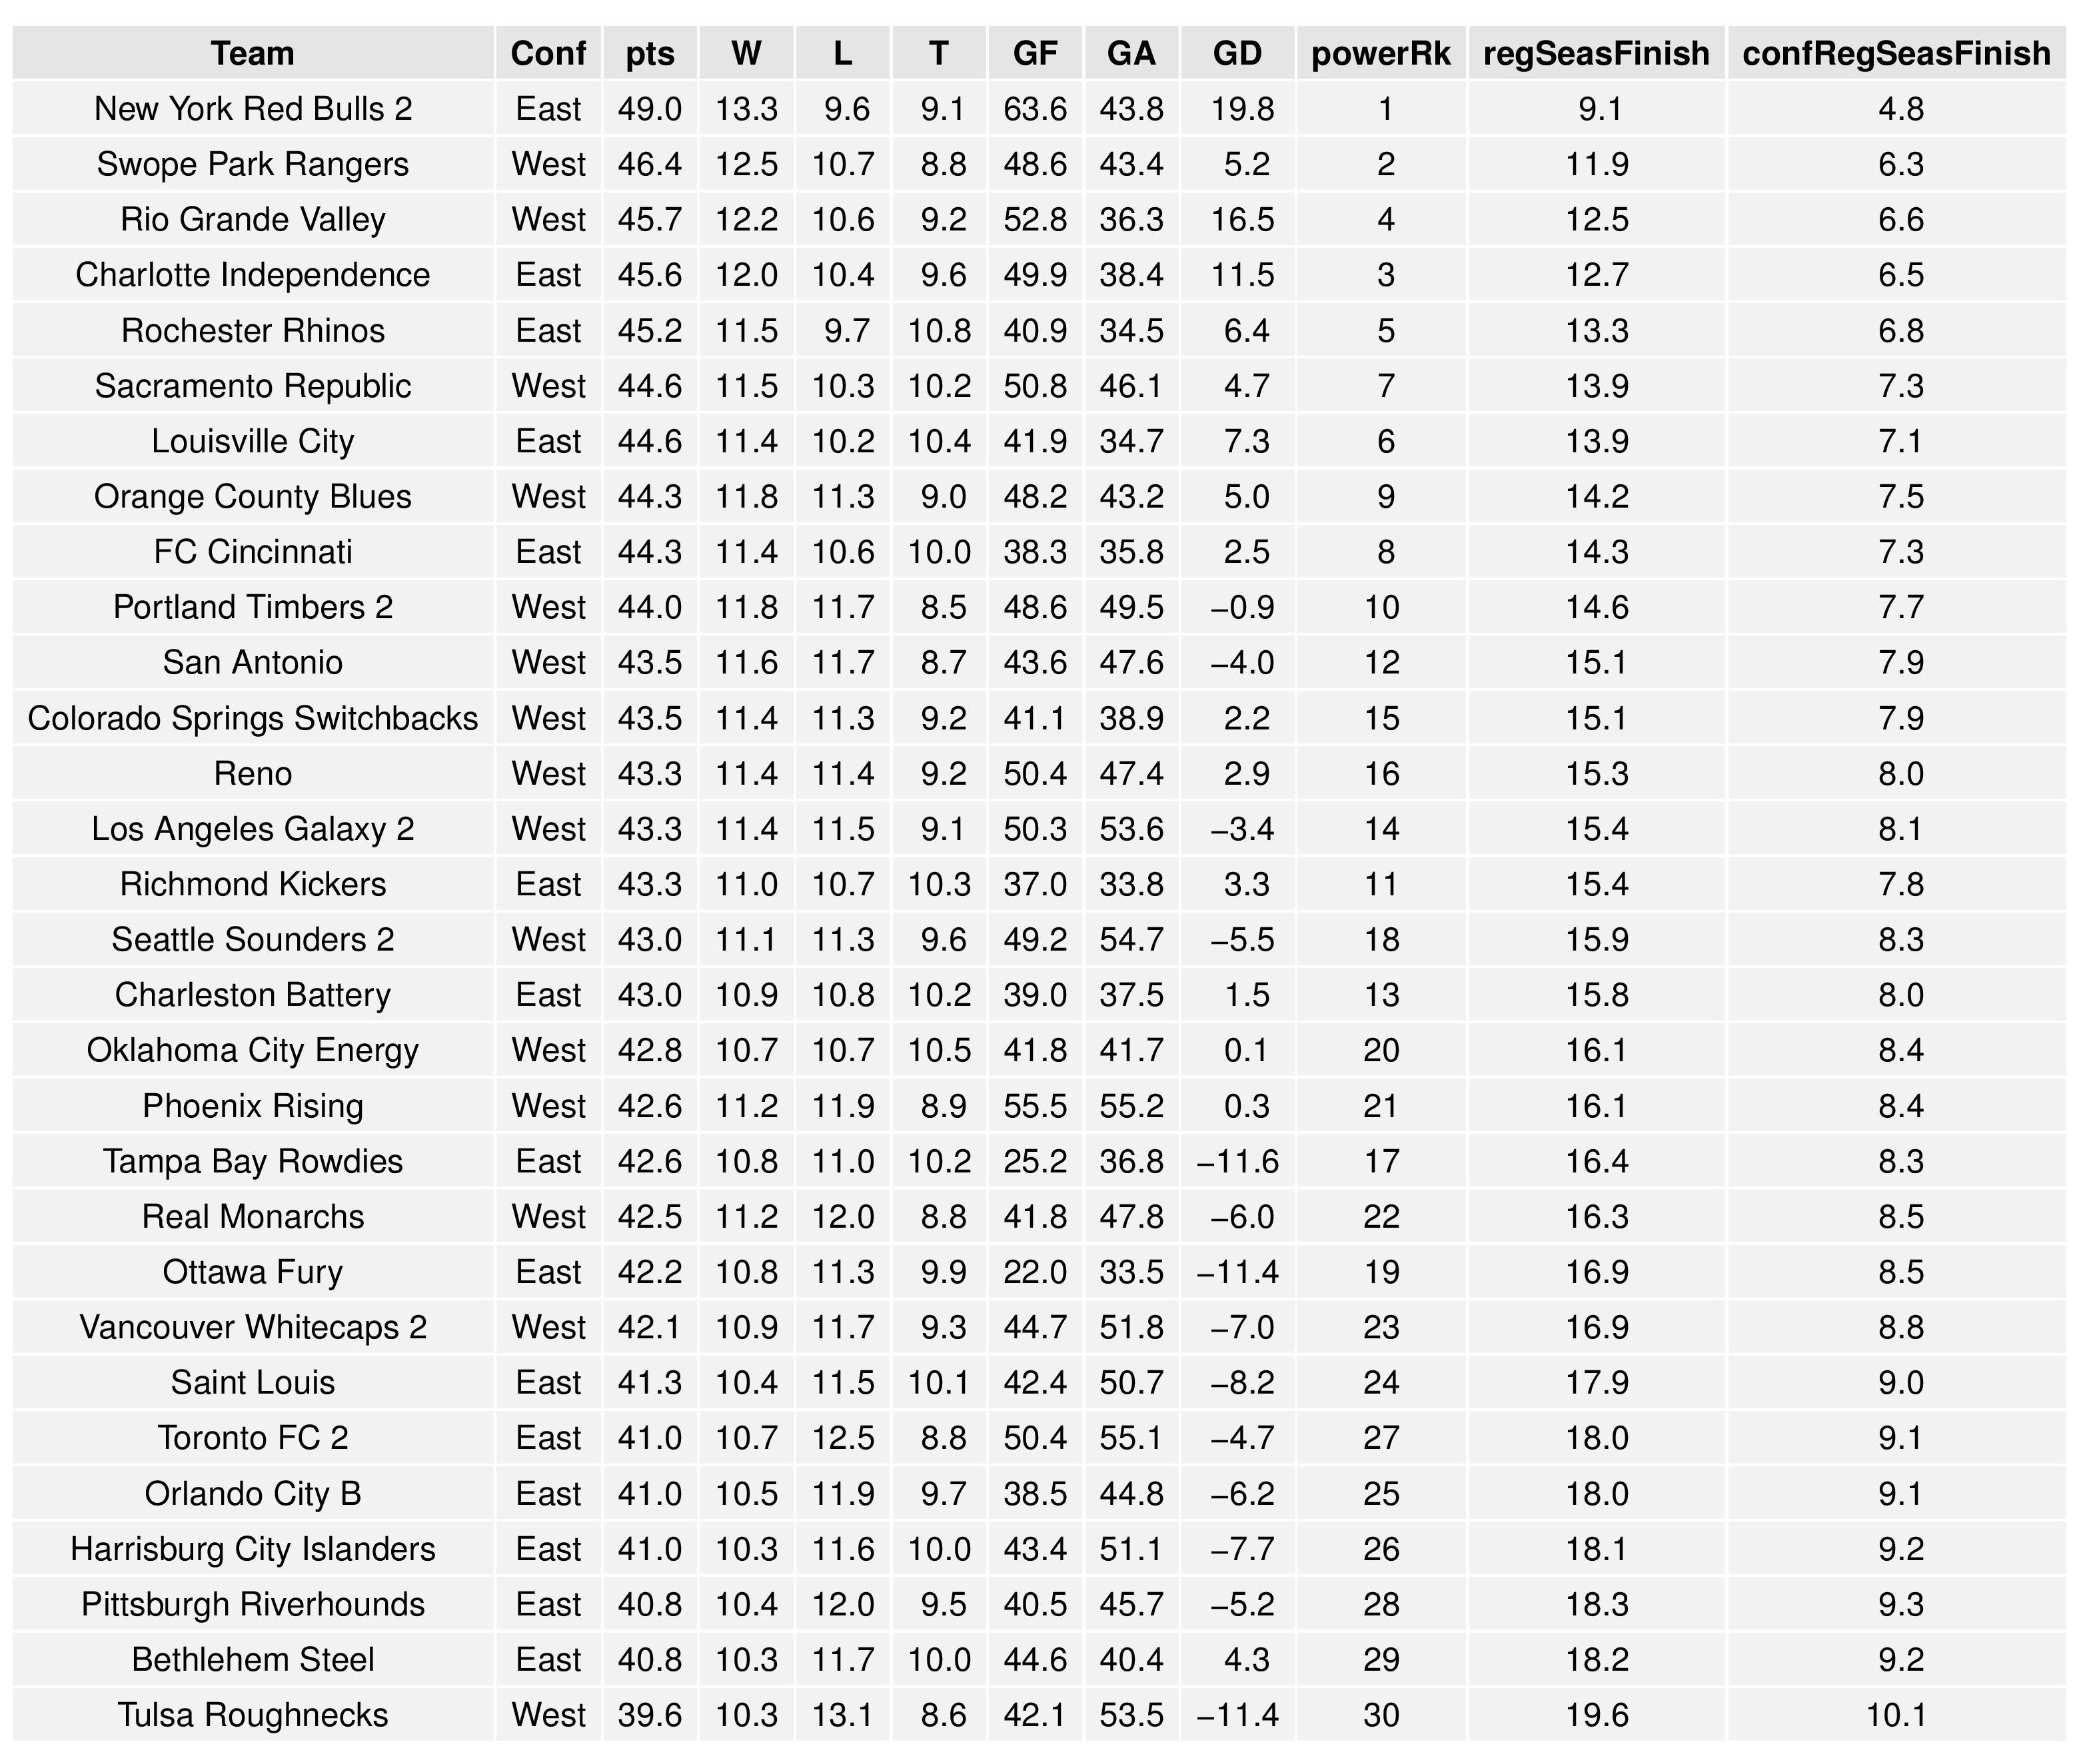
Power Rankings
SEBA has Bethlehem Steel begin the season in 29th. It has Harrisburg City in 26th. These are currently based entirely off of 2016 results (and skewed towards the end, as well).
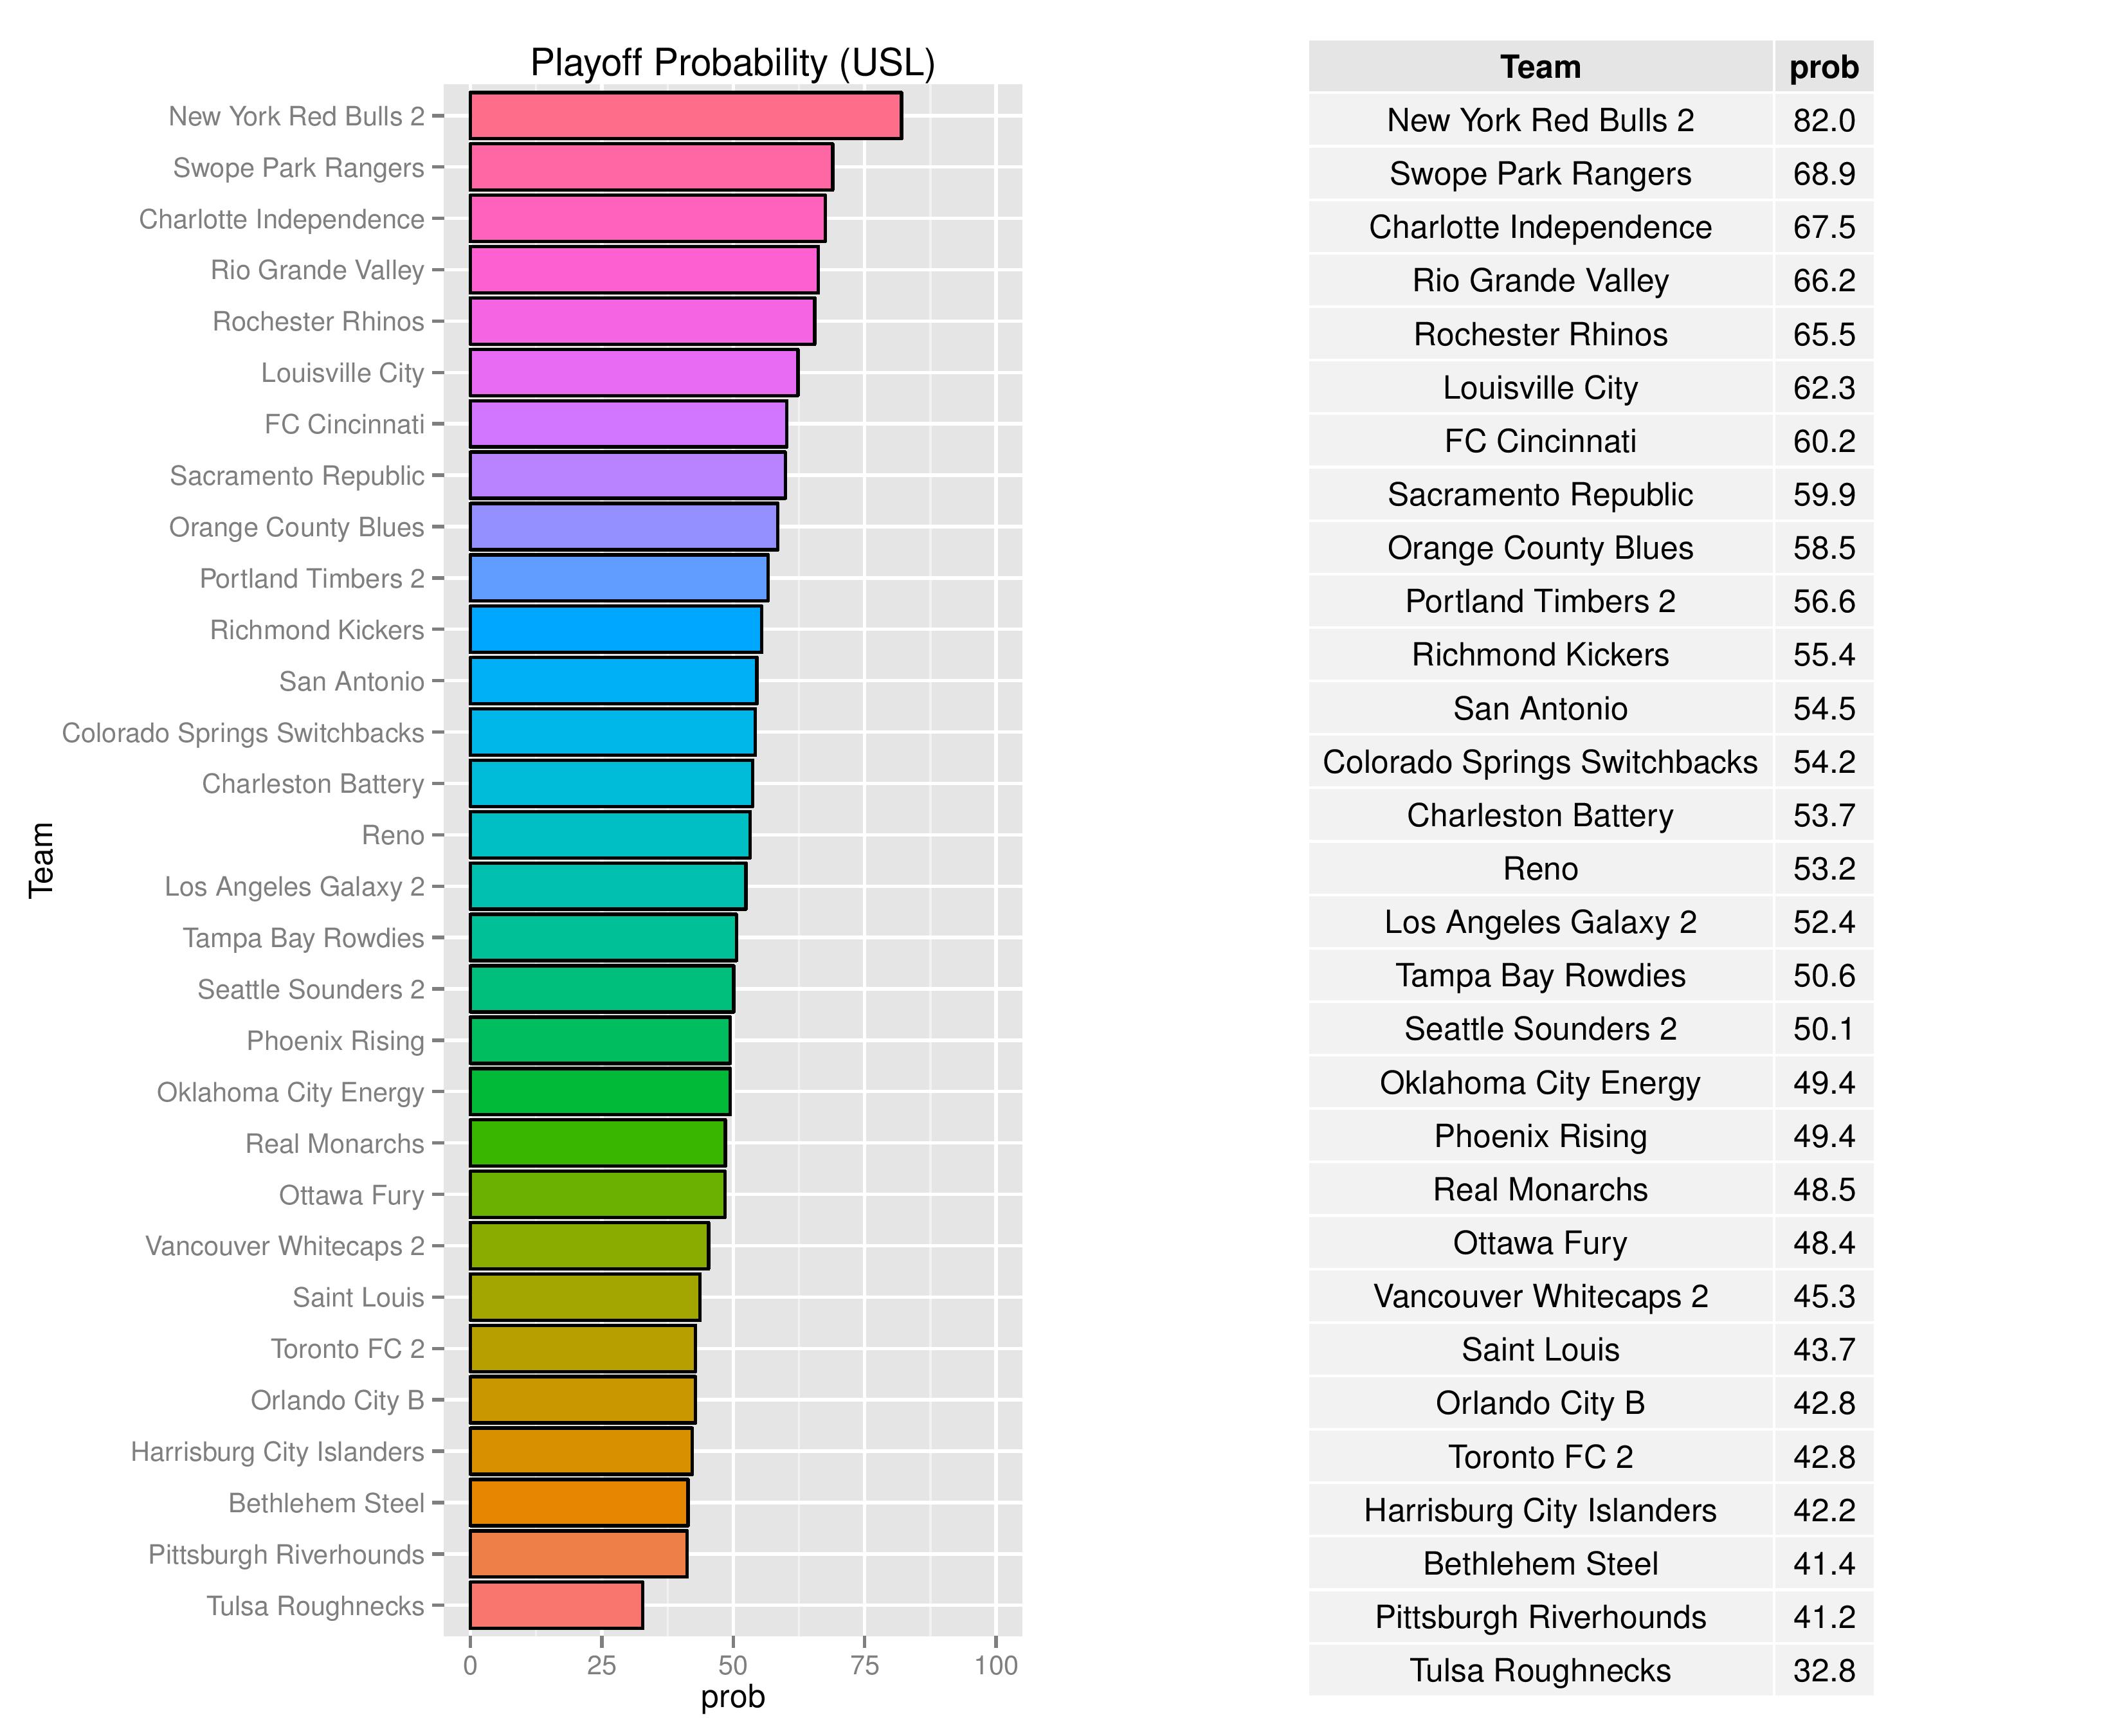
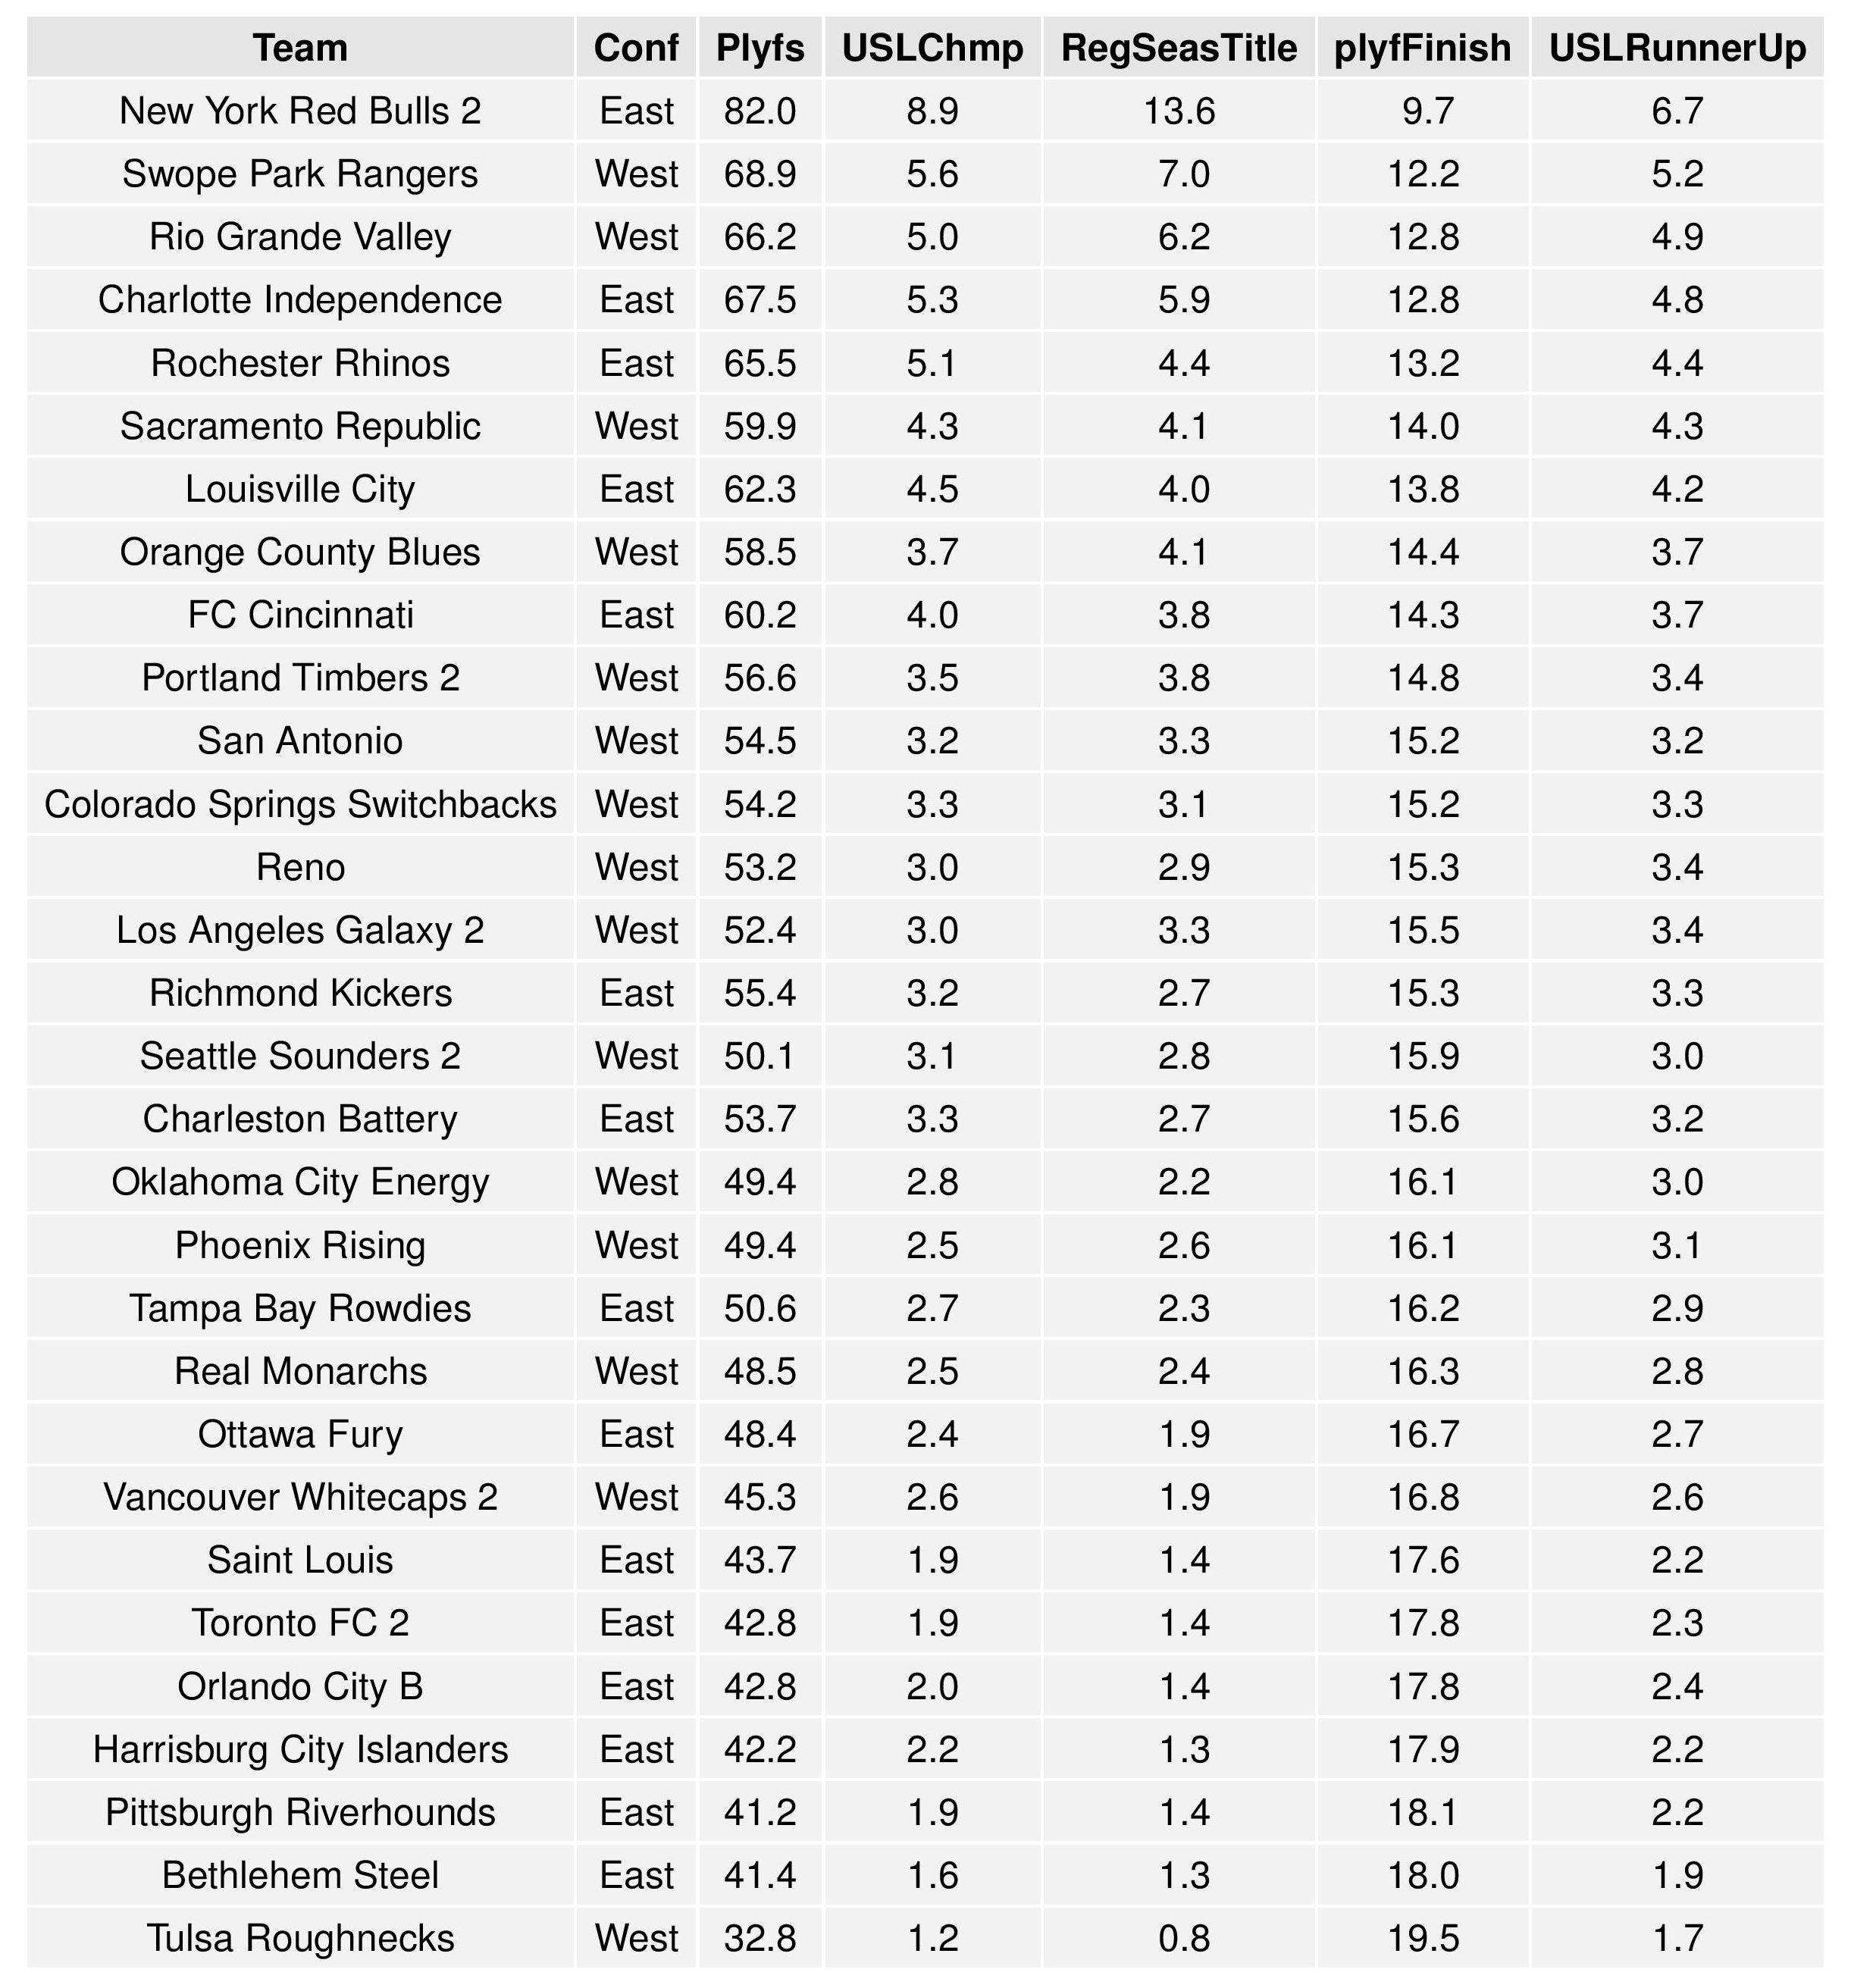
Playoffs probability and more
It should be noted with all of the USL forecast, that the model is the same as the MLS model (as teams from different leagues do compete against one another). Therefore, unlike with the preseason MLS forecast, I am not able to manually constrain the model’s parameters to avoid drawing bolder conclusions upon existing (2016) data in a different way than MLS clubs (which now have 2017 data to draw upon). As a result, some of these projections will be a bit bolder than we can reasonably expect given the data at hand. This will correct itself as we get new USL data, but it is worth calling out.
Bethlehem’s playoff odds begin at 41.4% and Harrisburg City’s odds start at 42.4% in making the playoffs.
Bethlehem’s chances at winning the Regular Season Title is at 1.3% with Harrisburg City also at 1.3%.

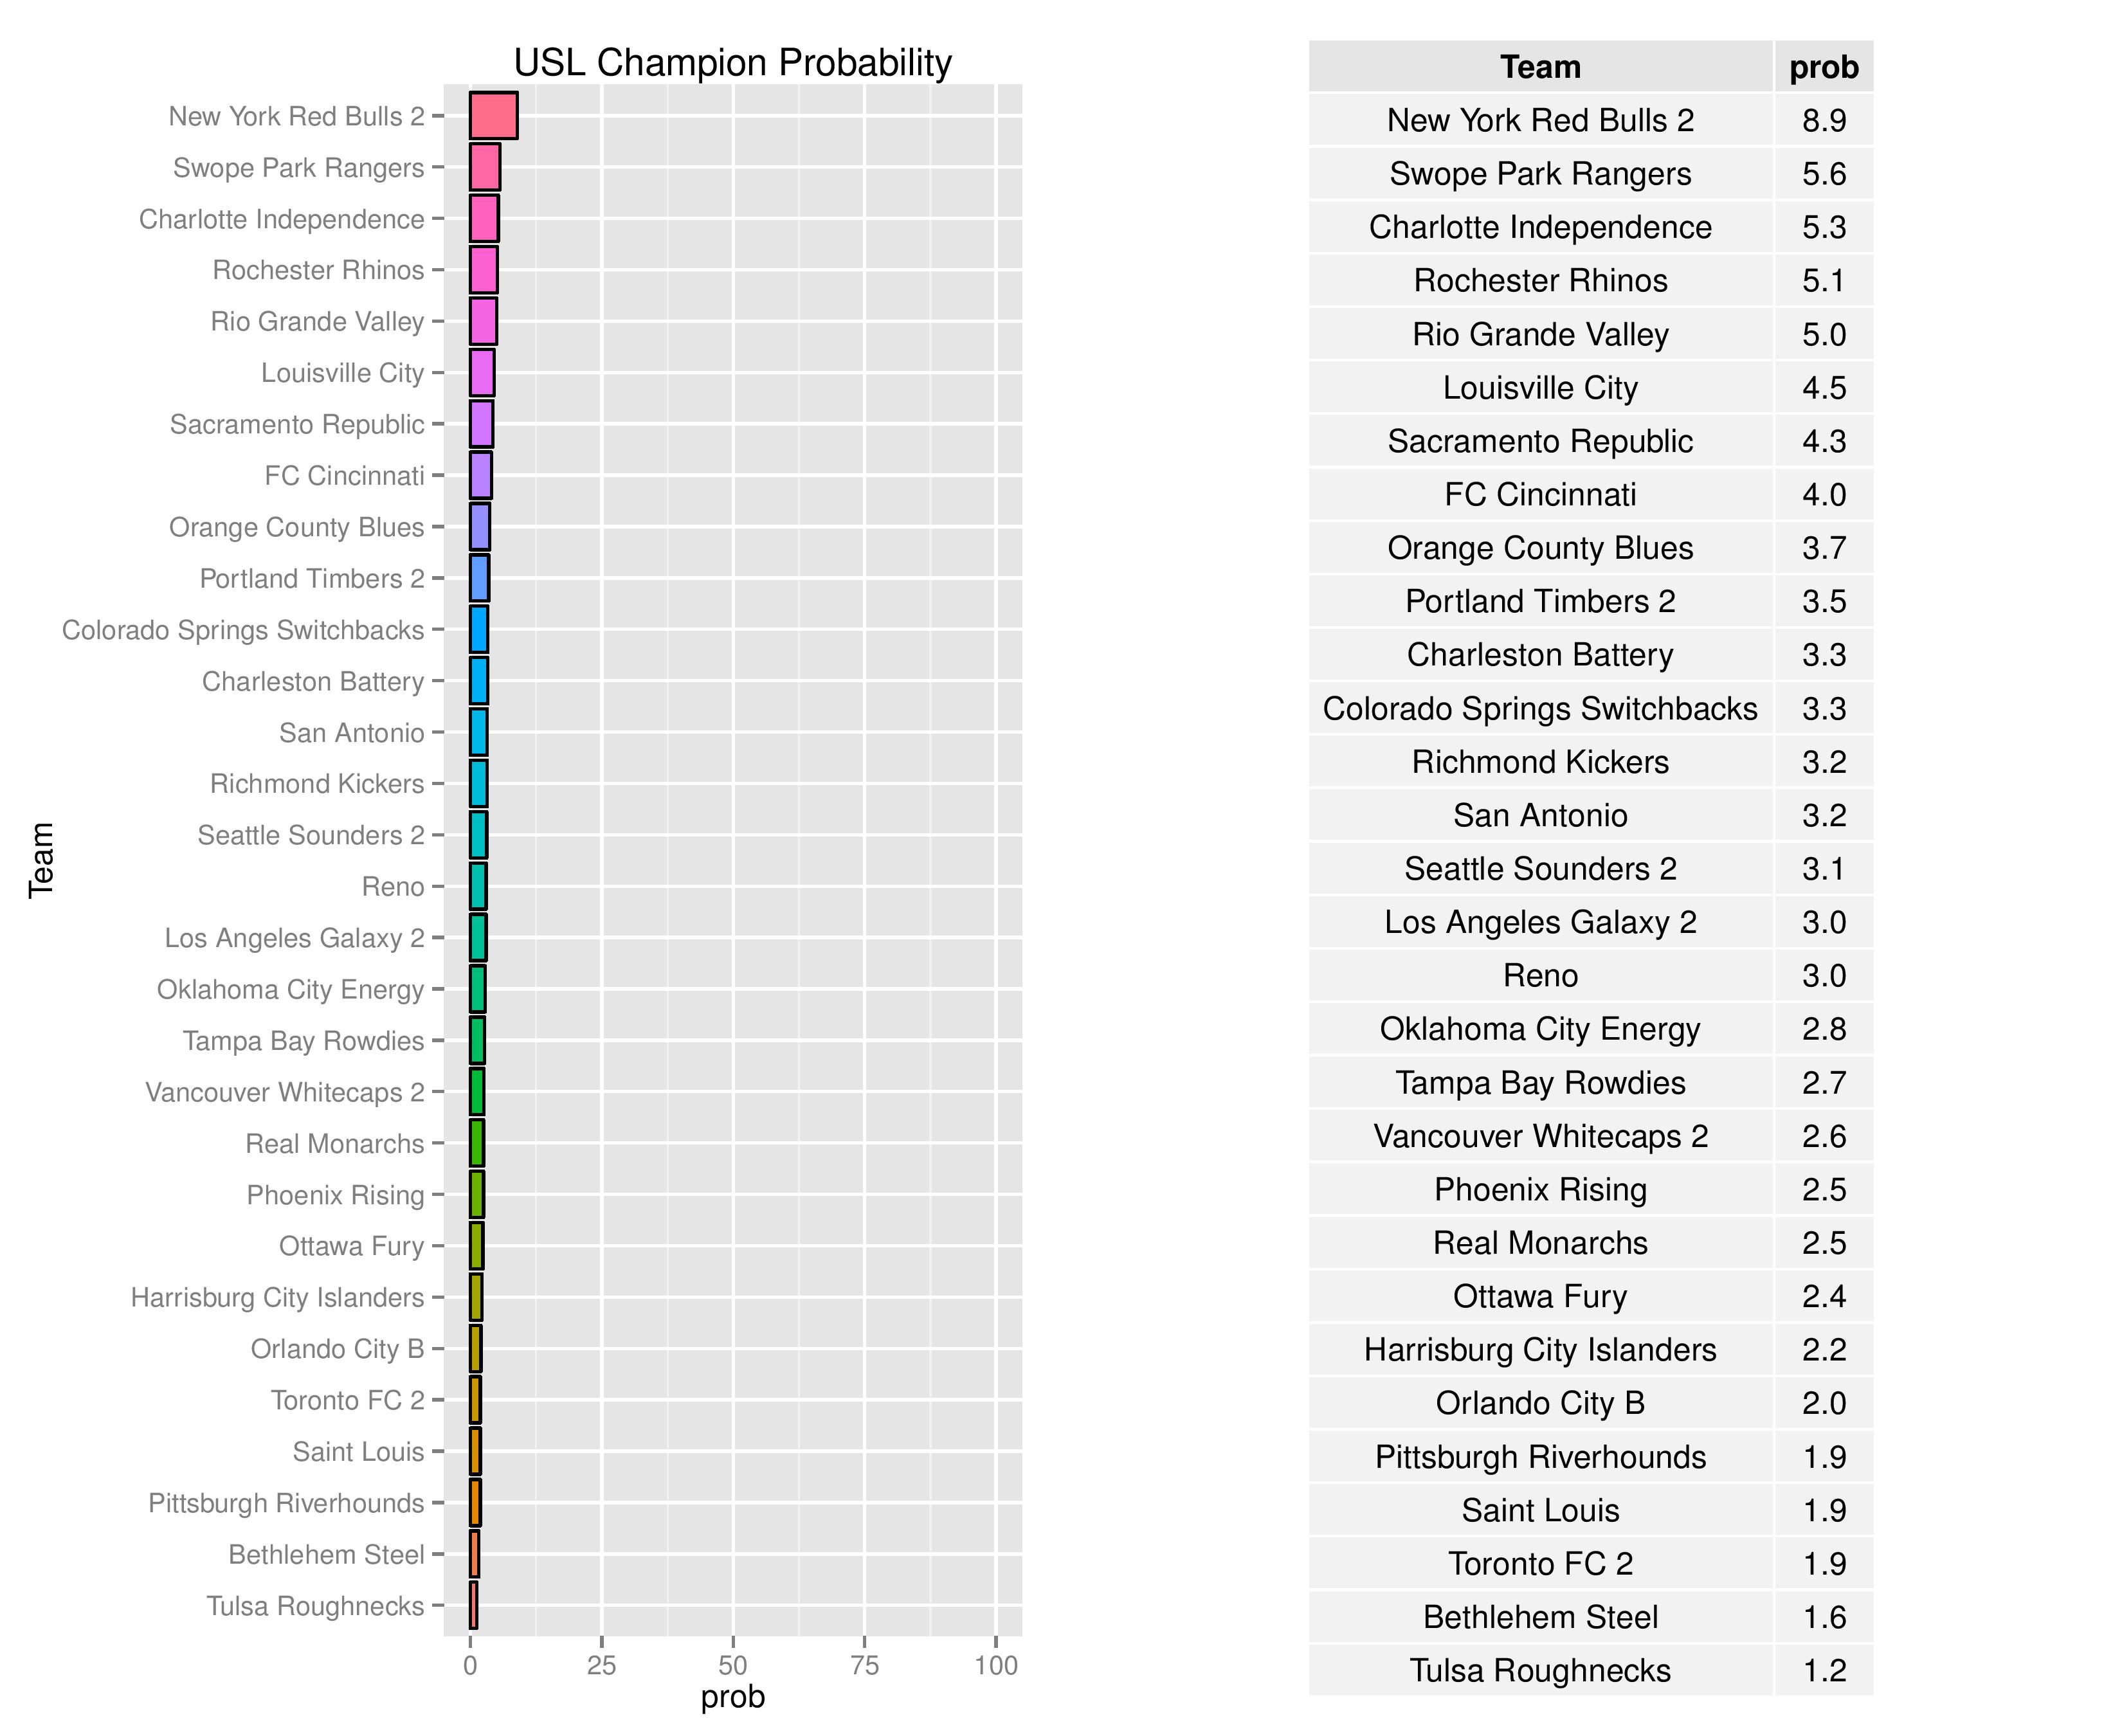
Bethlehem’s odds at becoming the USL Champion start at 1.6% with Harrisburg City at 2.2%.
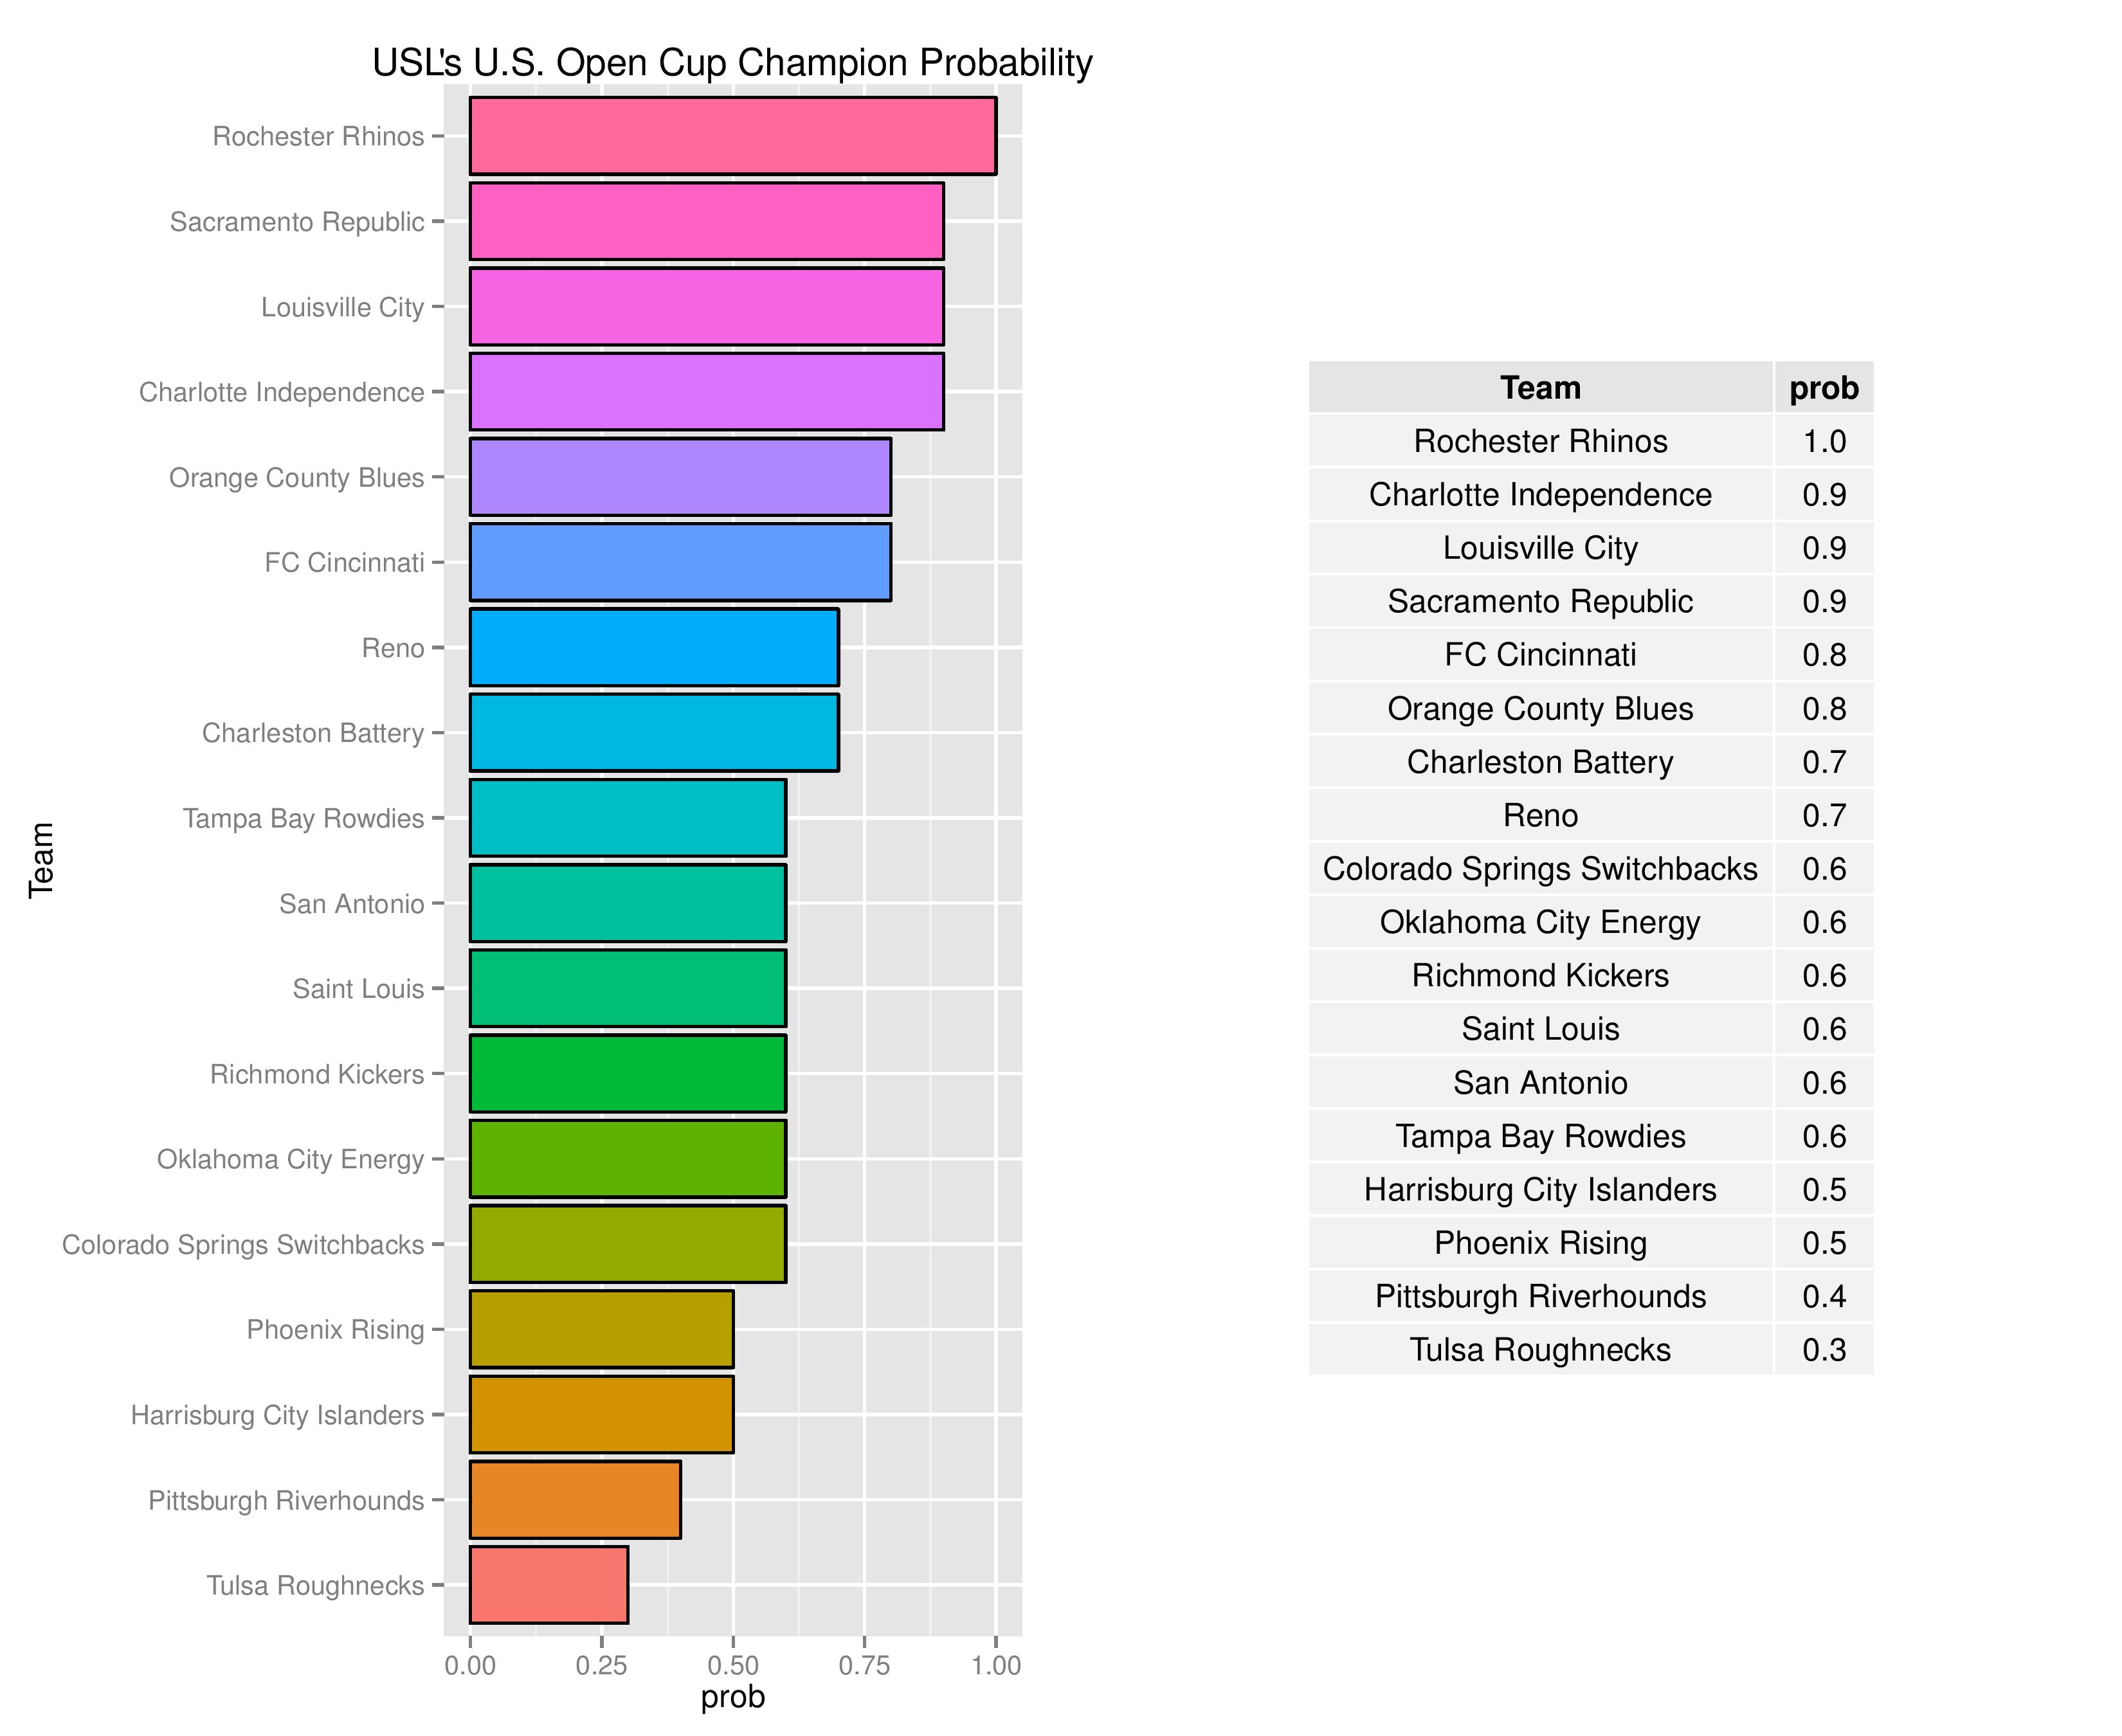
The USOC odds for USL clubs alone are as follows. Harrisburg begins at 0.5% odds. Bethlehem, being Philadelphia-controlled, is not eligible for the U.S. Open Cup.
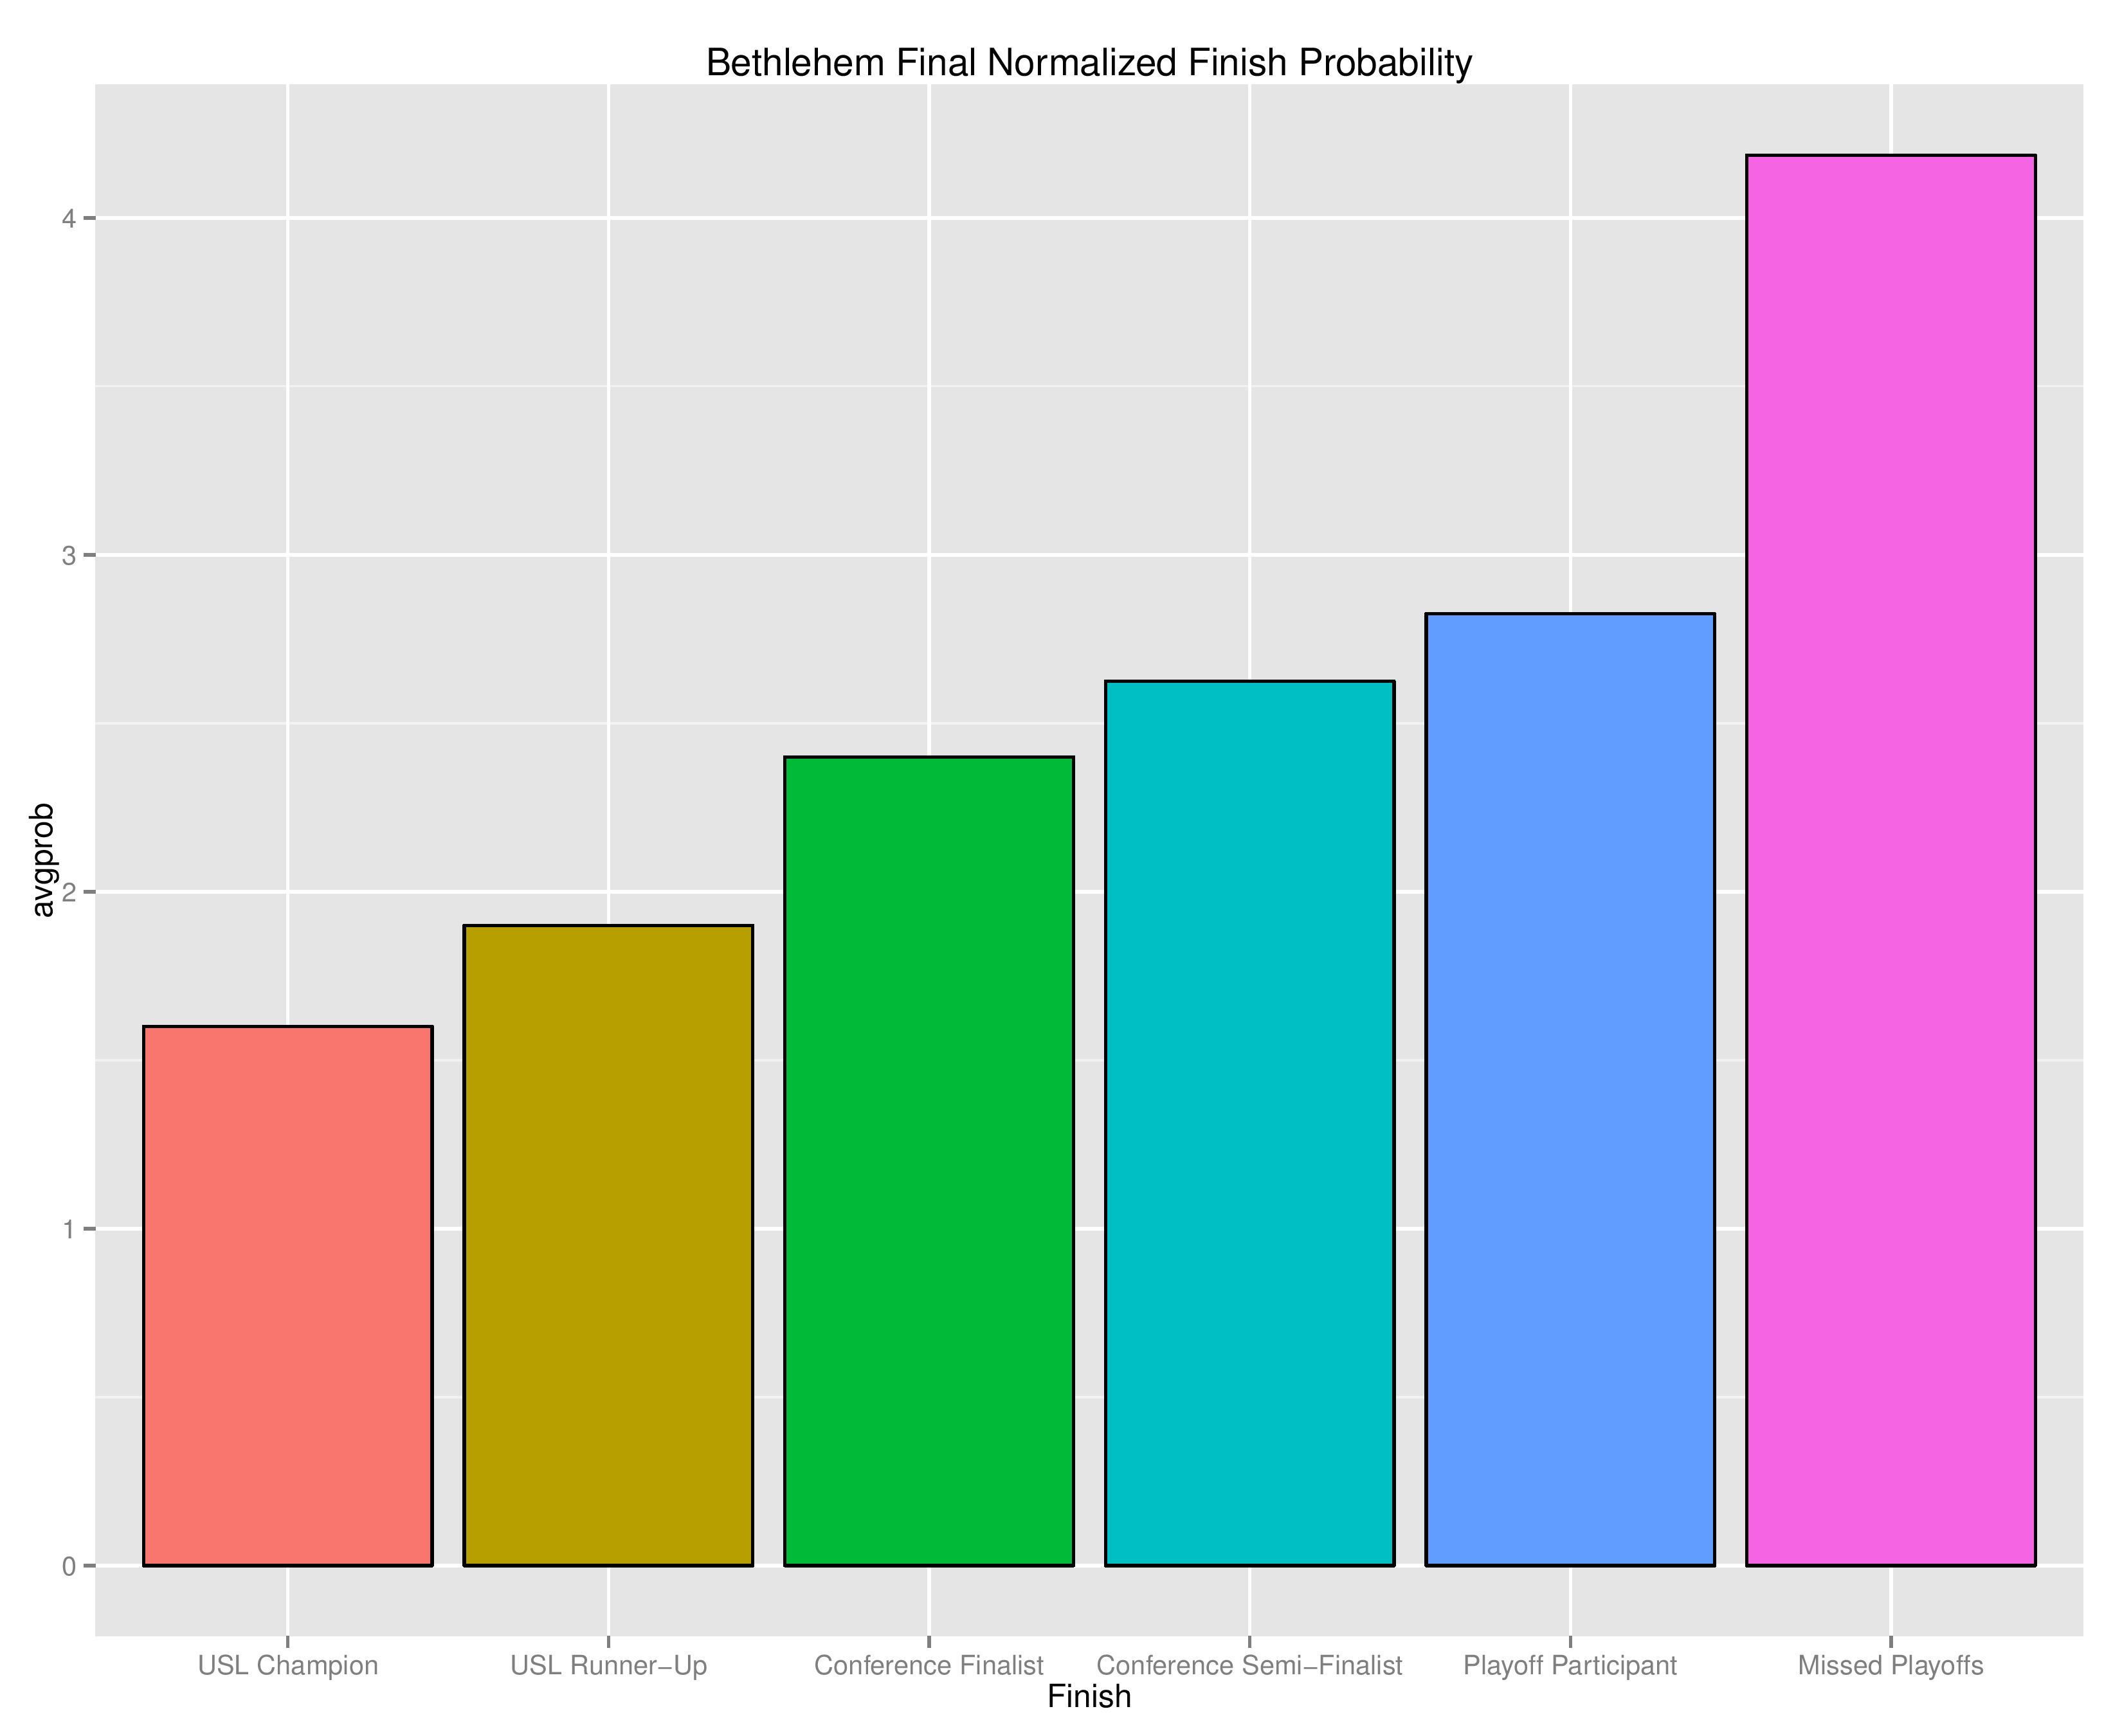
The following are probabilities for each category of outcomes for Bethlehem.

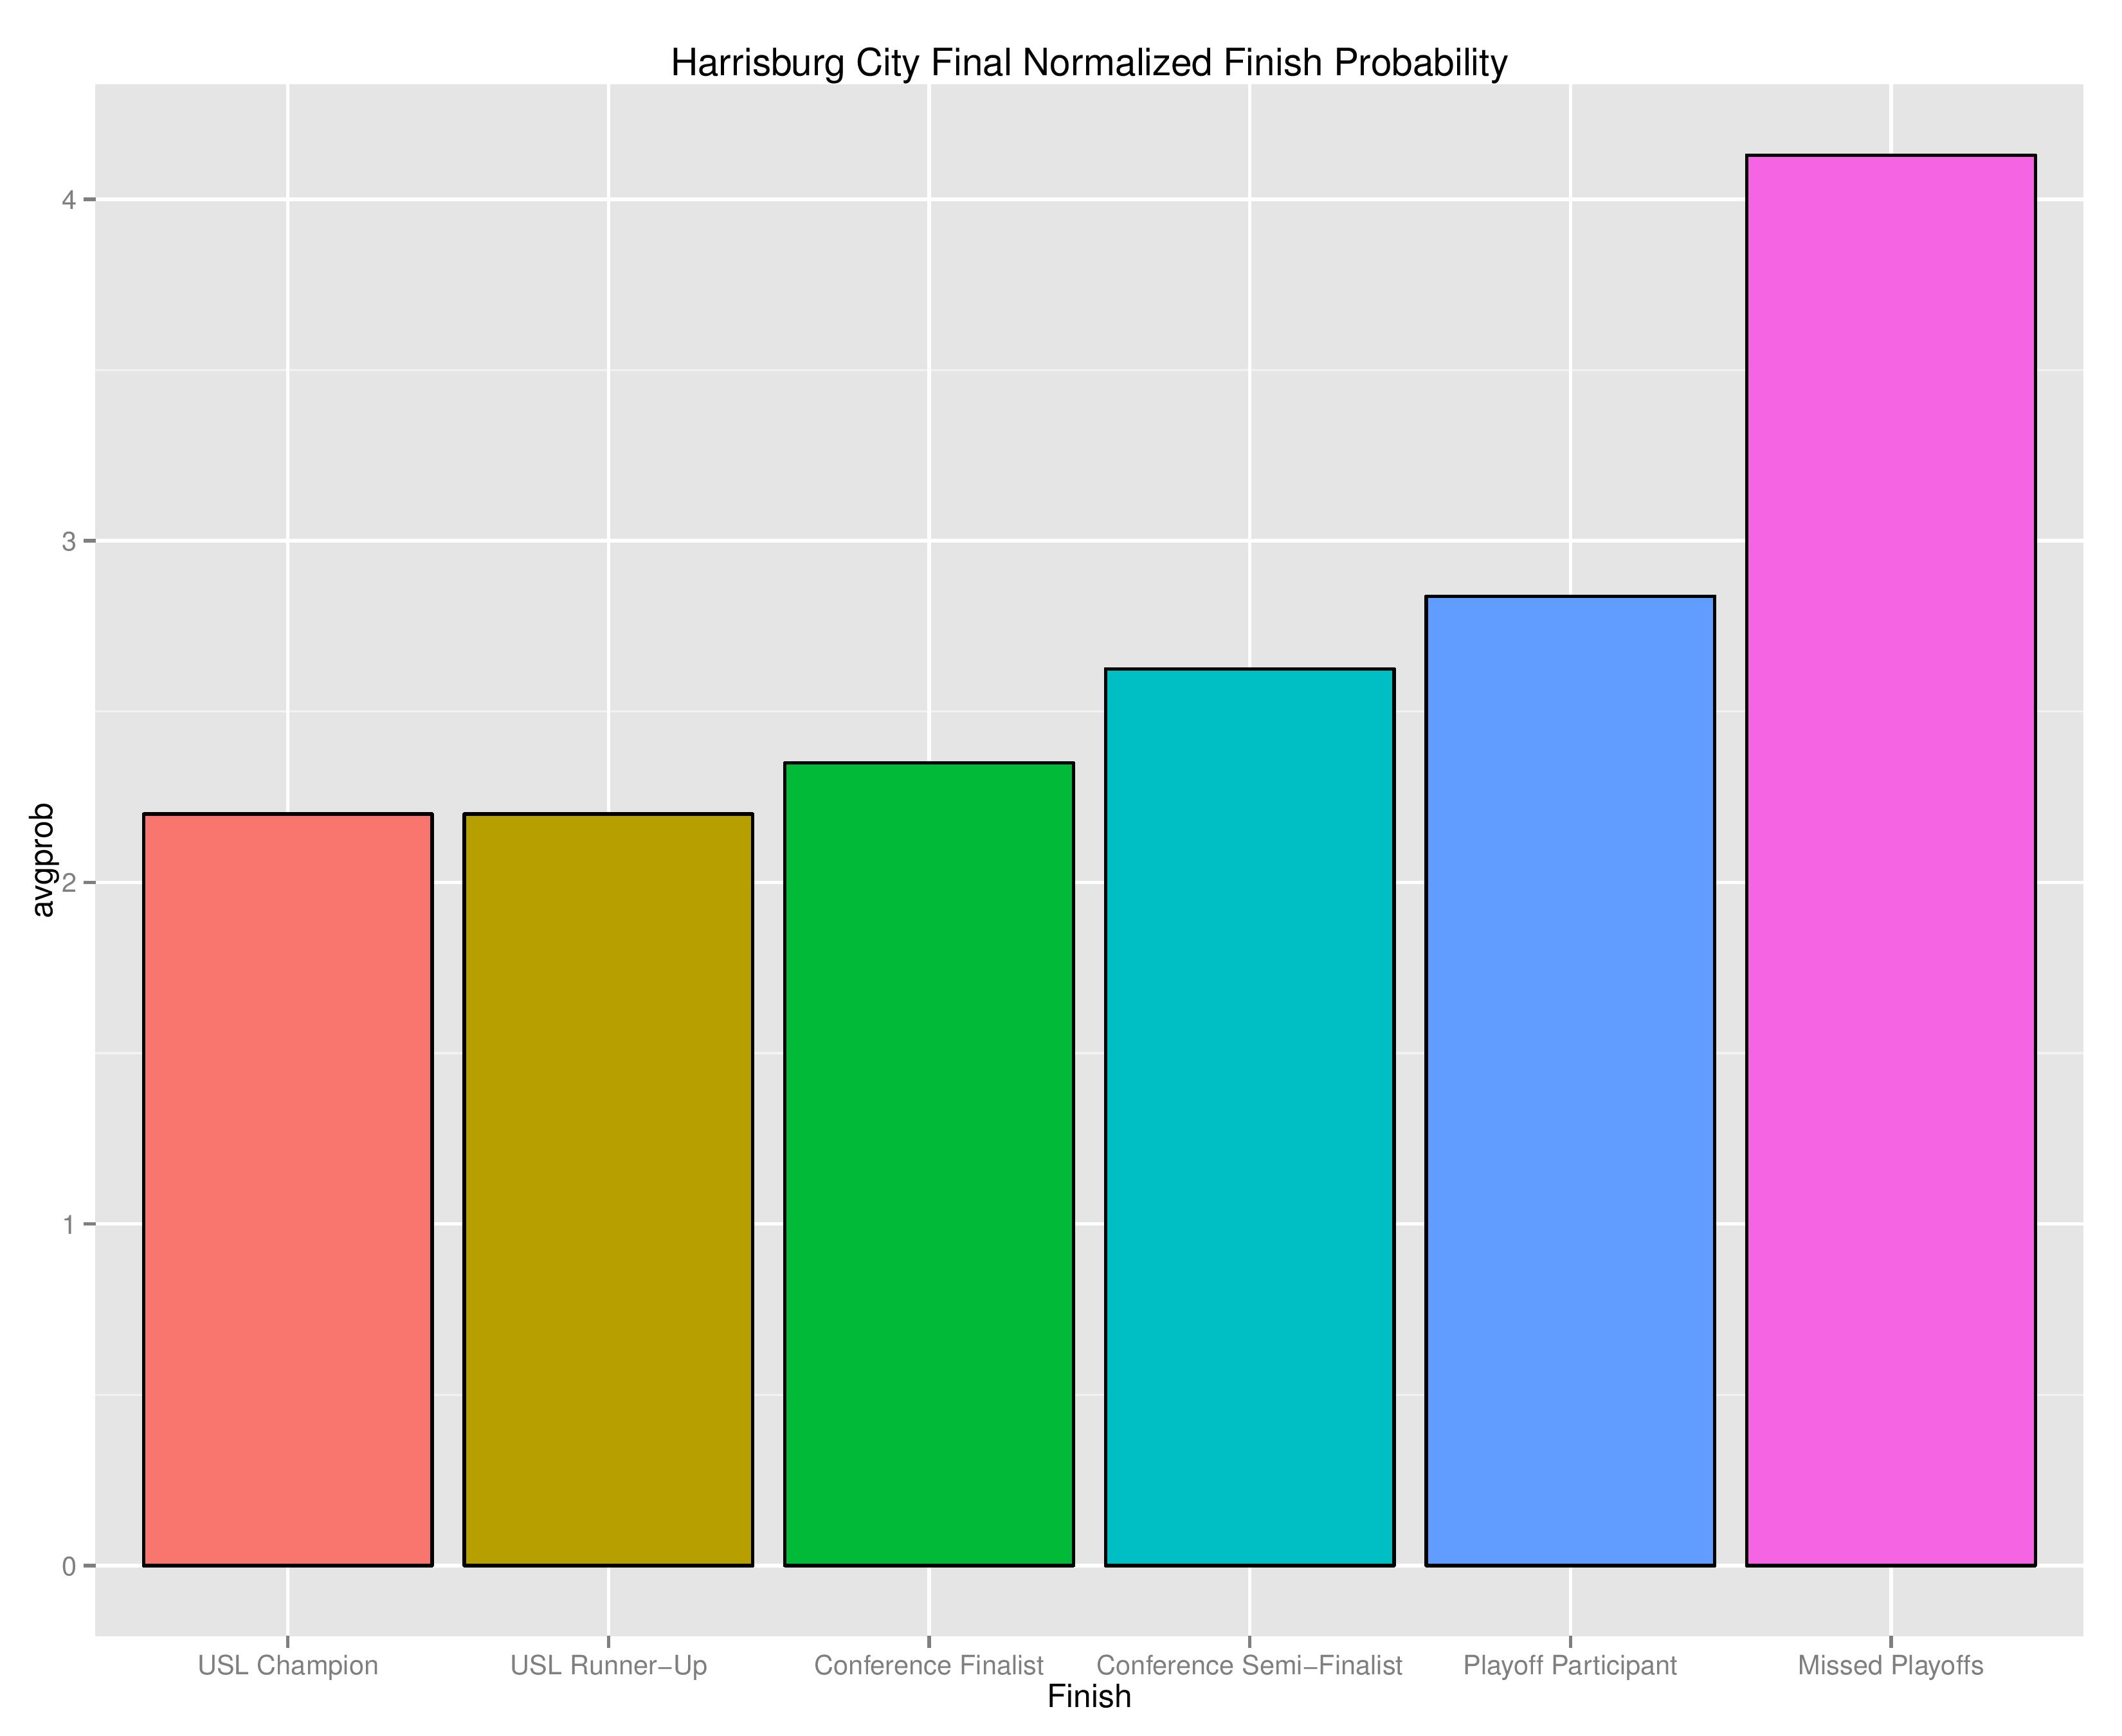
The following are probabilities for each category of outcomes for Harrisburg City.
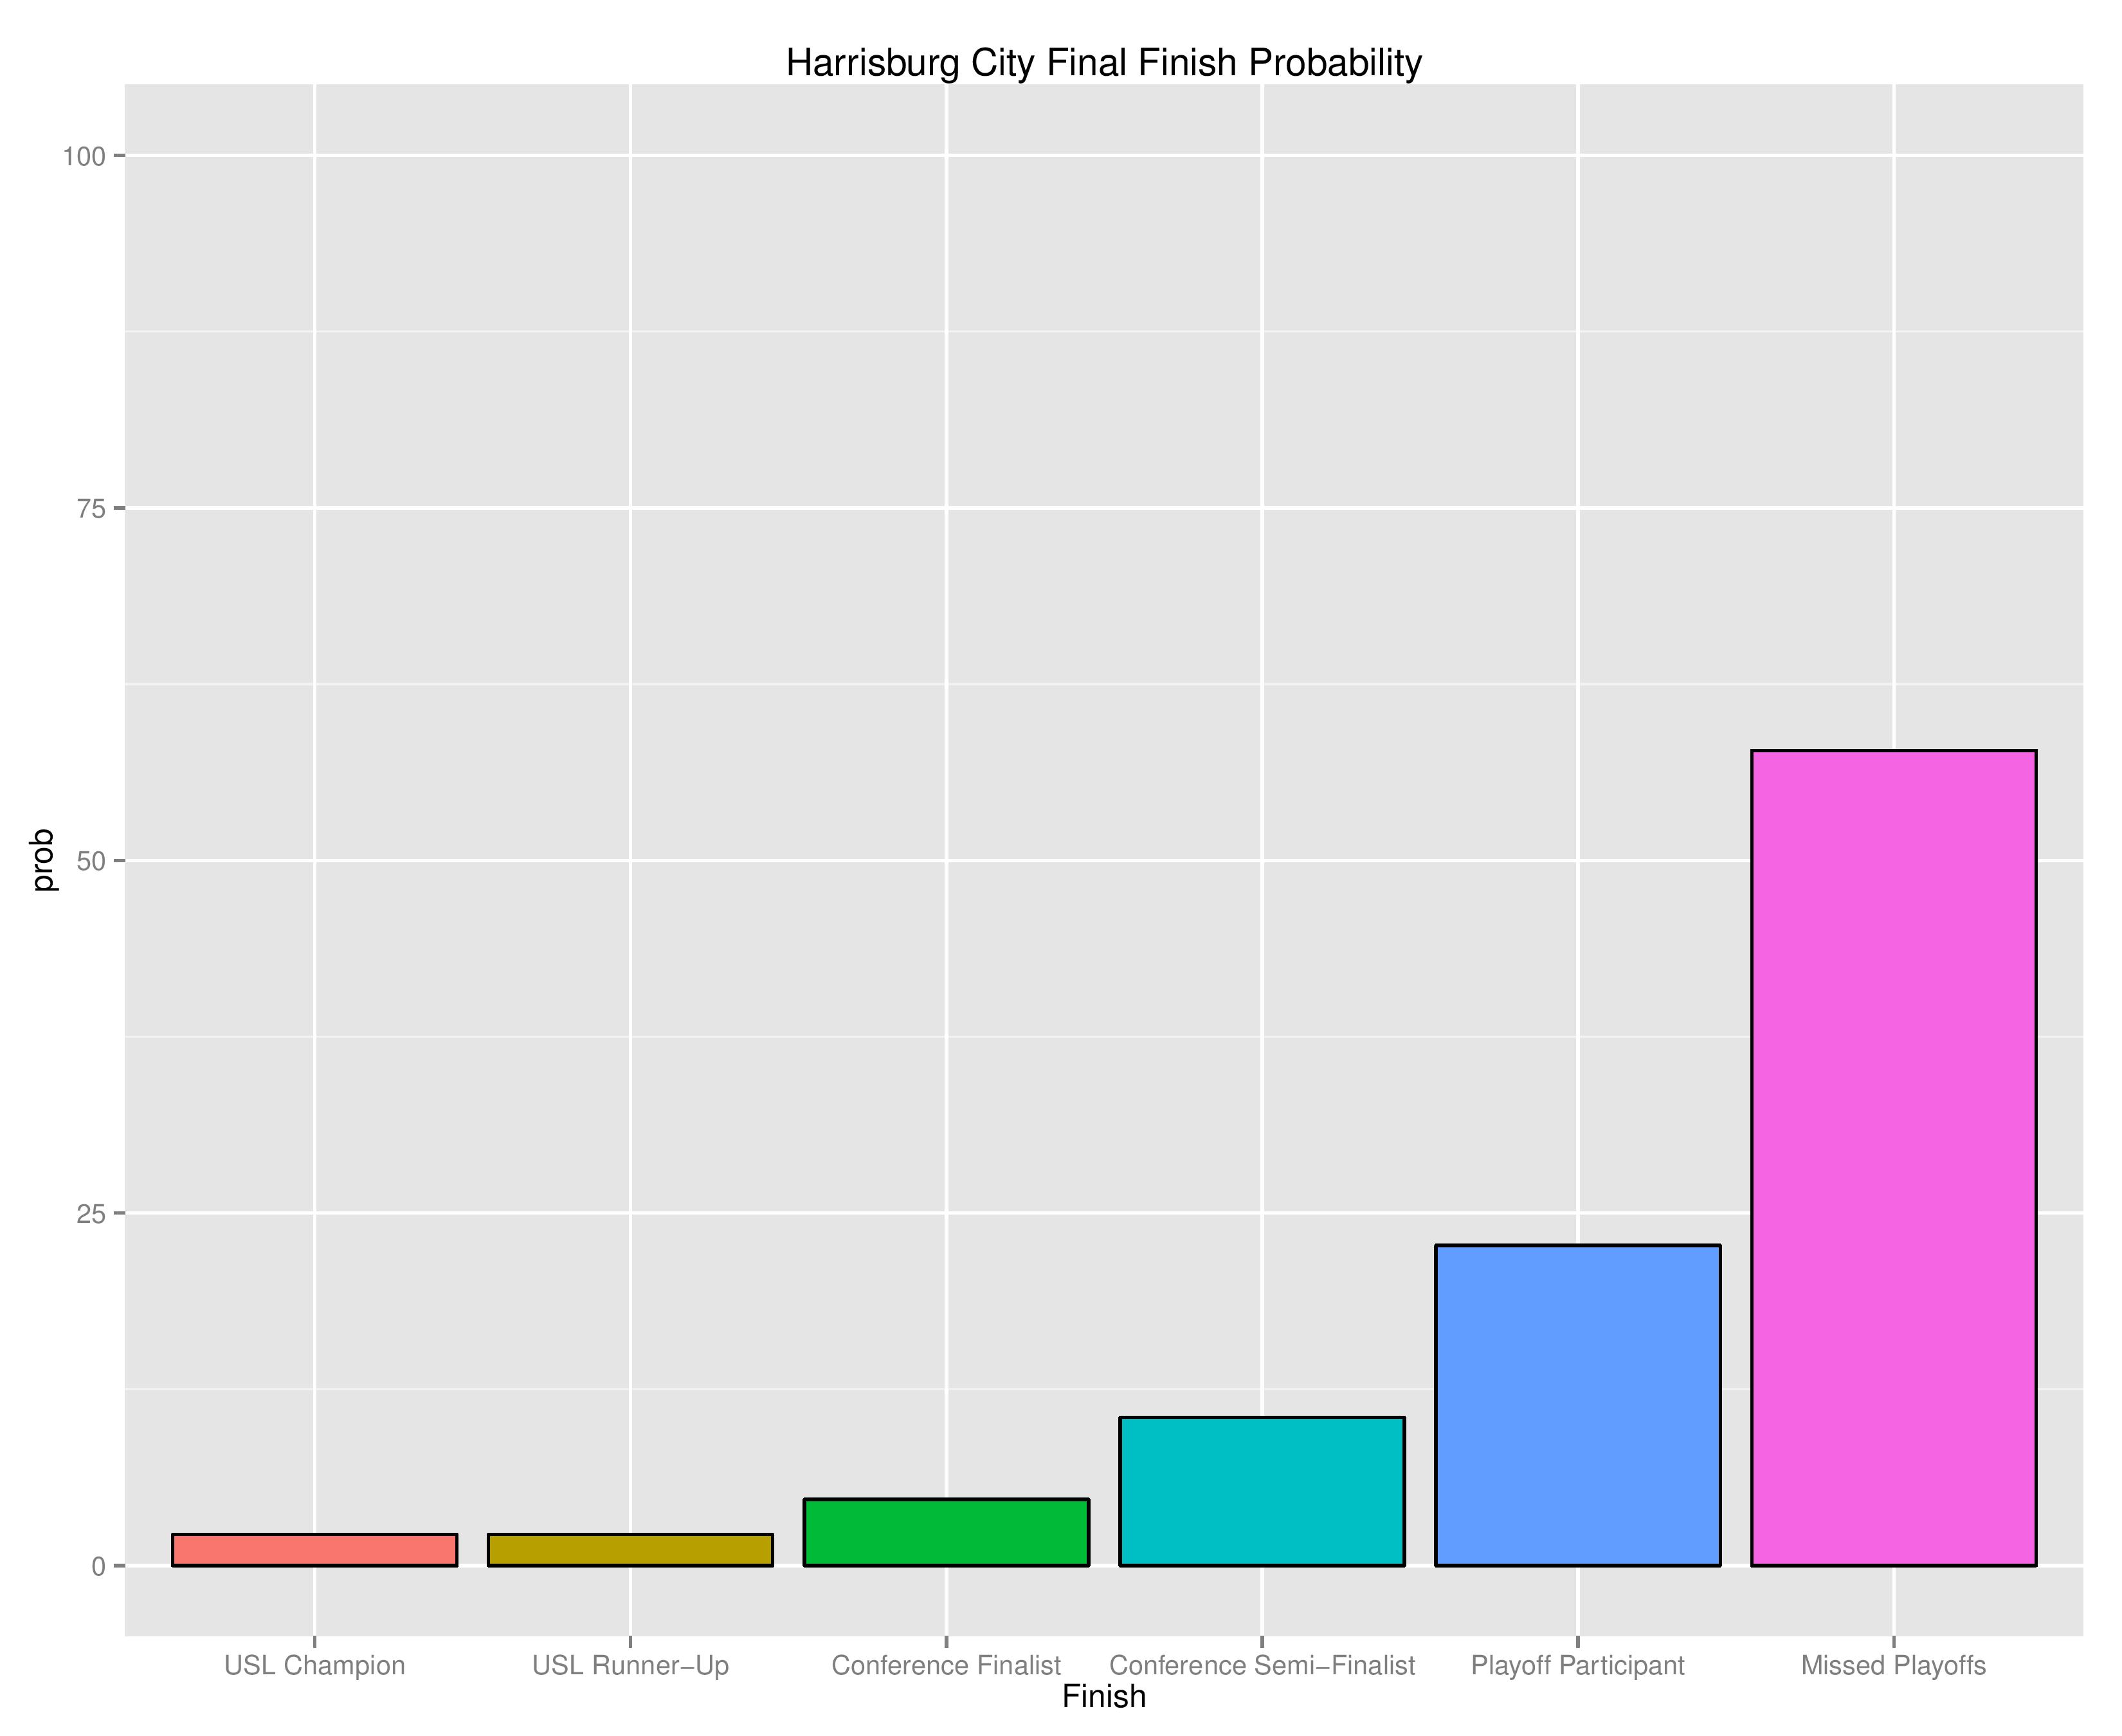
The following shows the relative probability of the prior categories. If the projection system were entirely random, these bars would be even, despite that “Missed Playoffs” is inherently 14 times more likely than “USL Champion.” The chart outlines where the club is headed. We begin with Bethlehem Steel.
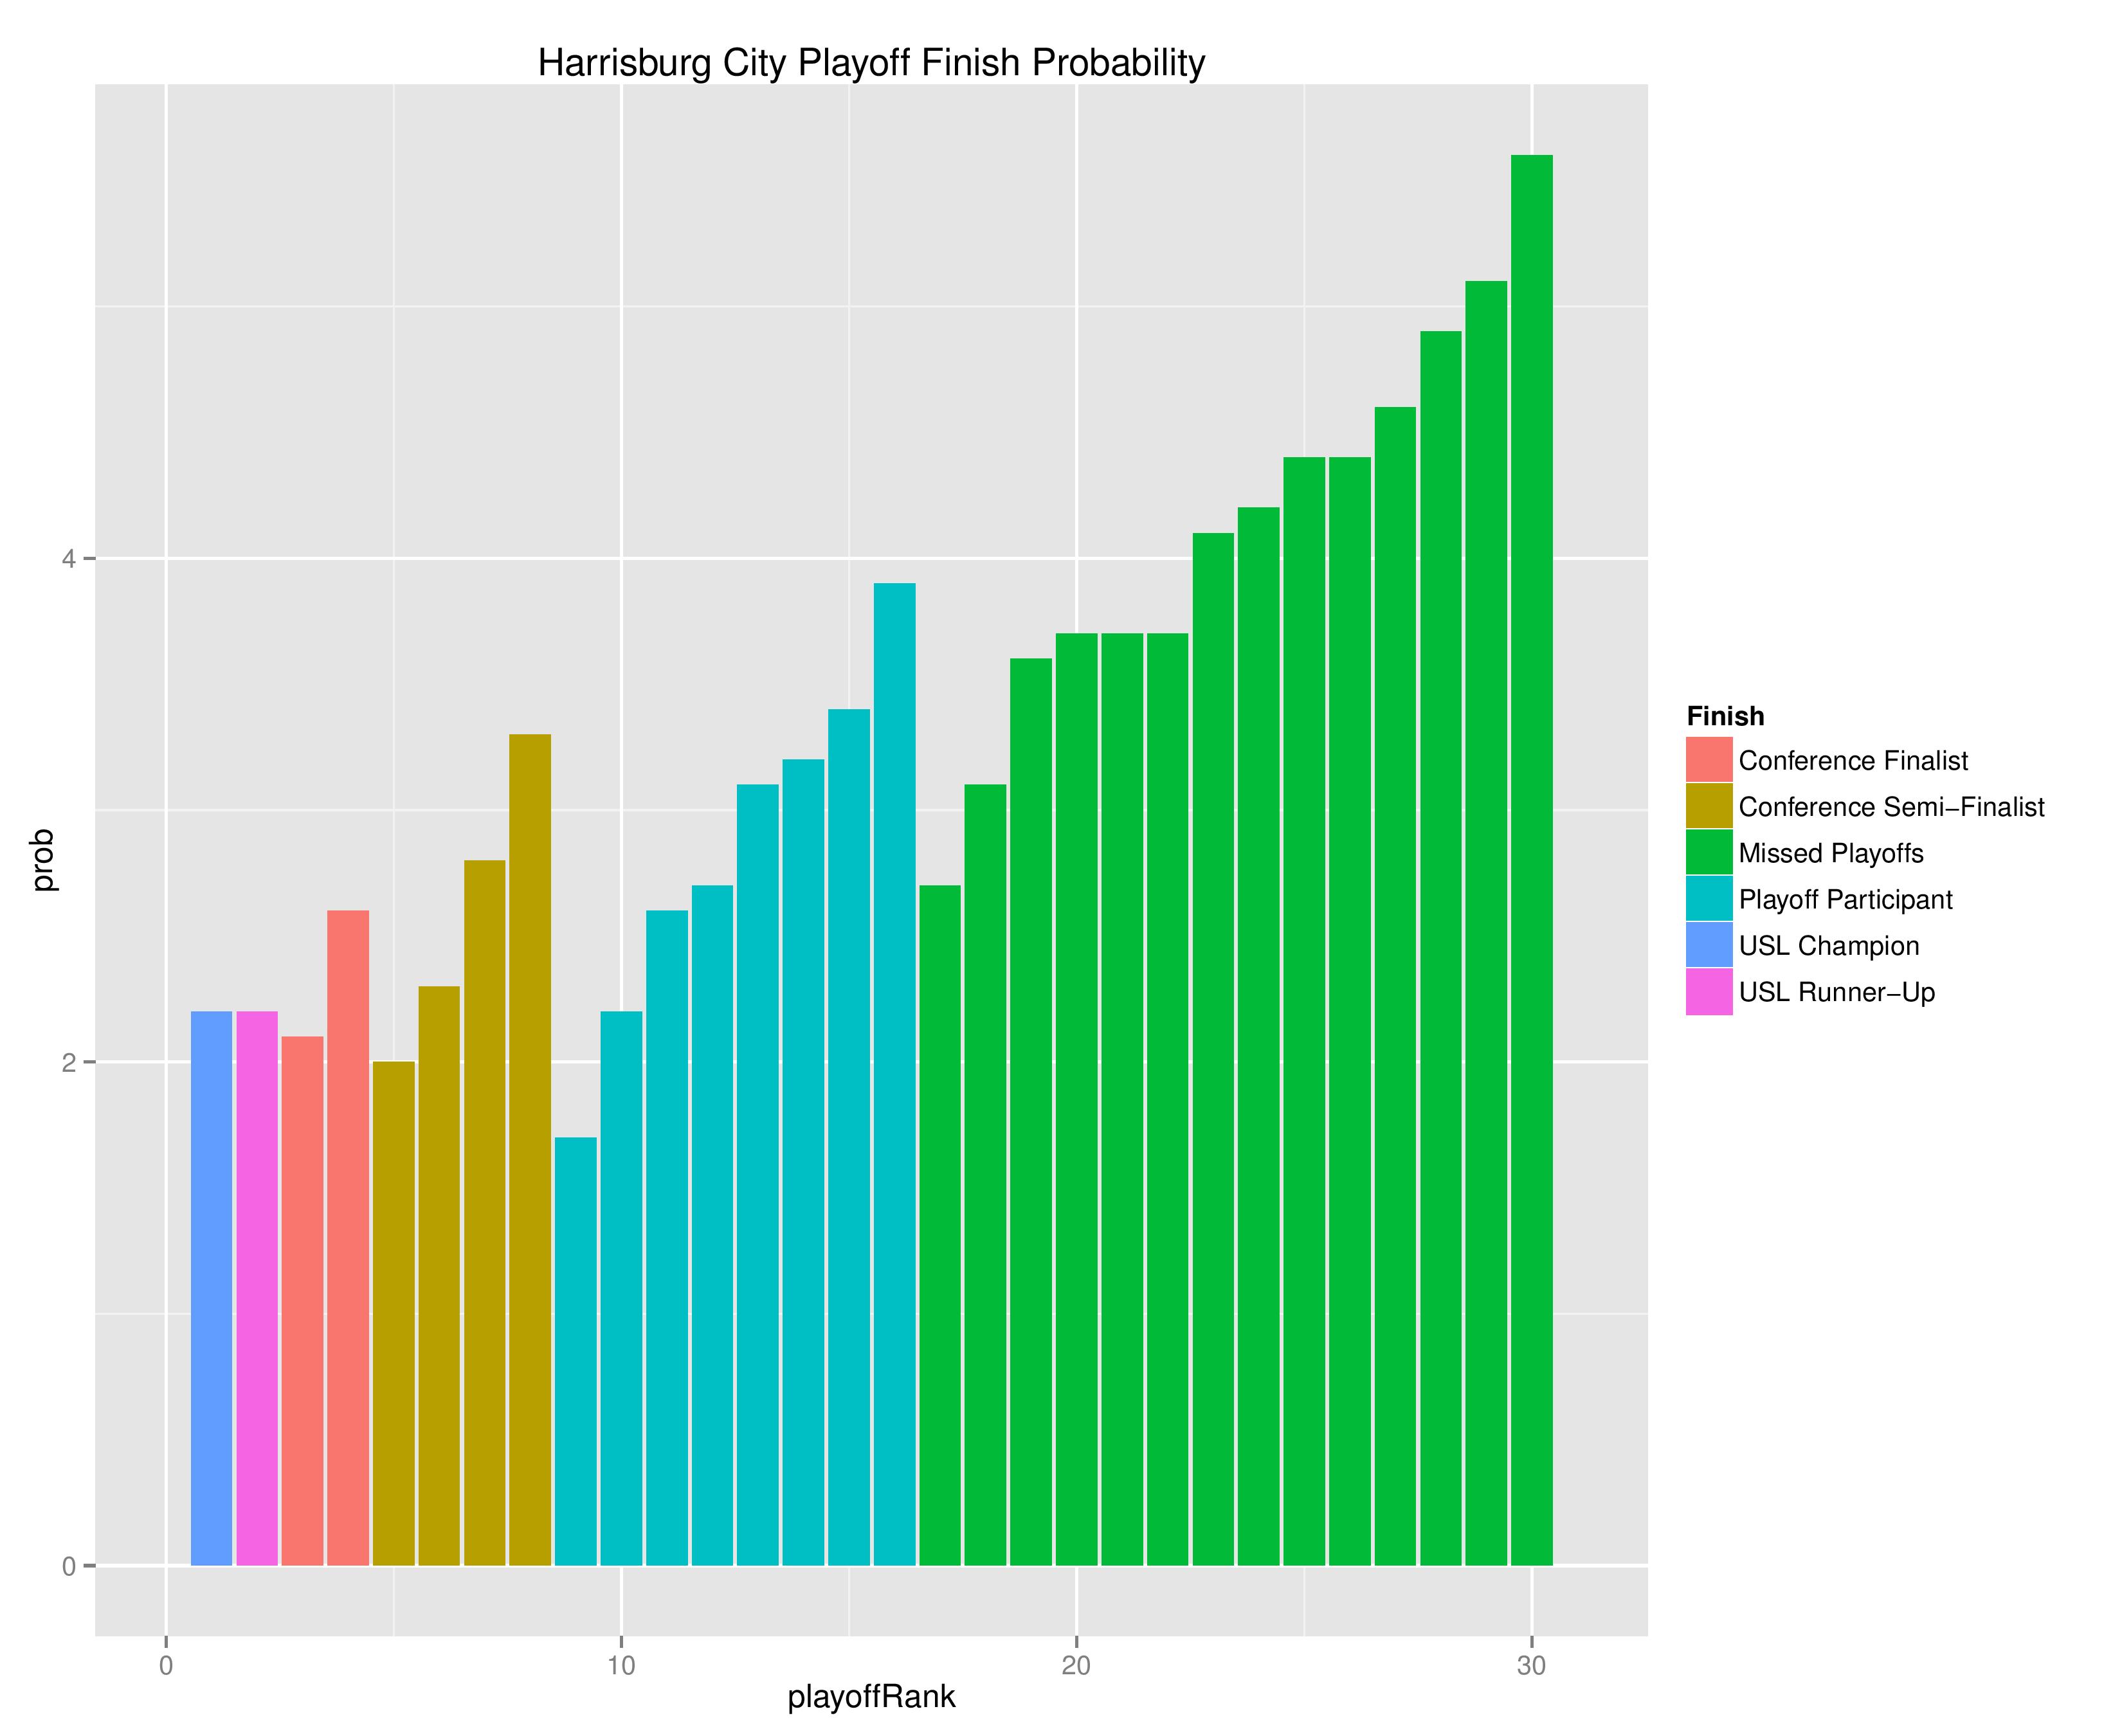
The following shows the probability of each post-playoff ranking finish.

The following shows the summary of the simulations in an easy table format.
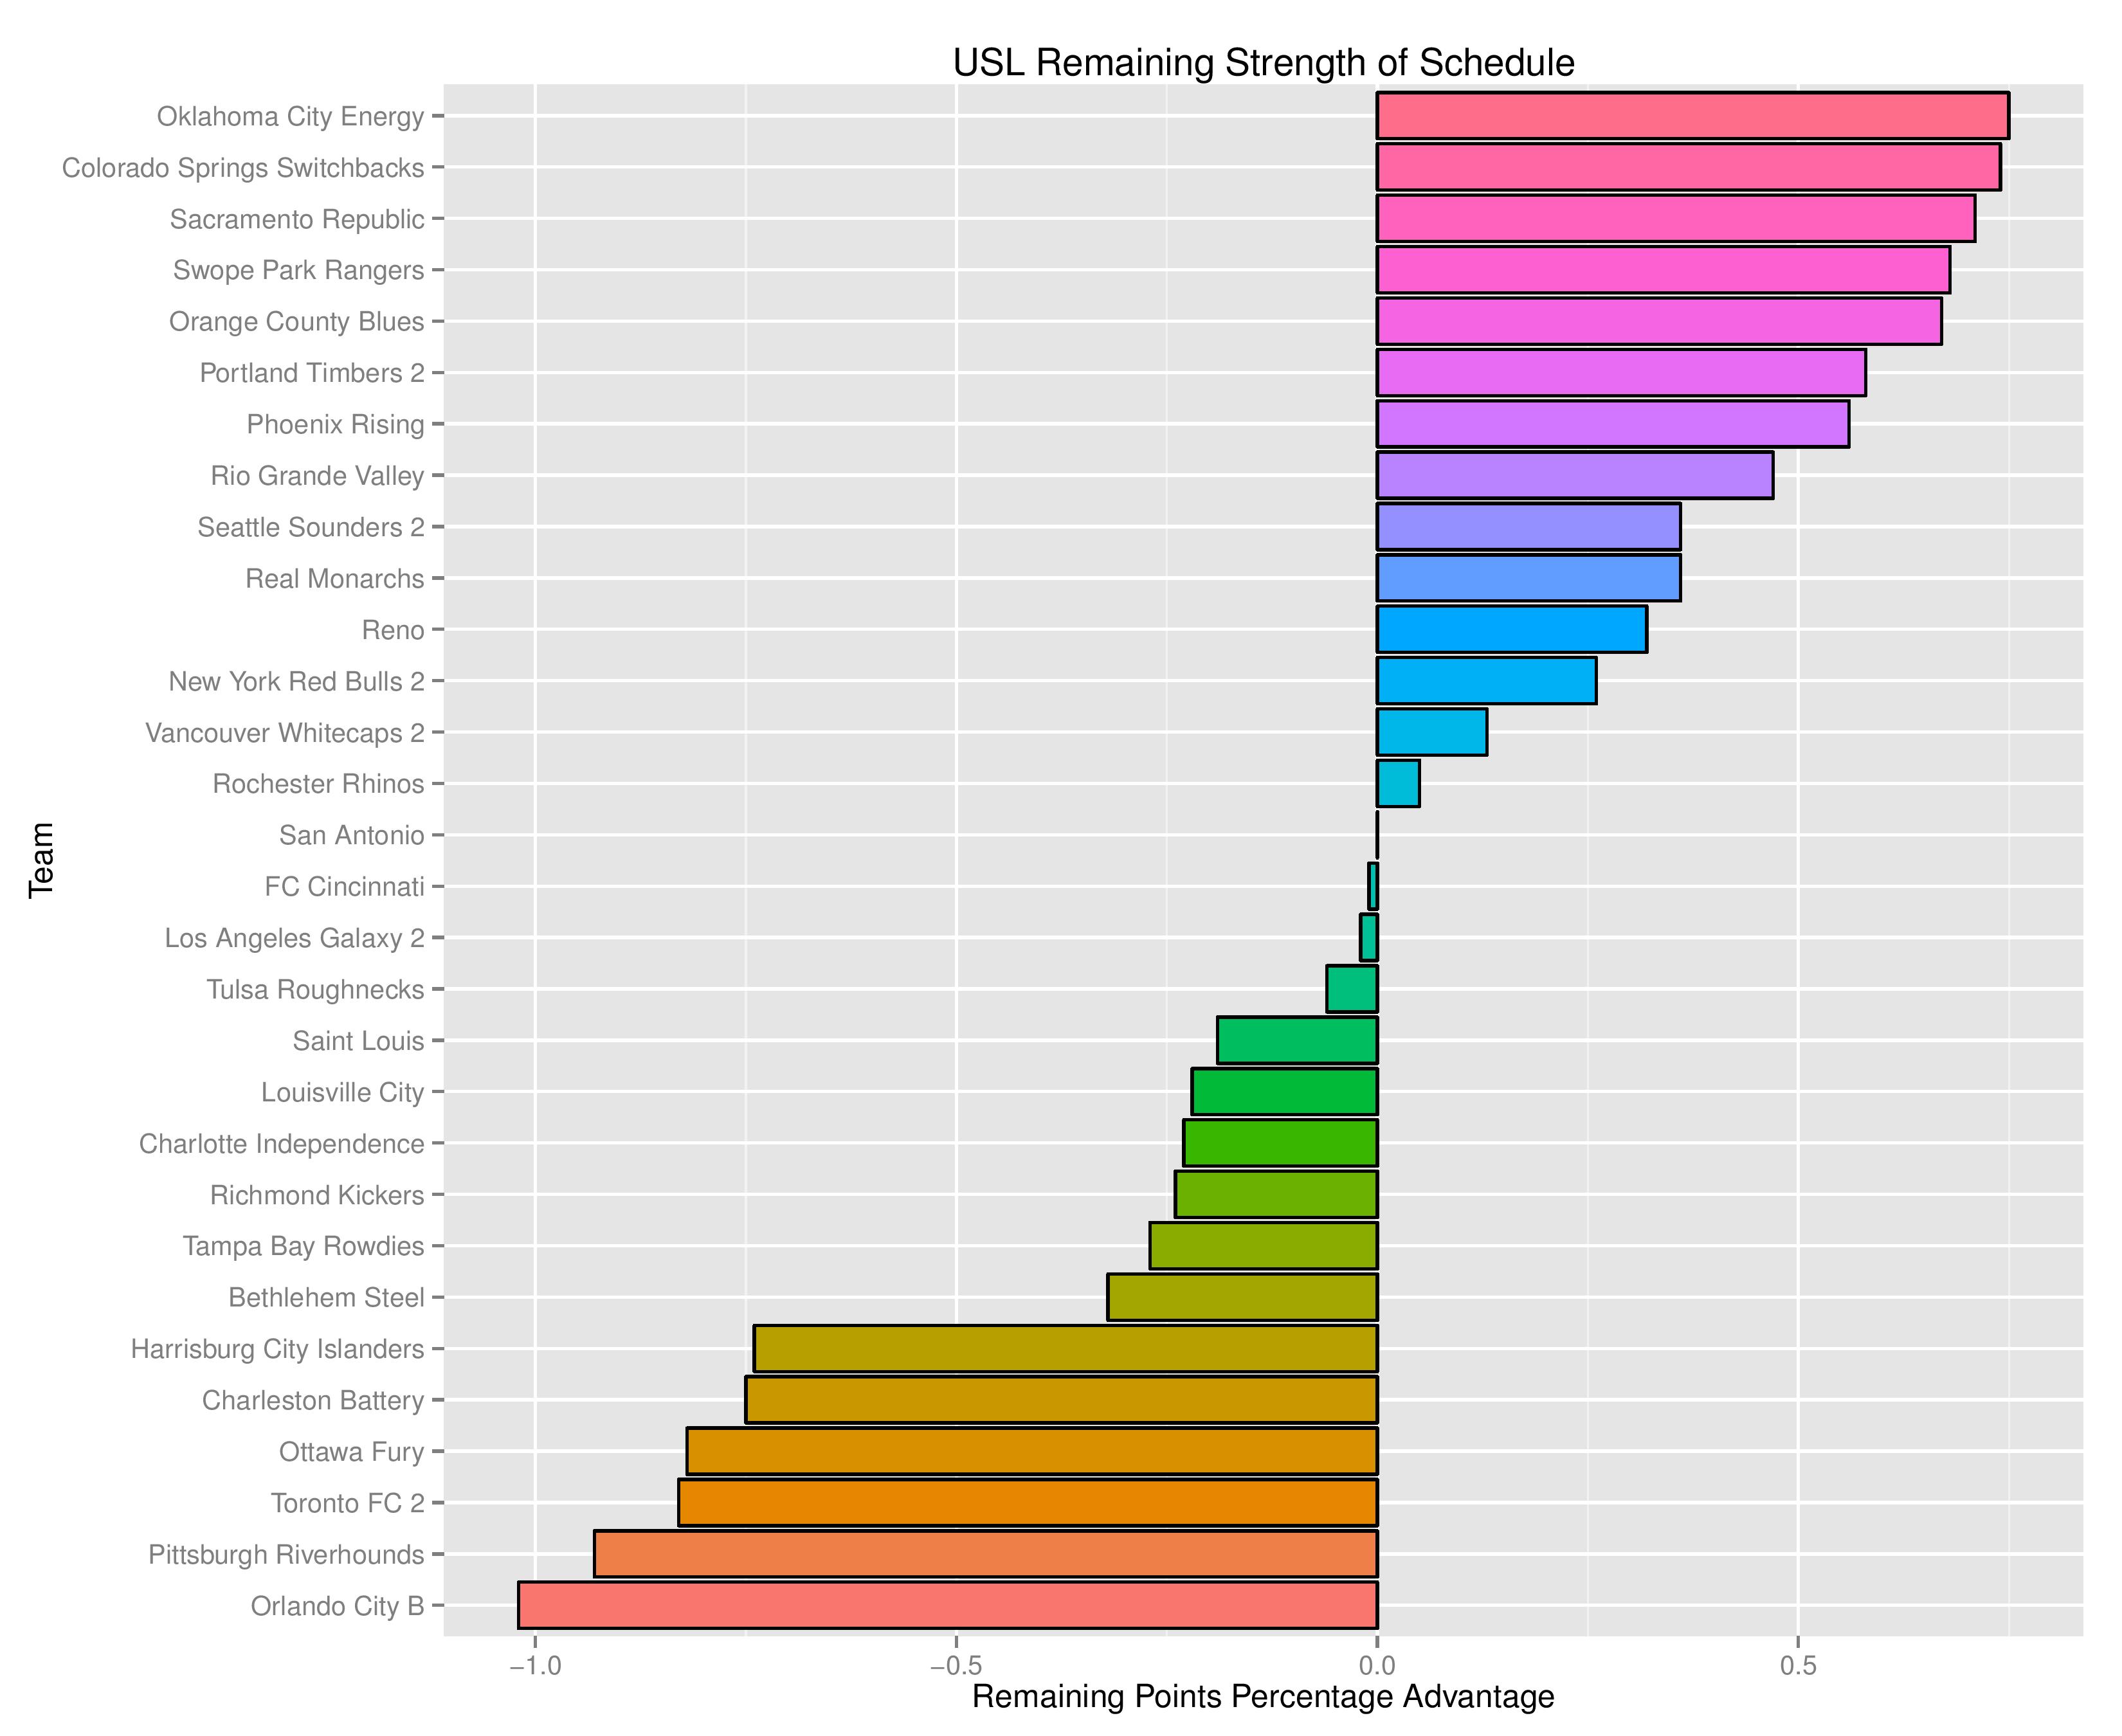
As a new feature, we can also show how the Remaining Strength of Schedule affects each team.
The “Points Percentage Advantage” shown on the X-axis represents the percentage of points expected over the league average schedule. This “points expected” value is generated by simulating how all teams would perform with all remaining schedules (and therefore judges a schedule based upon how all teams would perform in that scenario).
In short, the higher the value, the easier the remaining schedule.
Remaining home field advantage will make a large contribution here. It can also be true that a better team has an ‘easier’ schedule simply because they do not have to play themselves. Likewise, a bad team may have a ‘harder’ schedule because they also do not play themselves.
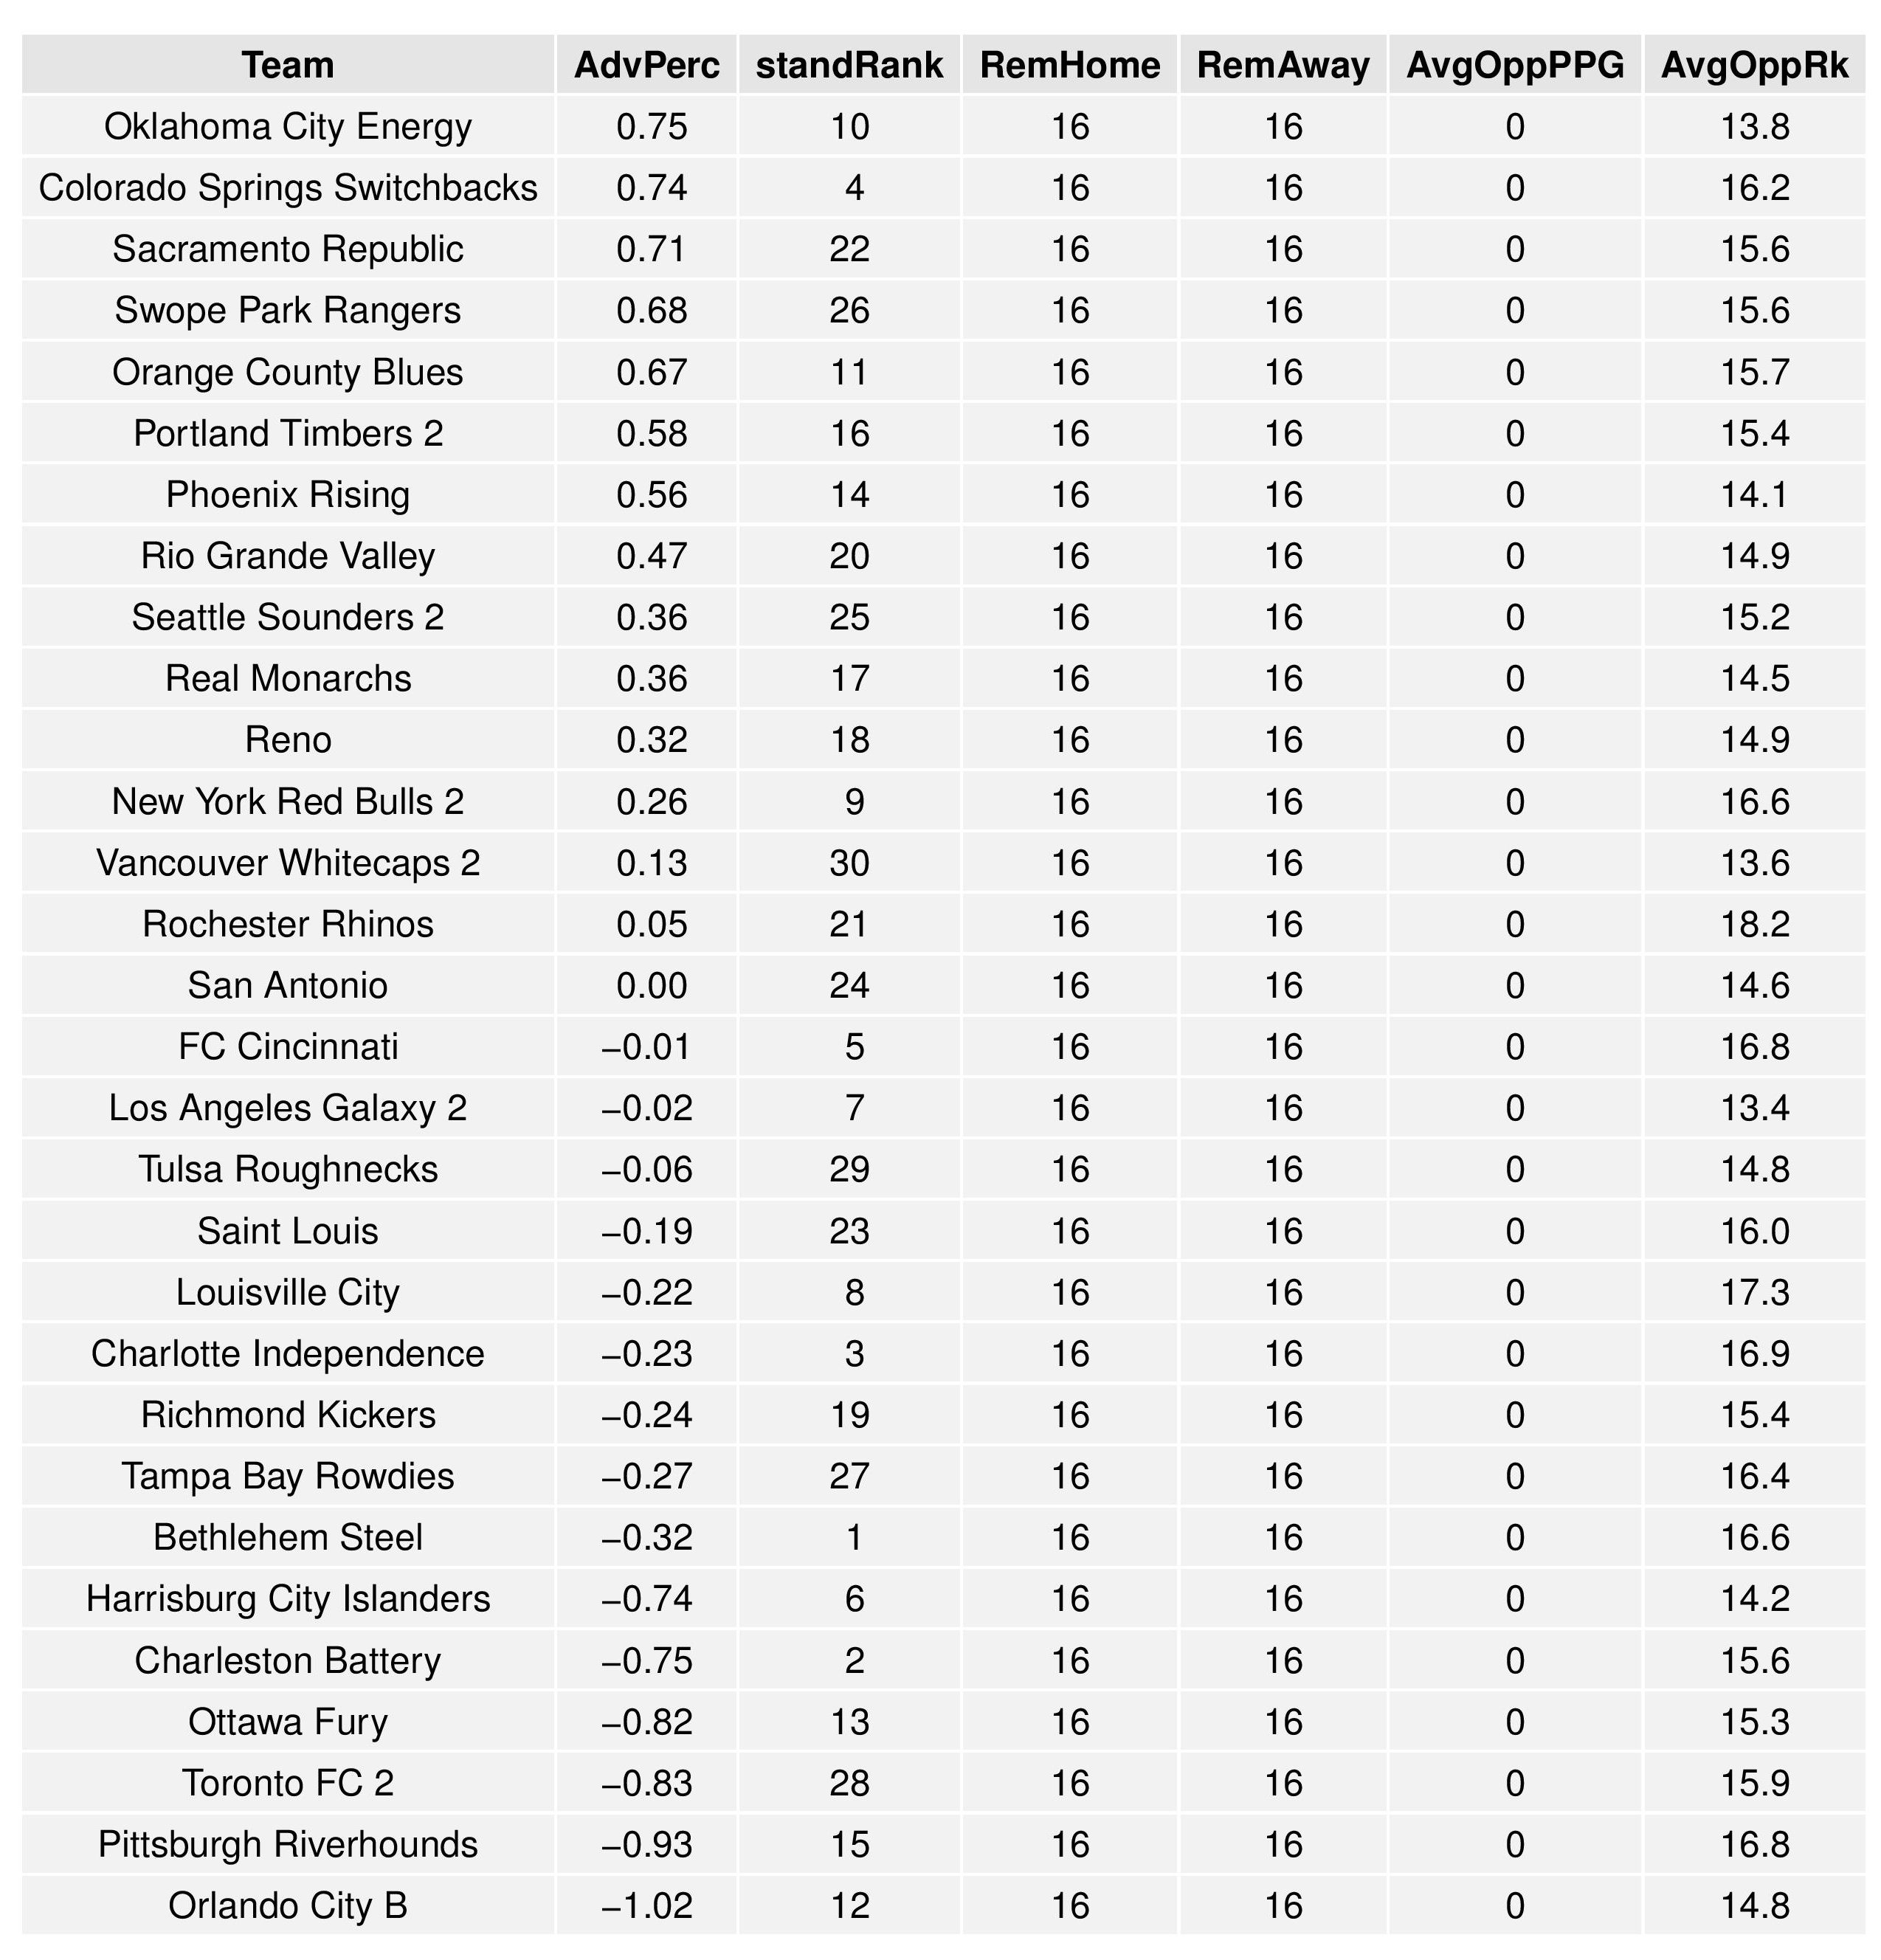
The table following the chart also shares helpful context with these percentages.
Accompanying the advantage percentage in the following table is their current standings rank (right now ties are not properly calculated; I’ll fix that), the remaining home matches, the remaining away matches, the current average points-per-game of future opponents (results-based, not model-based), and the average power ranking of future opponents according to SEBA.
The following shows the expectations for upcoming matches for both Bethlehem and Harrisburg:


The SEBA Projection System is an acronym for a tortured collection of words in the Statistical Extrapolation Bayesian Analyzer Projection System. Check out the first season’s post to find out how it works (https://phillysoccerpage.net/2017/03/03/2017-initial-seba-projections/)

Thanks as always, Chris. Enjoy your vacation next week!
Thanks!
Wow that is an exhaustive info you got here!