Ugh, what an awful loss. While most of the articles I’ve read are calling for Klinsmann to be fired, I did read a couple of optimistic articles suggesting that he not be fired yet because the USA is still probable to qualify. Well, that’s true, as SEBA will report below, but the USA should never have been in this weak of a position. SEBA actually predicted a loss to Costa Rica on the road, but a 4-0 loss was shocking and really hurts in terms of tiebreakers, as well as the realization that, under Klinsmann, the USA is much weaker than we might have expected.
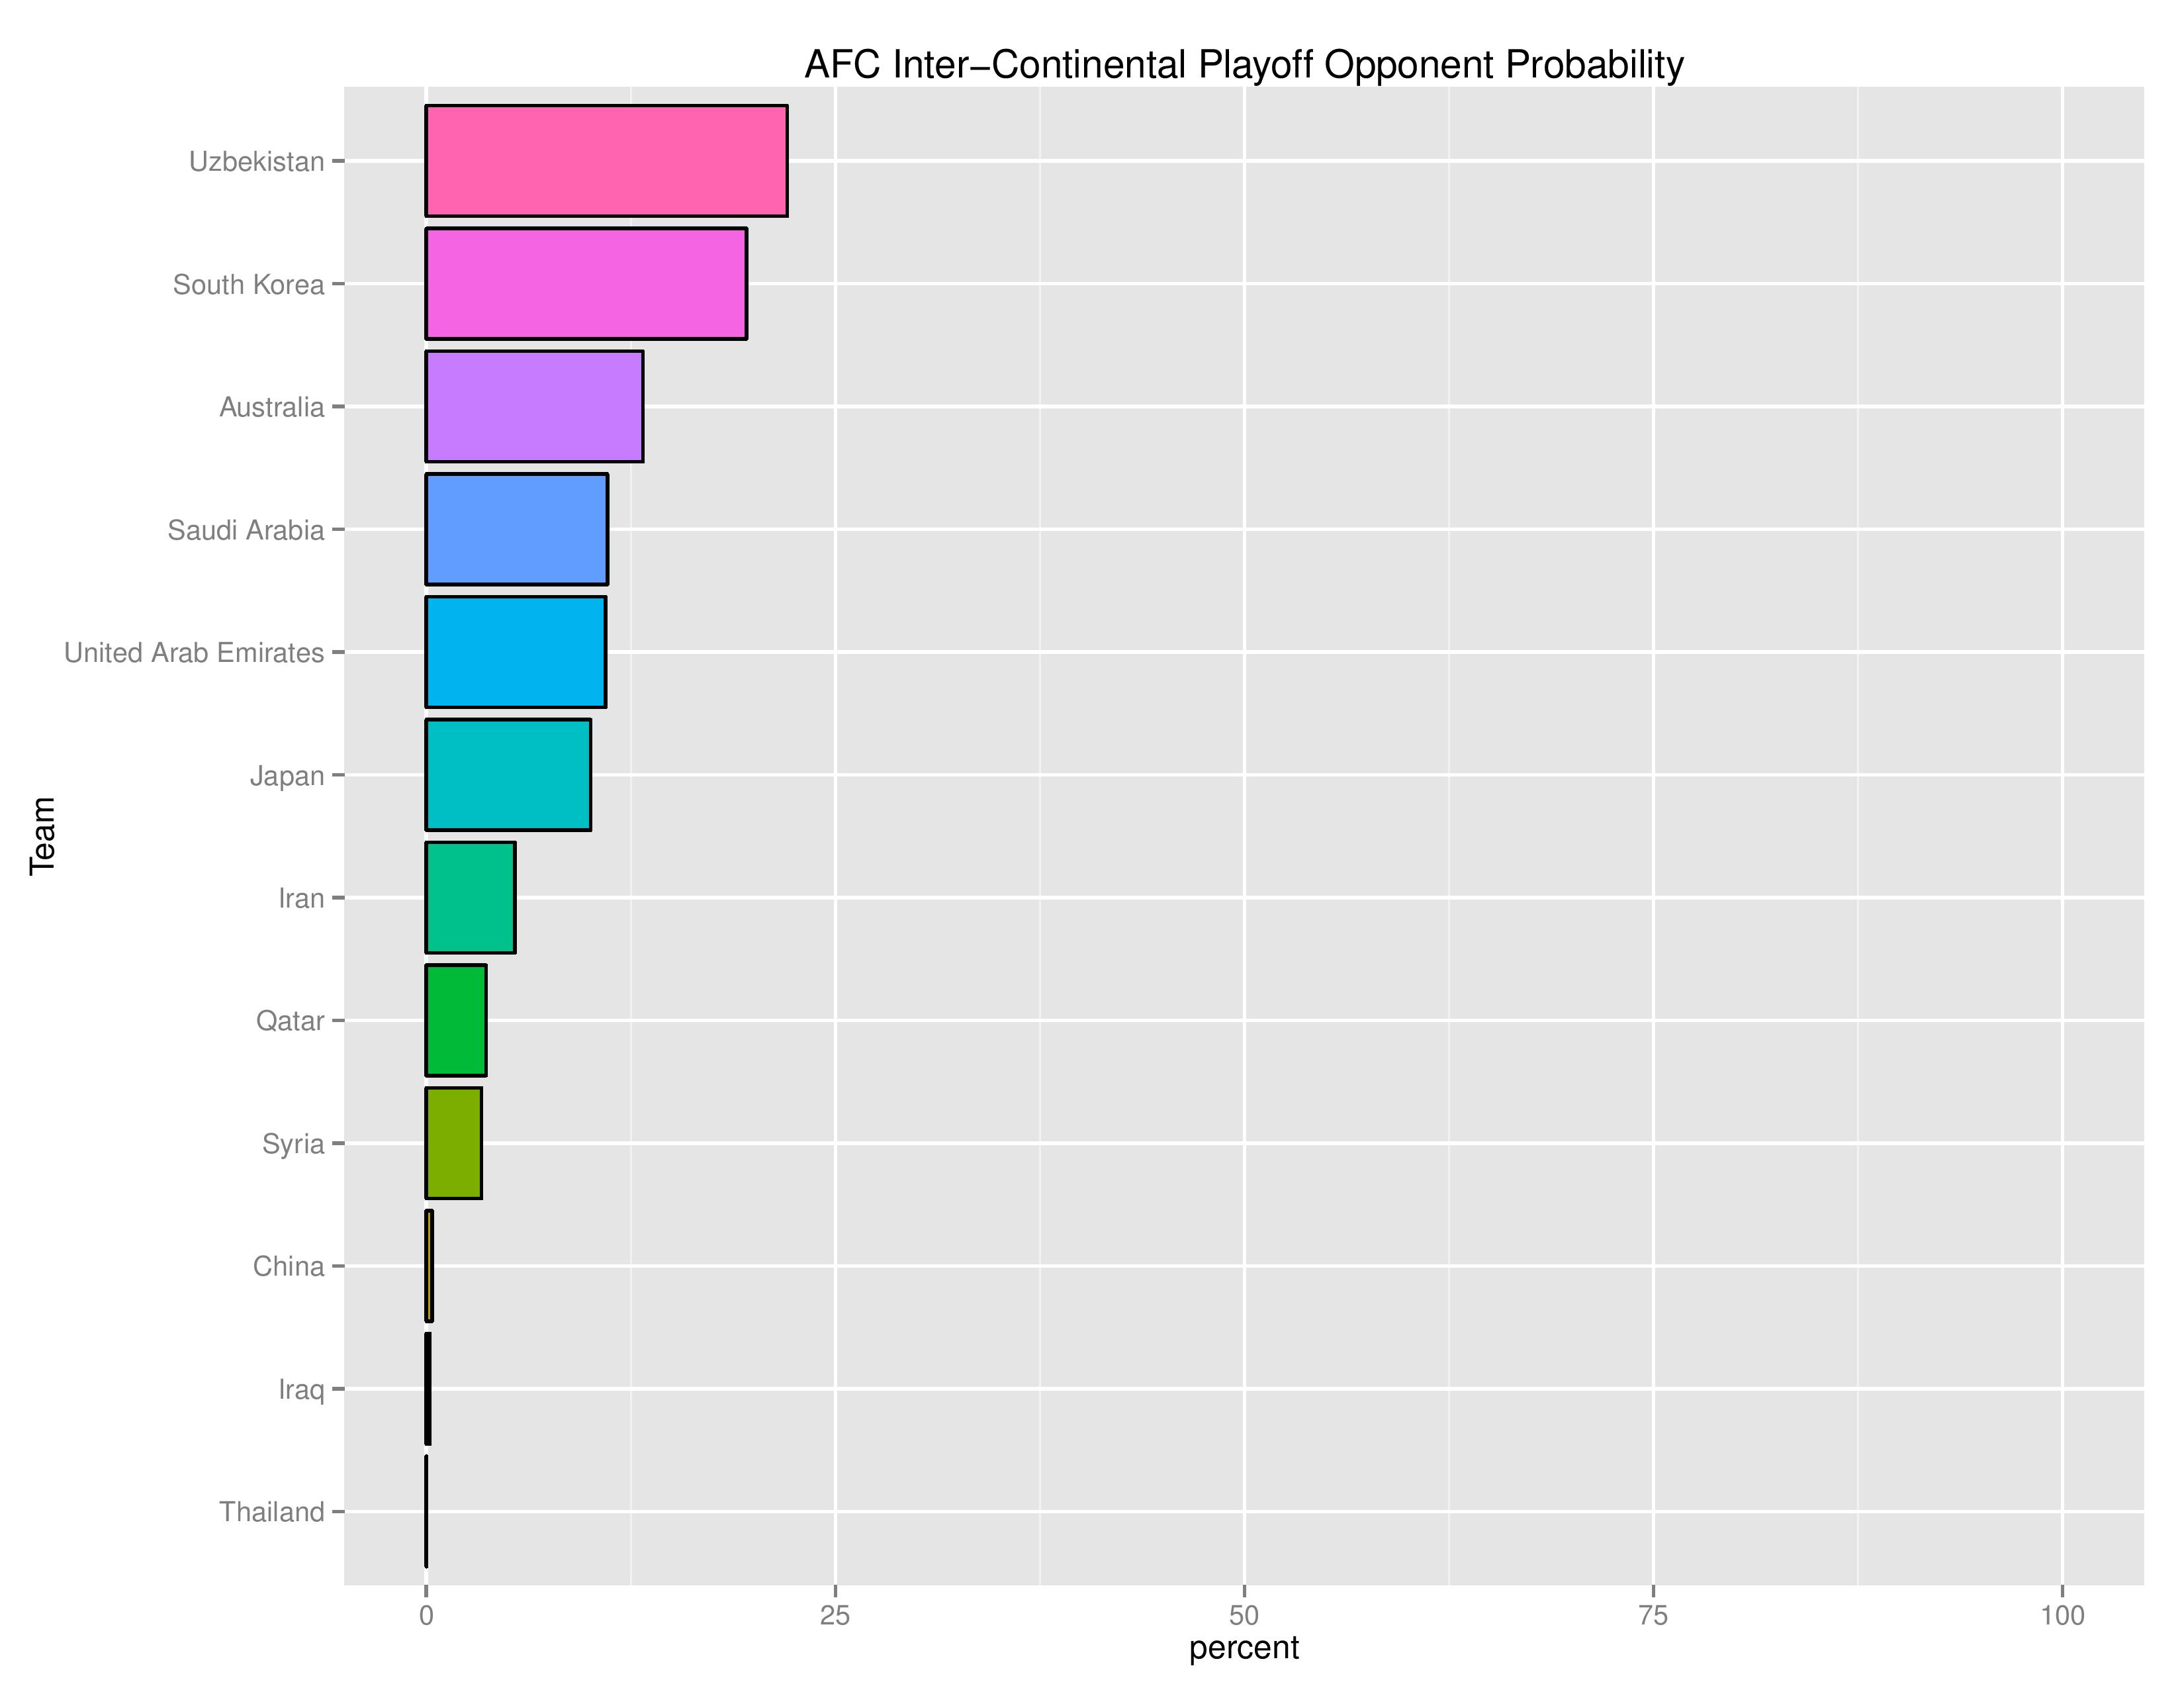
It is also worth pointing out that unlike the 2014 World Cup cycle, when CONCACAF was drawn against OFC for the inter-confederation playoffs and Mexico faced New Zealand for an easy-ish qualification, the 4th place Hex-finisher is by no means guaranteed a slot. The AFC is much stronger than the OFC even when you consider it is AFC’s 5th place (most likely Uzbekistan, South Korea, or Australia) compared with OFC’s 1st place (likely New Zealand).
Below are the current World Cup Qualification forecasts using data from games through November 16, 2016.
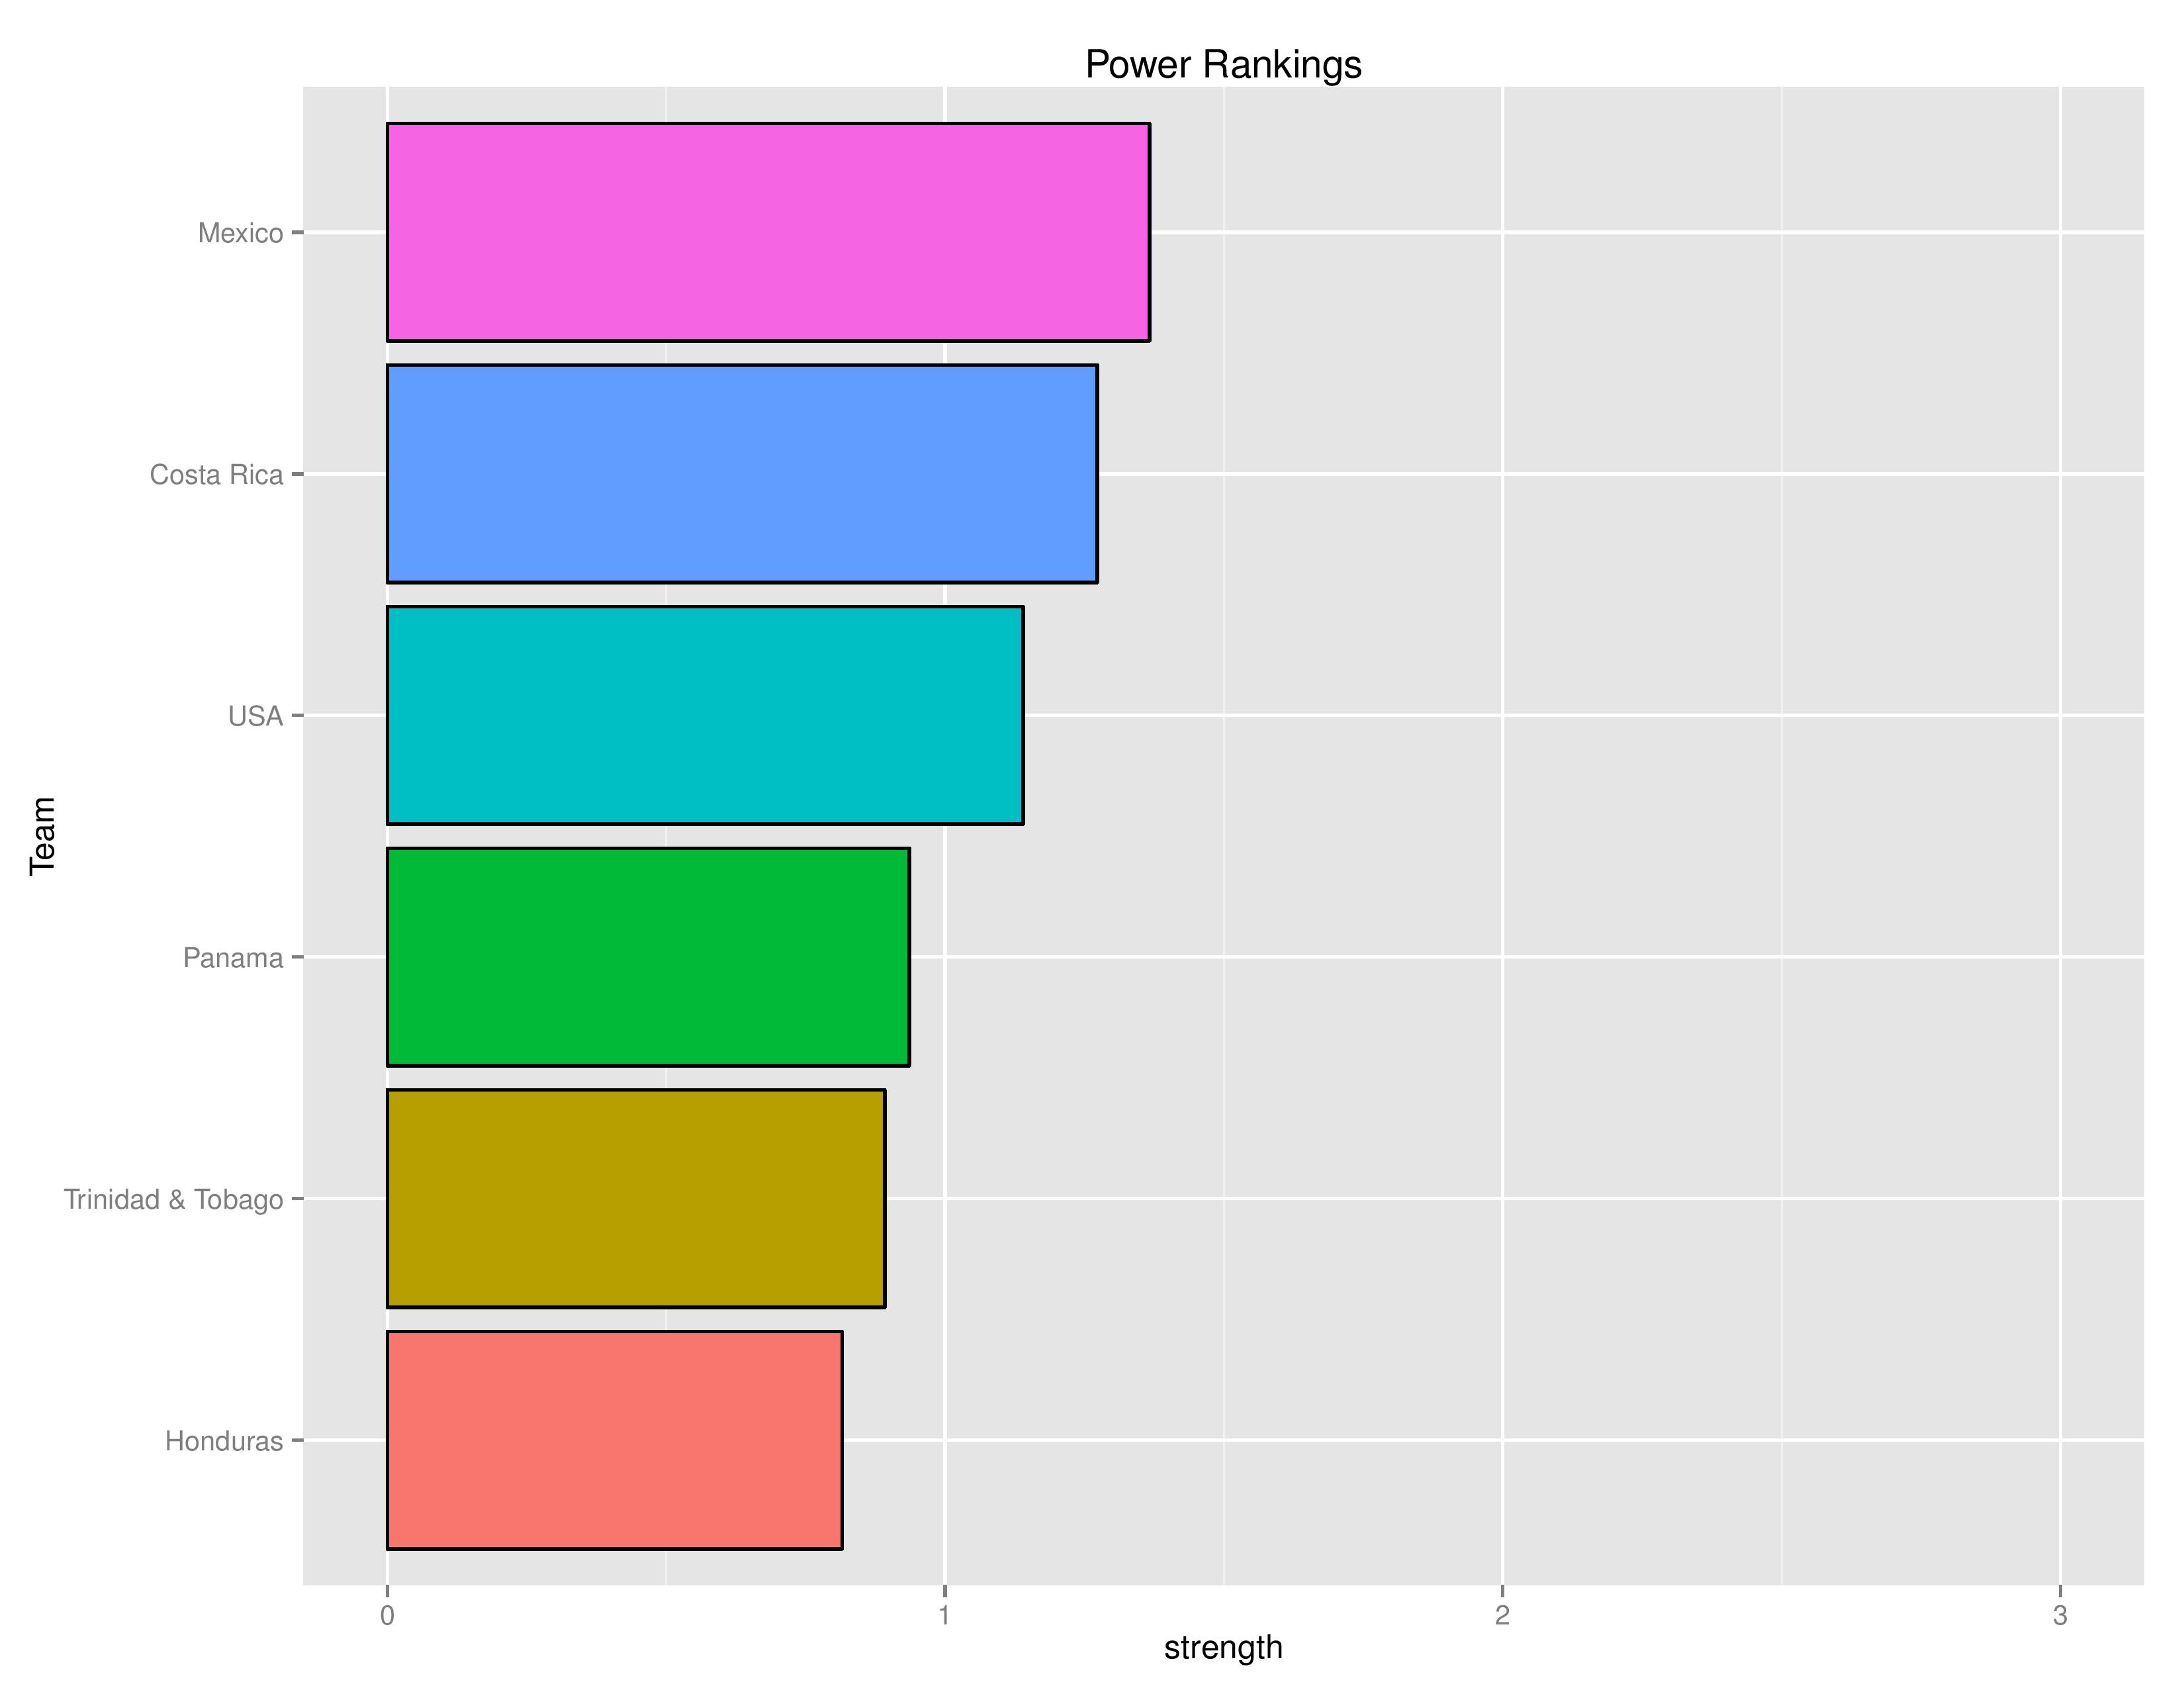
Power Rankings
The “Power Rankings” we concoct are the actual “strength” of the team according to competitive expectations. The value represented on the X-Axis is the average amount of points we expect that team to receive when playing against every national team that participated in the previous world cup on neutral territory:
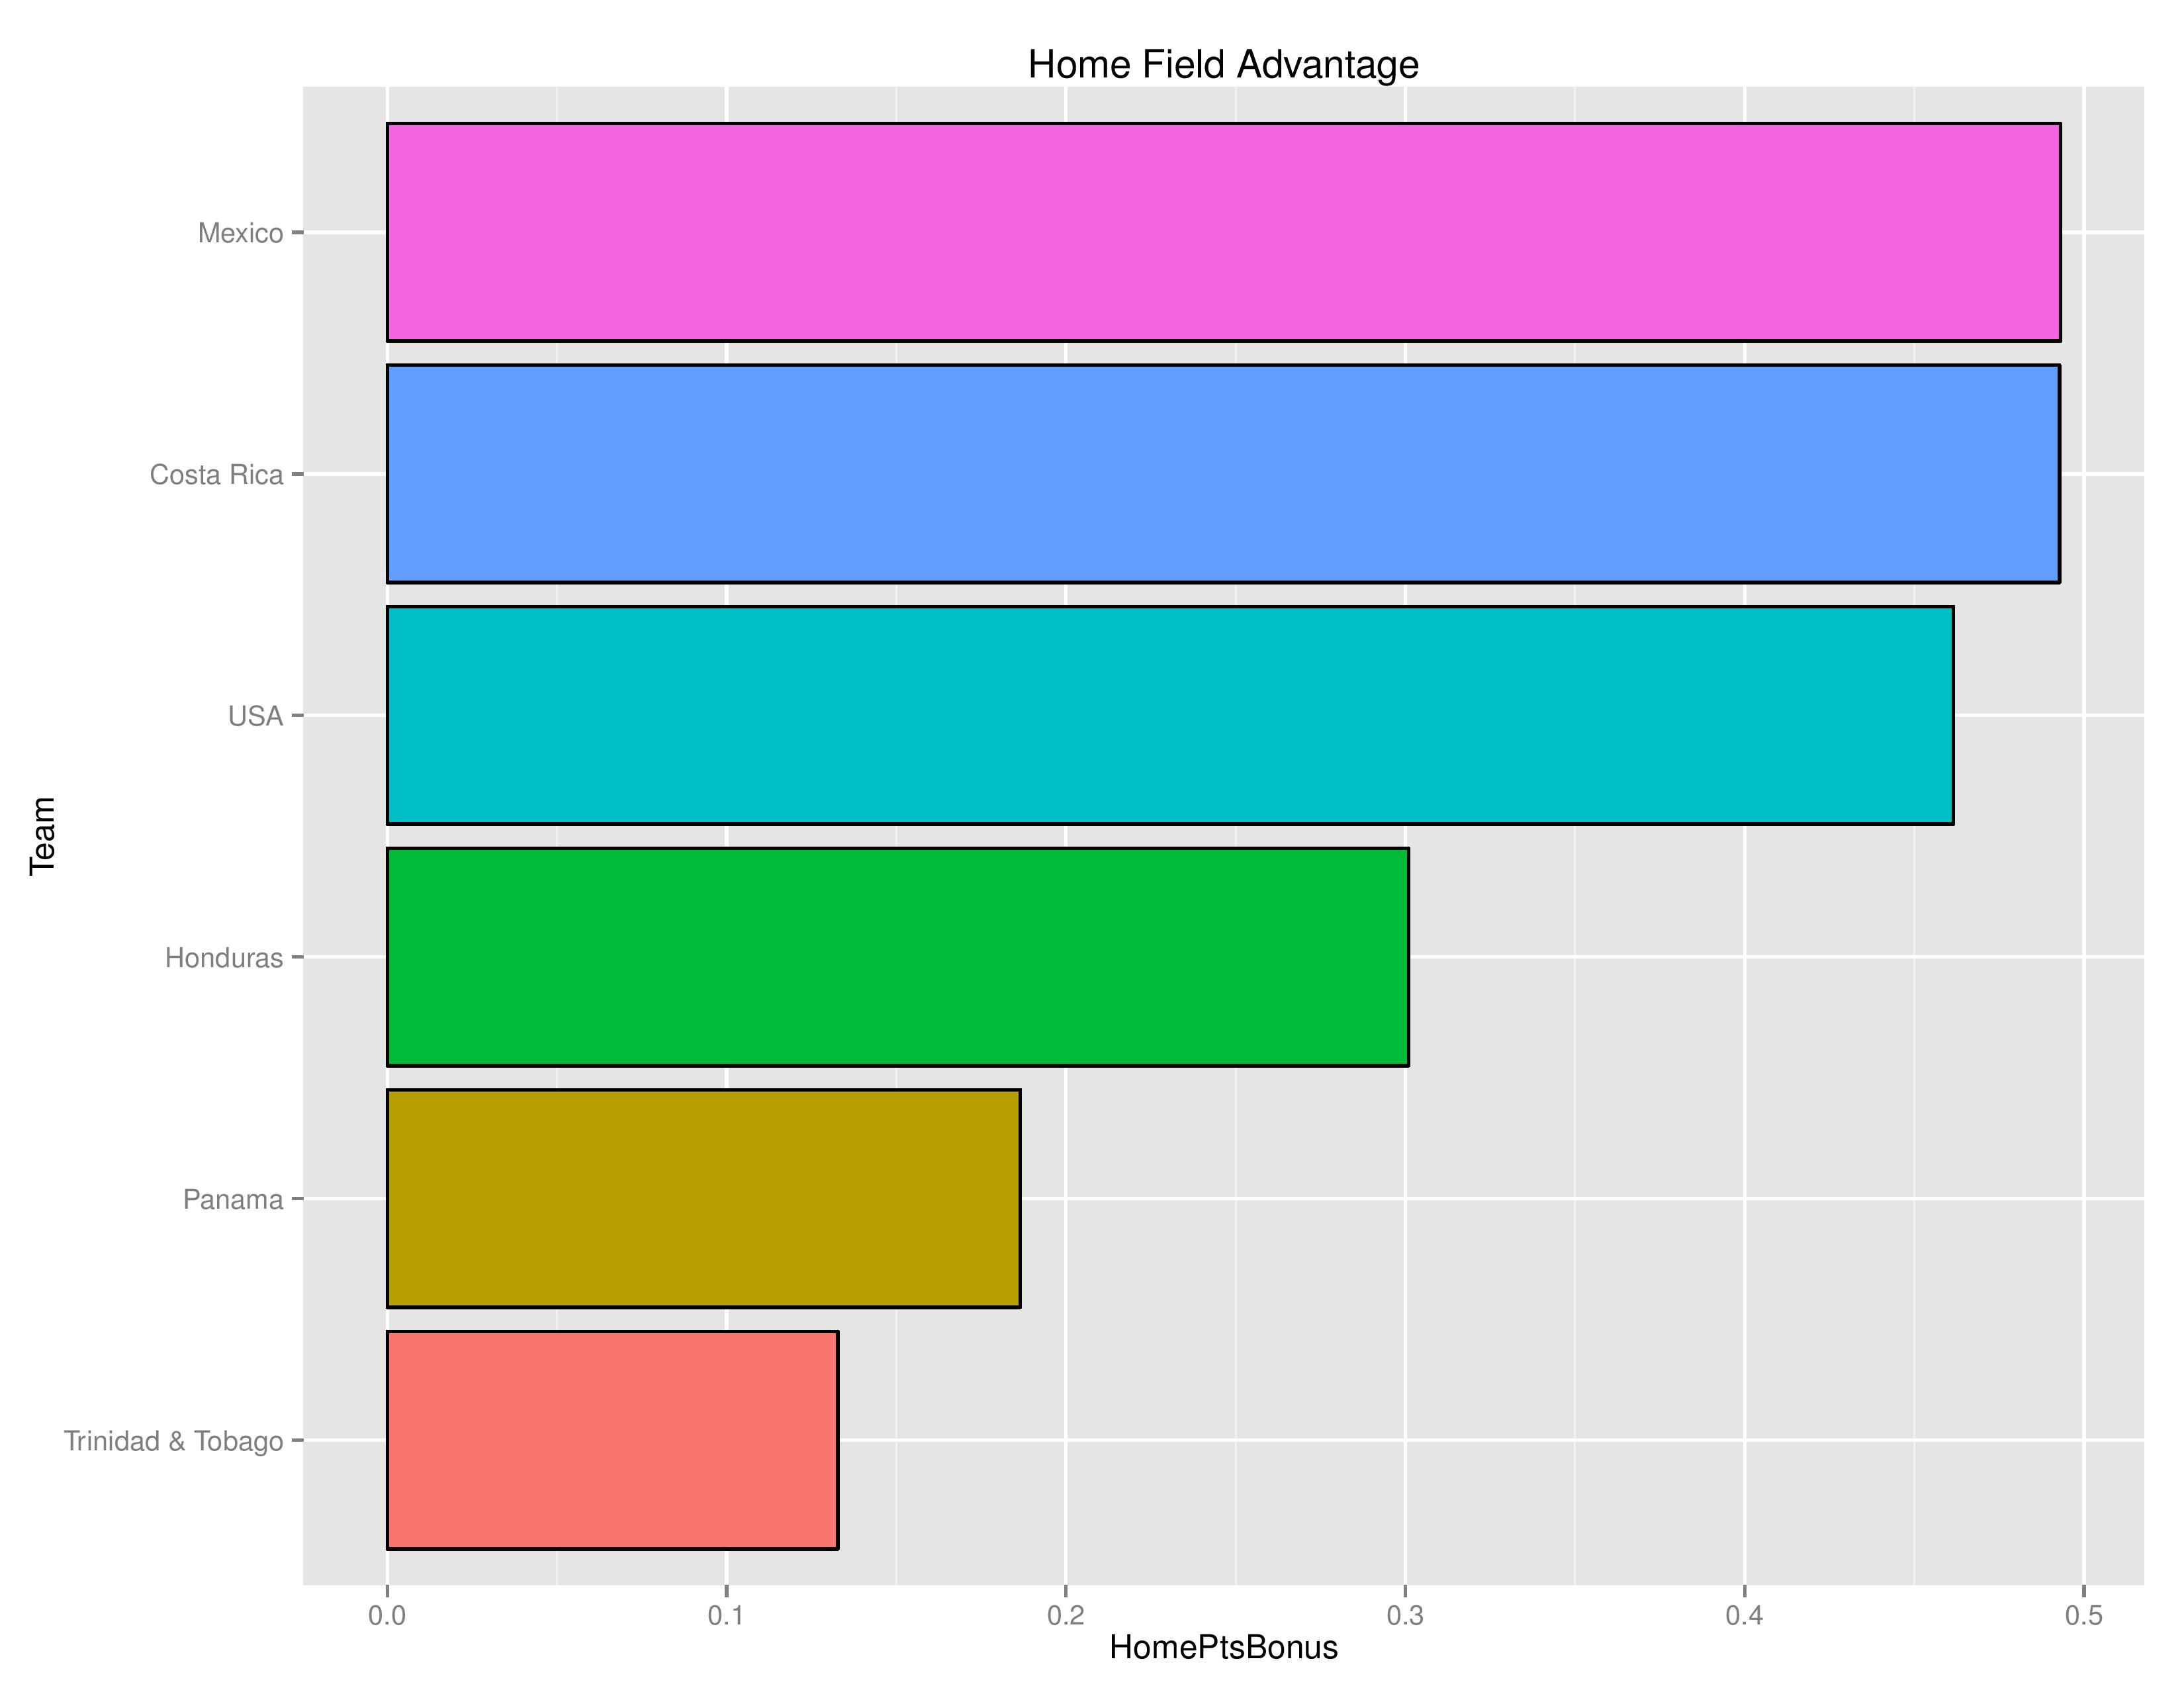
The following chart shows the average points bonus for a particular nation’s home field advantage. This is important in explaining why teams may seem to have favorable odds to qualify when lower ranked.
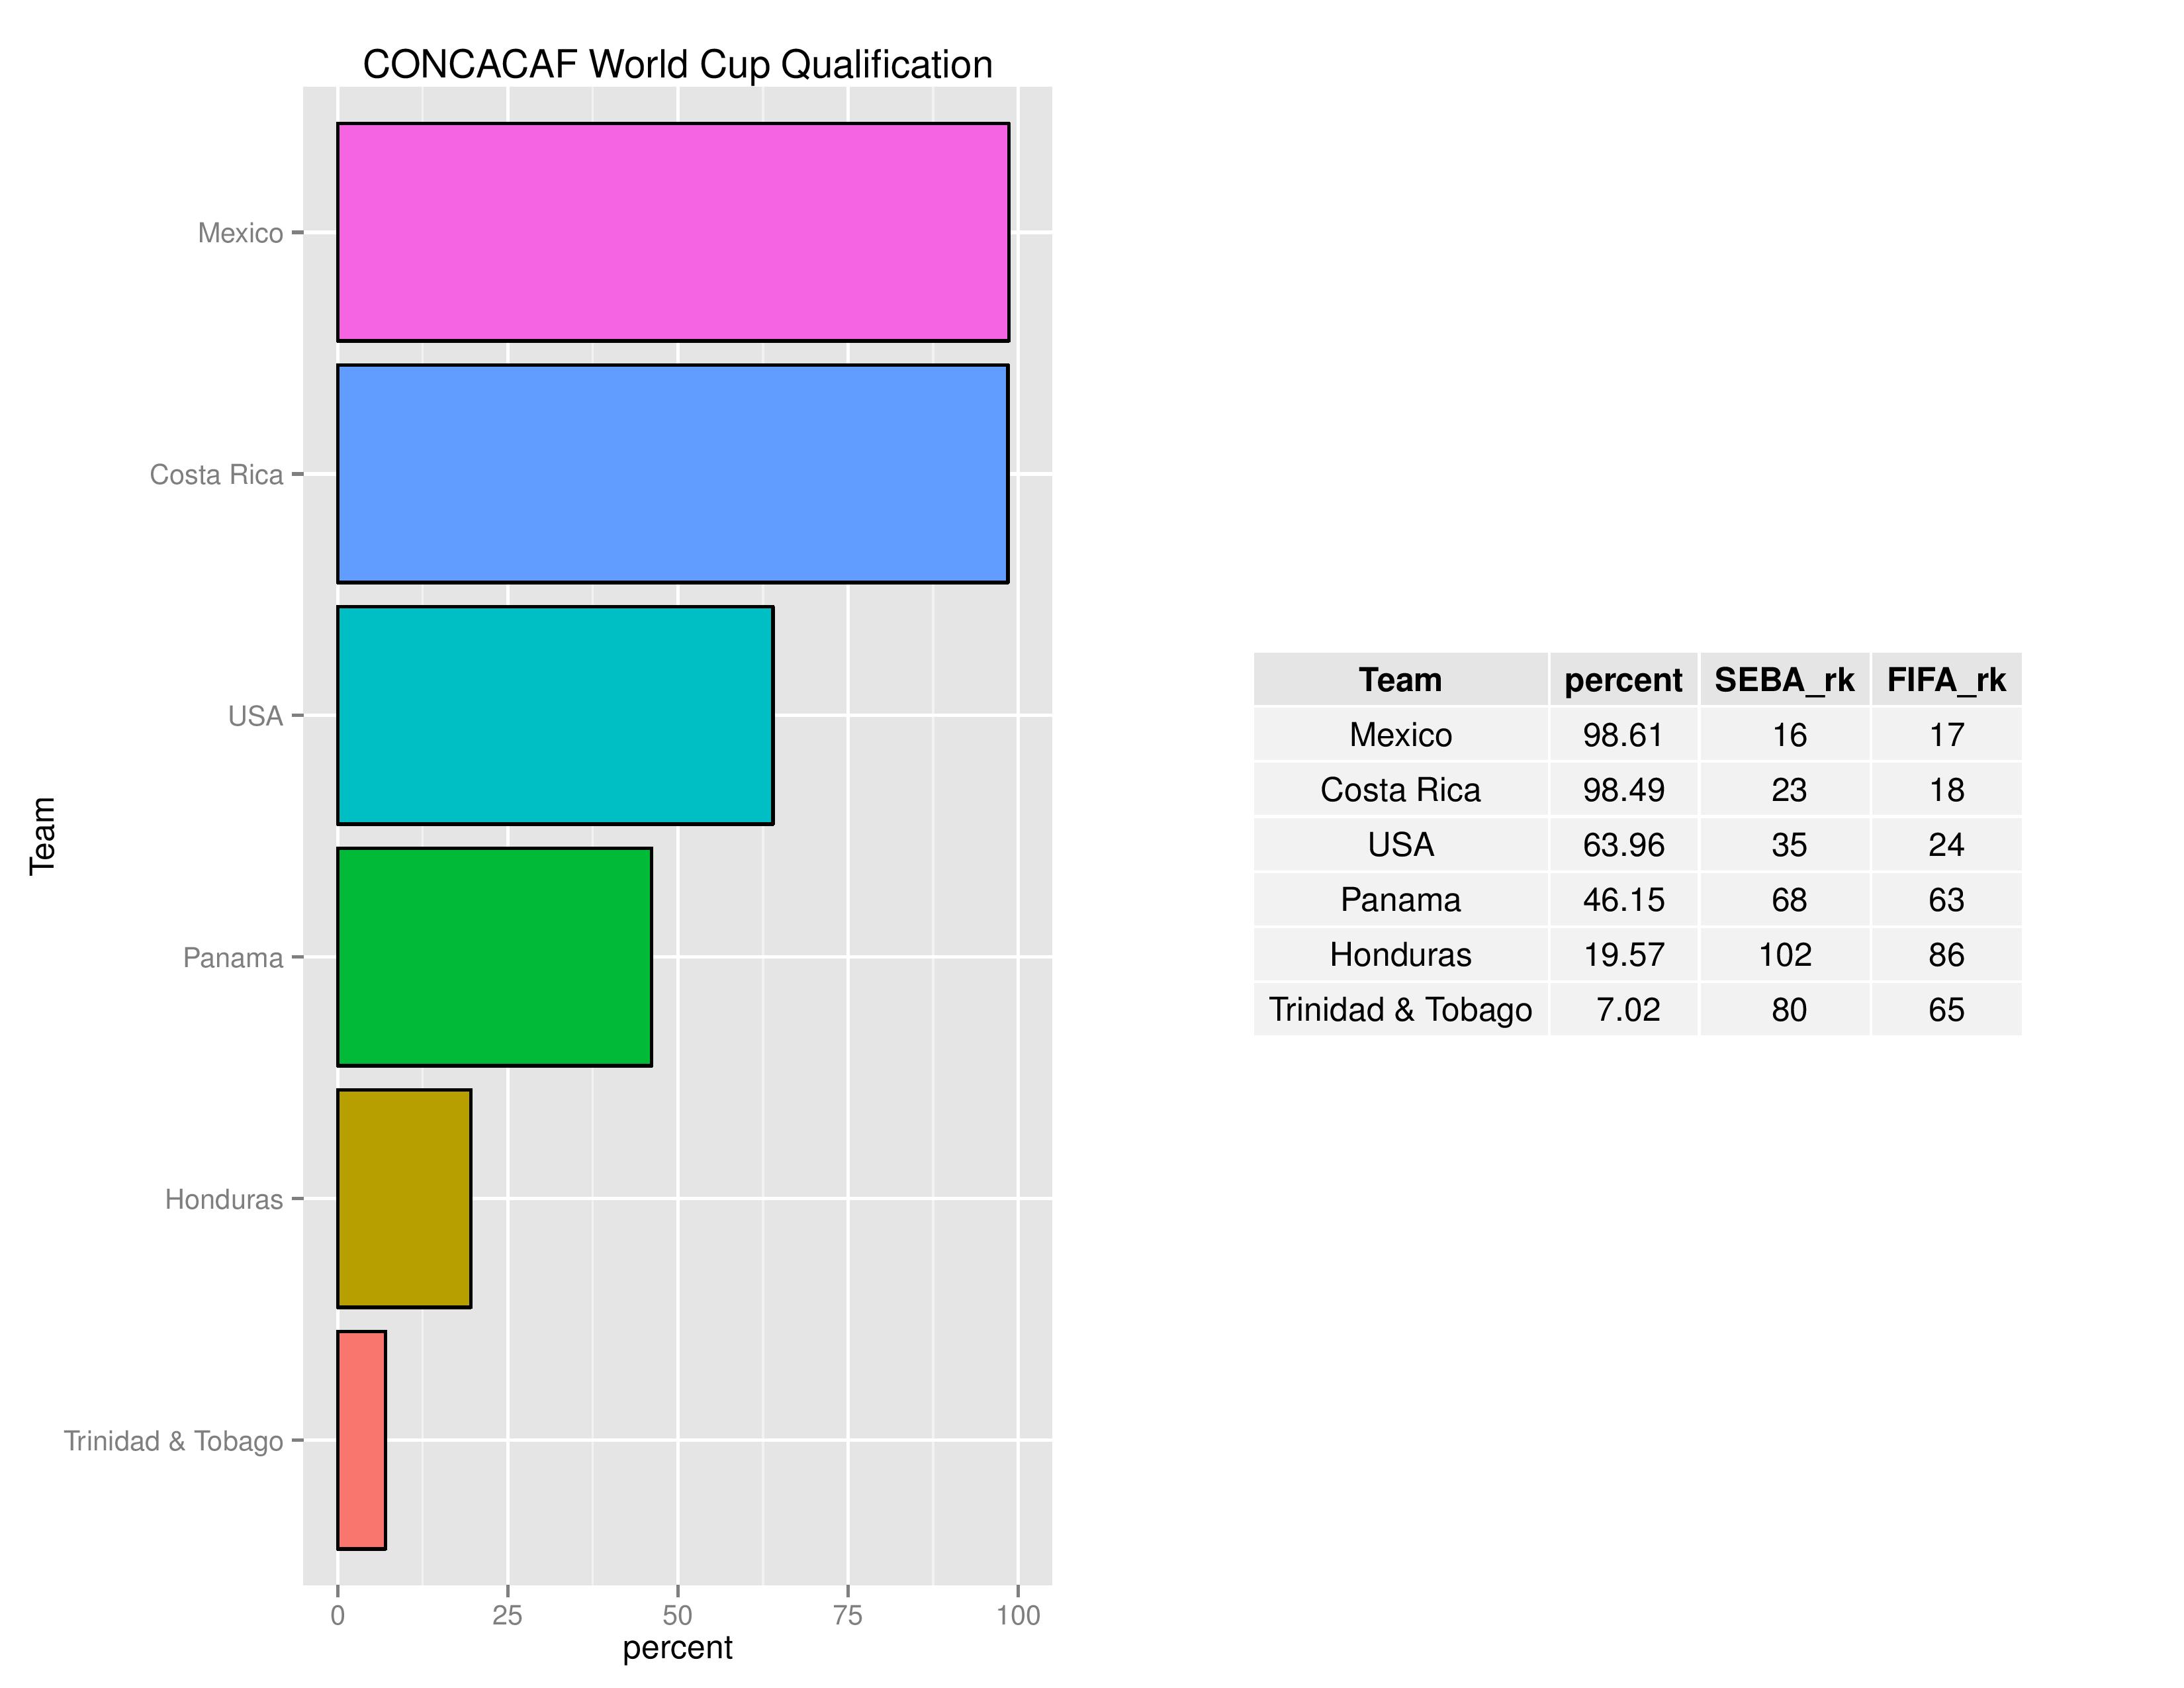
Probability Outcomes
USA has declined from 75.16% to 63.96% in their chance of qualifying for the World Cup. They have also declined in SEBA’s rankings from 32 to 35 since their humiliating loss to Costa Rica.
Finally, the FIFA rank is from the most recently available one from October 20.
The next chart shows the probabilities of USA’s potential finishing in the Hex.

The following chart shows the likelihood of the AFC opponent for the inter-confederation opponent (4th place CONCACAF vs. 5th place AFC).
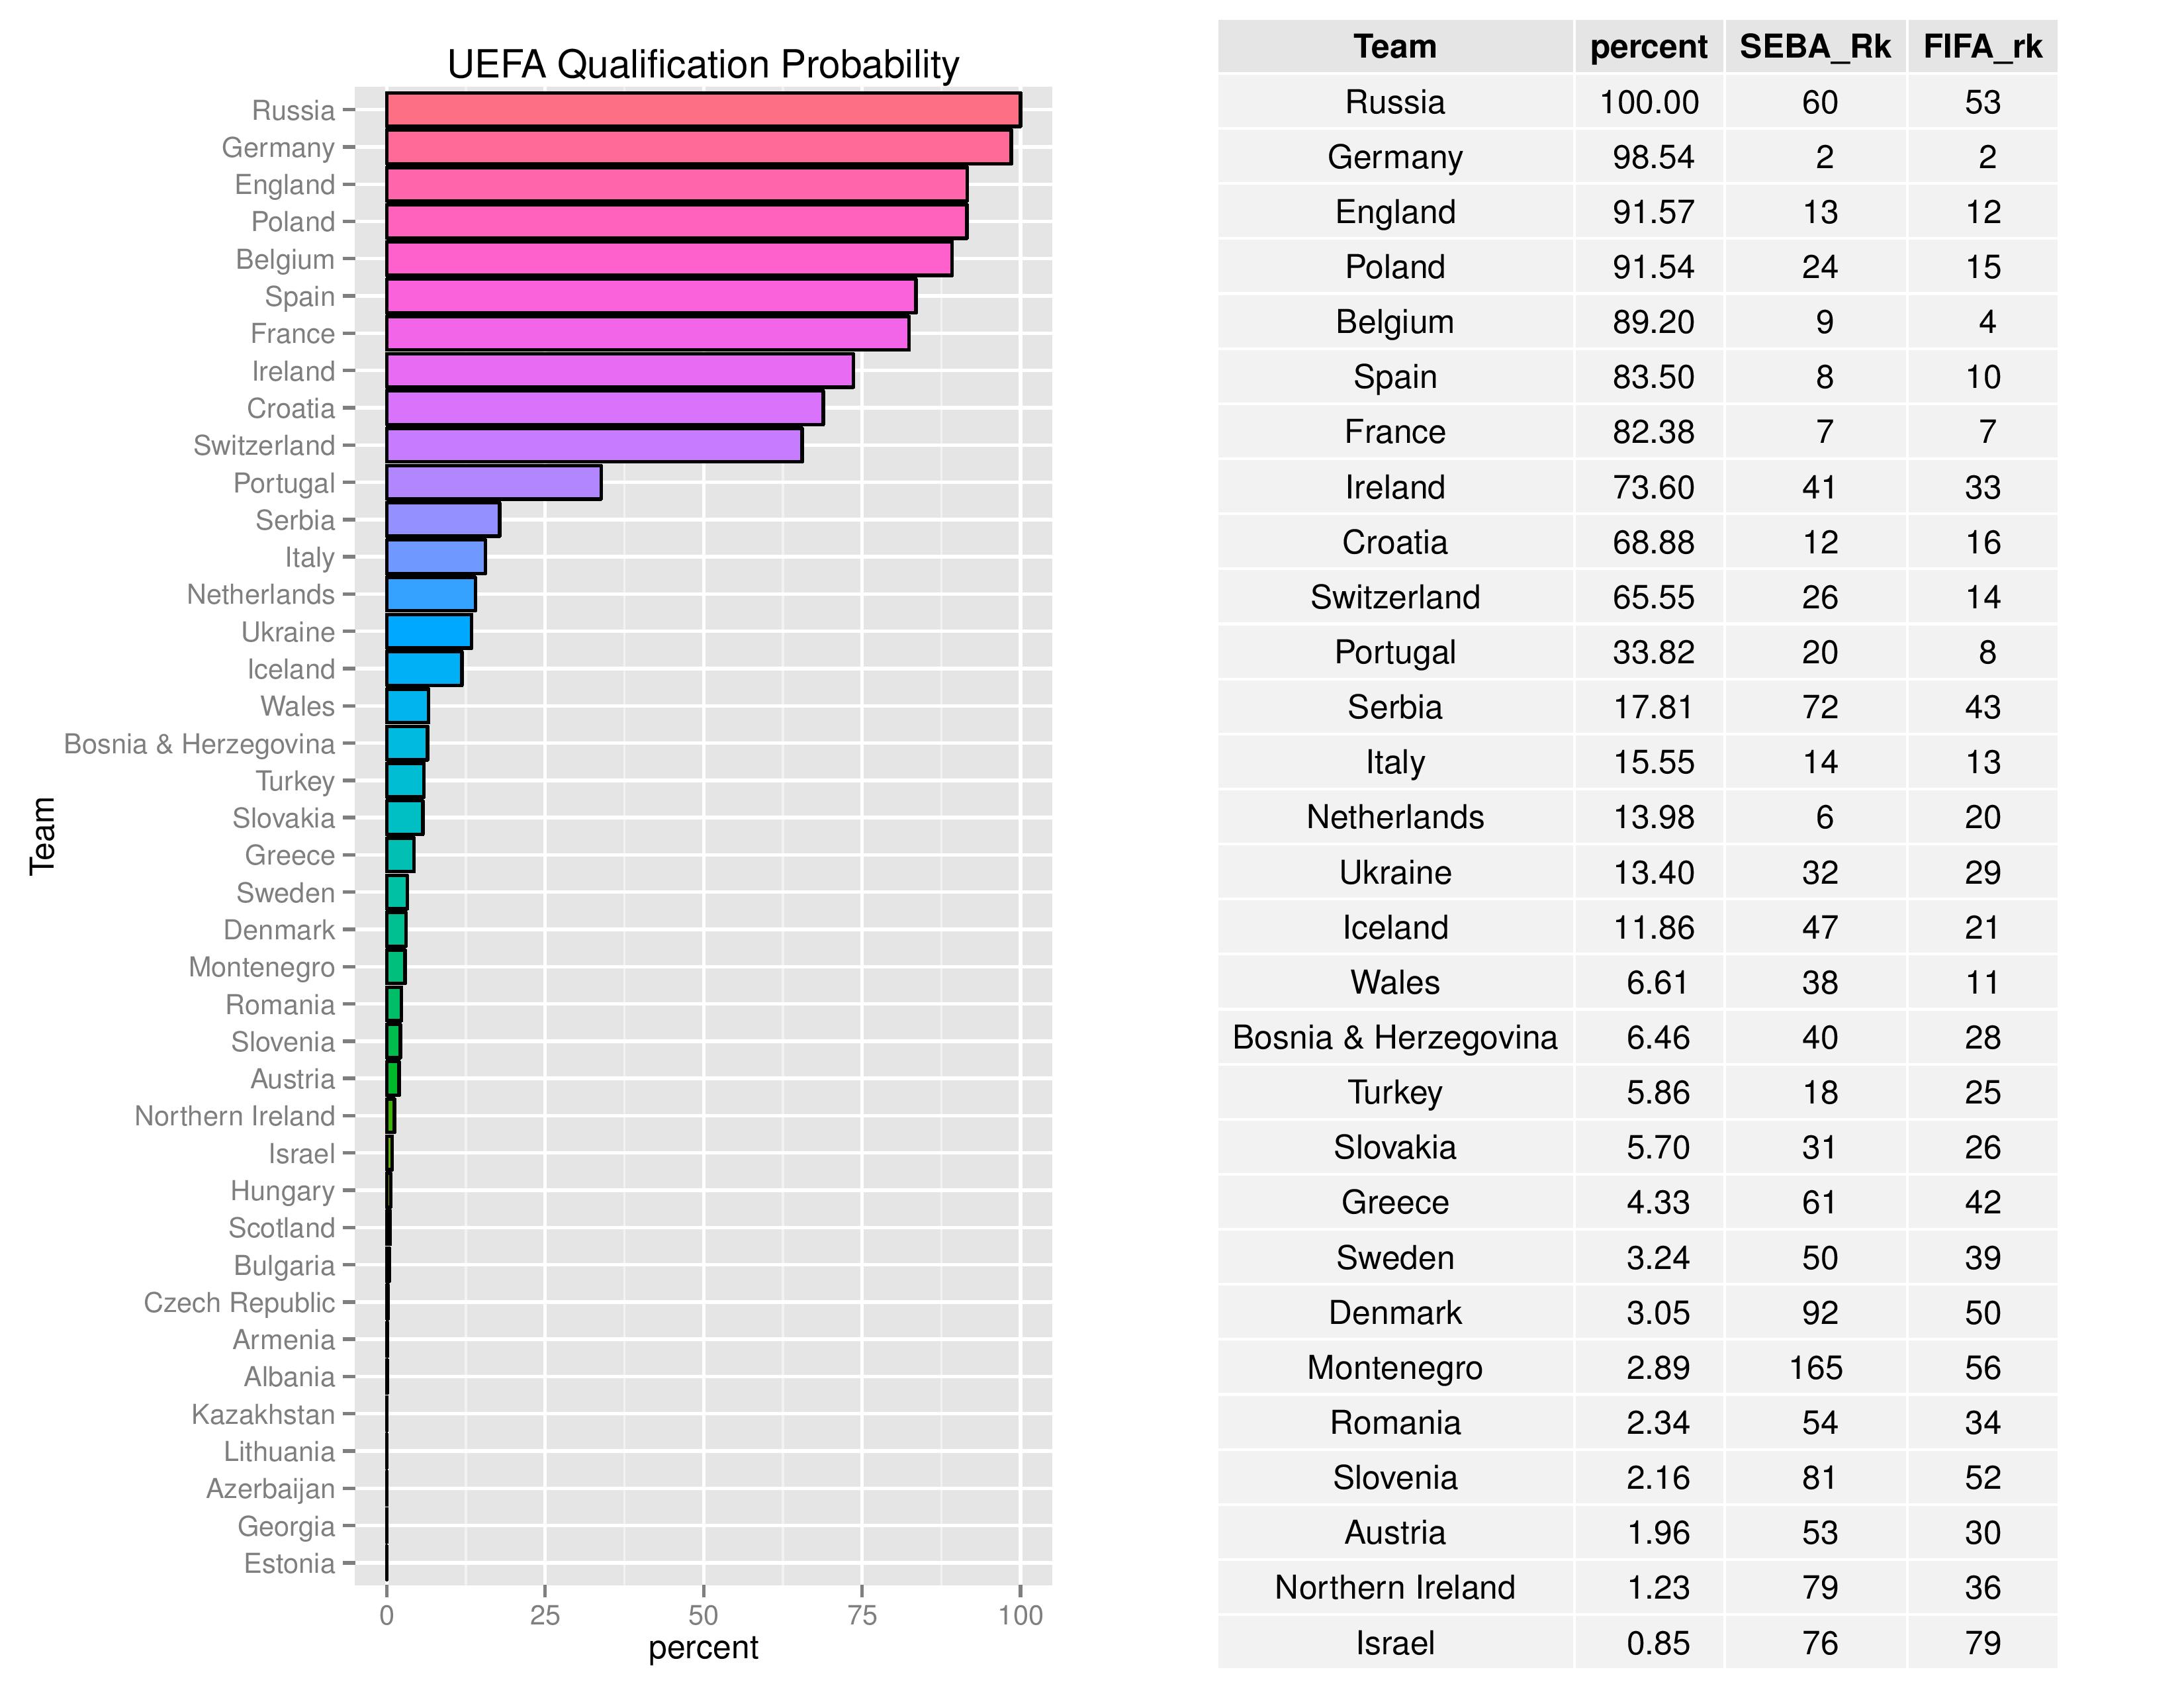
The following chart shows the “Snub Index.” The idea is based on, if the World Cup were to be a tournament for the 32 truly-top teams in the world (at least according to SEBA), then this chart is sorted by how unfortunately damaged the top 32 teams’ chances are in qualifying for the World Cup (the table shows only the top 29 teams but the graph shows all teams with a chance).
The USA is no longer in this chart because they are no longer among the top 32 teams according to SEBA.

On the other side, this chart shows the nations outside of the top-32 who, perhaps unfairly, benefit from an imperfect qualification system and are ranked by their benefit (the table shows only the top 29 teams but the graph shows all teams with a chance).
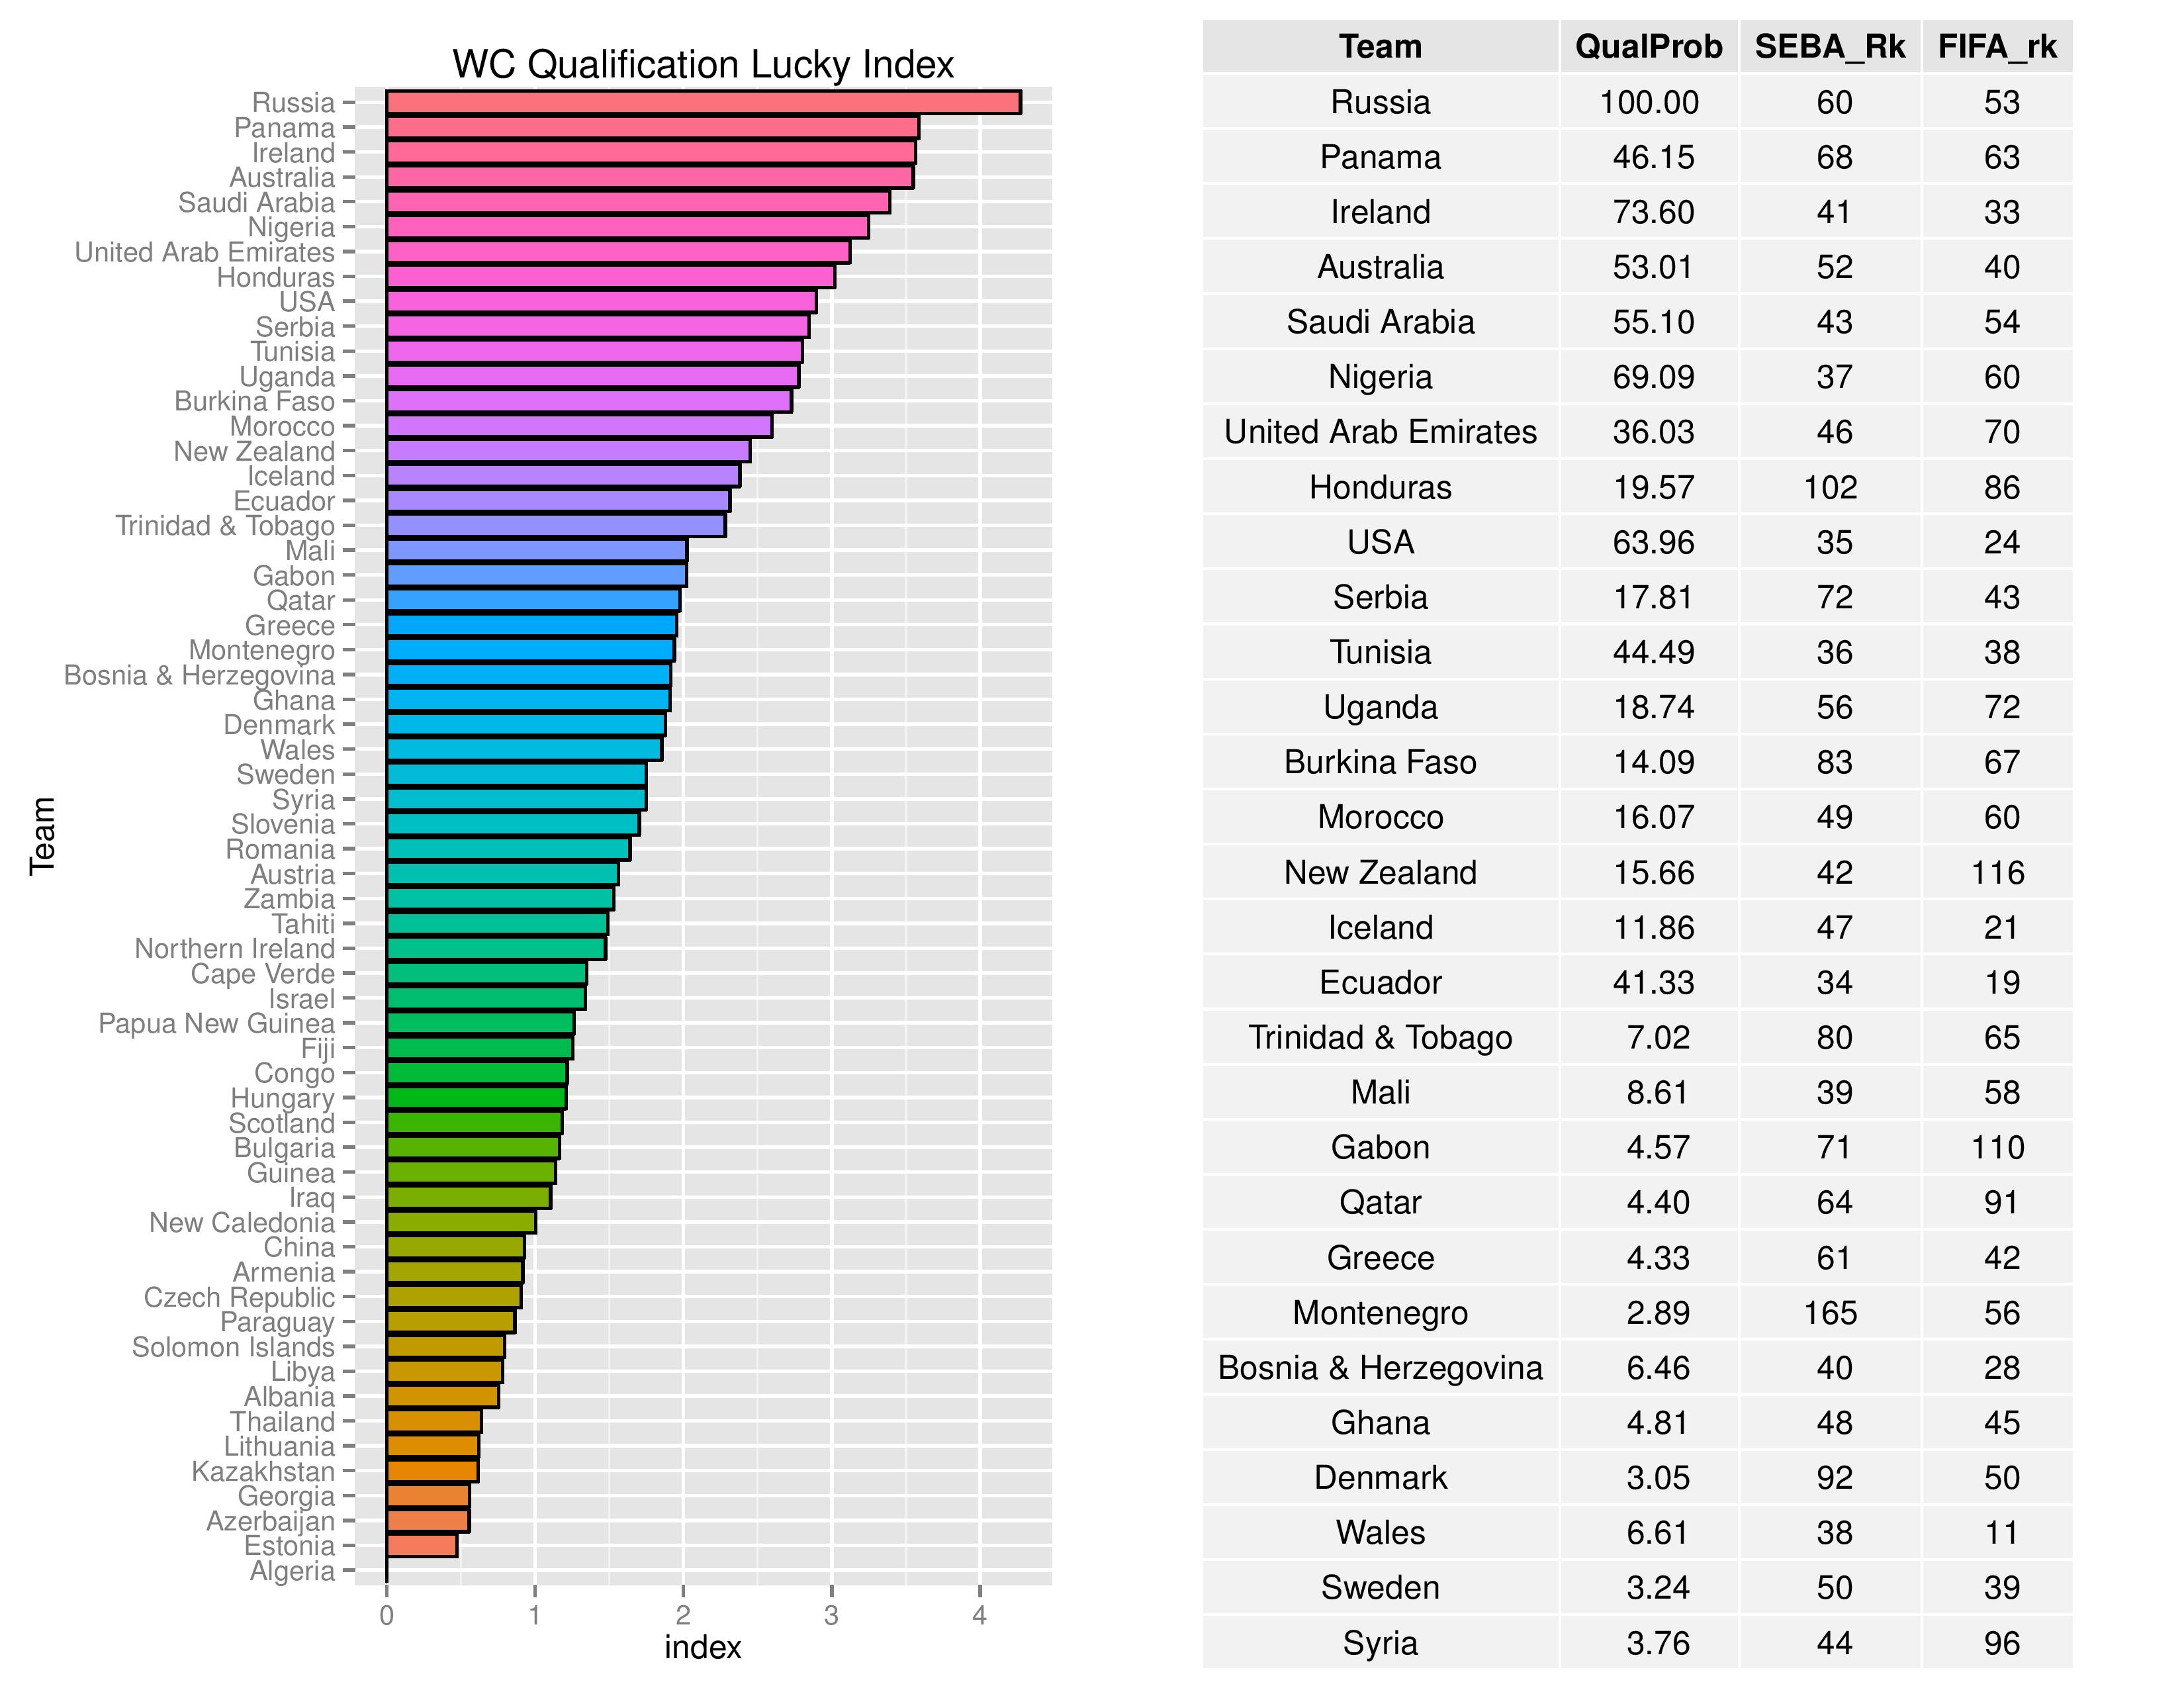
The next charts show the probabilities of other confederations qualifying for the World Cup.
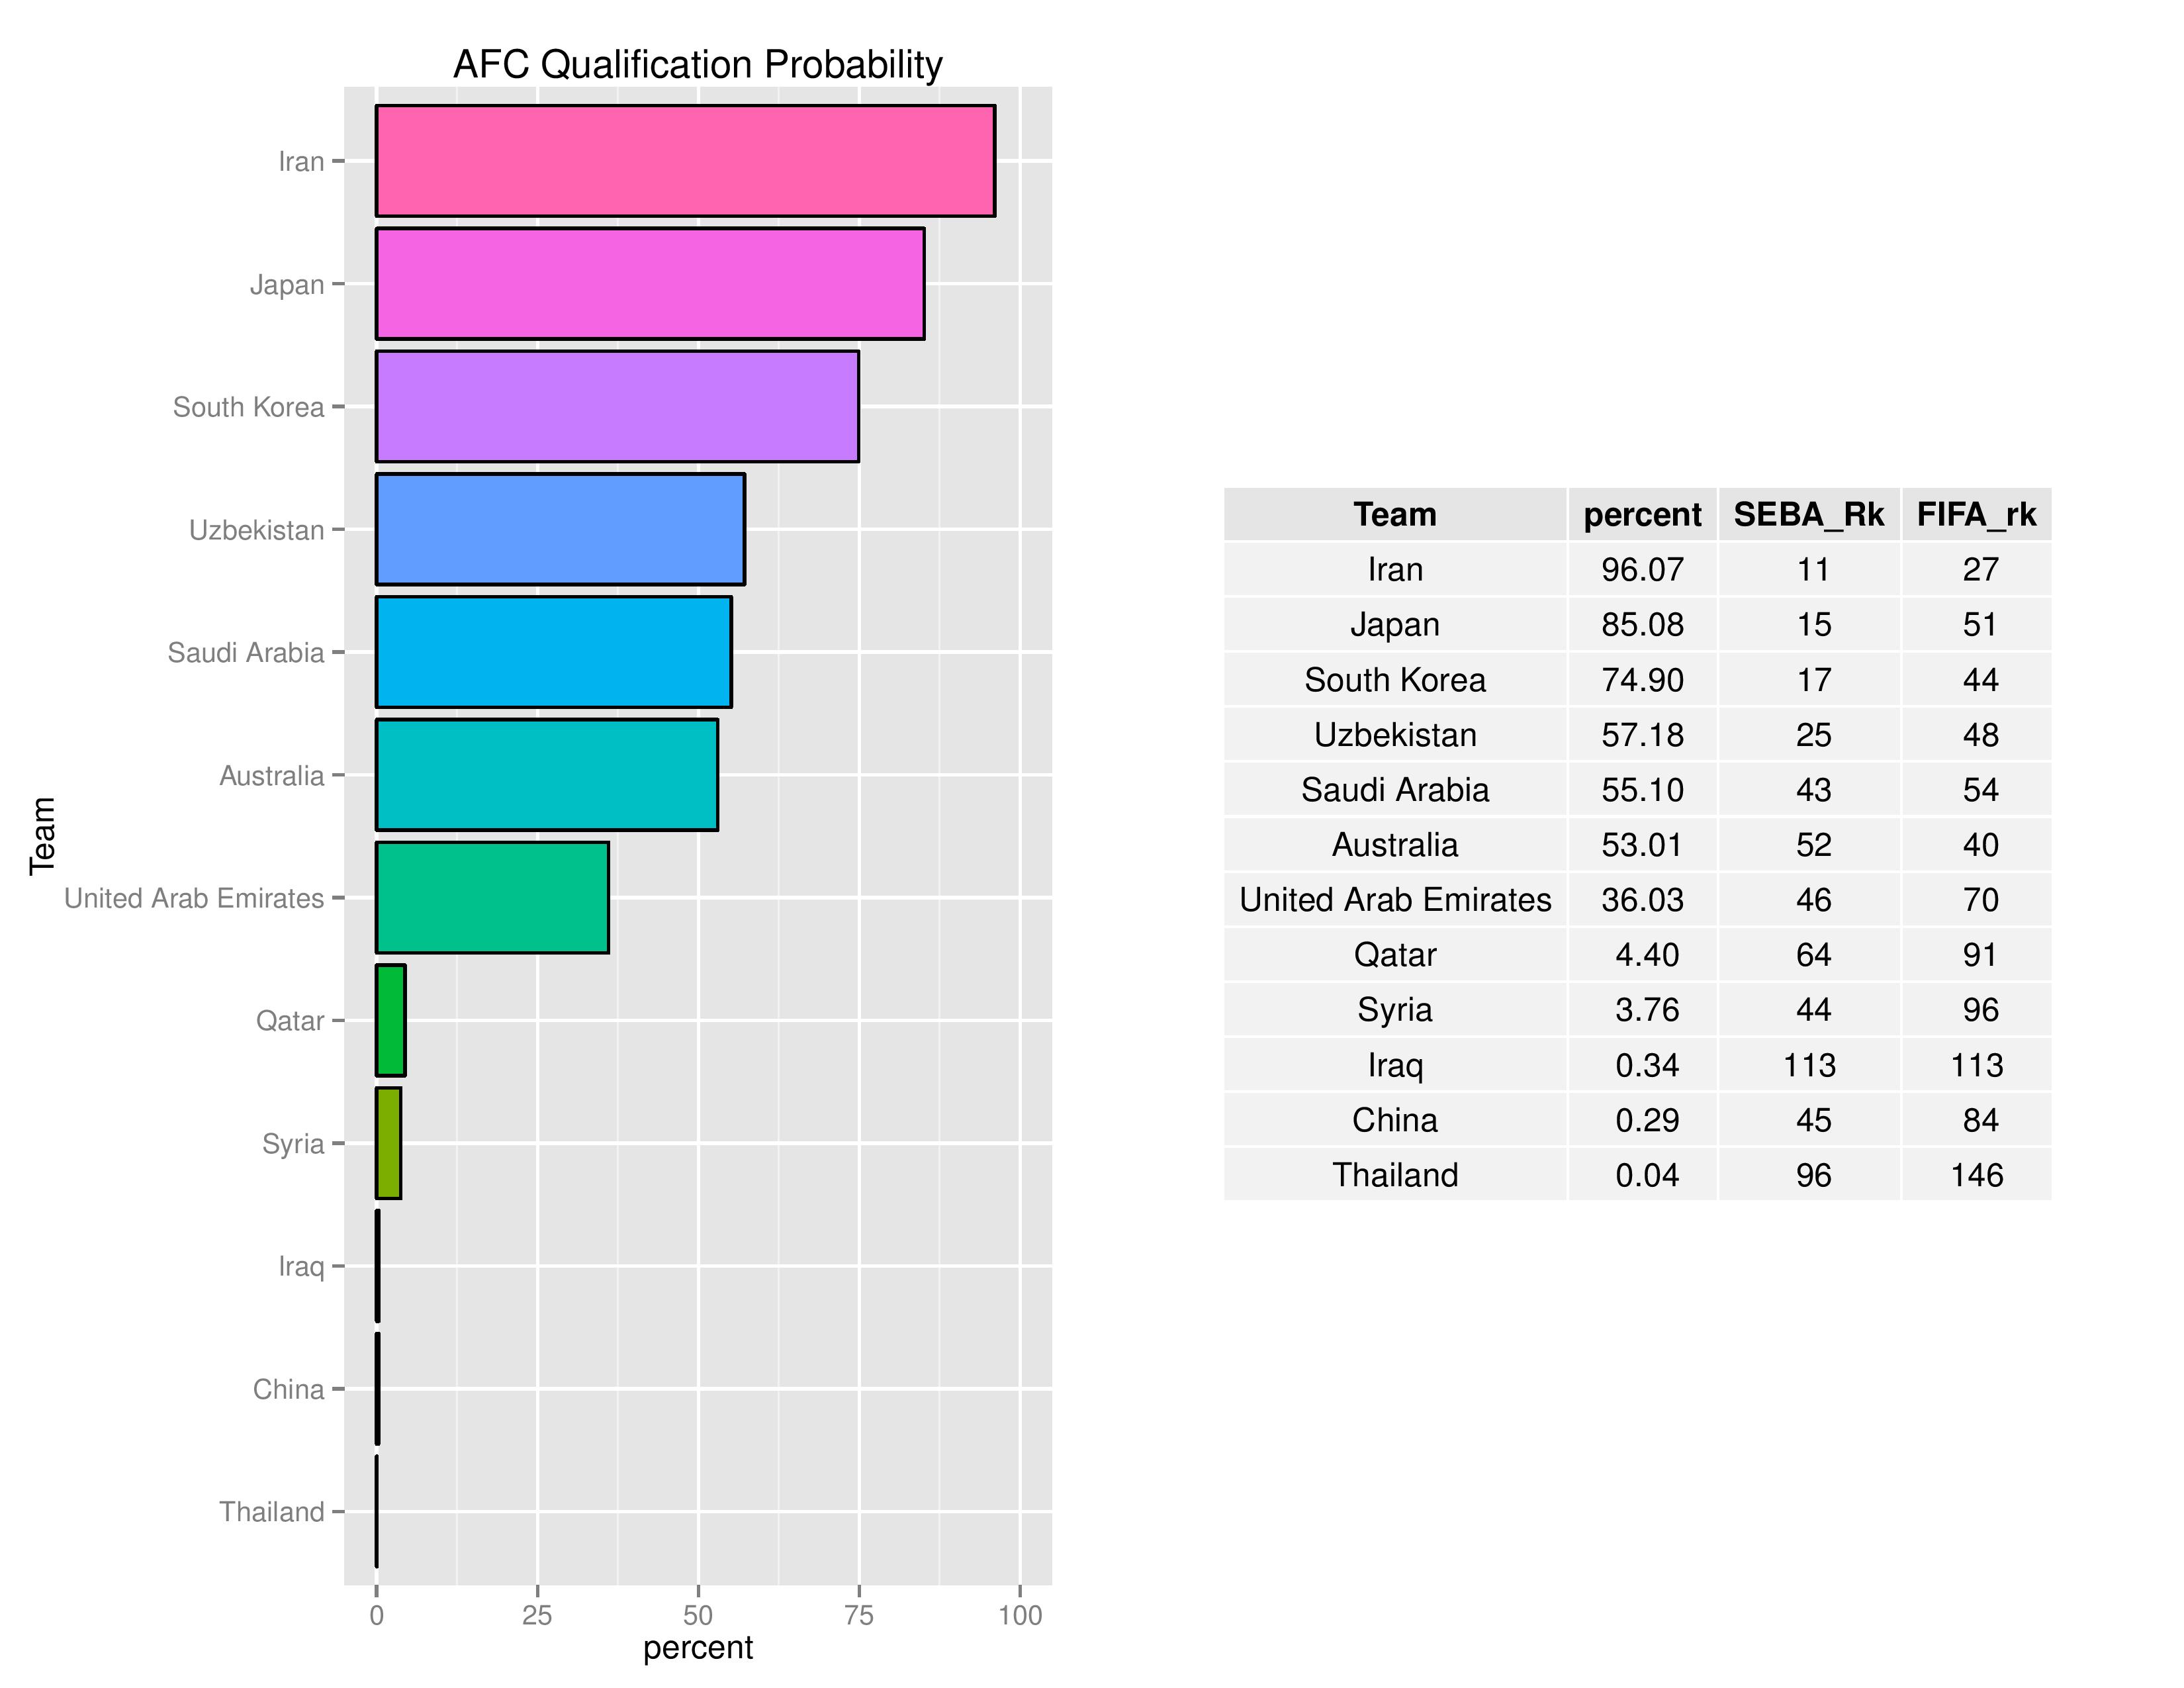
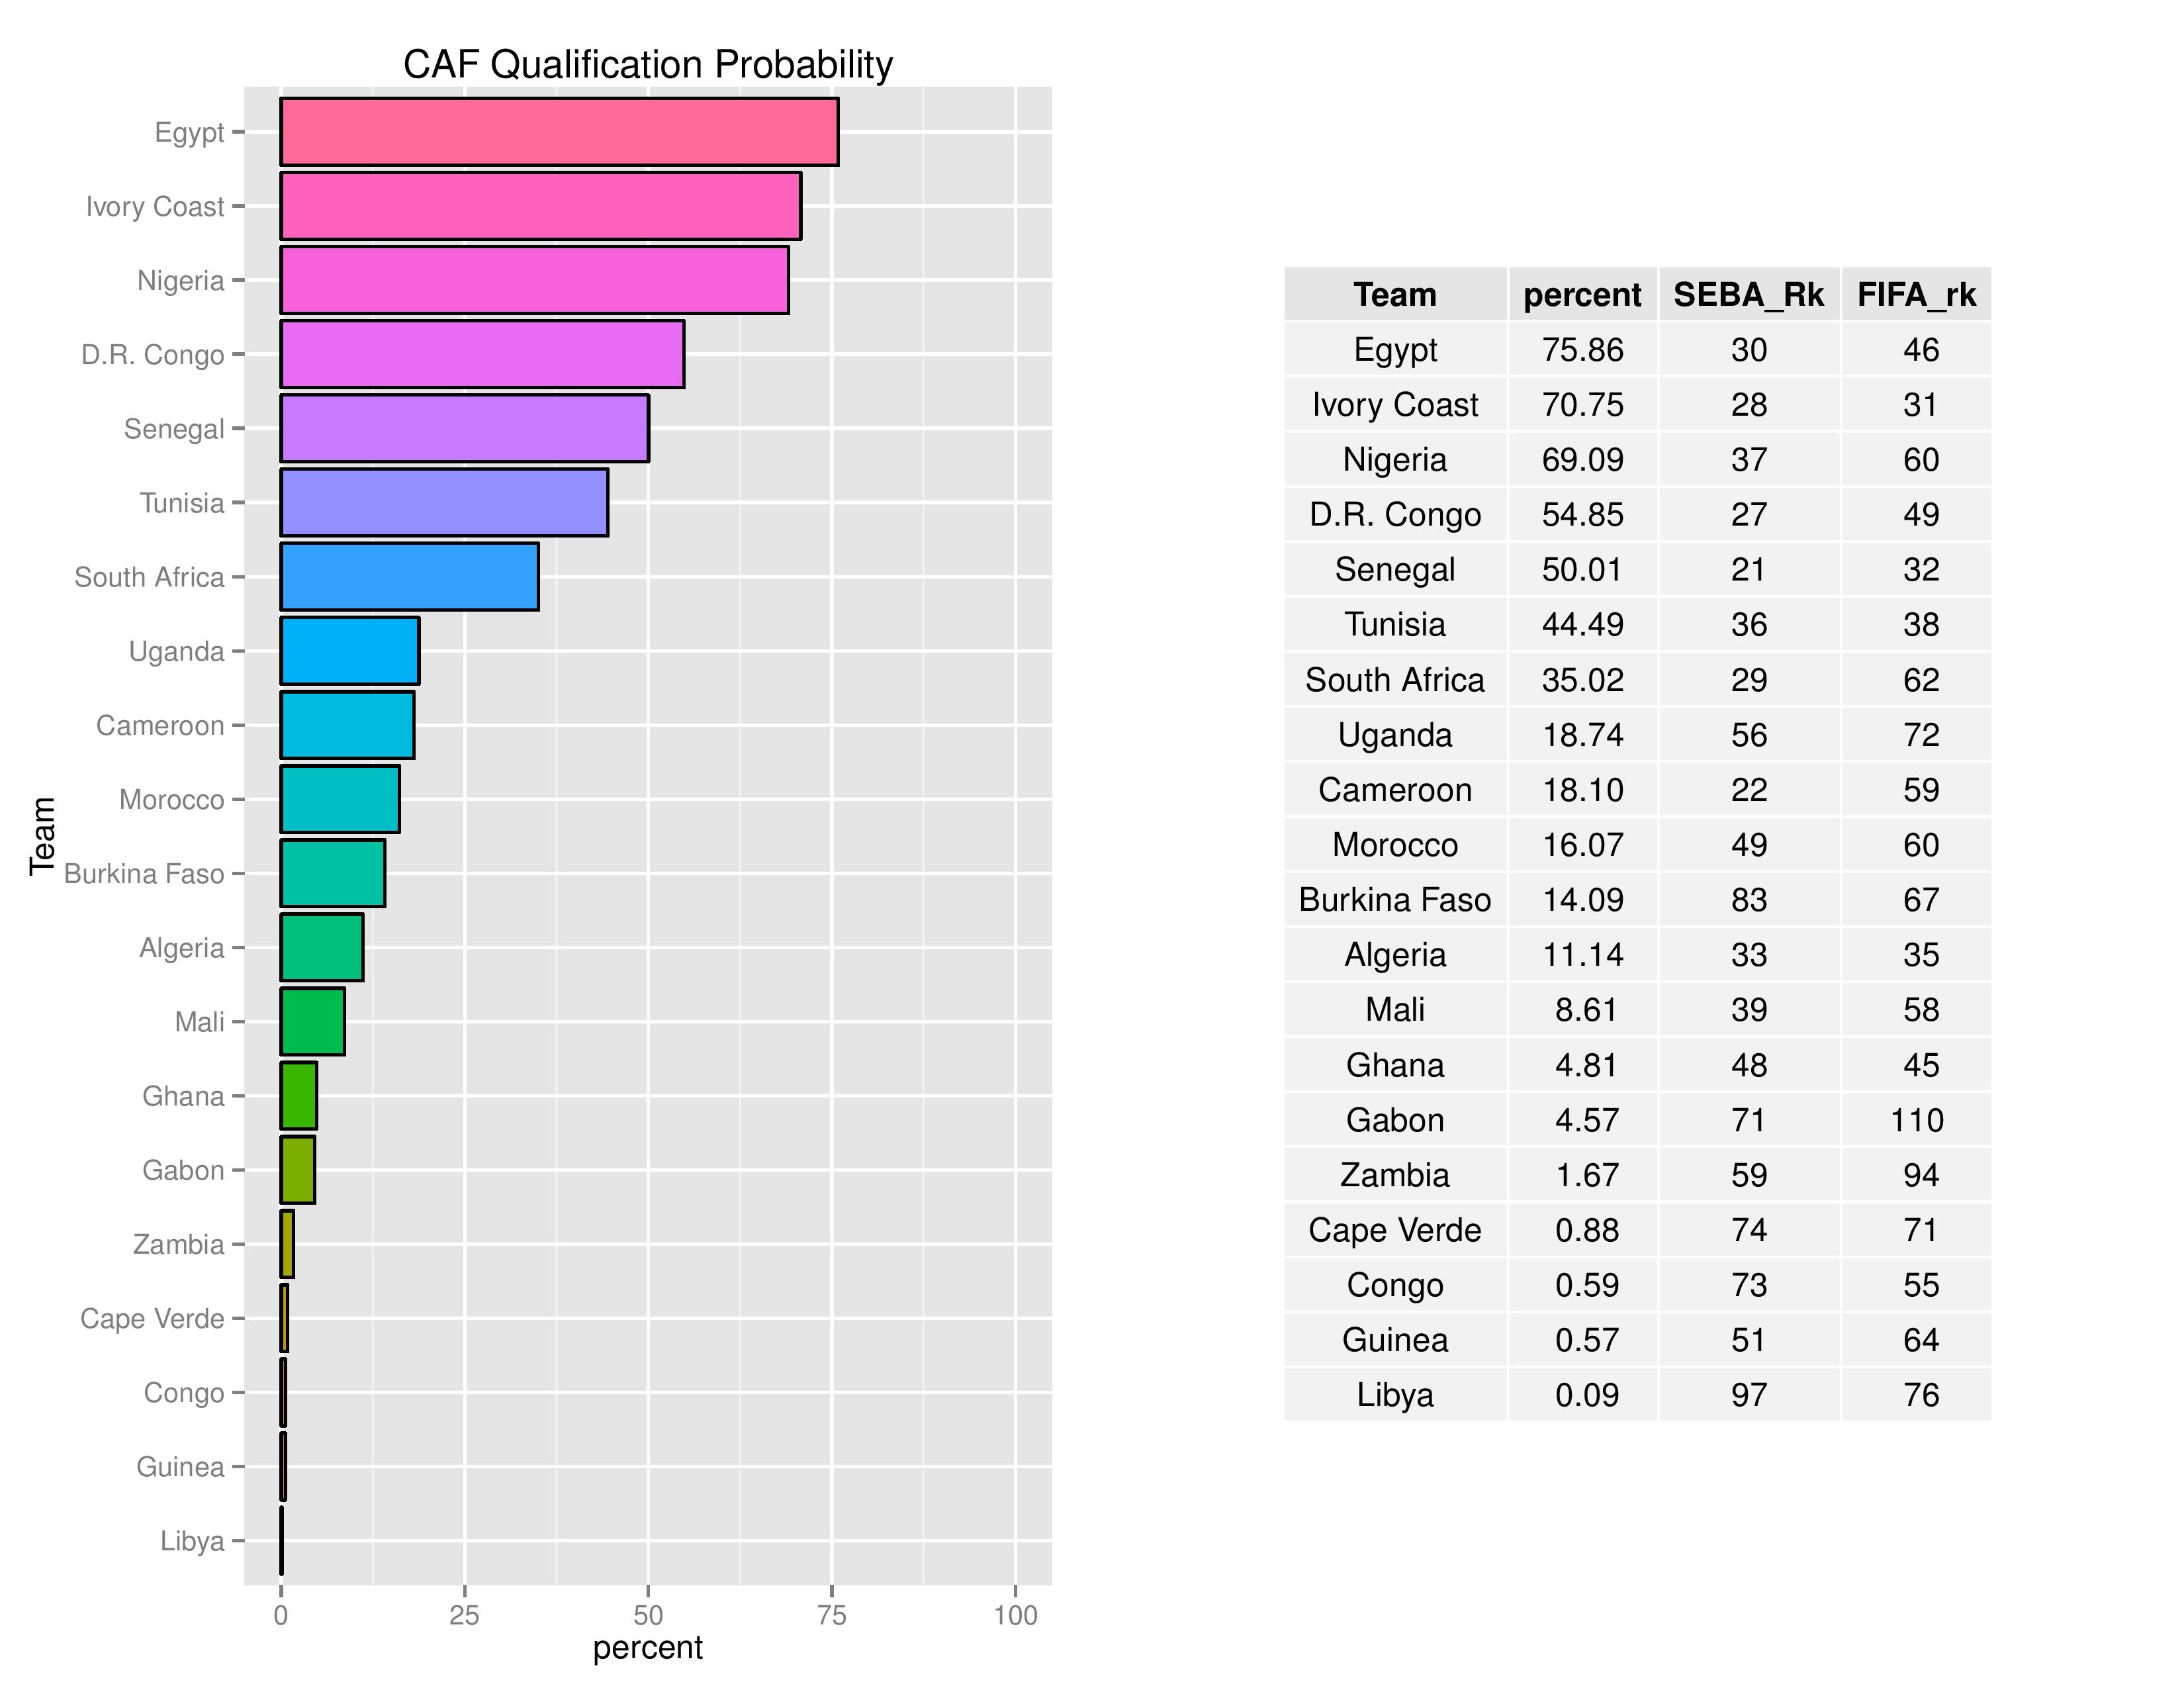
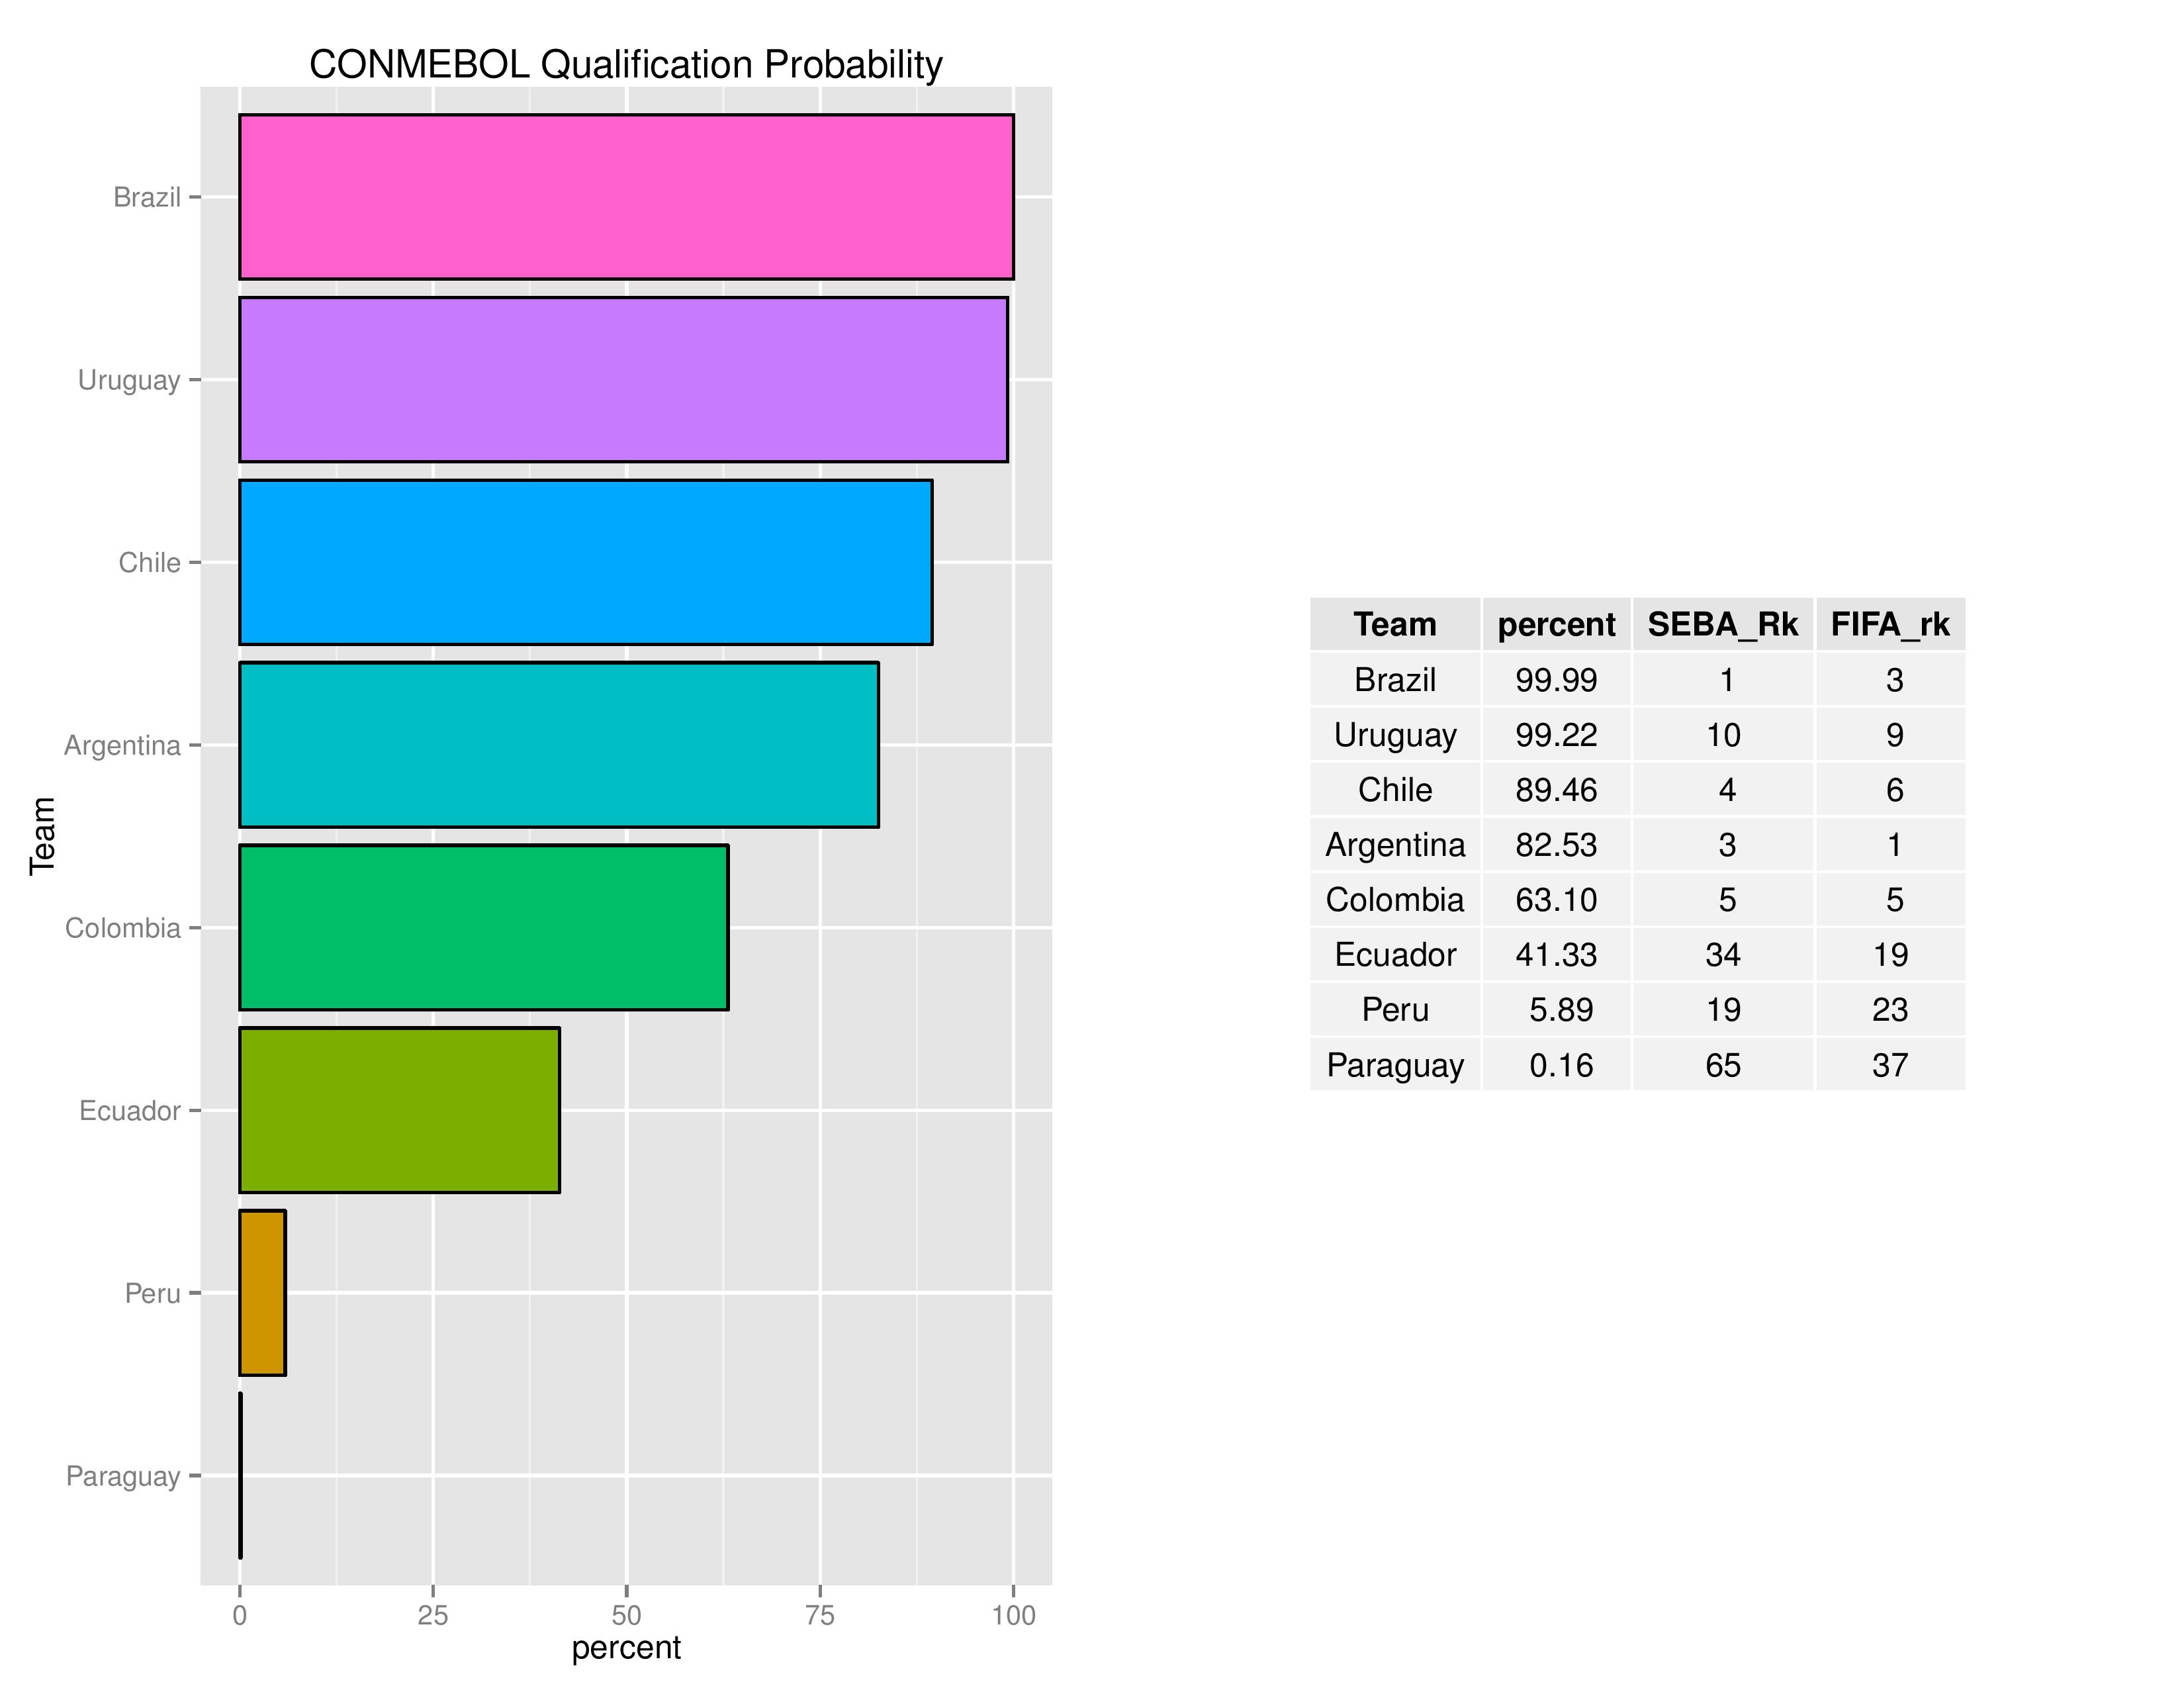
(The table shows only the top 29 teams but the graph shows all teams with a chance)
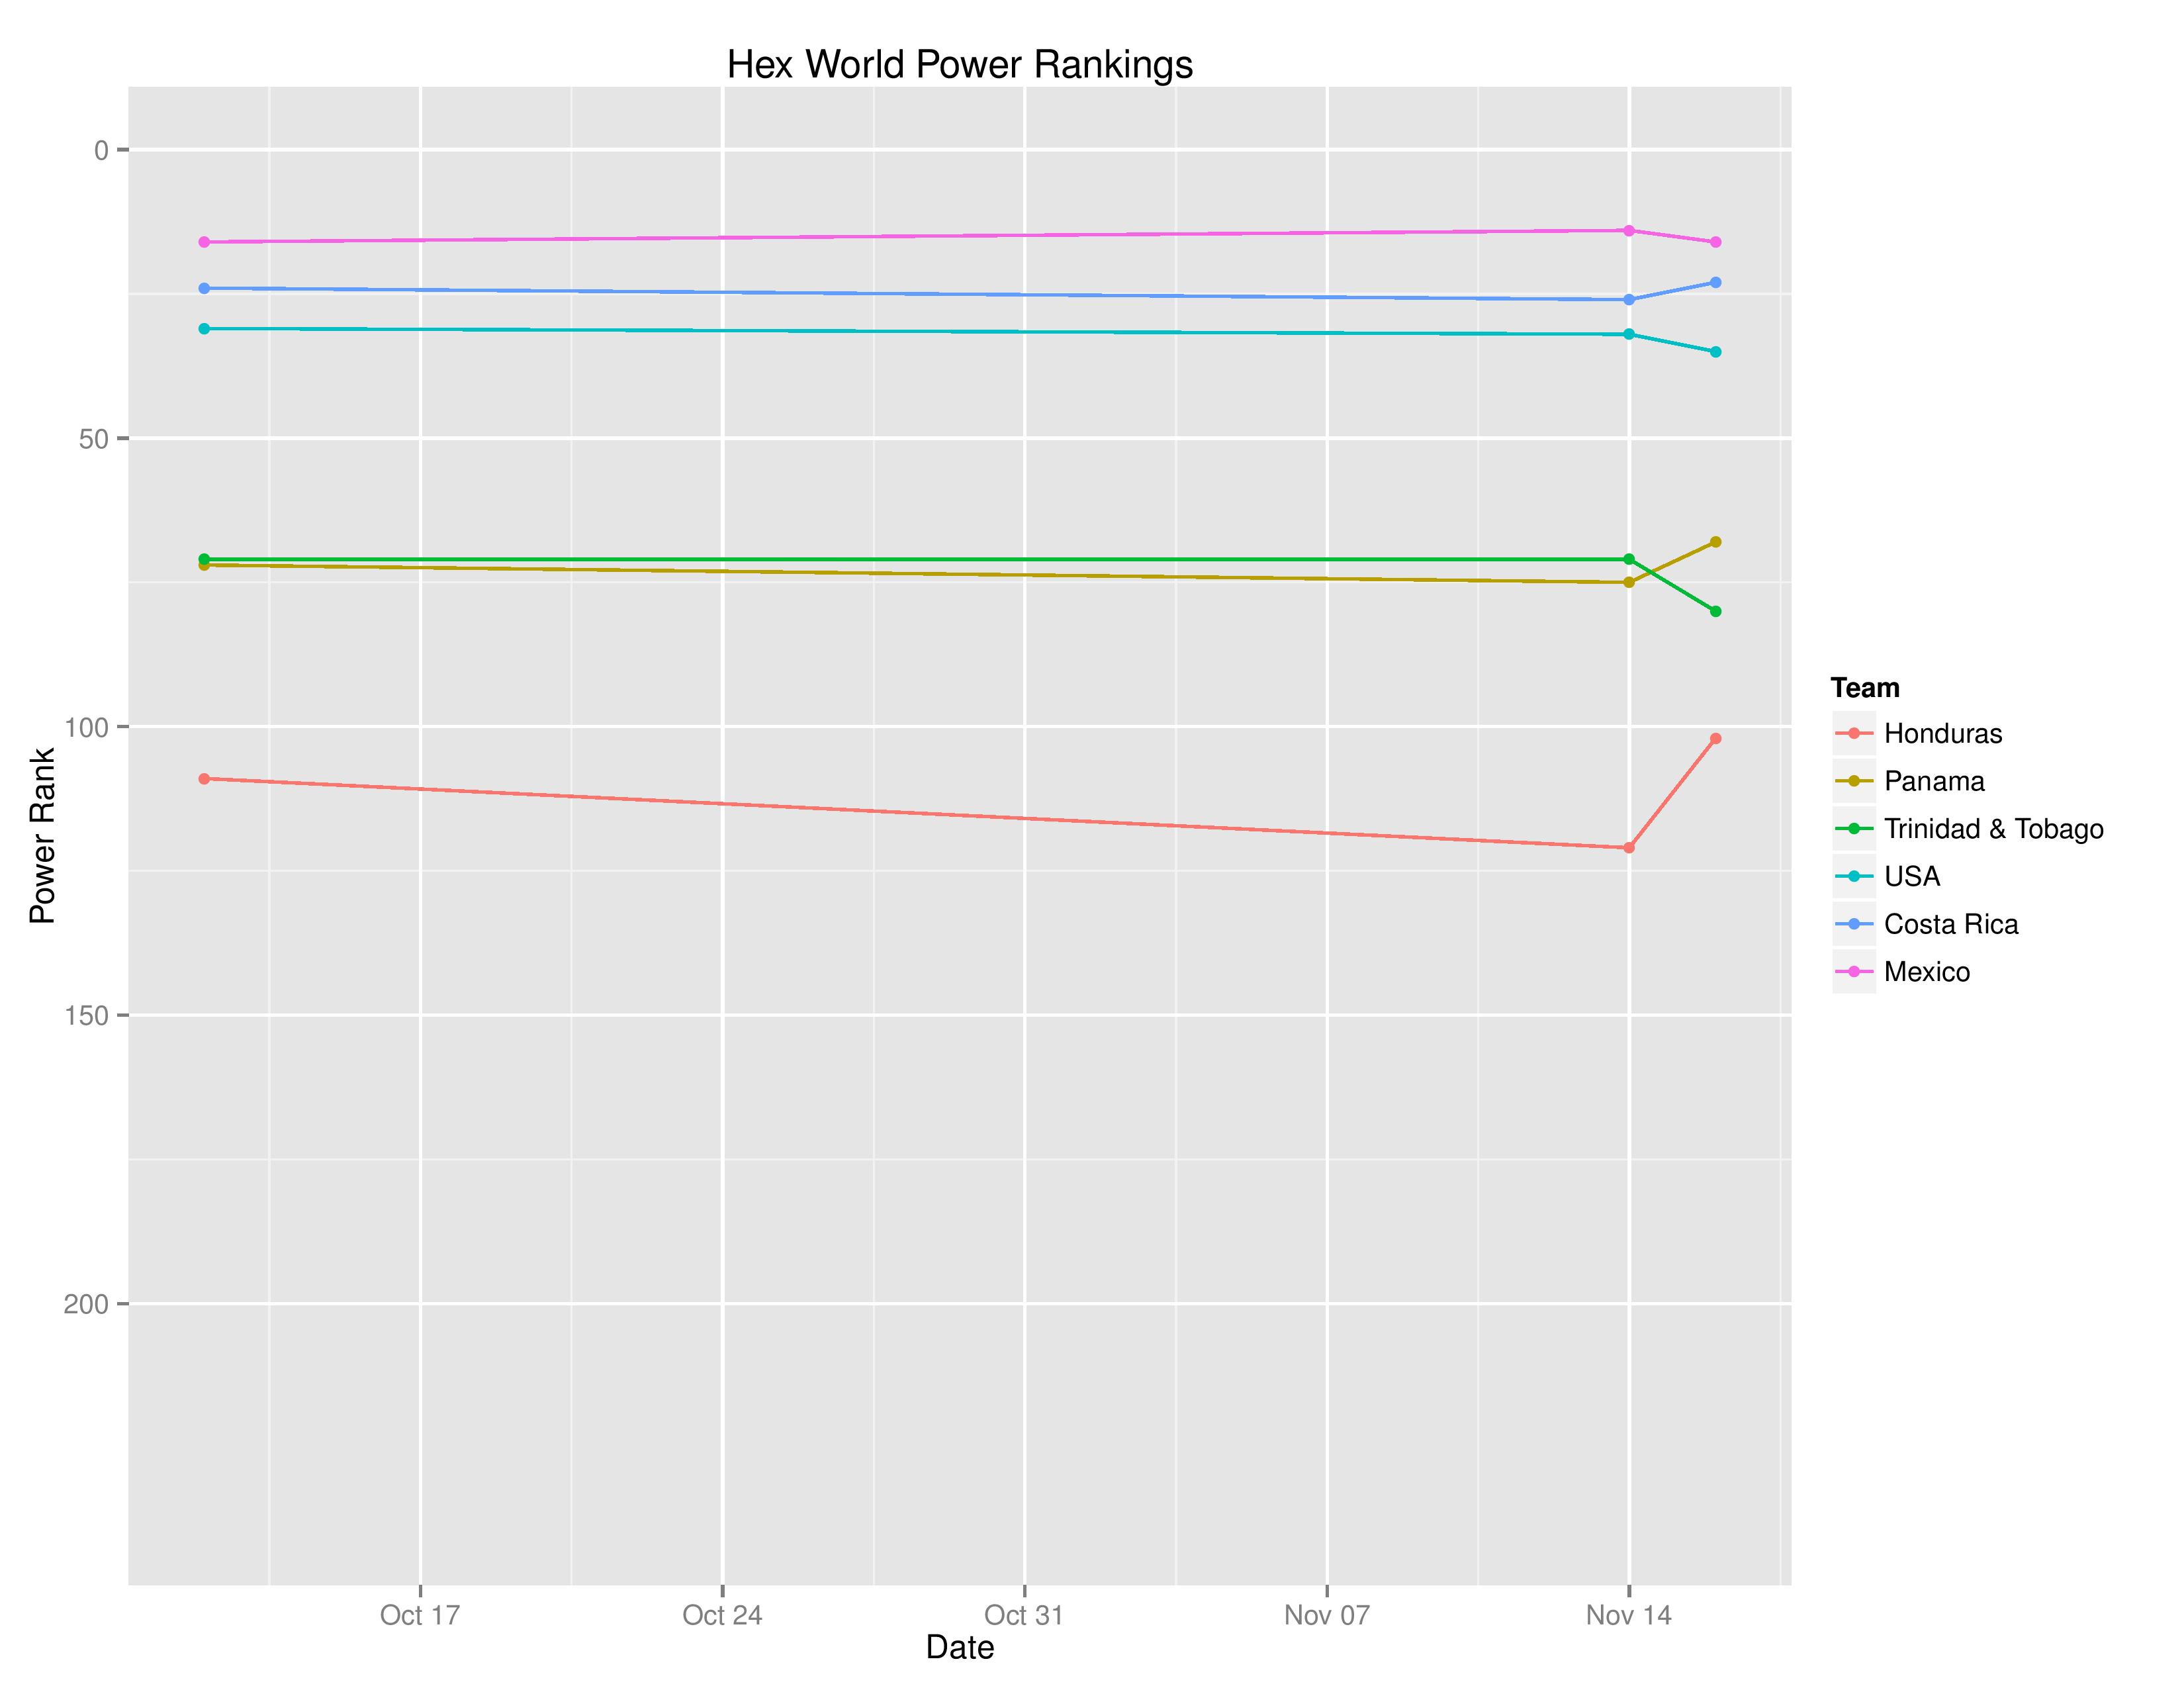
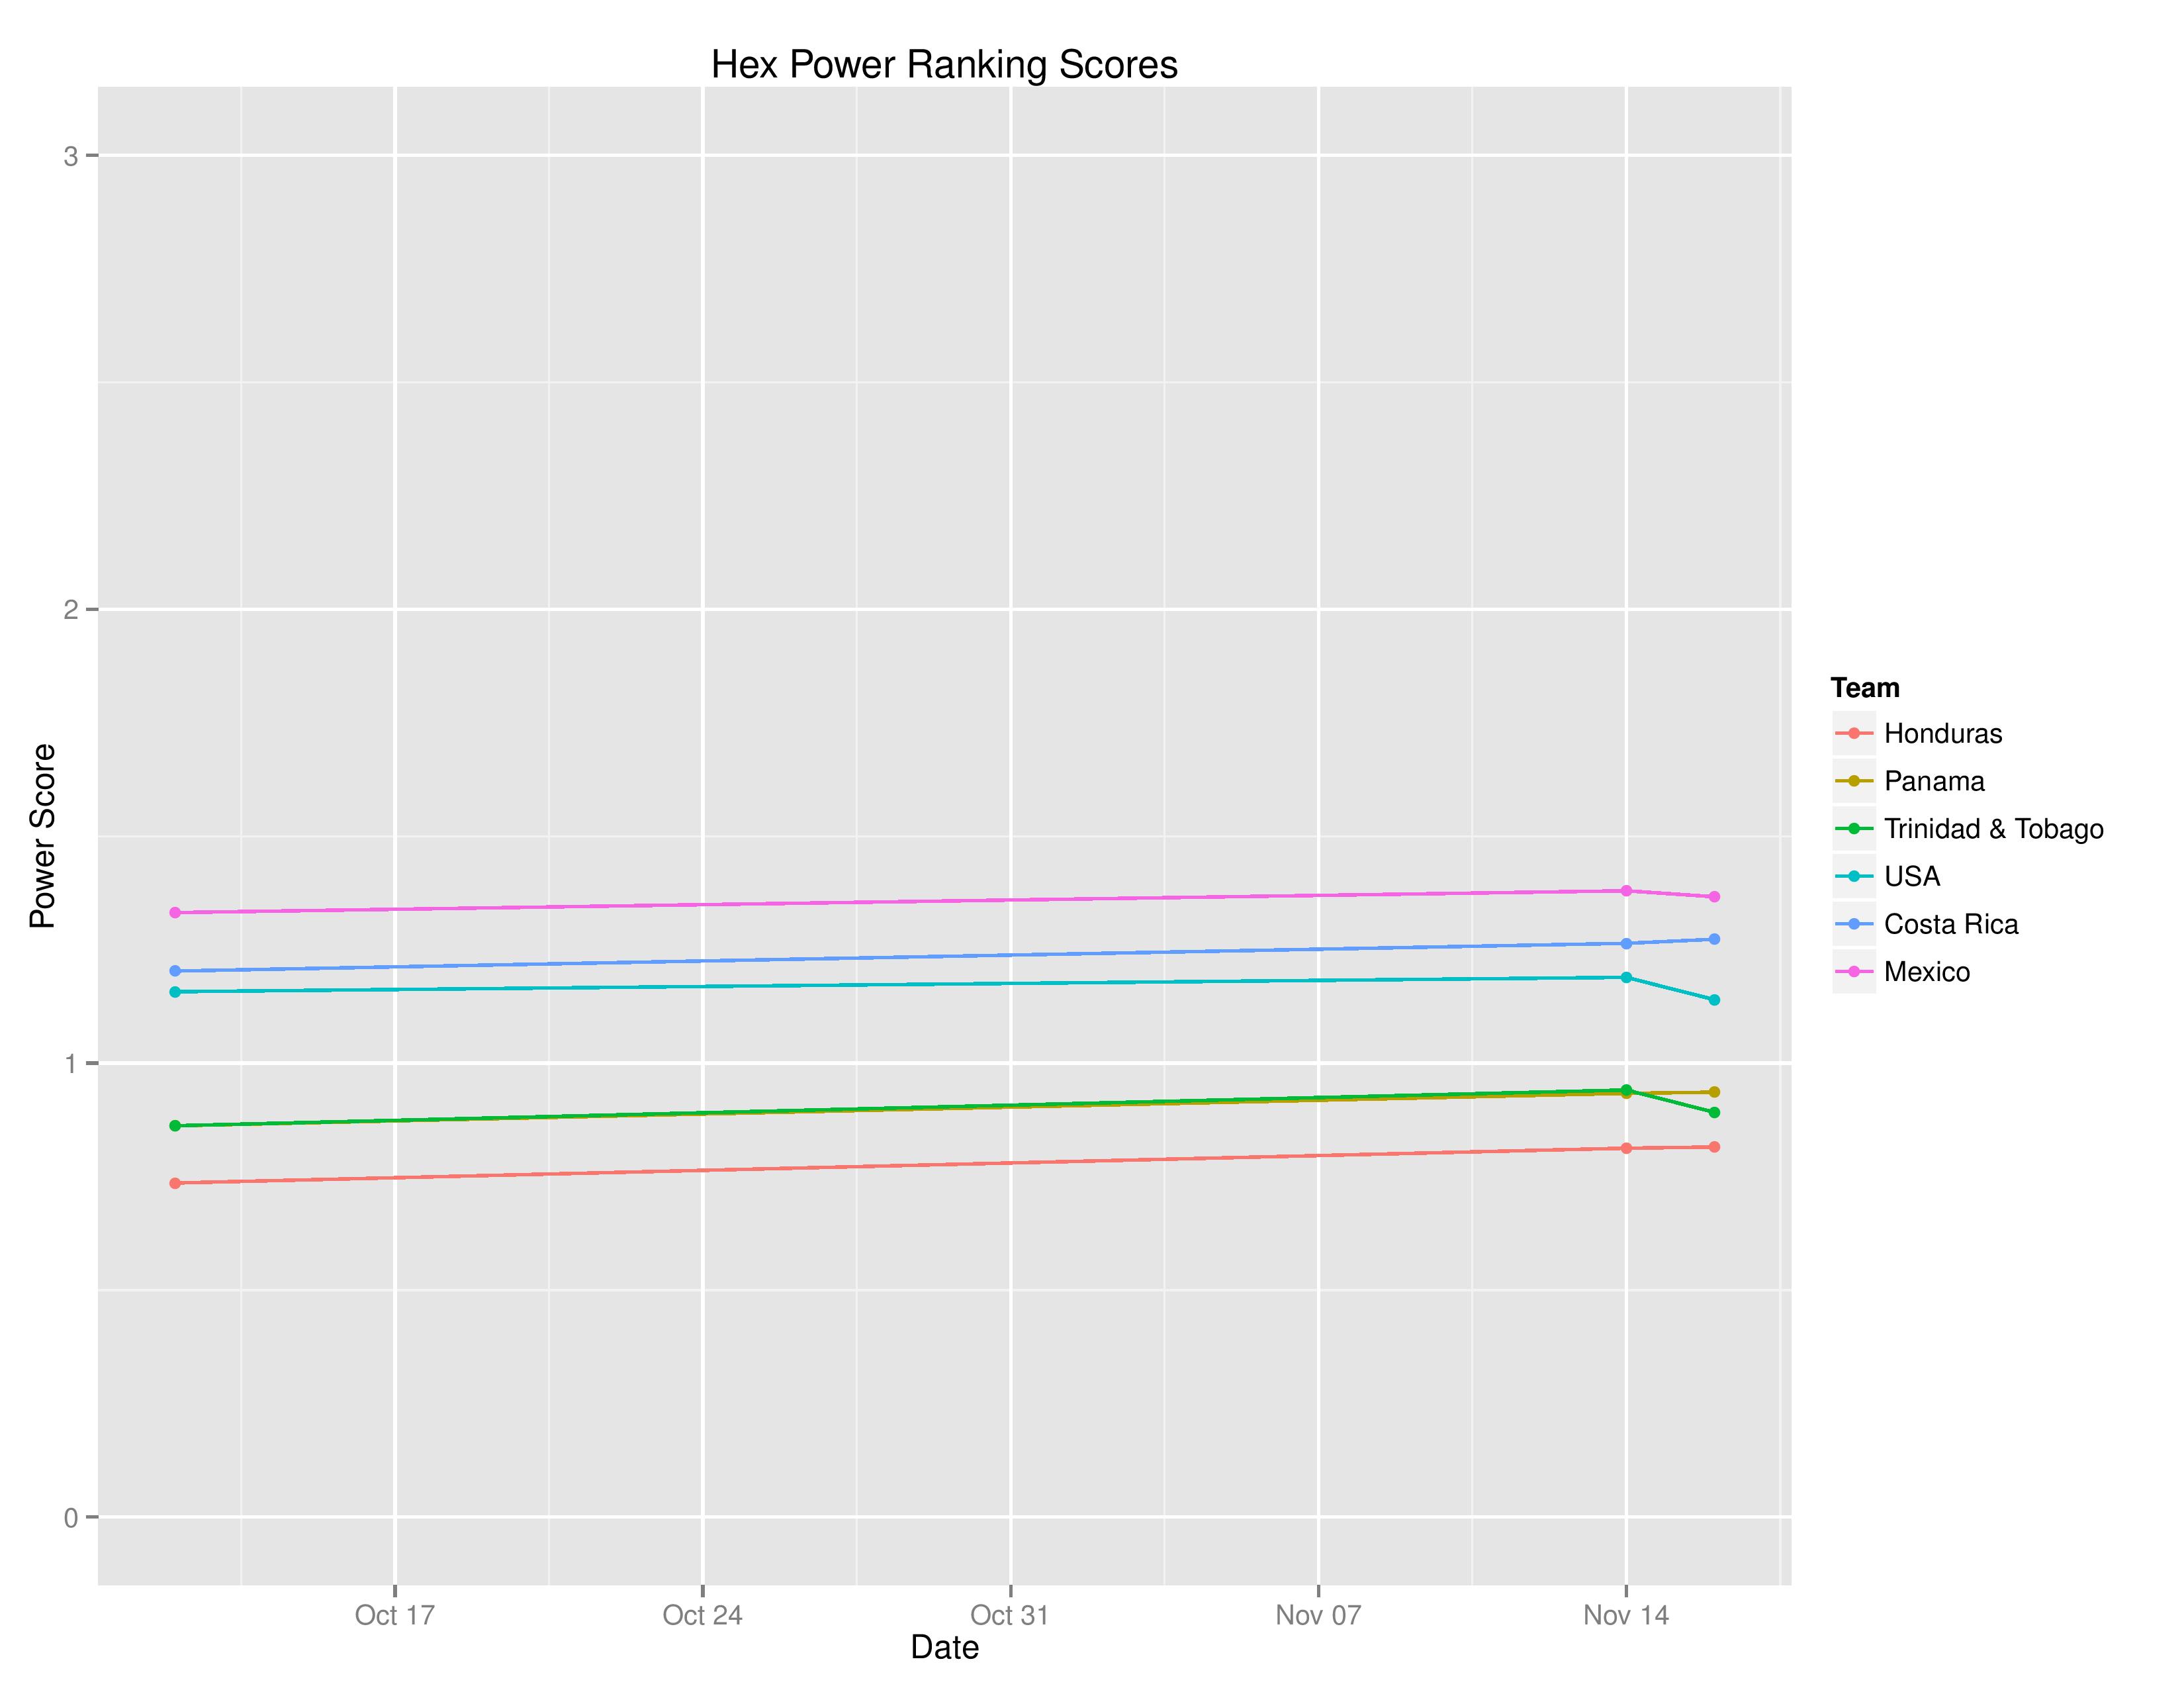
Over Time

The following is the scores used to create the power rankings (expected points on playing all of the teams from the previous world cup in neutral territory). This can help explain that the model did acknowledge results even if the ranks didn’t change:

RECENT COMMENTS