Well I’m not sure who is interested in these anymore, but I figured I’d put them out. I also hope to have, at the end of the season, a review of how the projections worked out.
I also ran it through both Thursday’s games and Sunday’s games to better demonstrate how the projections changed for some of the charts.
Below are the current season forecasts using data from games through October 30, 2016.
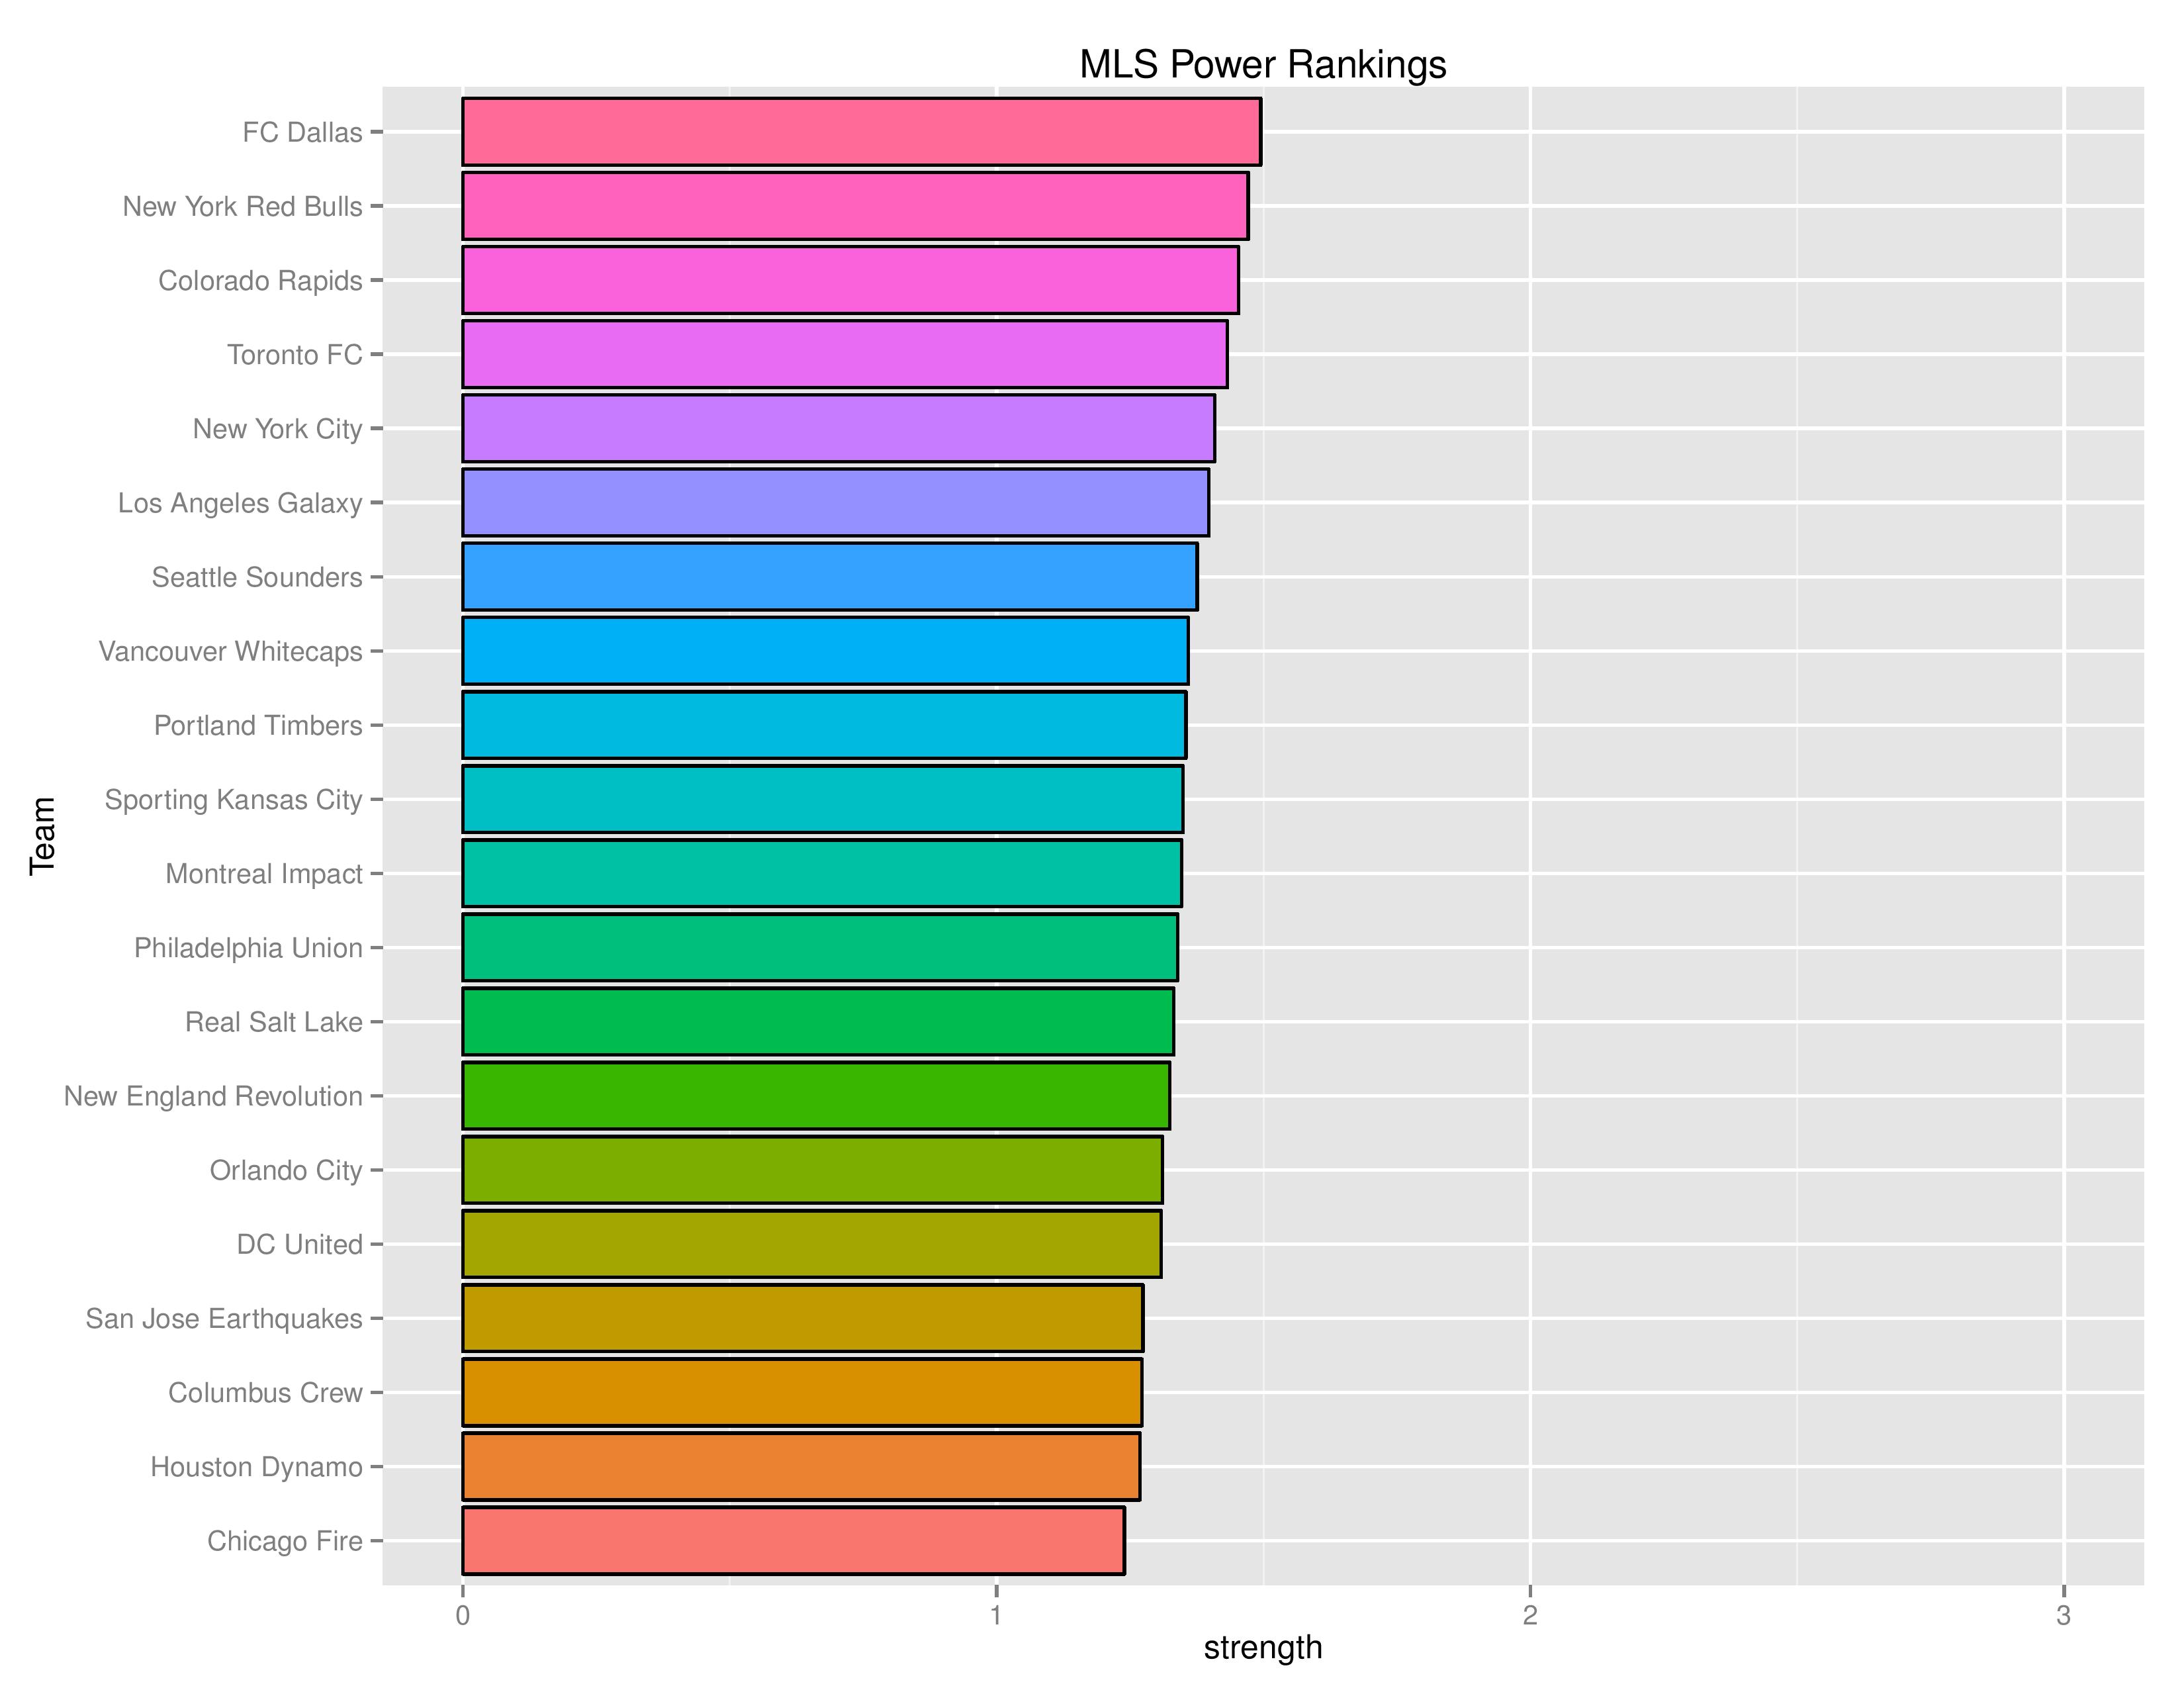
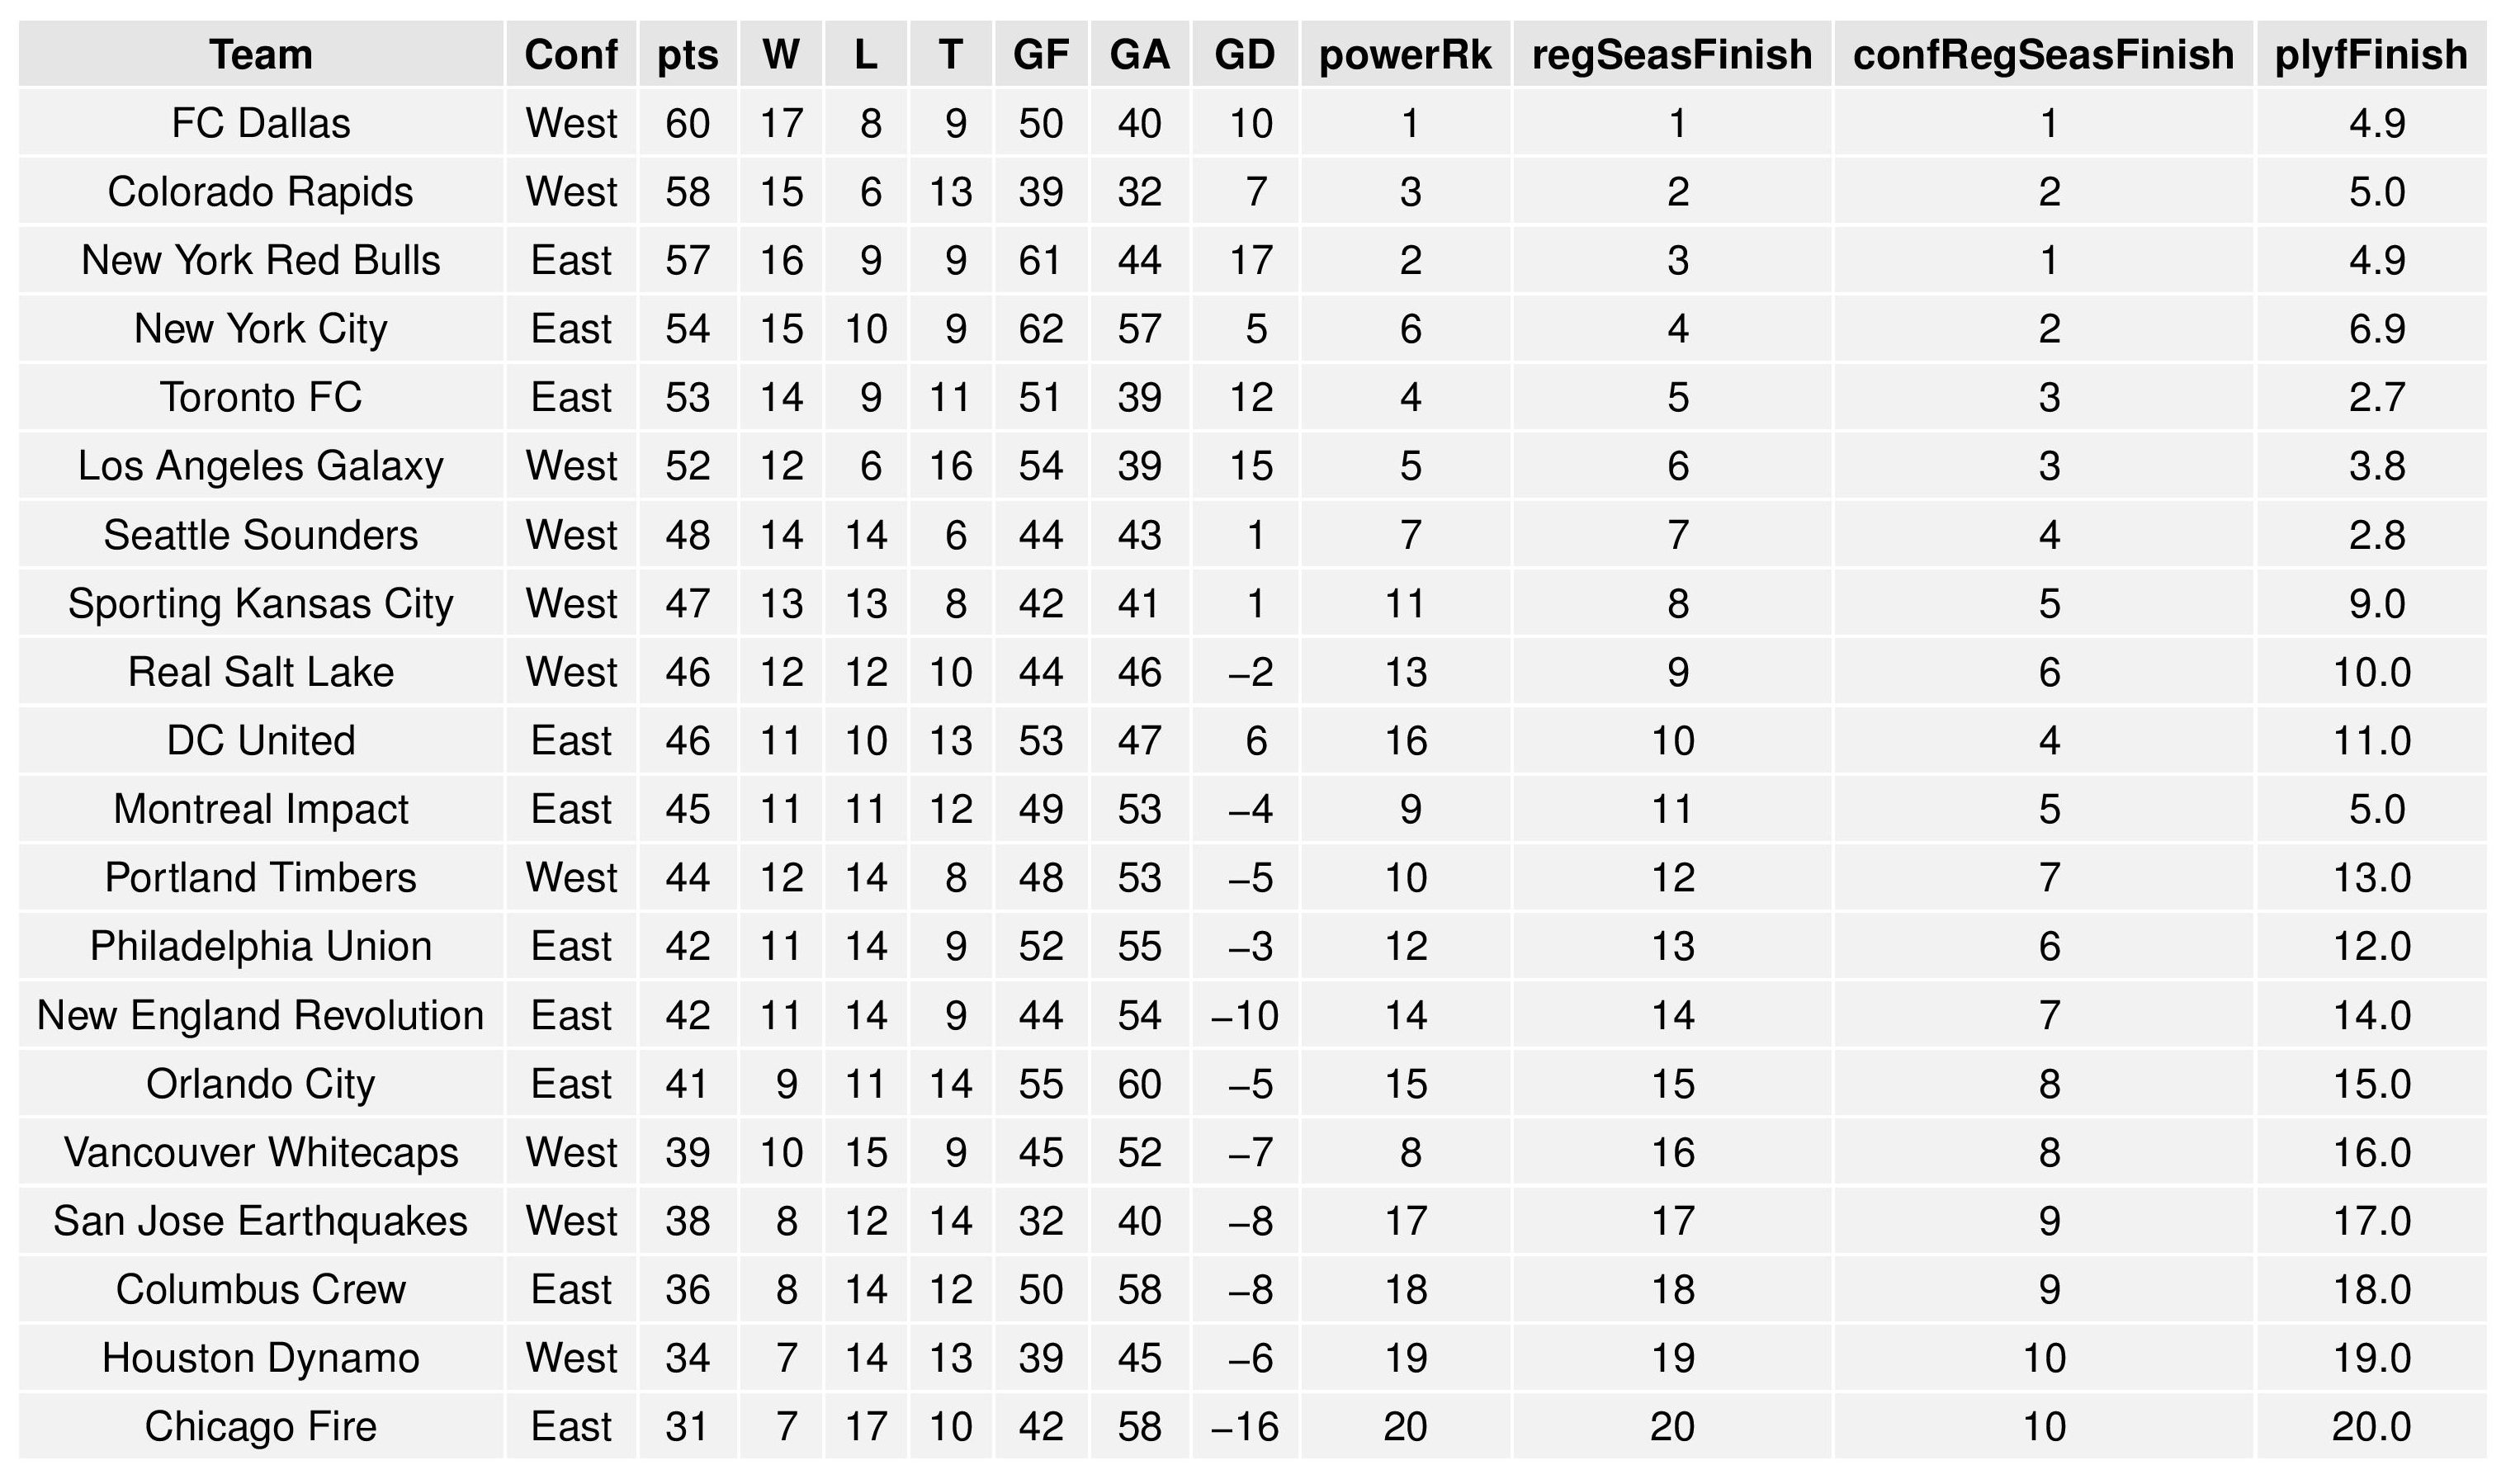
Power Rankings
The “Power Rankings” we concoct are the actual “strength” of the team according to competitive expectations. They are computed showing average expected points result if every team in MLS played every team both home and away.
Through the Thursday Games:
SEBA had the Union declining to No. 12 from No. 11.
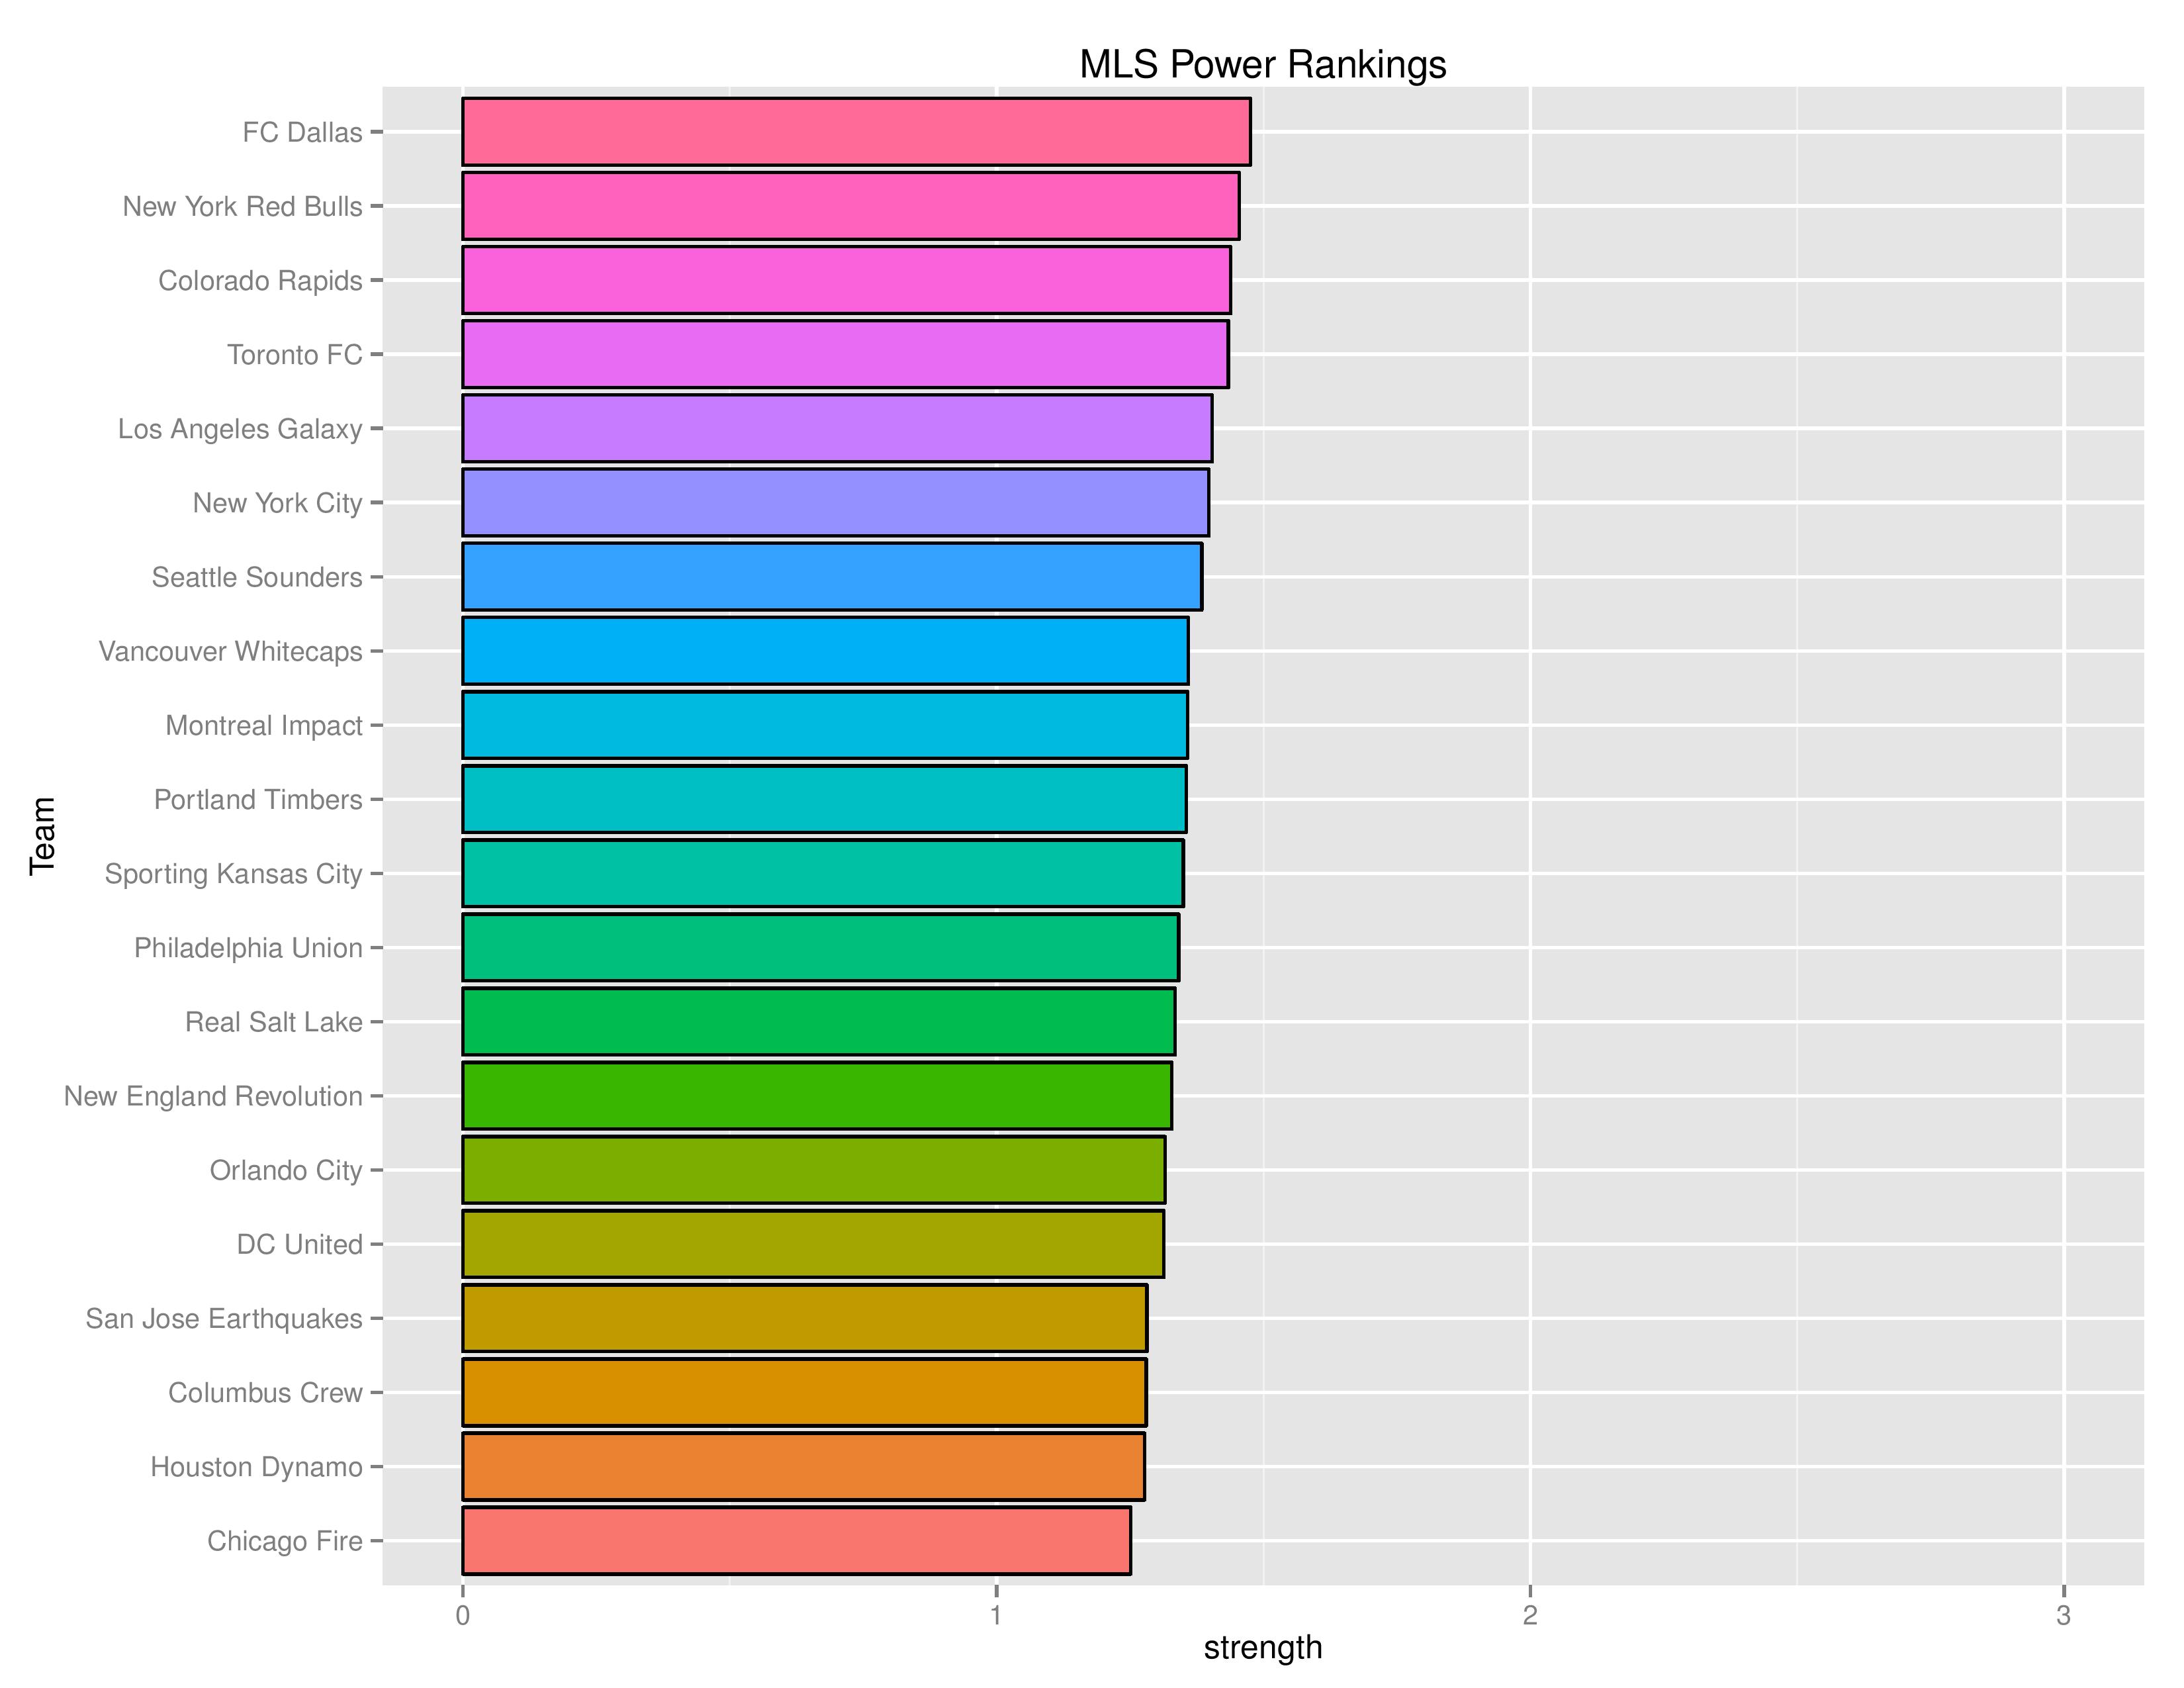
Through the Sunday Games:
SEBA had the Union remaining at No. 12. The only changes from mid-week were LA moving over NYCFC and Montreal jumping over both Portland and Kansas City.
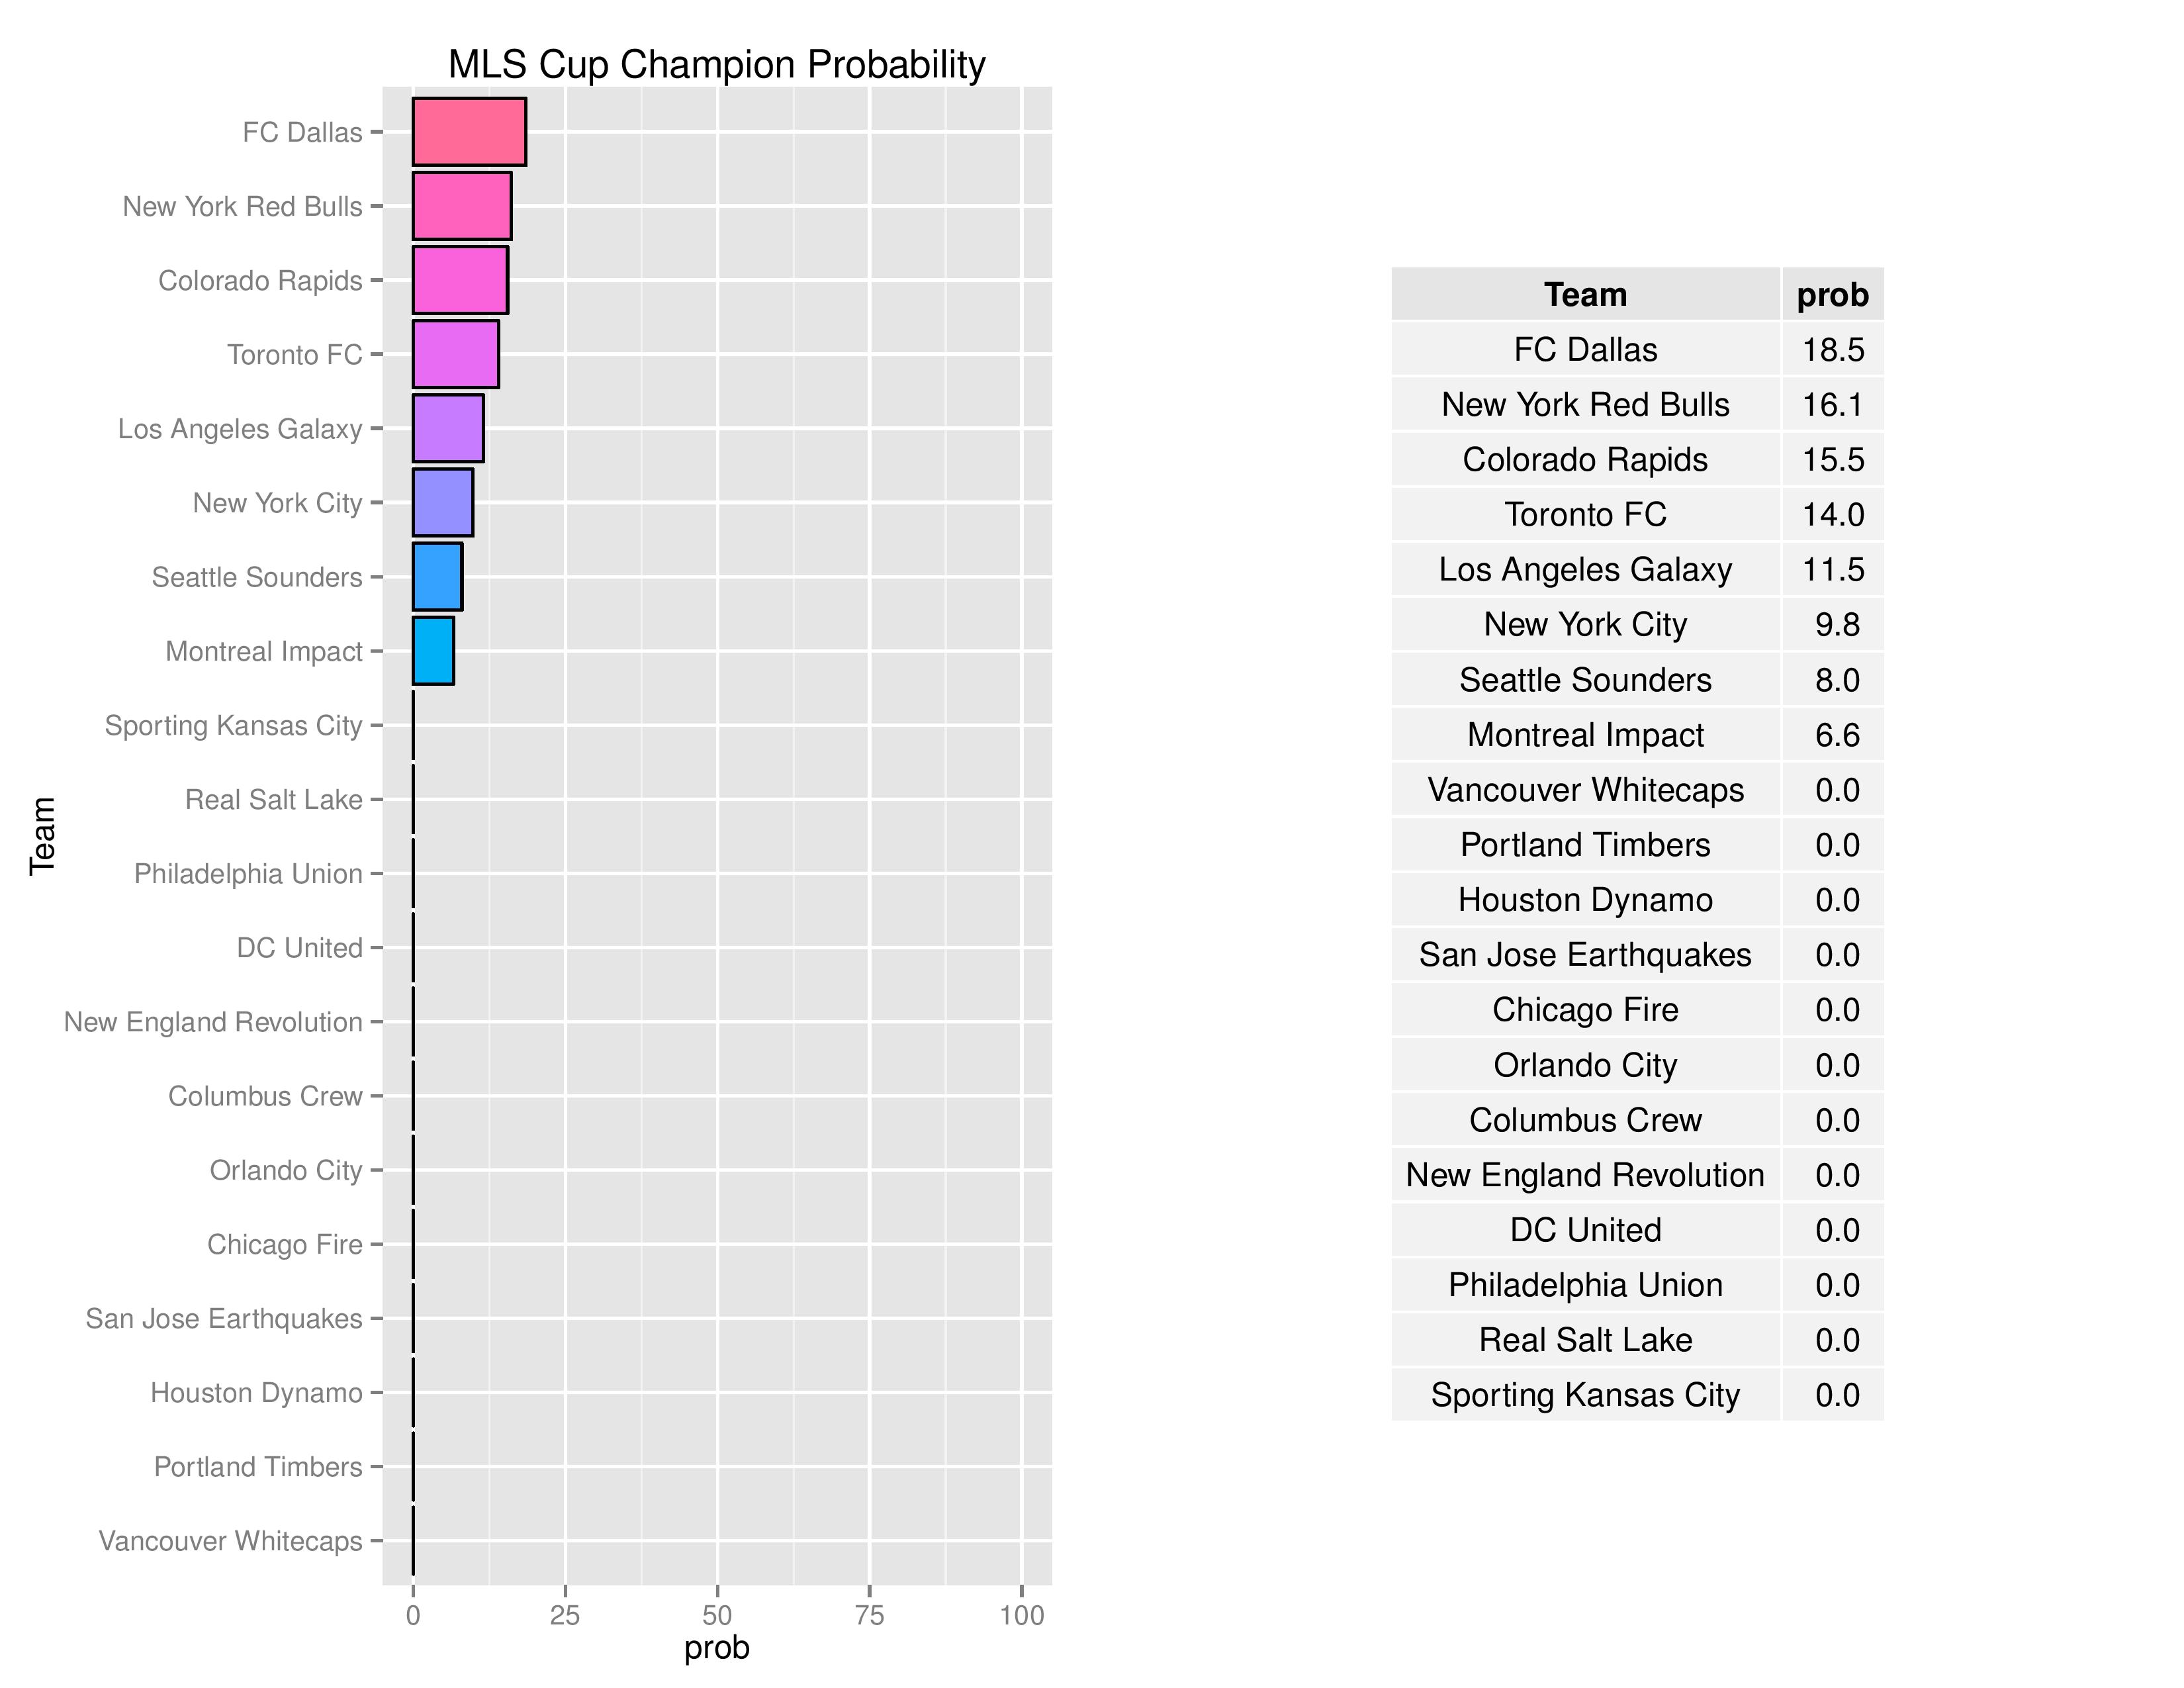
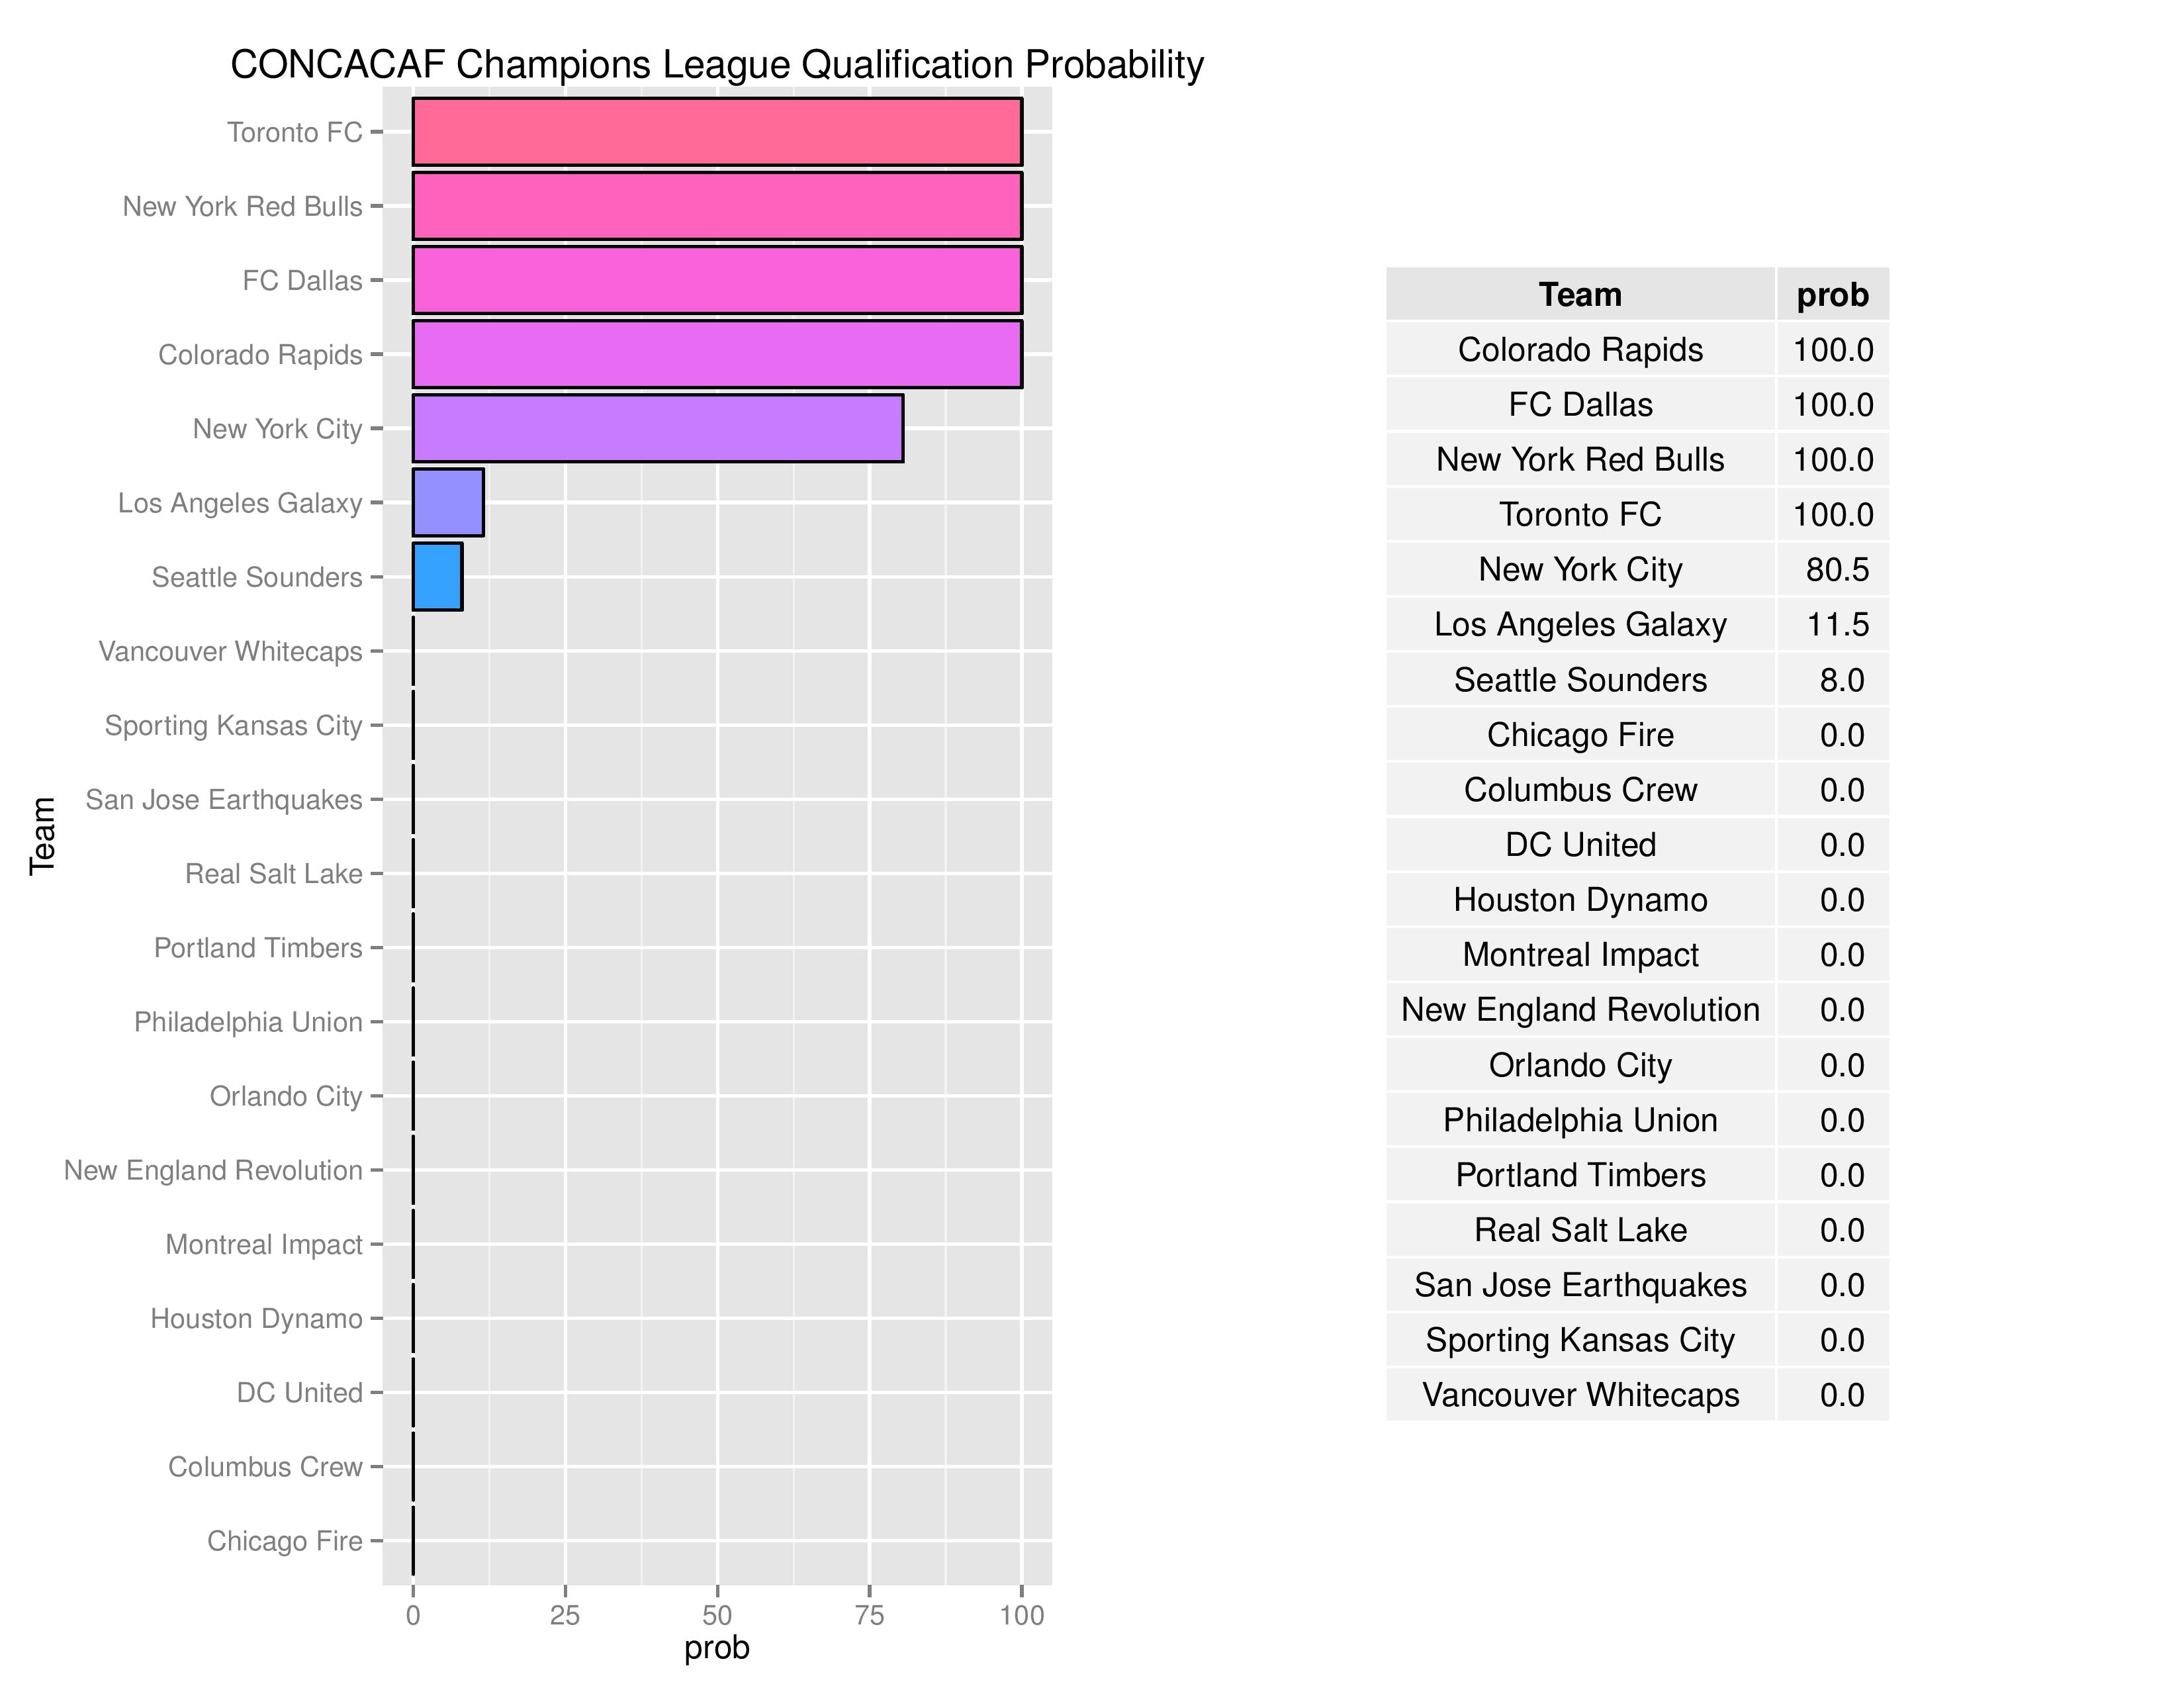
Playoffs probability and more
Through the Thursday Games:
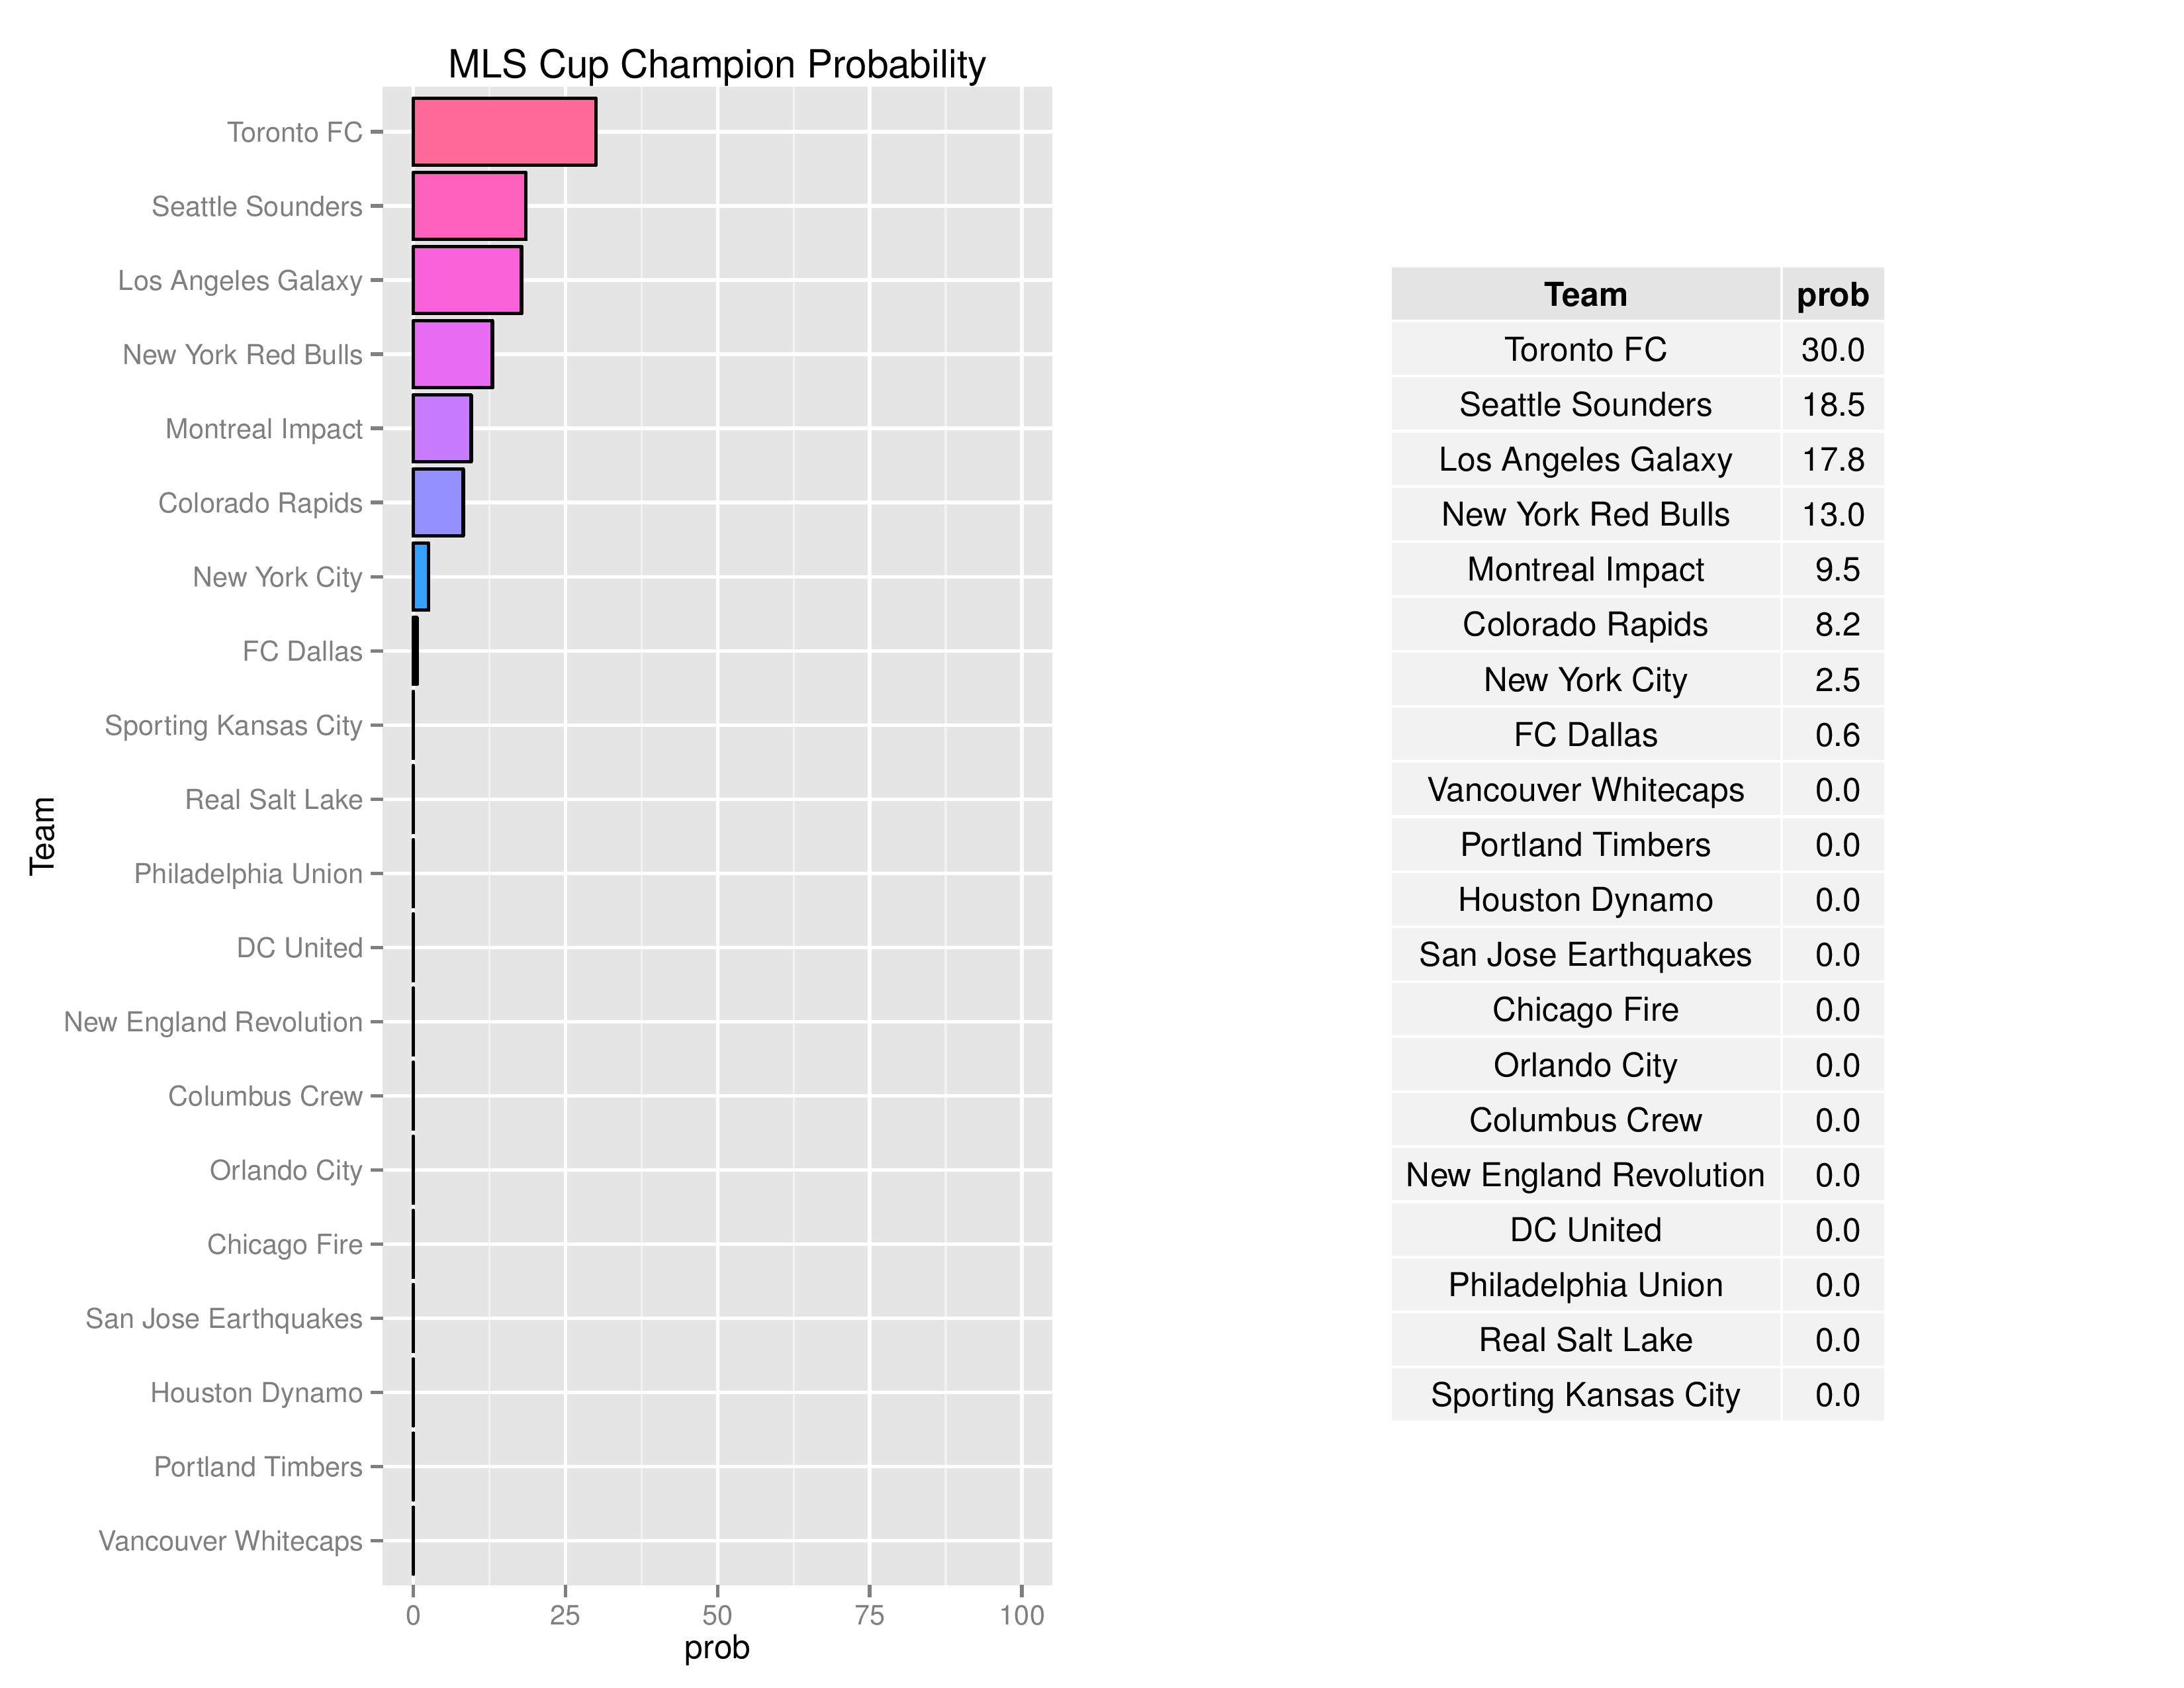
Through the Sunday Games:
FC Dallas obviously tumbled hard when they lost 3-0 in their first match of the series. Toronto’s 2-0 win over NYCFC gives them a very strong position to get out of their round, and, with Dallas and Colorado’s weaker chances of advancement, allows Toronto a greater likelihood of hosting the MLS Cup Final if they can win the Eastern Conference.
Through the Thursday Games:
Through the Sunday Games:
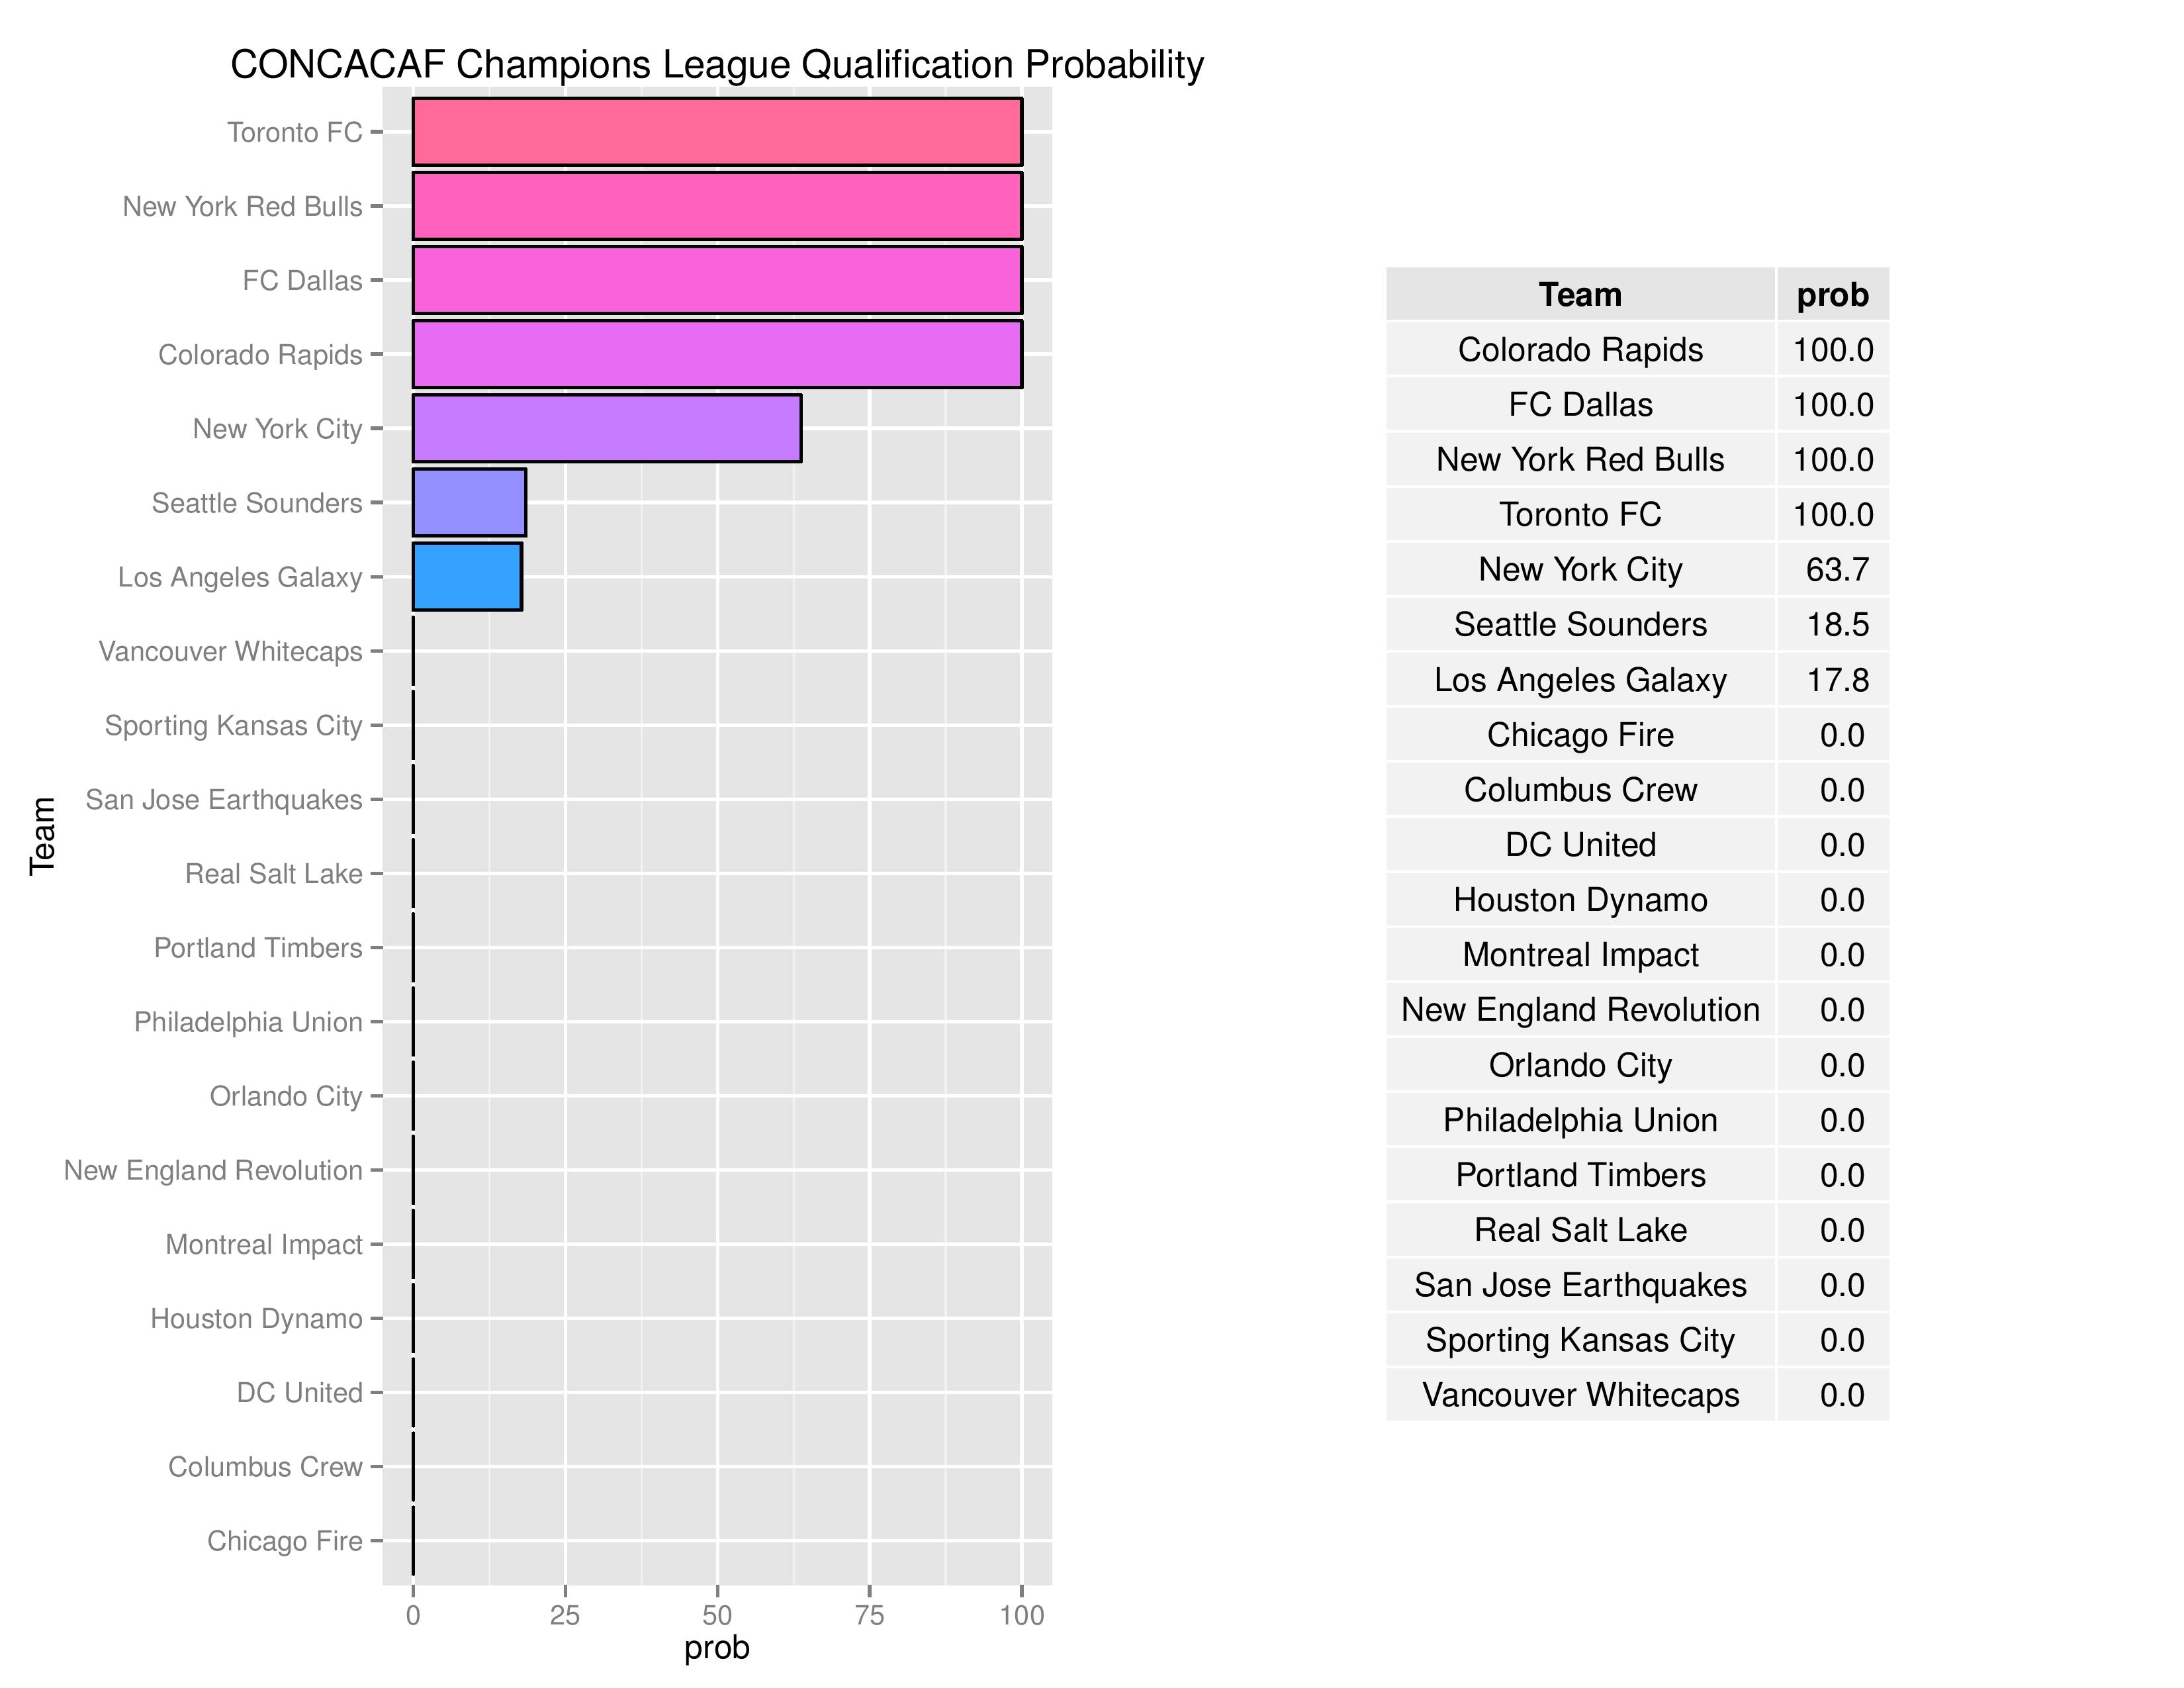
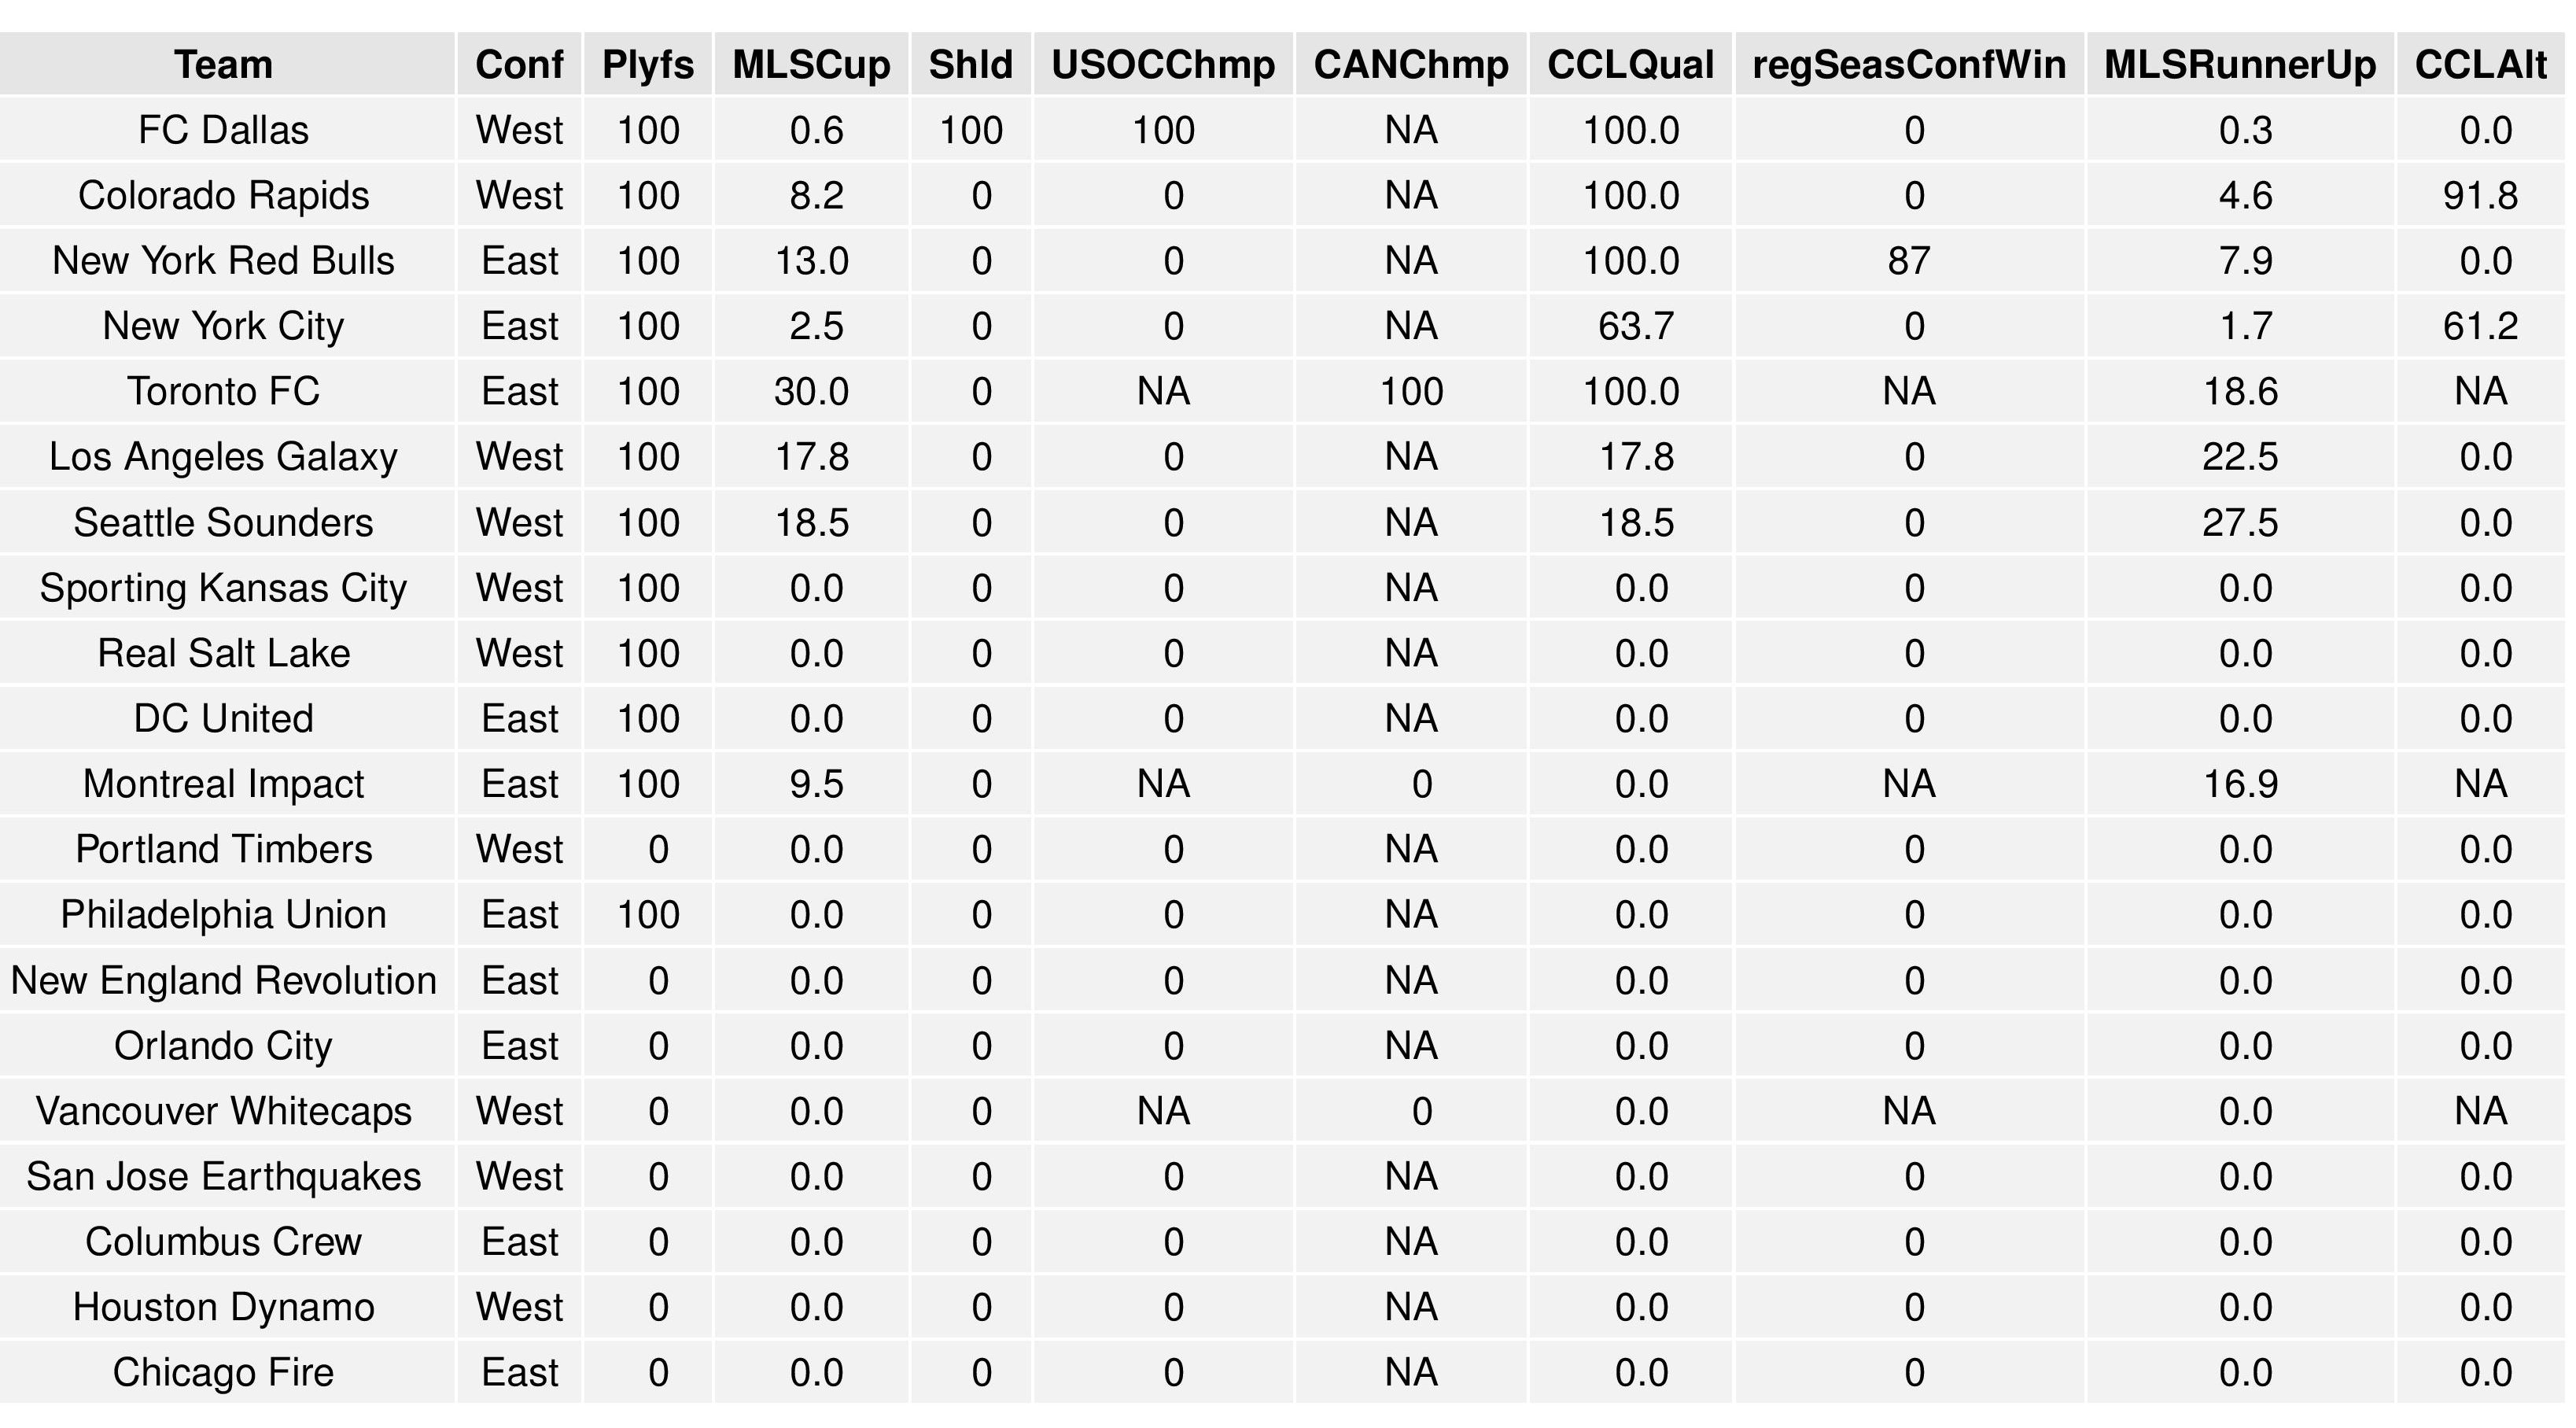
The charts below show the average results of all the simulations and the probabilities associated with all of the above. The chart is broken up into two parts in order to better fit on your screen.
(Note: CCLAlternate refers to qualifying for CONCACAF Champions League non-traditionally. U.S. teams qualify by winning the MLS Cup, winning the Supporters’ Shield, winning the Conference in the regular season, and by winning the U.S. Open Cup. If a Canadian team wins any of these or a U.S. team wins more than one, the extra slots are filled by top regular season performers. Also, “regSeasConfWin” refers to finishing the conference in first place AND not winning other CCL slots like MLS Cup, Supporters’ Shield, and USOC)
Changes Over Time
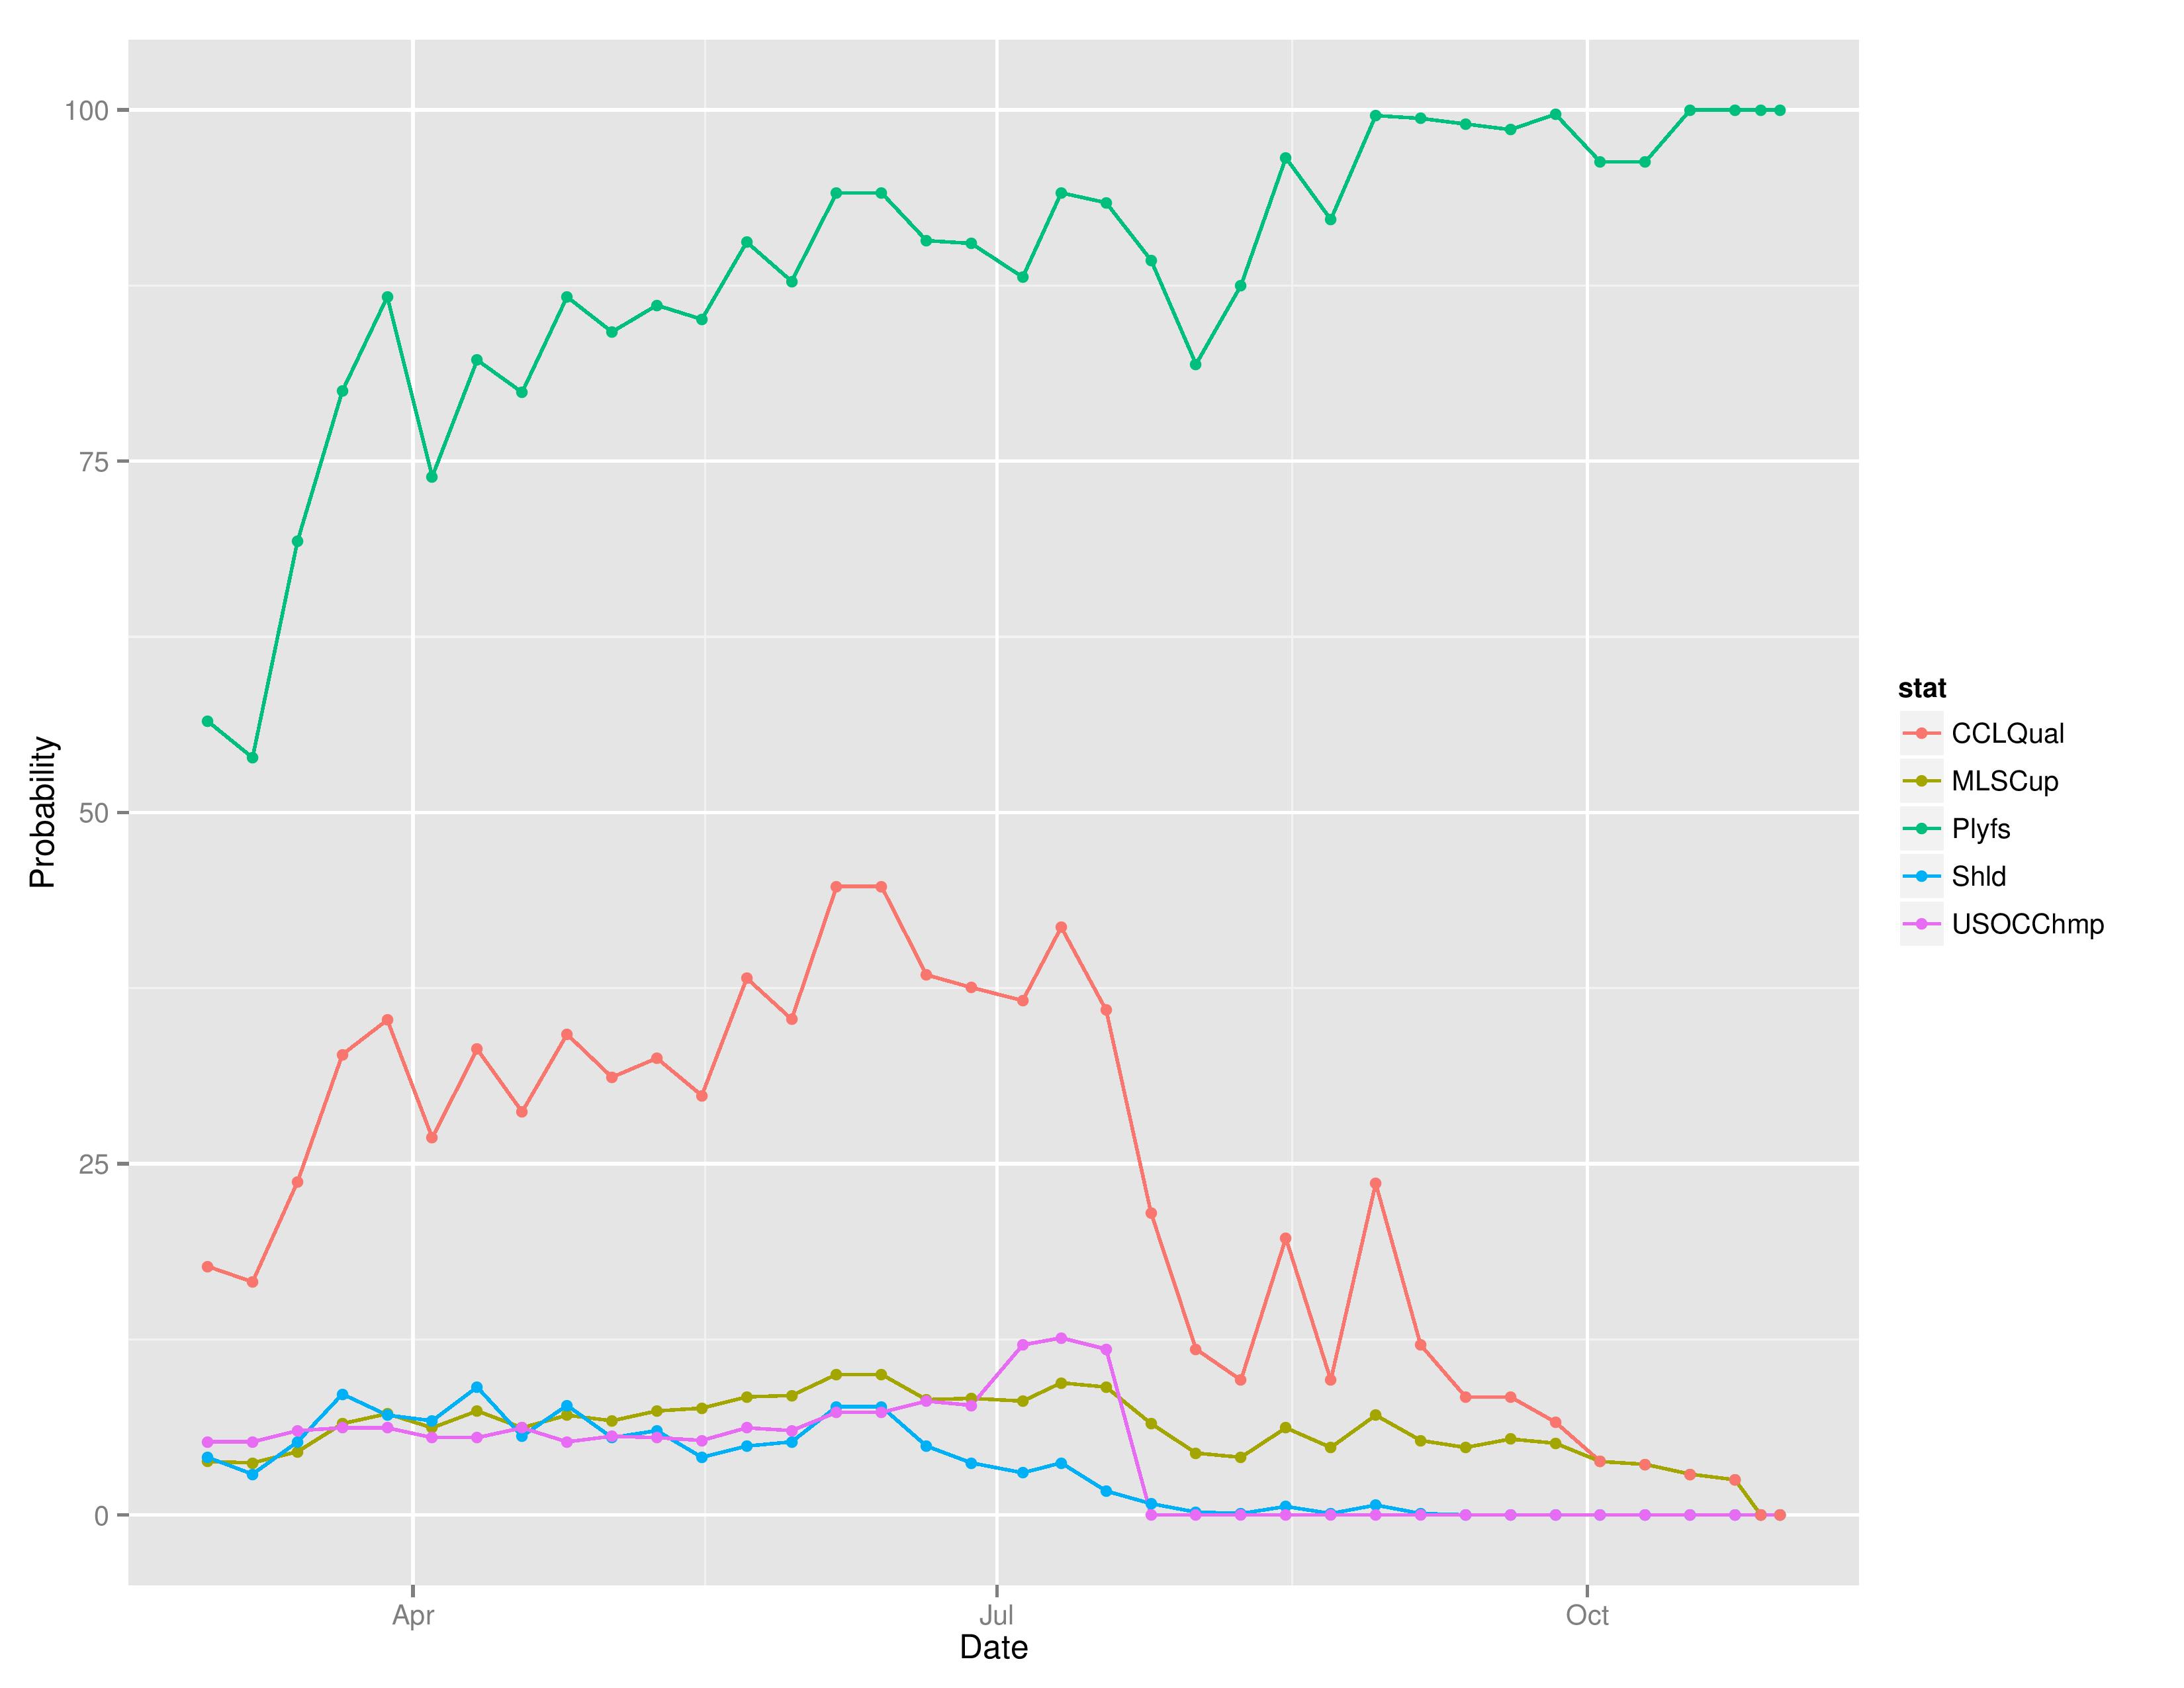
This chart shows how Philadelphia’s chances at each of the outcomes has evolved over the course of the season.
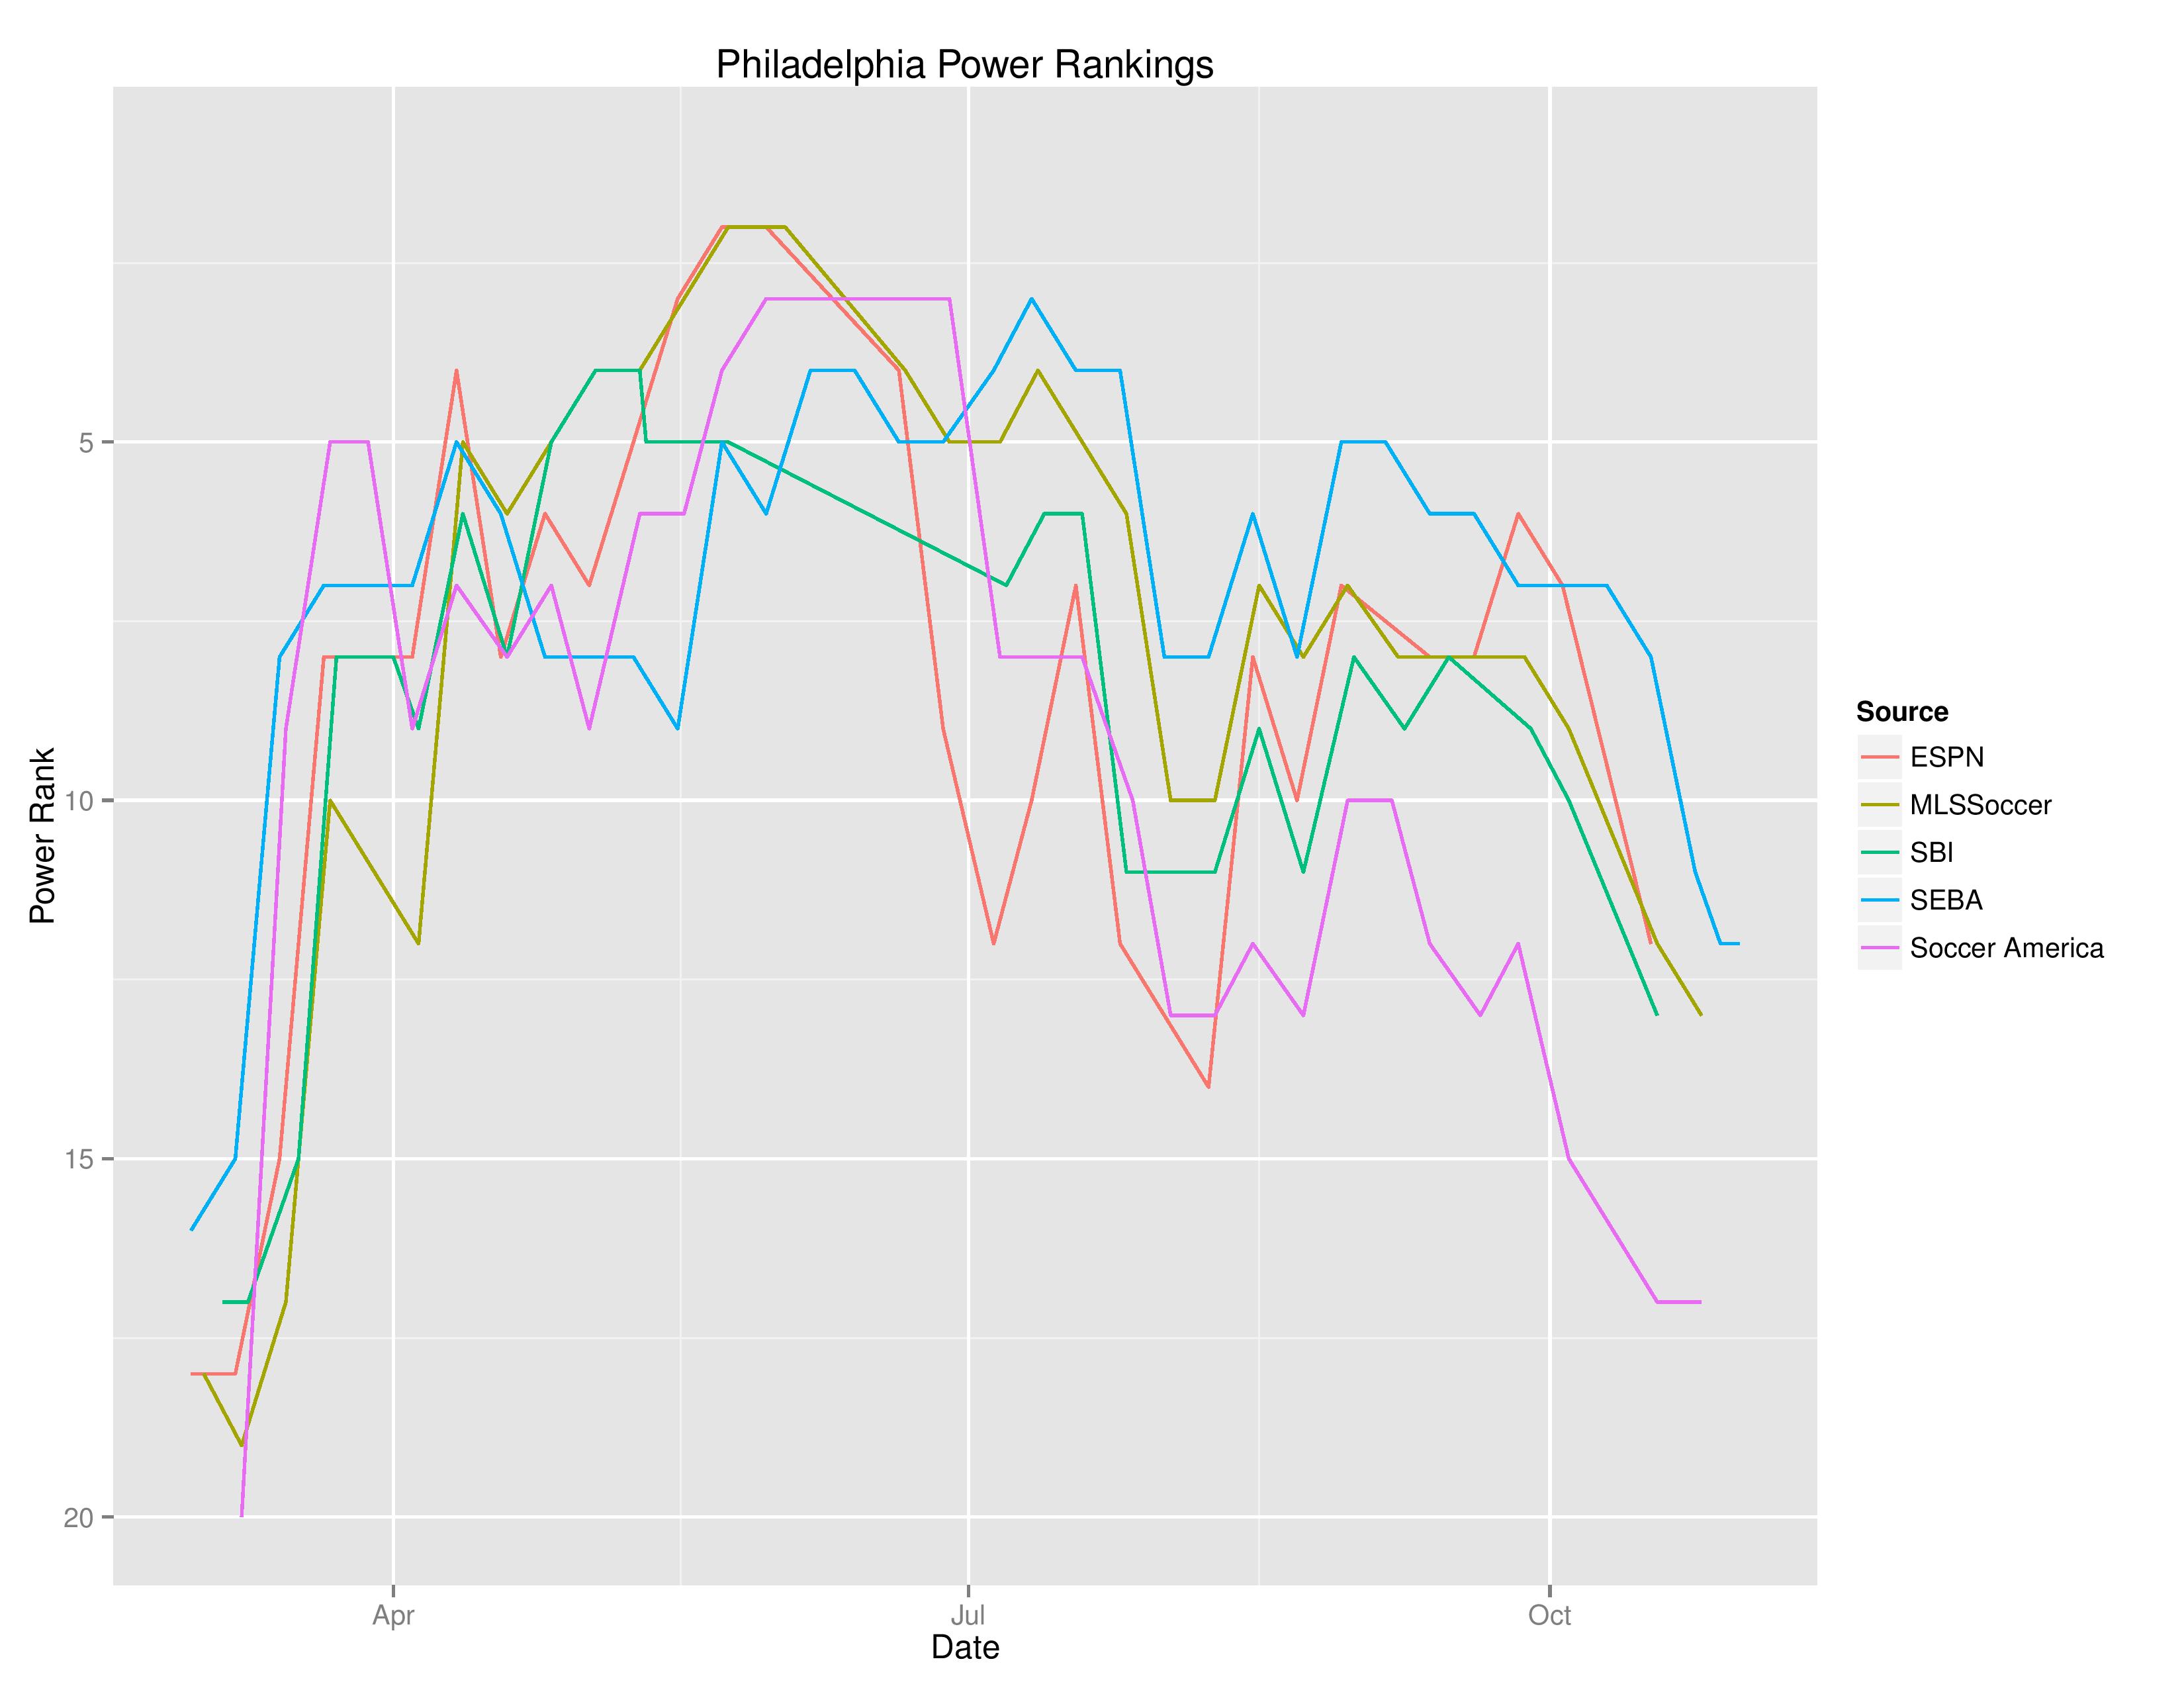
This shows the evolution of Philadelphia’s movement within SEBA and other media outlets’ power rankings.
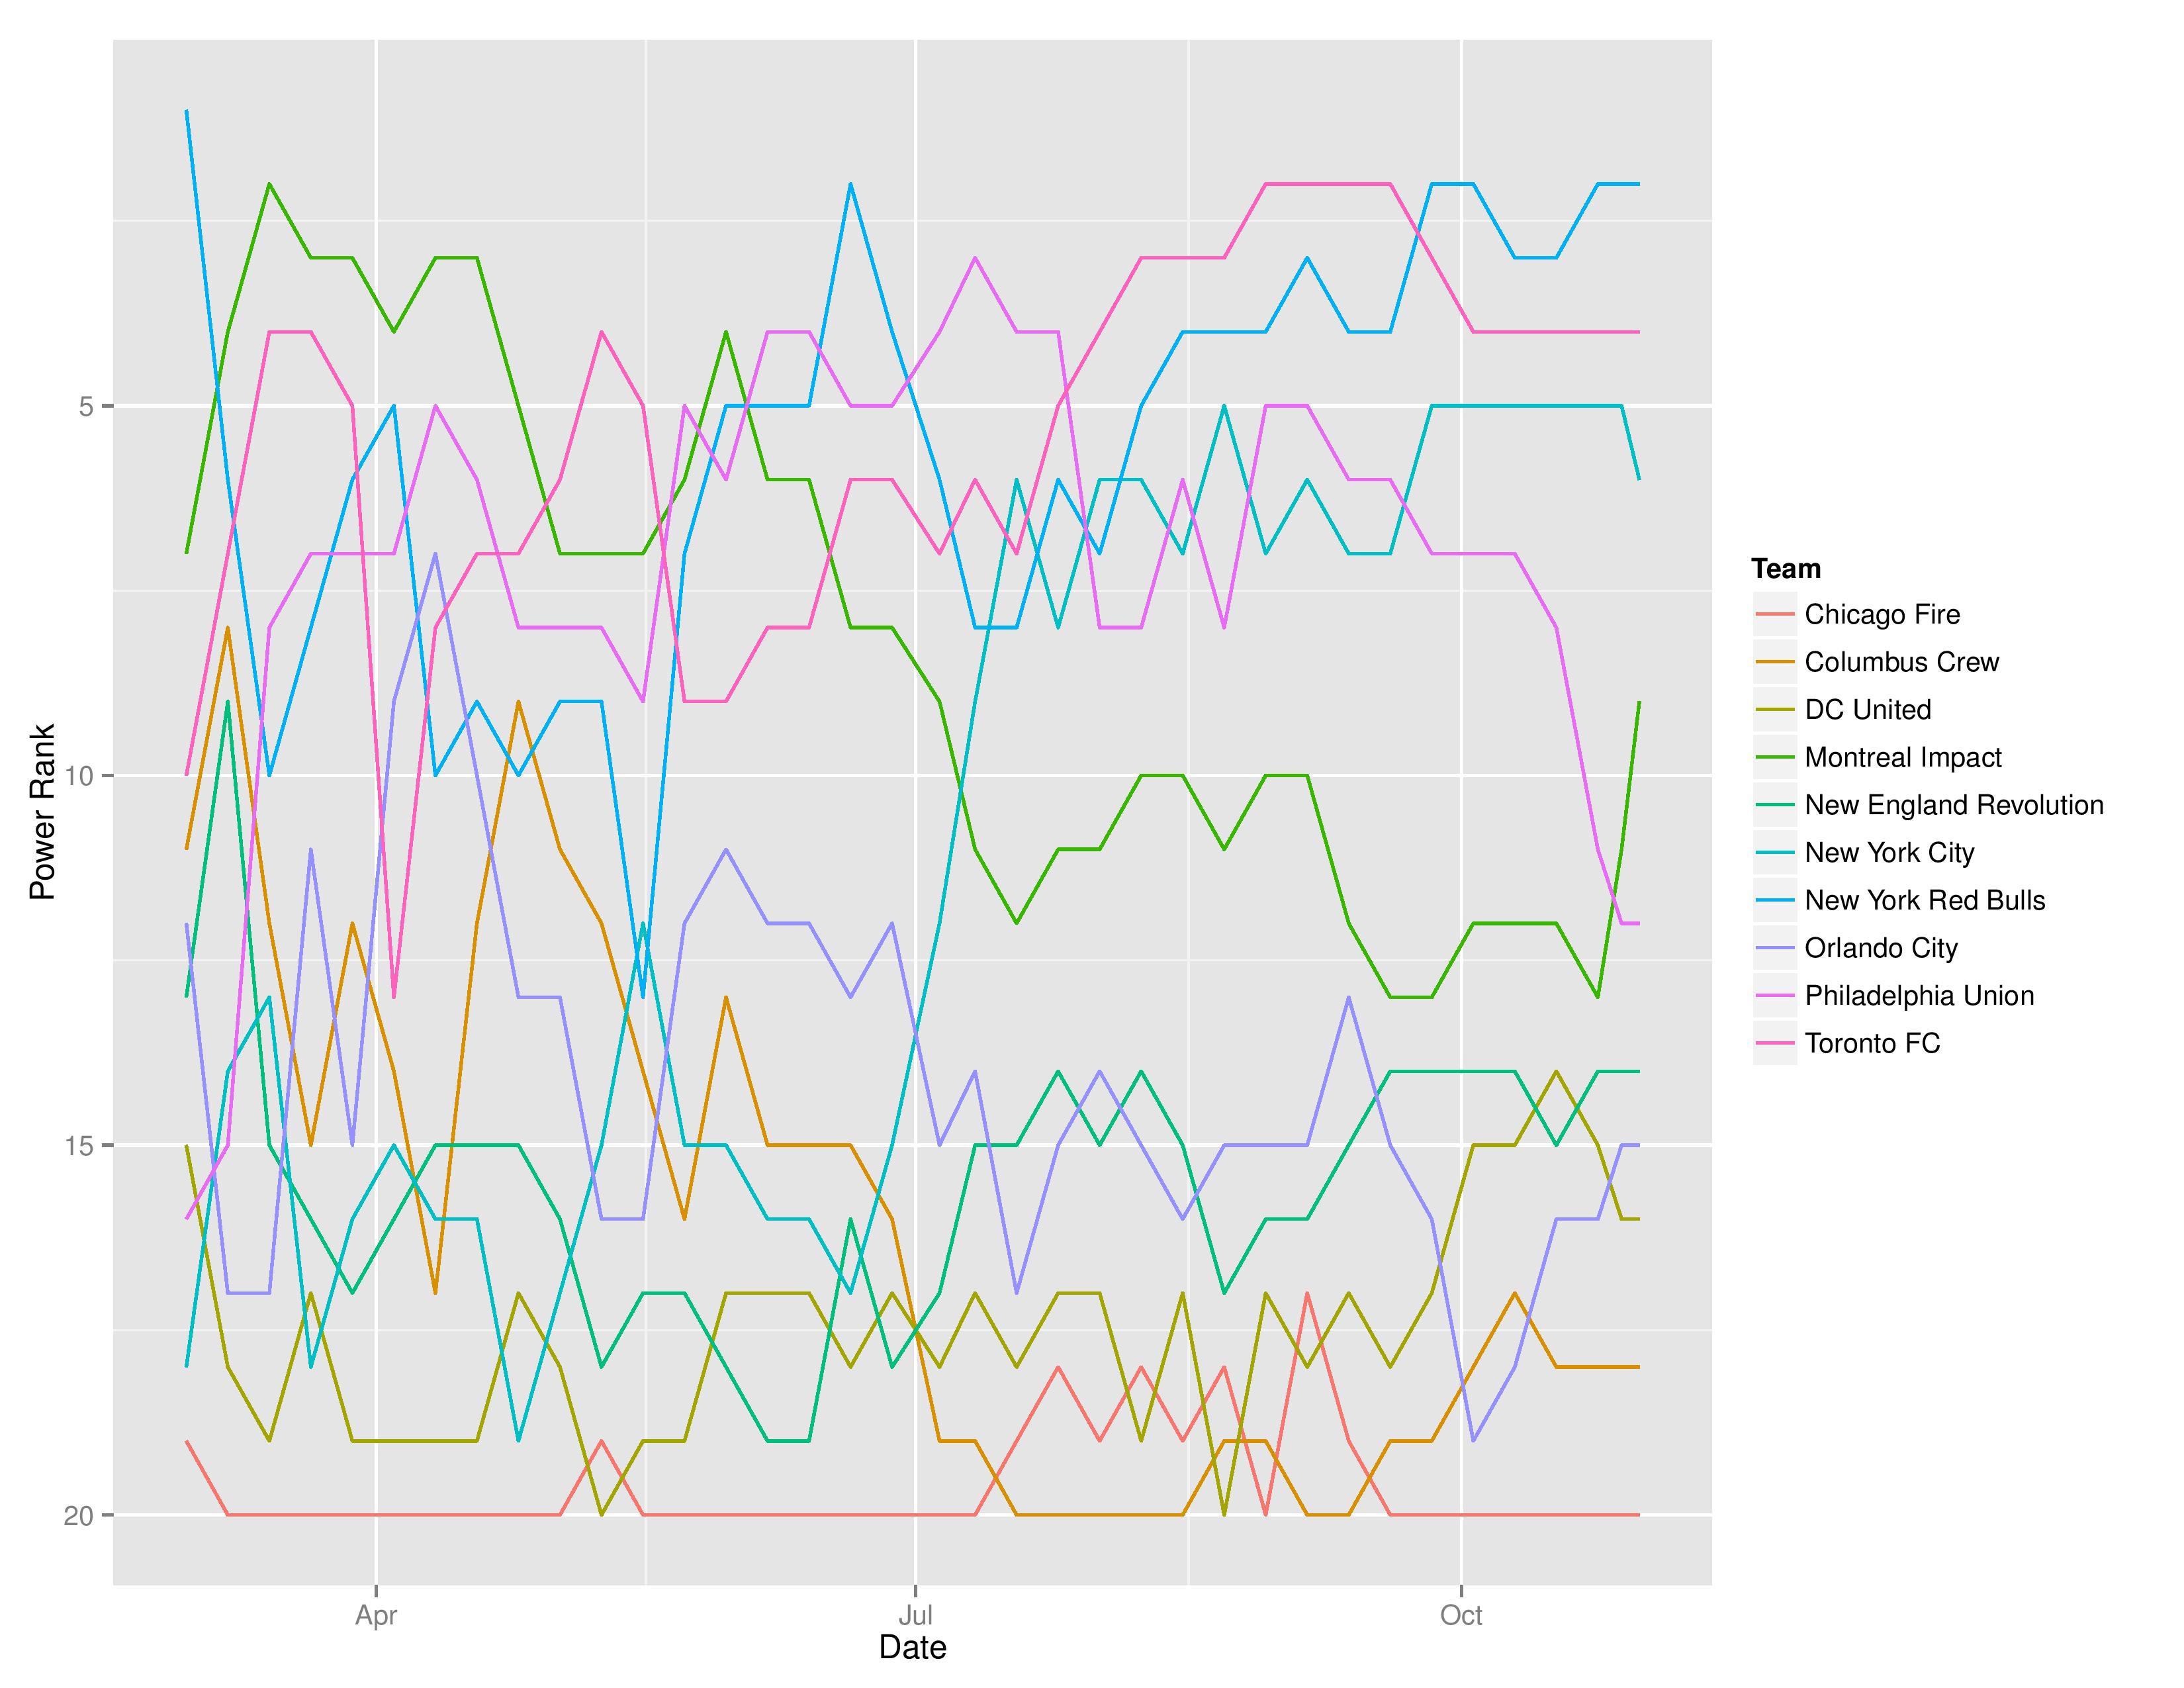
This shows the MLS Eastern Conference’s power rankings’ evolution in SEBA throughout the season.

Thanks for putting these oh so depressing numbers out :-).
.
It is interesting how the power rankings have several non playoff teams ahead of playoff teams even in the same conference (New England and Orlando ahead of DC, Vancouver ahead of SKC and RSL).
.
Can’t wait for next season’s numbers!
Sorry I responded so late, but thanks! I’m looking forward to them as well.
Shows how one result changes the table.
Yes, especially in the playoffs, the effect of one game can have such a dramatic effect due to the lack of remaining uncertainty