Welcome to the Statistical Extrapolation Bayesian Analyzer Projection System, which is, of course, a tortured gathering of words used to form the SEBA Projection System.
The system consists of a model projecting the probabilities of game results and then a barrage of simulations which account for the remaining luck. So the probabilities you see below show, essentially, what the odds are of an outcome if the team continues to play like it has been.
Below are the current season forecasts using data from games through August 21, 2016.
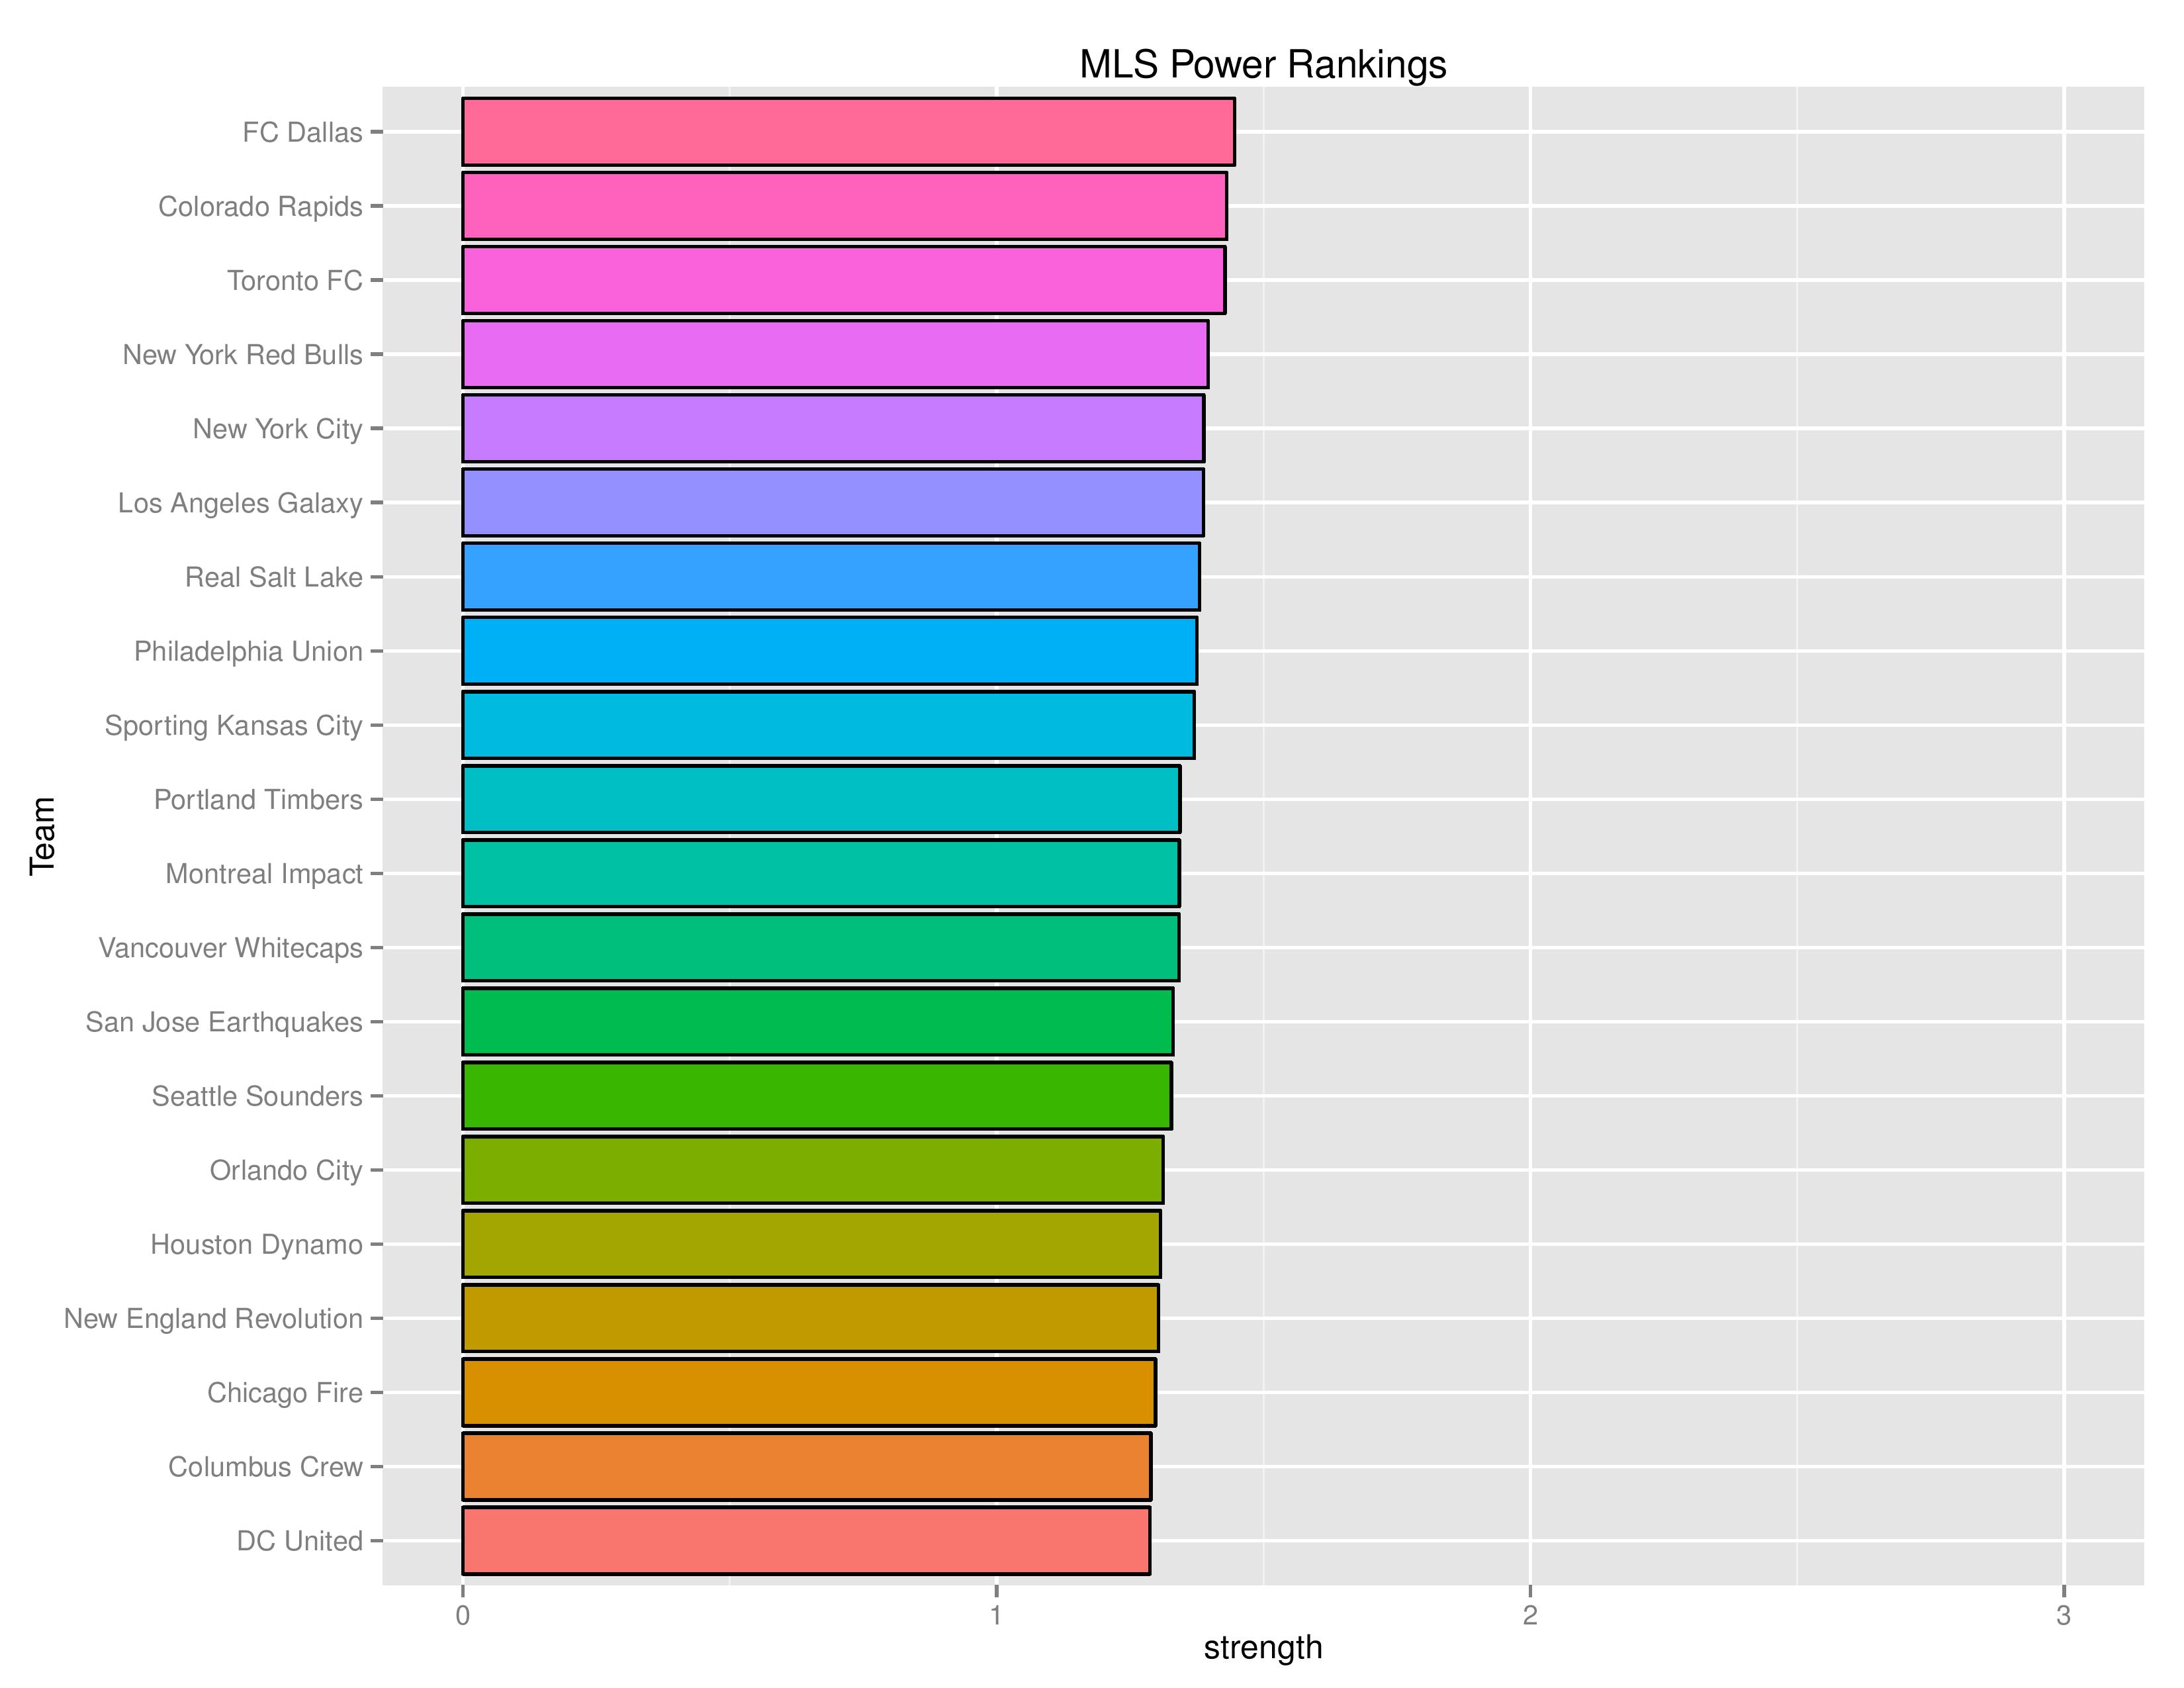
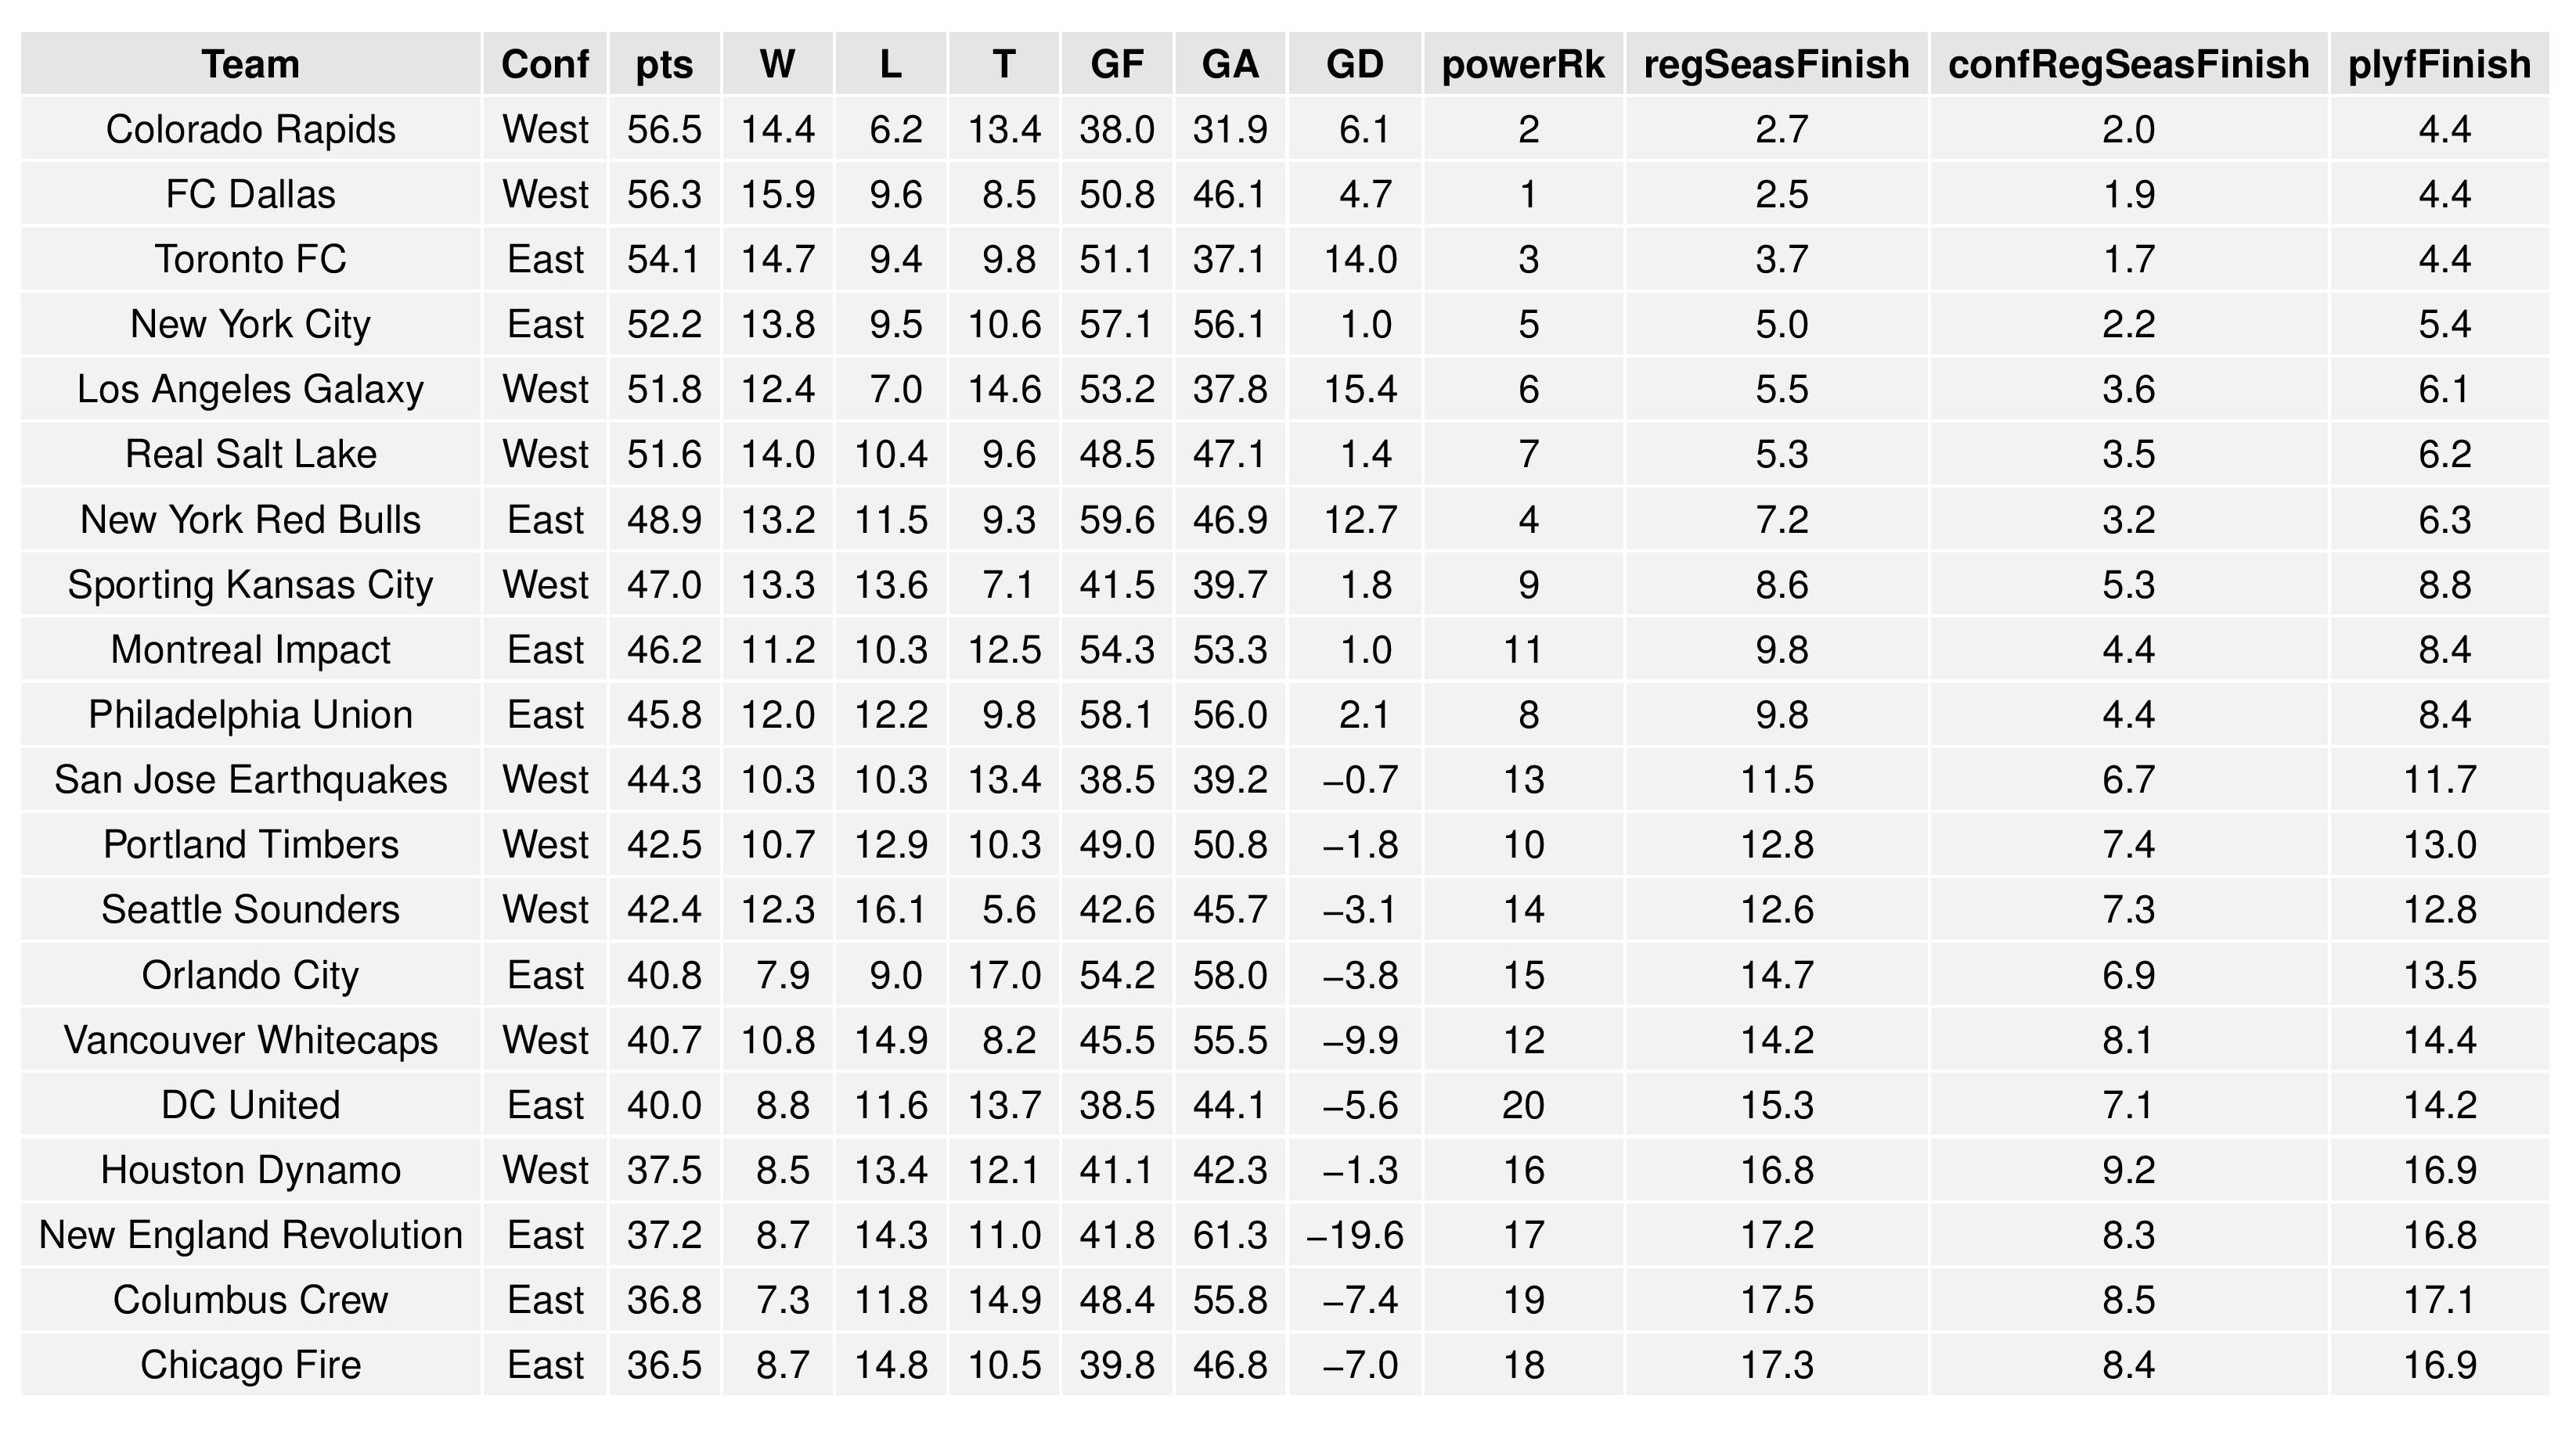
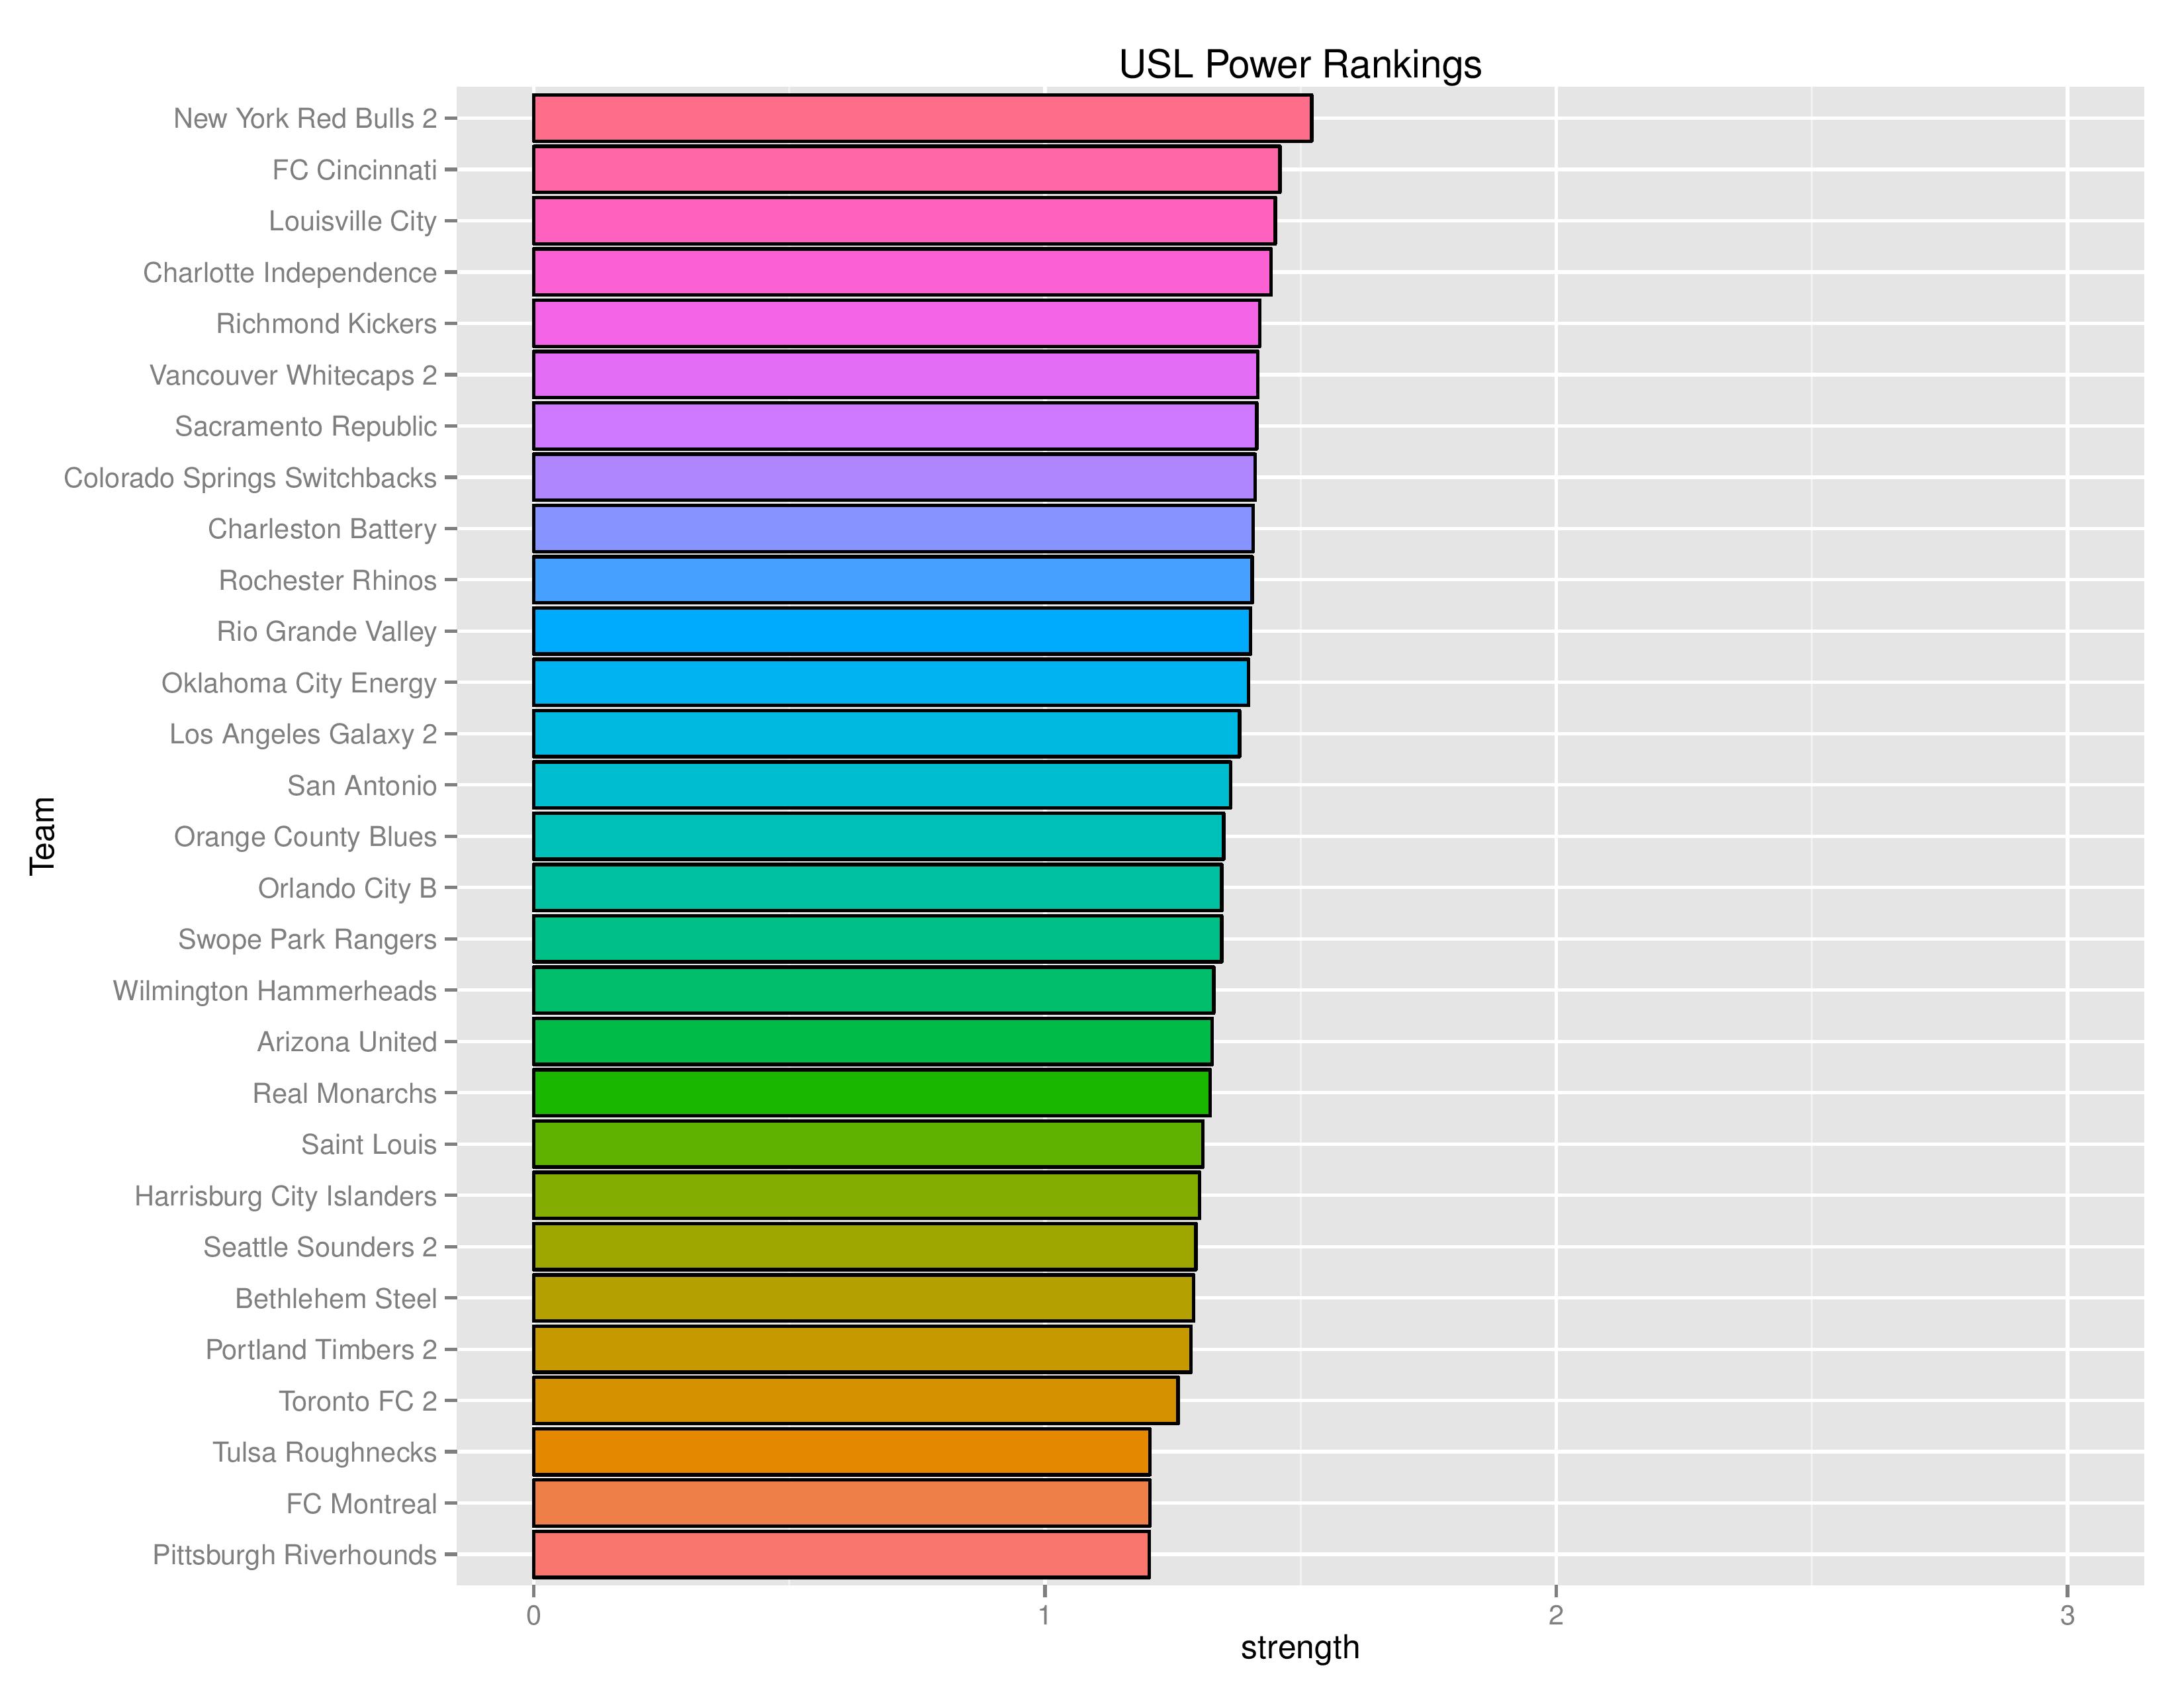
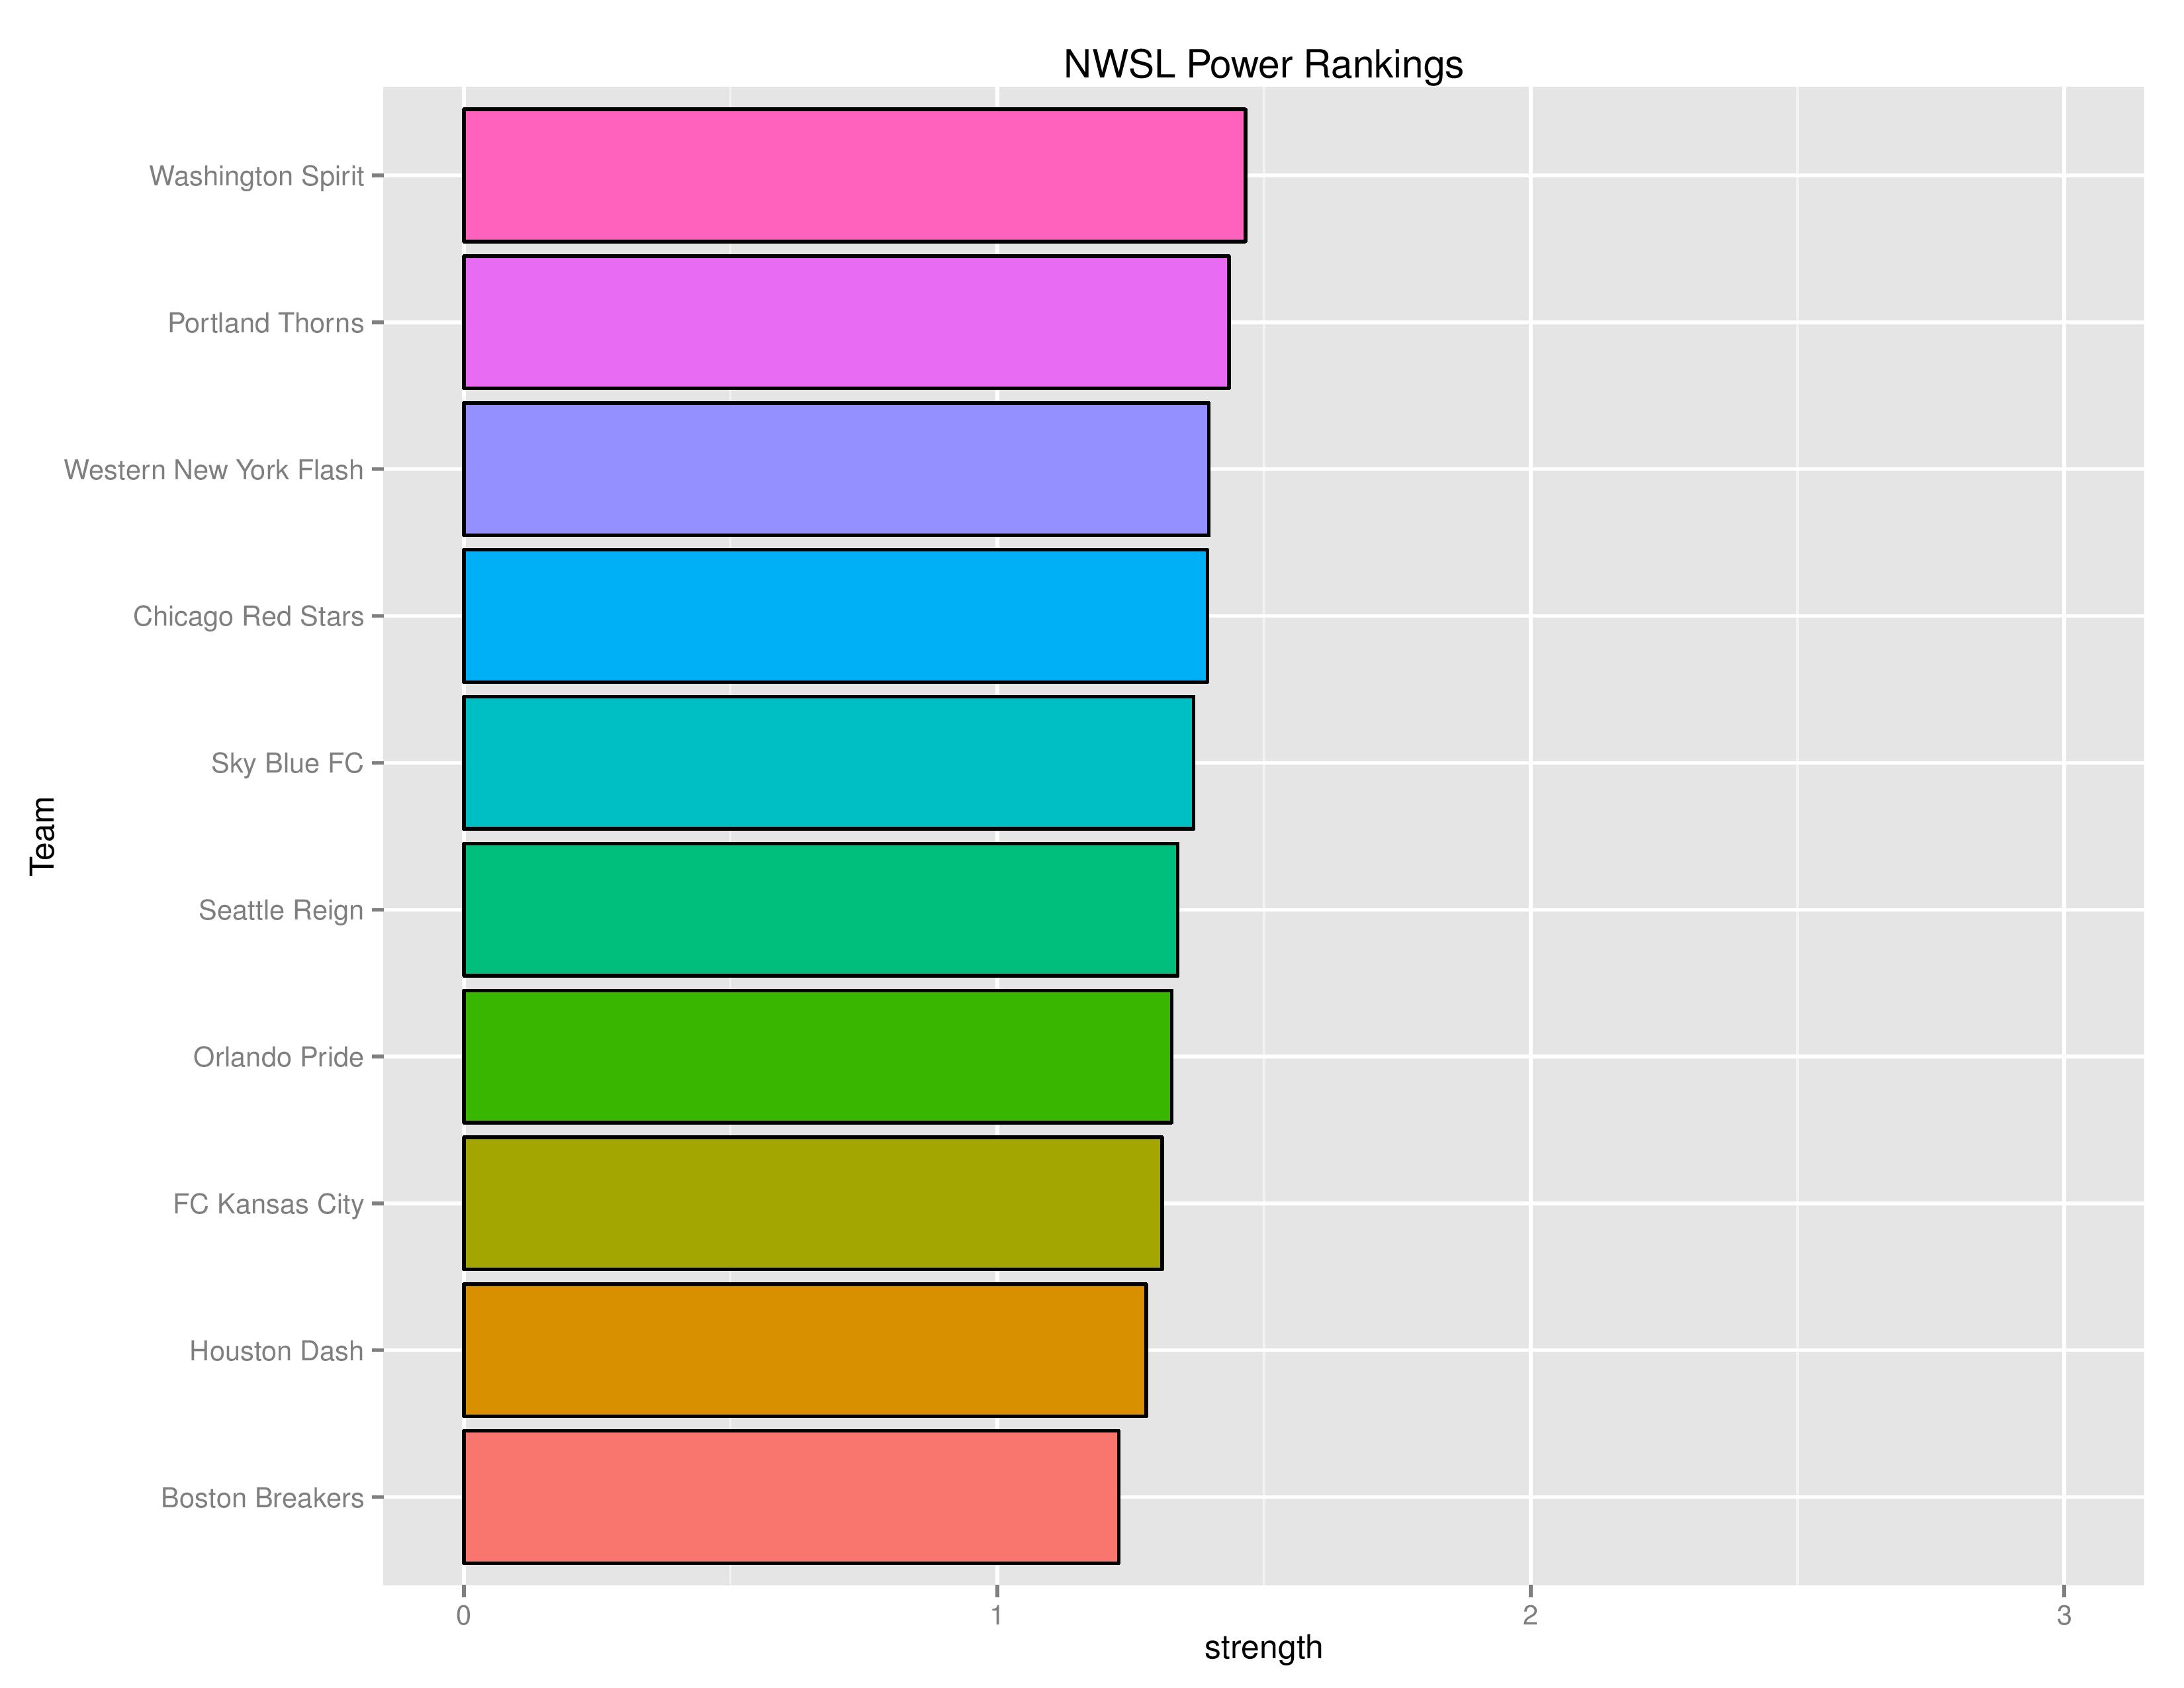
Power Rankings
The “Power Rankings” we concoct are the actual “strength” of the team according to competitive expectations. They are computed showing average expected points result if every team in MLS played every team both home and away.
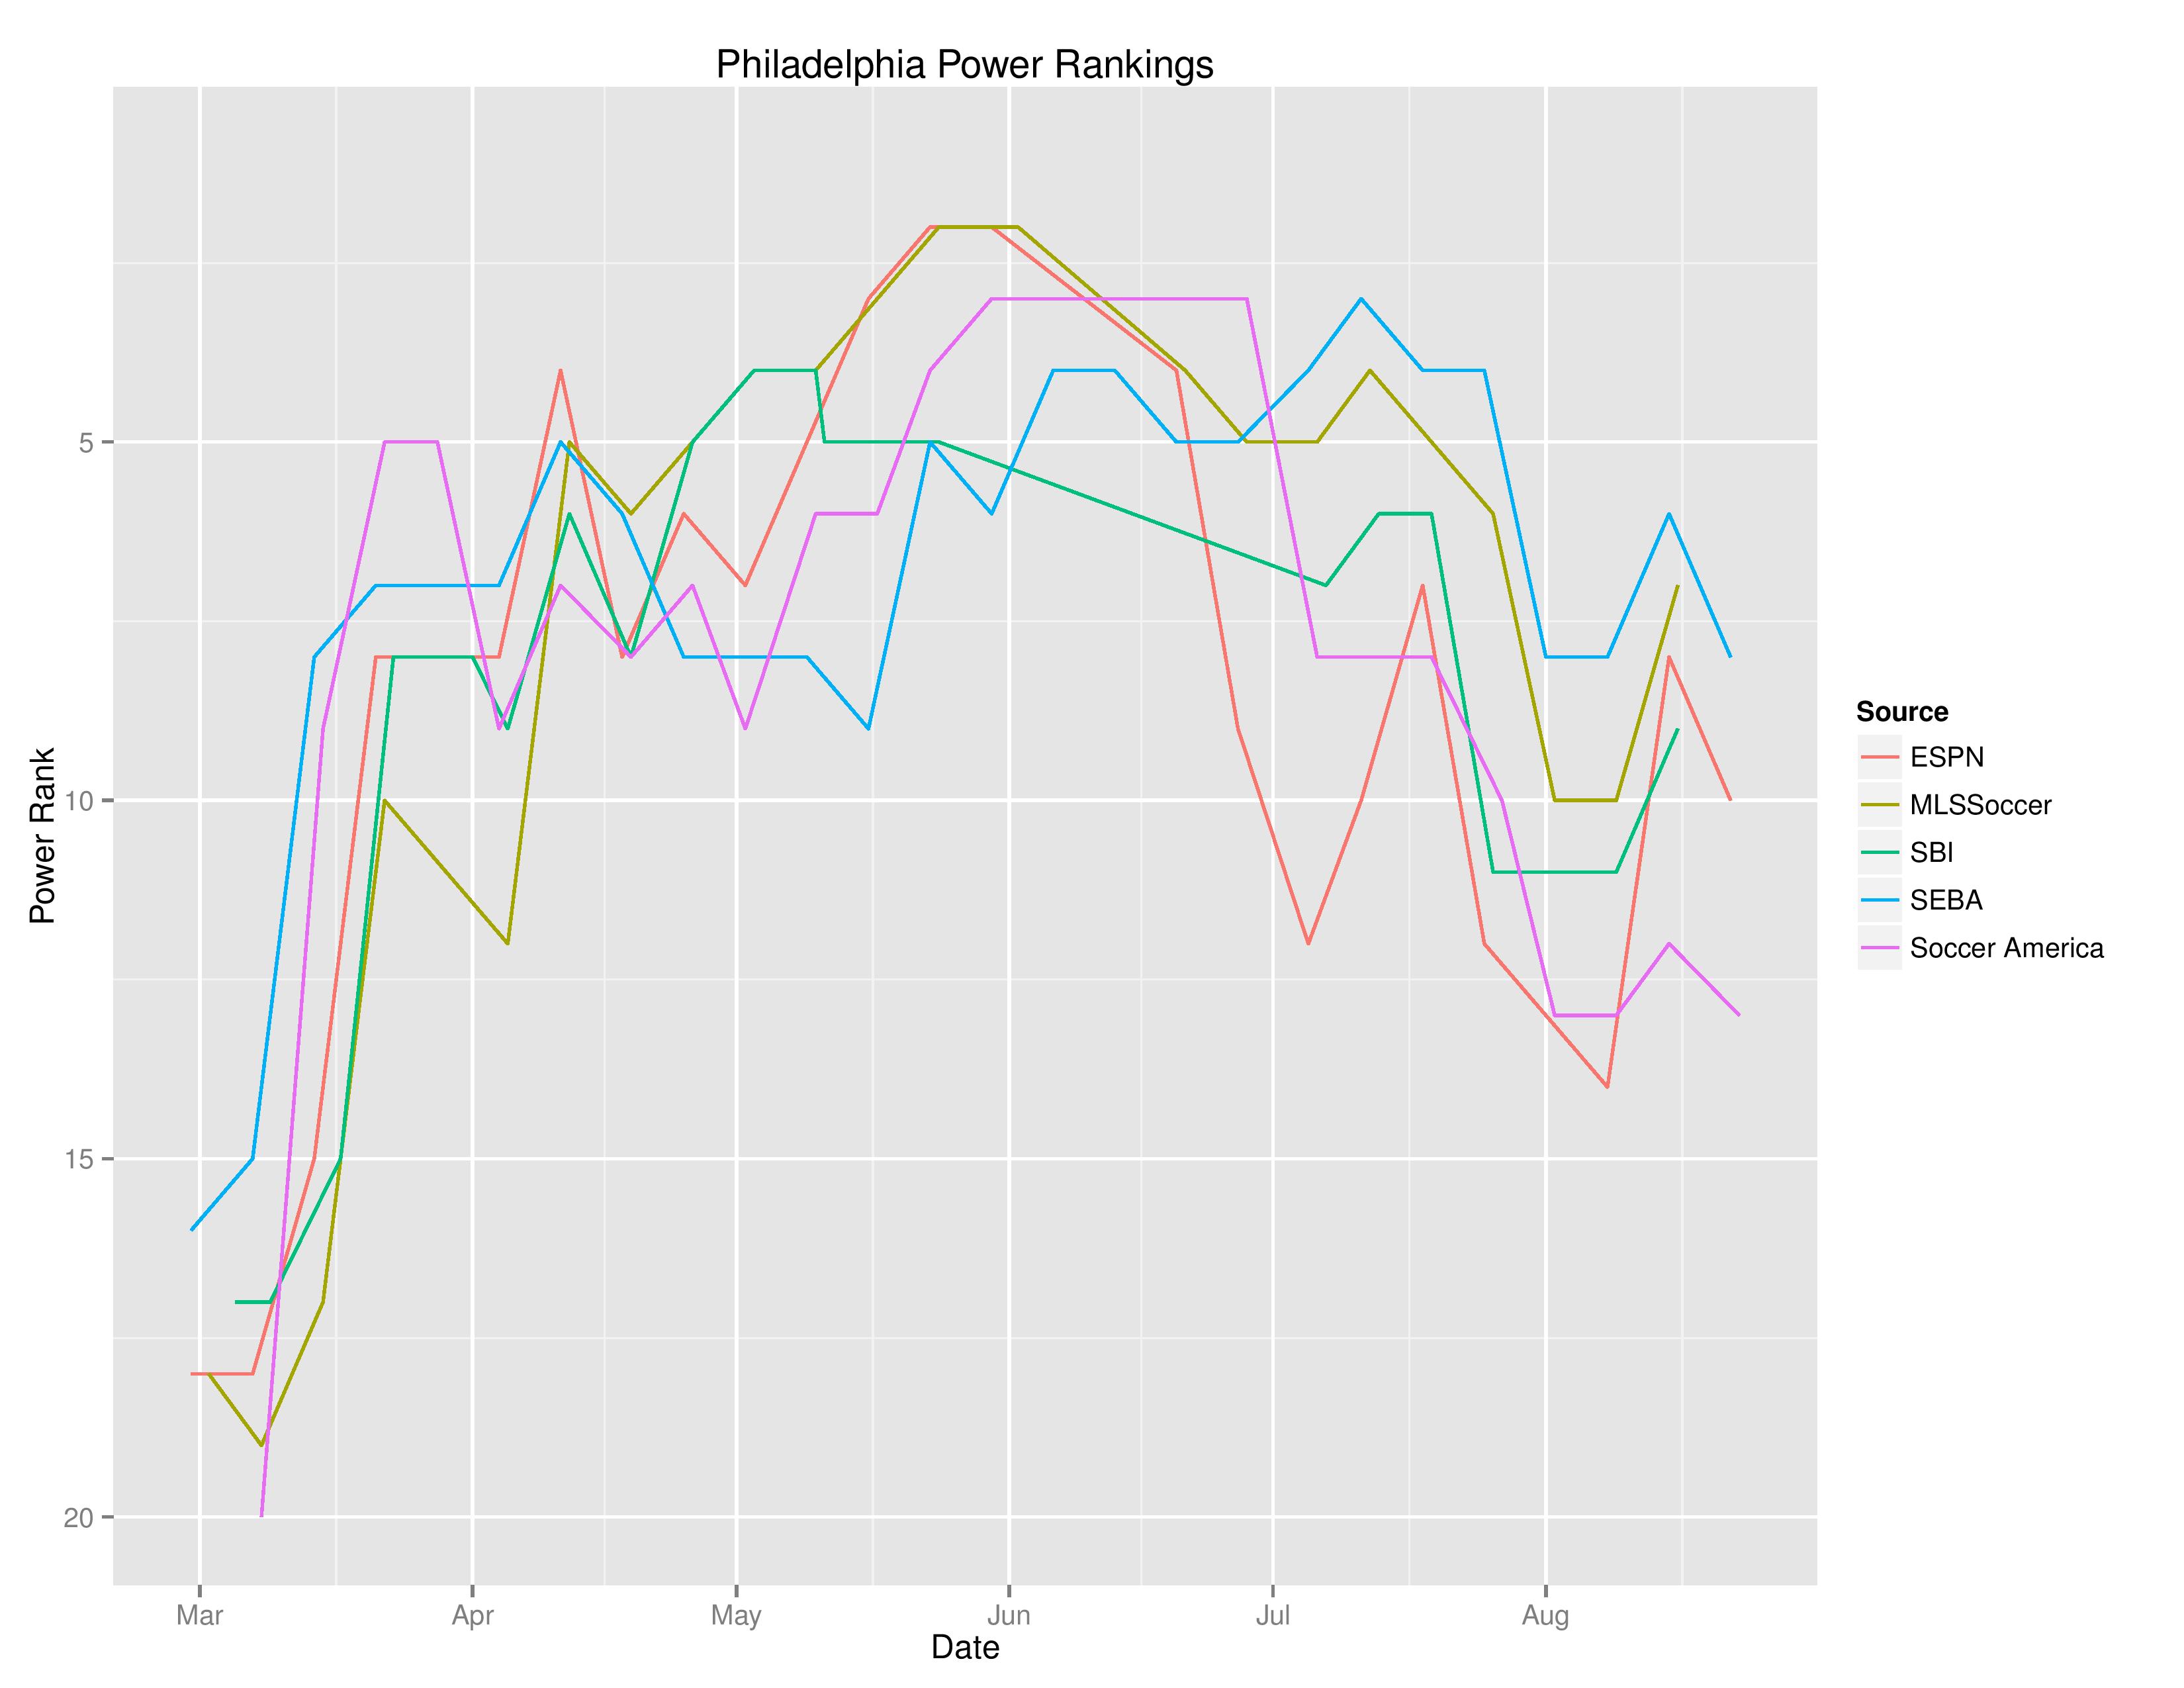
SEBA has the Union declining back t0 No. 8 from No. 6. ESPN has the Union down two spots to No. 10 from No. 8. Soccer America has the Union down one spot to No. 13 from No. 12.
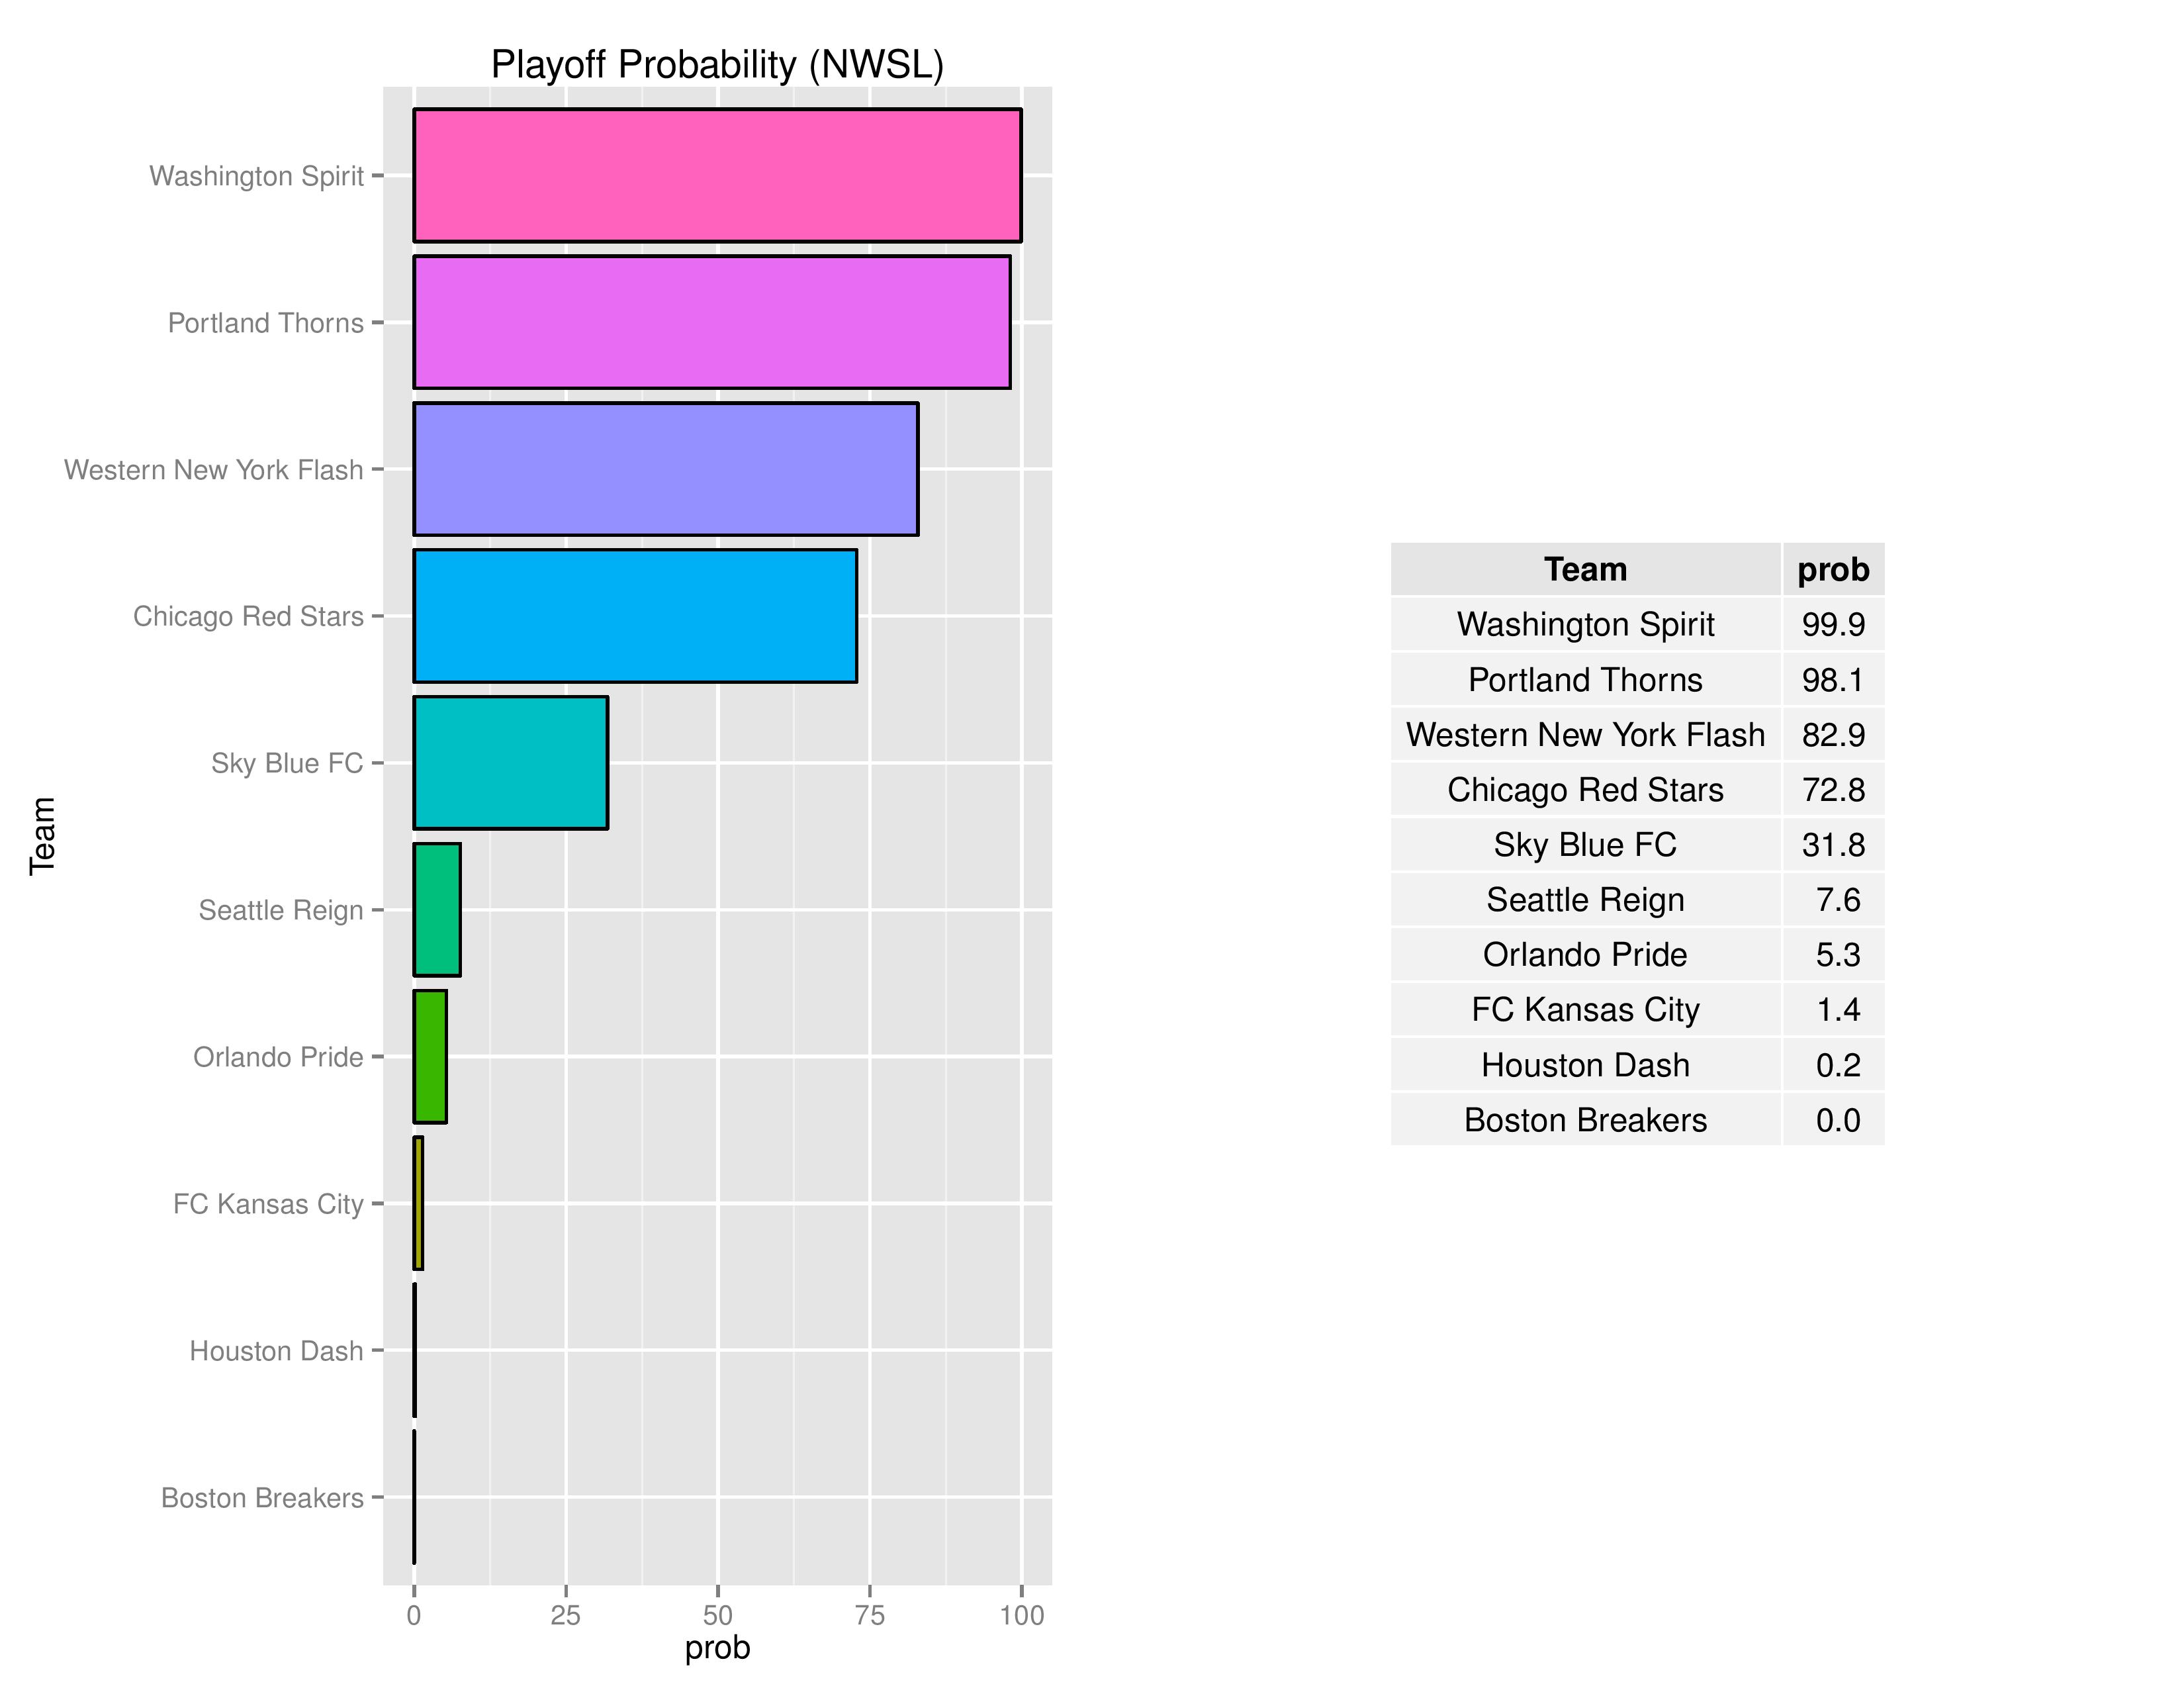
Playoffs probability and more
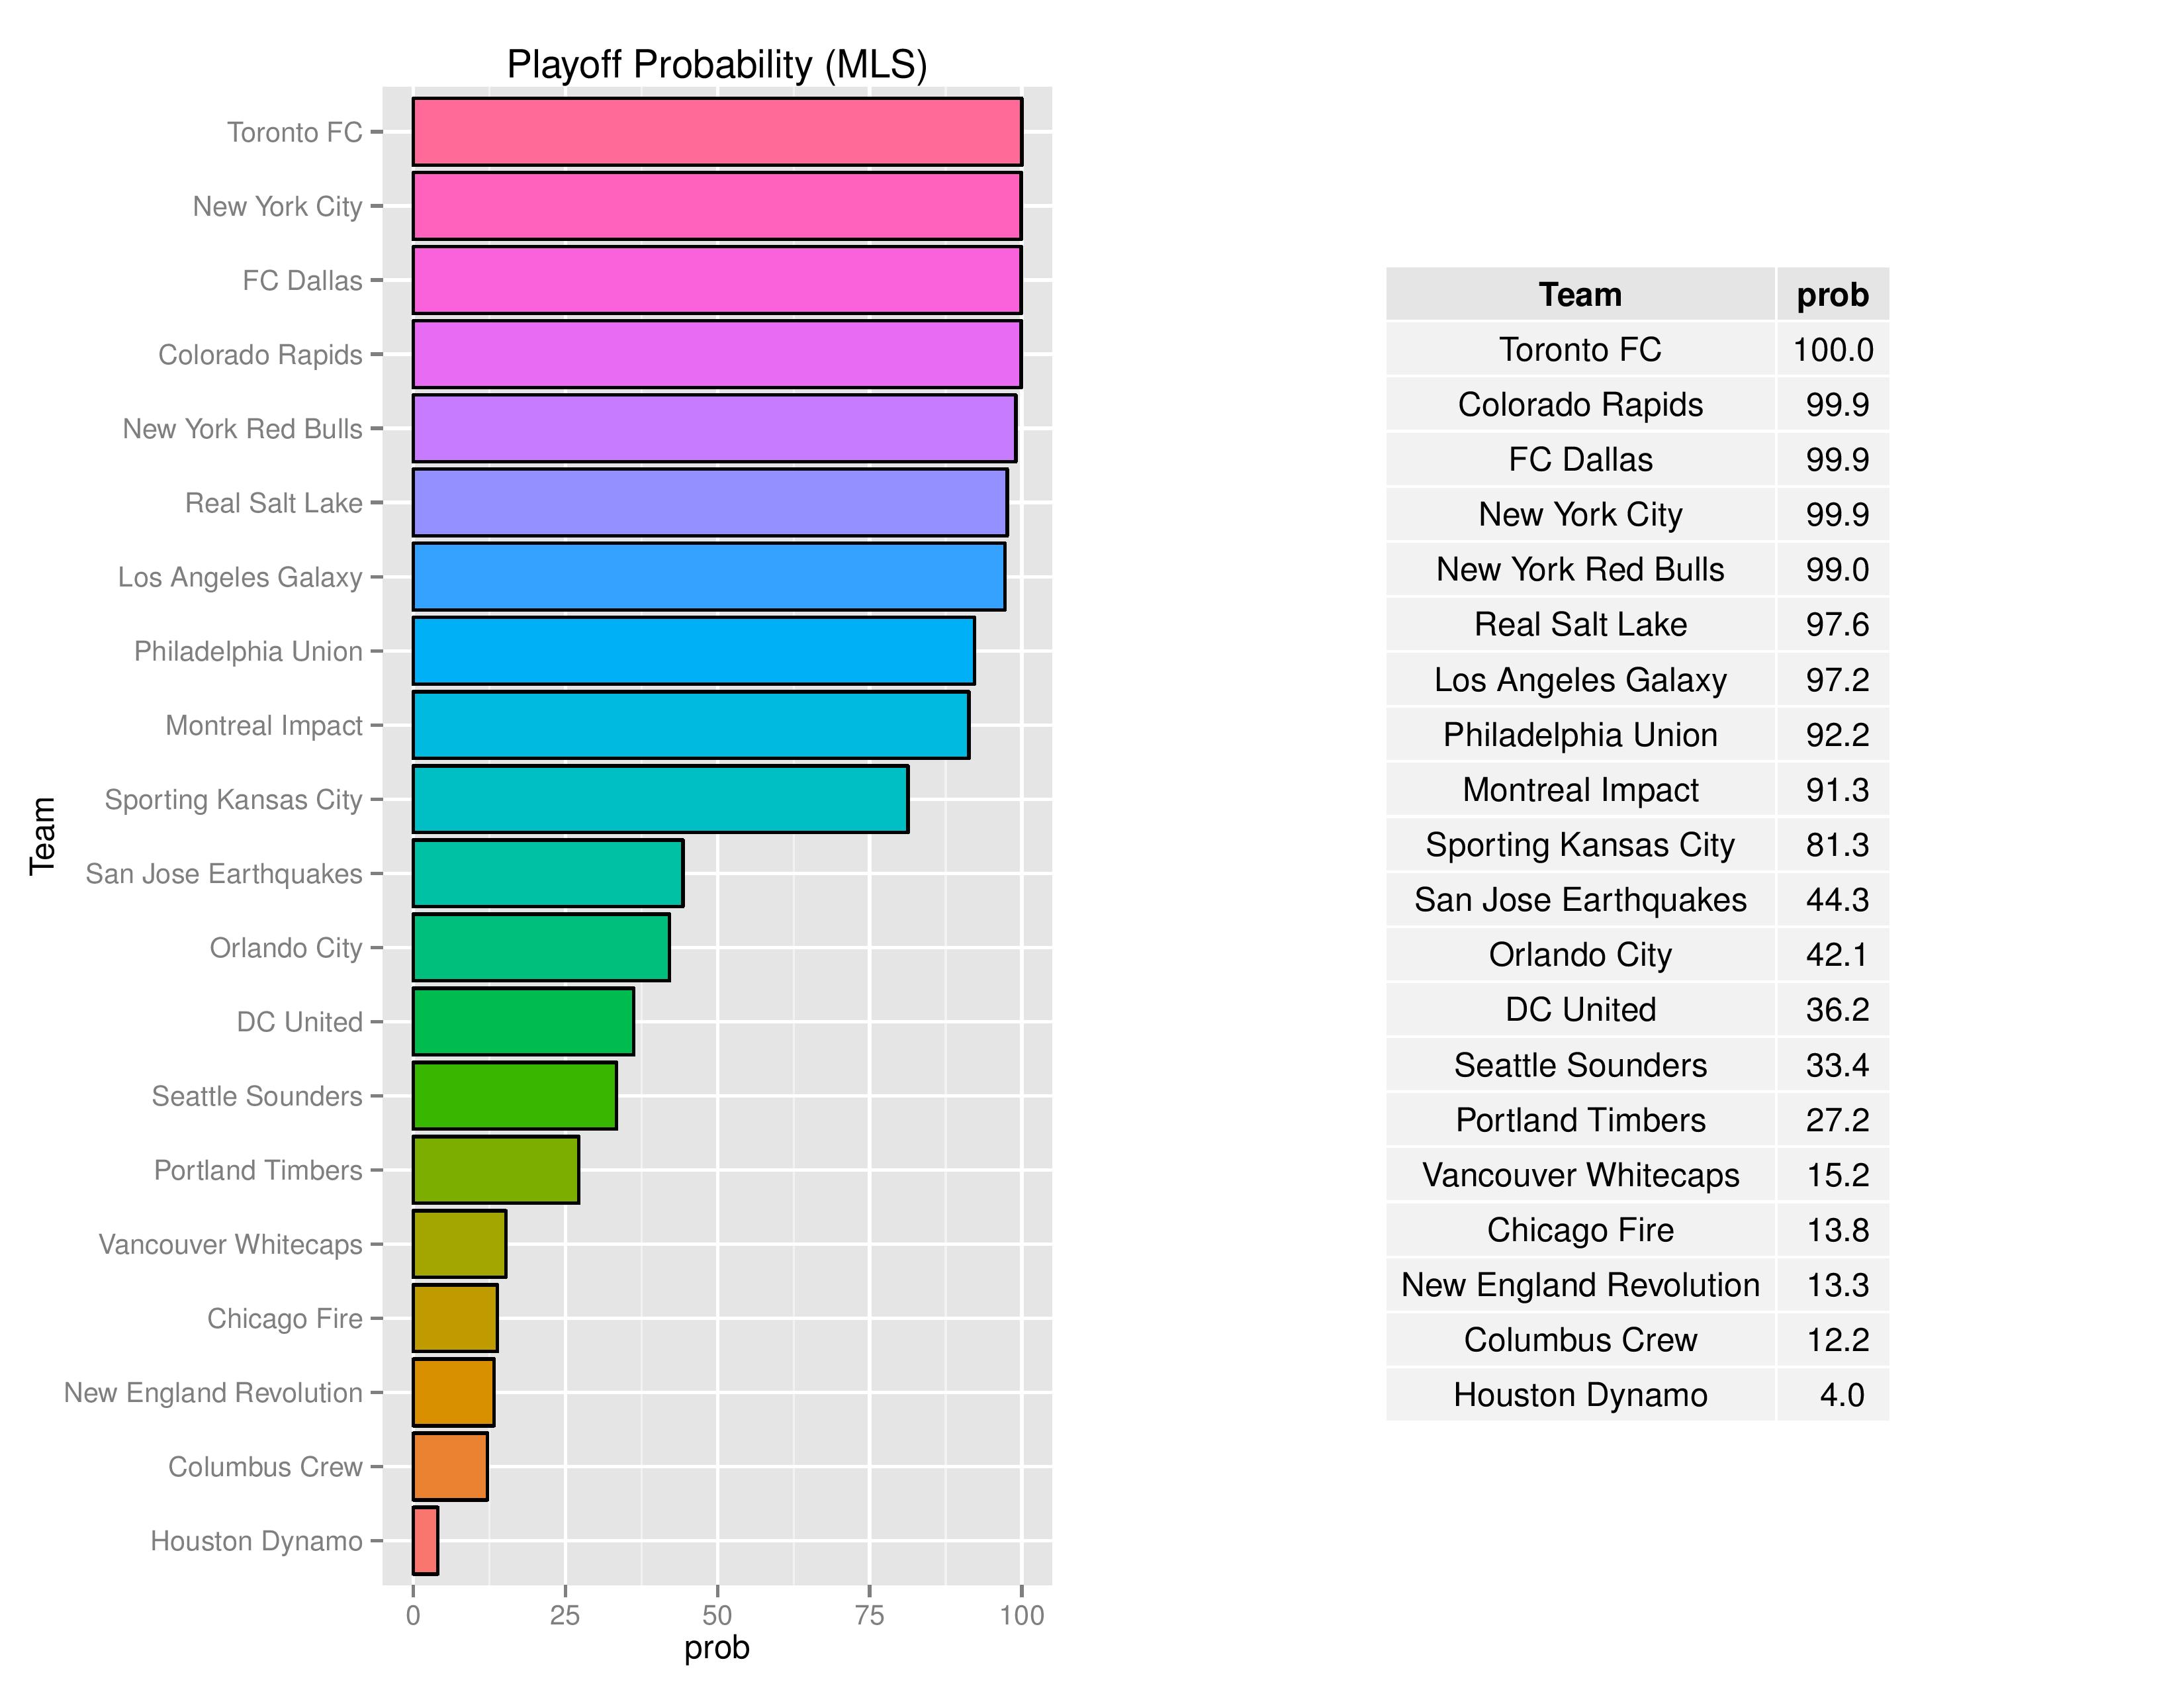
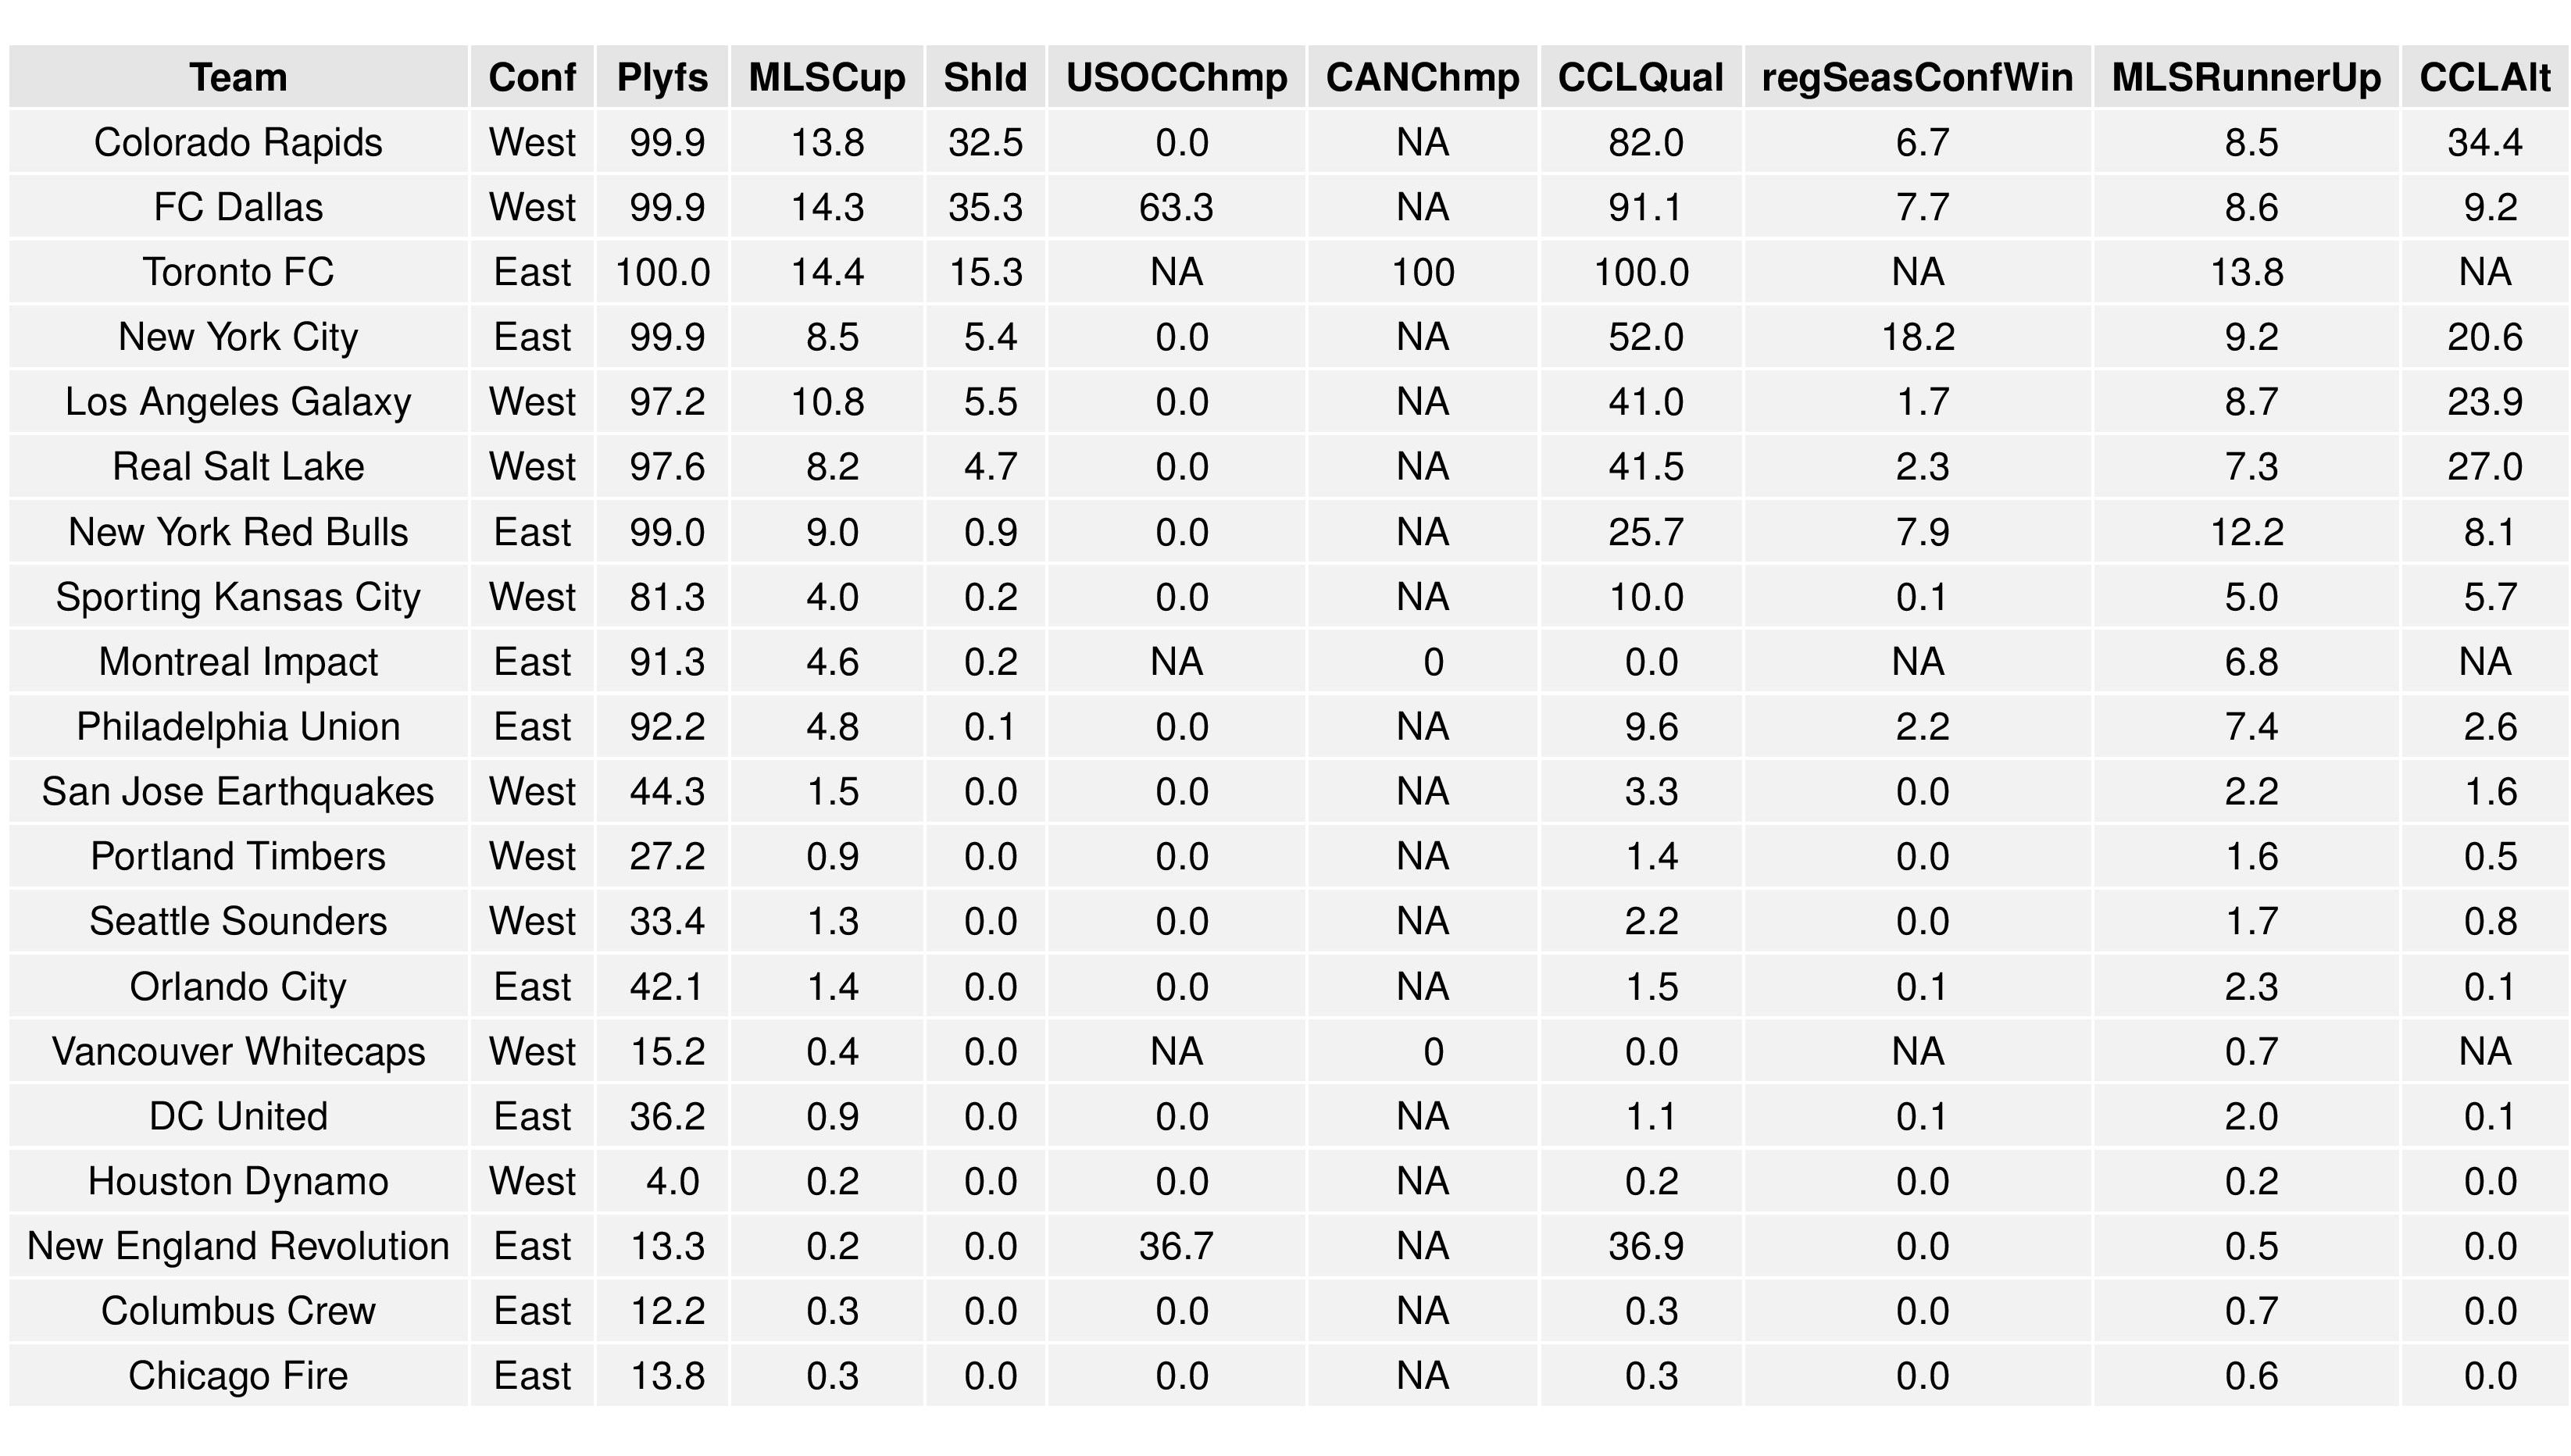
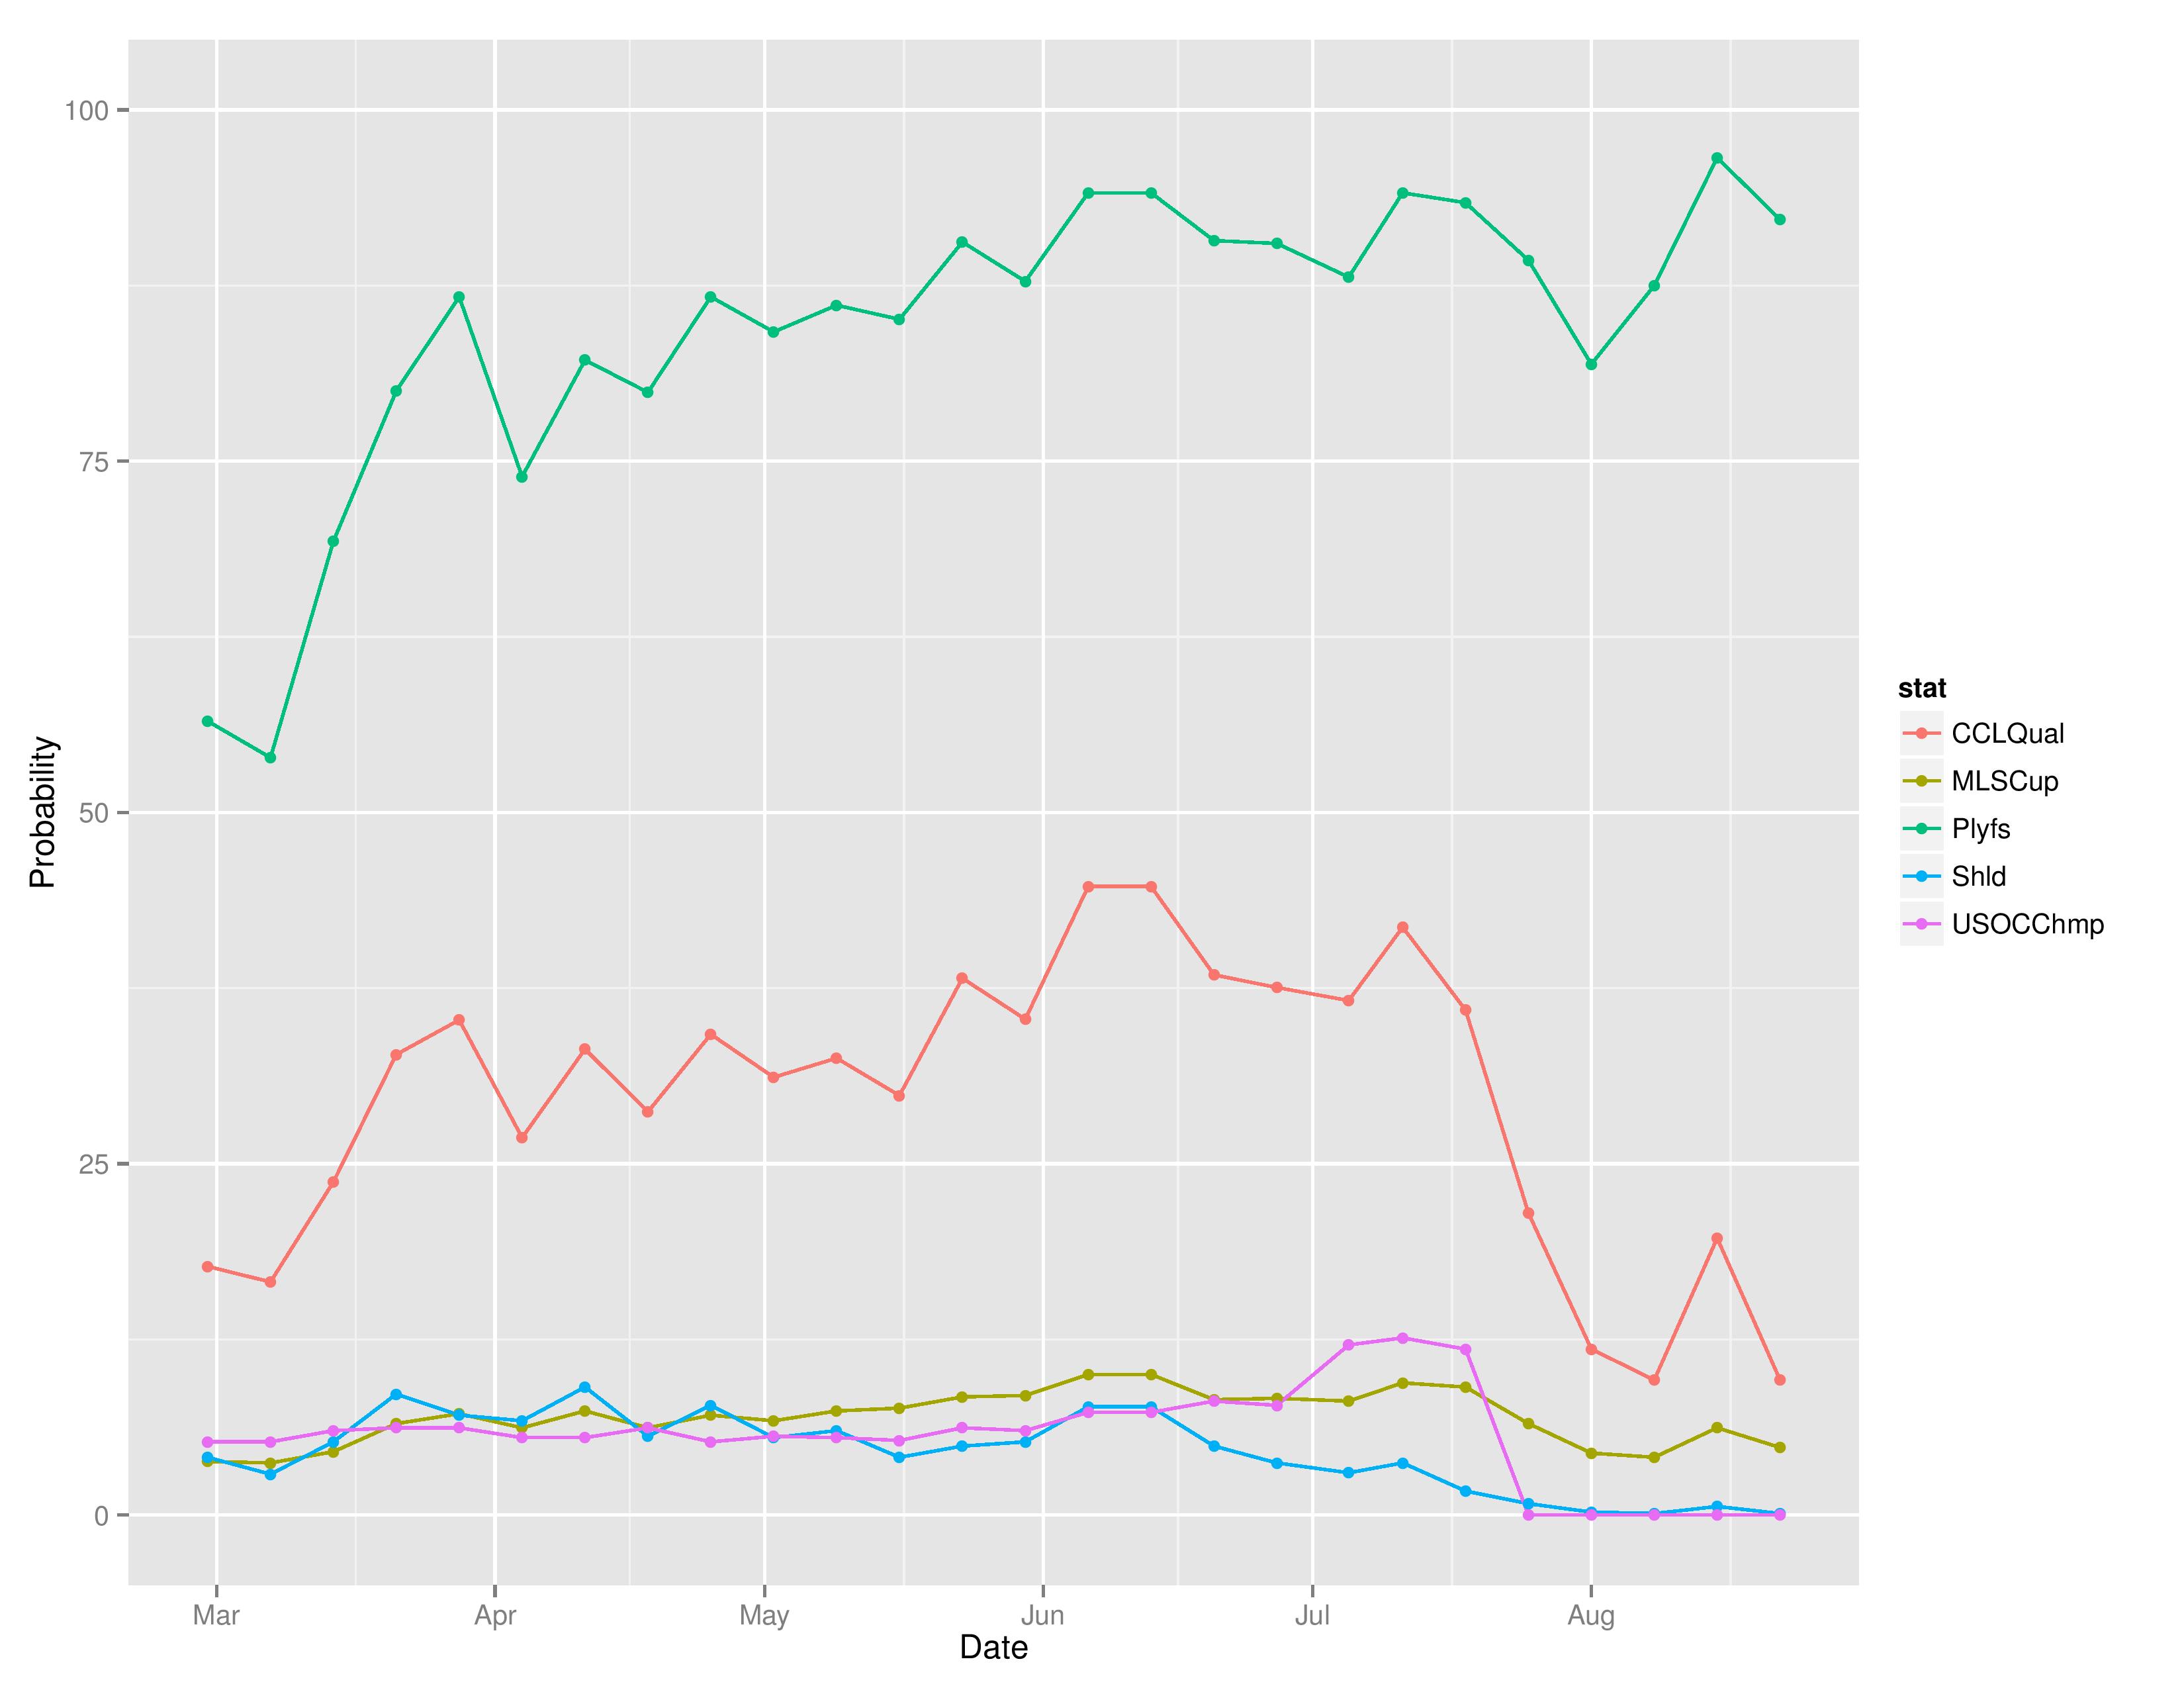
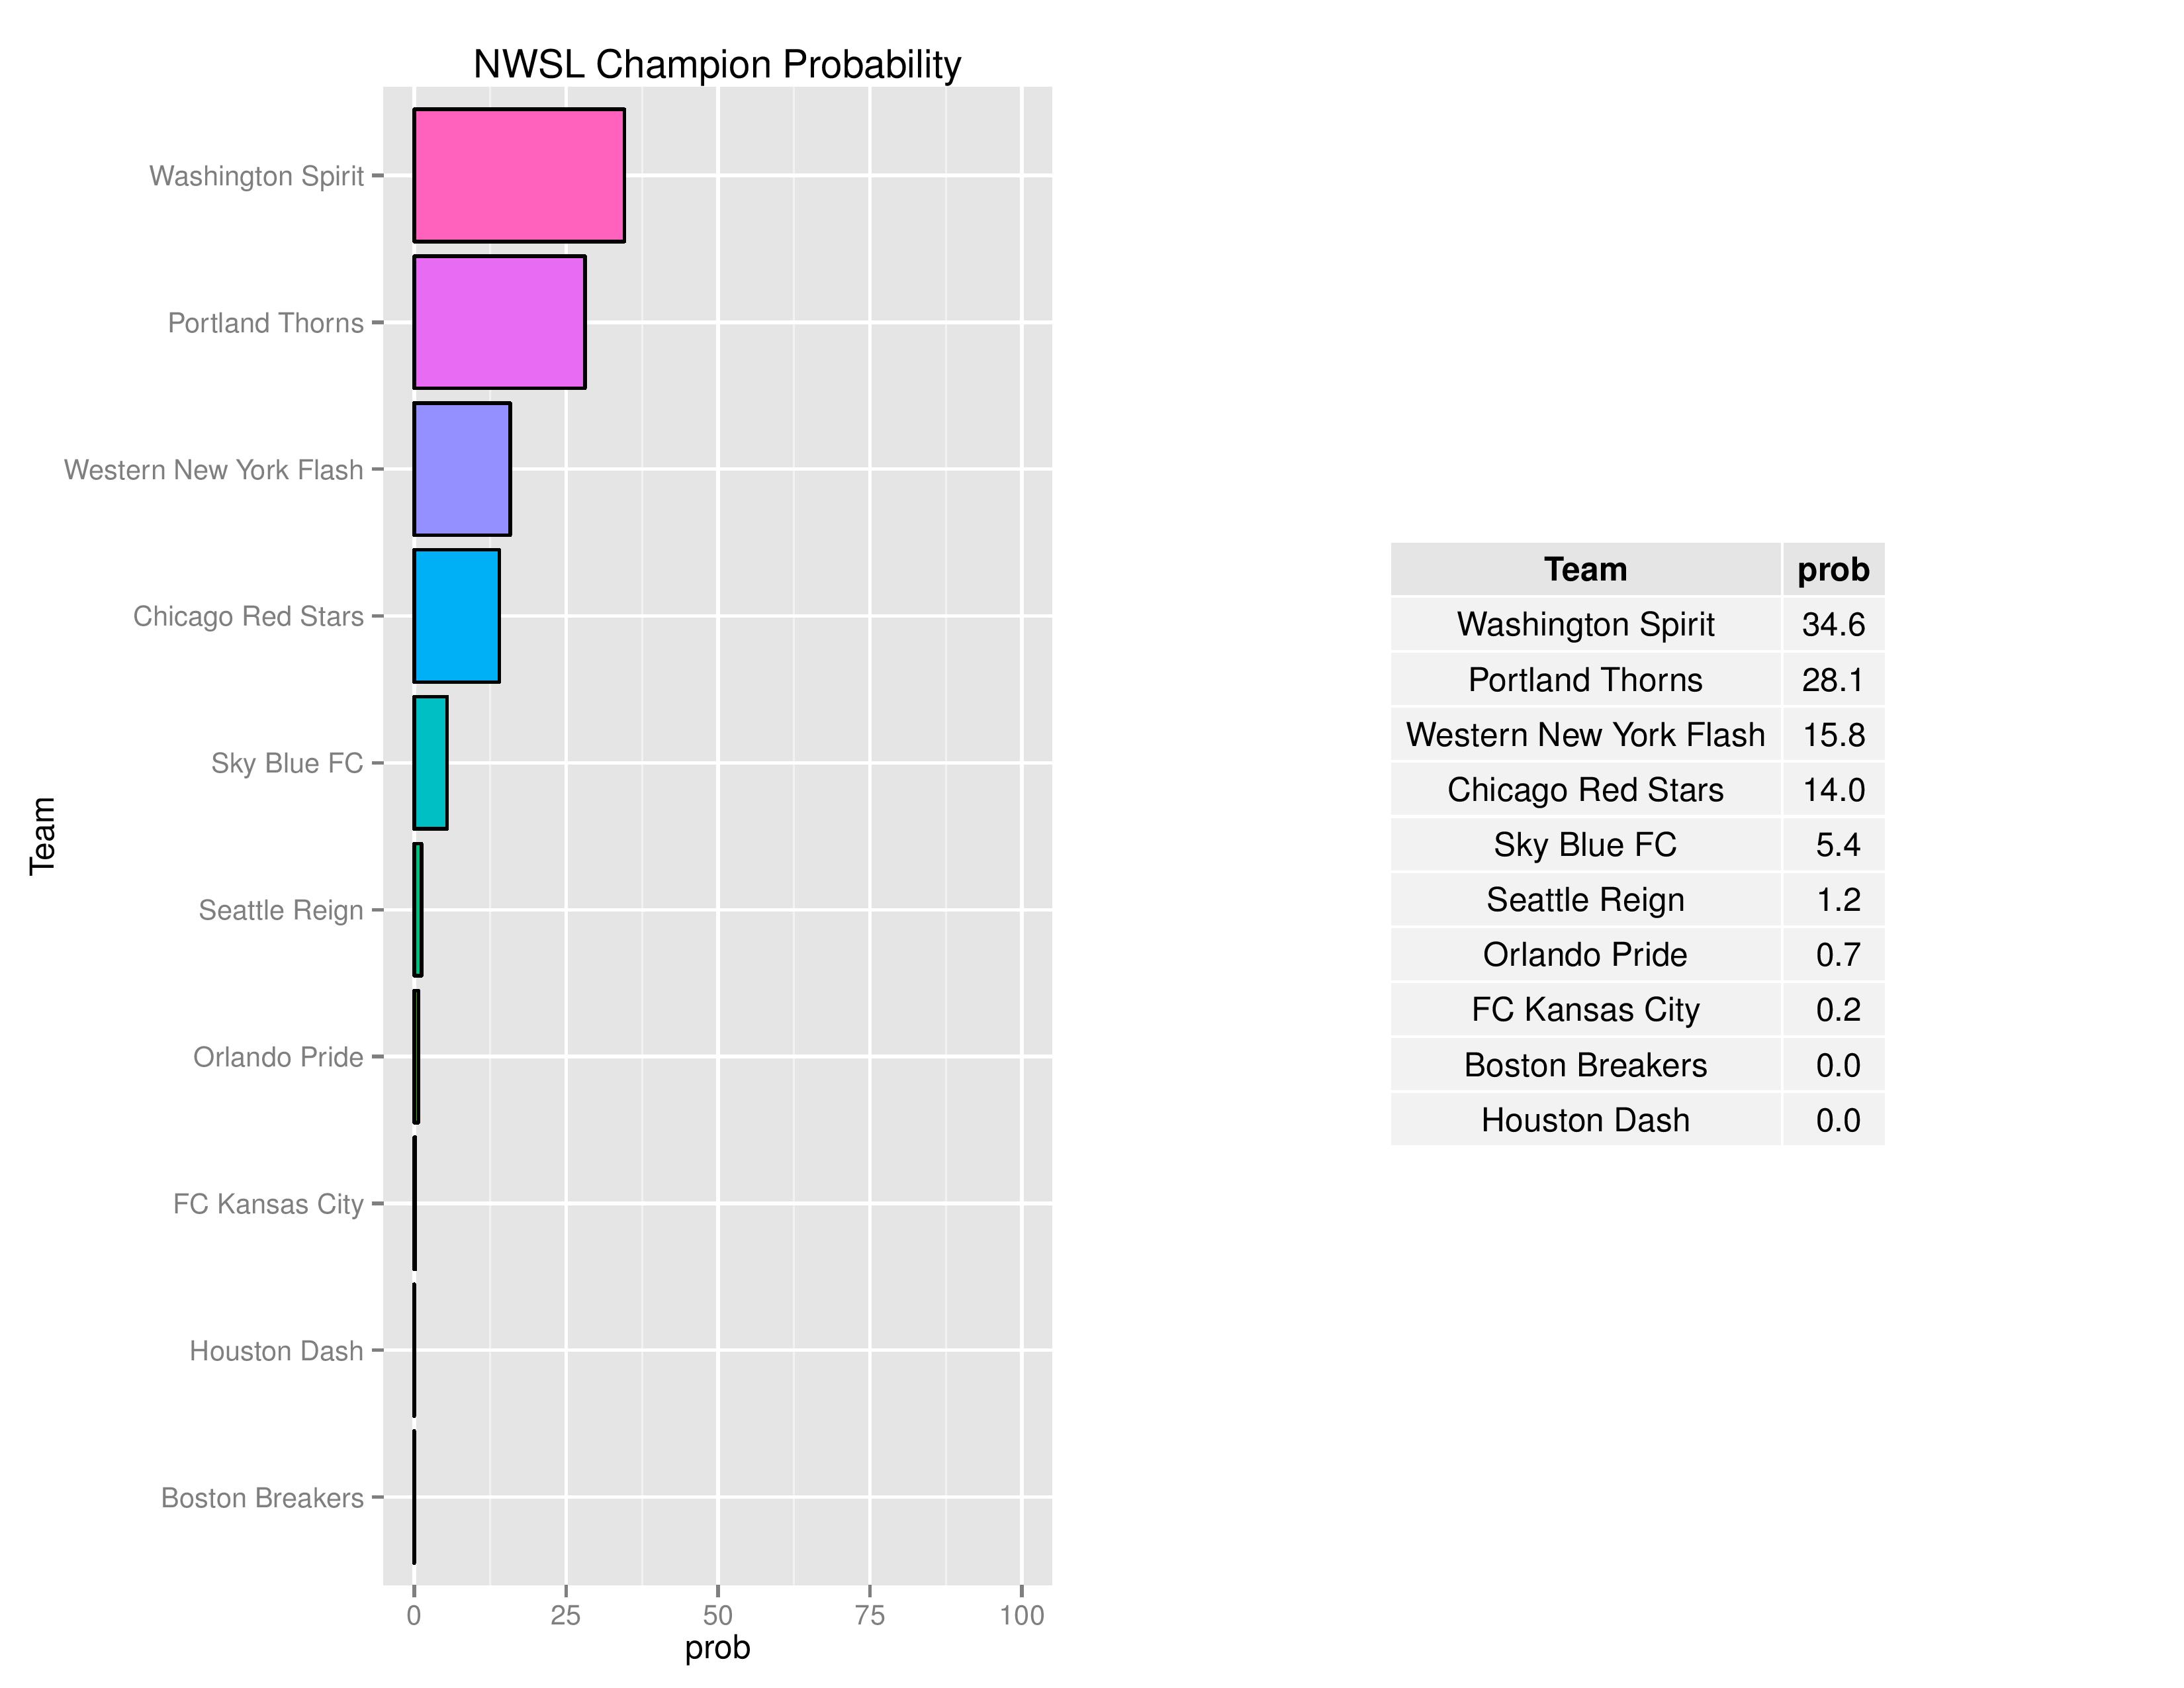
The following charts show the probabilities for making the playoffs, winning the Supporters’ Shield, winning the MLS Cup, winning the USOC Cup, and qualification for CONCACAF Champions League.
The Union went down to 92.2% from 96.6% last week in their probability of making the playoffs. Toronto has effectively clinched their playoff spot (or at least their chances of missing are likely less than 1/15000).
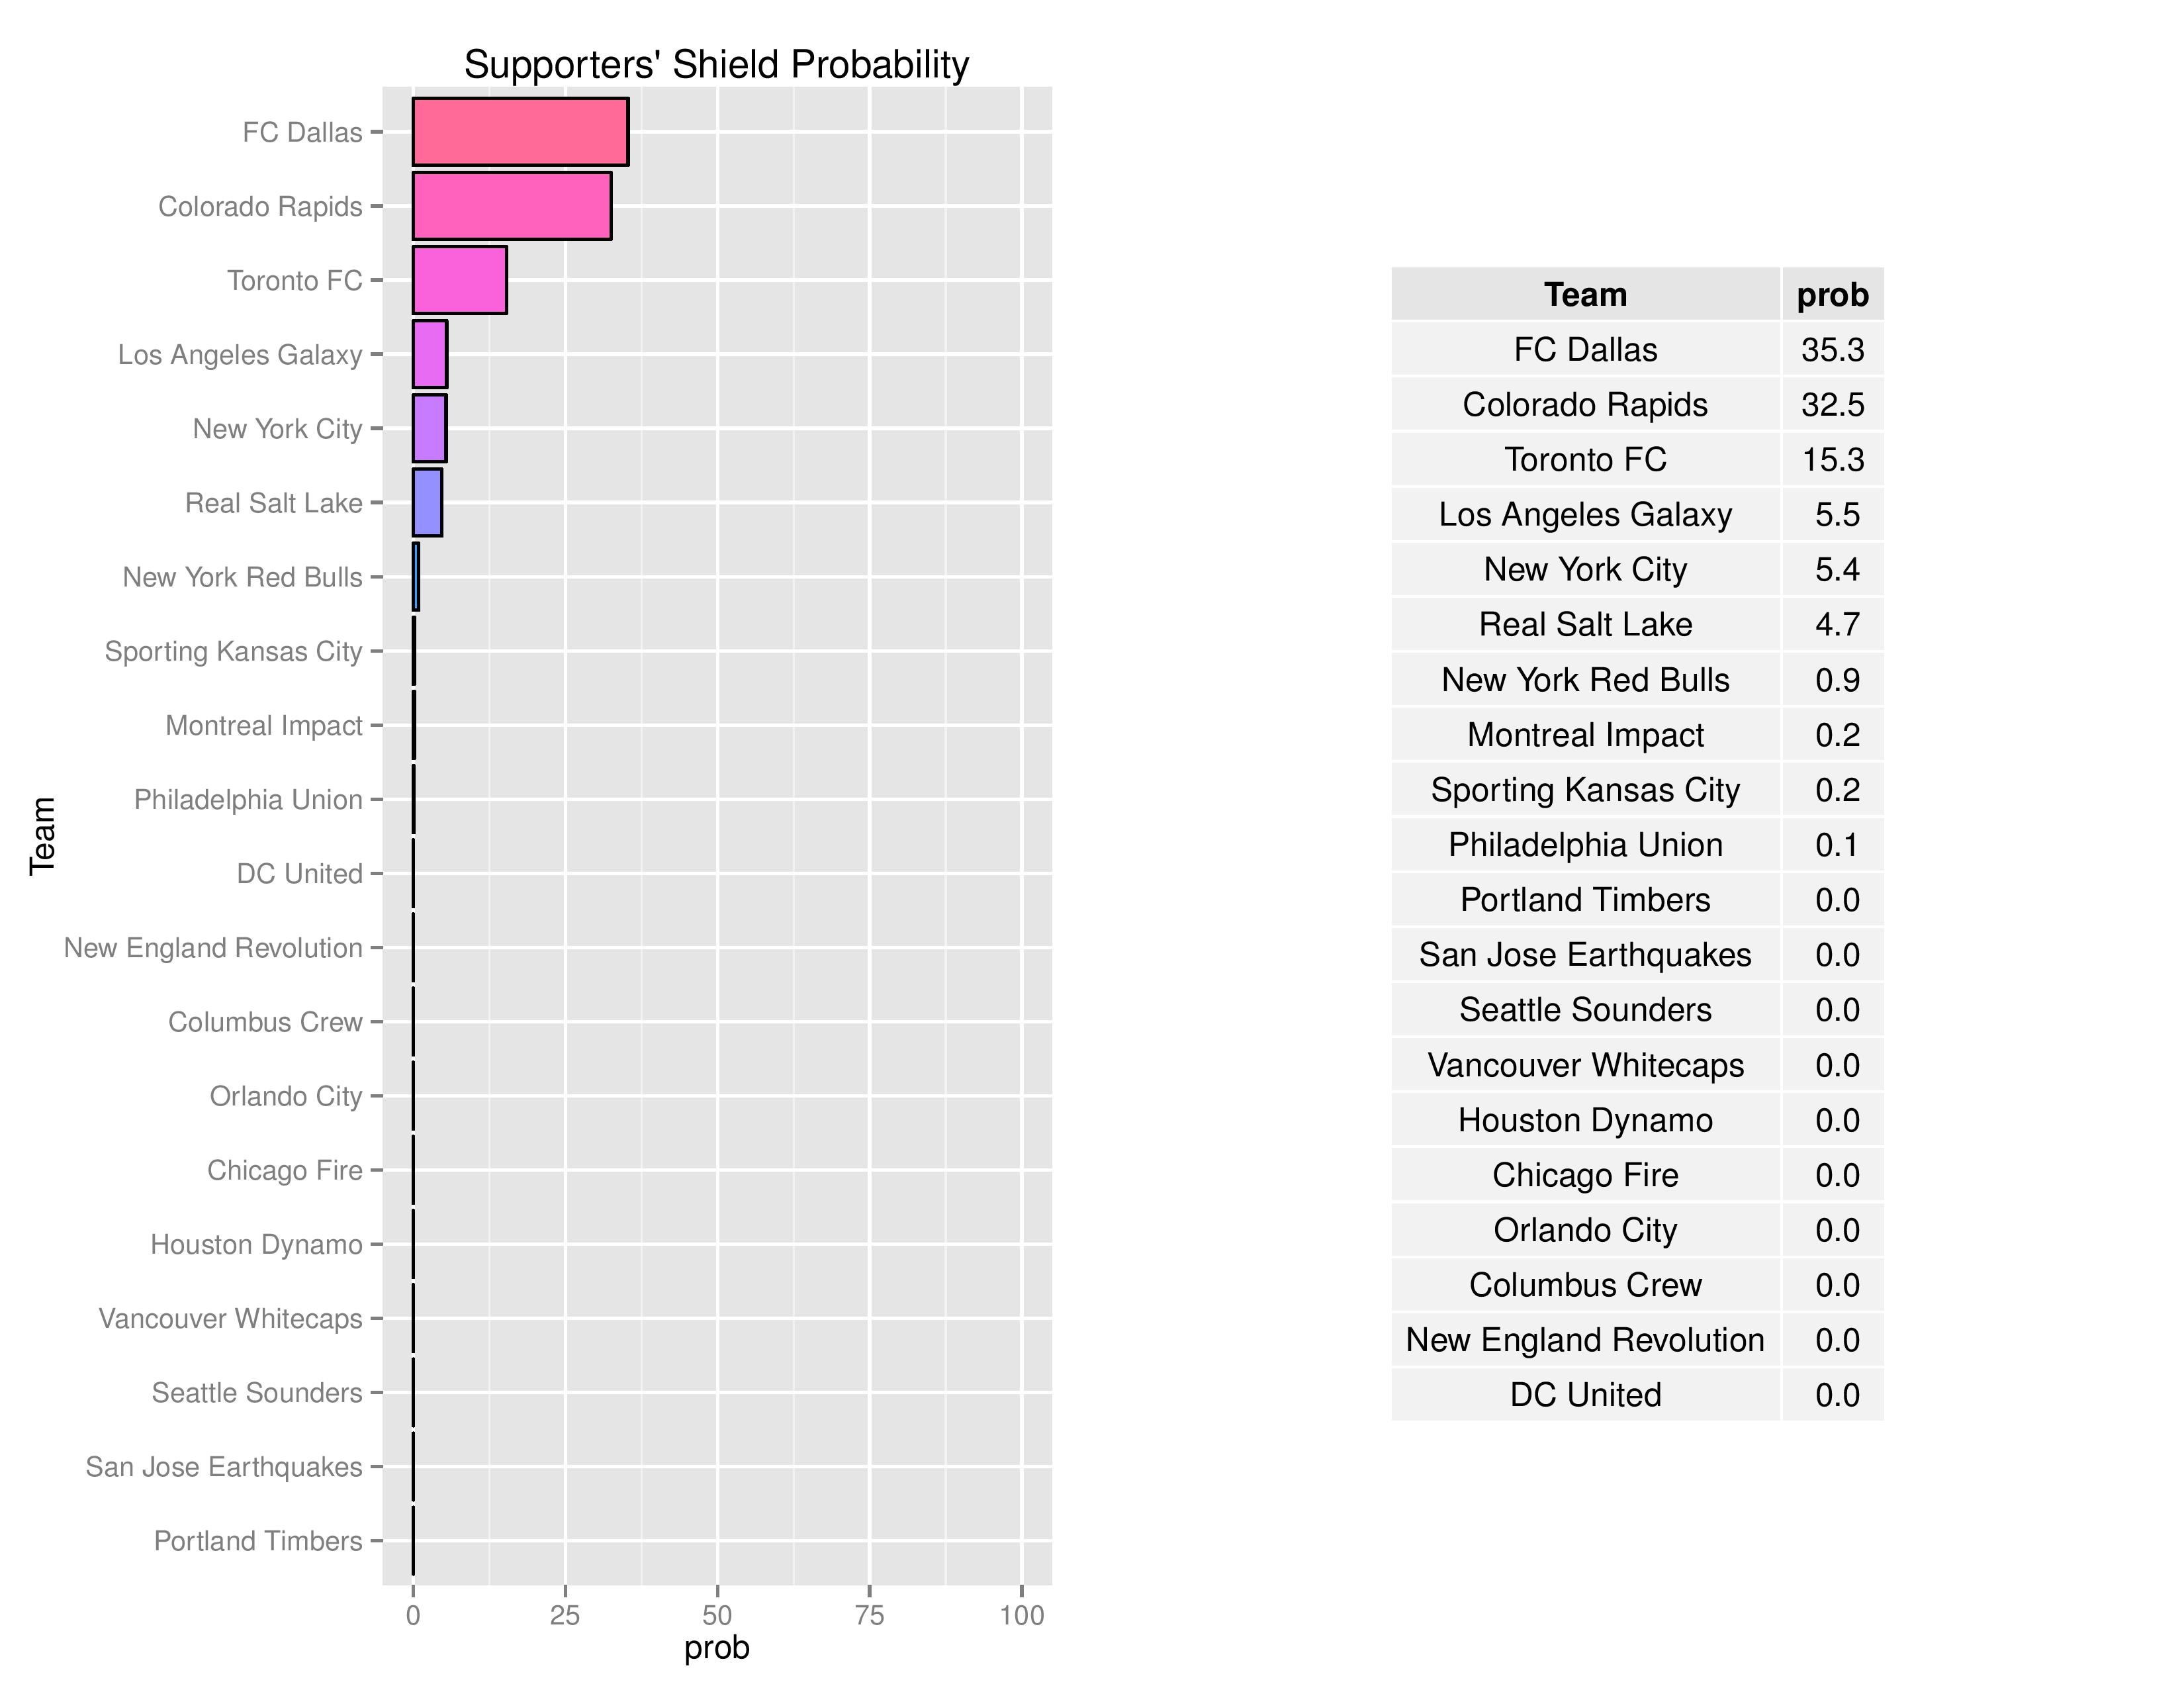
The odds of Philadelphia claiming the Supporters’ Shield declined from a meager 0.6% to an even more paltry 0.1%.
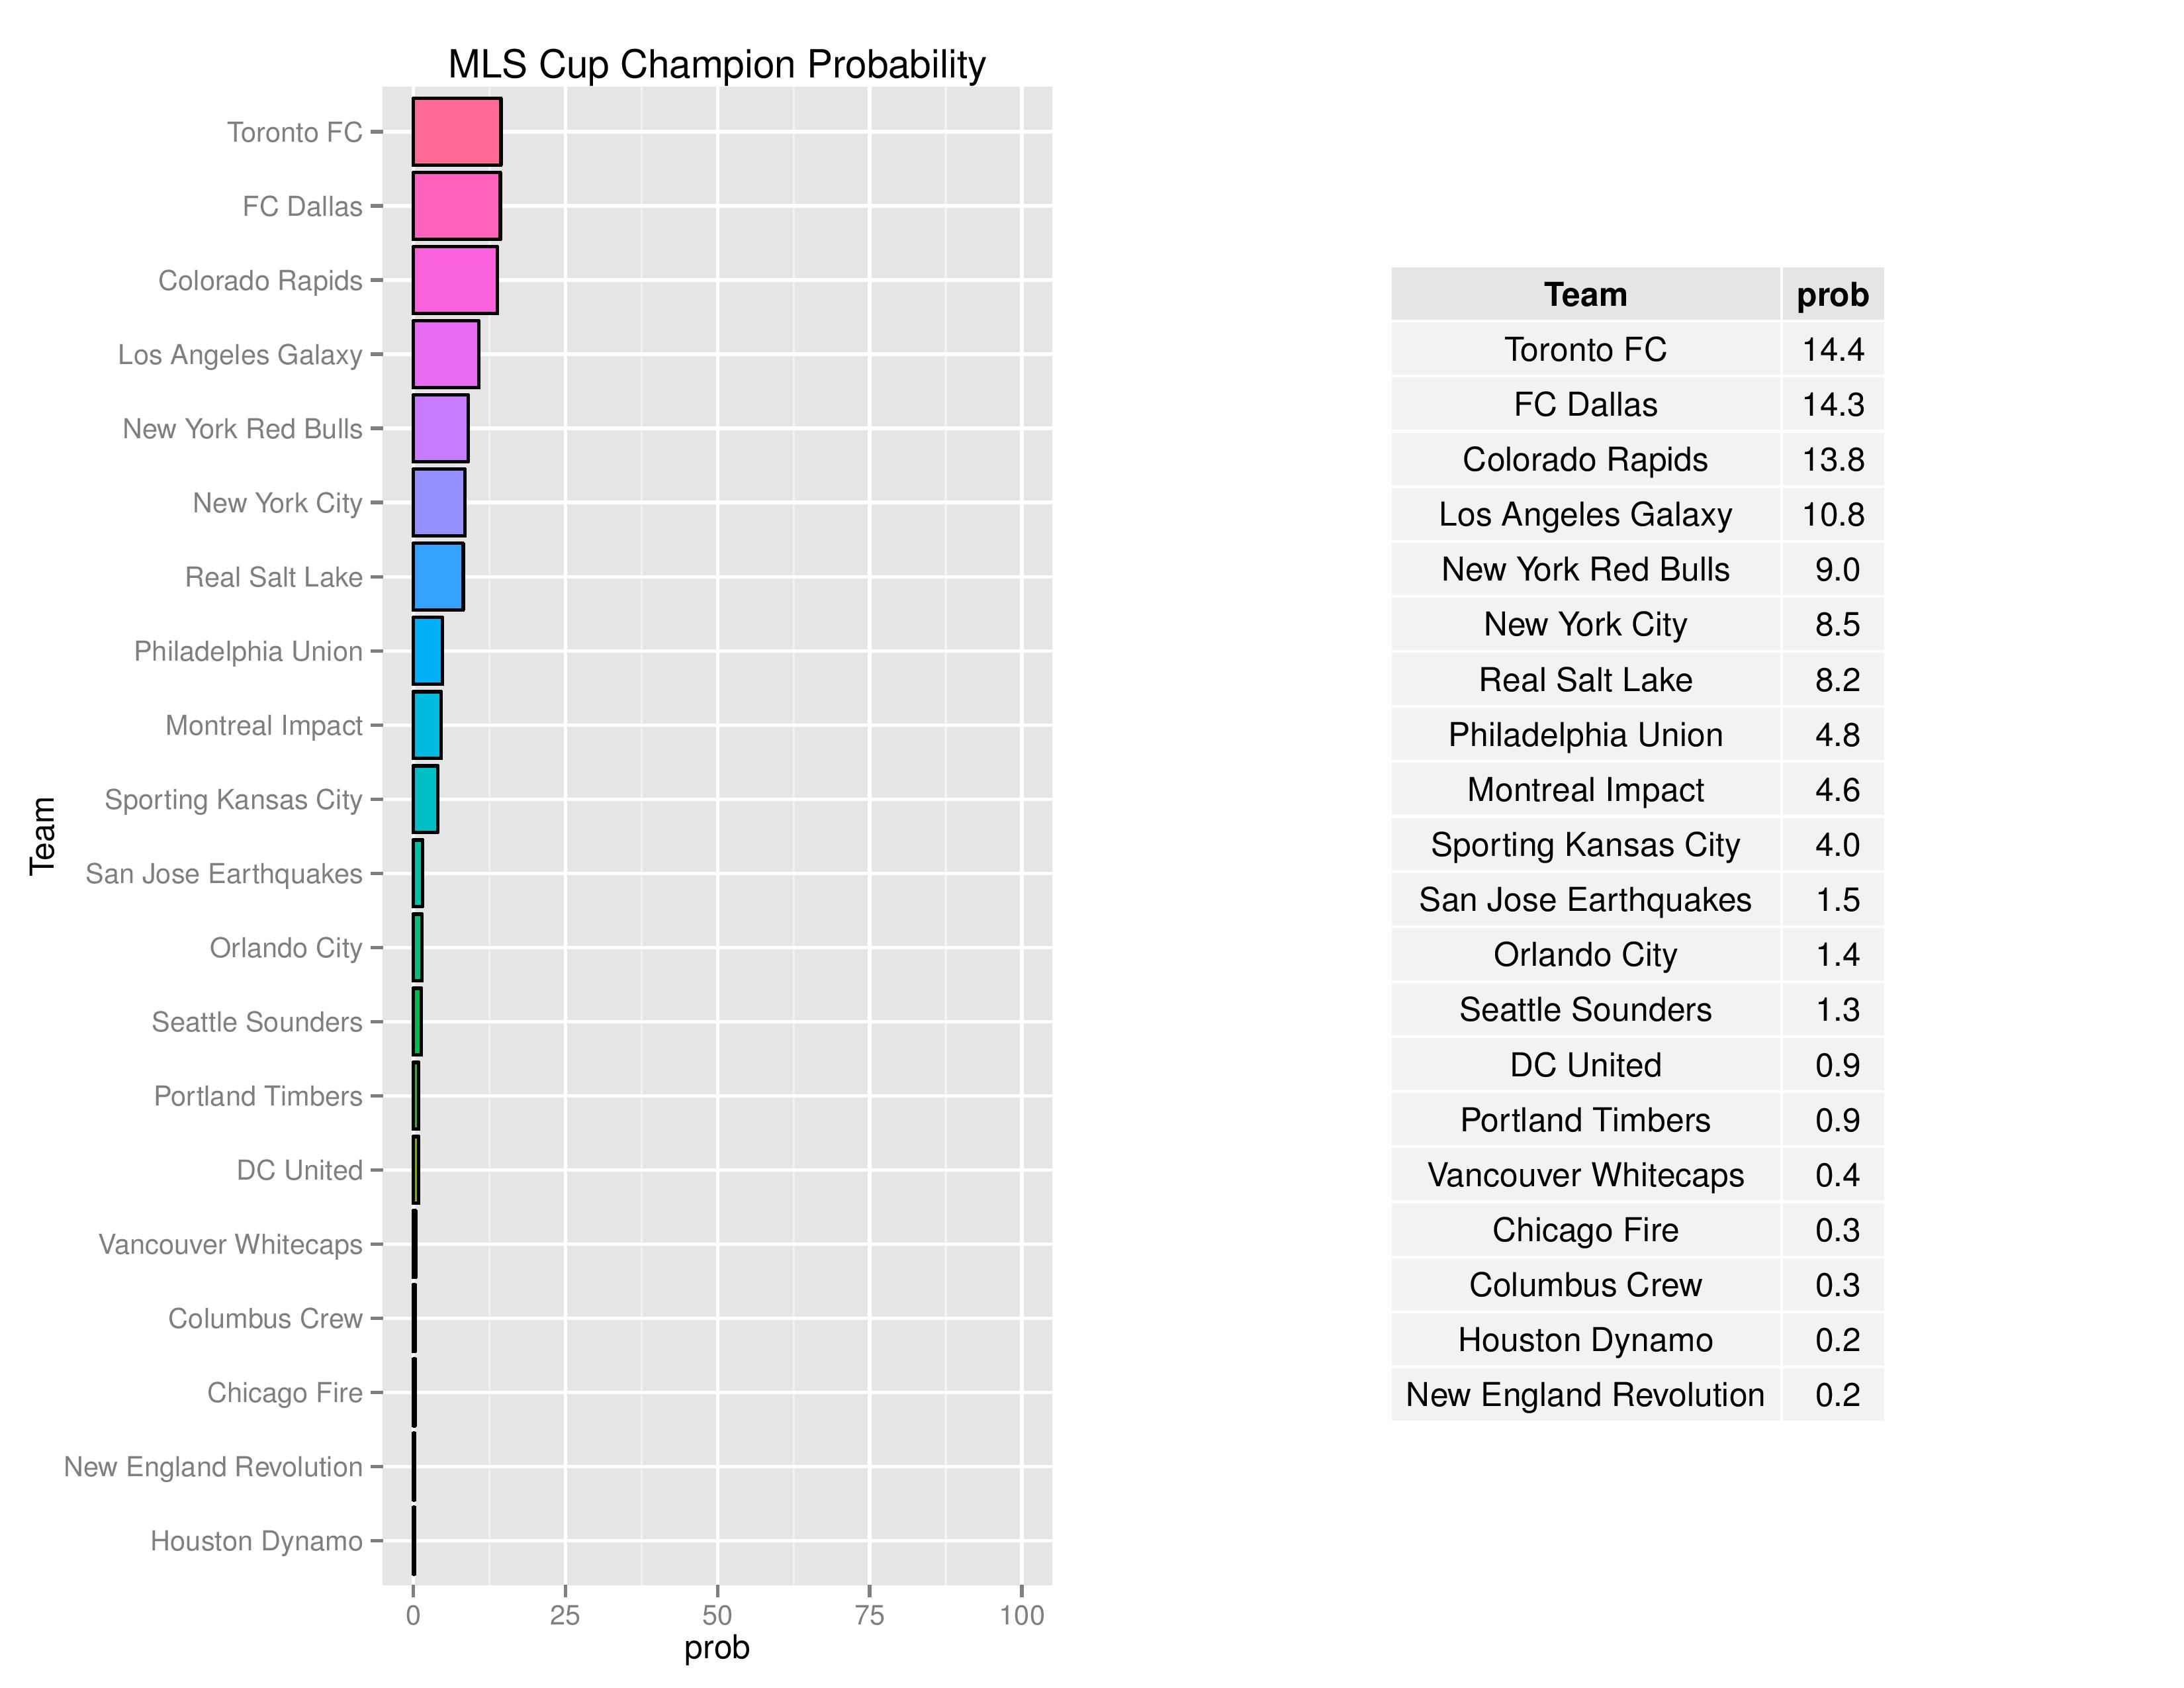
The Union decreased from 6.2% last week to 4.8% in their odds of capturing MLS Cup. Toronto is atop the MLS Cup projections at 14.4%, one tenth of a percentage point above FC Dallas, who fell 1-0 to RSL over the weekend.
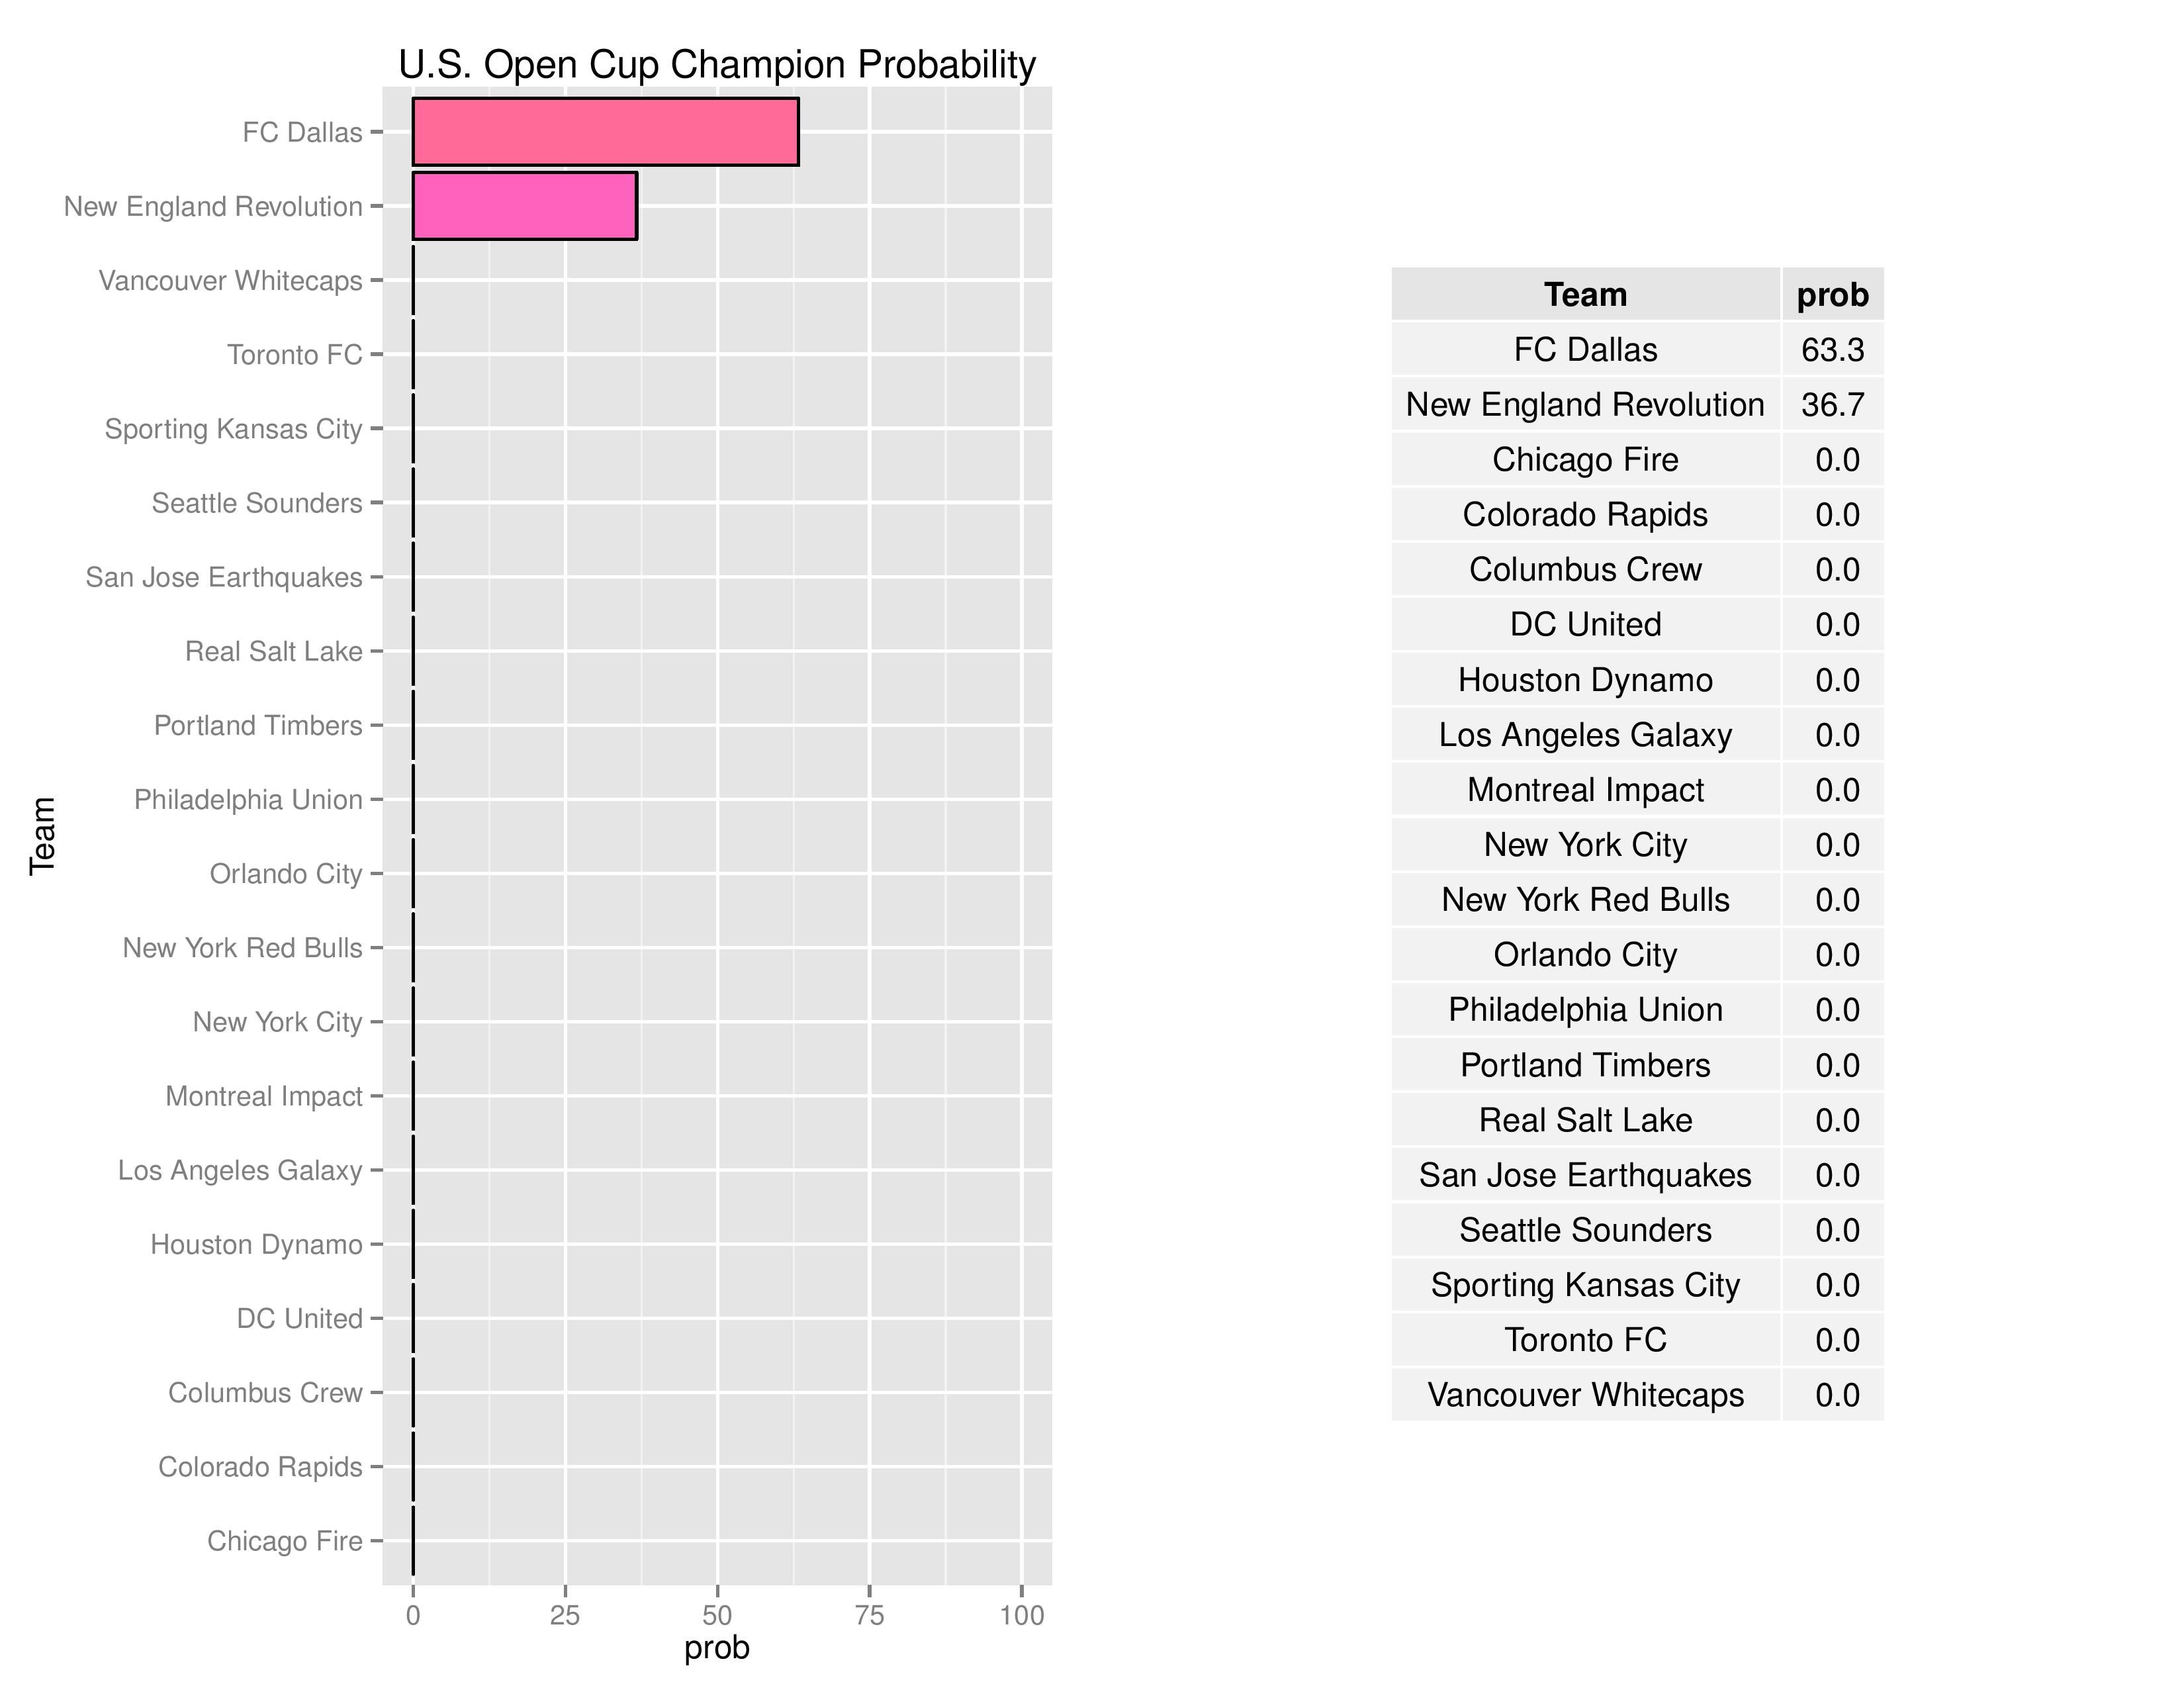
Philadelphia is eliminated from the US Open Cup. It is now down to just Dallas and New England, with the Texas side looking heavy favorites.
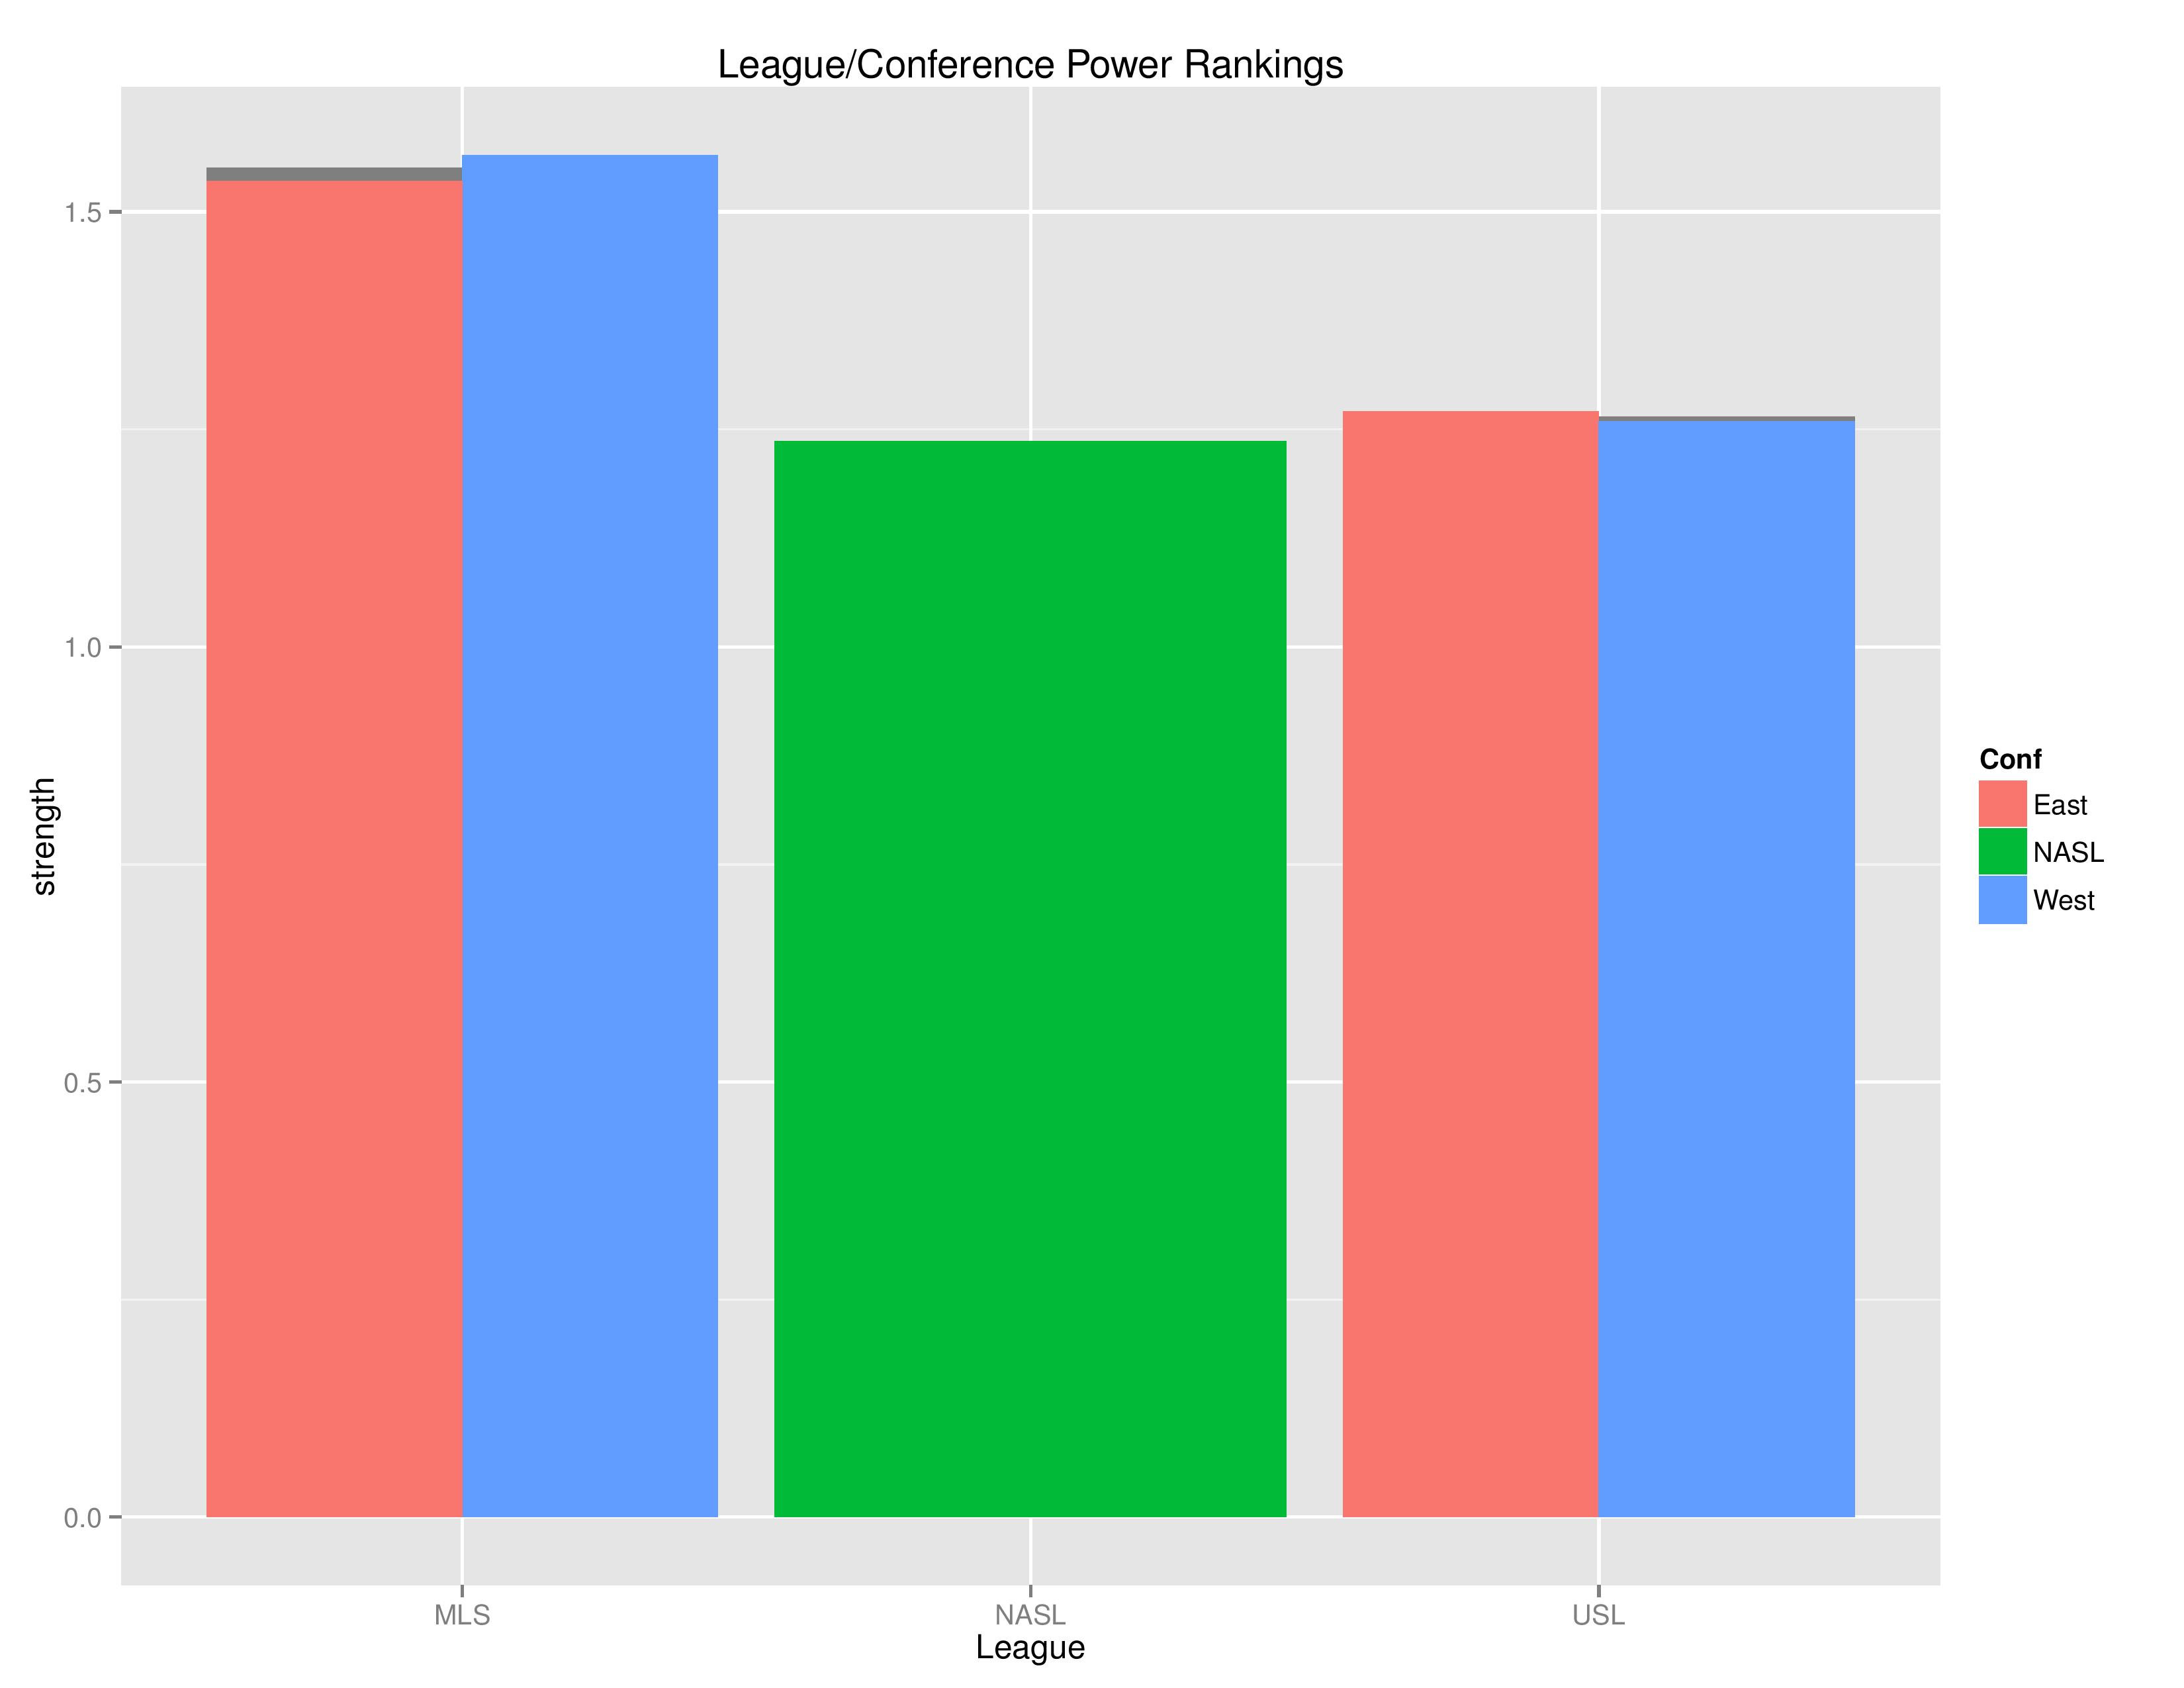
The figure below shows how the model rates each U.S. league and conference compared to one another. This is based on an all-vs-all assessment rather than a top vs. top assessment. MLS is clearly rated as superior to either NASL or USL, though USL has a slight edge over NASL. This also shows the MLS-West outperforming MLS-East, and USL-East slightly outperforming USL-West.
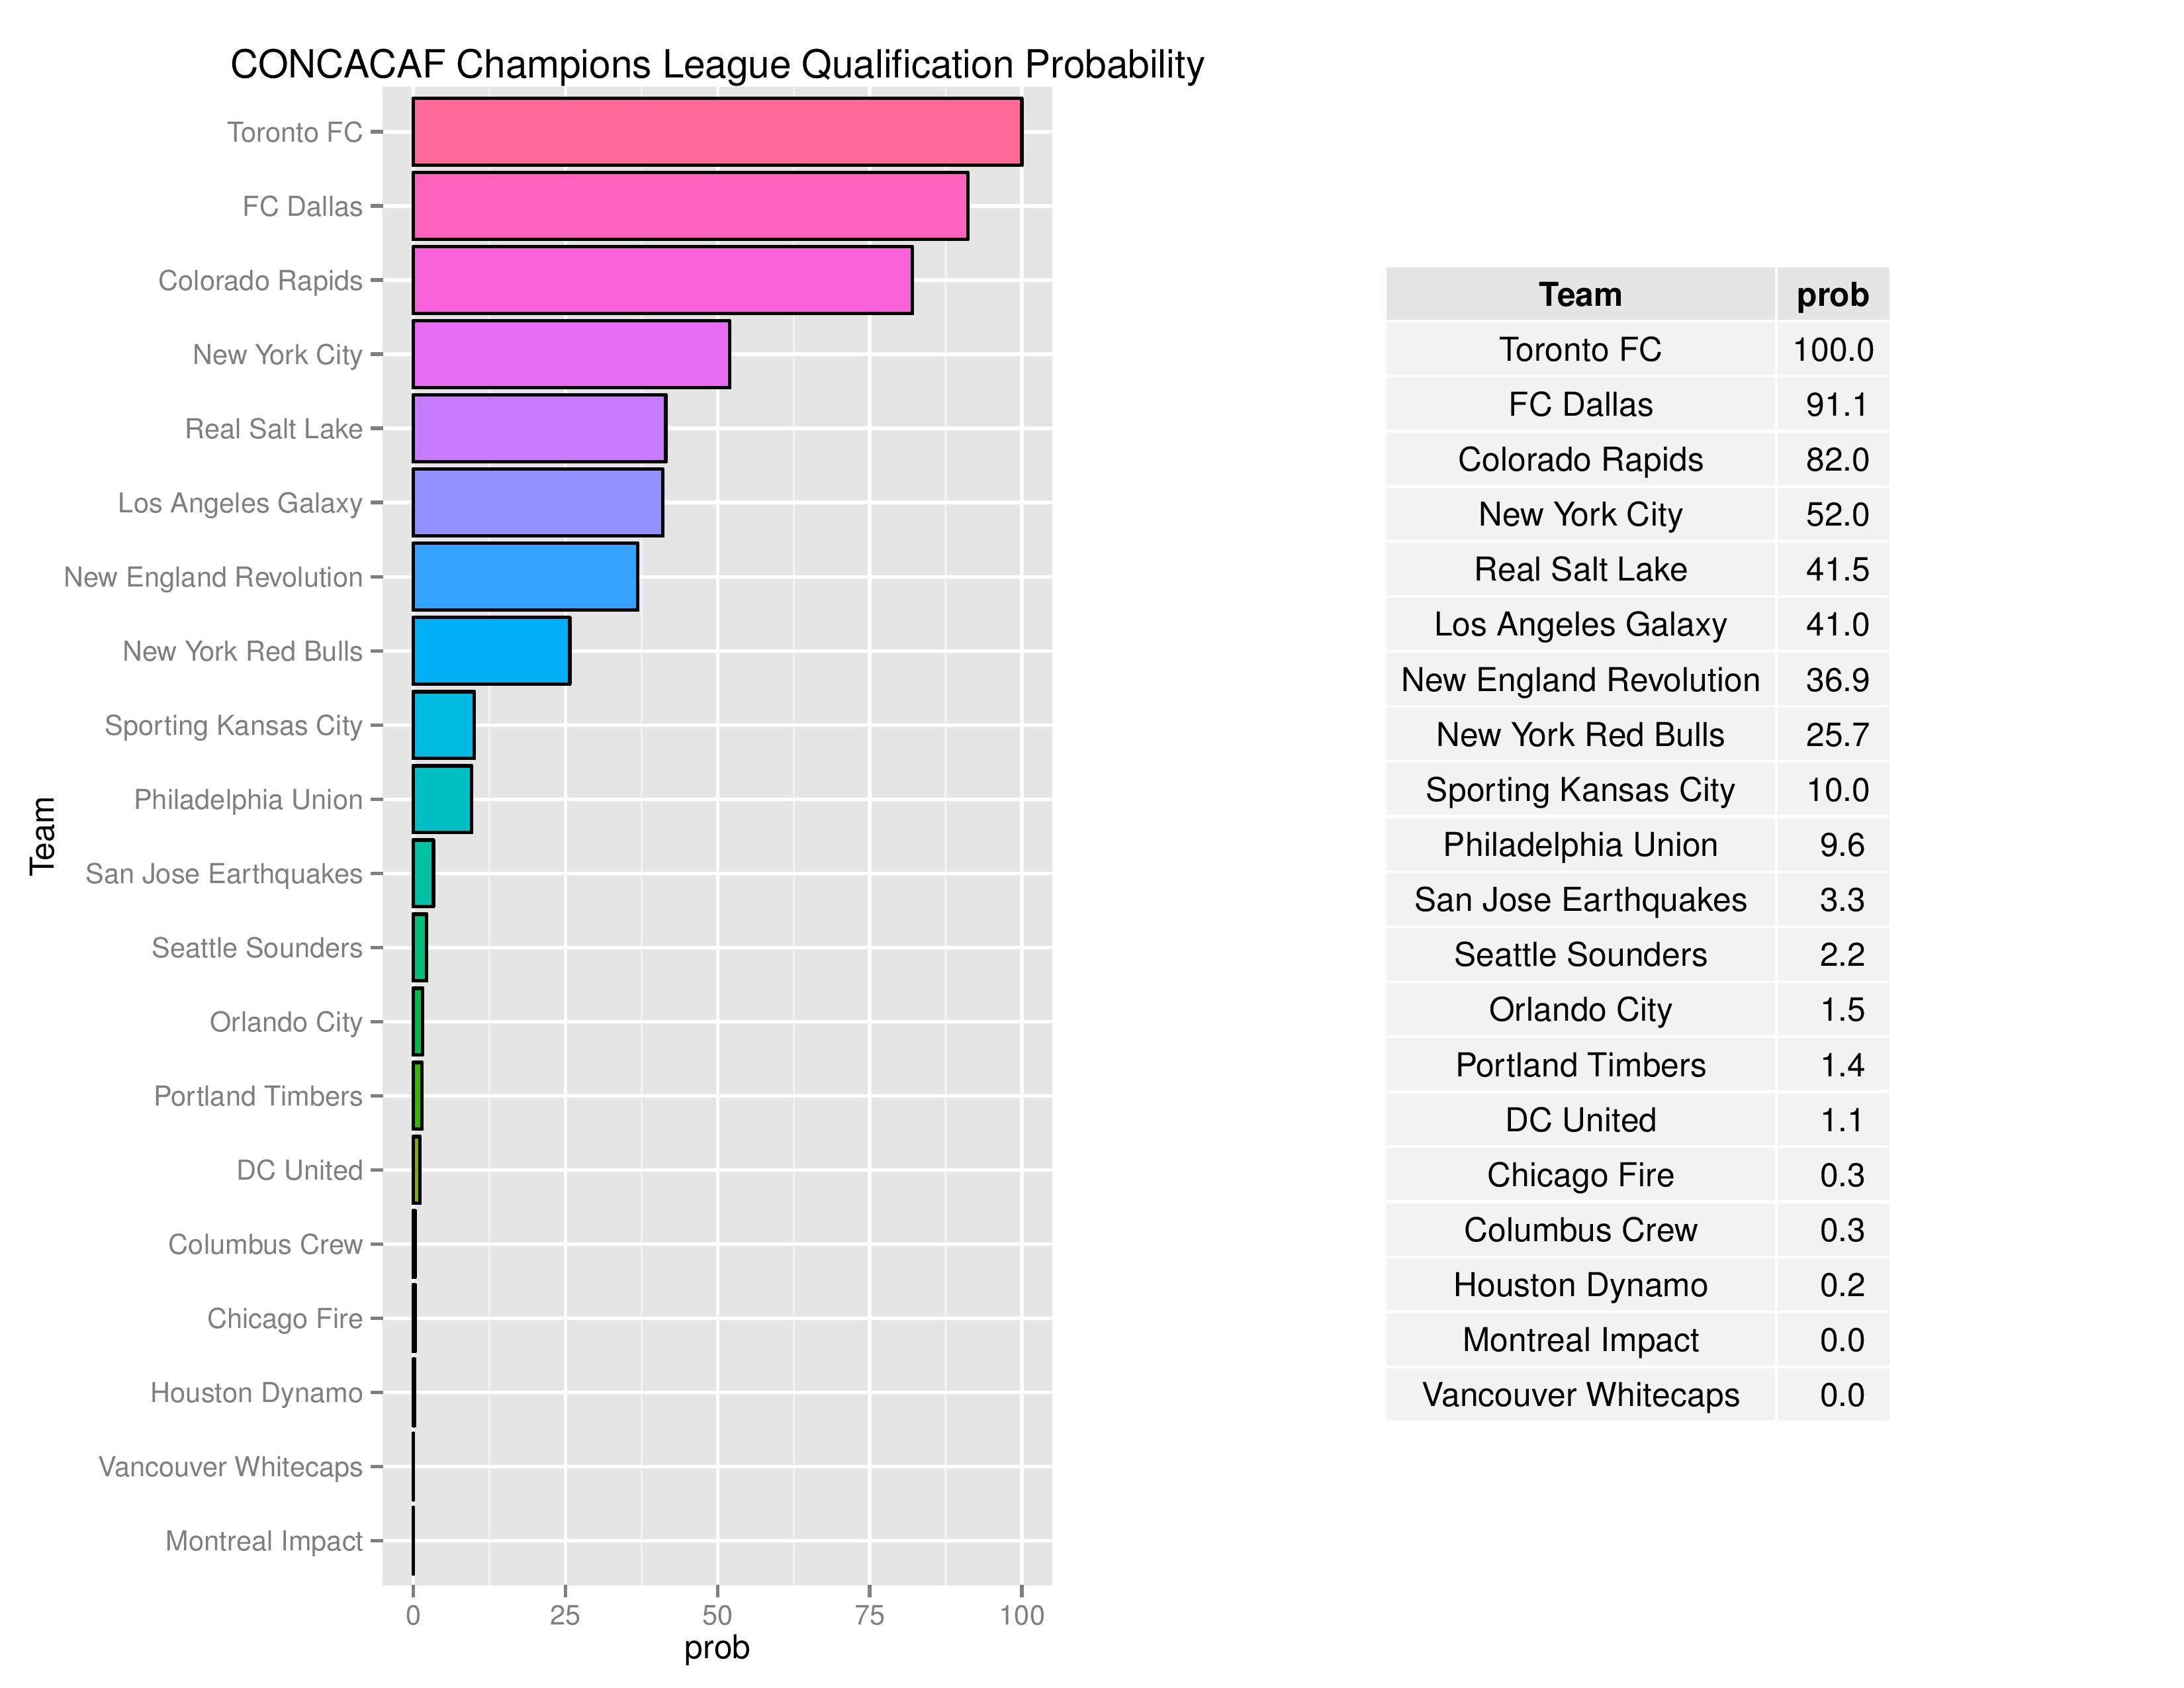
Philadelphia’s probability of qualifying for the CONCACAF Champions League reverted to its pre-NE match low of 9.6%, down from 19.7%. Toronto’s lead on the regular season conference title makes it more probable that a western conference team will get the extra slot (since Canadian teams cannot occupy a US CCL slot).
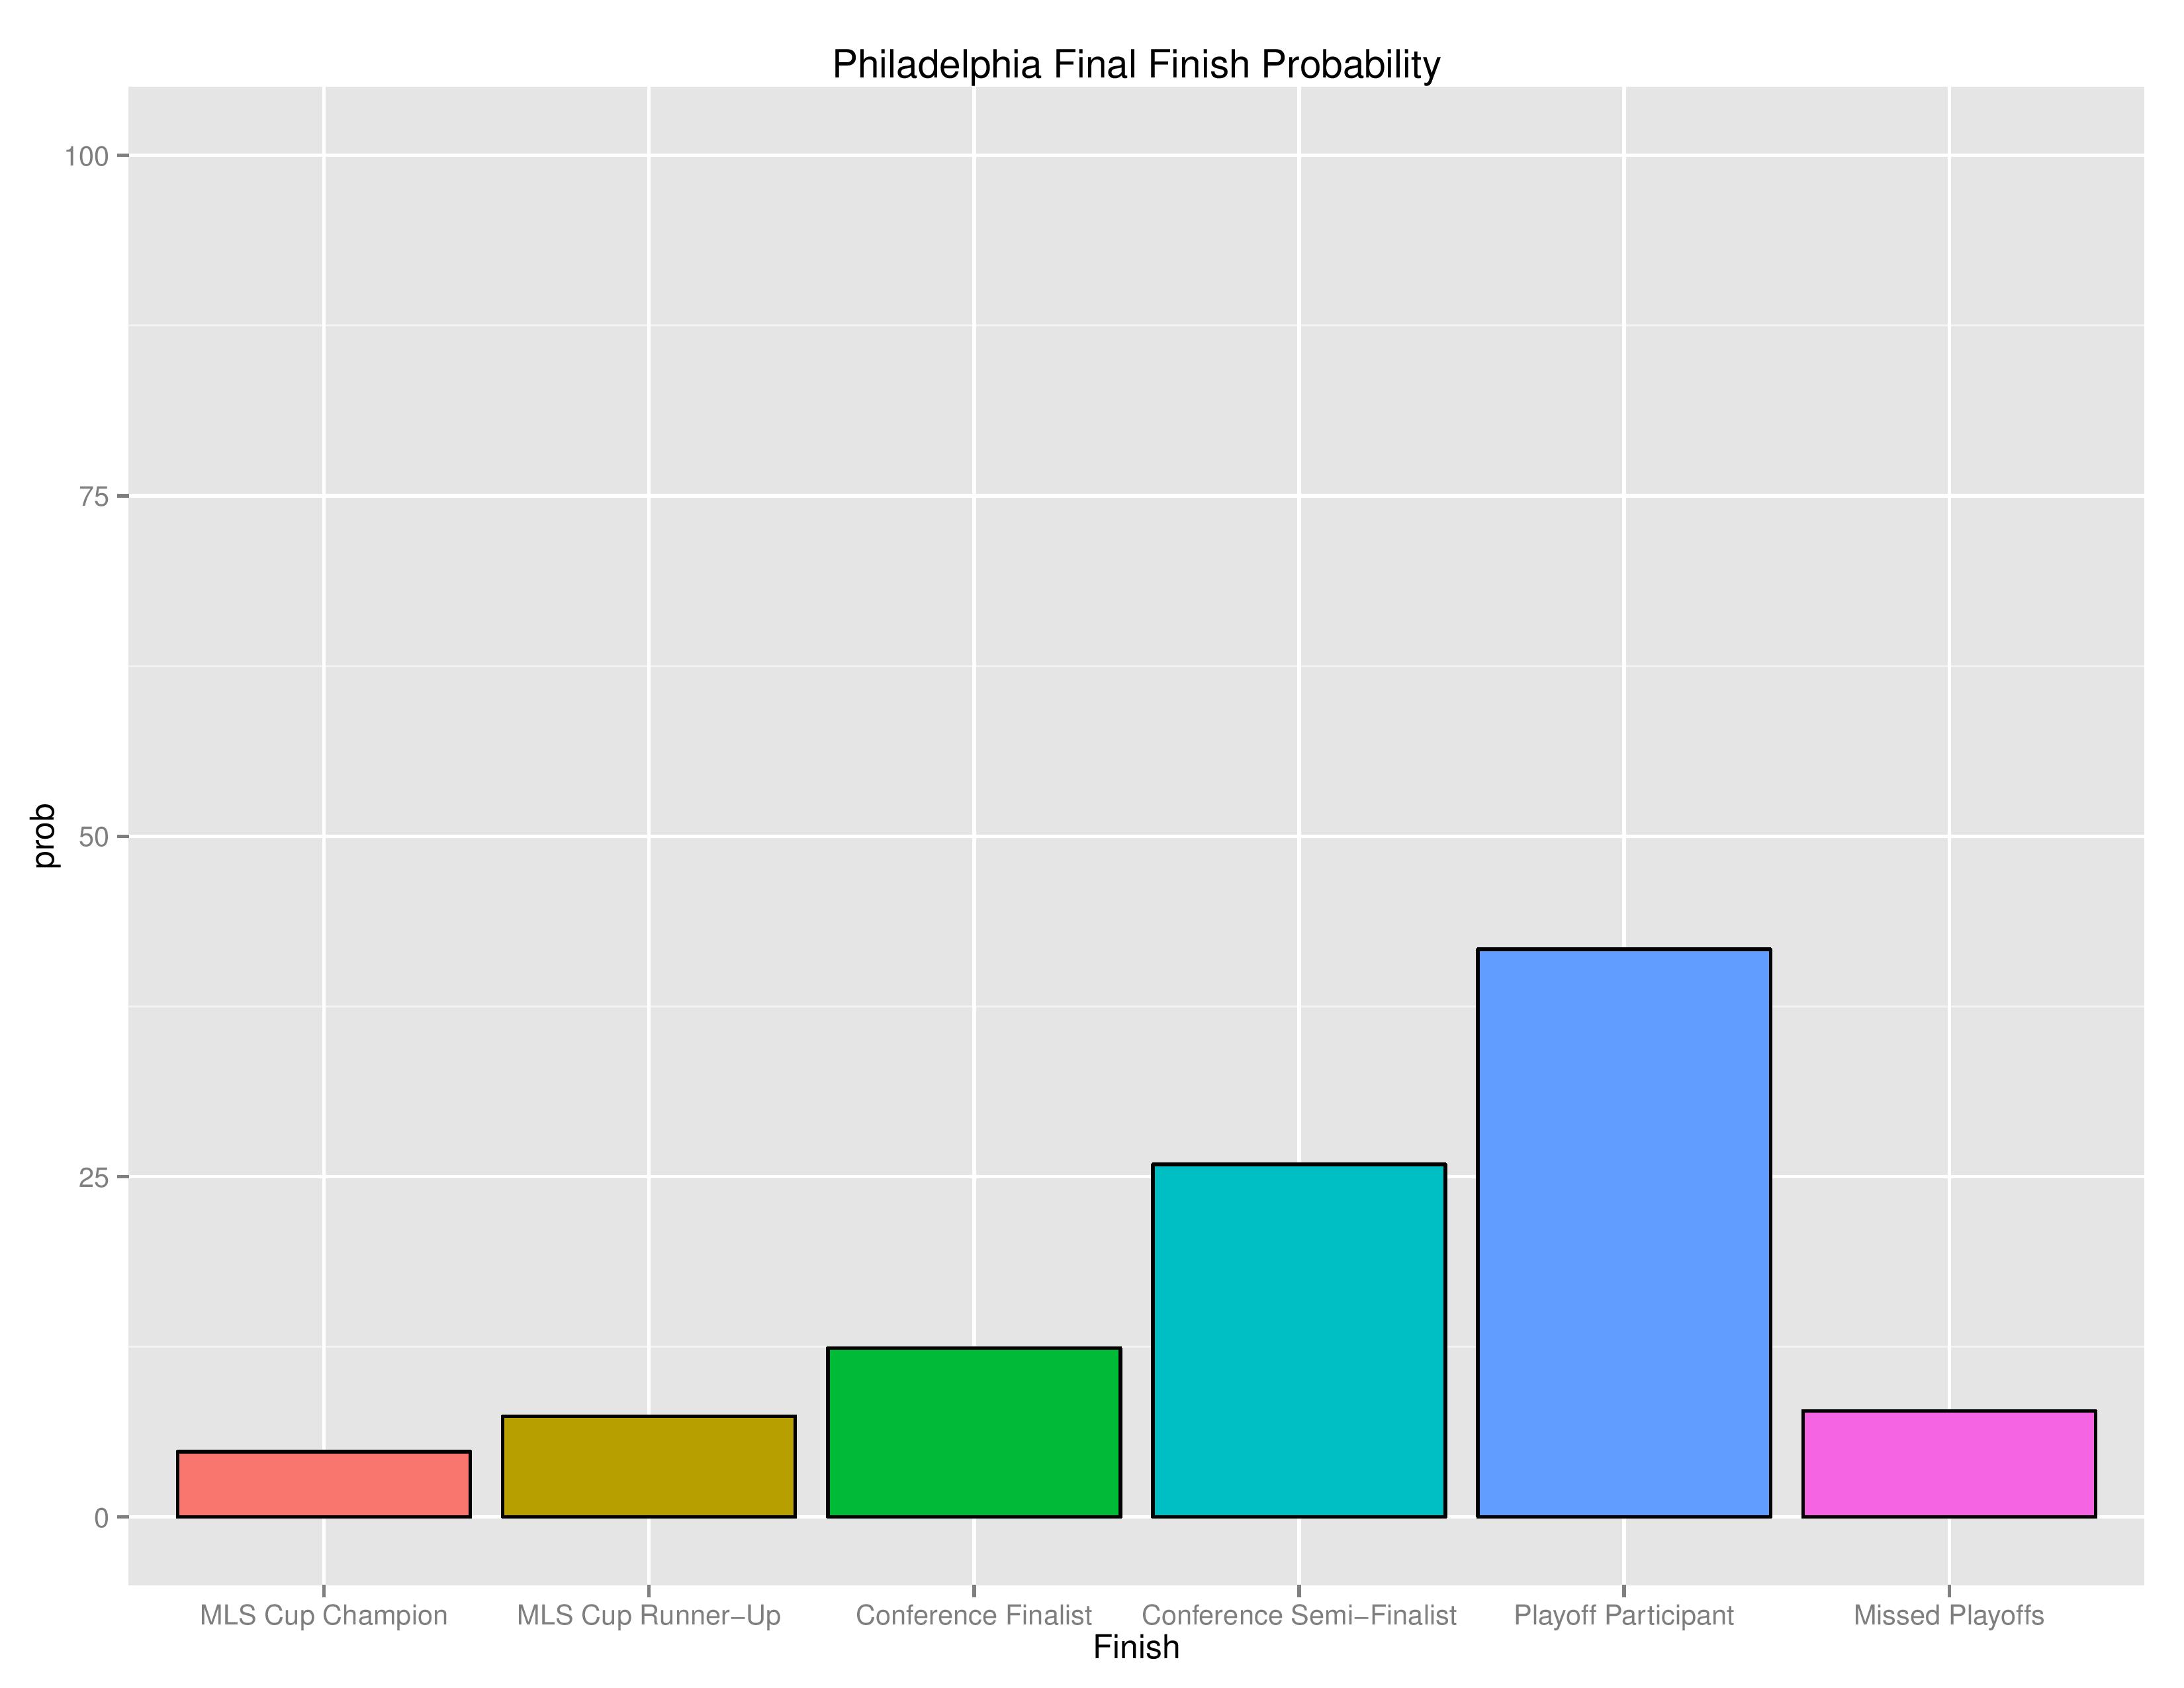
Philadelphia finishing
The following shows the probability of various playoff categories and Philadelphia’s probability of each of them.
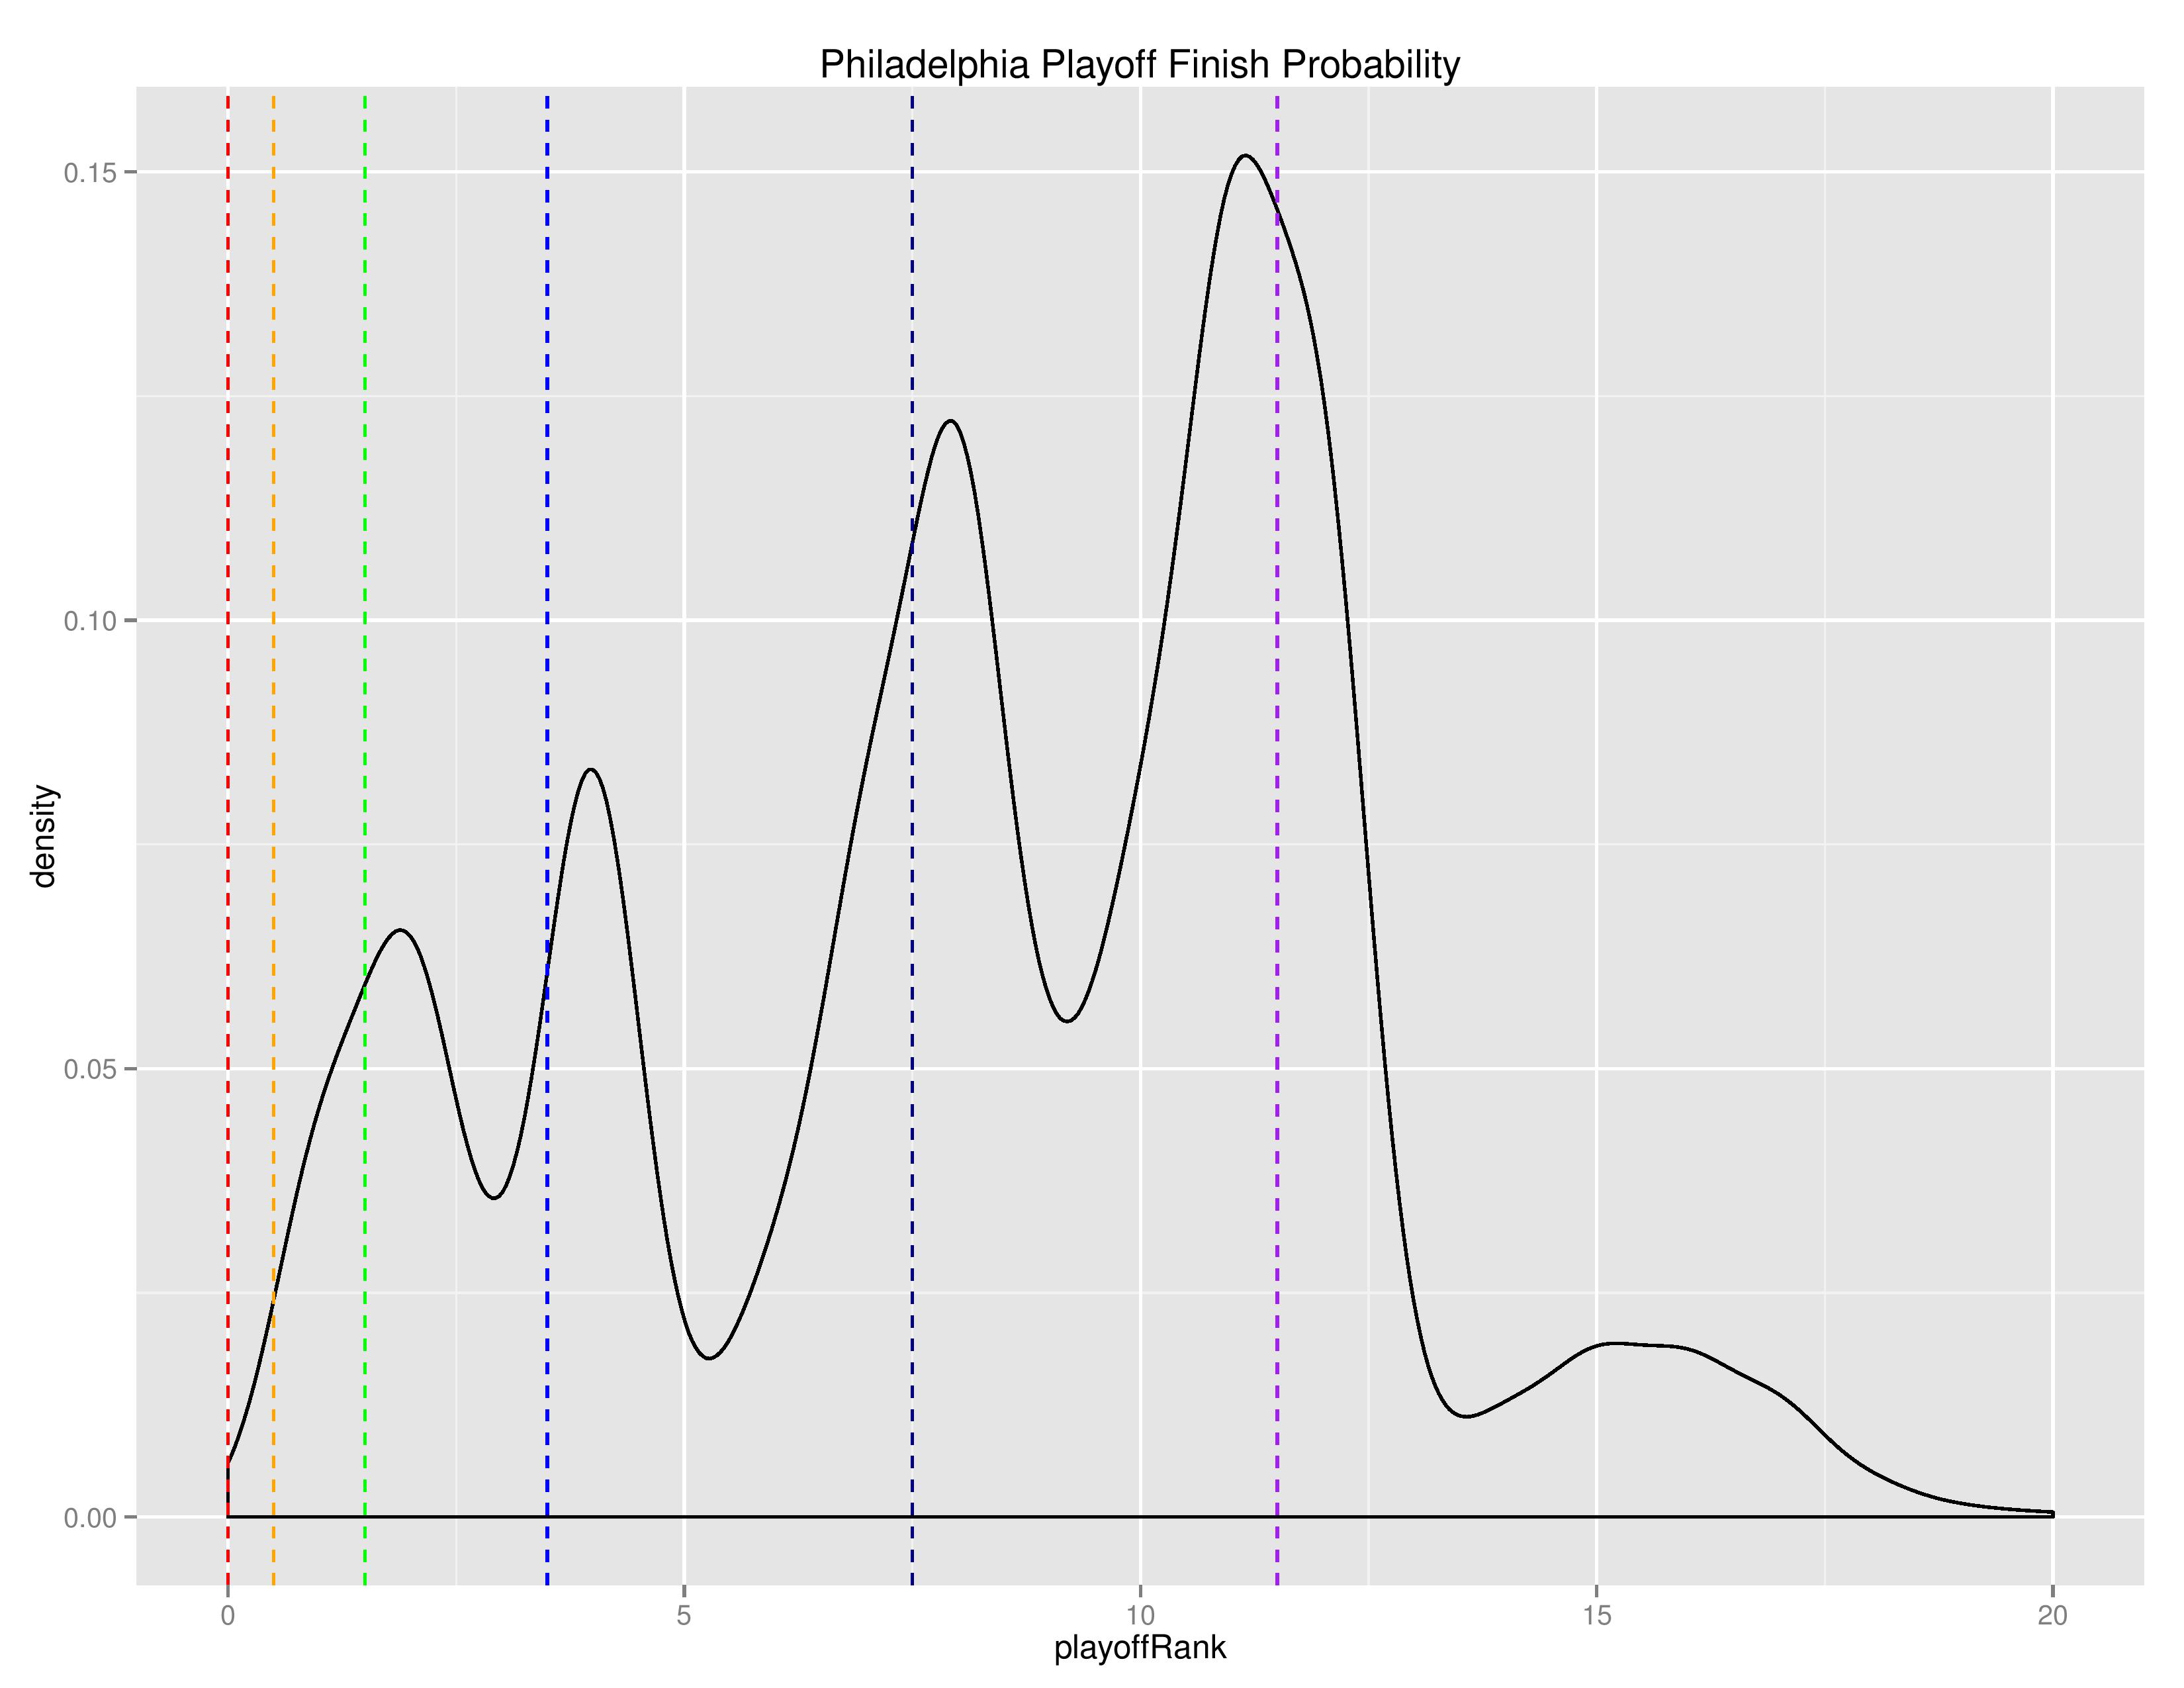
The following is a “density” chart showing the relative probability of Philadelphia finishing at the different after-playoffs rankings from 1 to 20.
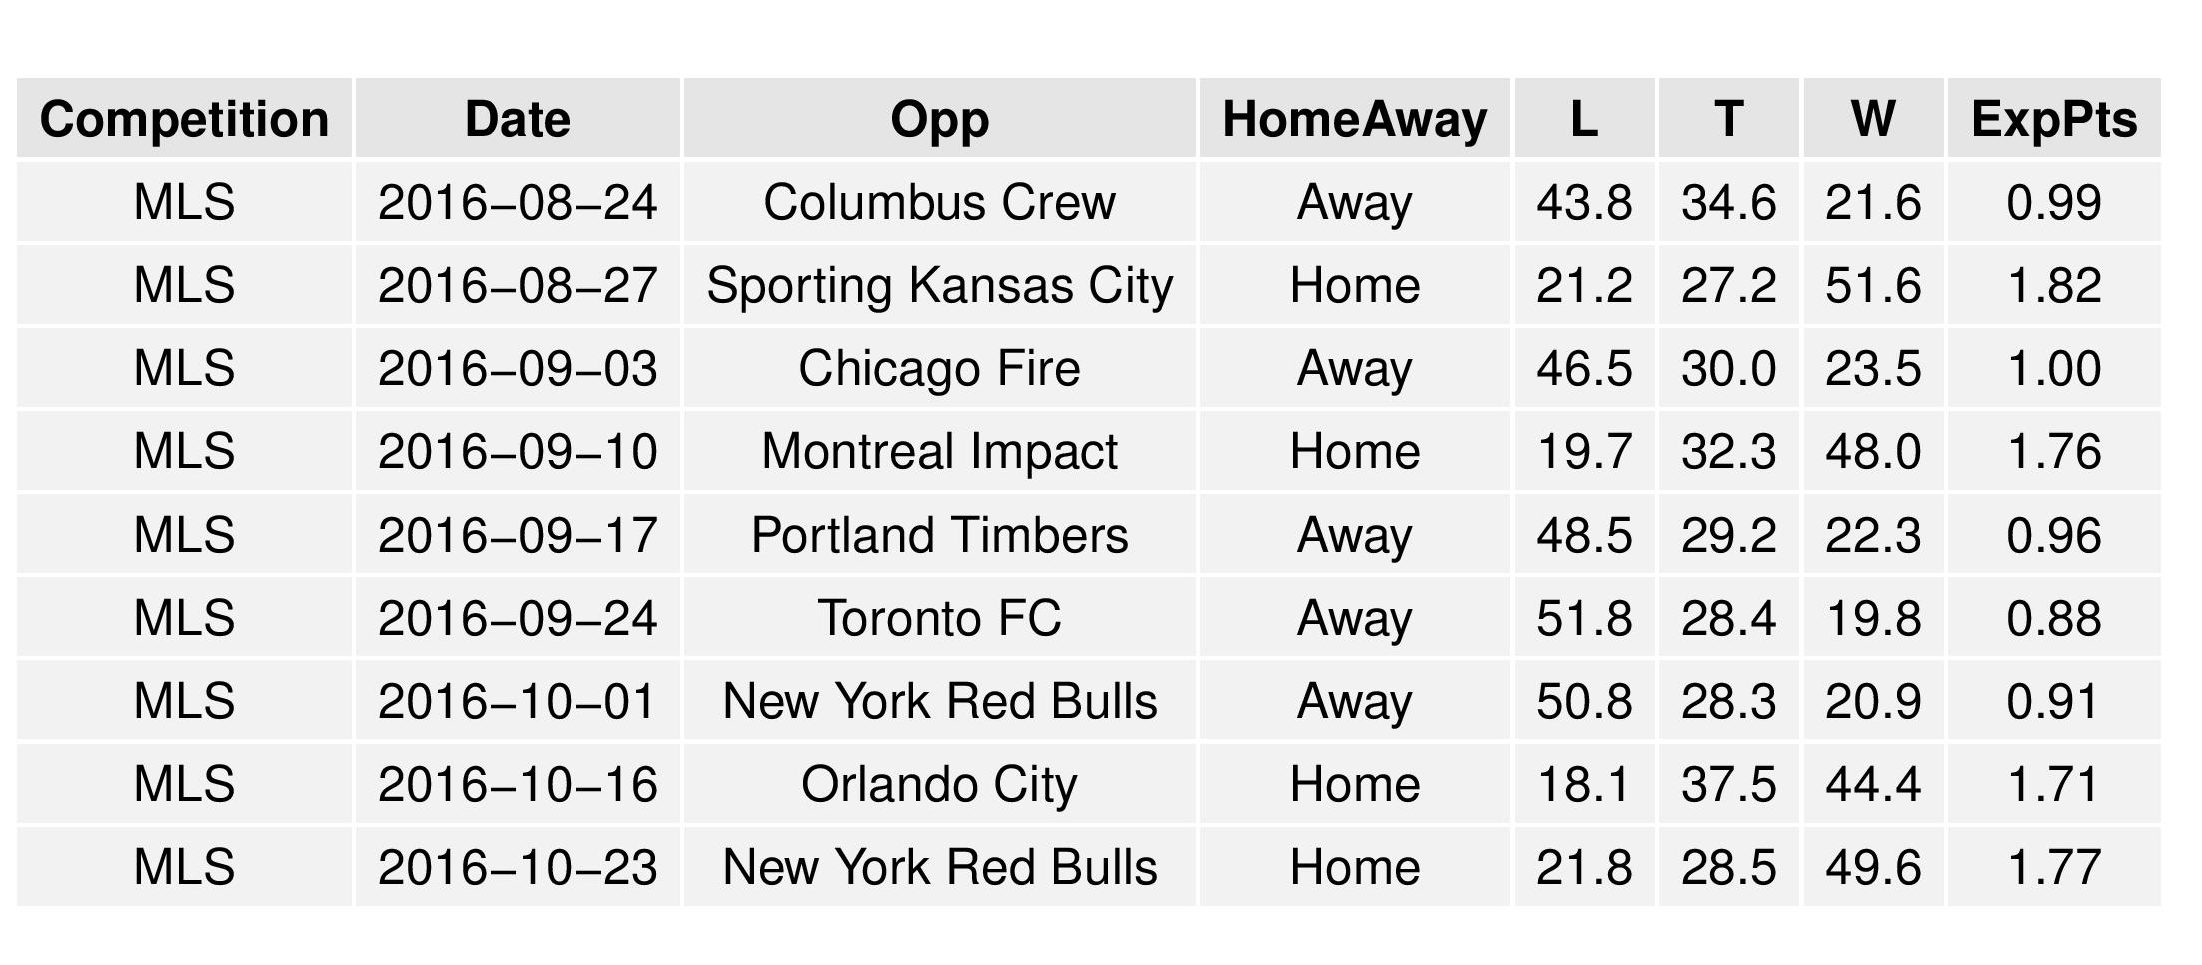
The following is the list of Philadelphia’s remaining scheduled matches accompanied by result probabilities as predicted by SEBA.
The charts below show the average results of all the simulations and the probabilities associated with all of the above. The chart is broken up into two parts in order to better fit on your screen.
(Note: CCLAlternate refers to qualifying for CONCACAF Champions League non-traditionally. U.S. teams qualify by winning the MLS Cup, winning the Supporters’ Shield, winning the Conference in the regular season, and by winning the U.S. Open Cup. If a Canadian team wins any of these or a U.S. team wins more than one, the extra slots are filled by top regular season performers.) (Also, “regSeasFinish” refers to finishing the conference in first place AND not winning other CCL slots like MLSCup, Supporters’ Shield, and USOC)
Changes Over Time
This chart shows how Philadelphia’s chances at each of the outcomes has evolved over the course of the season.
This shows the evolution of Philadelphia’s movement within SEBA and other media outlets’ power rankings.
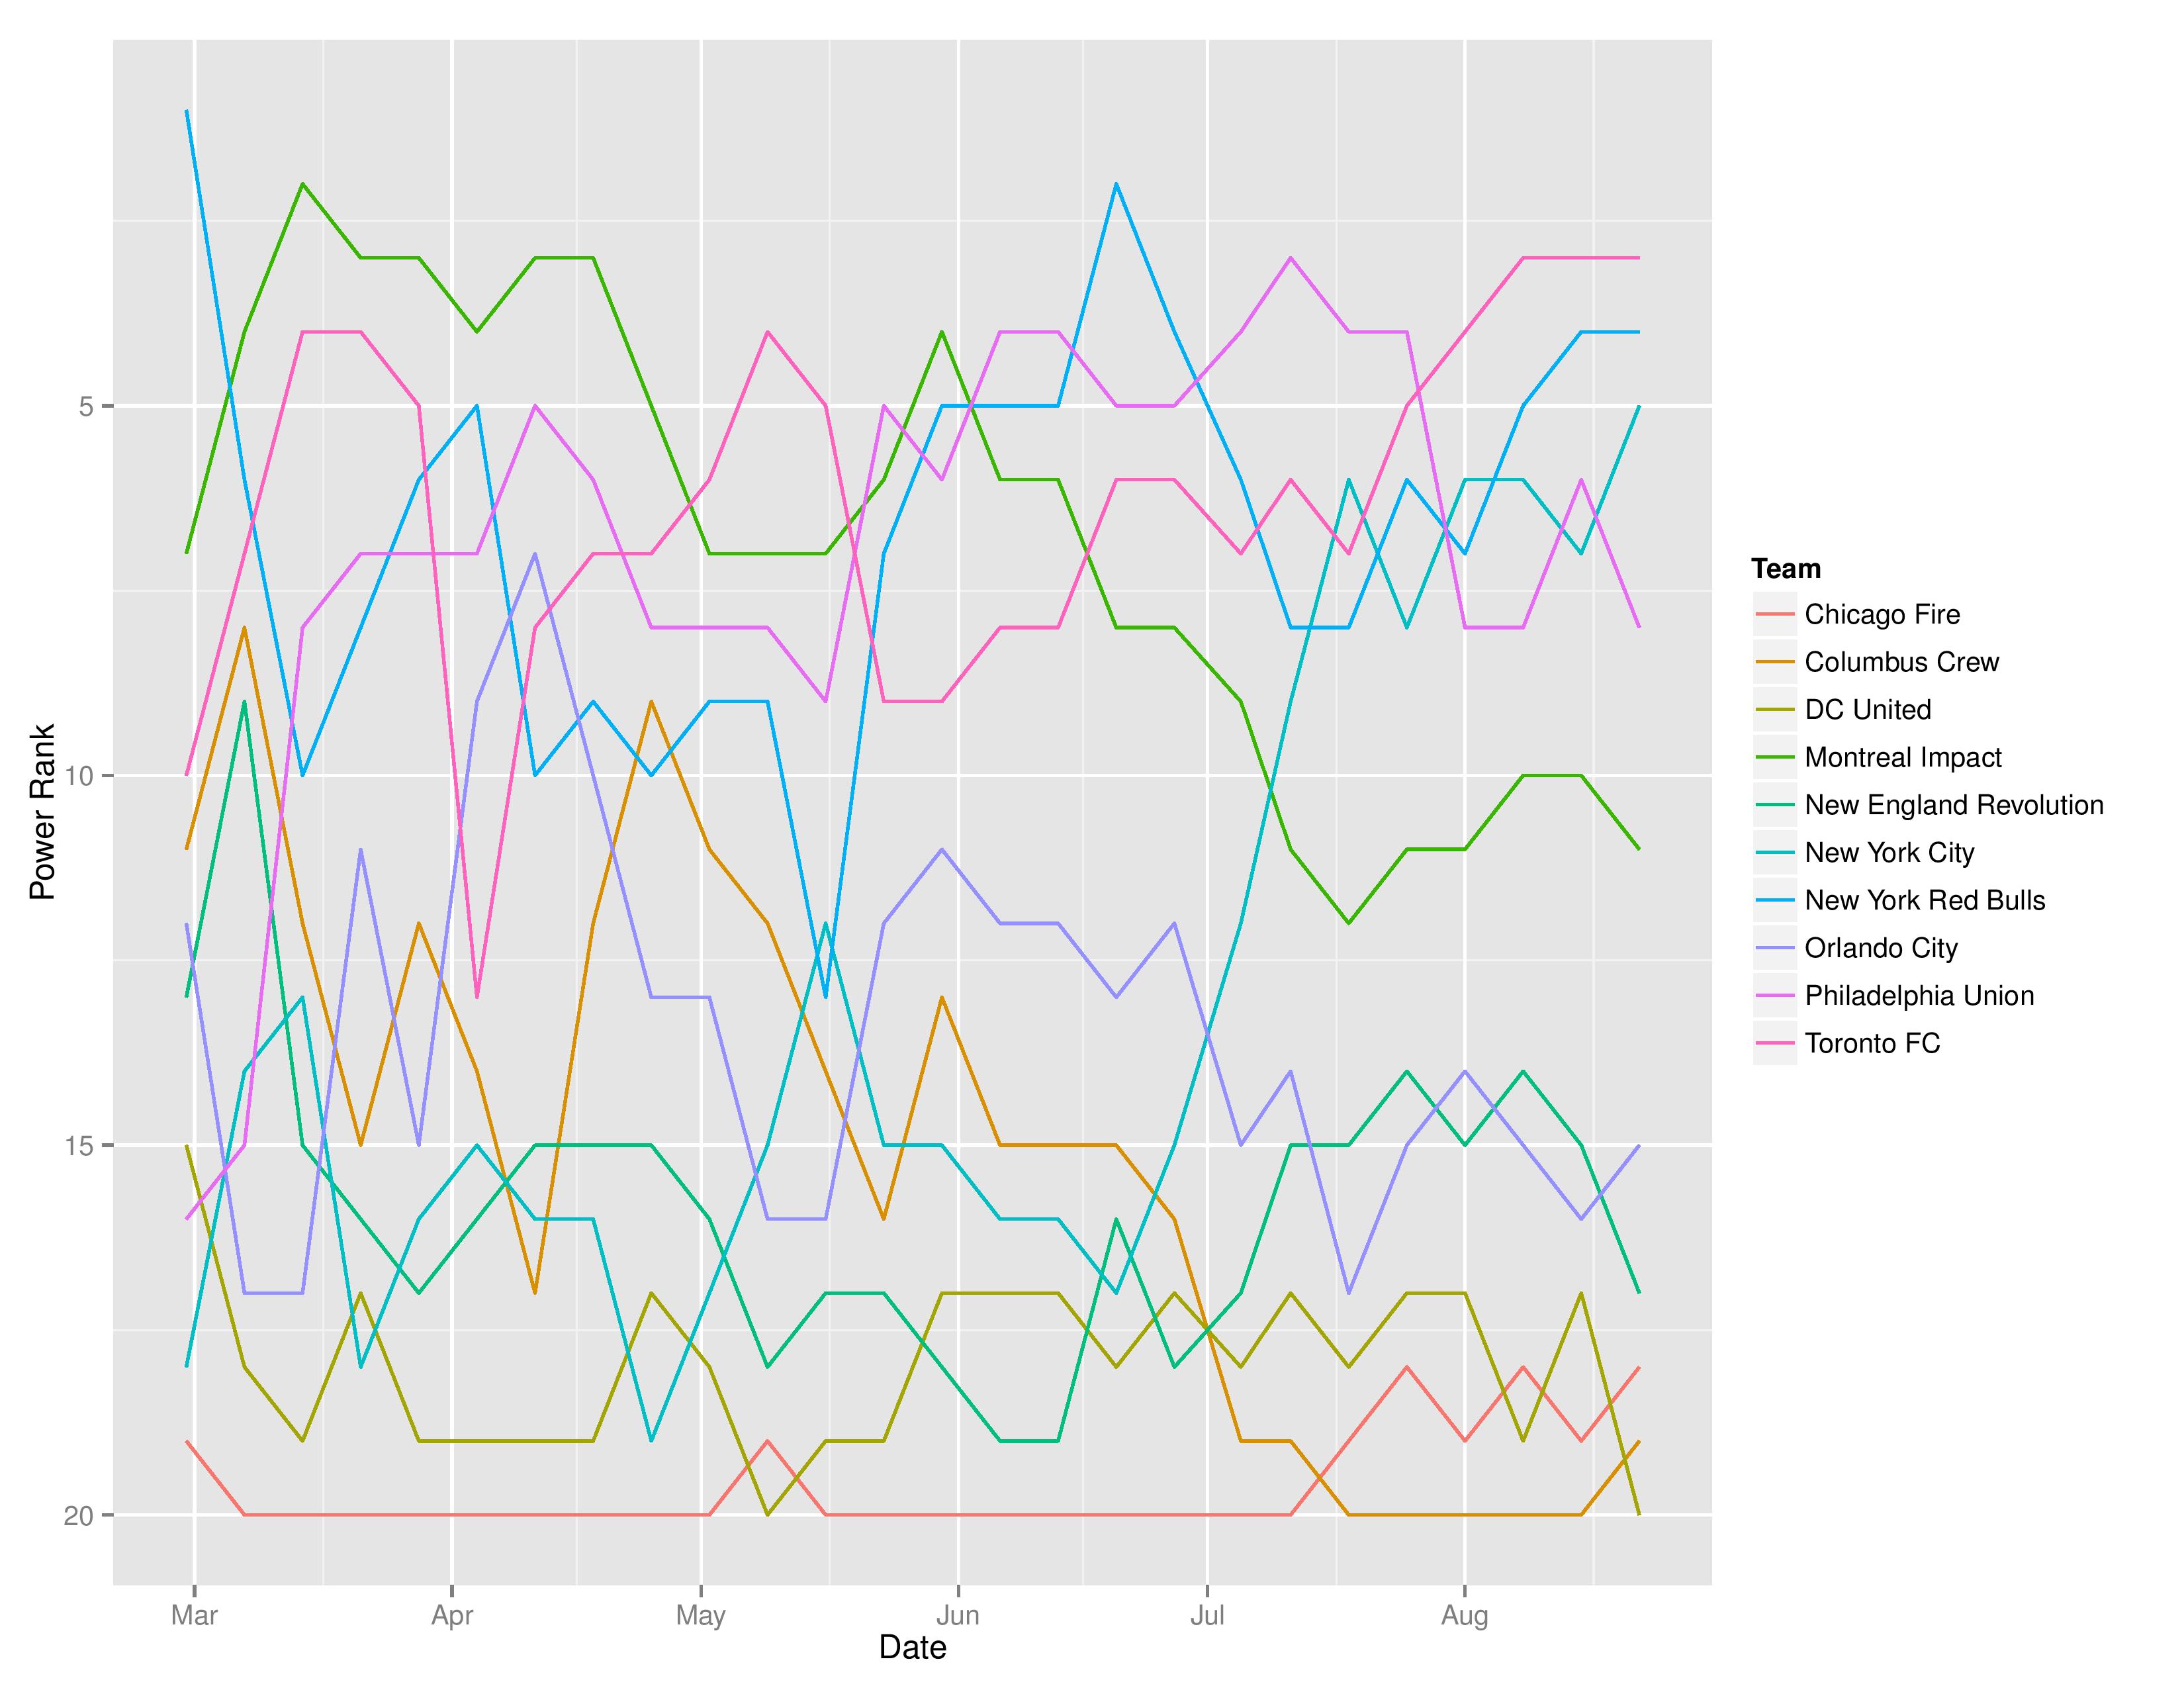
This shows the MLS Eastern Conference’s power rankings’ evolution in SEBA throughout the season.
Records
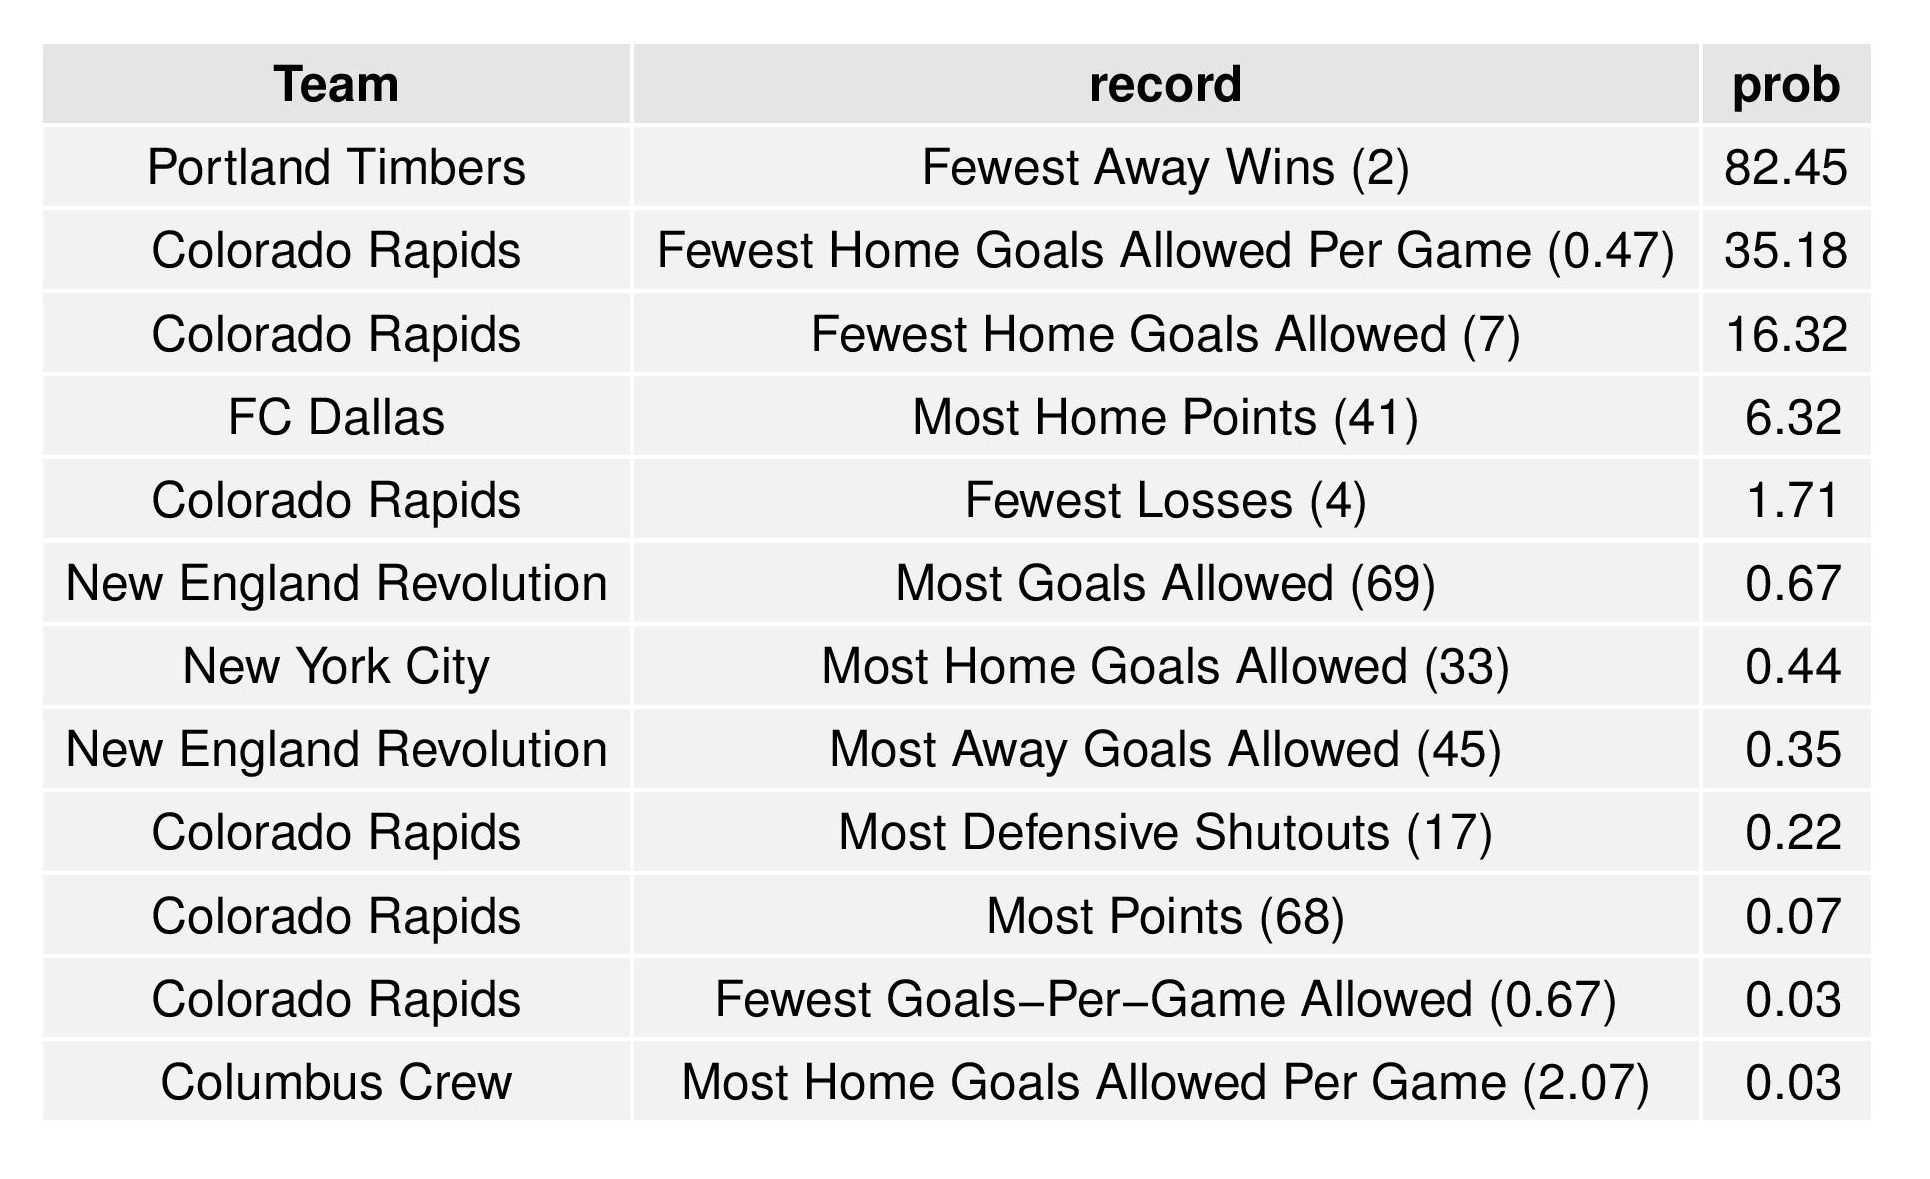
This shows the odds of breaking MLS single-season records, not of holding them. If more than one team could break the same record this season, they would both be represented below.
(Philadelphia did not break any single-season records in any of the 15,000 simulations.)
The following table shows all single-season records that had a record broken in at least one simulation. However, it limits the records to show only the most probable team for breaking each record.
USL Projections
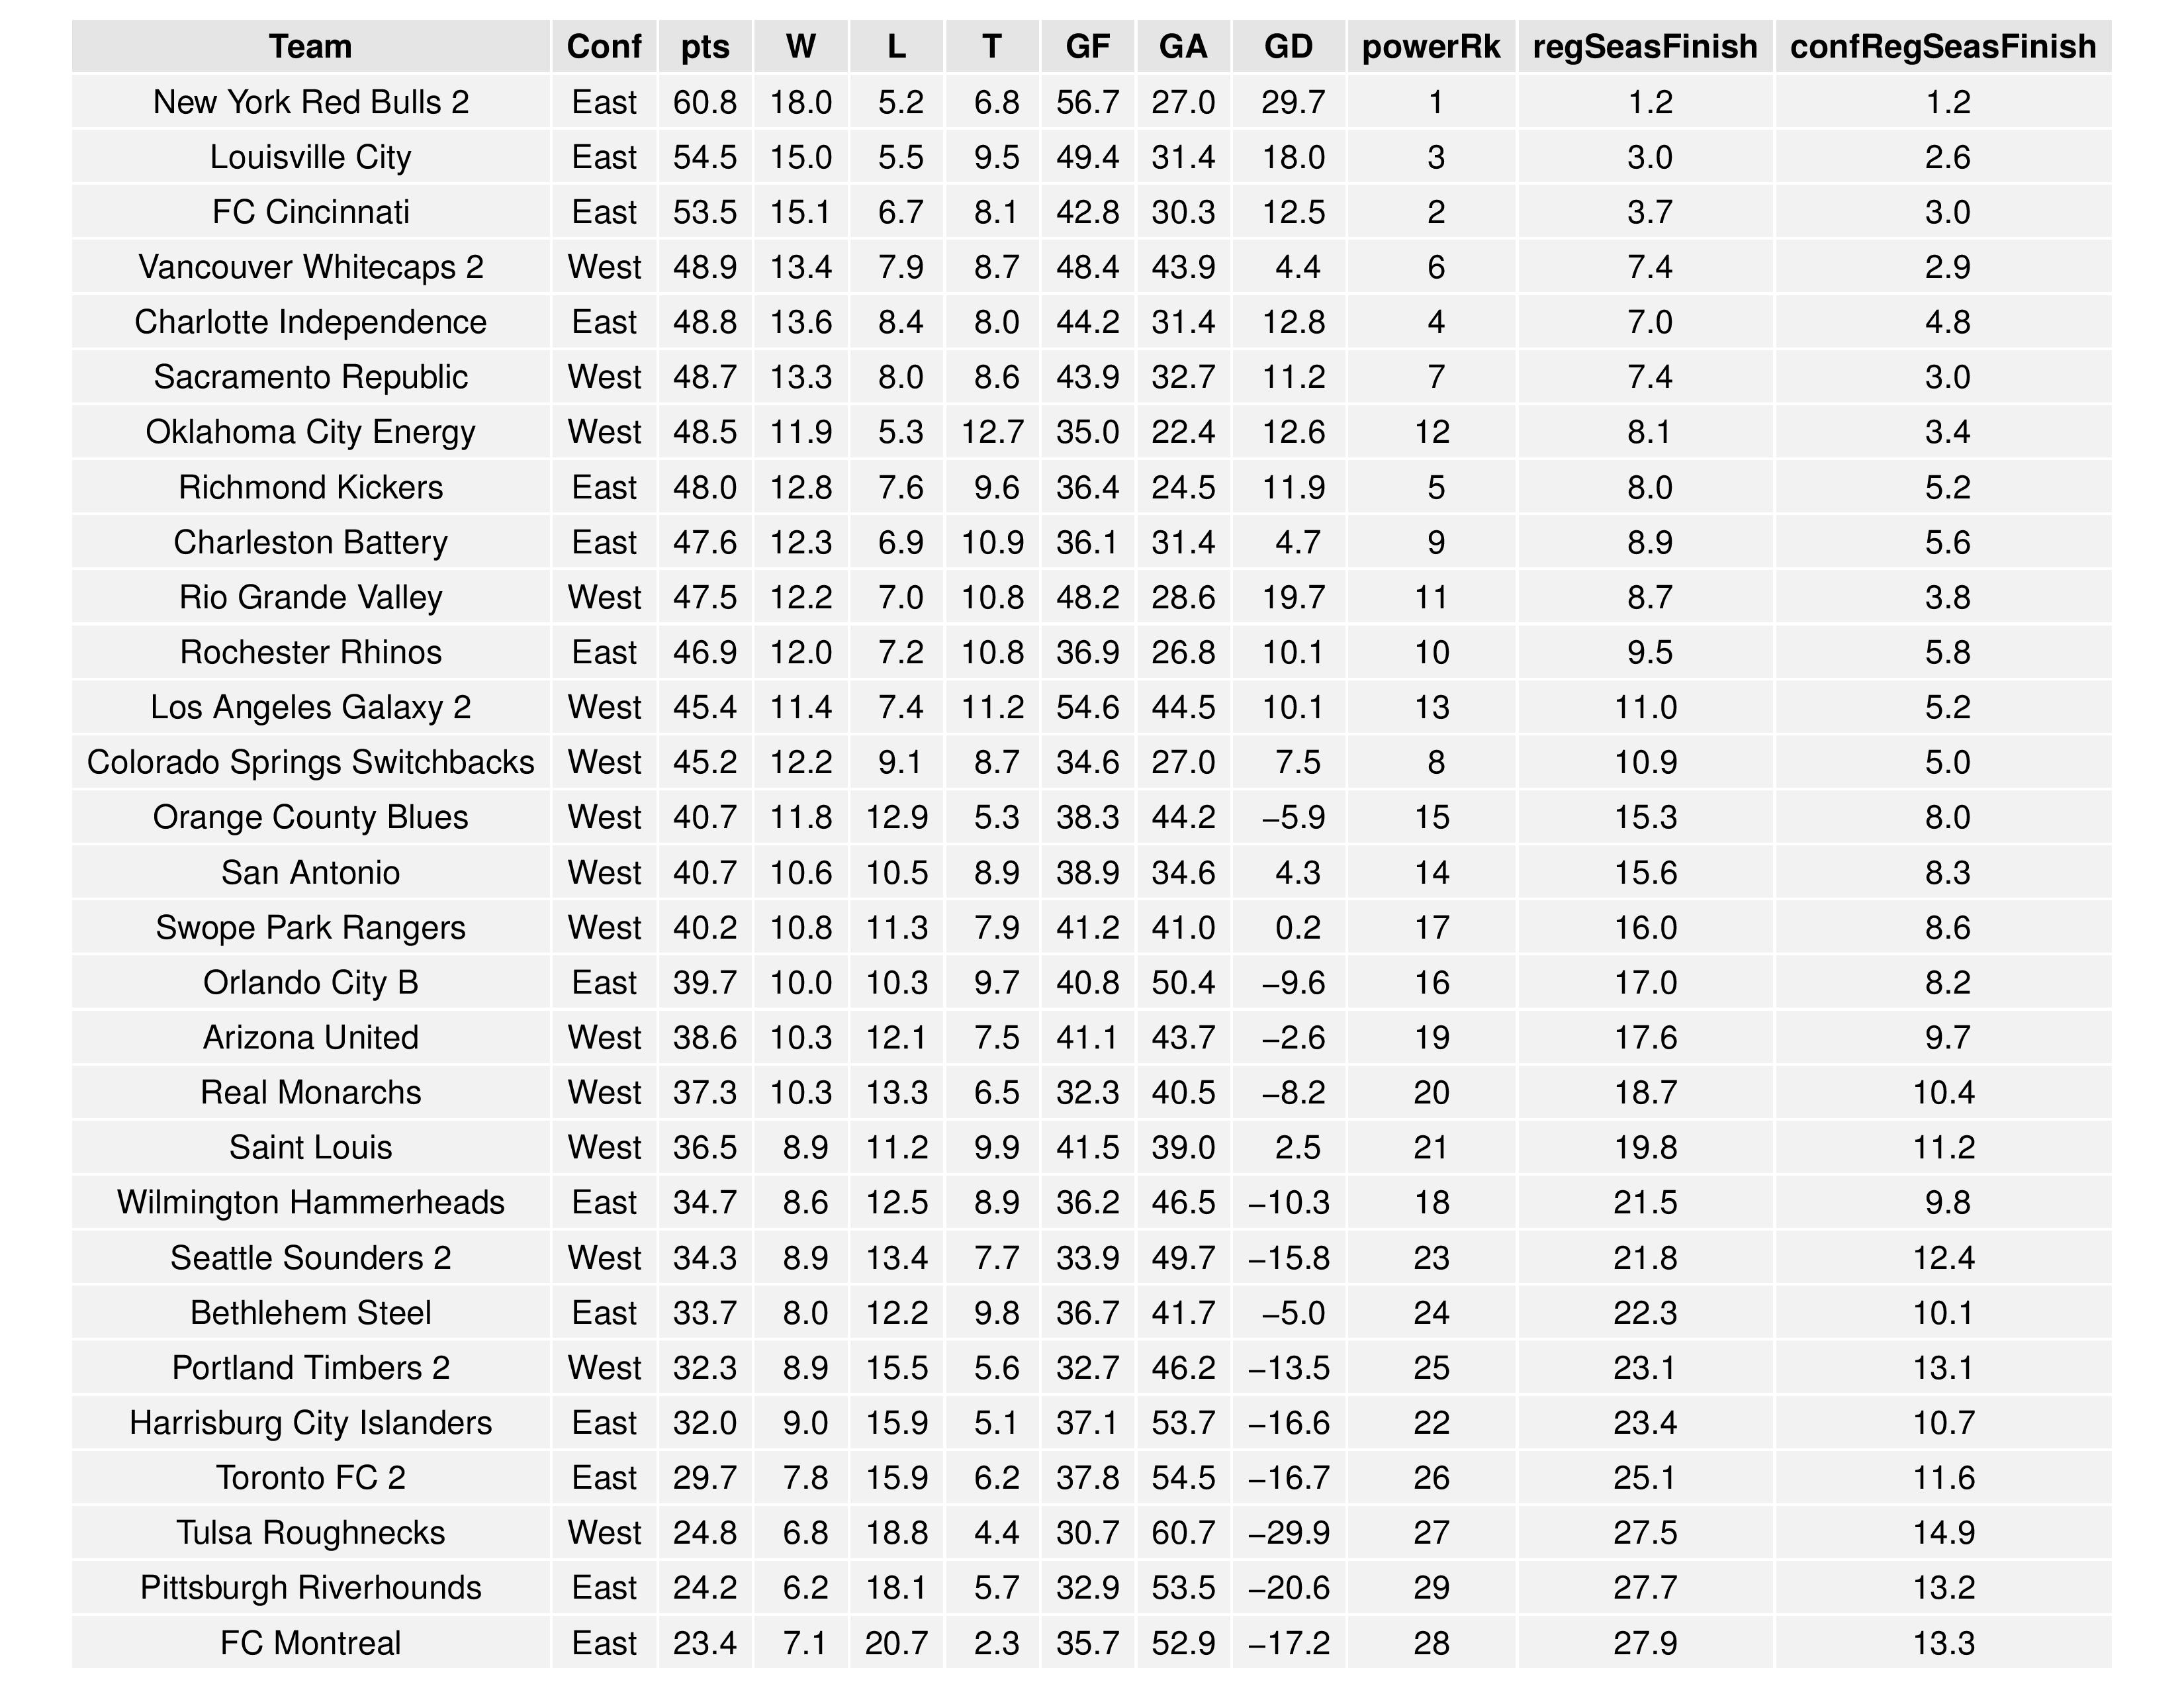
Bethlehem actually increased to 24th from 25th despite the loss (thanks to Portland Timbers 2 double loss by an aggregate 6-1 last week) and the Harrisburg City Islanders rose to 22nd from 24th. USLSoccer.com‘s top 10 rankings do not include either team.
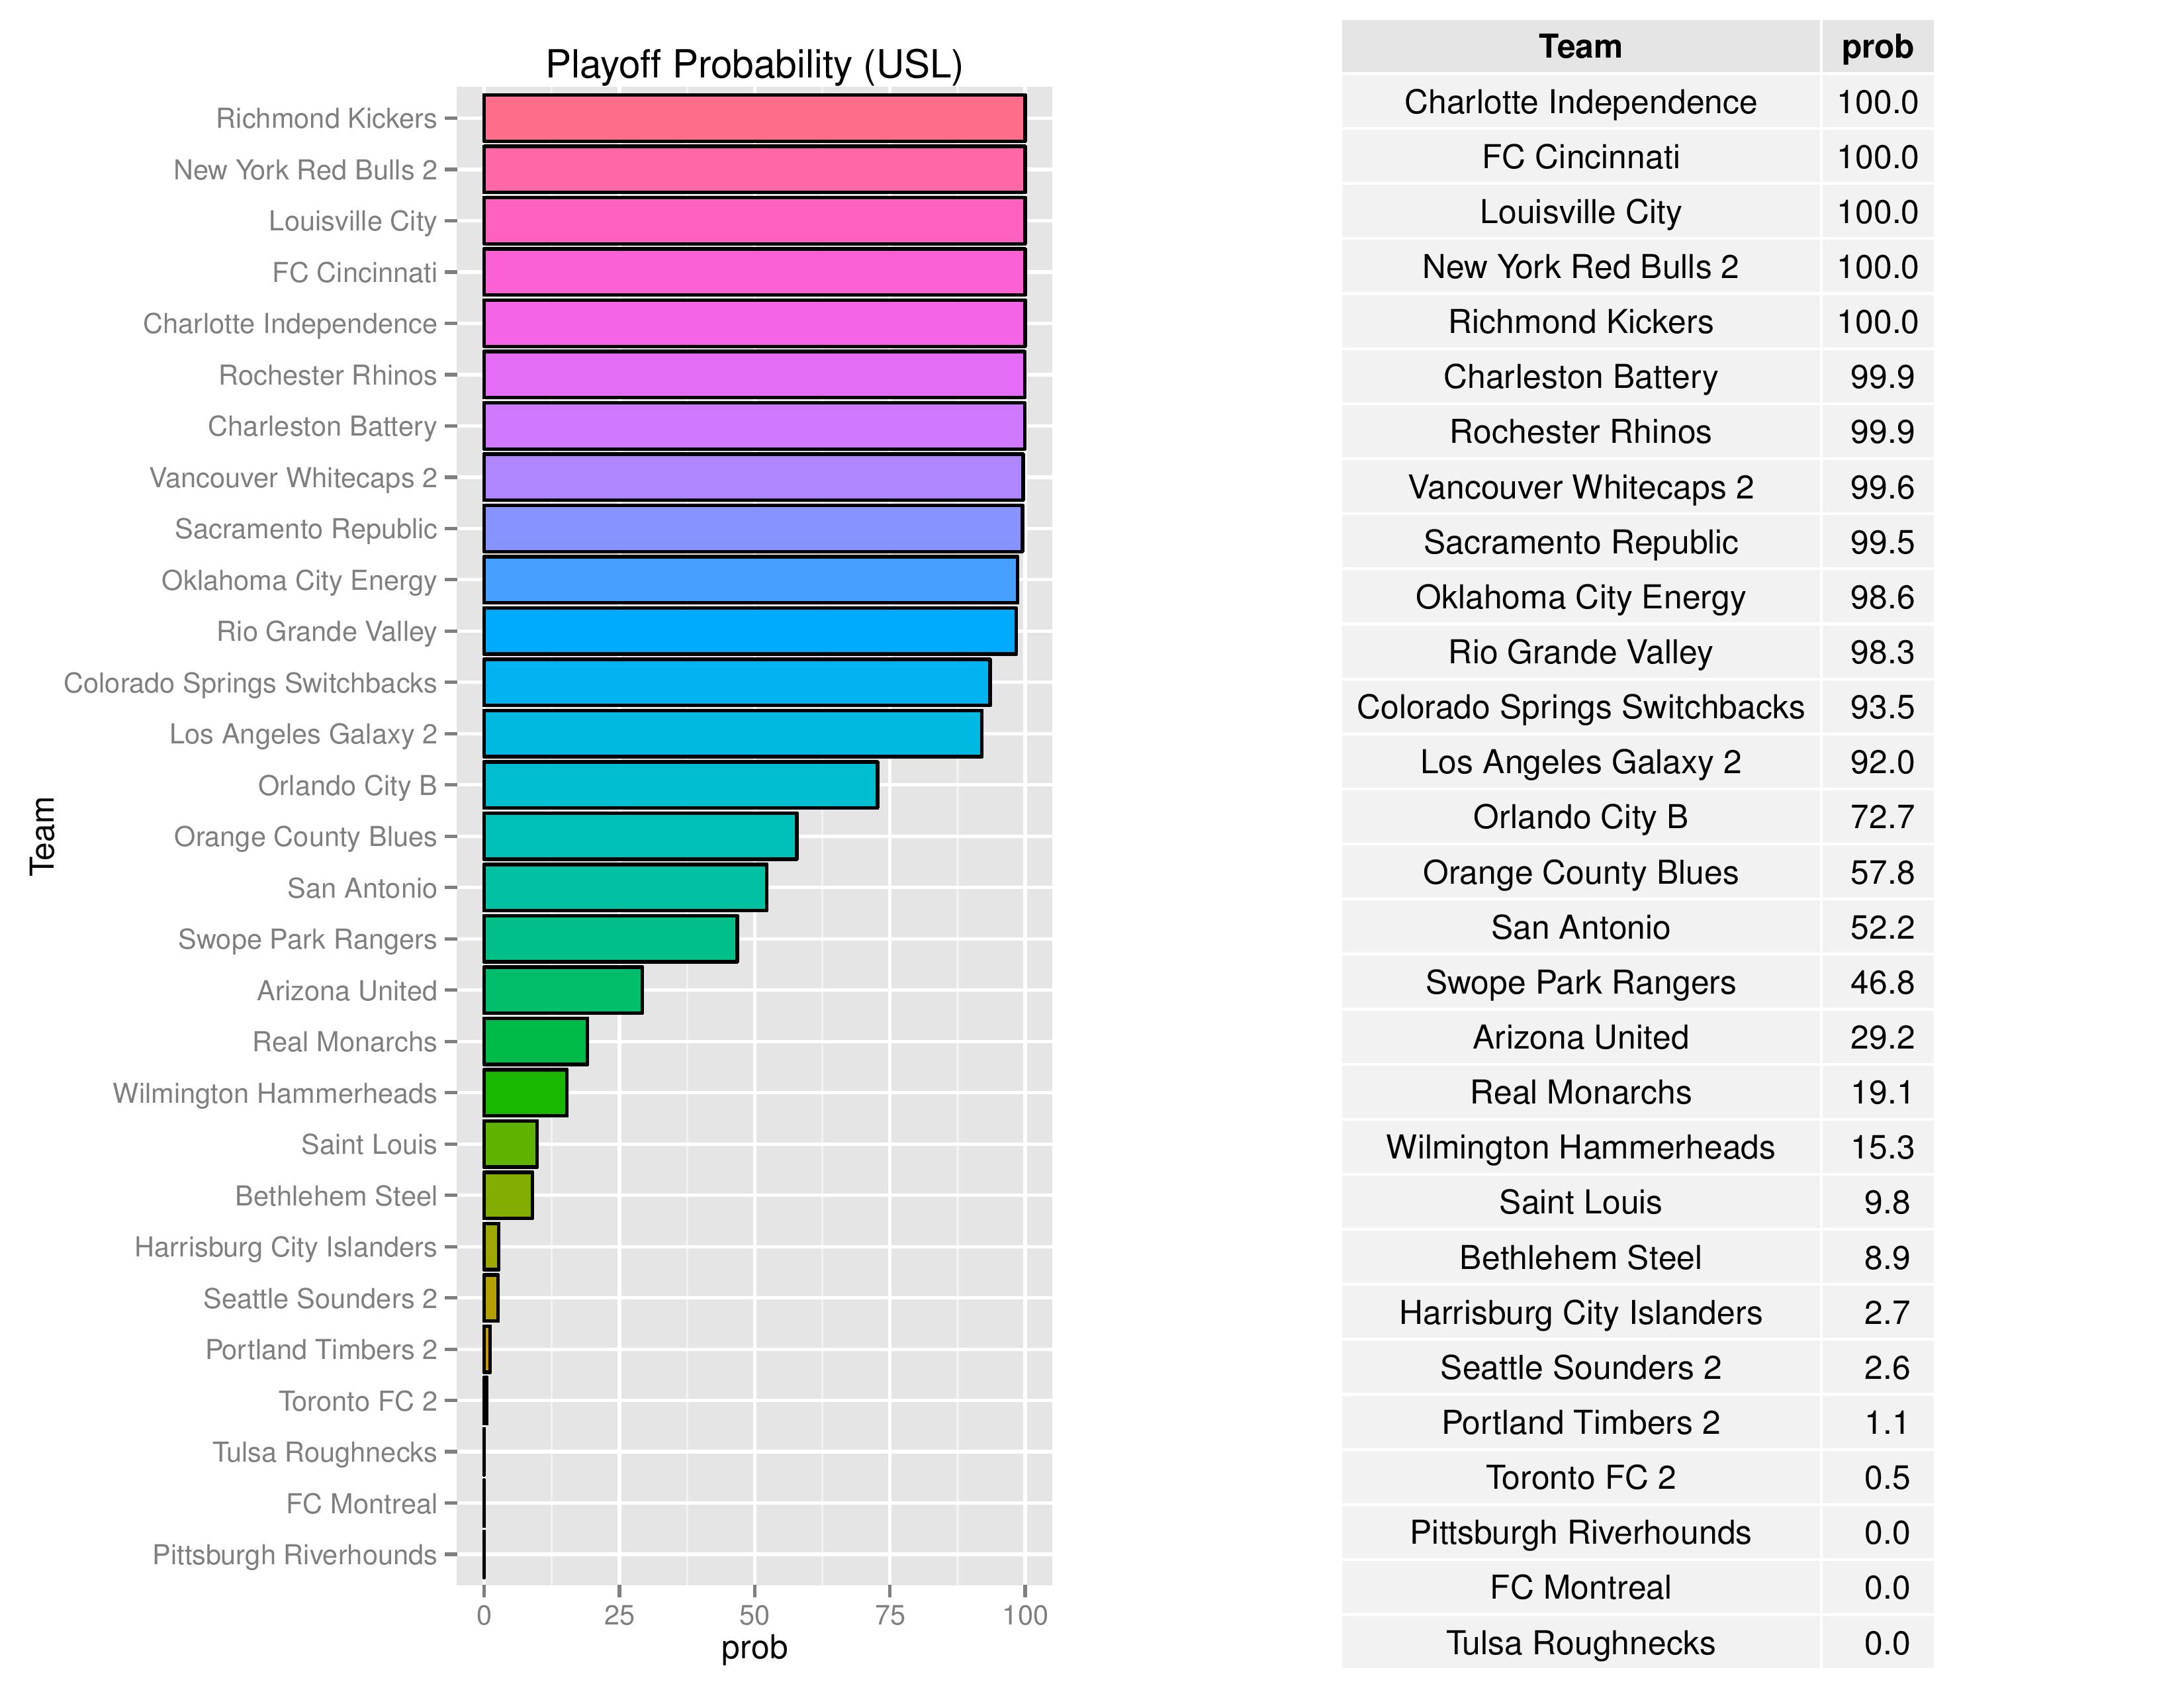
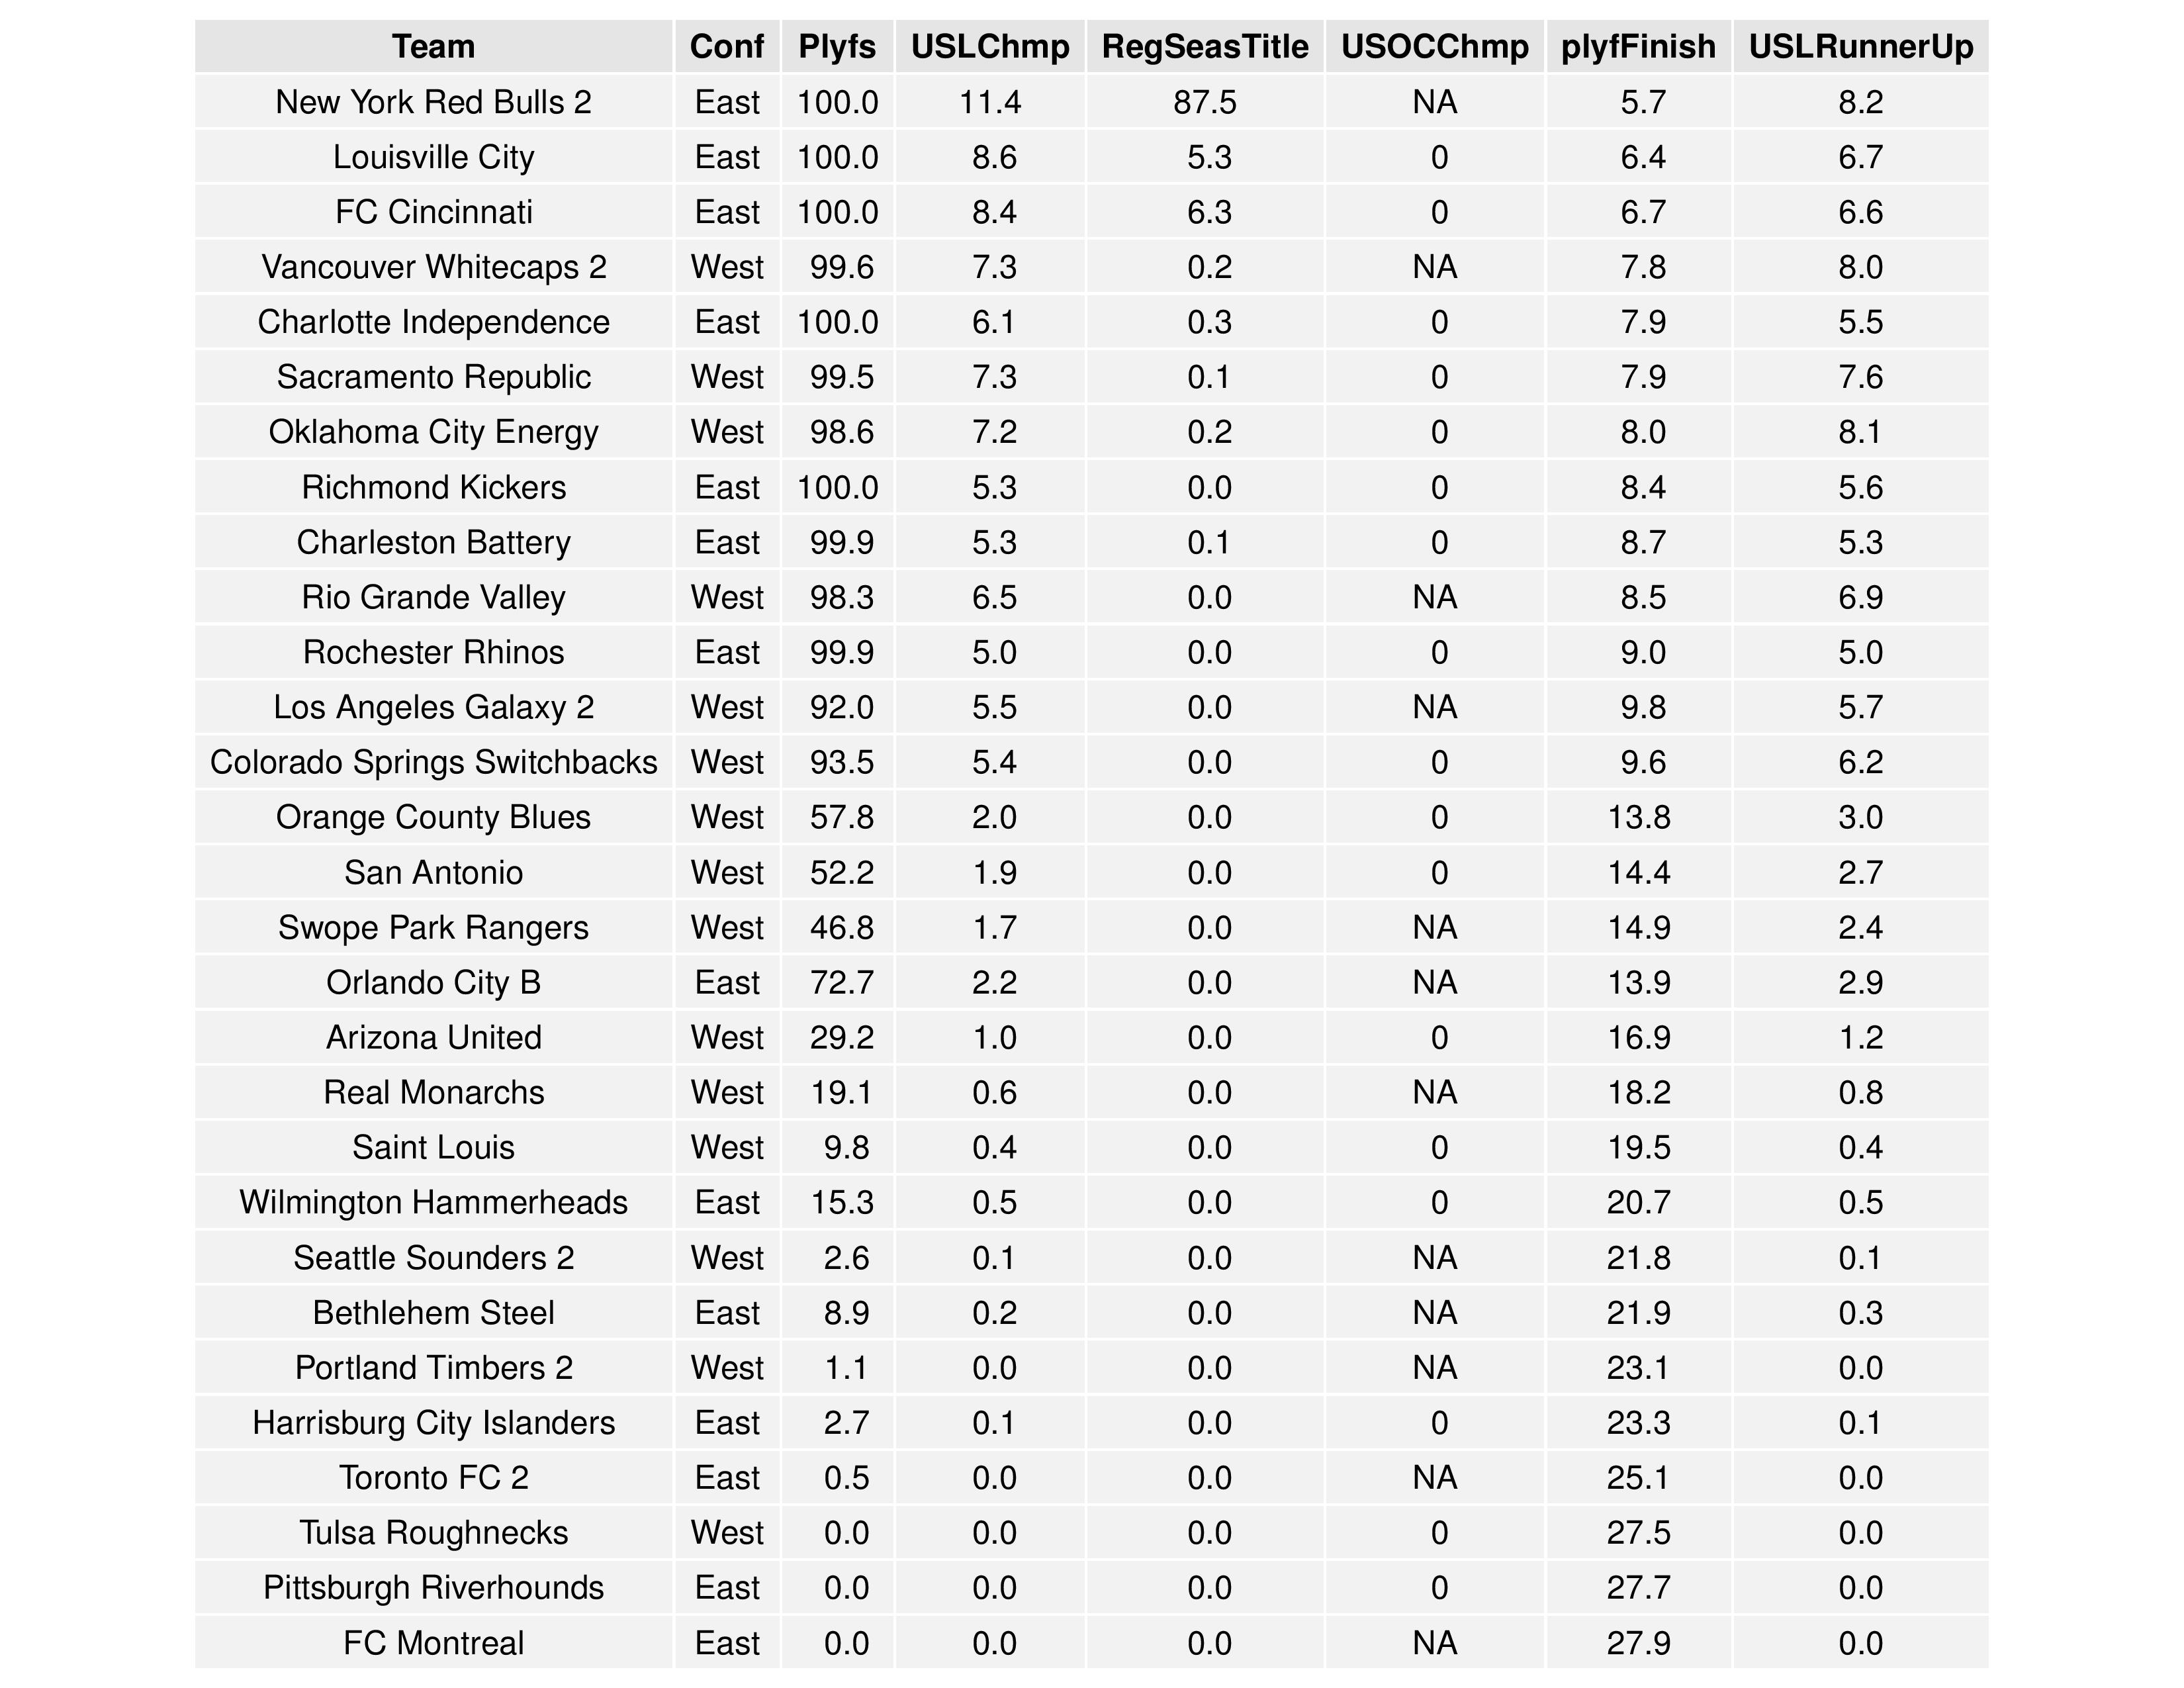
Bethlehem’s probability of making the playoffs continues to decline from 10.5% to 8.9%. Harrisburg City’s increased to 2.7% from 1.5%.
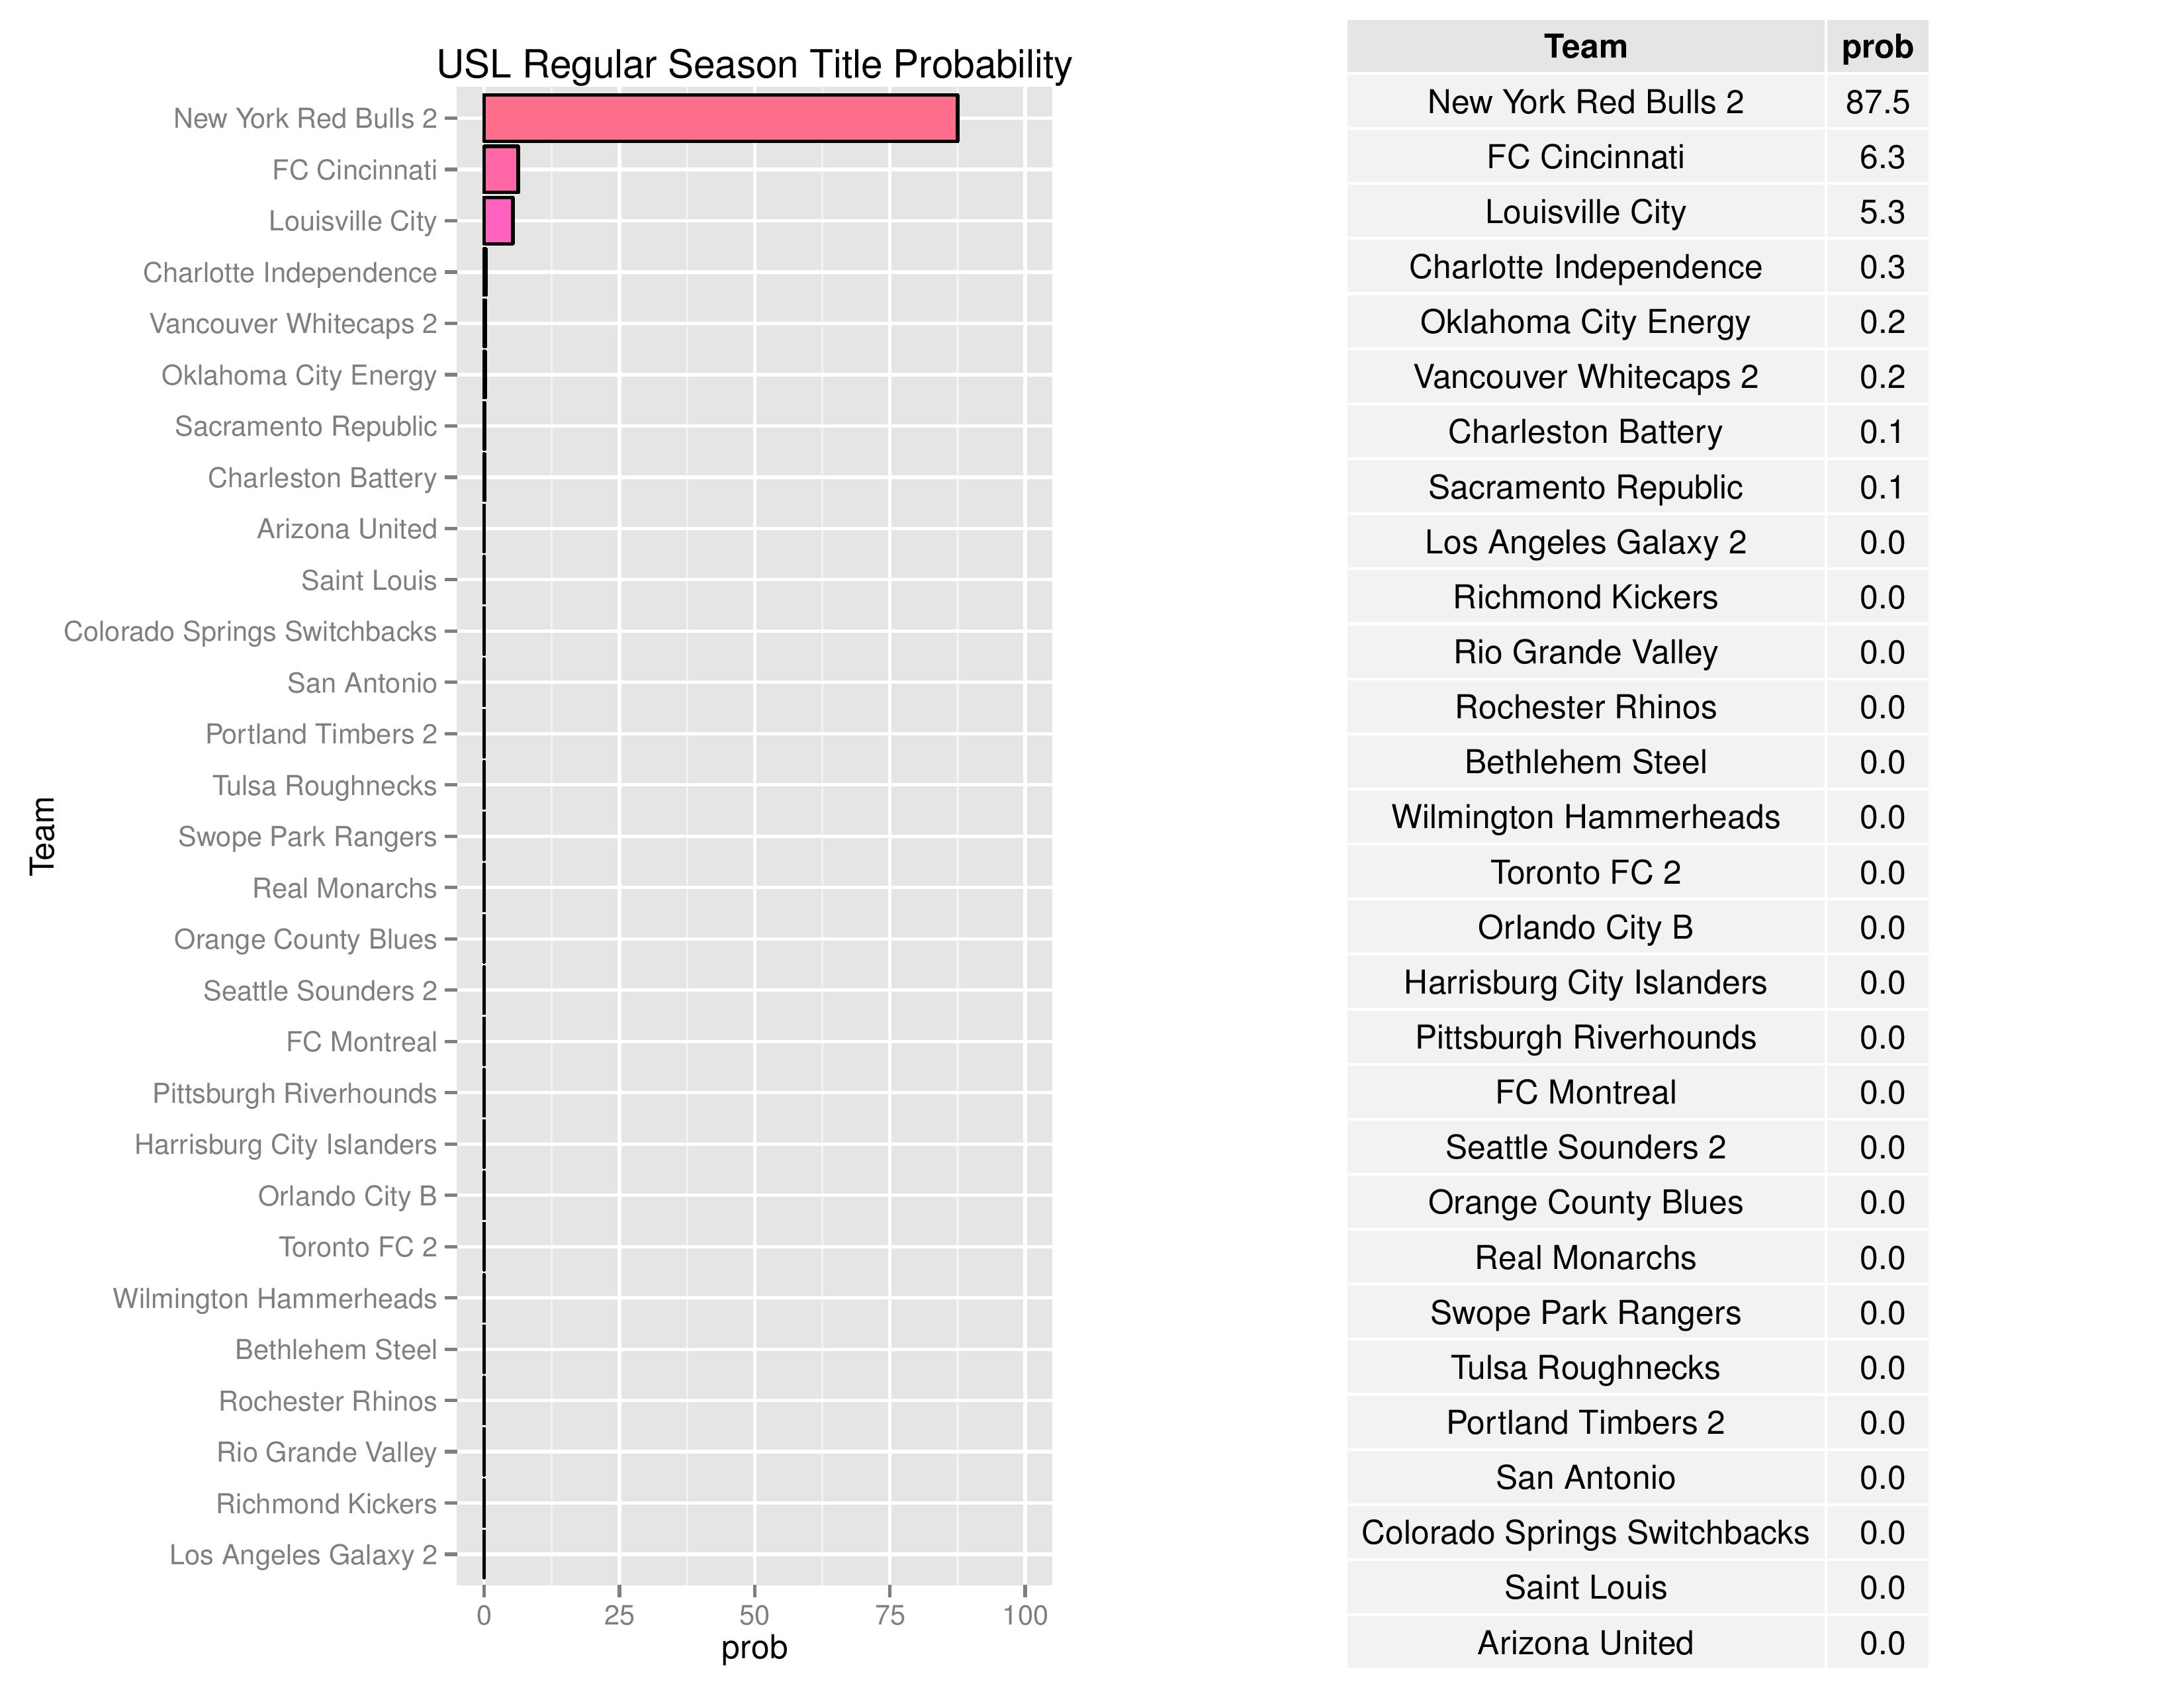
Both Bethlehem and Harrisburg City have no chance of winning the USL regular season title. NYRB 2 has nearly locked it up.
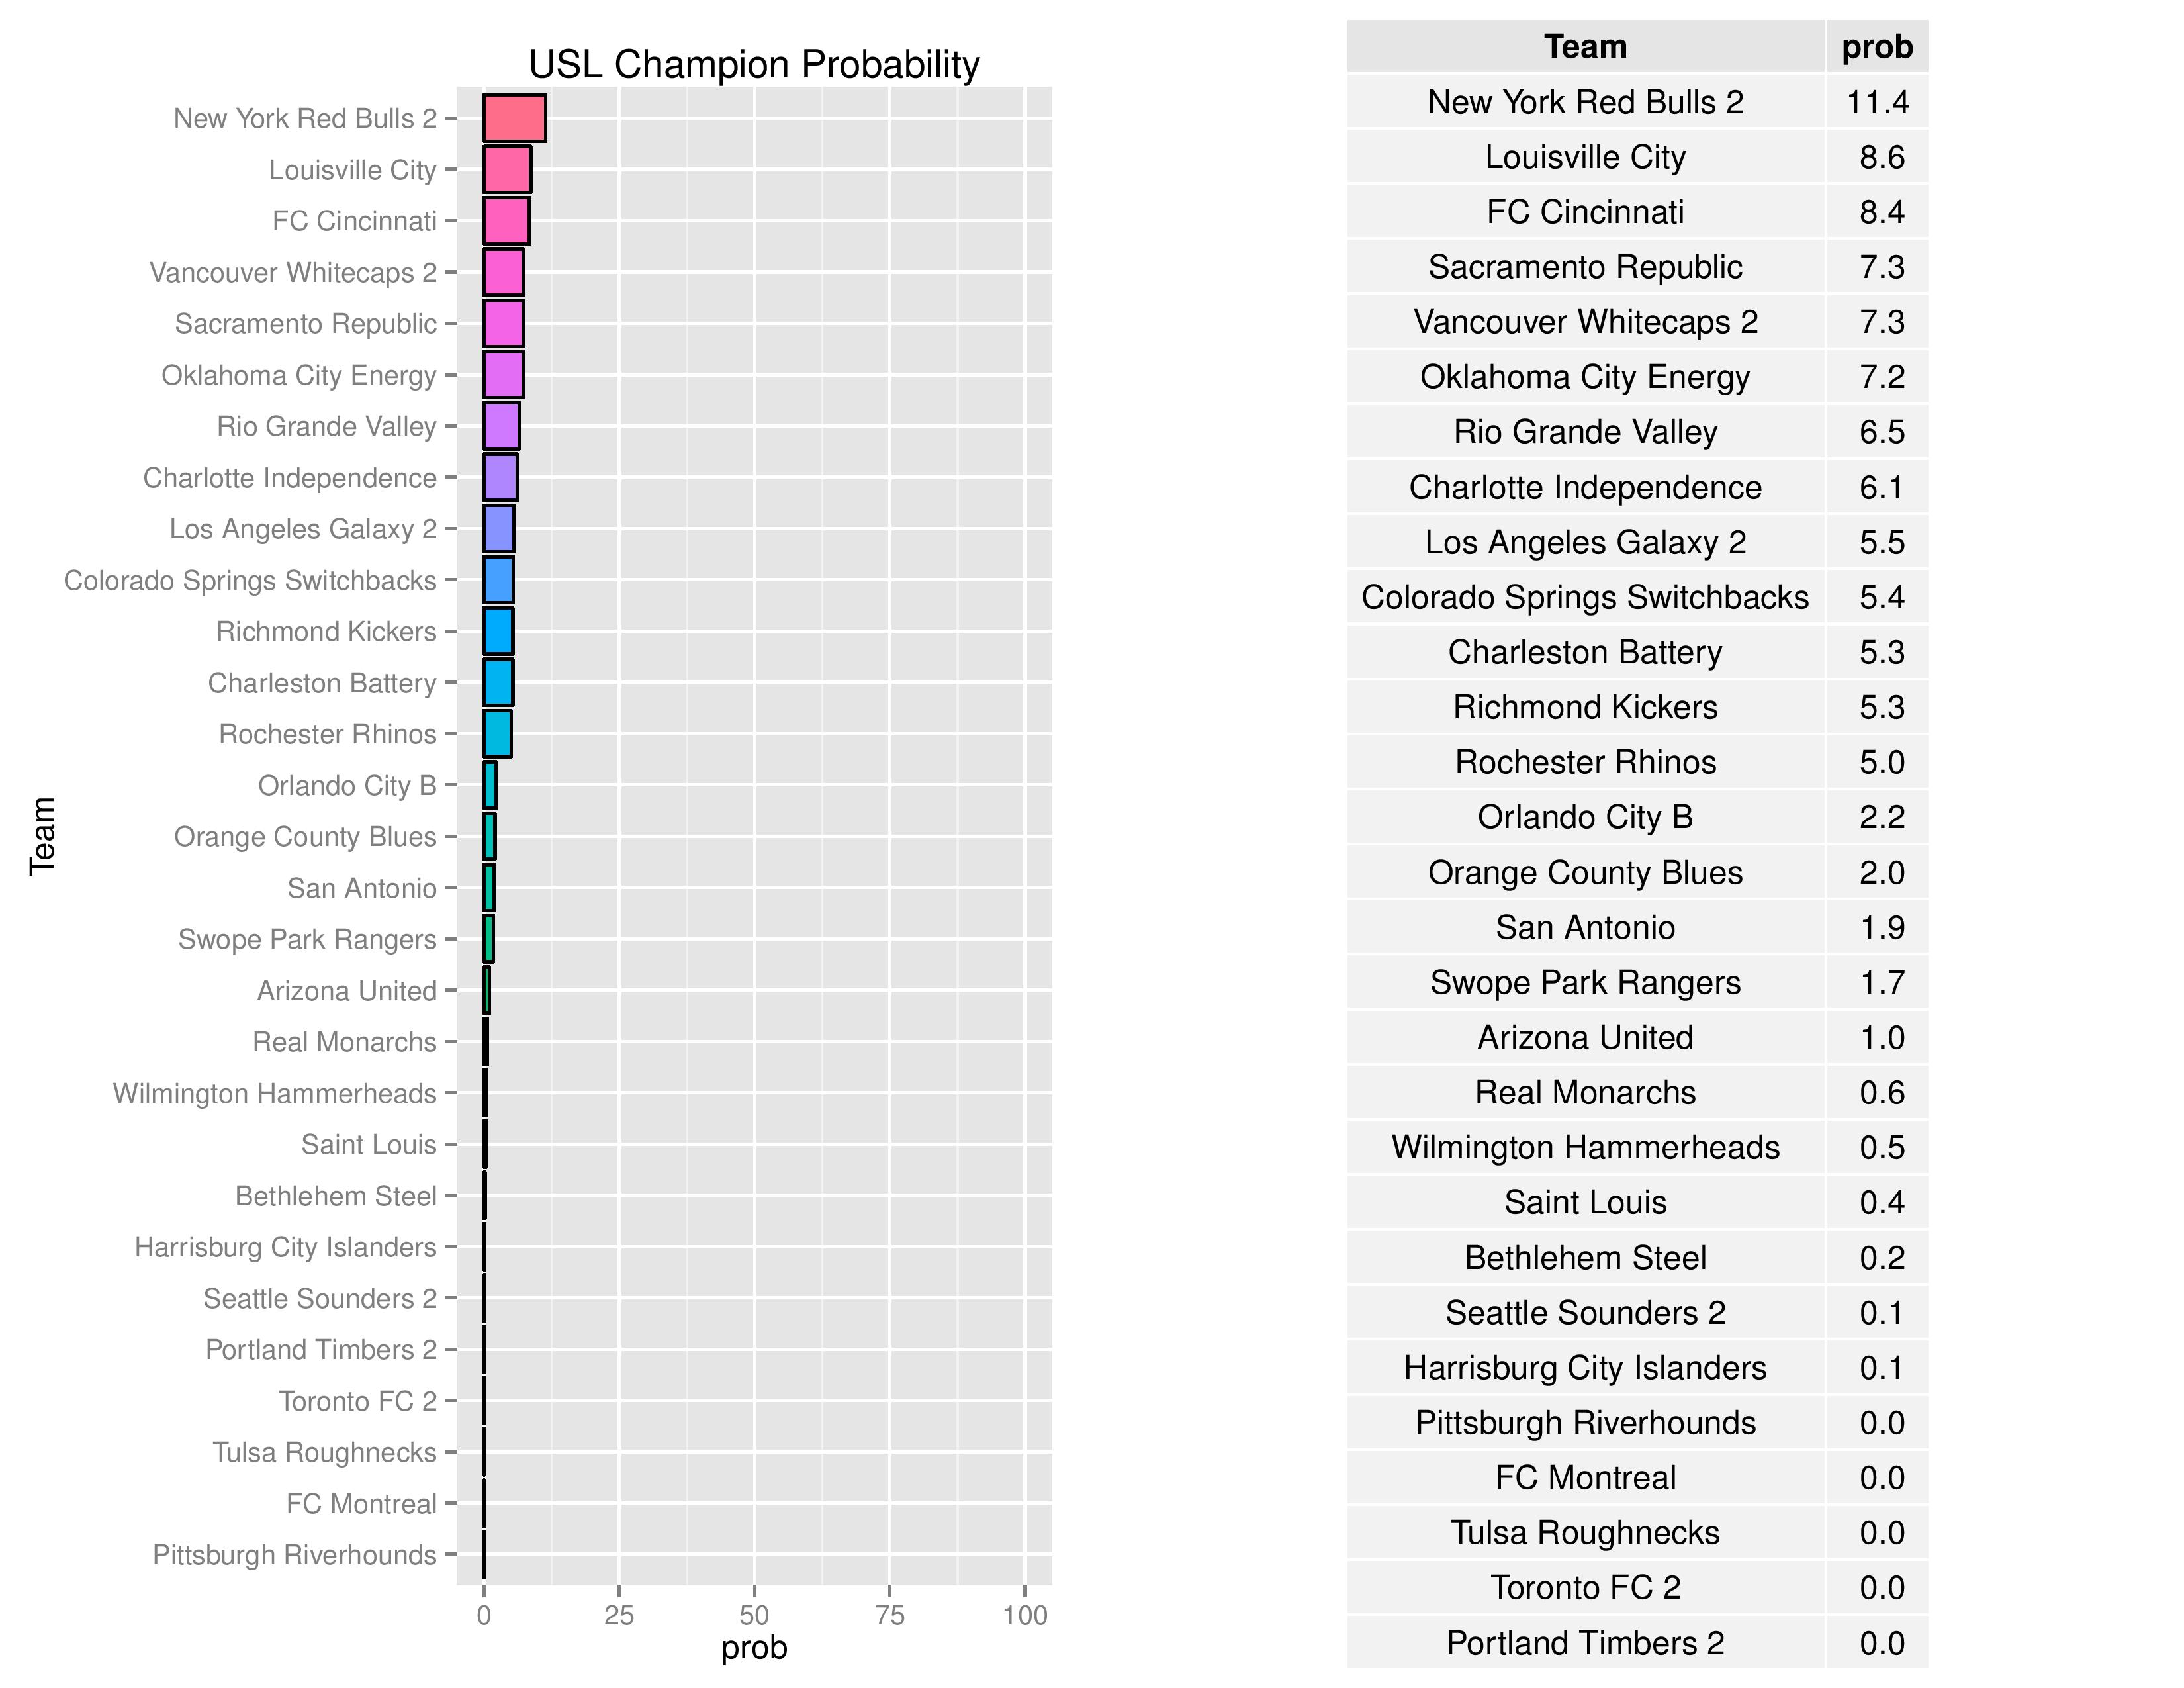
Bethlehem’s probability of winning the USL Championship decreased from 0.3% to 0.2%. Harrisburg City’s chances increased to 0.1% from negligible.
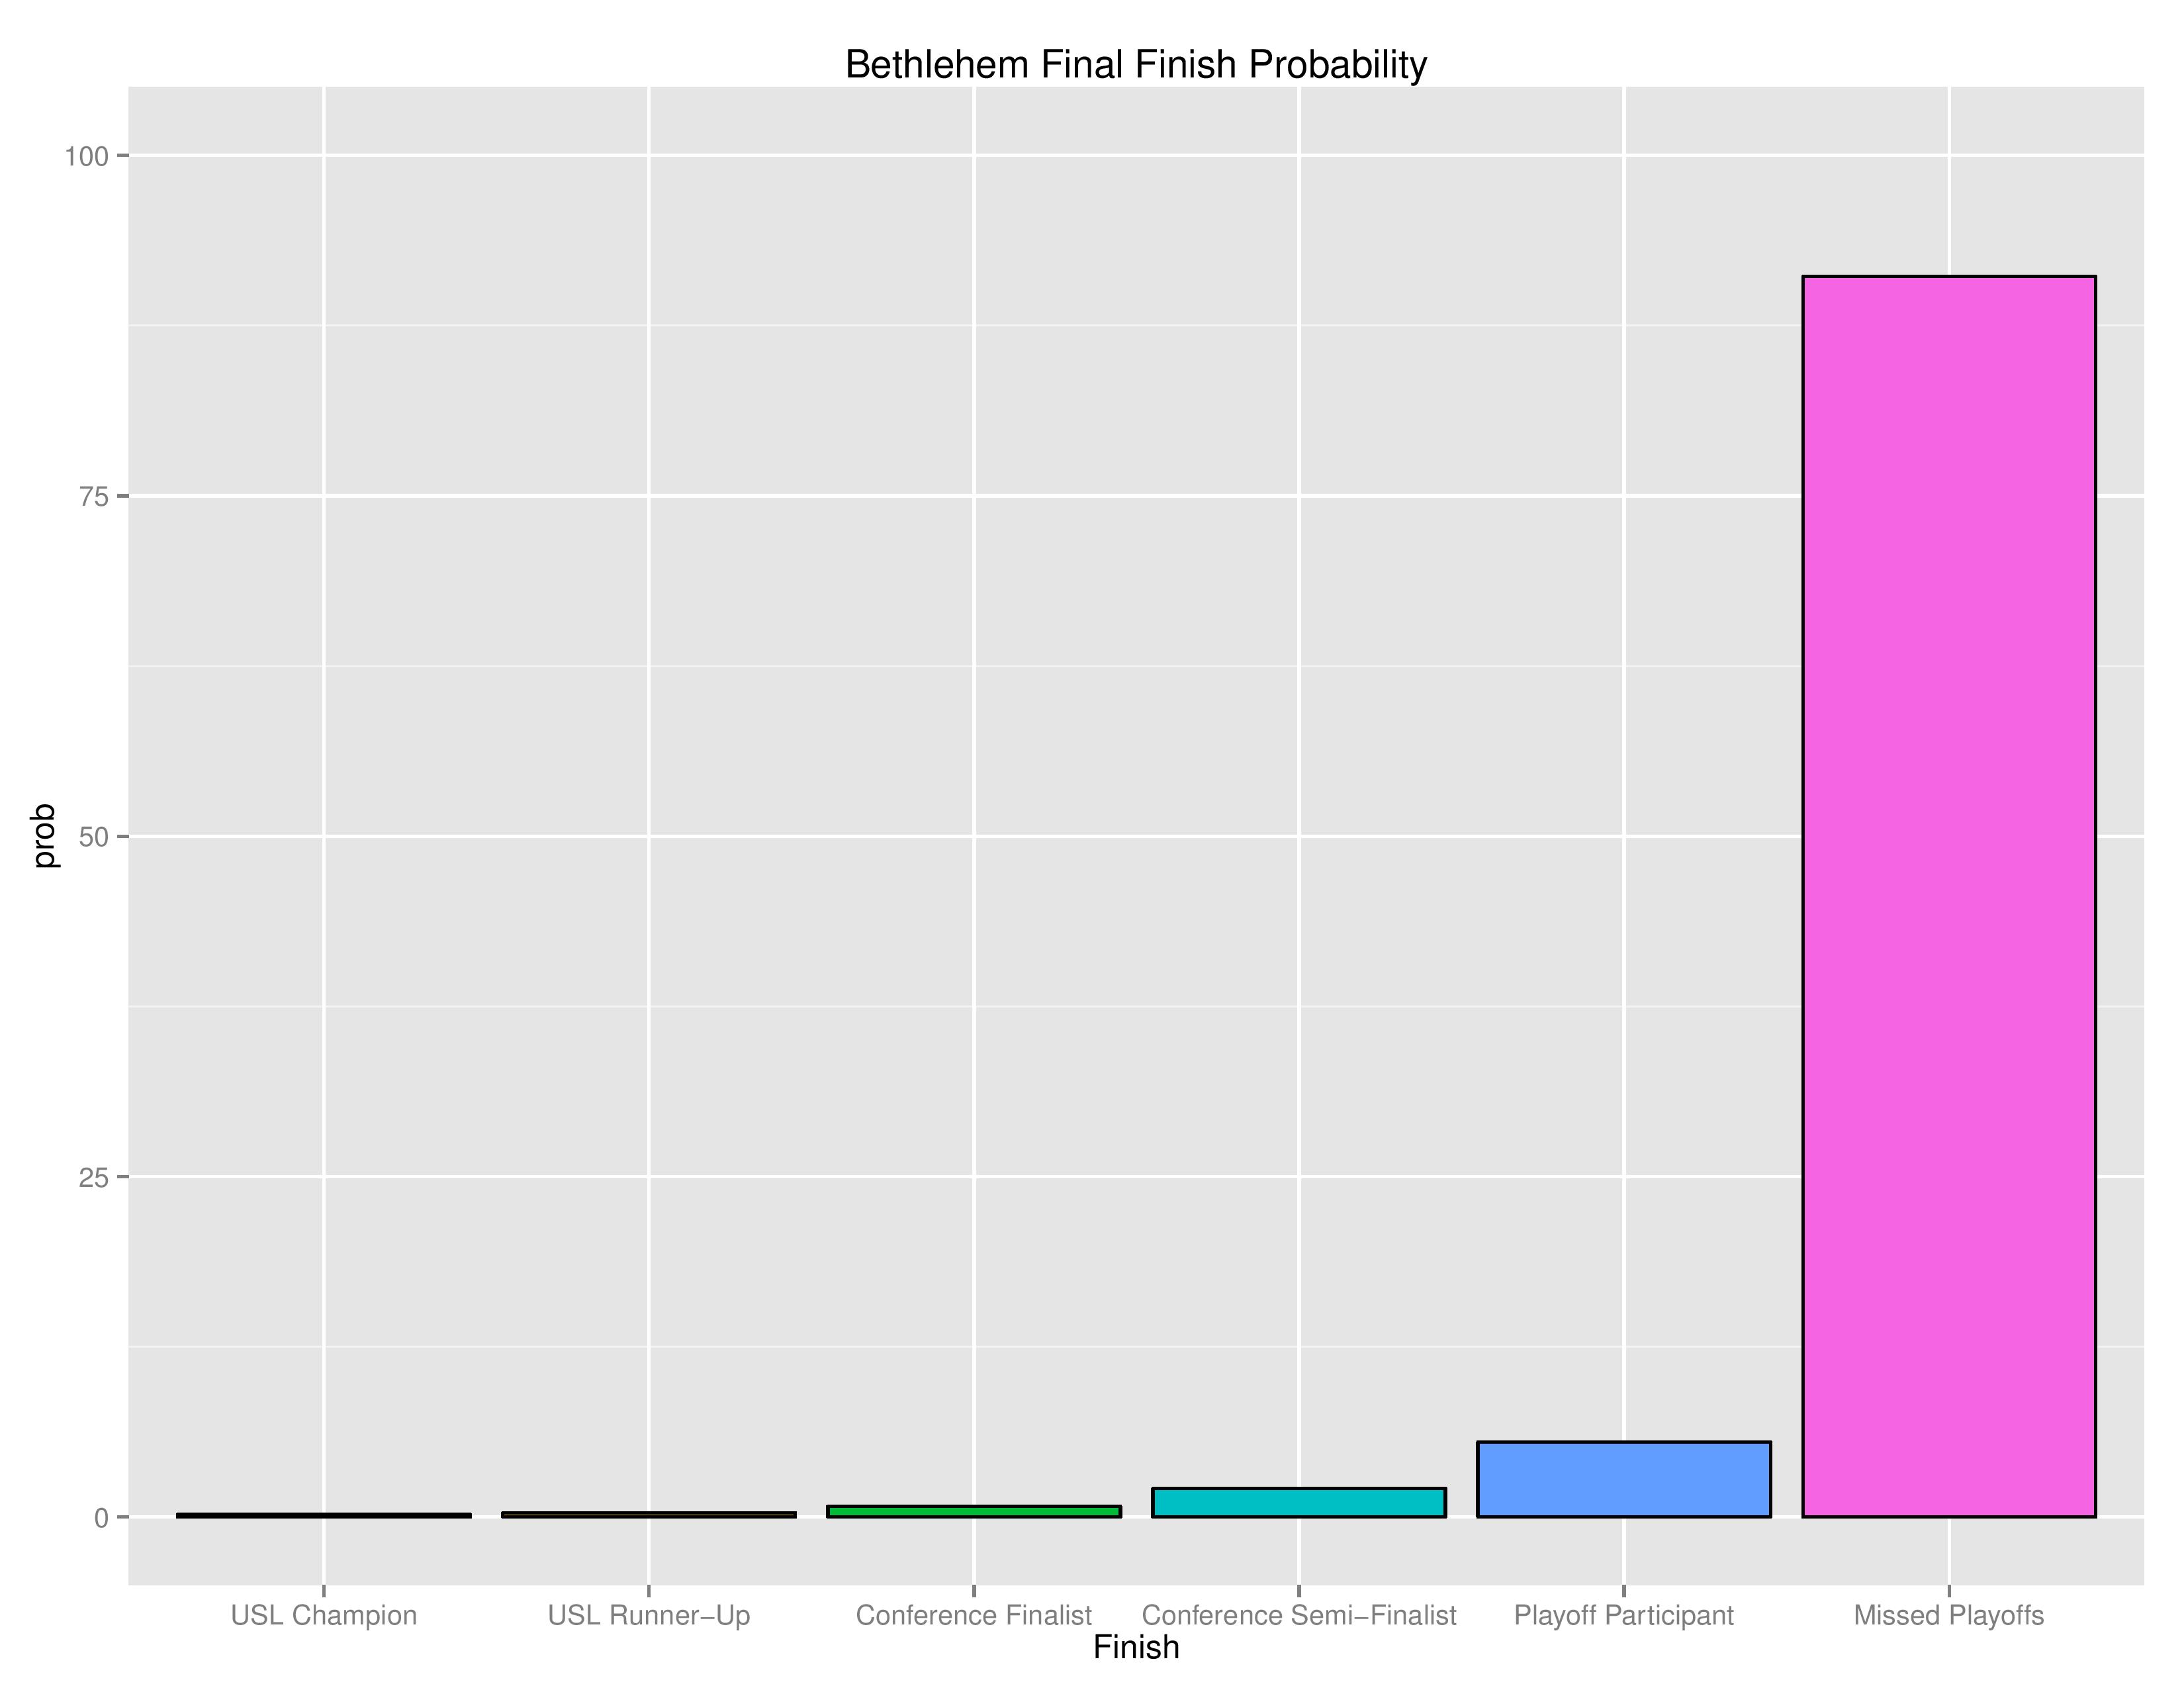
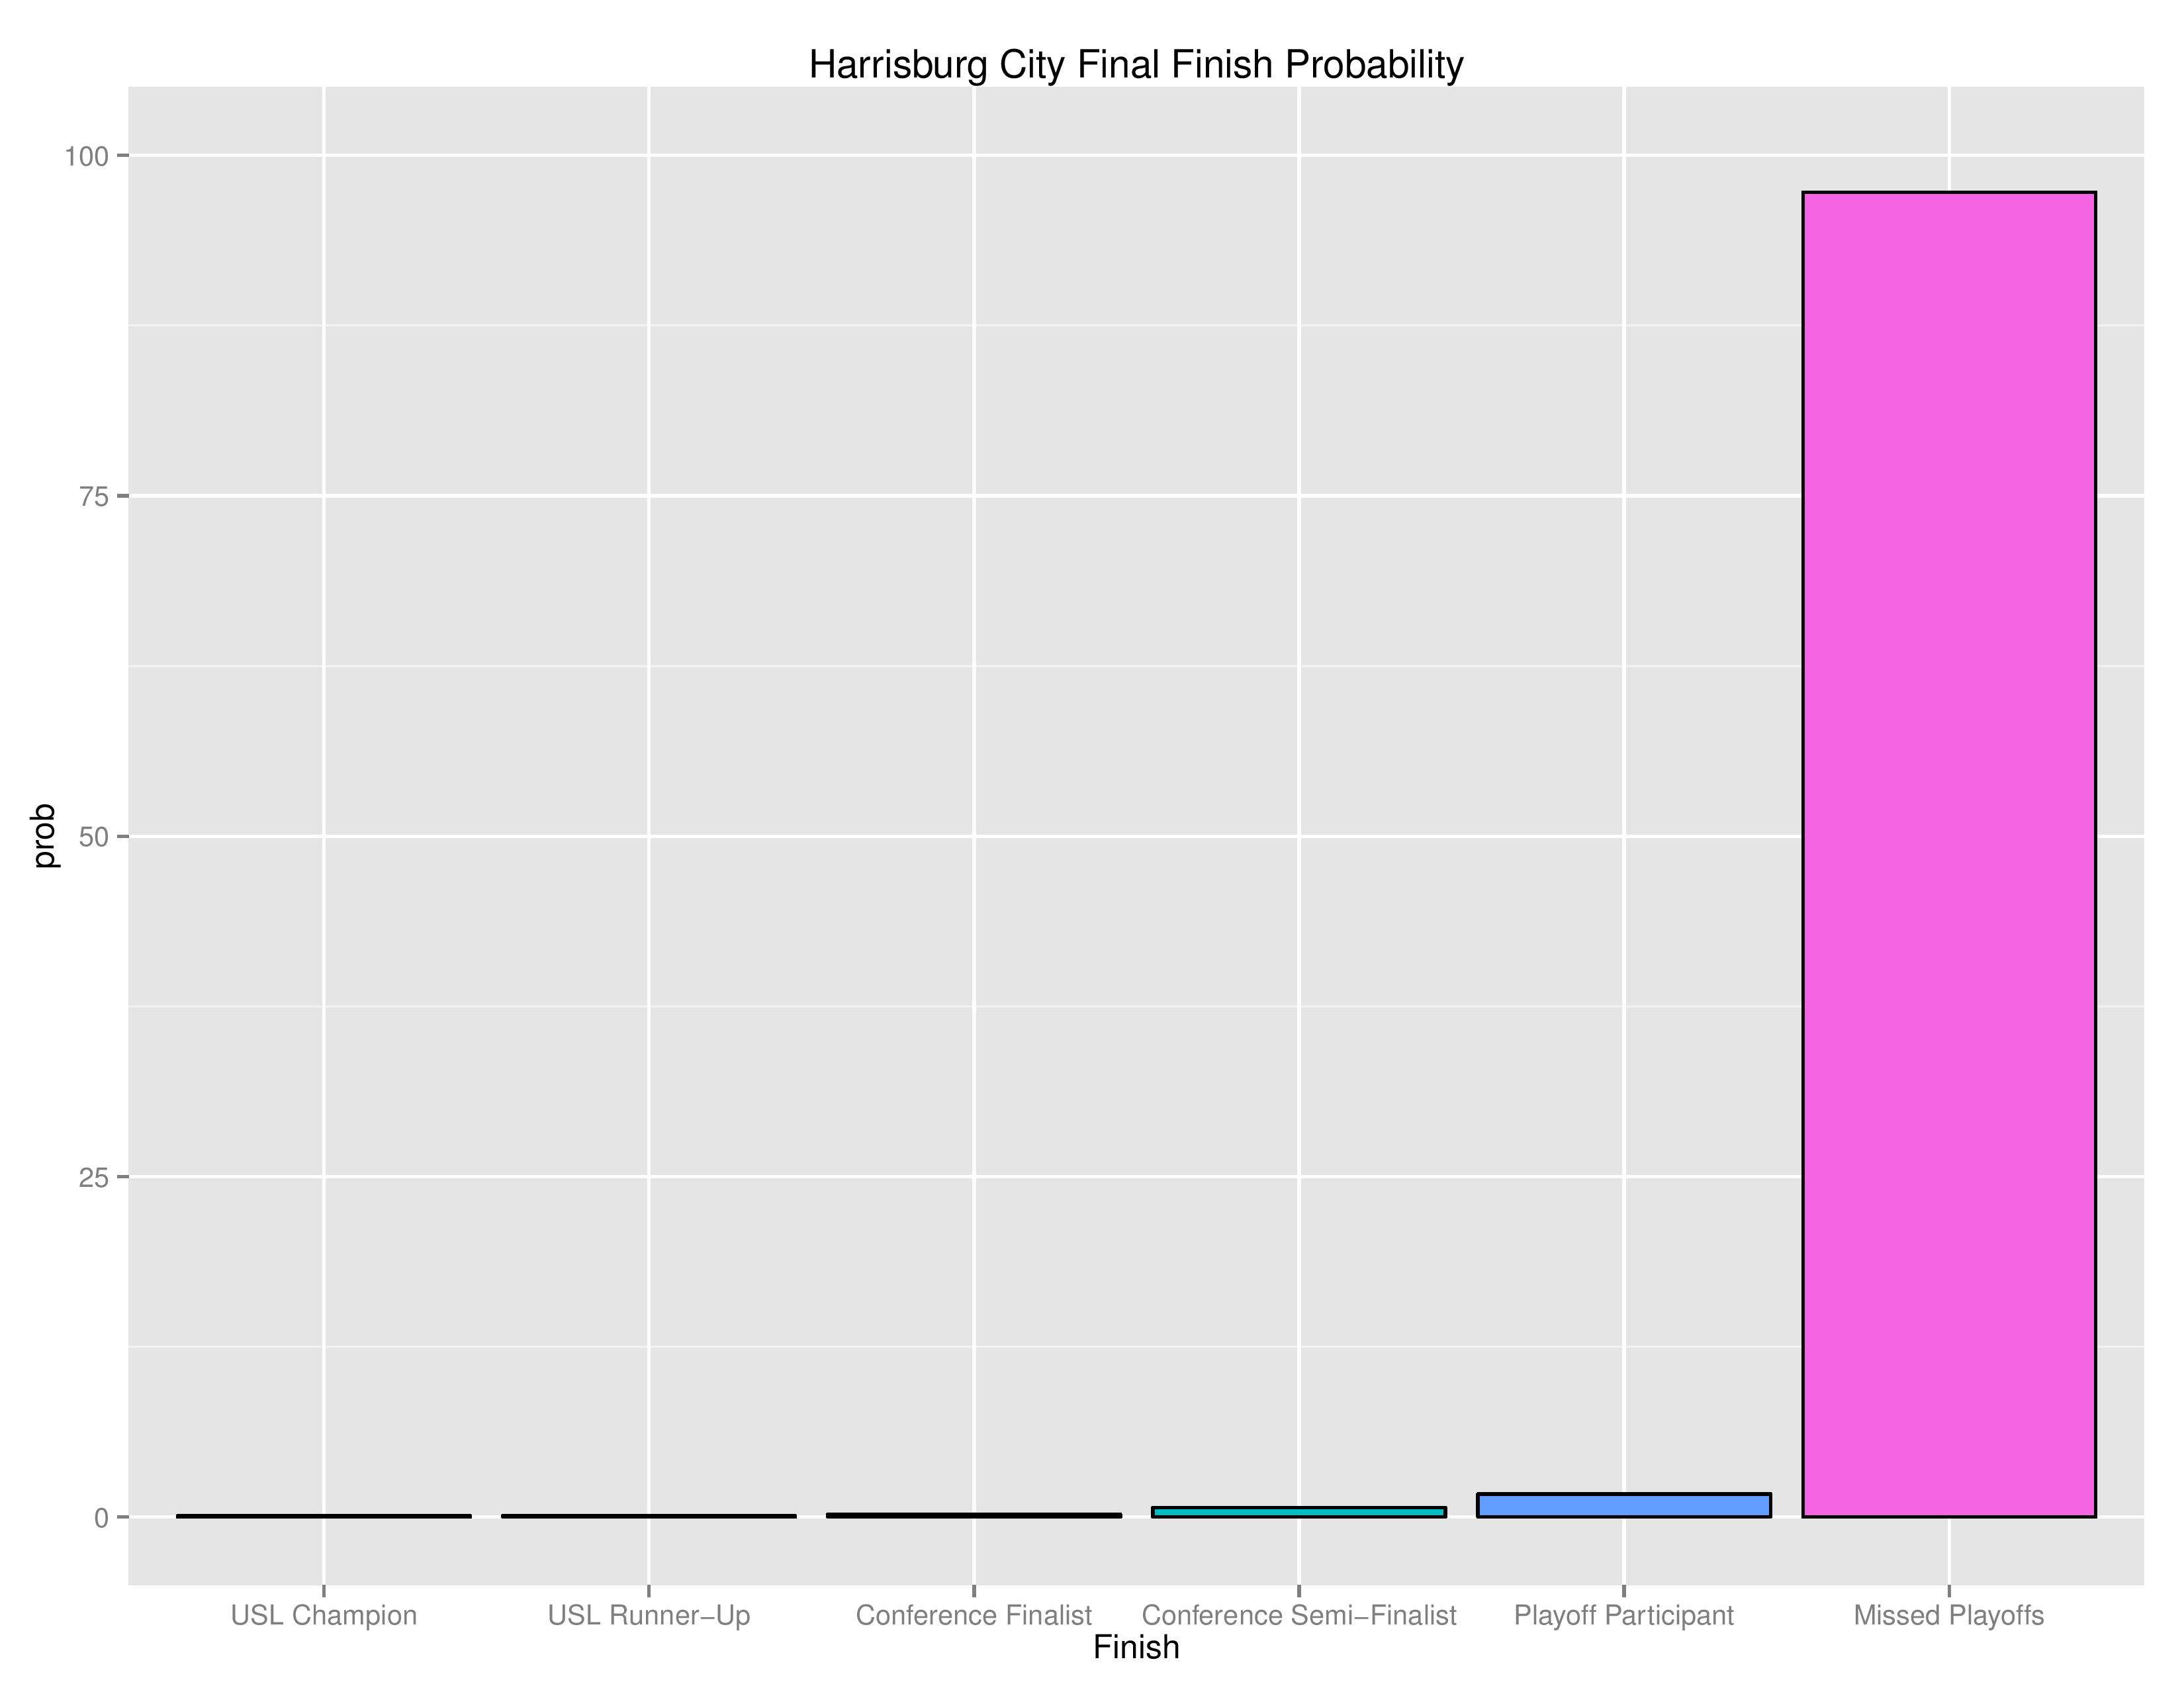
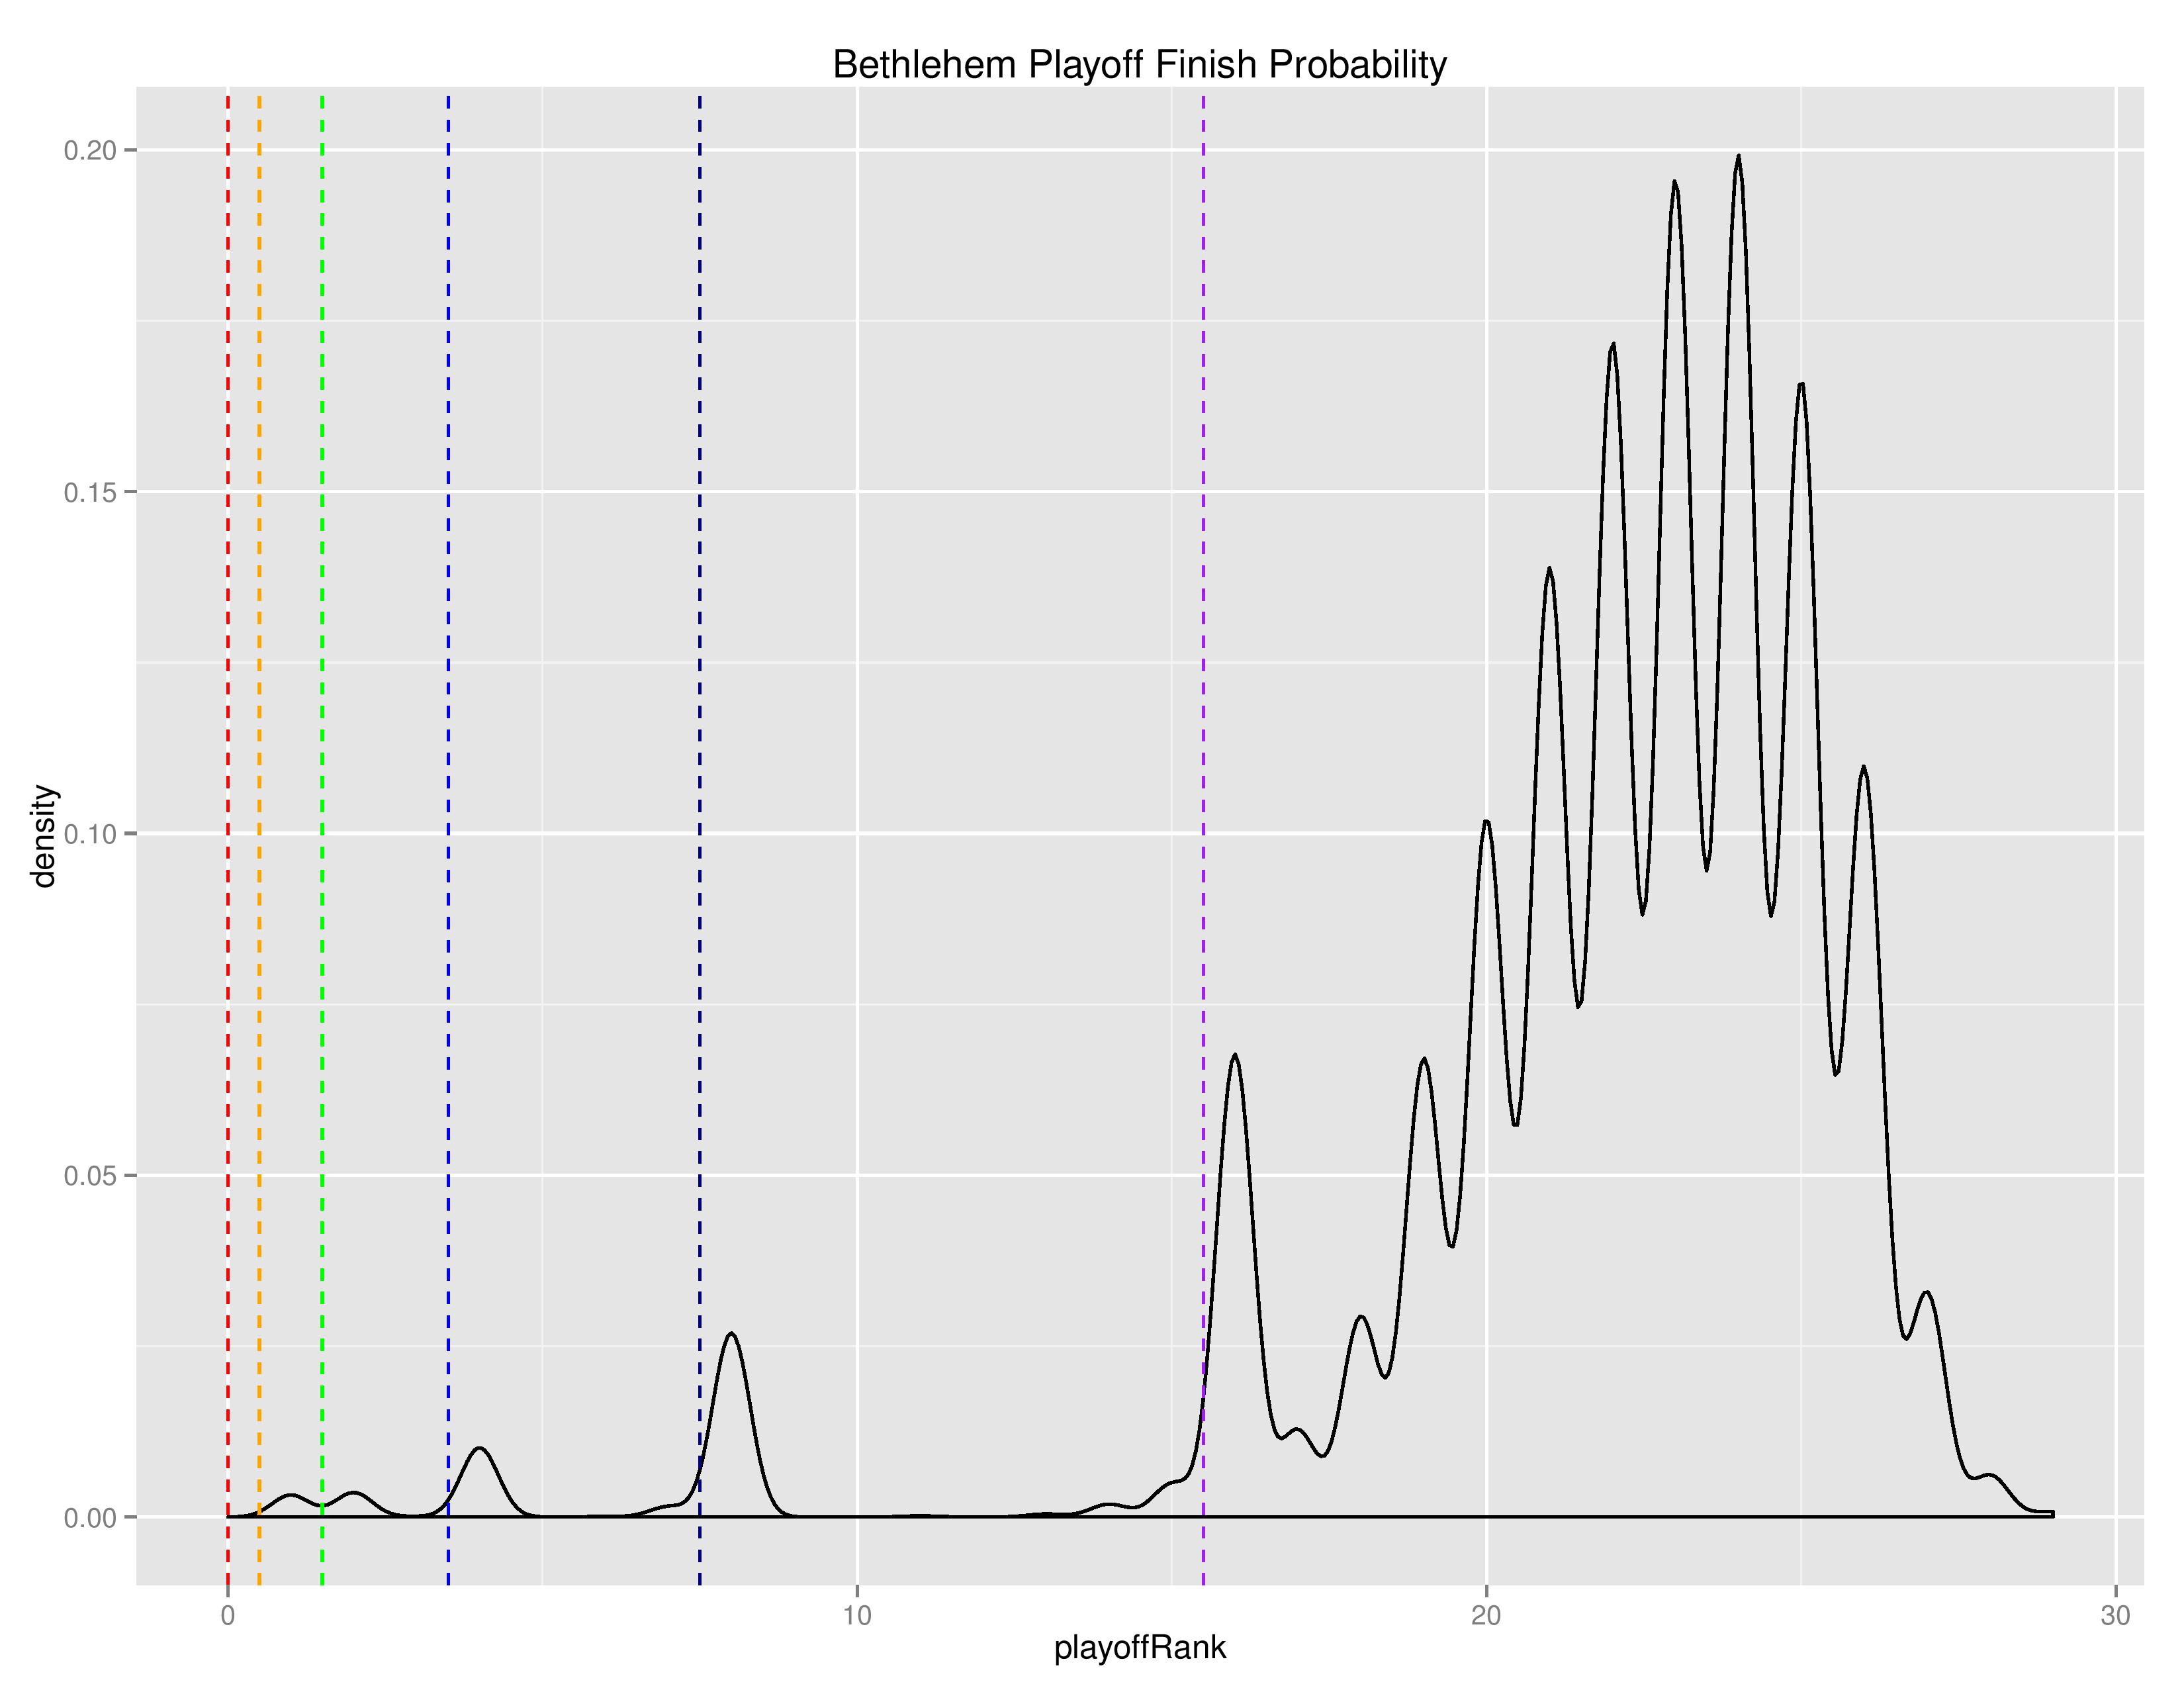
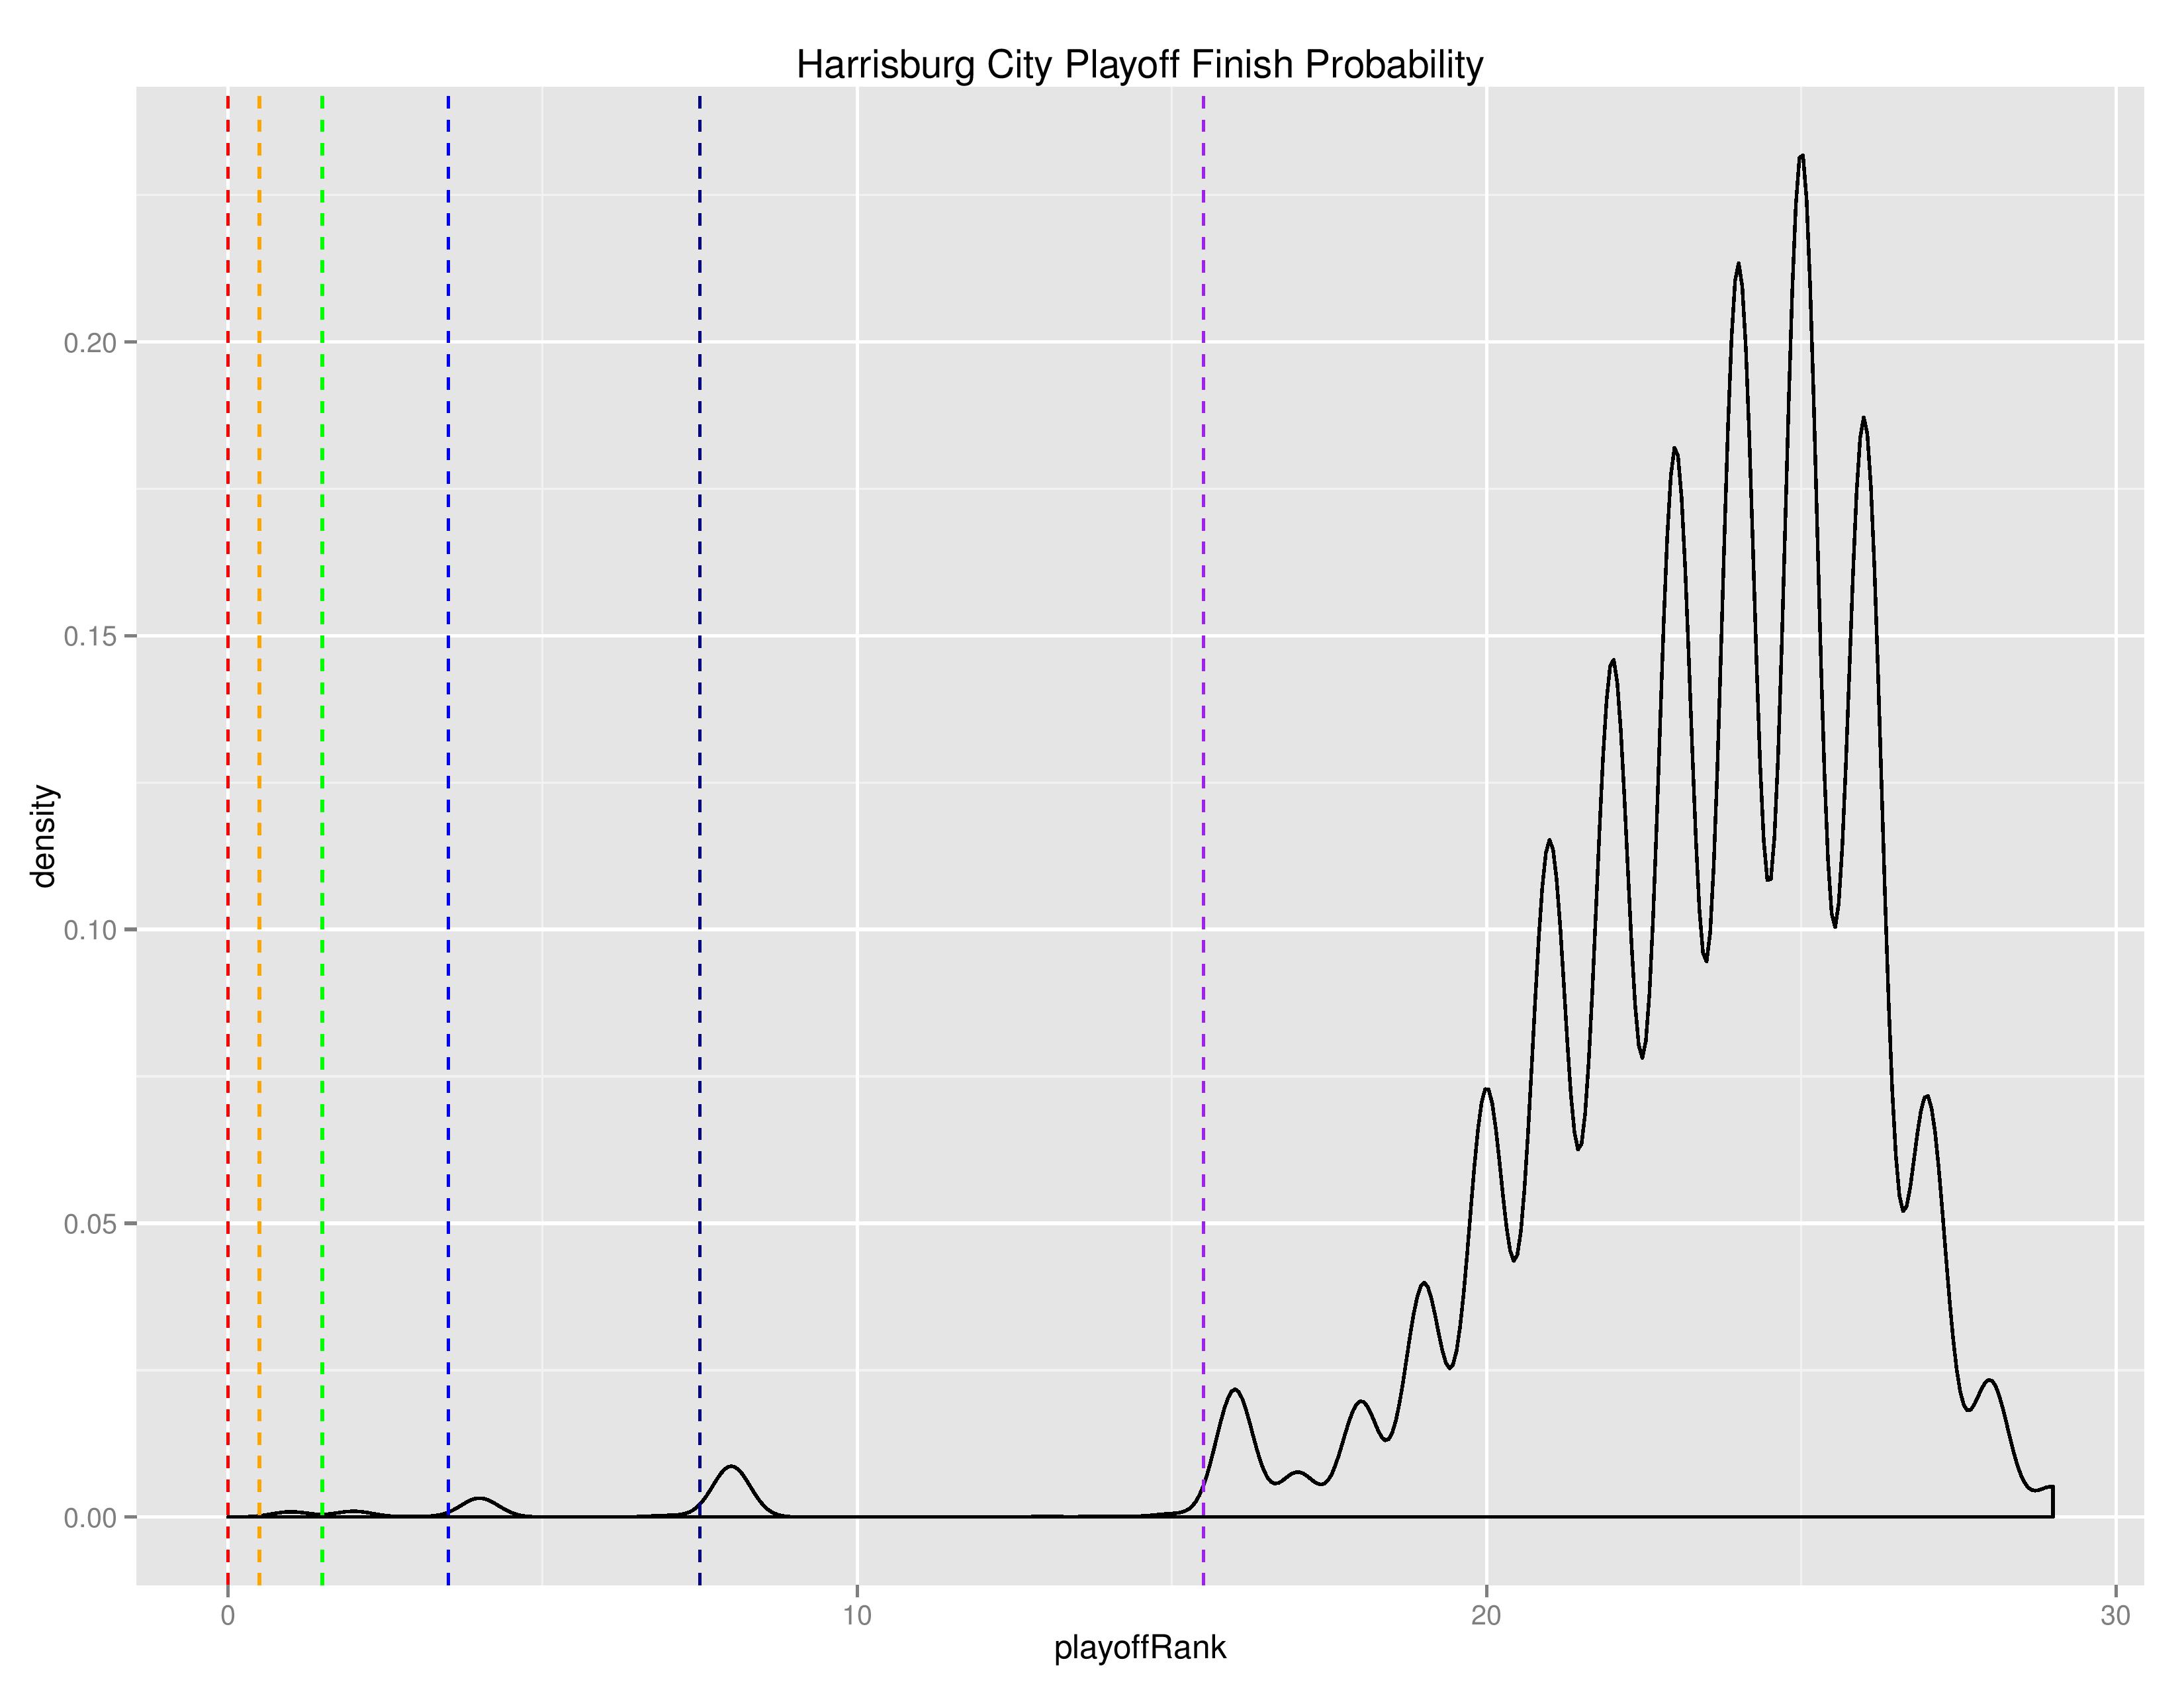
As with MLS, the below density charts show the relative probabilities of Bethlehem and Harrisburg finishing for their final playoff-rank.
The following are the upcoming matches and associated probabilities for Bethlehem and Harrisburg City.
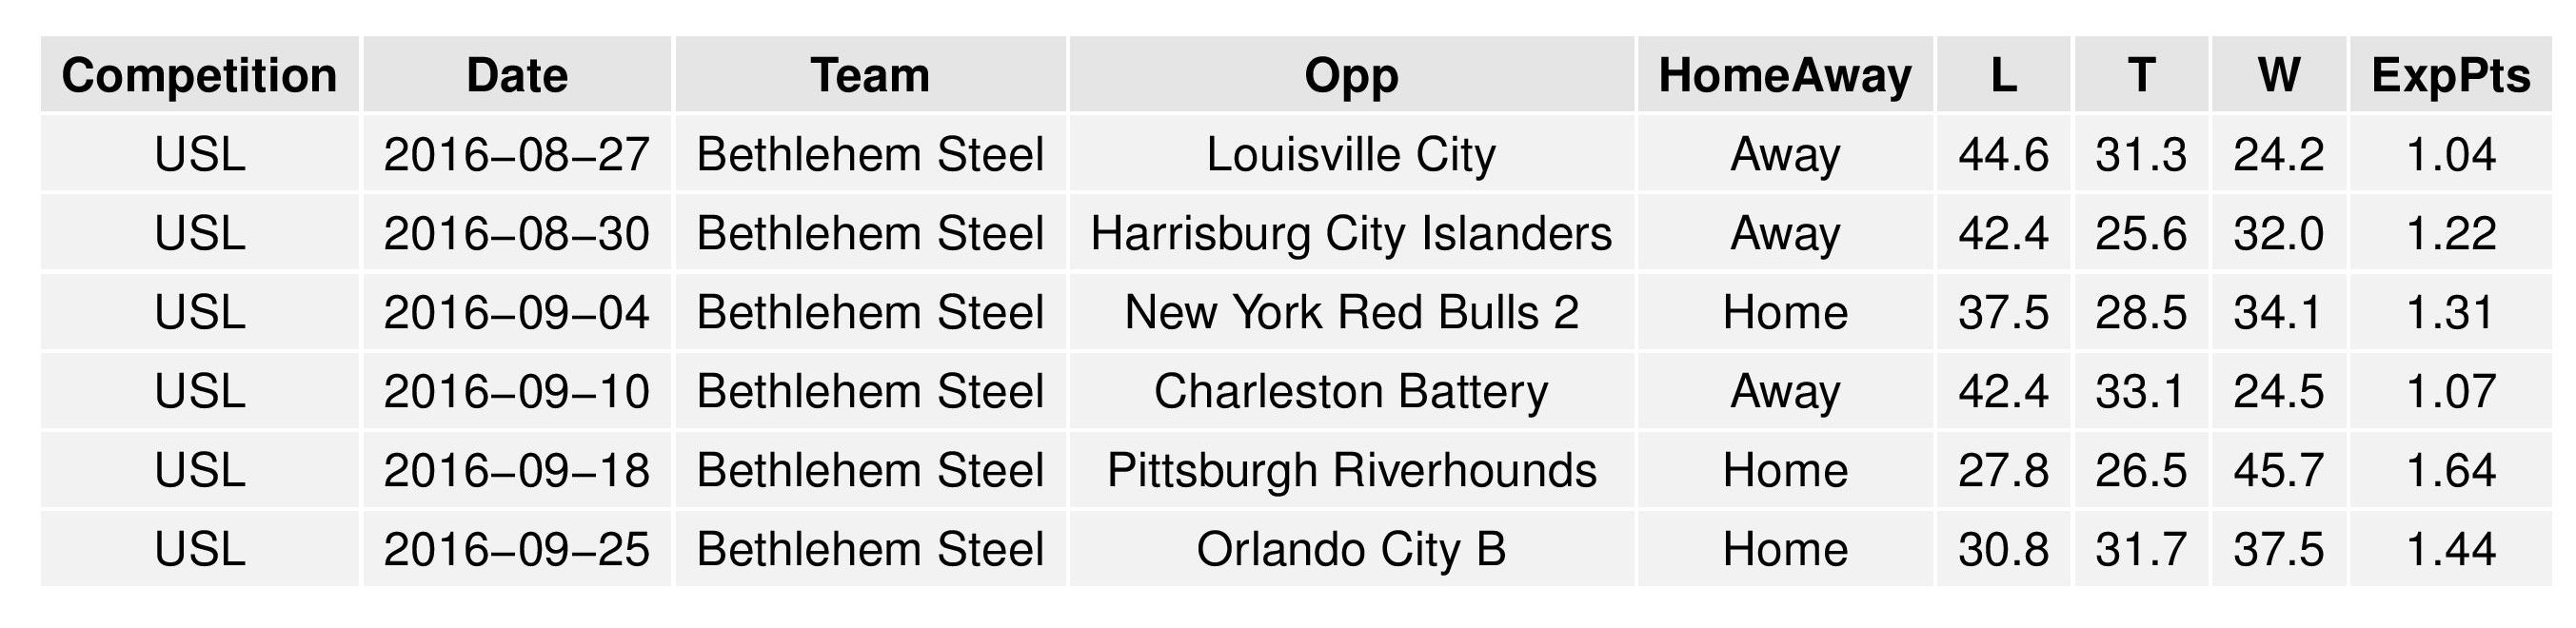
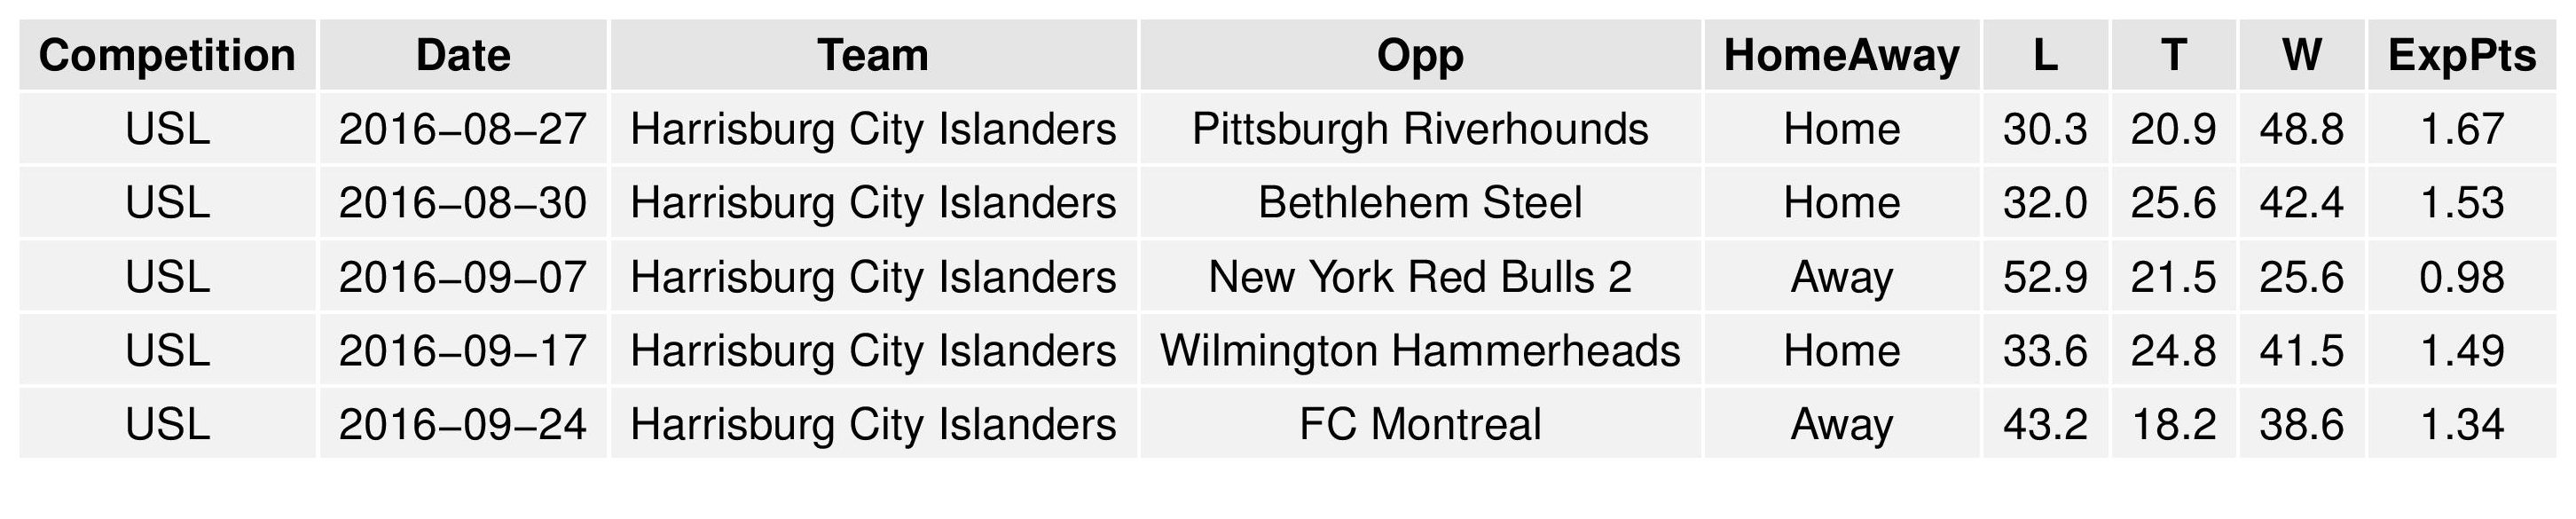
The following tables show the average simulation results. They are divided into two tables to present better to your screen.
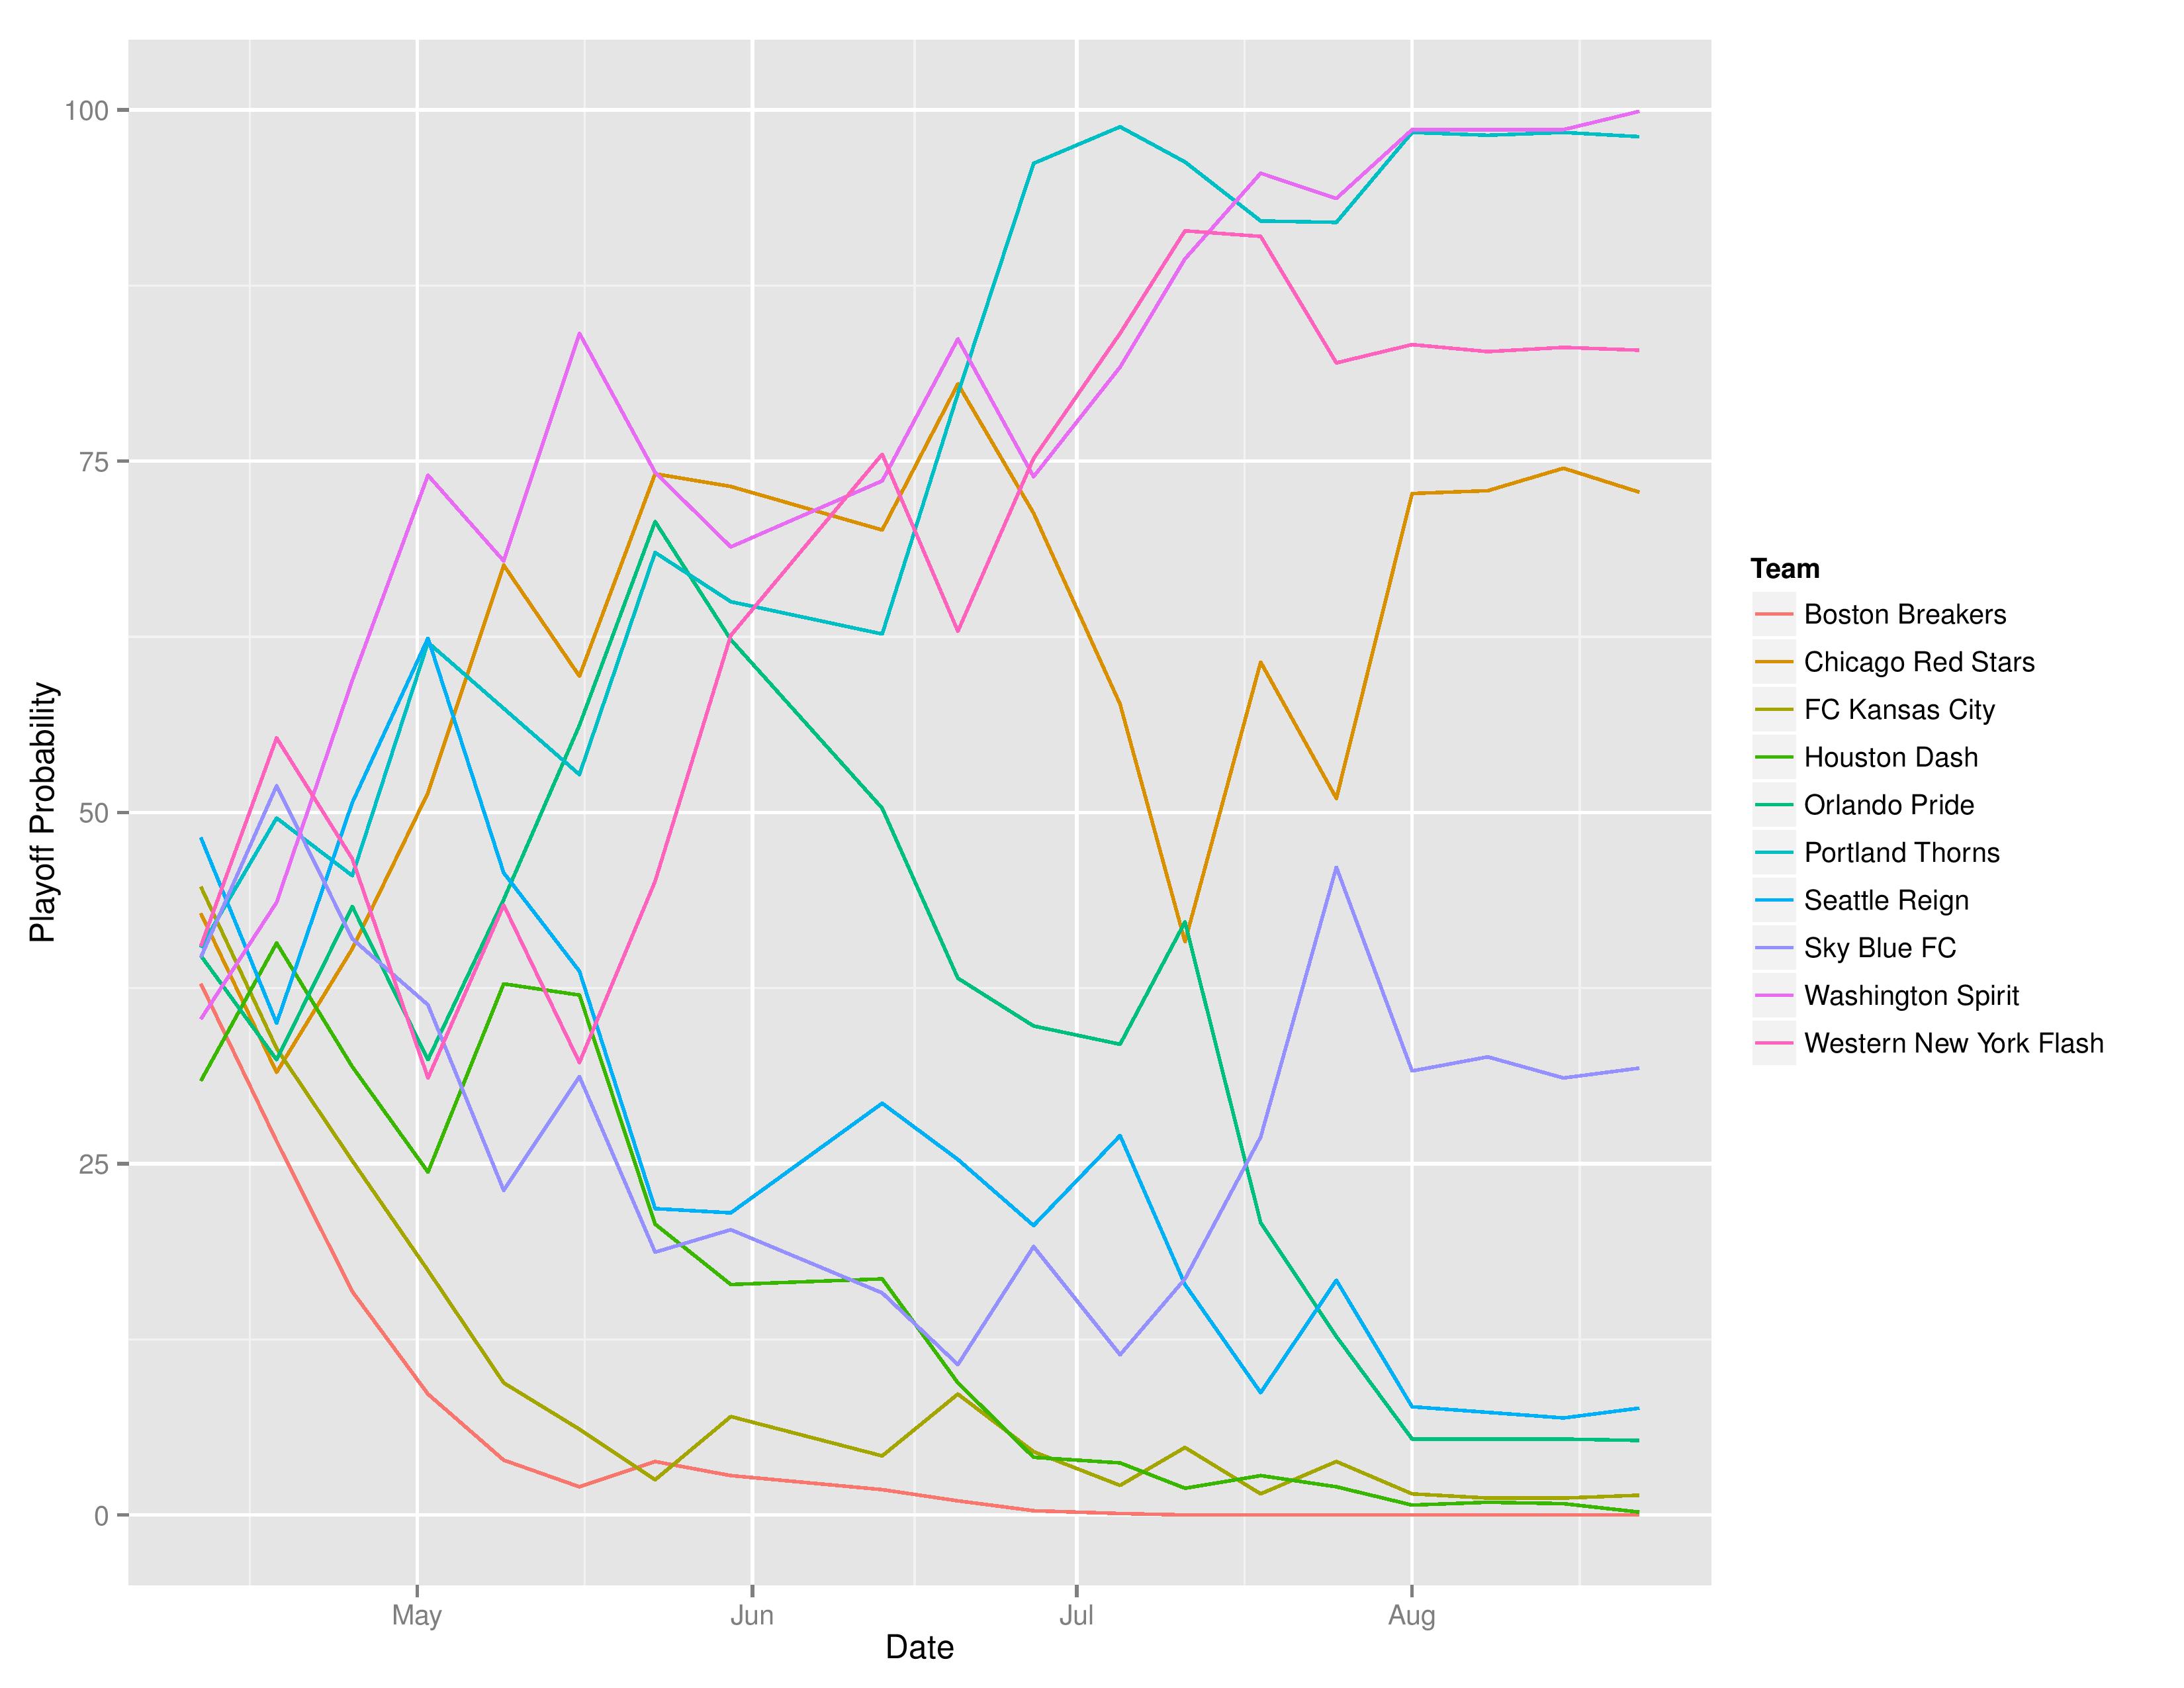
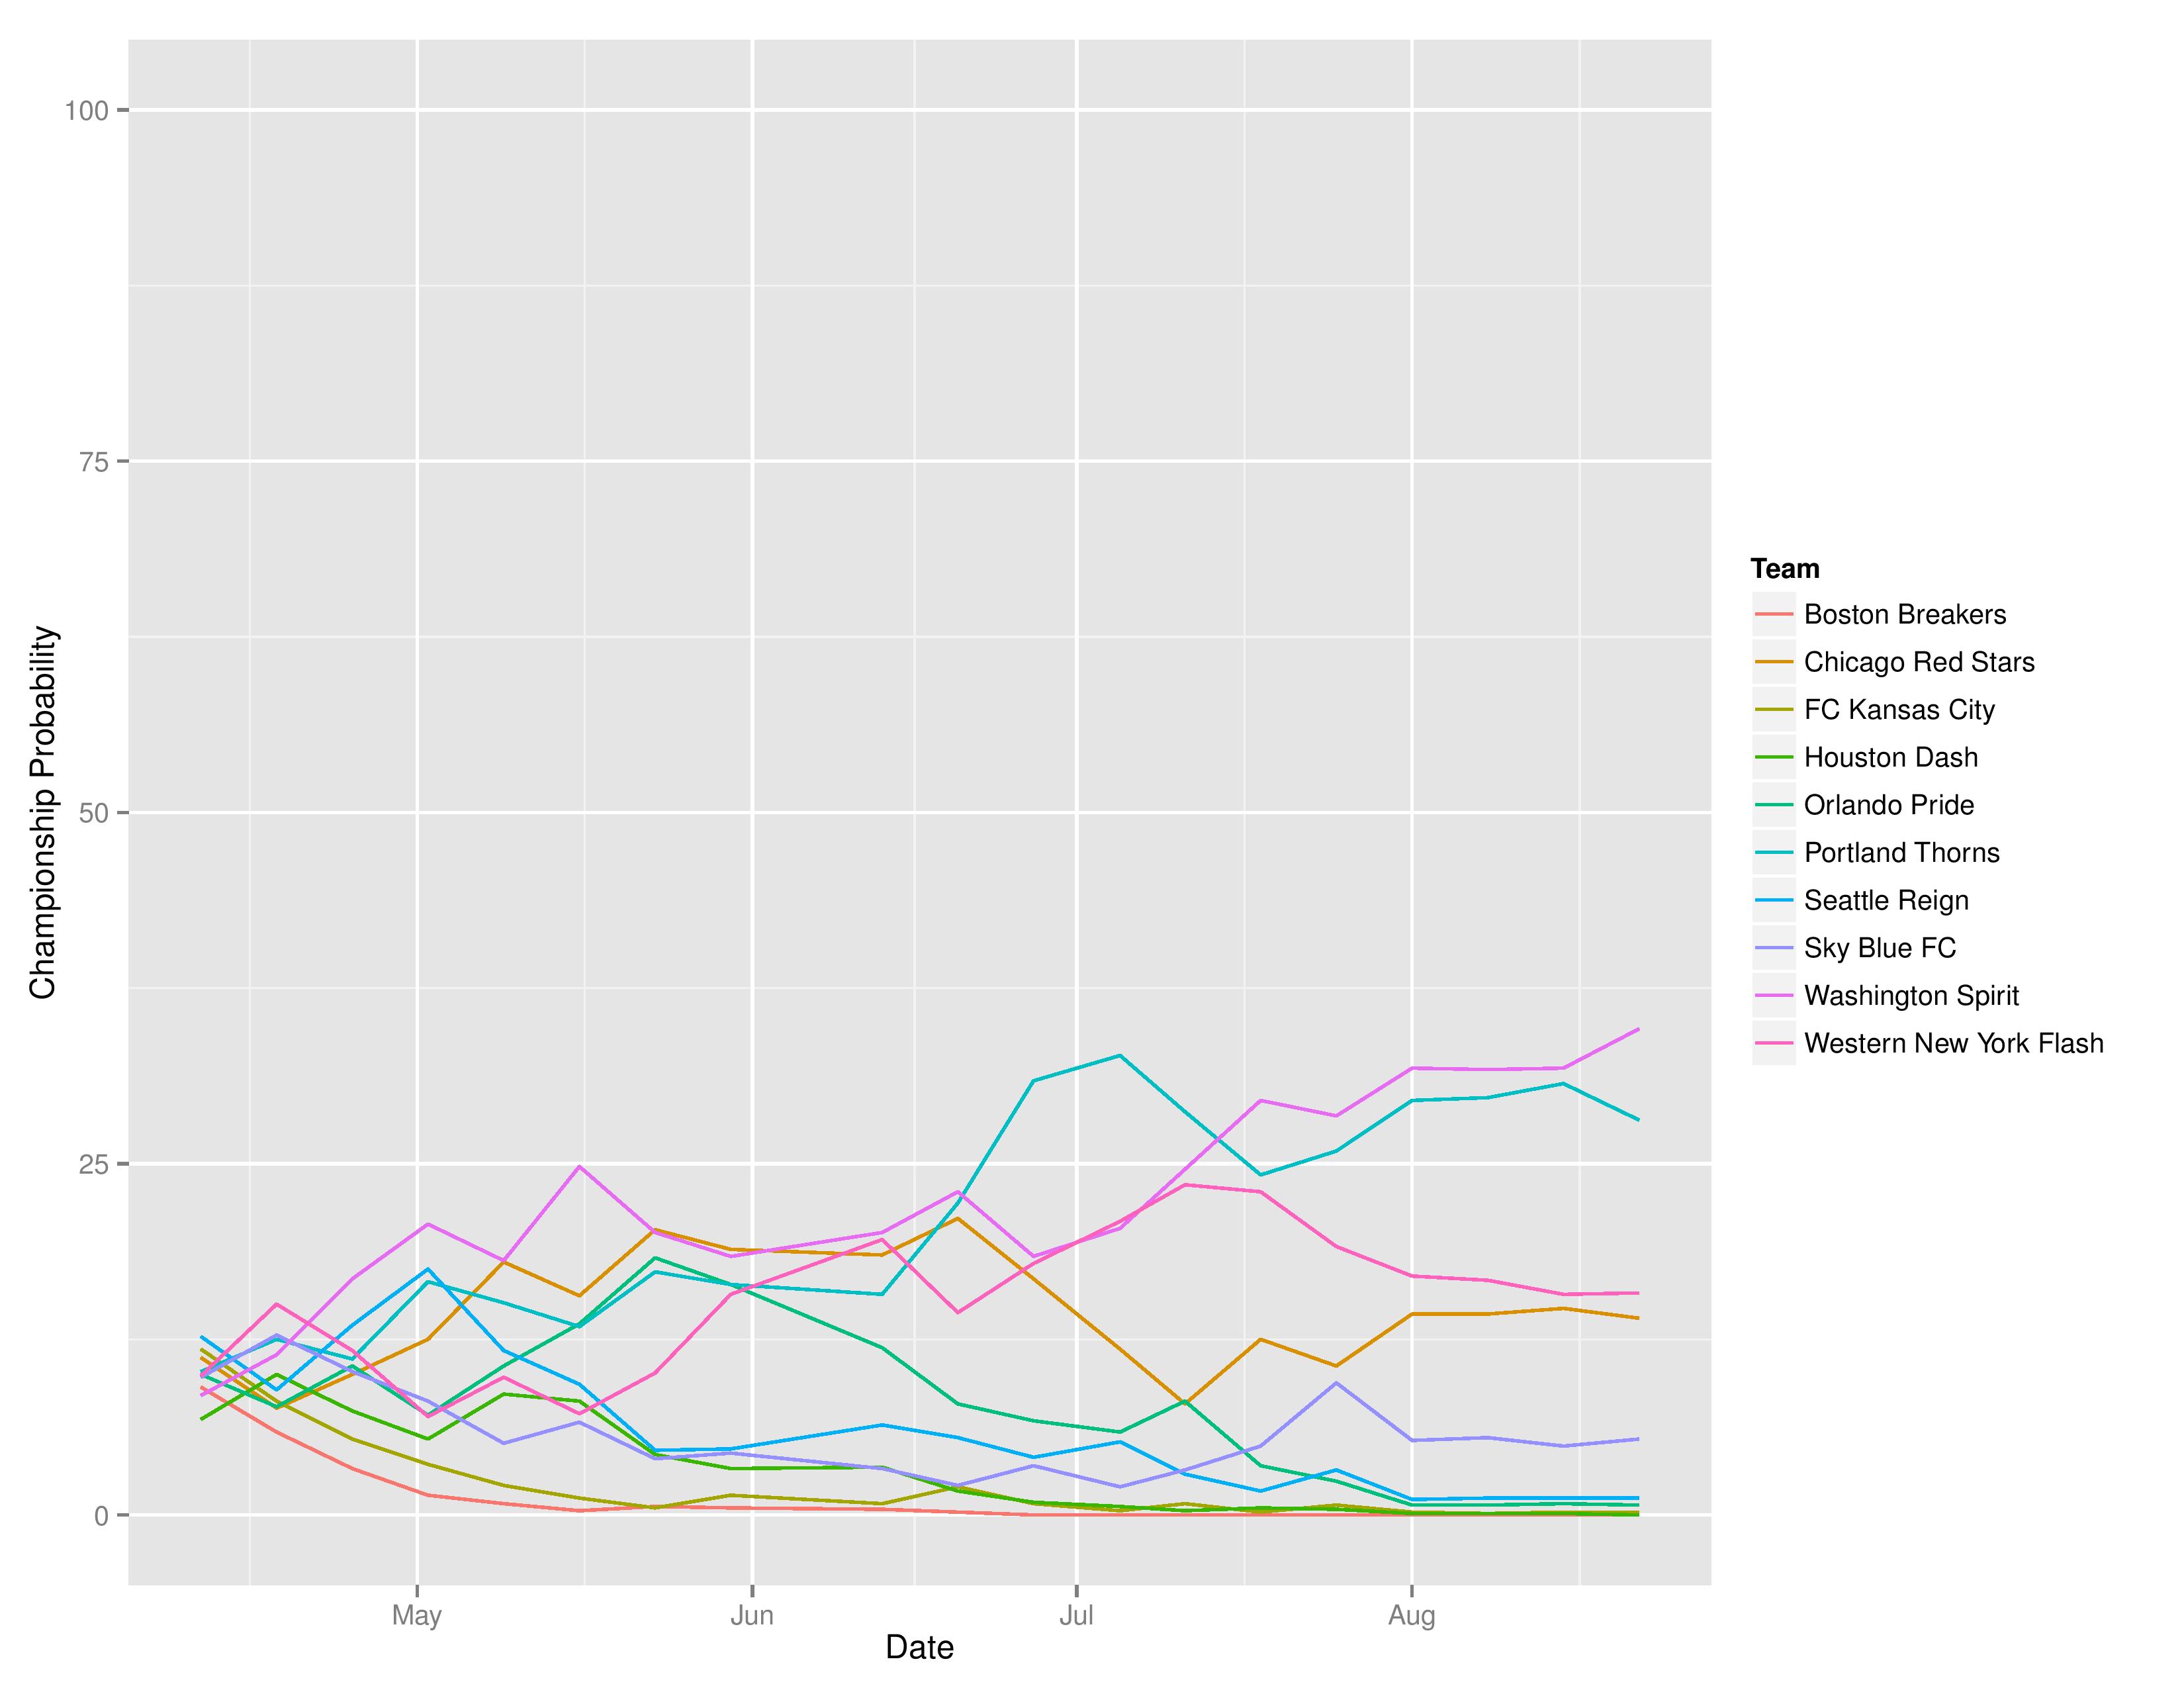
Changes over time
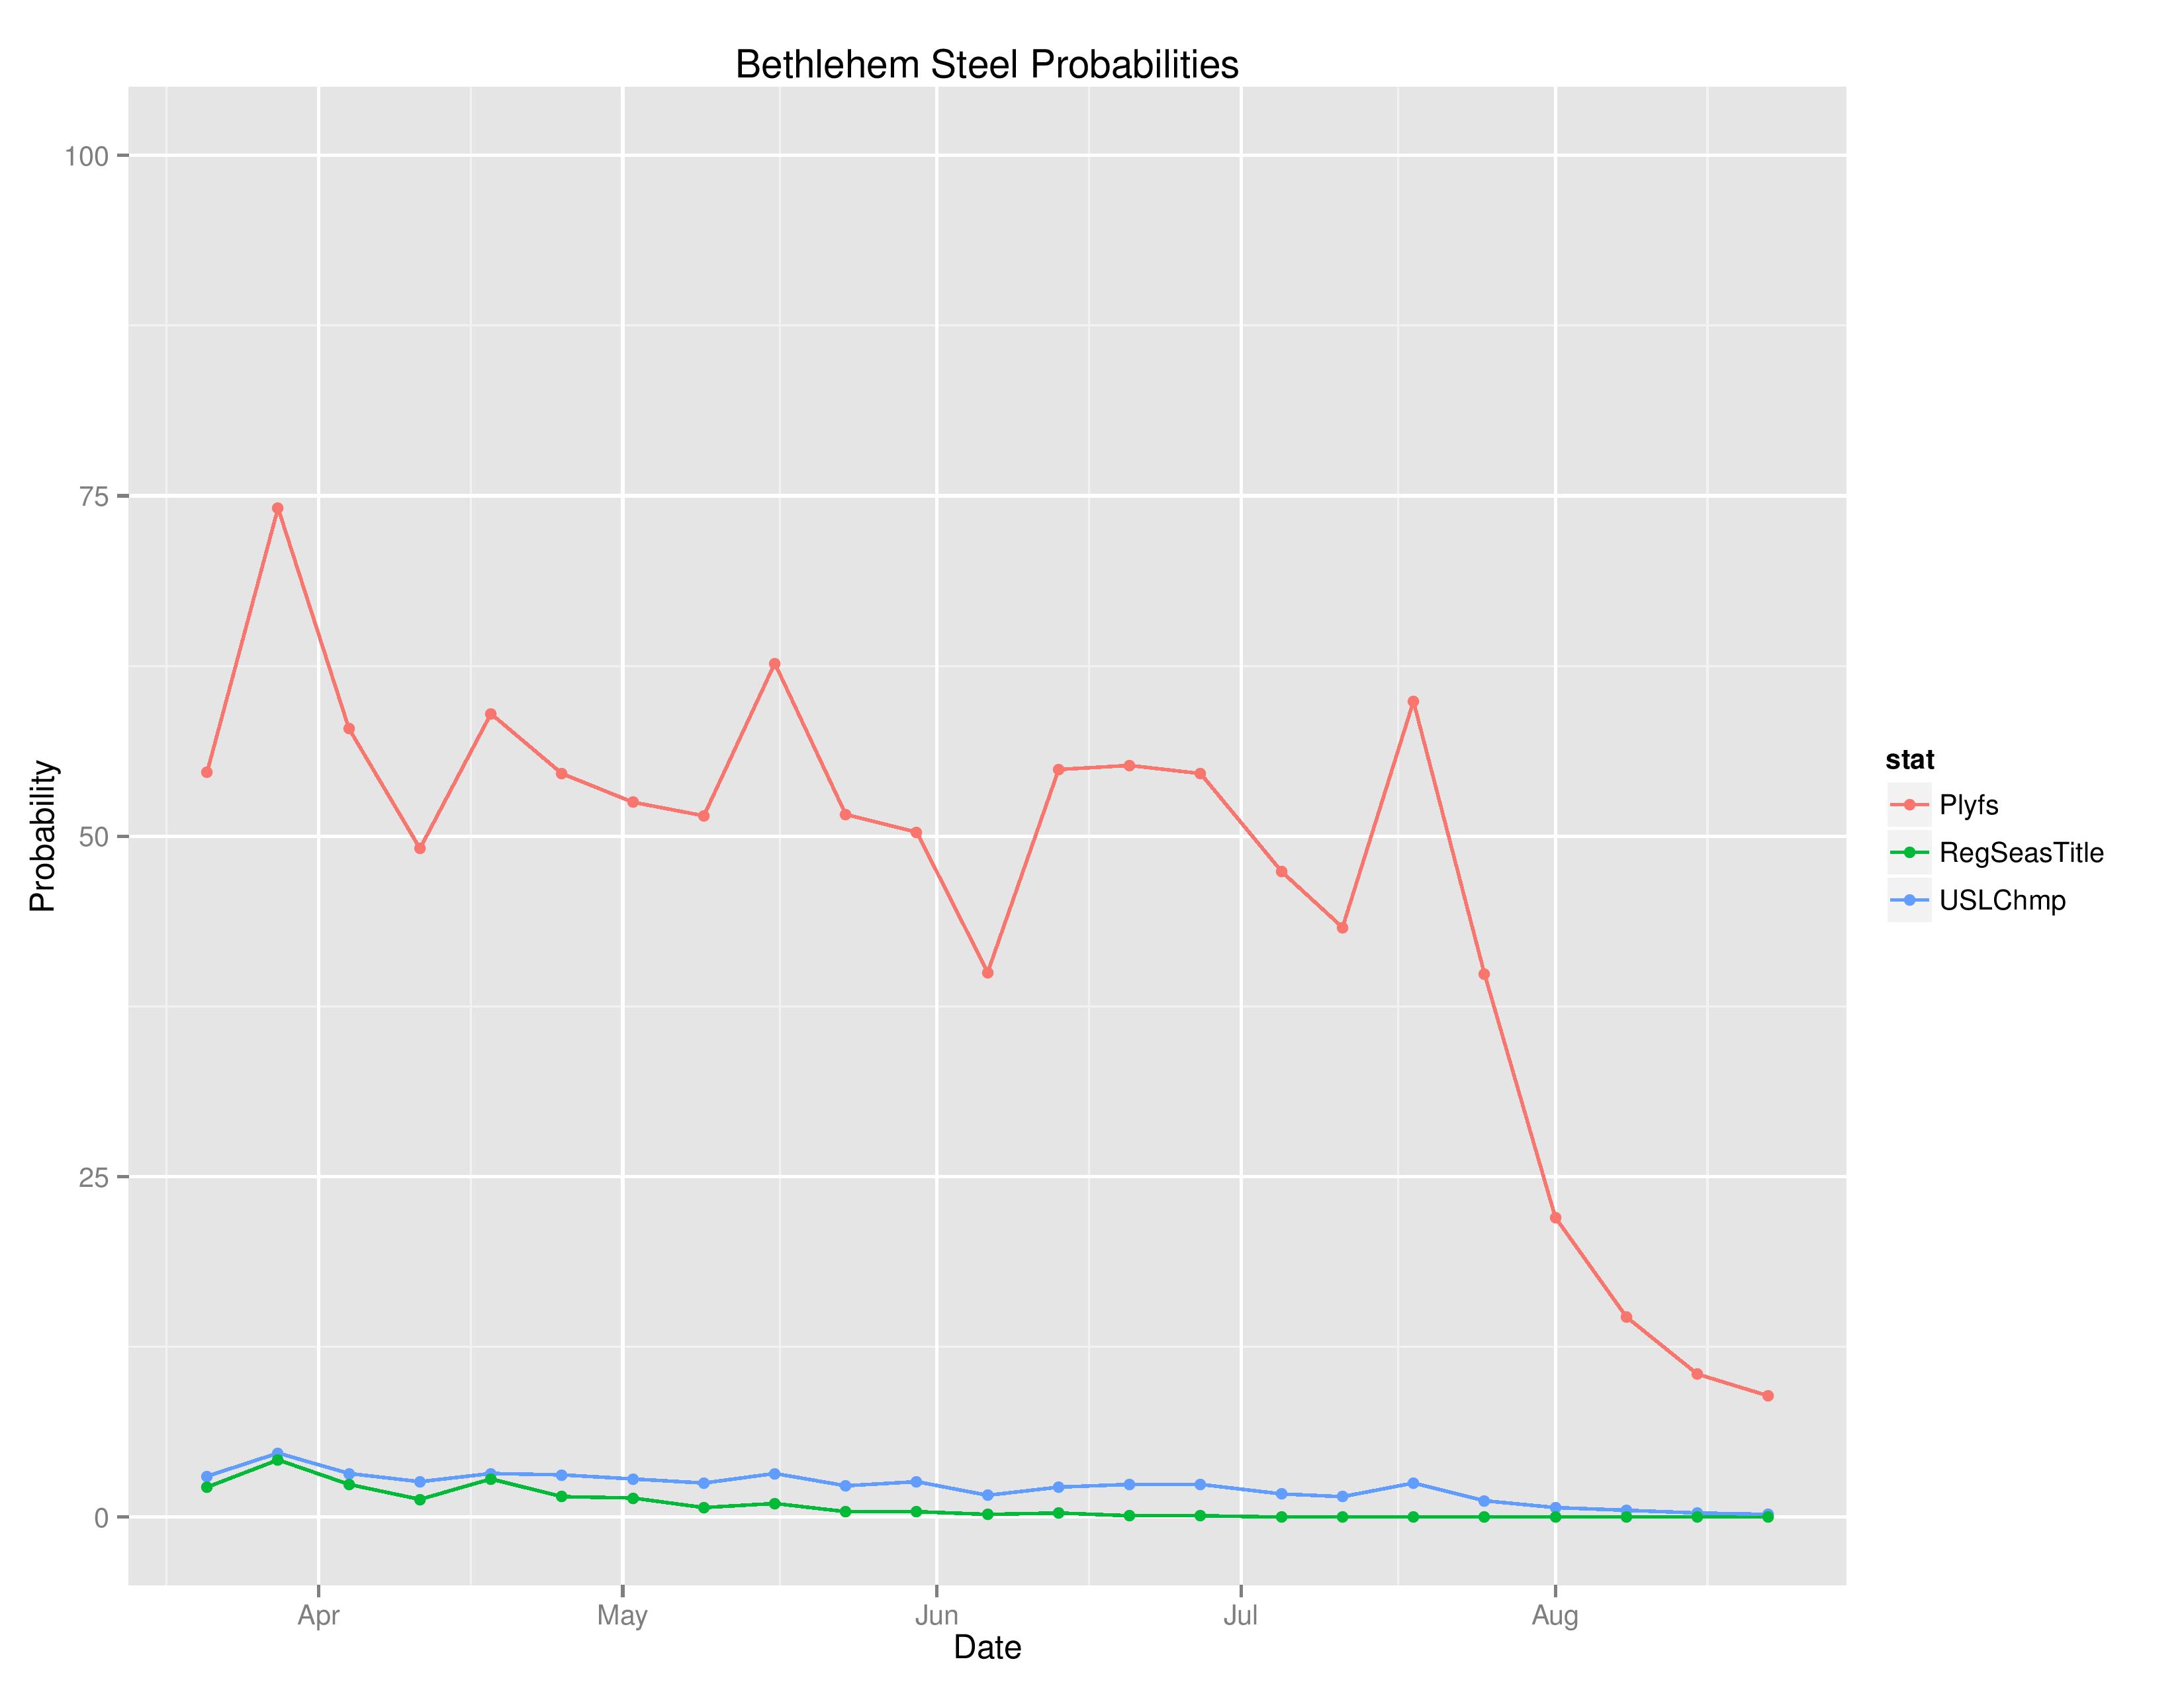
Below shows the probabilities of various outcomes for Bethlehem over the course of the season.
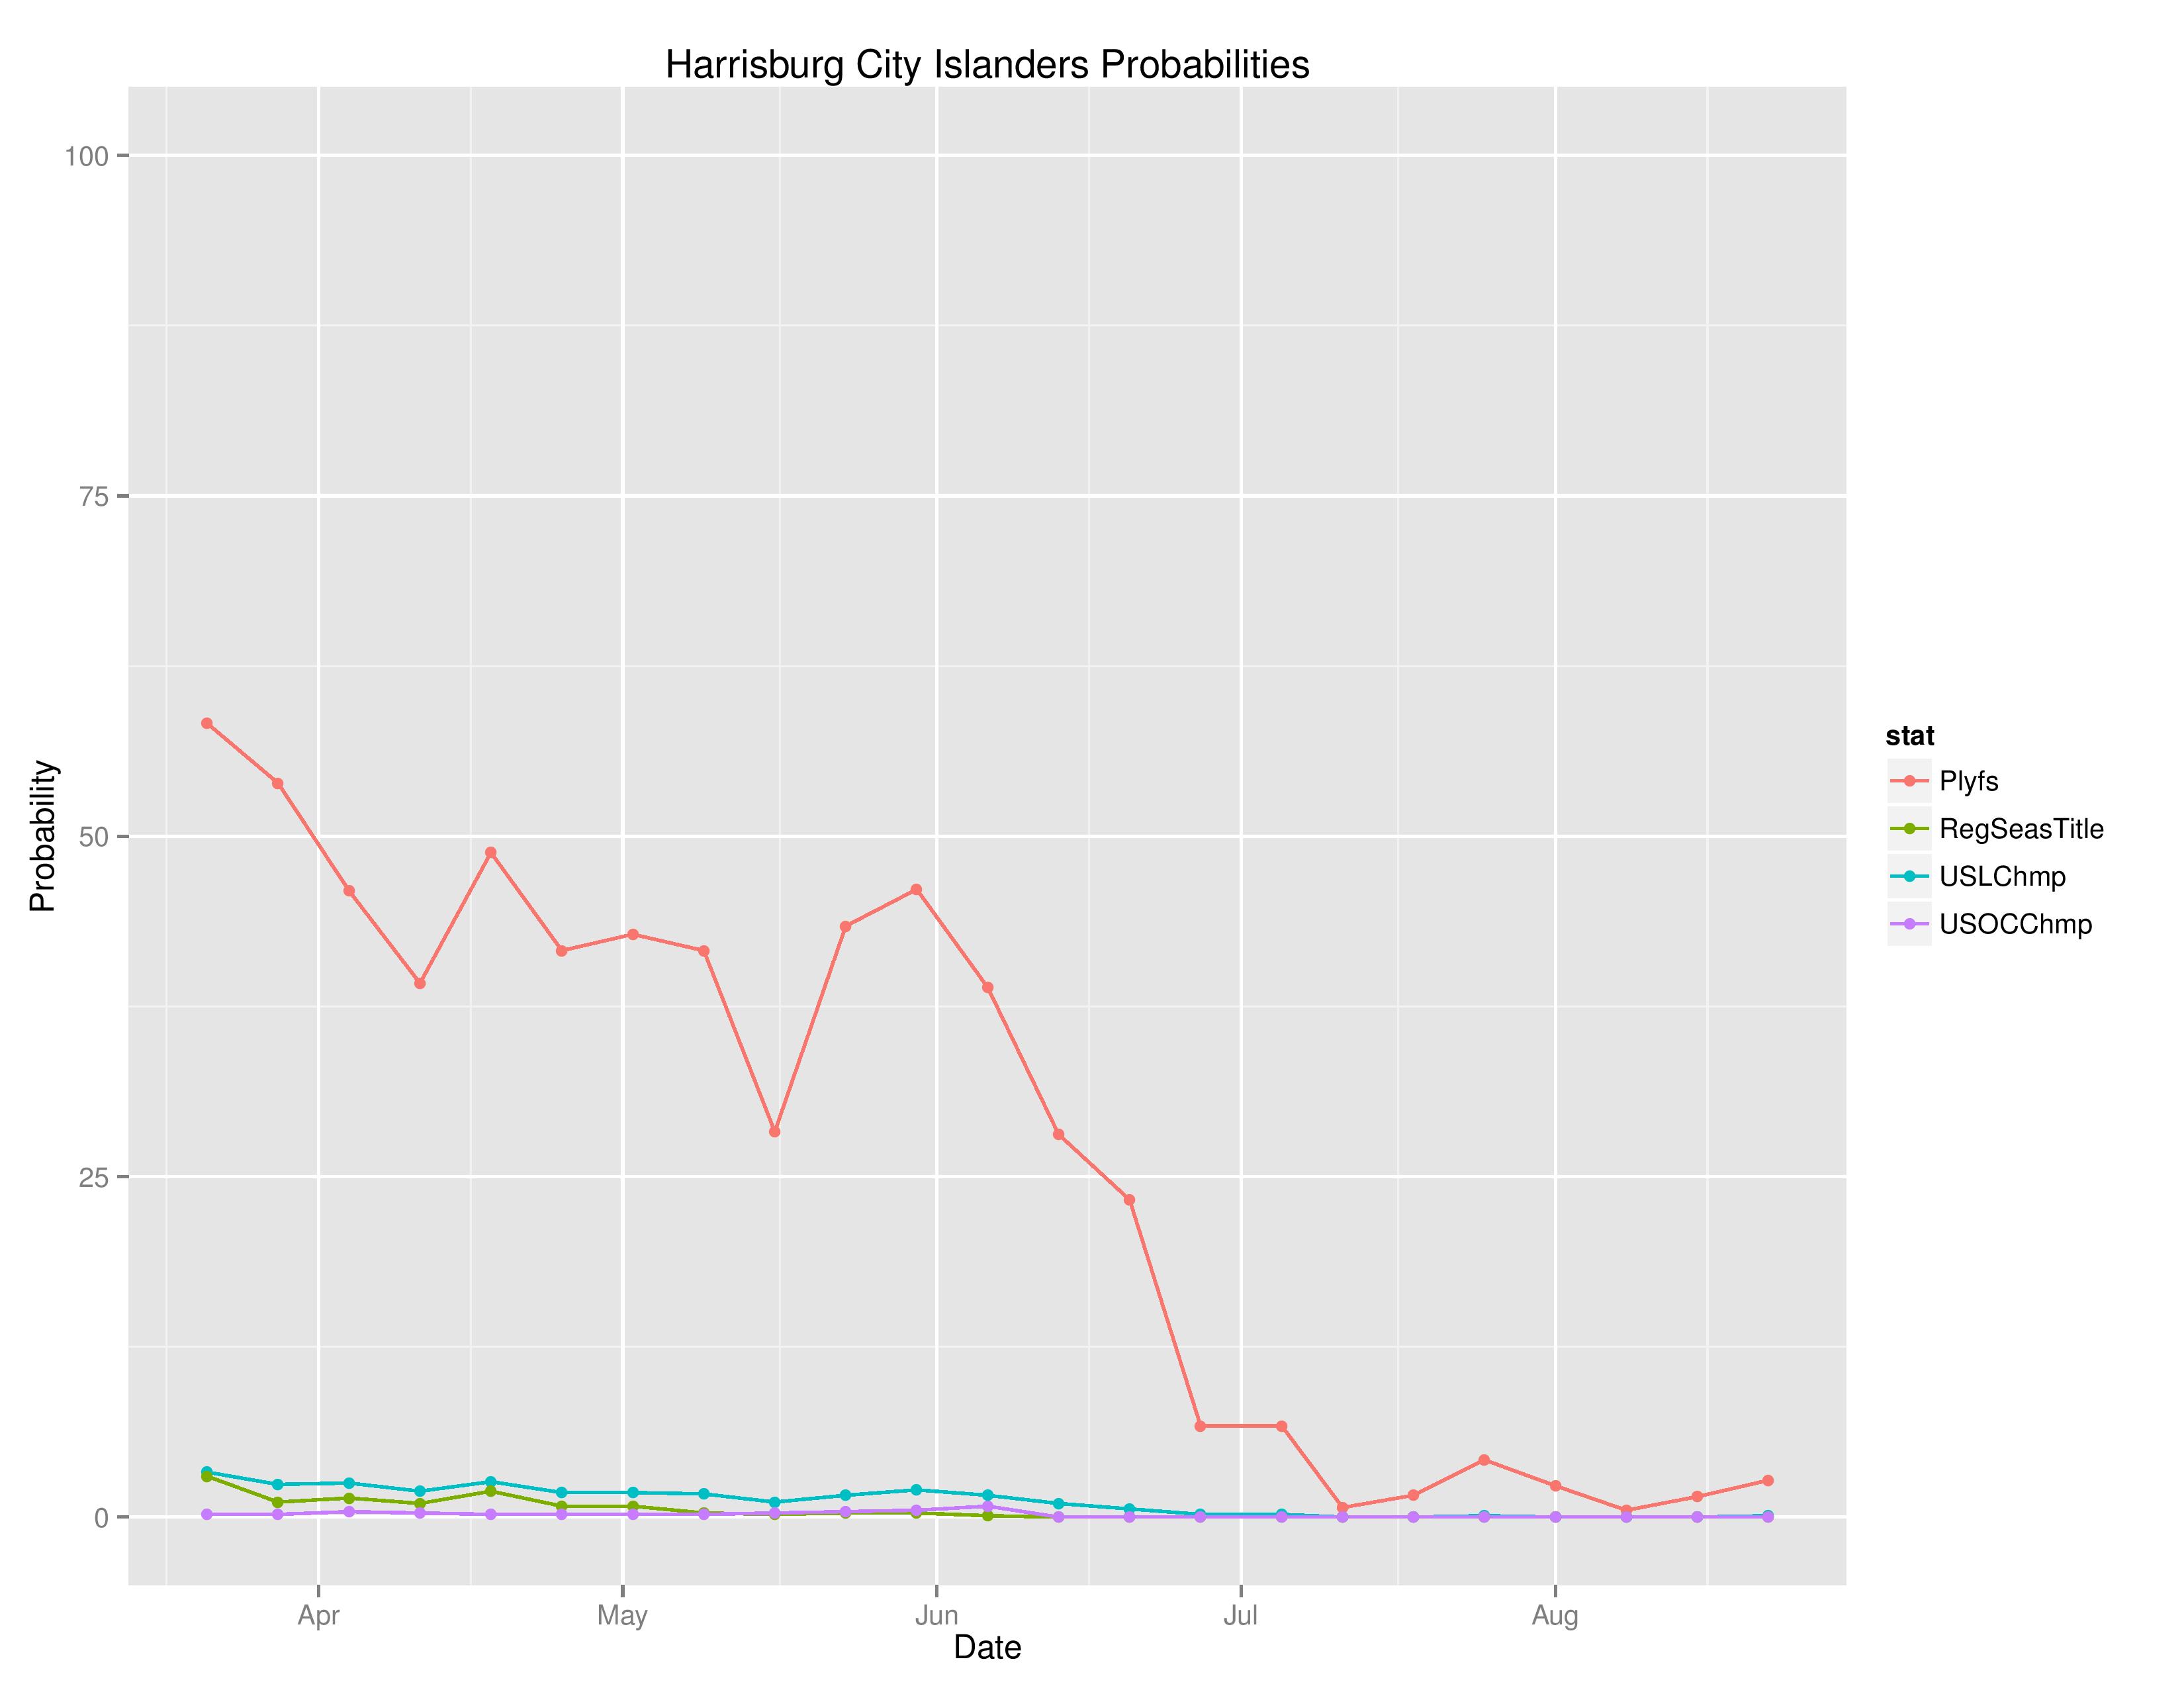
Below shows the probabilities of various outcomes for Harrisburg over the course of the season.
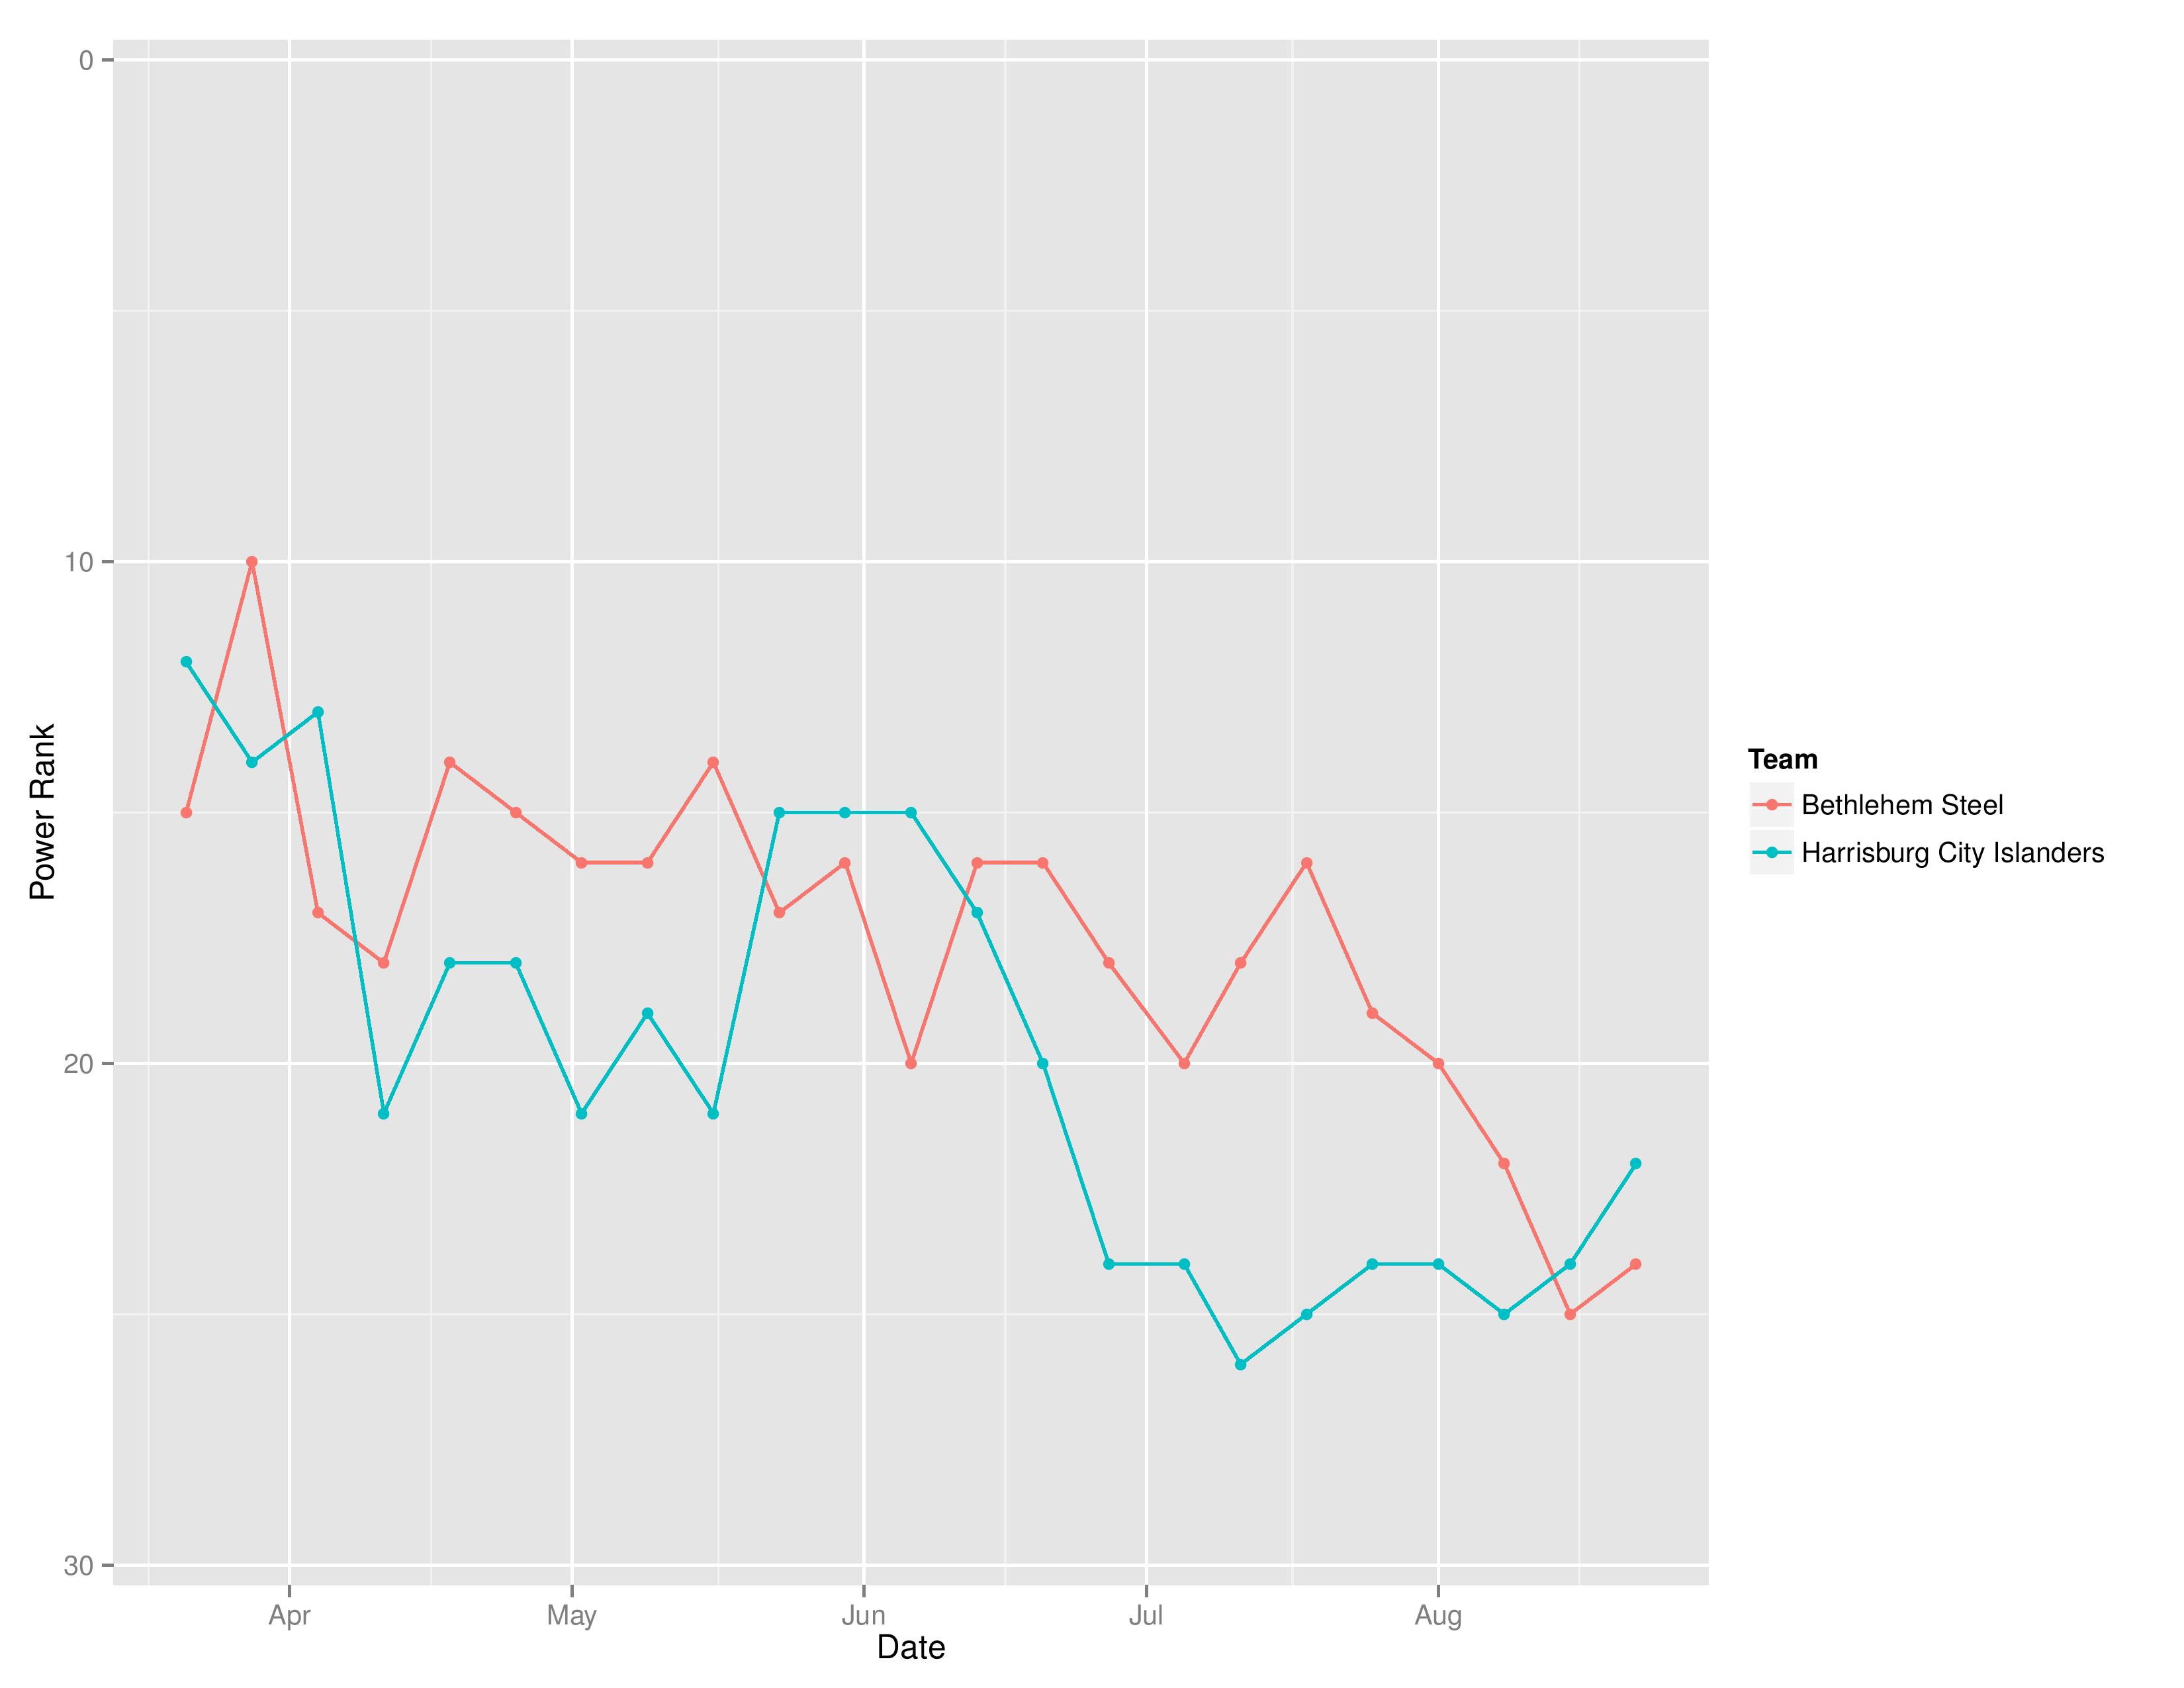
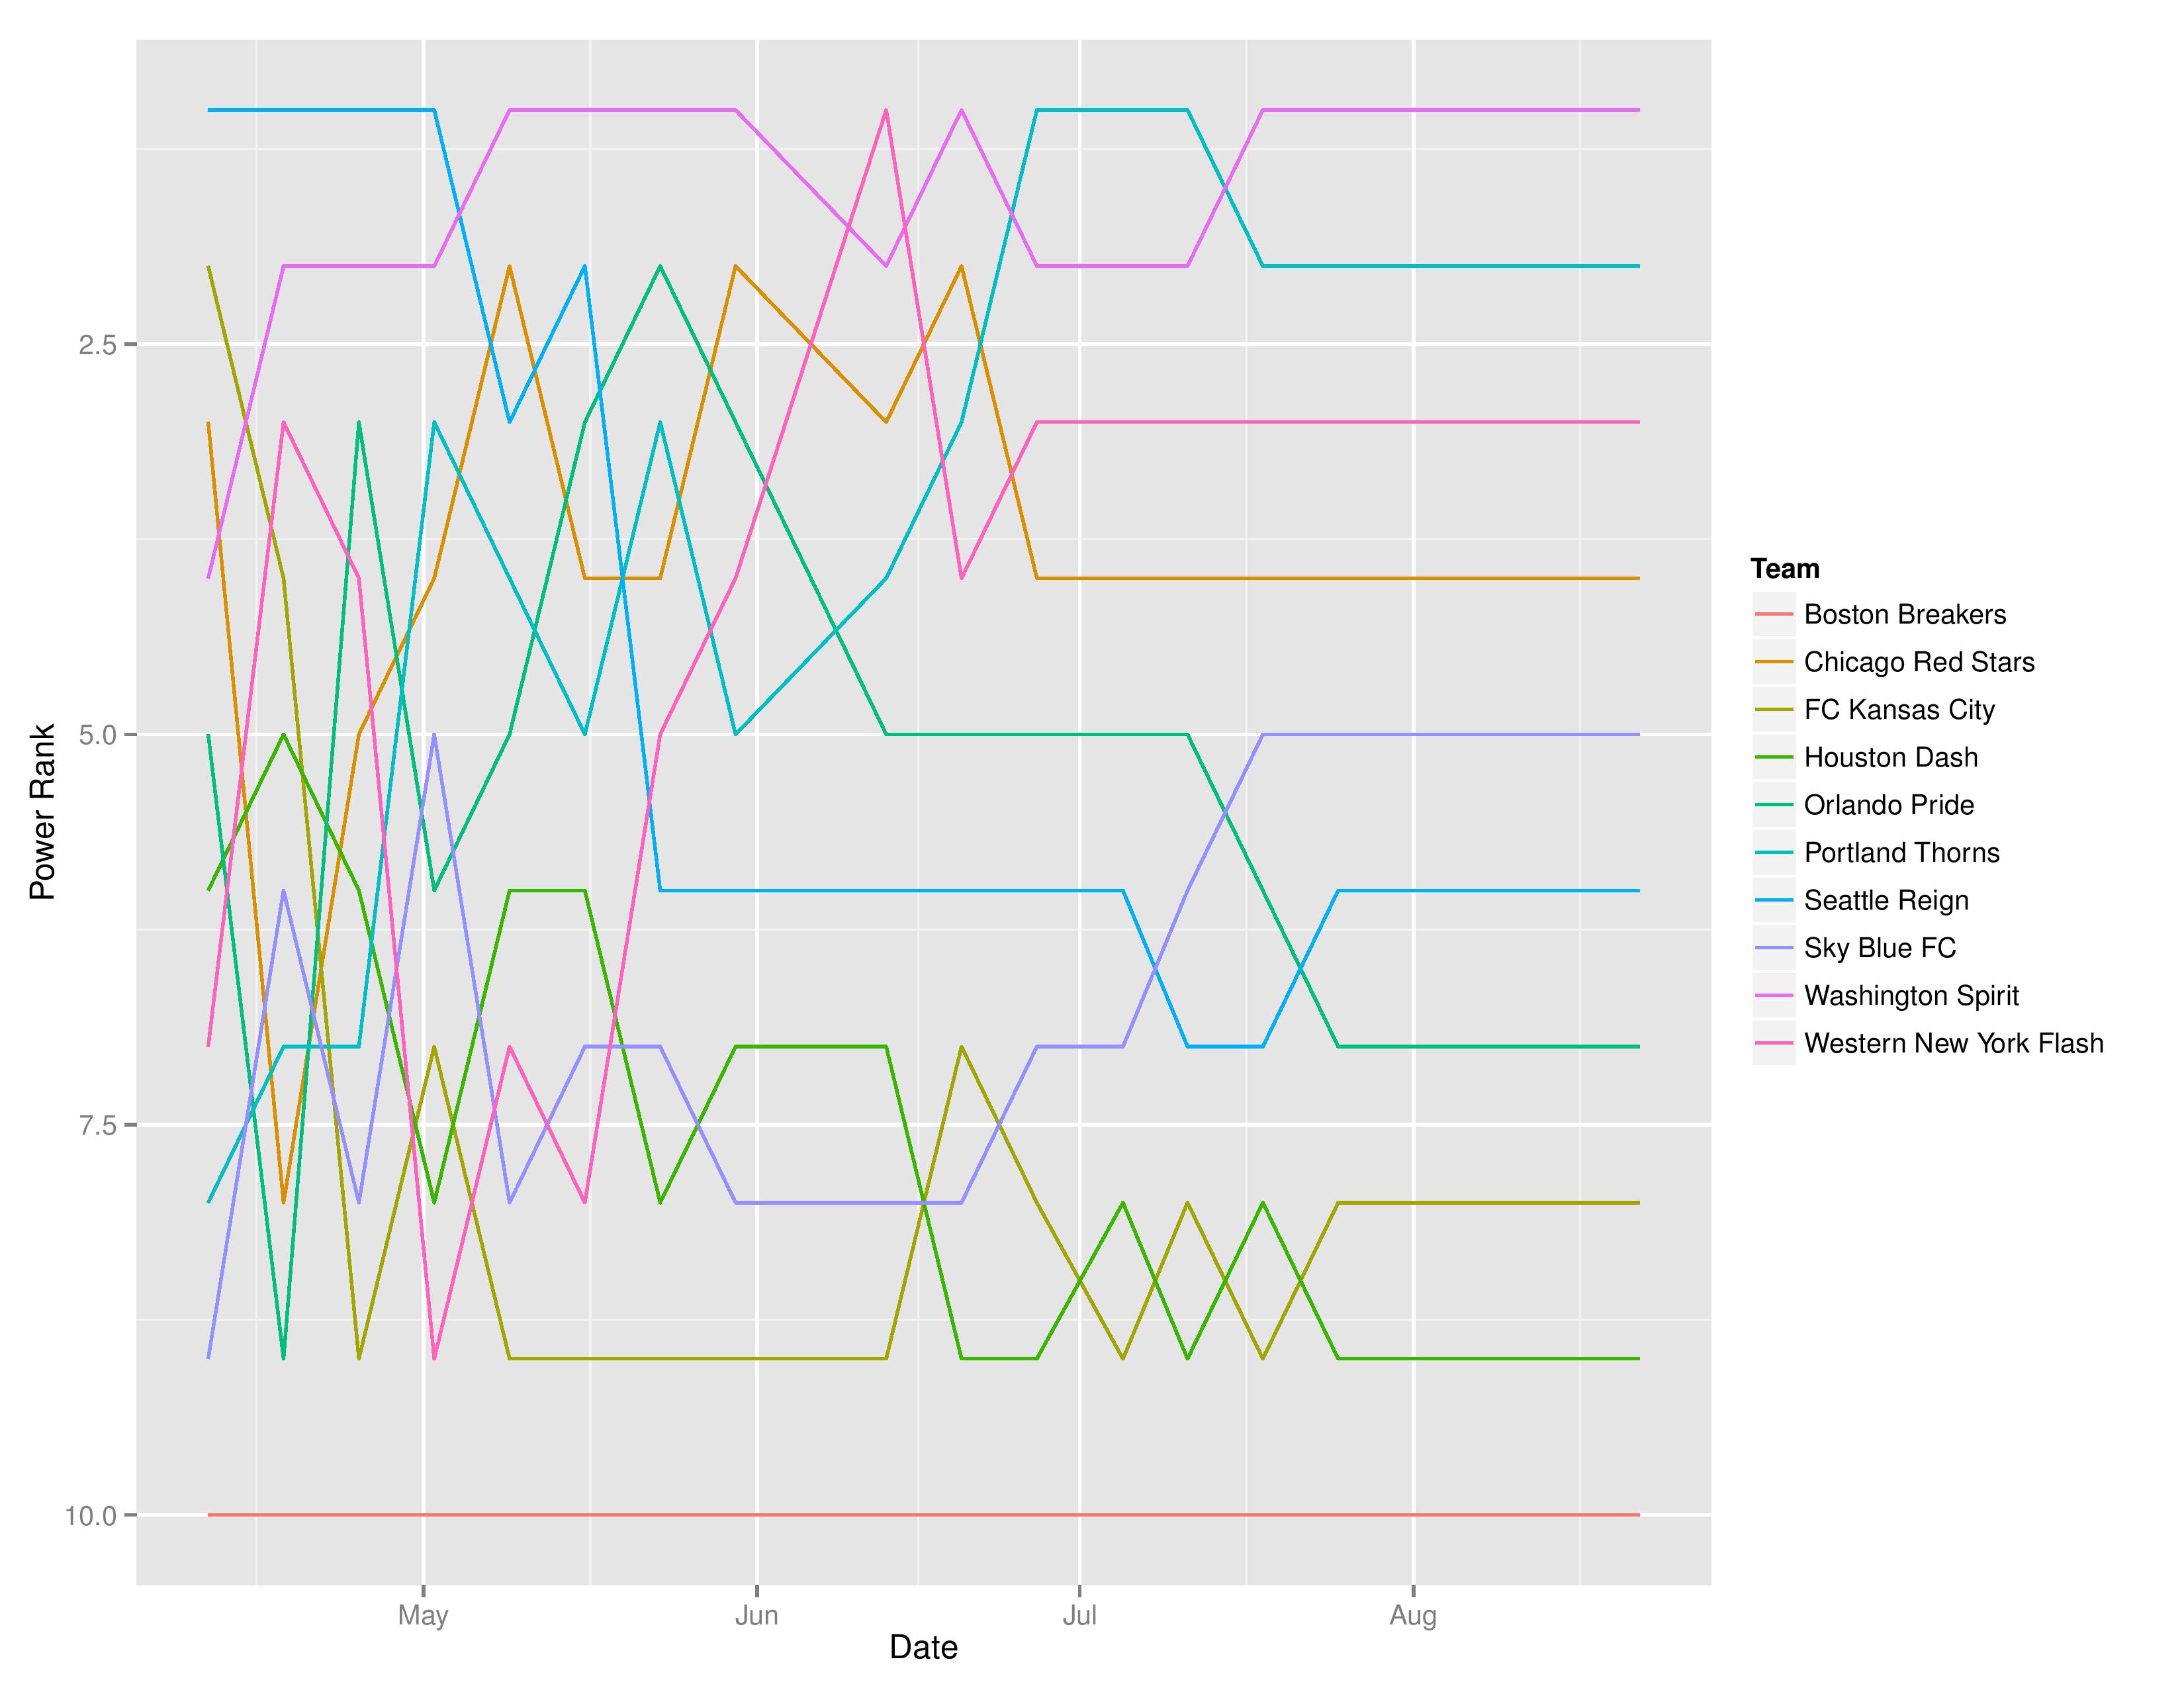
Below shows the evolution of SEBA’s power rankings for Bethlehem Steel FC and the Harrisburg City Islanders.
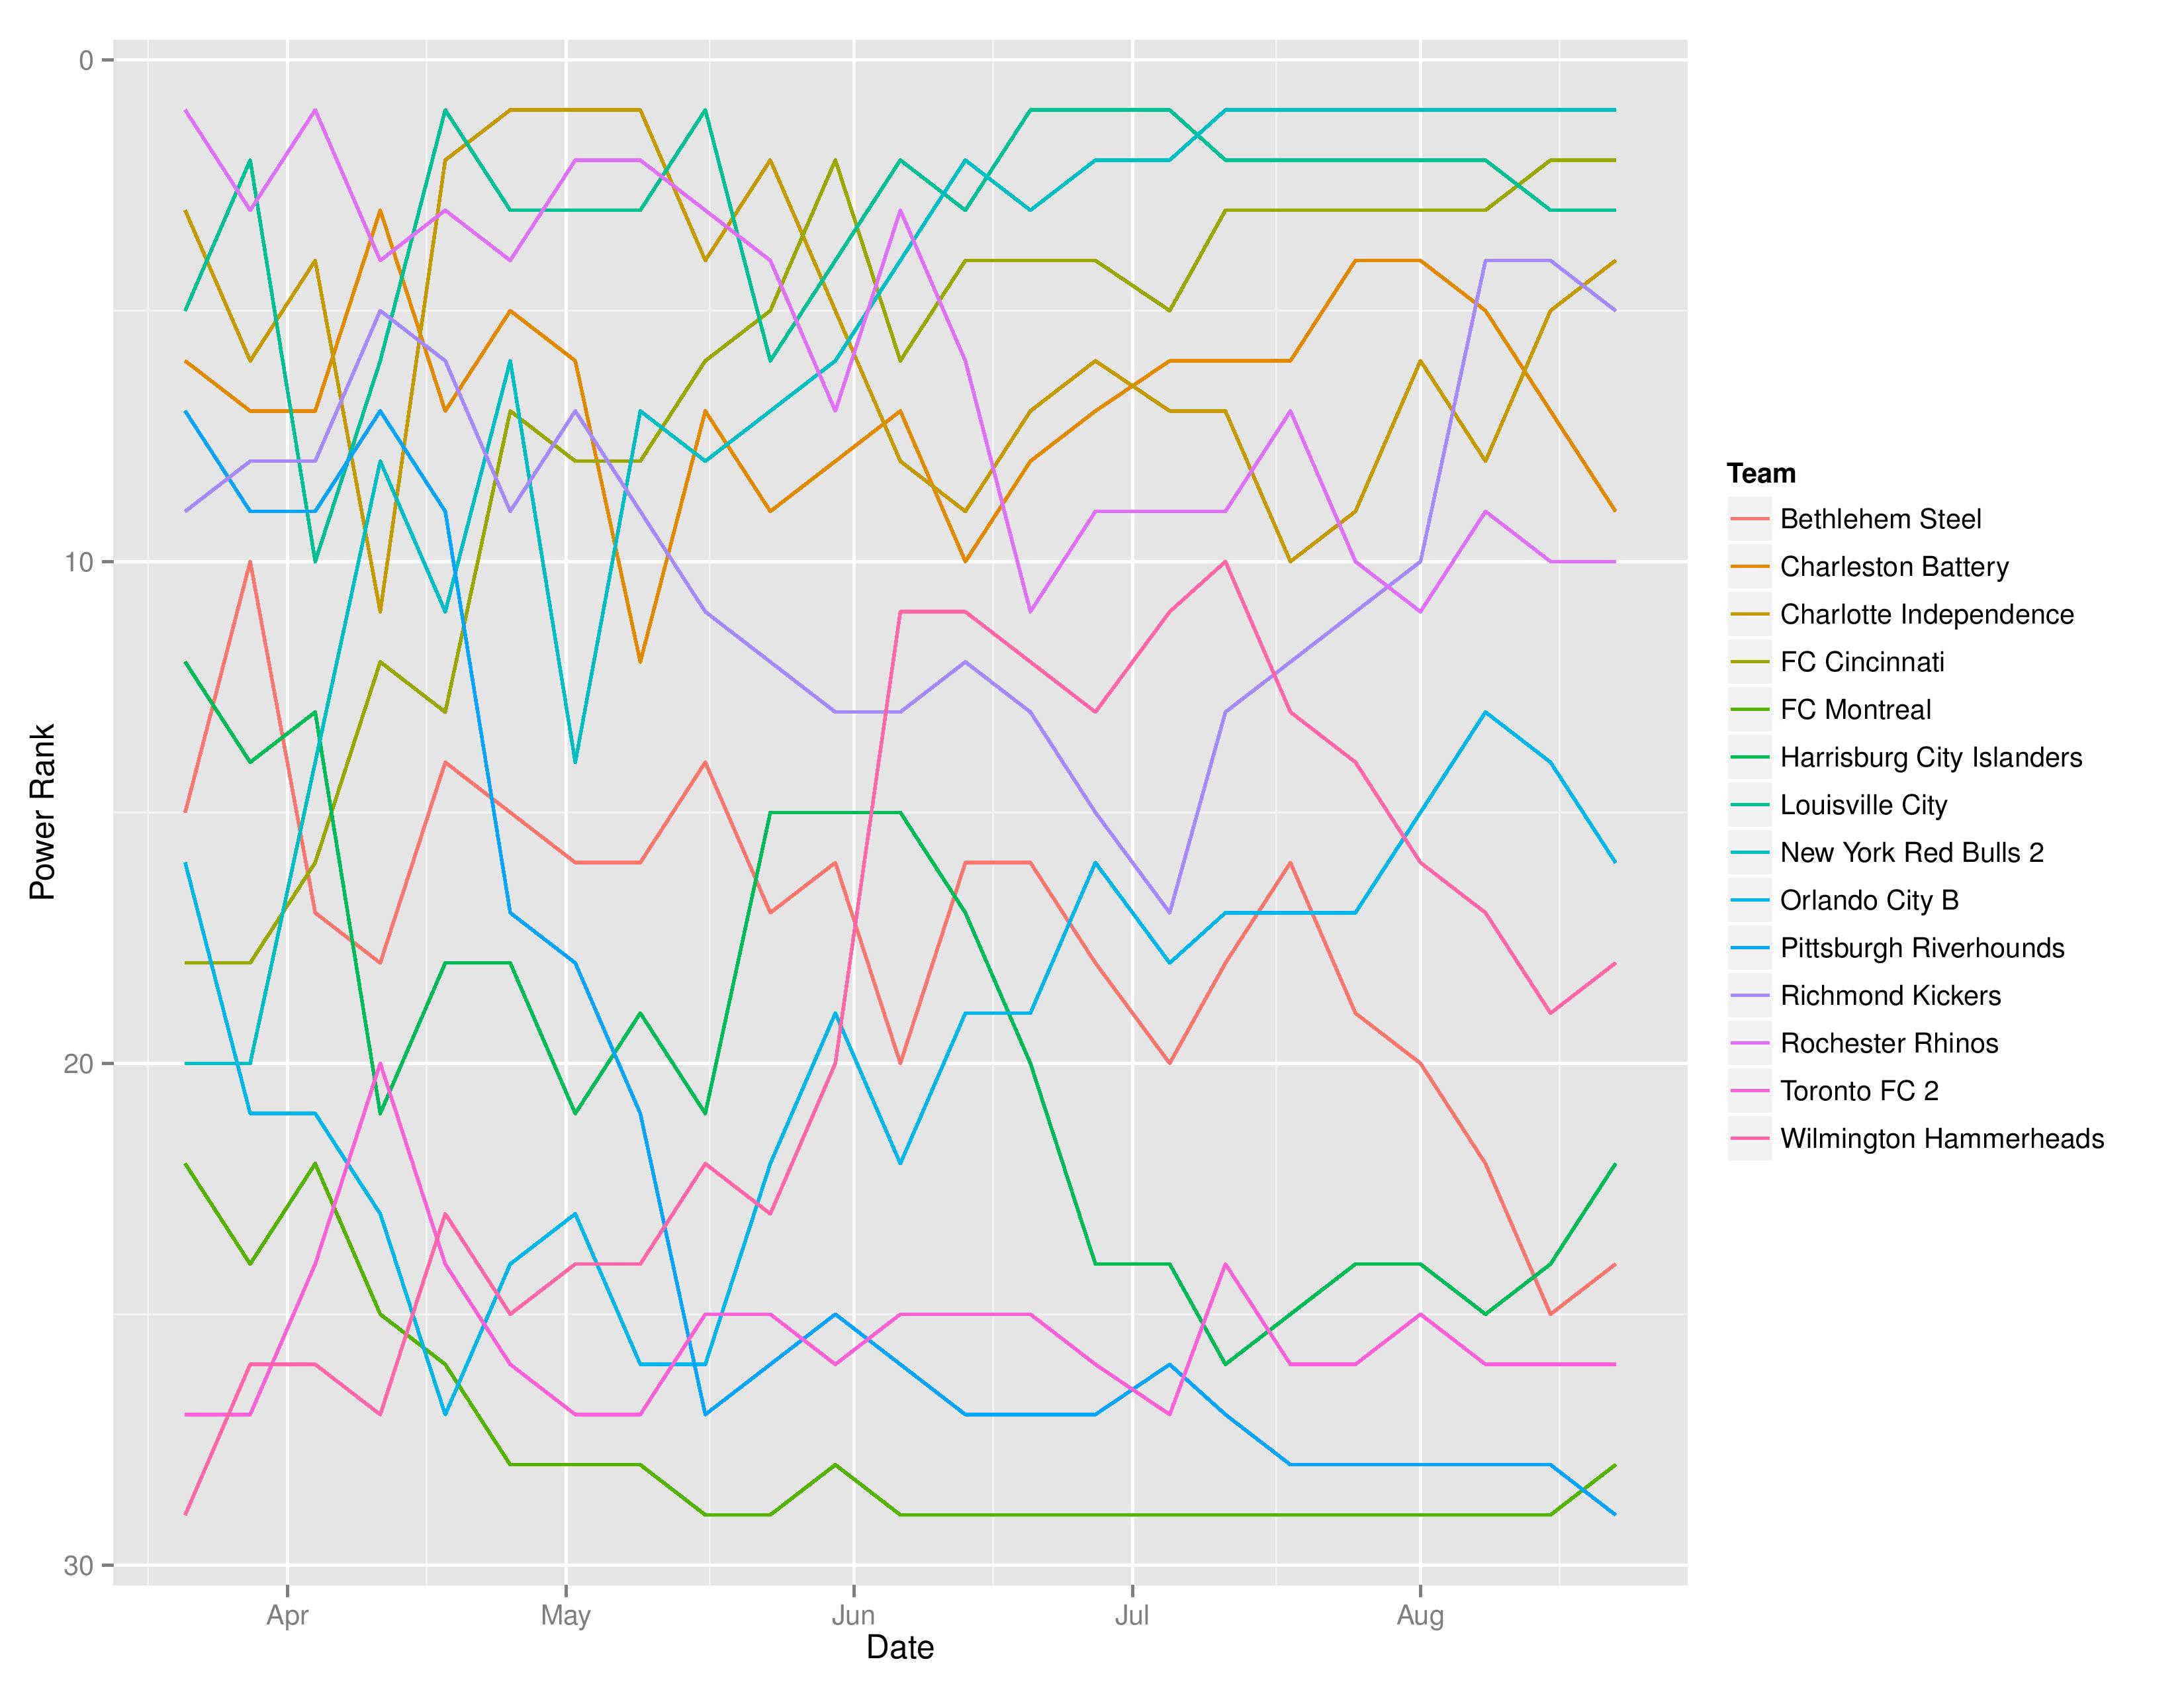
Below shows SEBA’s power rankings evolution for the USL East over the course of the season
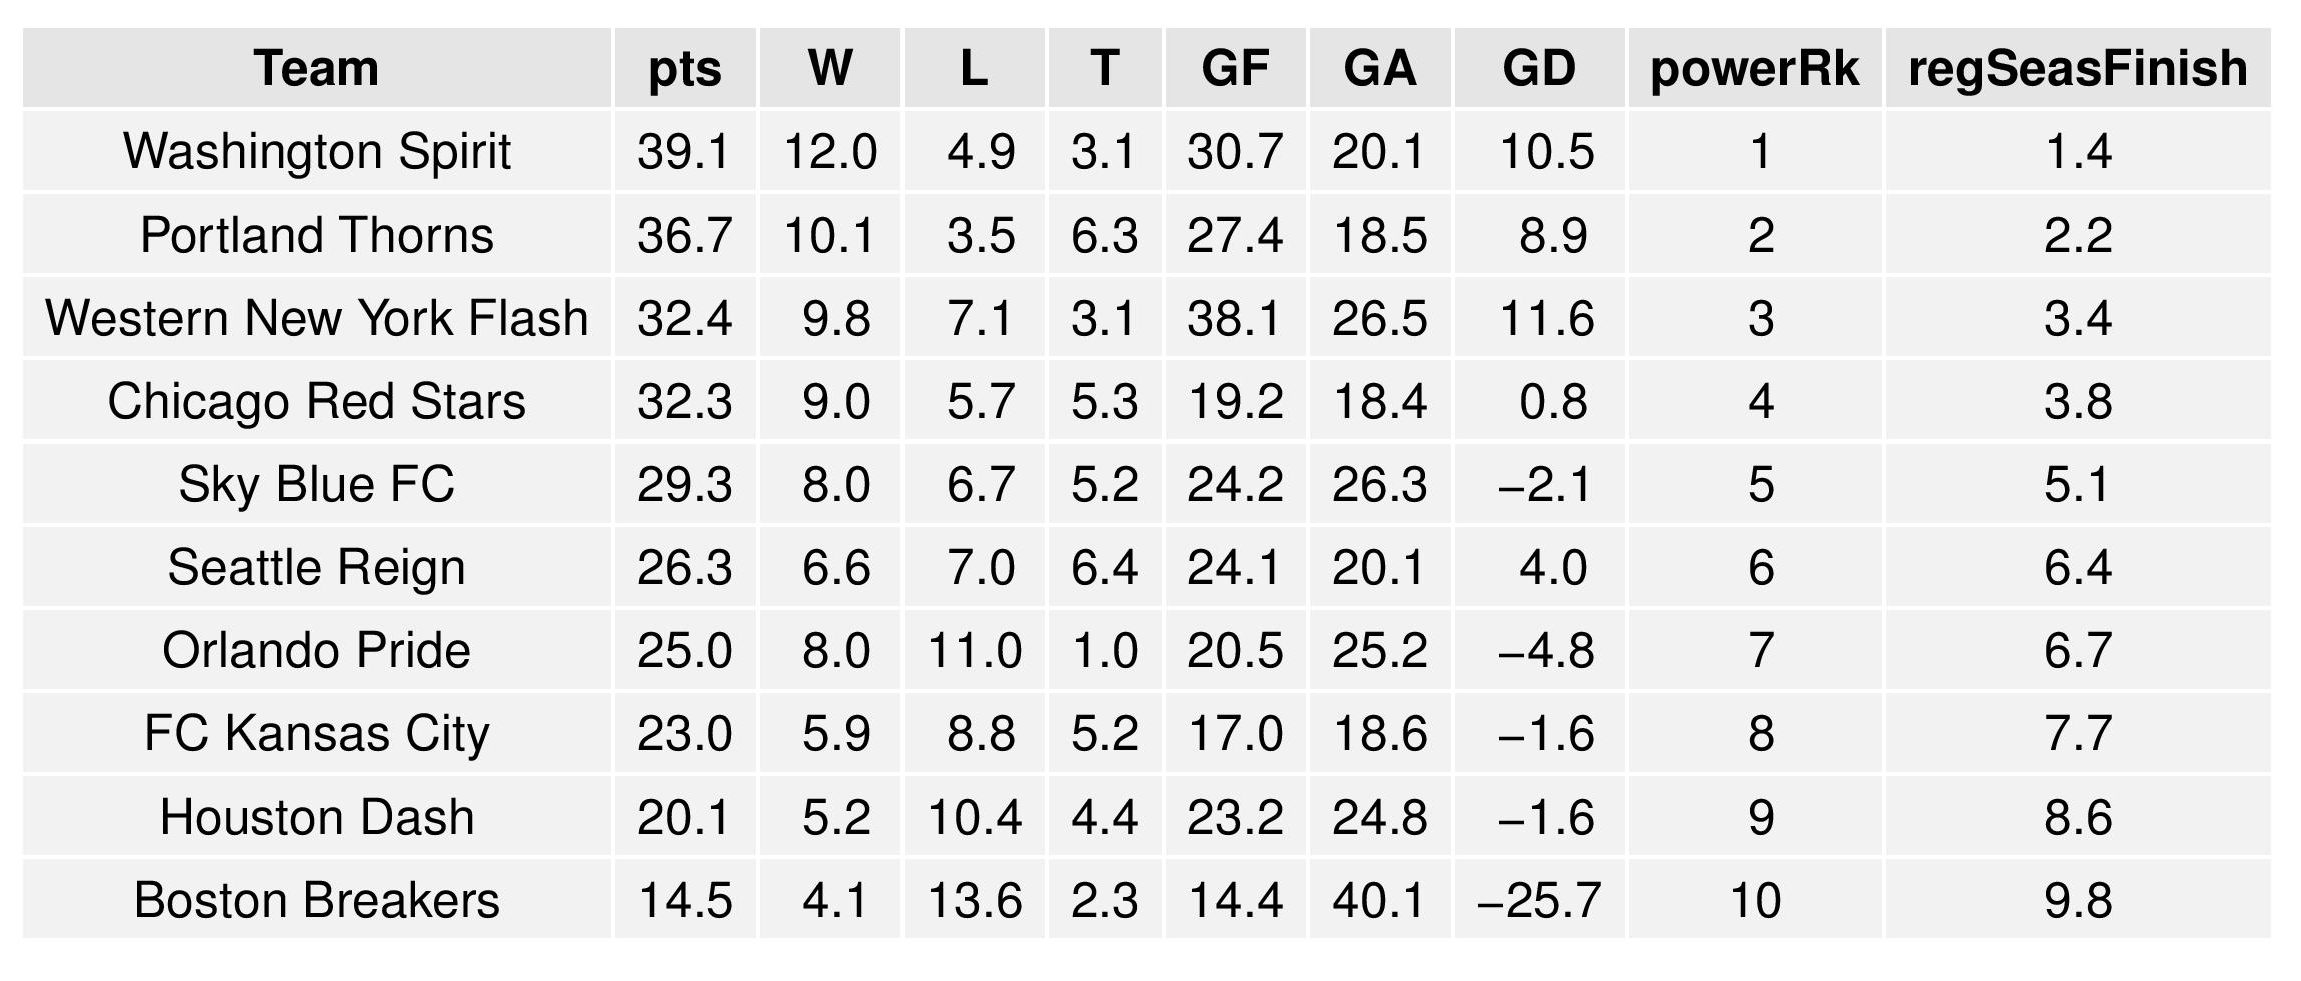
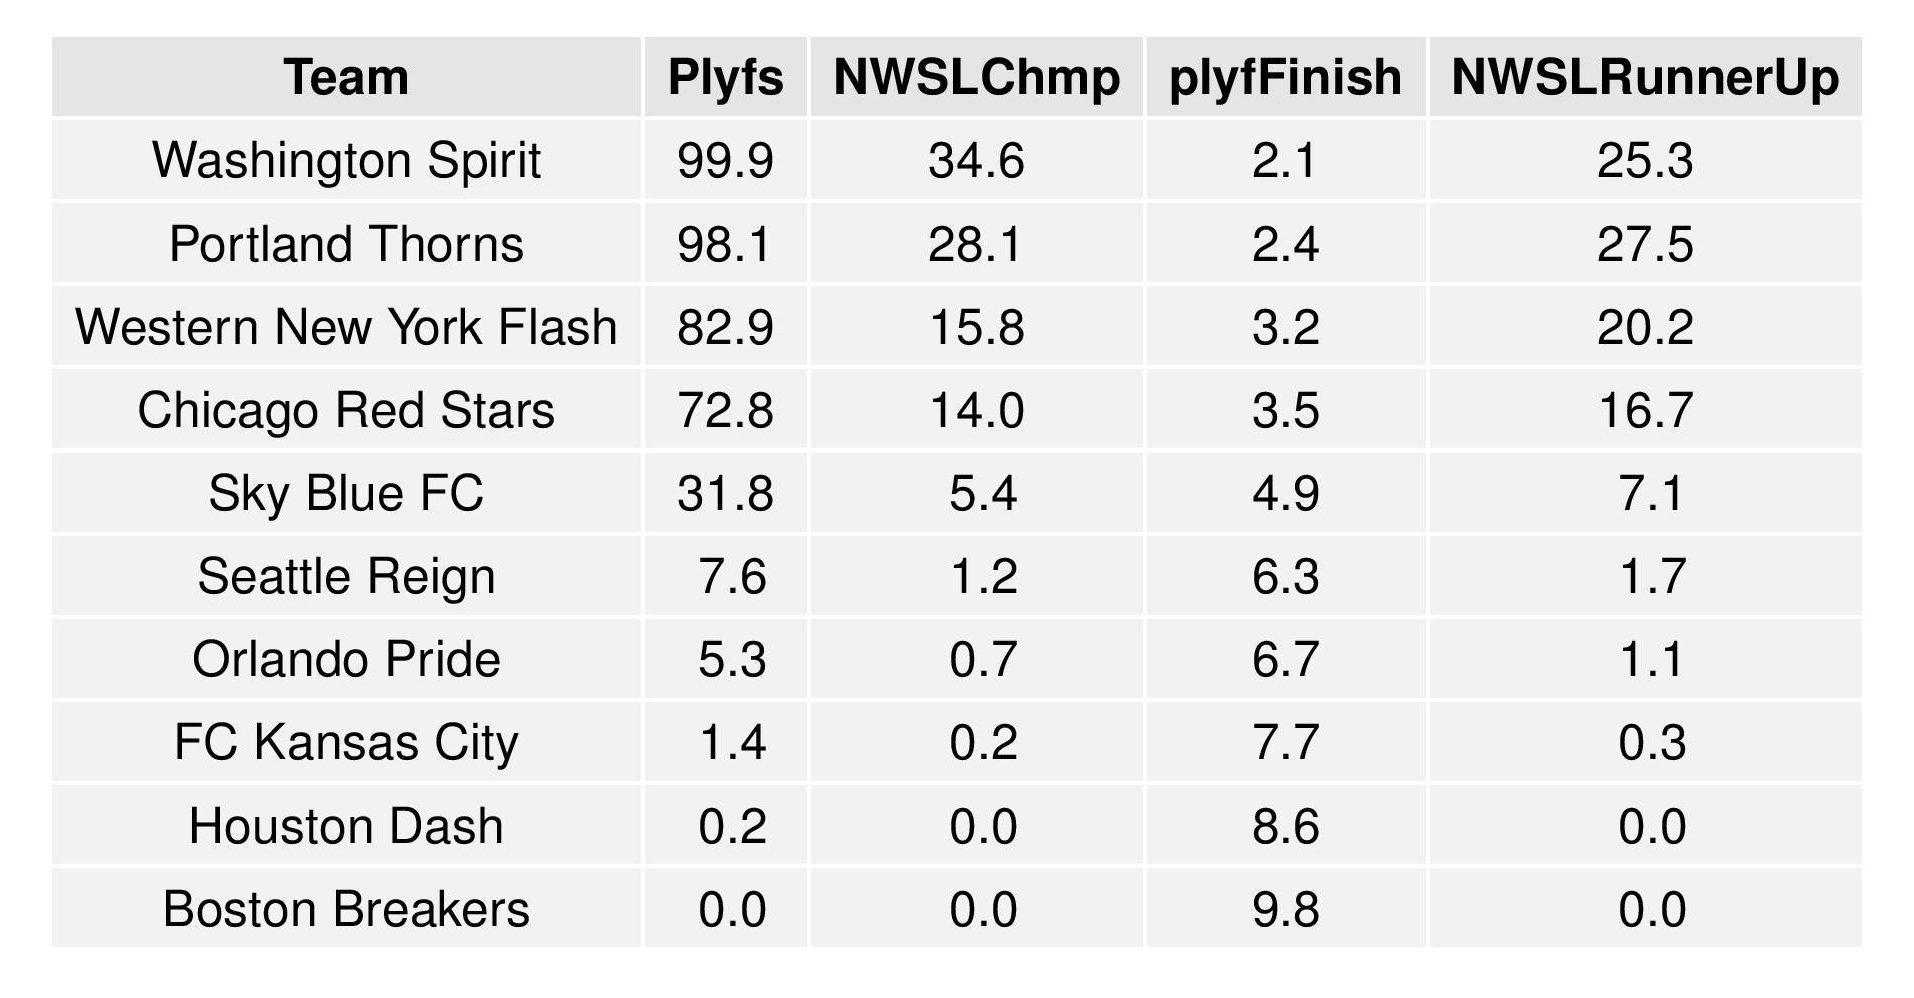
NWSL Projections
The following tables are the average simulation results produced by SEBA.

I think it’s interesting that the Union’s highest expected points is against KC, a team in the west, a conference which the Union is winless against so far this season.
.
Also, I’m guessing that the expected points against Chicago doesn’t take into account the fact that Bedoya and Blake will likely miss that game on international duty.
.
It looks like the Union are project to get just under 12 points the rest of the way. That would put them at 46 points for the season. I’d be curious to see where everyone else projects to.
with KC, I hear you, but KC hasn’t proven themselves with their 11/5/11 record (right in line with Philly’s 9/7/9) and the model doesn’t give credit to conferences, only the teams within them. They also have a lower draw percentage which, when combined with a home game for their opponents, allows a greater potential for points (with 3 pts for win and 1 pt for draw).
–
That’s correct. I’ve secured a way to bring in player minutes data that I intend to implement next year, but I decided I didn’t want to test such a significant model change mid-season. Even so, because Bedoya has played so few minutes (over the season), Bedoya’s absence wouldn’t affect the predictions much (and, therefore, could cause underestimation now) but Blake’s absence would have a large impact.
–
That’s correct, my average expectation is that the Union will pick up about 12 points, however, there is a fairly large margin of error given that each game can only issue 0, 1, or 3 points (i.e. our average expectation against KC is 1.82, but that can never happen).
Thanks, Chris. BTW, I should mention that I do really like these analysis (as if you hadn’t figured that out by my comments).
Thanks Andy! Great to hear, and I’m glad you enjoy them