Author’s note: I discovered an error in the code in which, for the purposes of past games only, was using all games between MLS teams in contributing to points in the MLS table. This led to overestimation of all the Canadian teams (from the Canadian Championship) as well as Portland (who played an early USOC game against an MLS side) and therefore an underestimation of all other teams. I have fixed the error and re-run all affected simulations for the purposes of the over-time graphs. Sorry for the inconvenience.
Welcome to the Statistical Extrapolation Bayesian Analyzer Projection System, which is, of course, a tortured gathering of words used to form the SEBA Projection System.
The system consists of a model projecting the probabilities of game results and then a barrage of simulations which account for the remaining luck. So the probabilities you see below show, essentially, what the odds are of an outcome if the team continues to play like it has been.
Below are the current season forecasts using data from MLS games through July 4, 2016. It does not include yesterday’s NYCFC away win over New England.
I added a new feature this week. It shows the probability of MLS teams breaking single-season records. Check it out at the bottom of the MLS section.
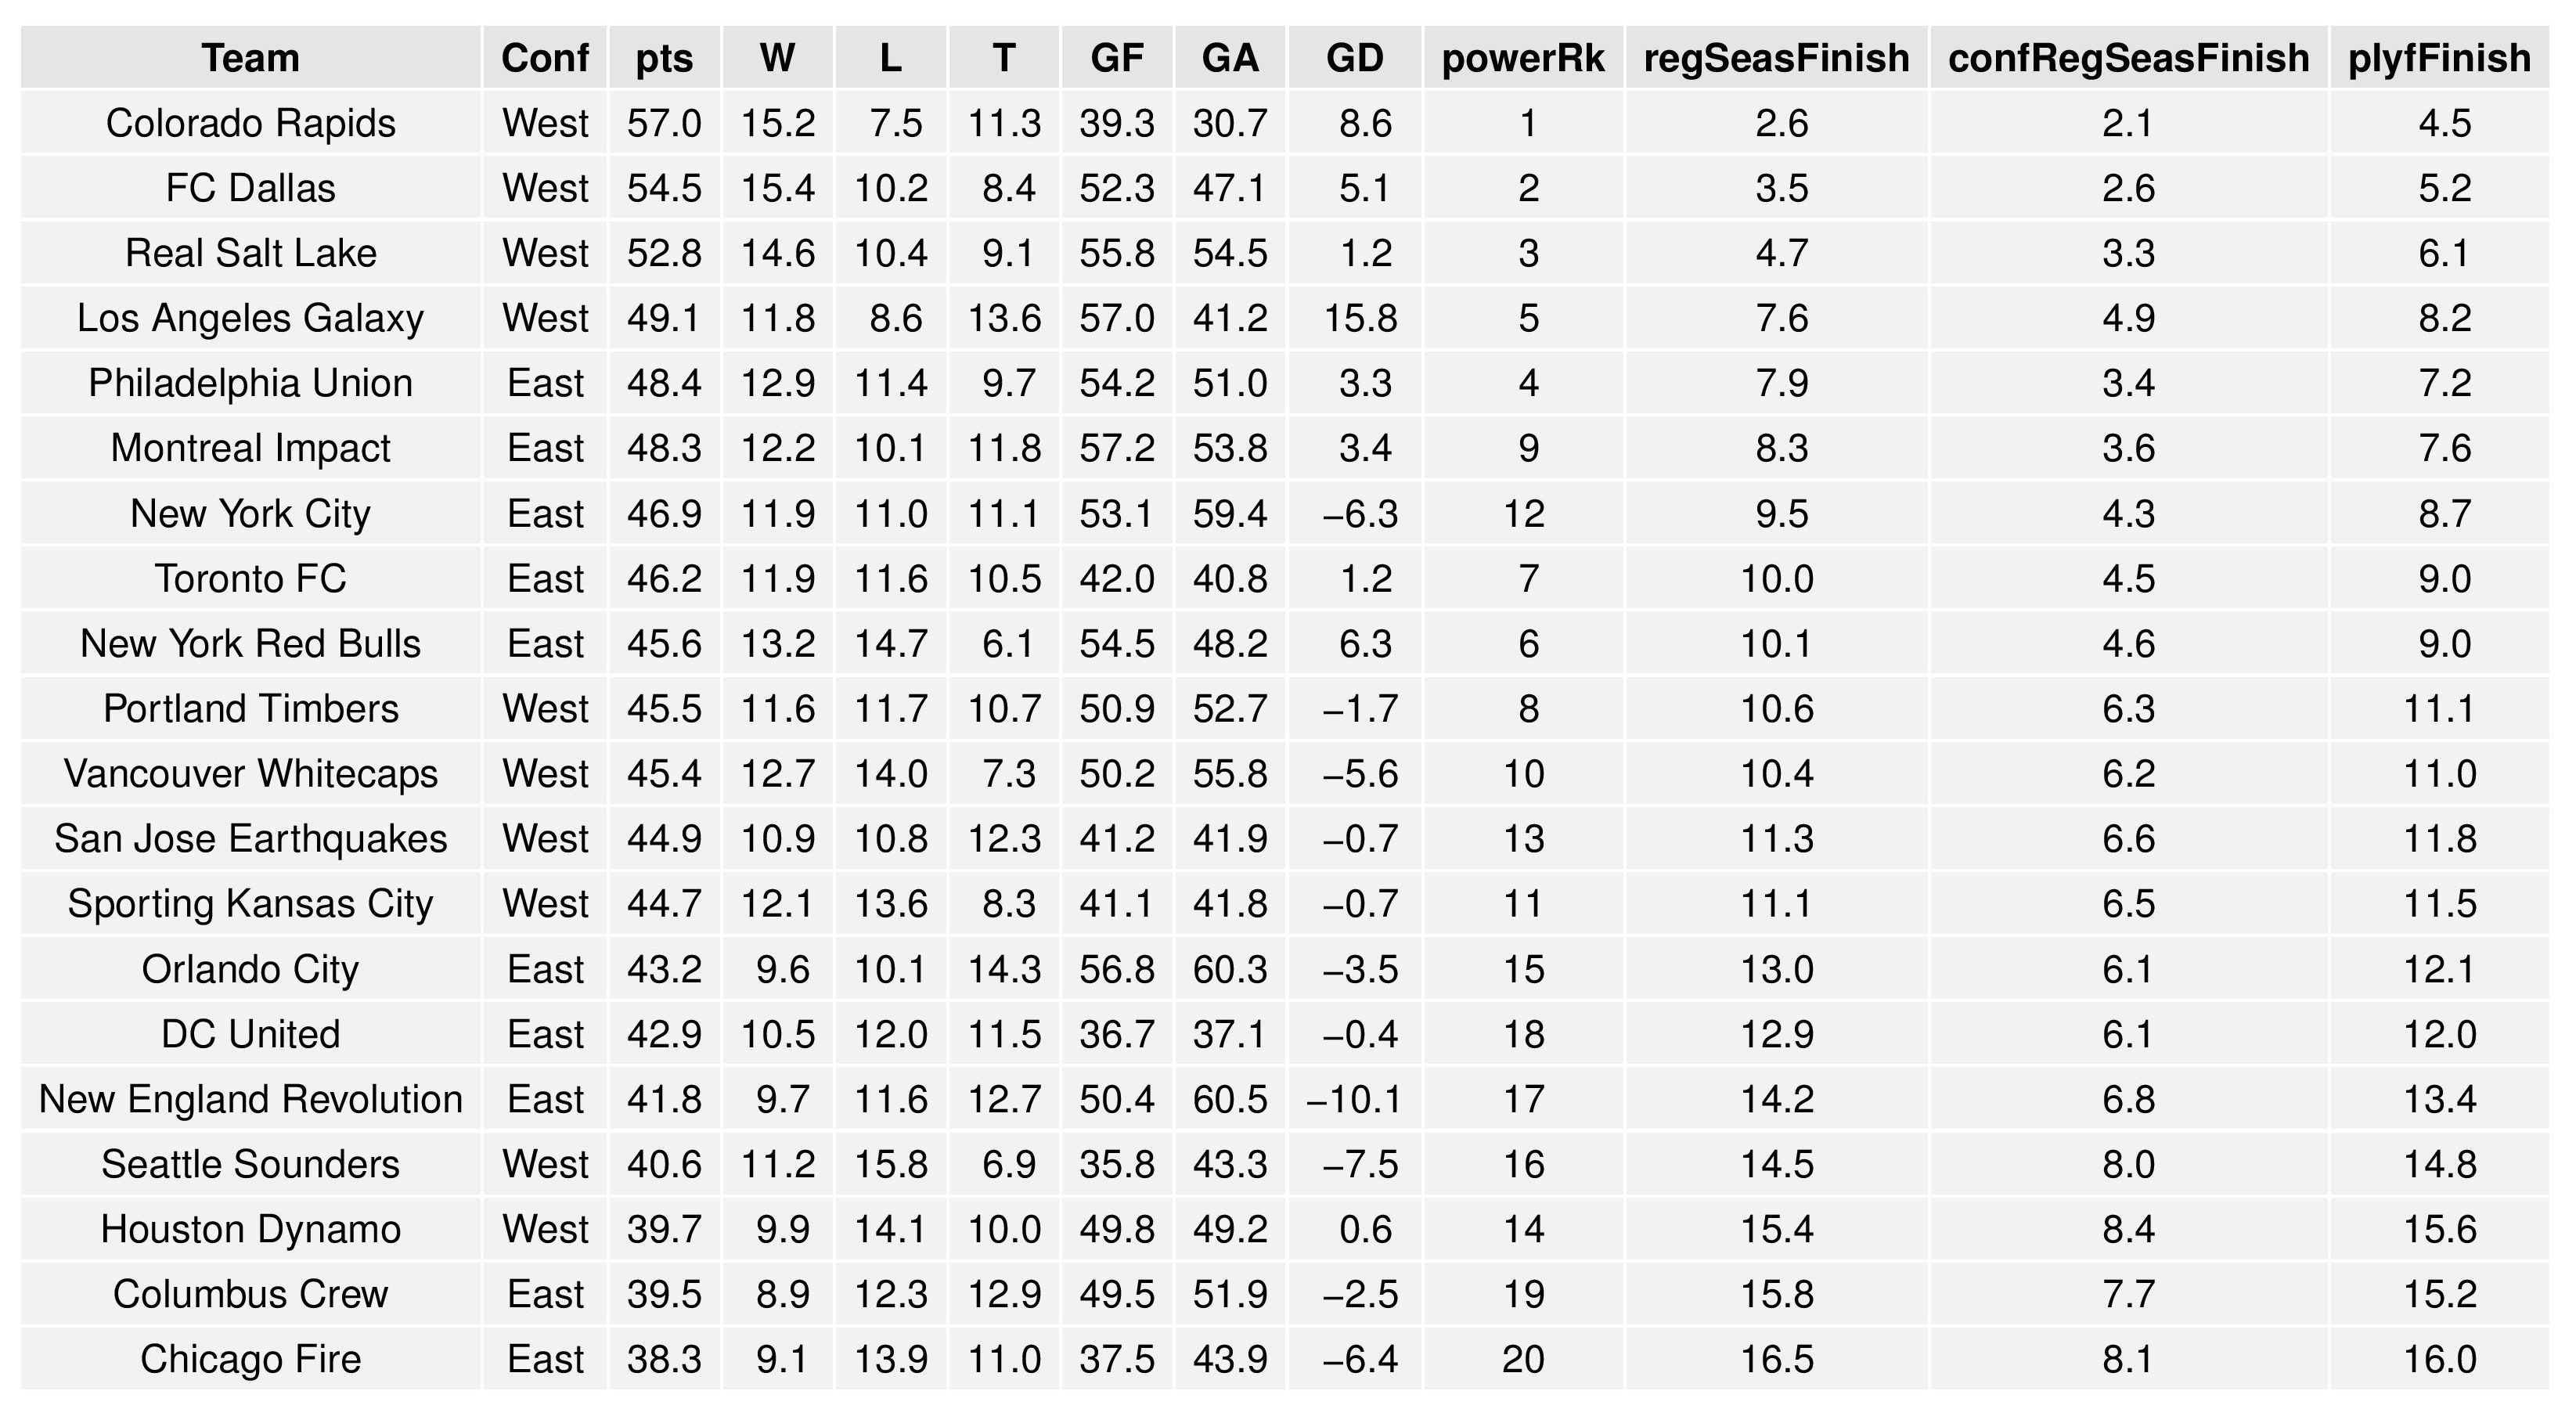
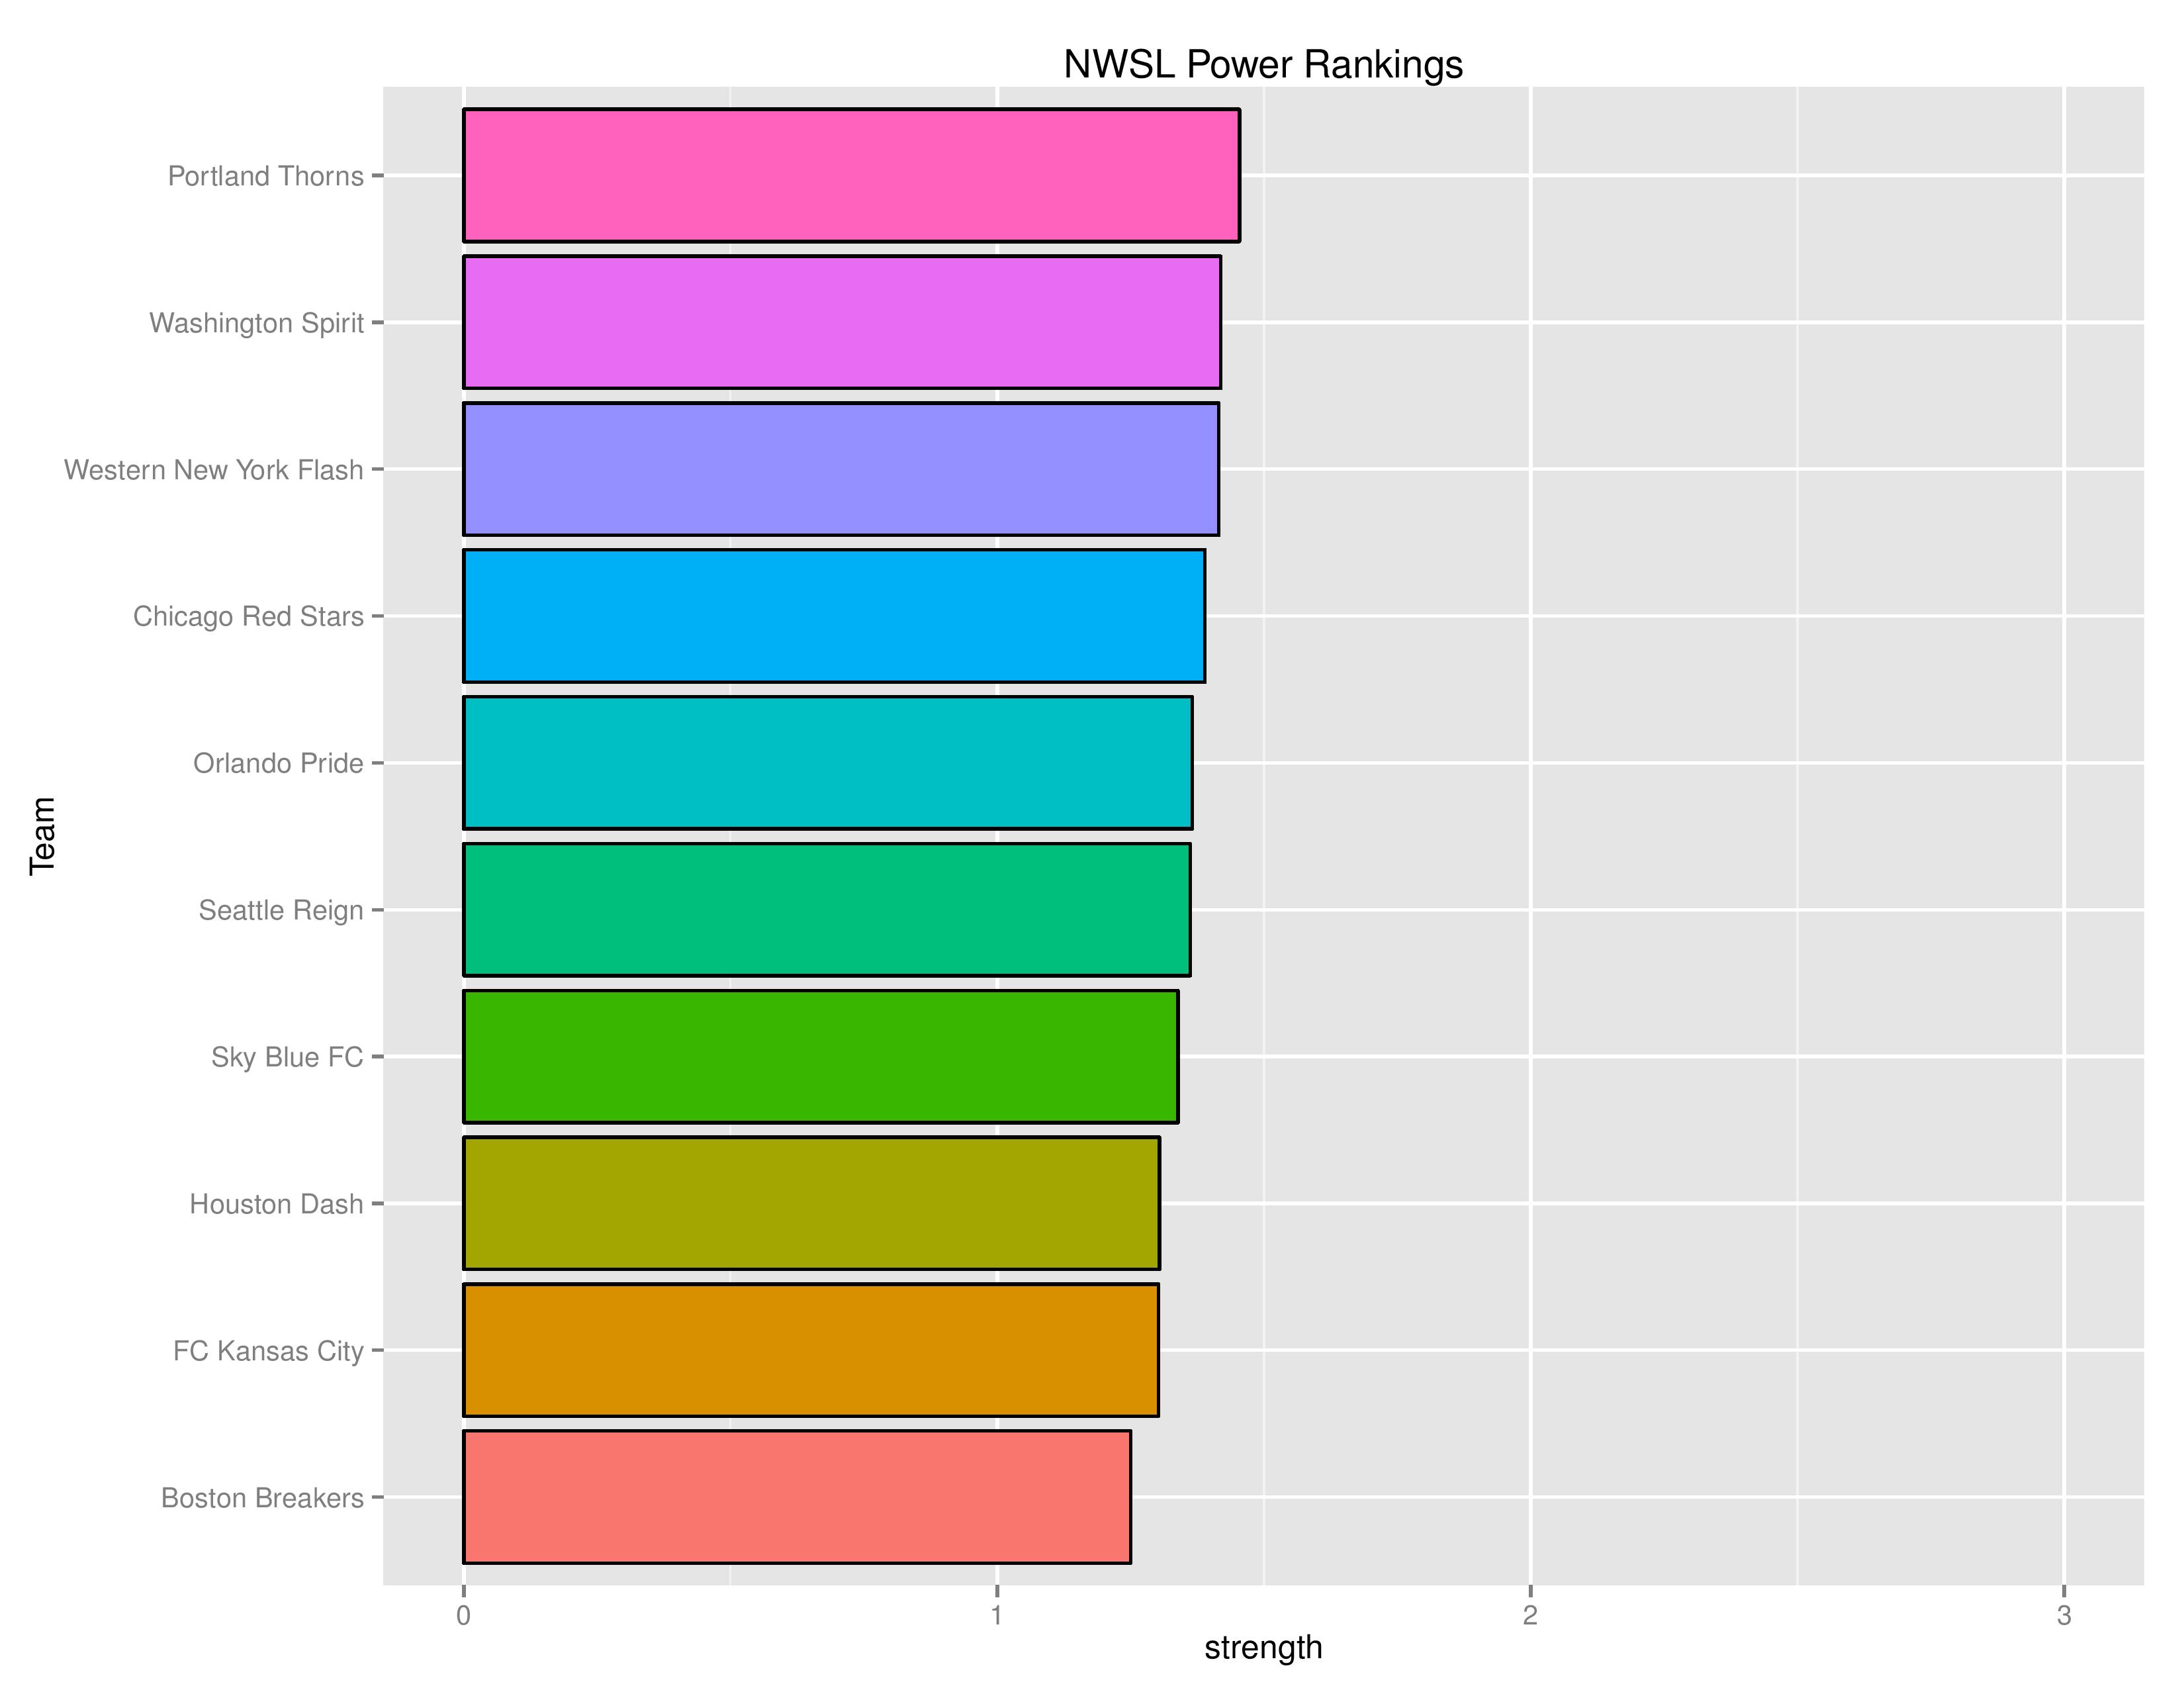
Power Rankings
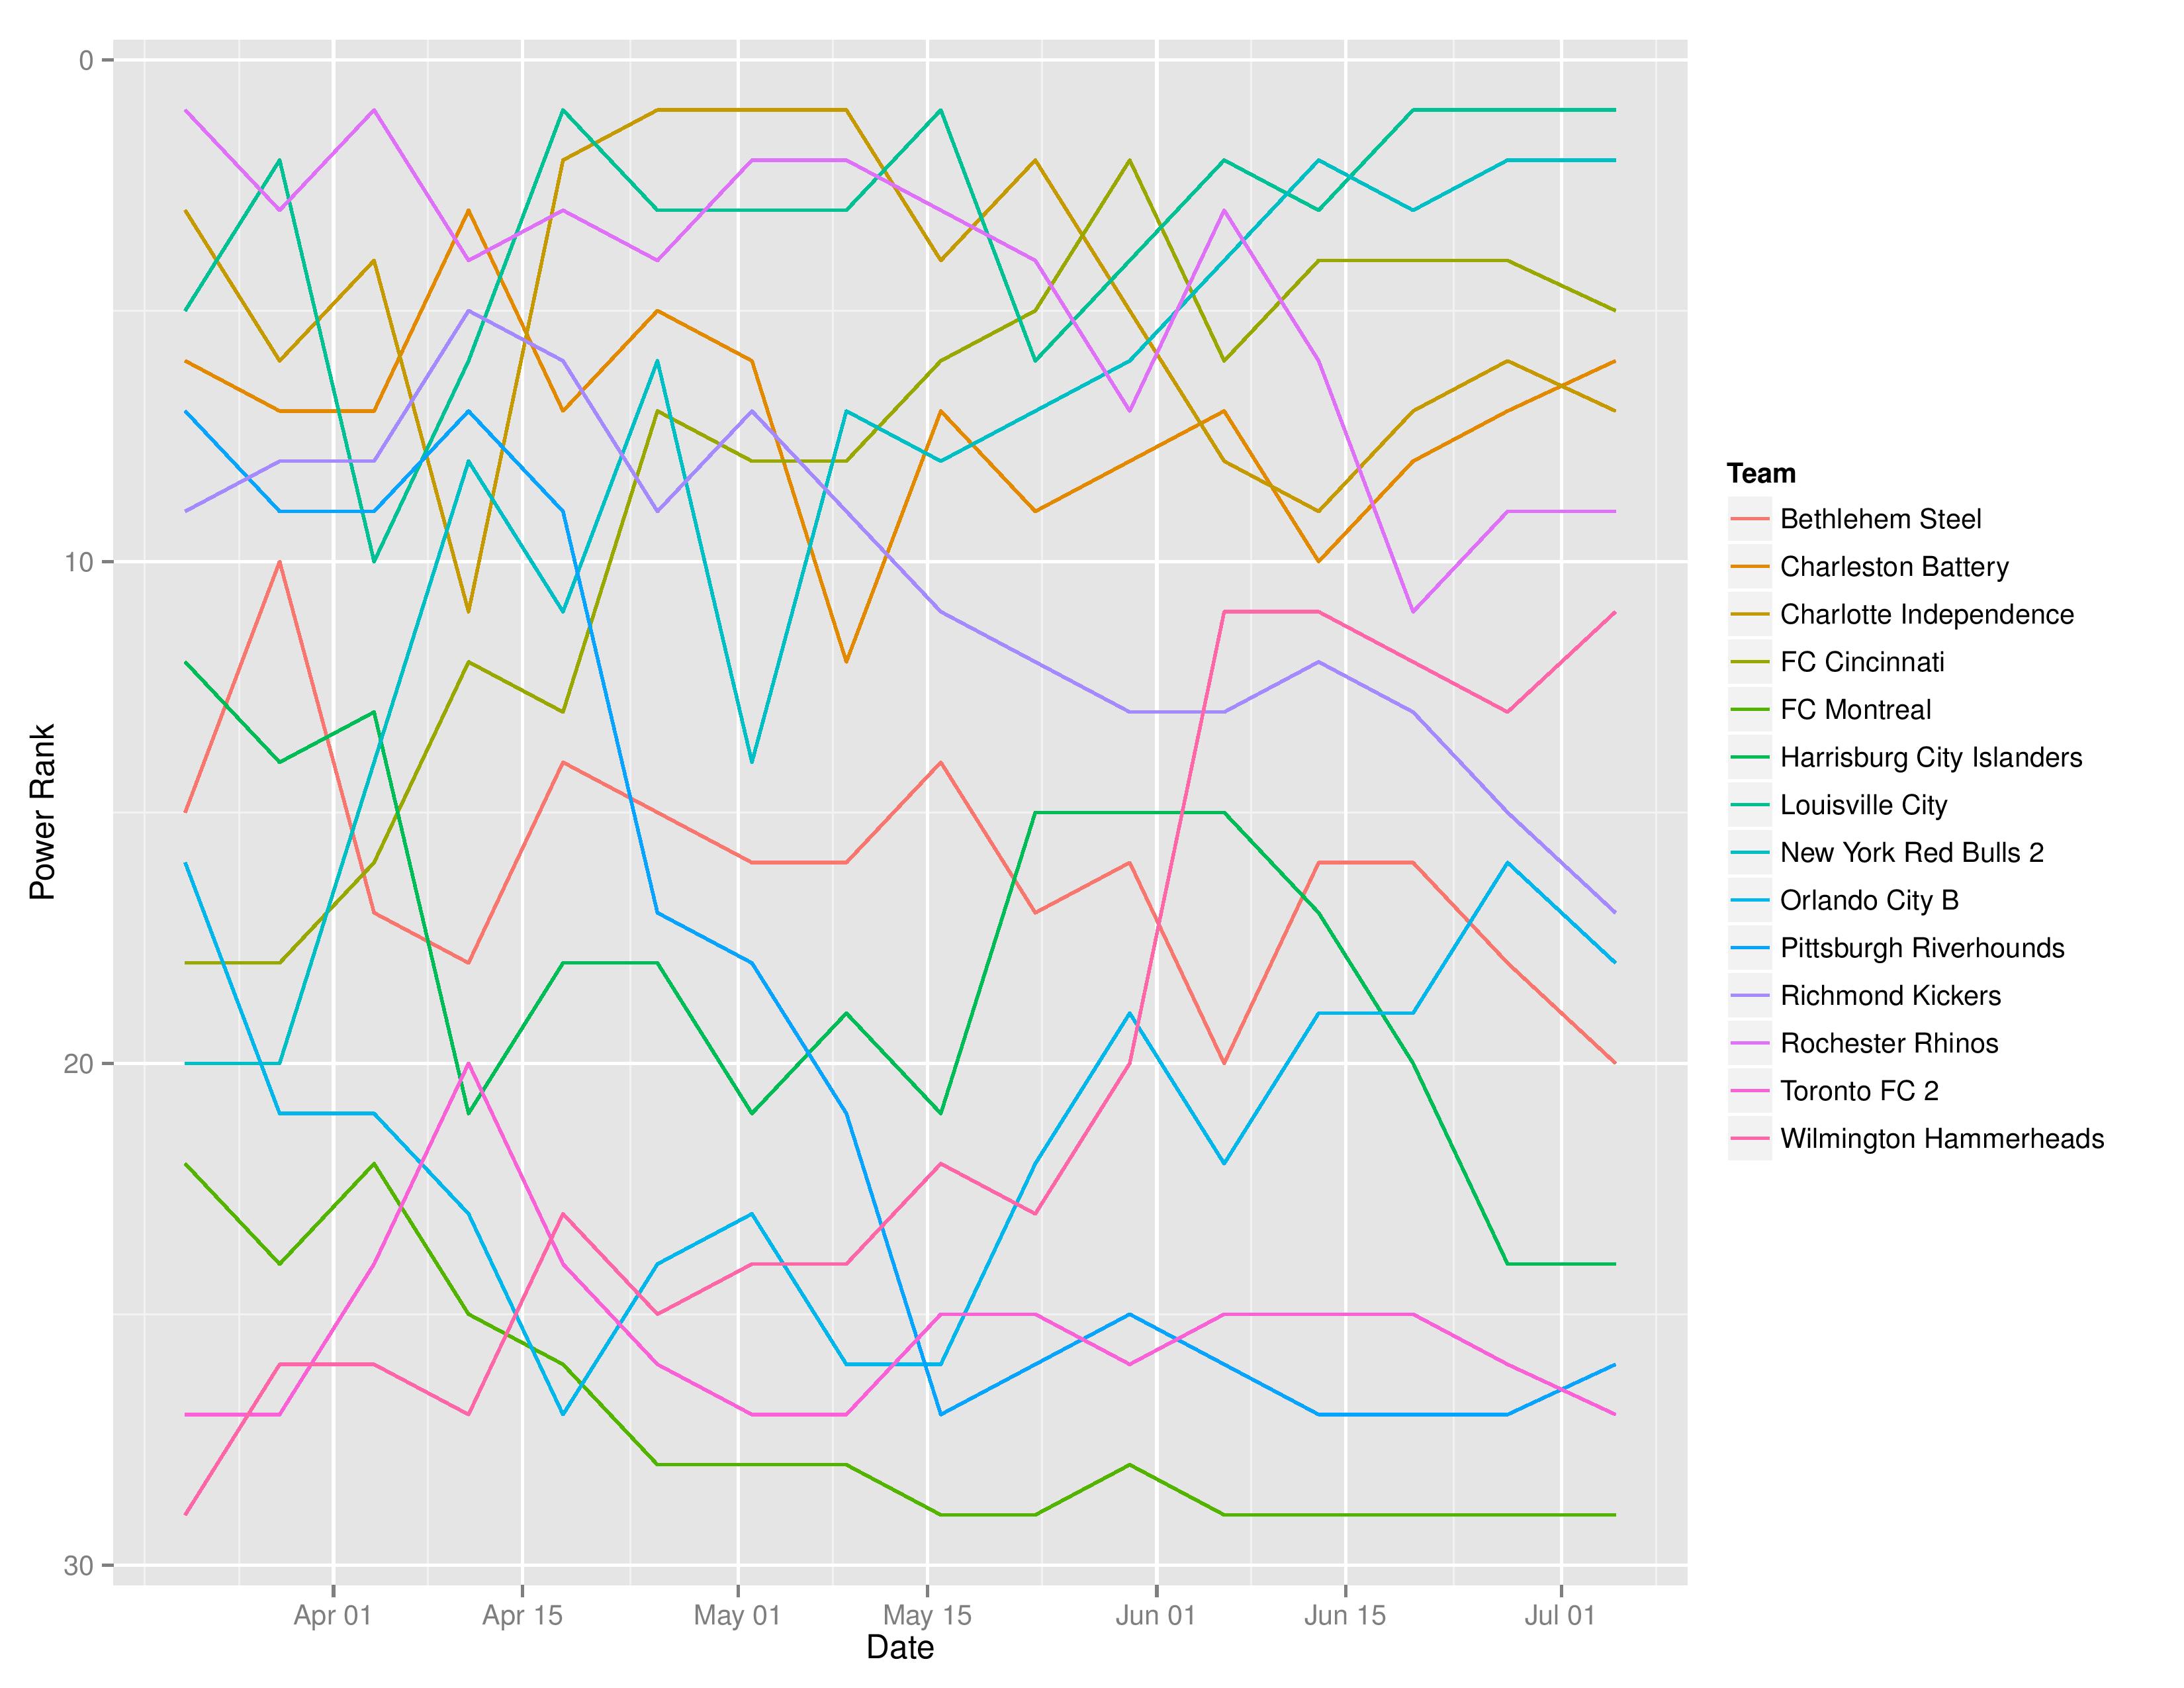
The “Power Rankings” we concoct are the actual “strength” of the team according to competitive expectations. They are computed showing average expected points result if every team in MLS played every team both home and away:

SEBA has the Union increasing from No. 5 to No. 4 this week surpassing the NYRB (SEBA’s power rankings are based on team ability and so includes USOC matches in assessments). ESPN has the Union at No. 12. (Seriously, ESPN? Overreact much?). Soccer America has the Union at No. 8. MLSSoccer has the Union at No. 5.
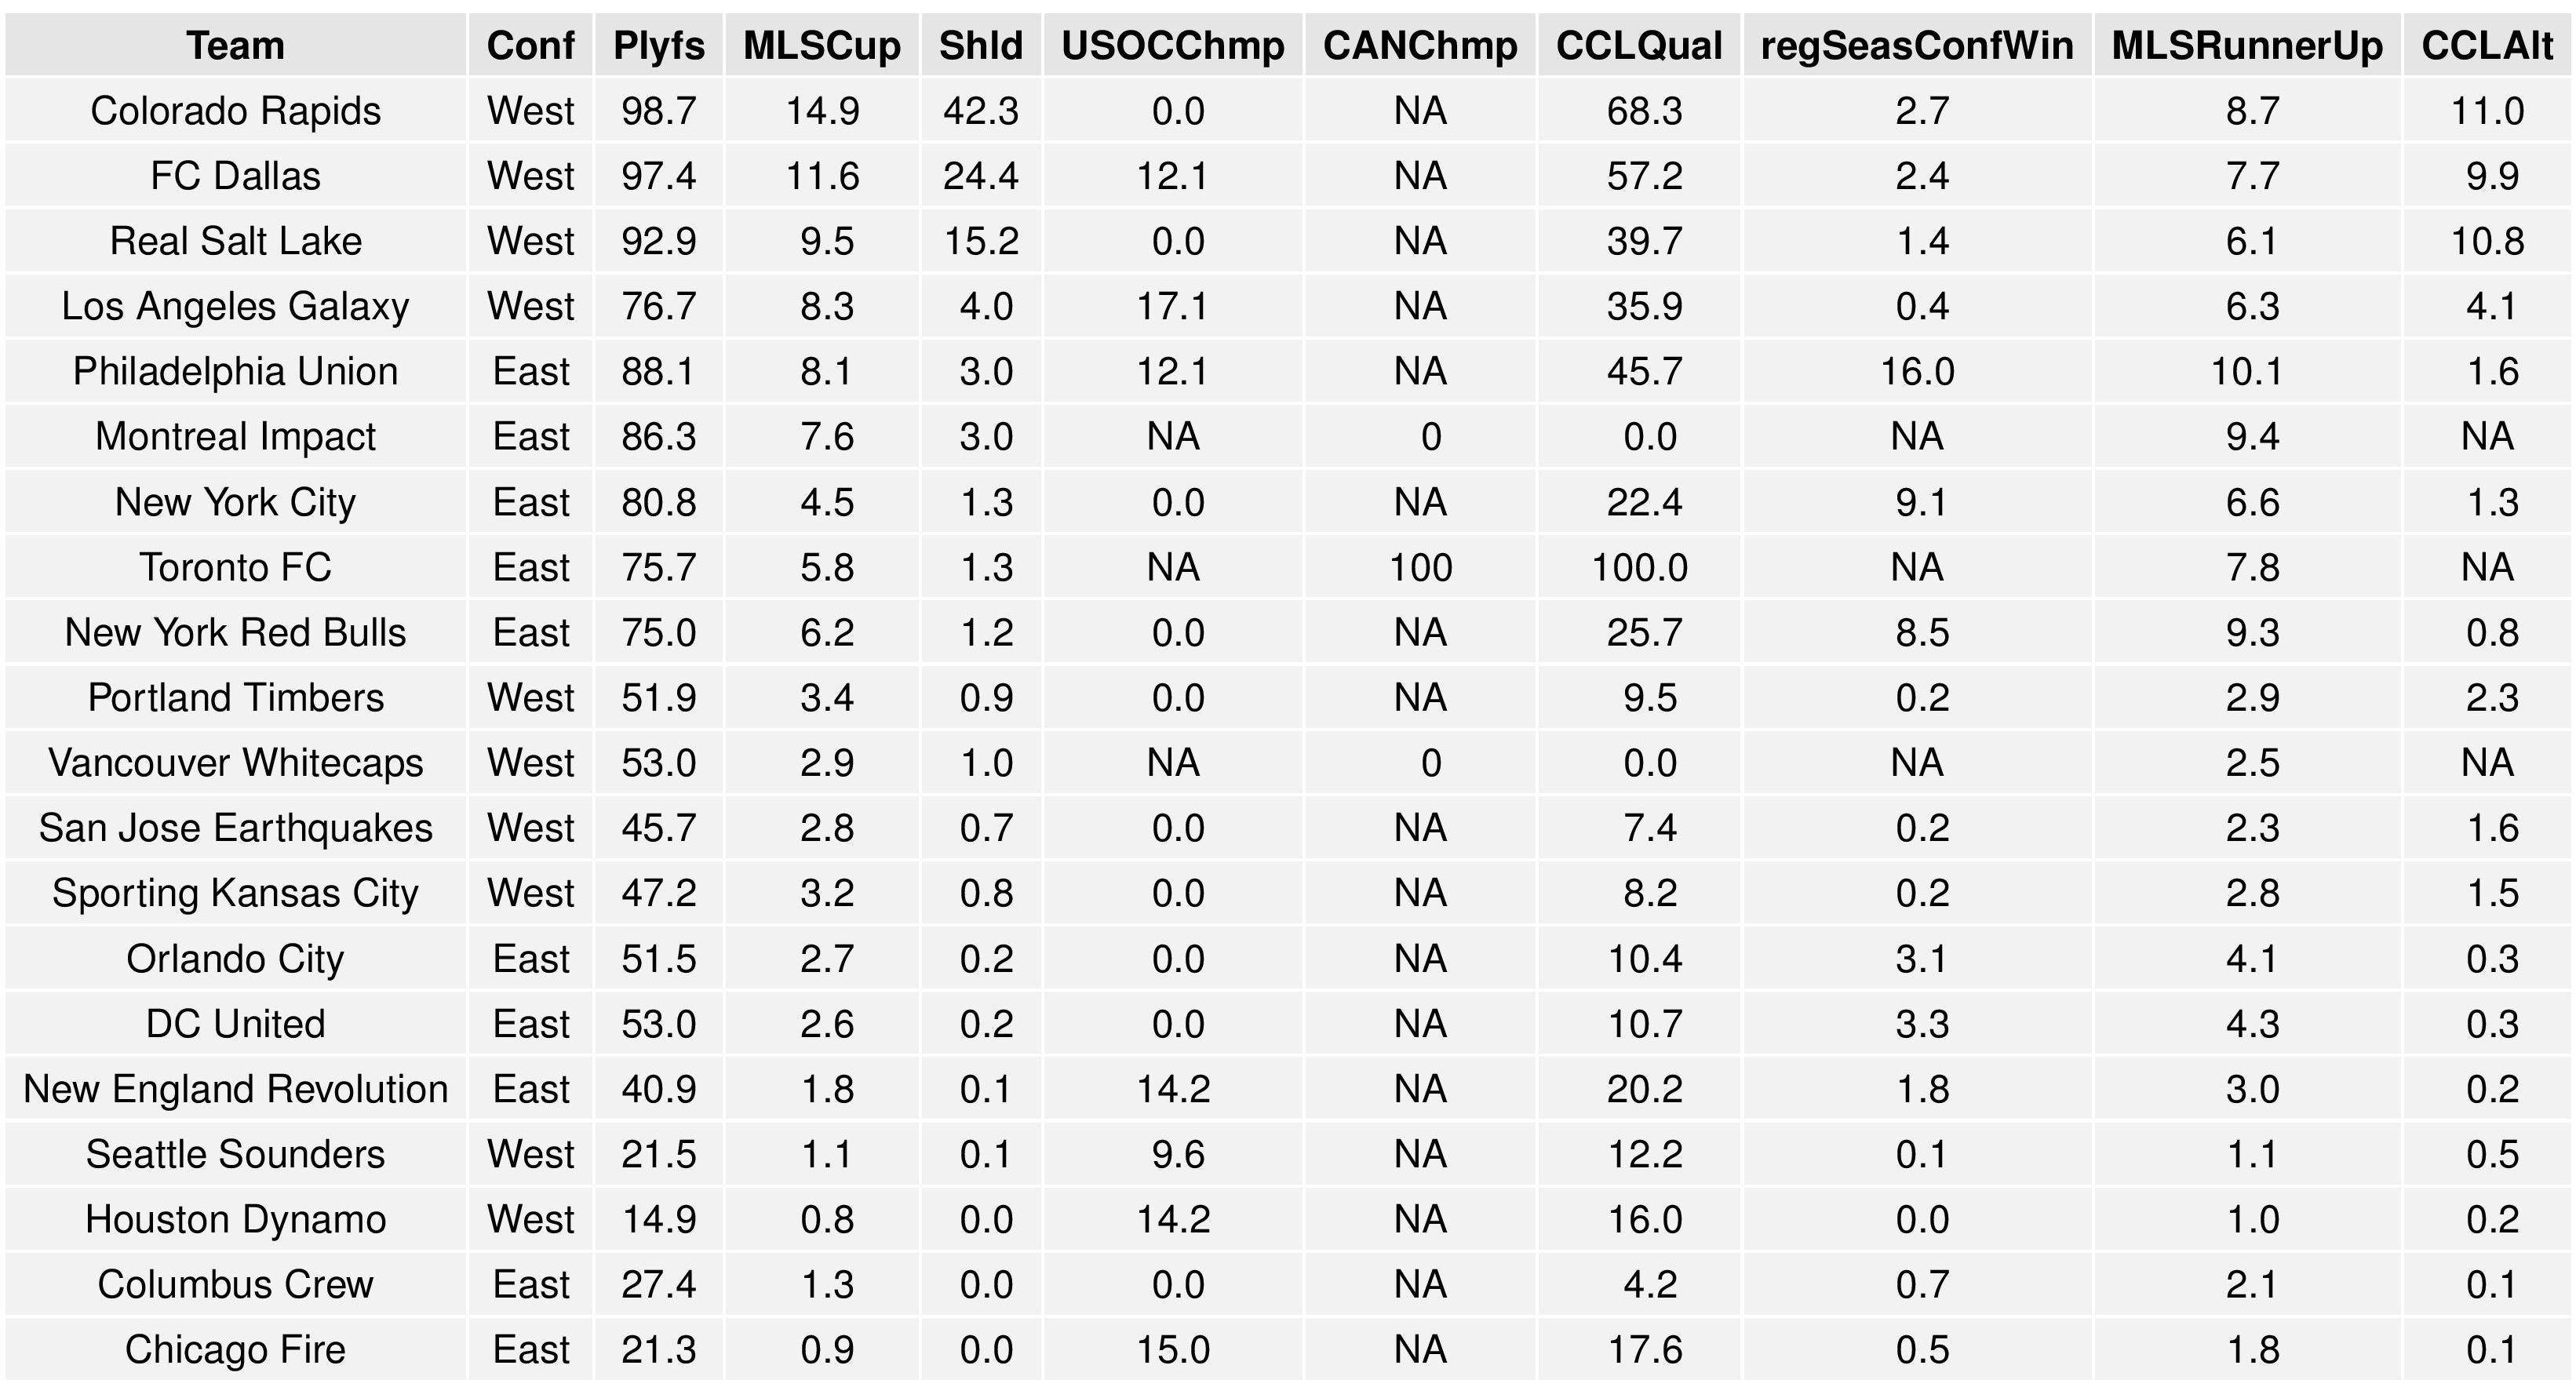
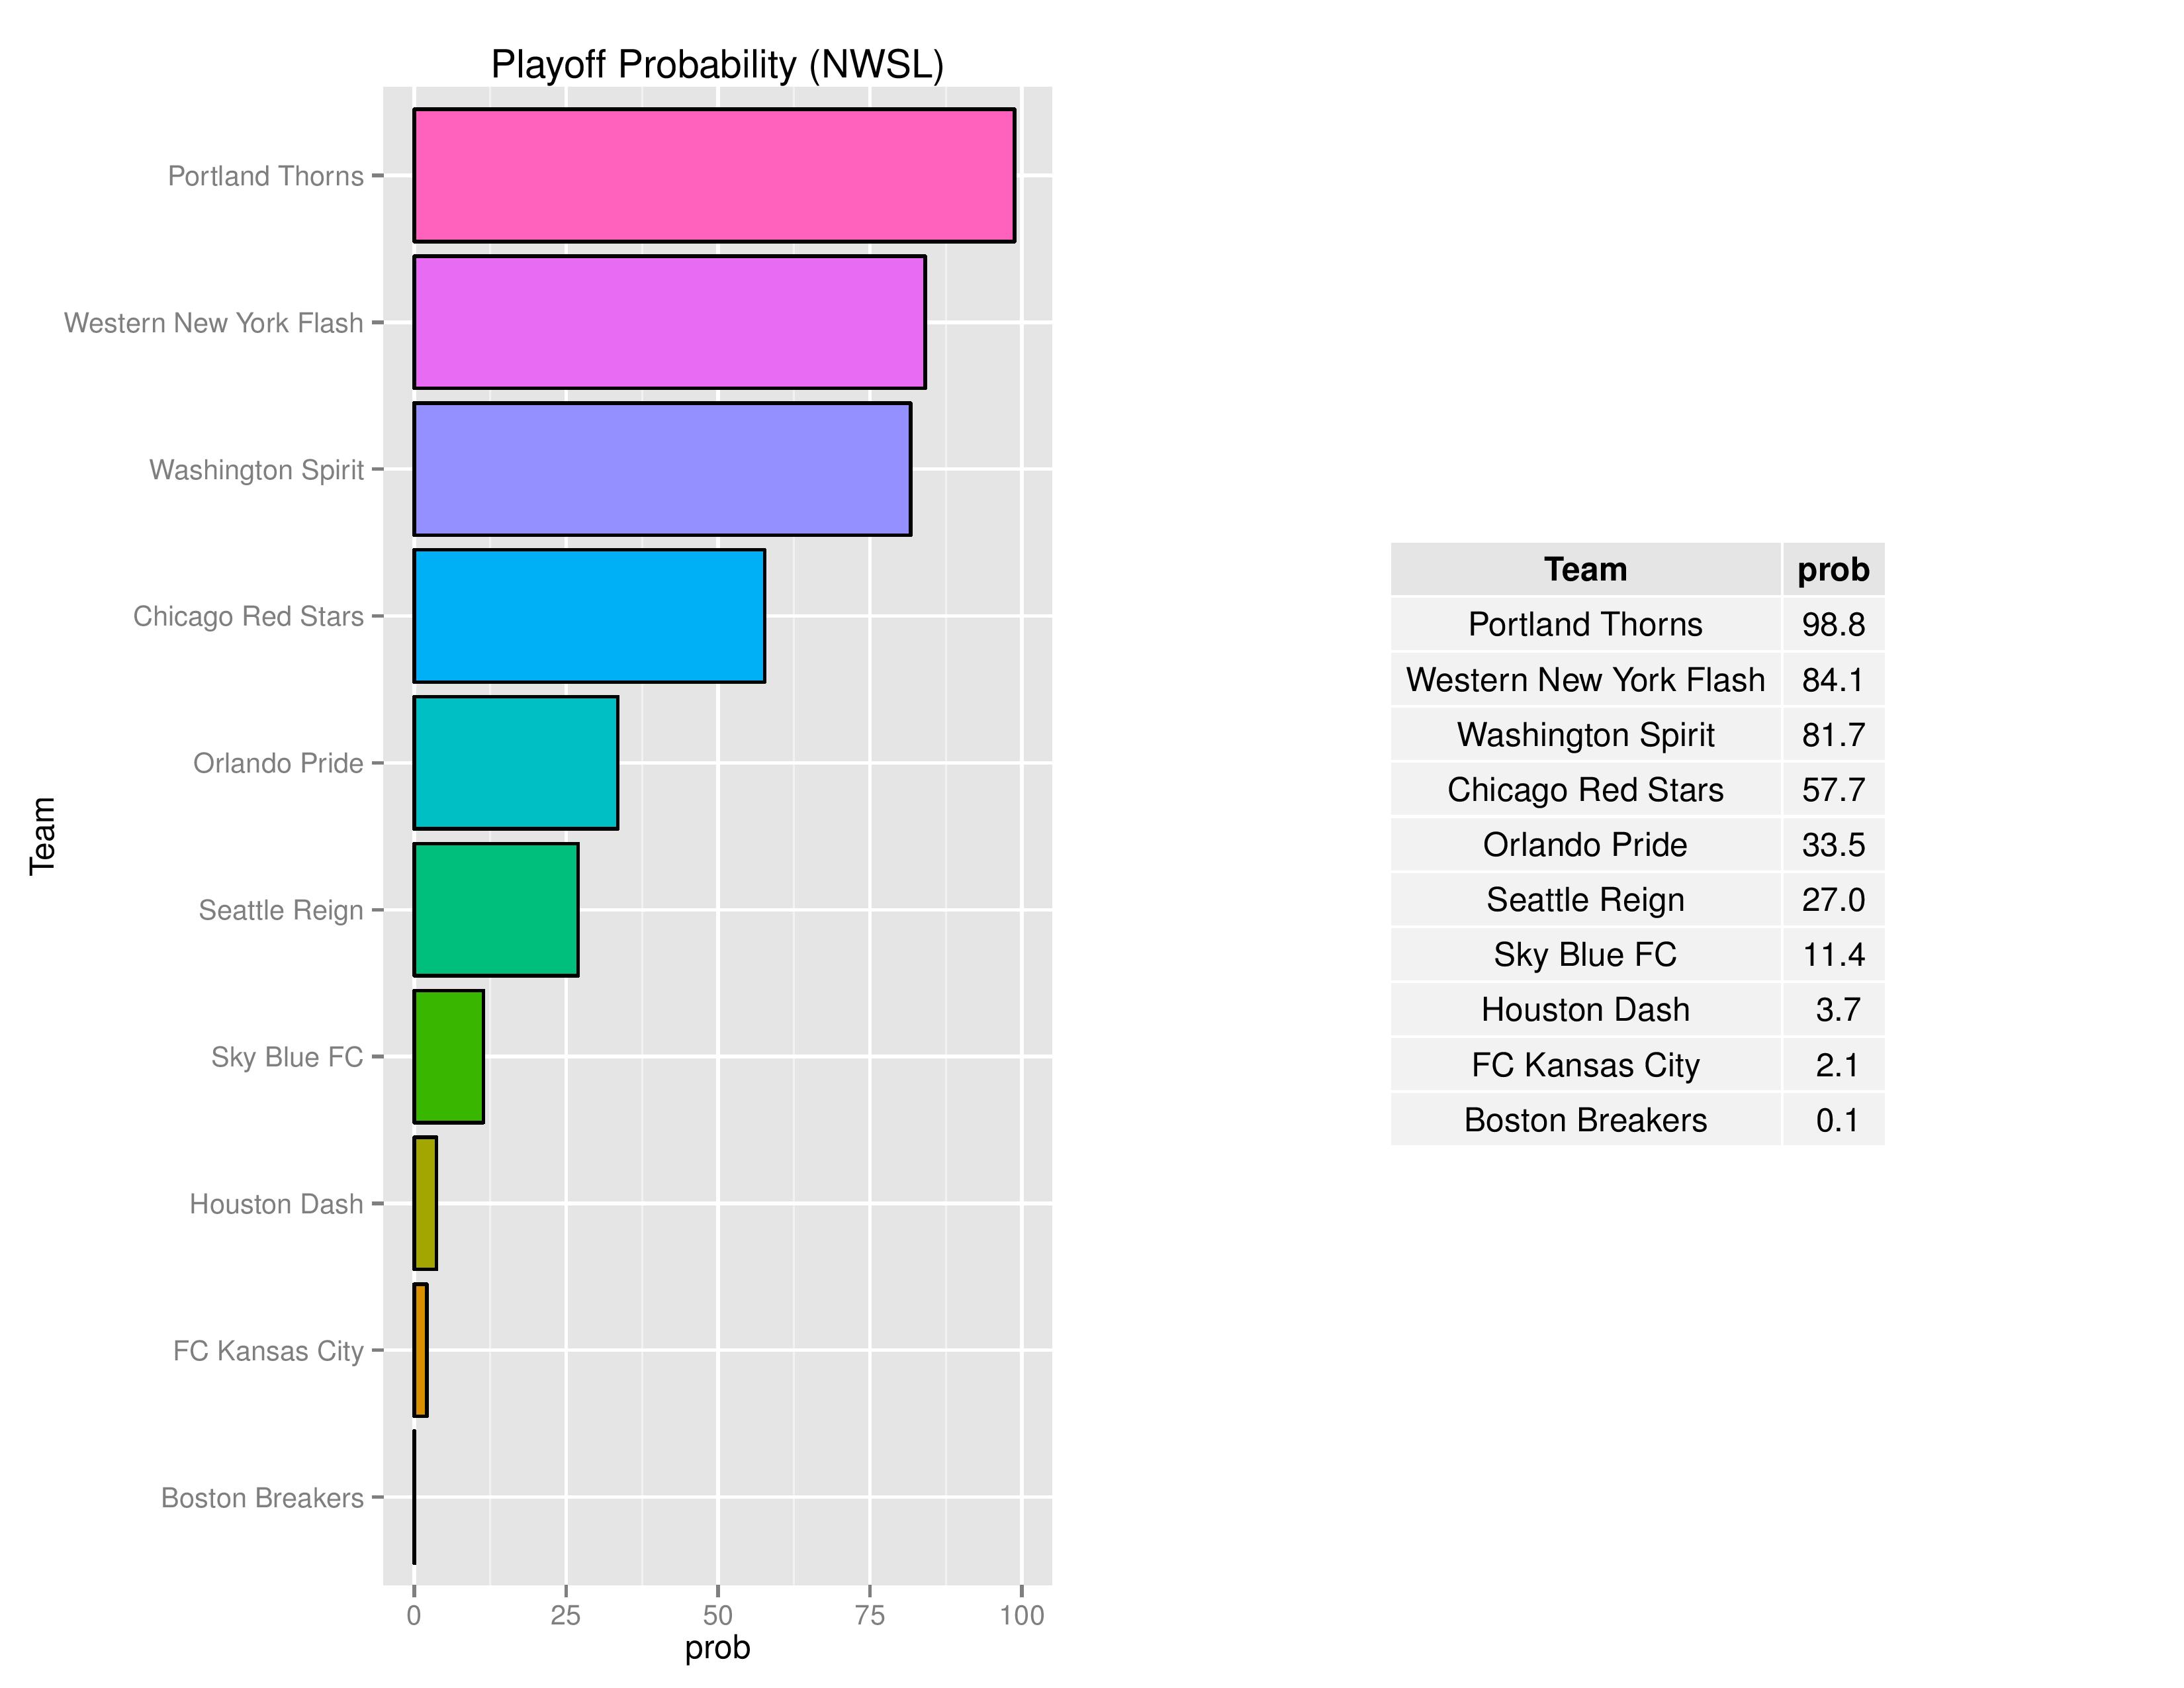
Playoffs probability and more
The following charts show the probabilities for making the playoffs, winning the Supporters’ Shield, winning the MLS Cup, winning the USOC Cup, and qualification for CONCACAF Champions League.
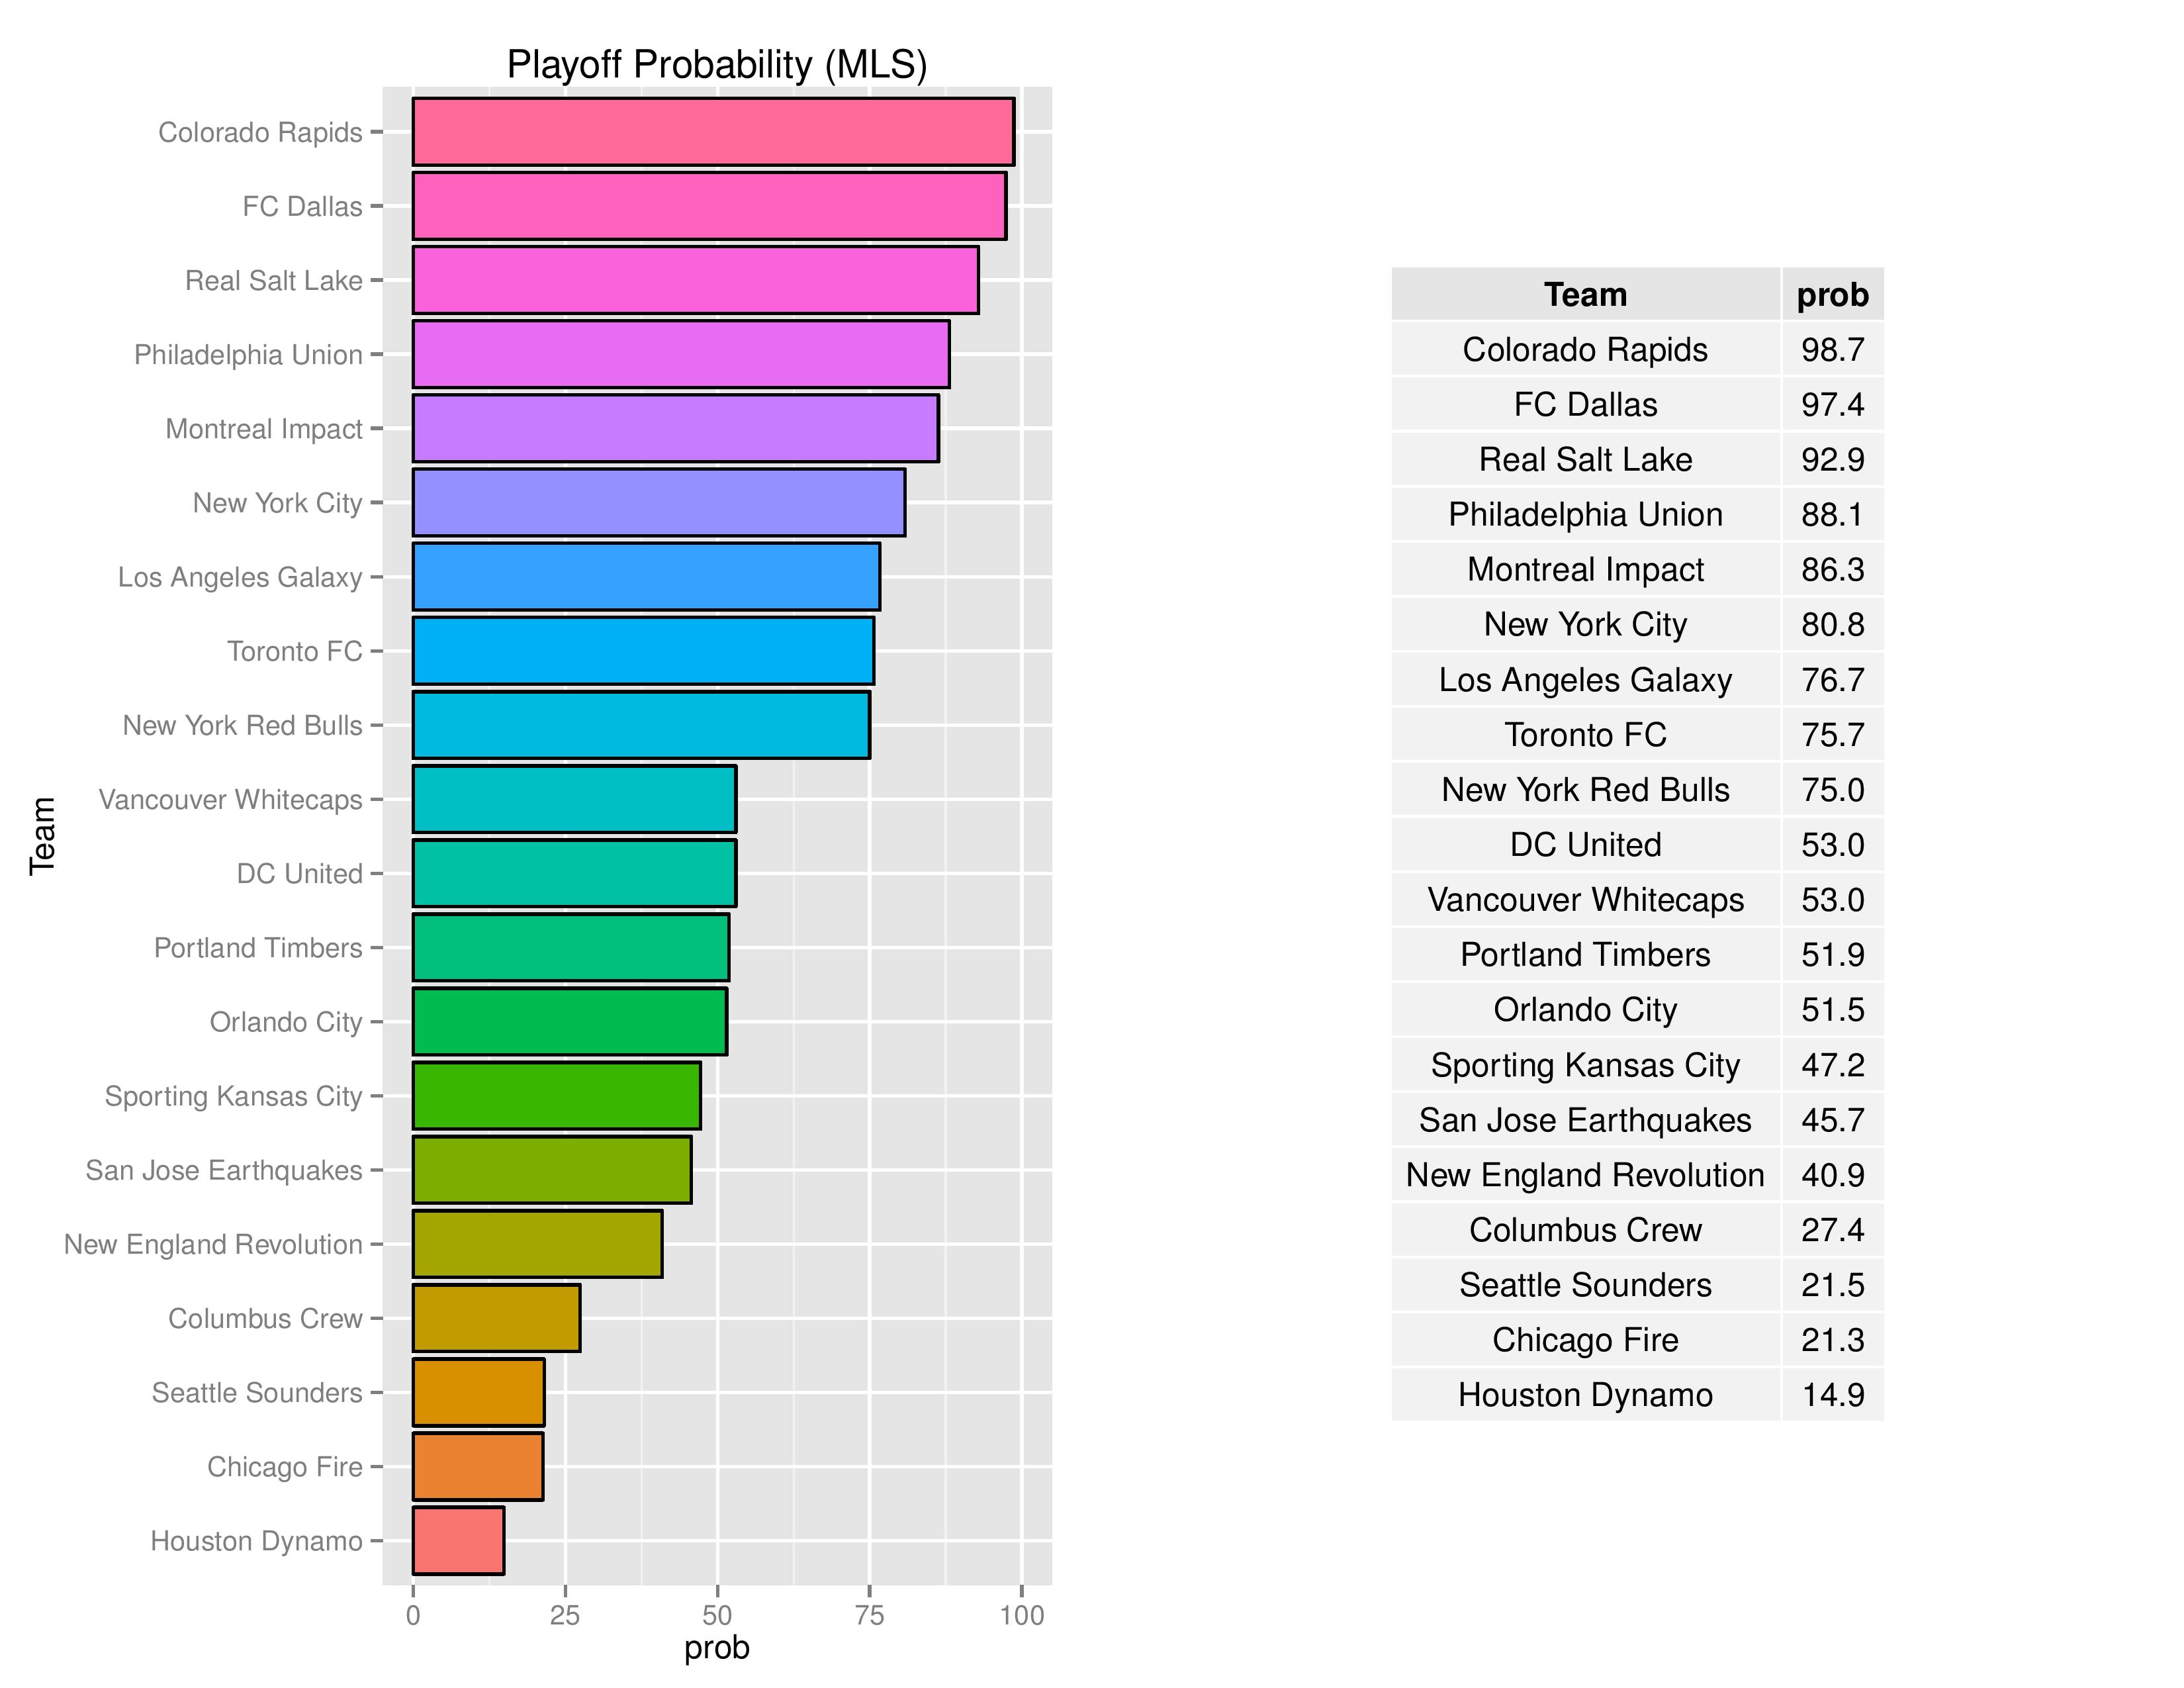
The Union continued their minor decline going from 90.5% to 88.1%.
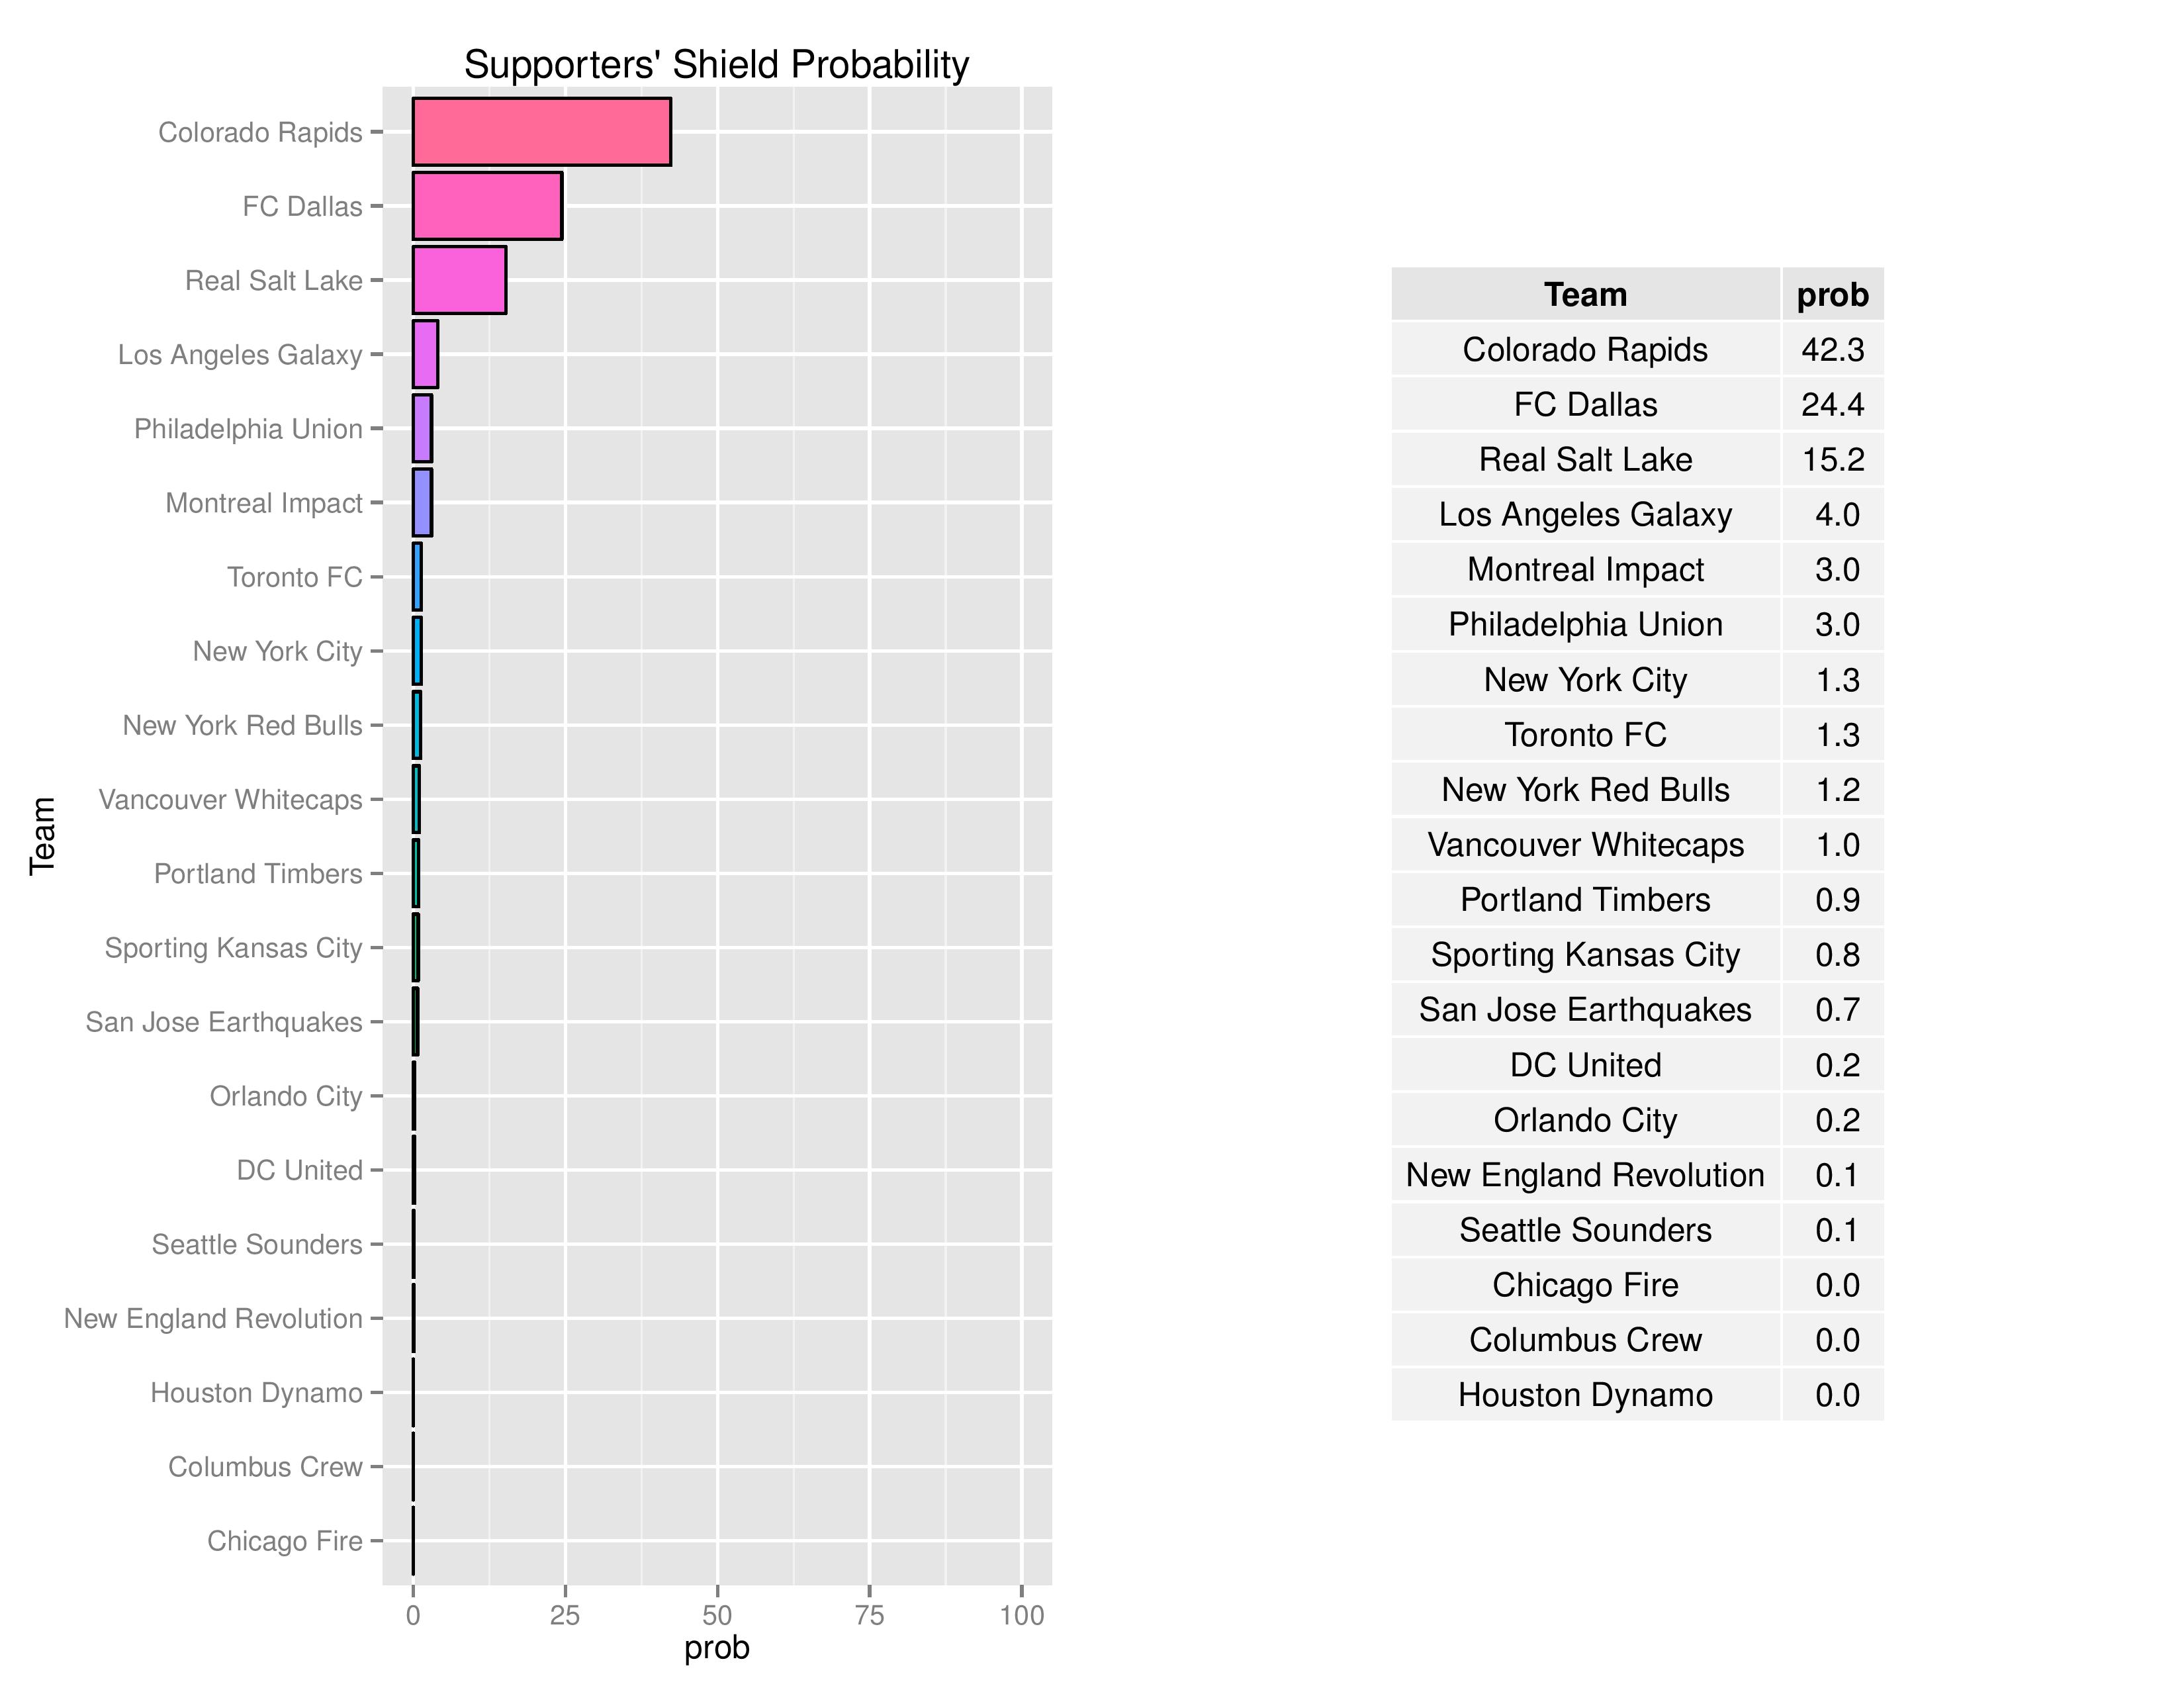
Philadelphia declined again to 3.0% from 3.7% in their odds of claiming the Shield.
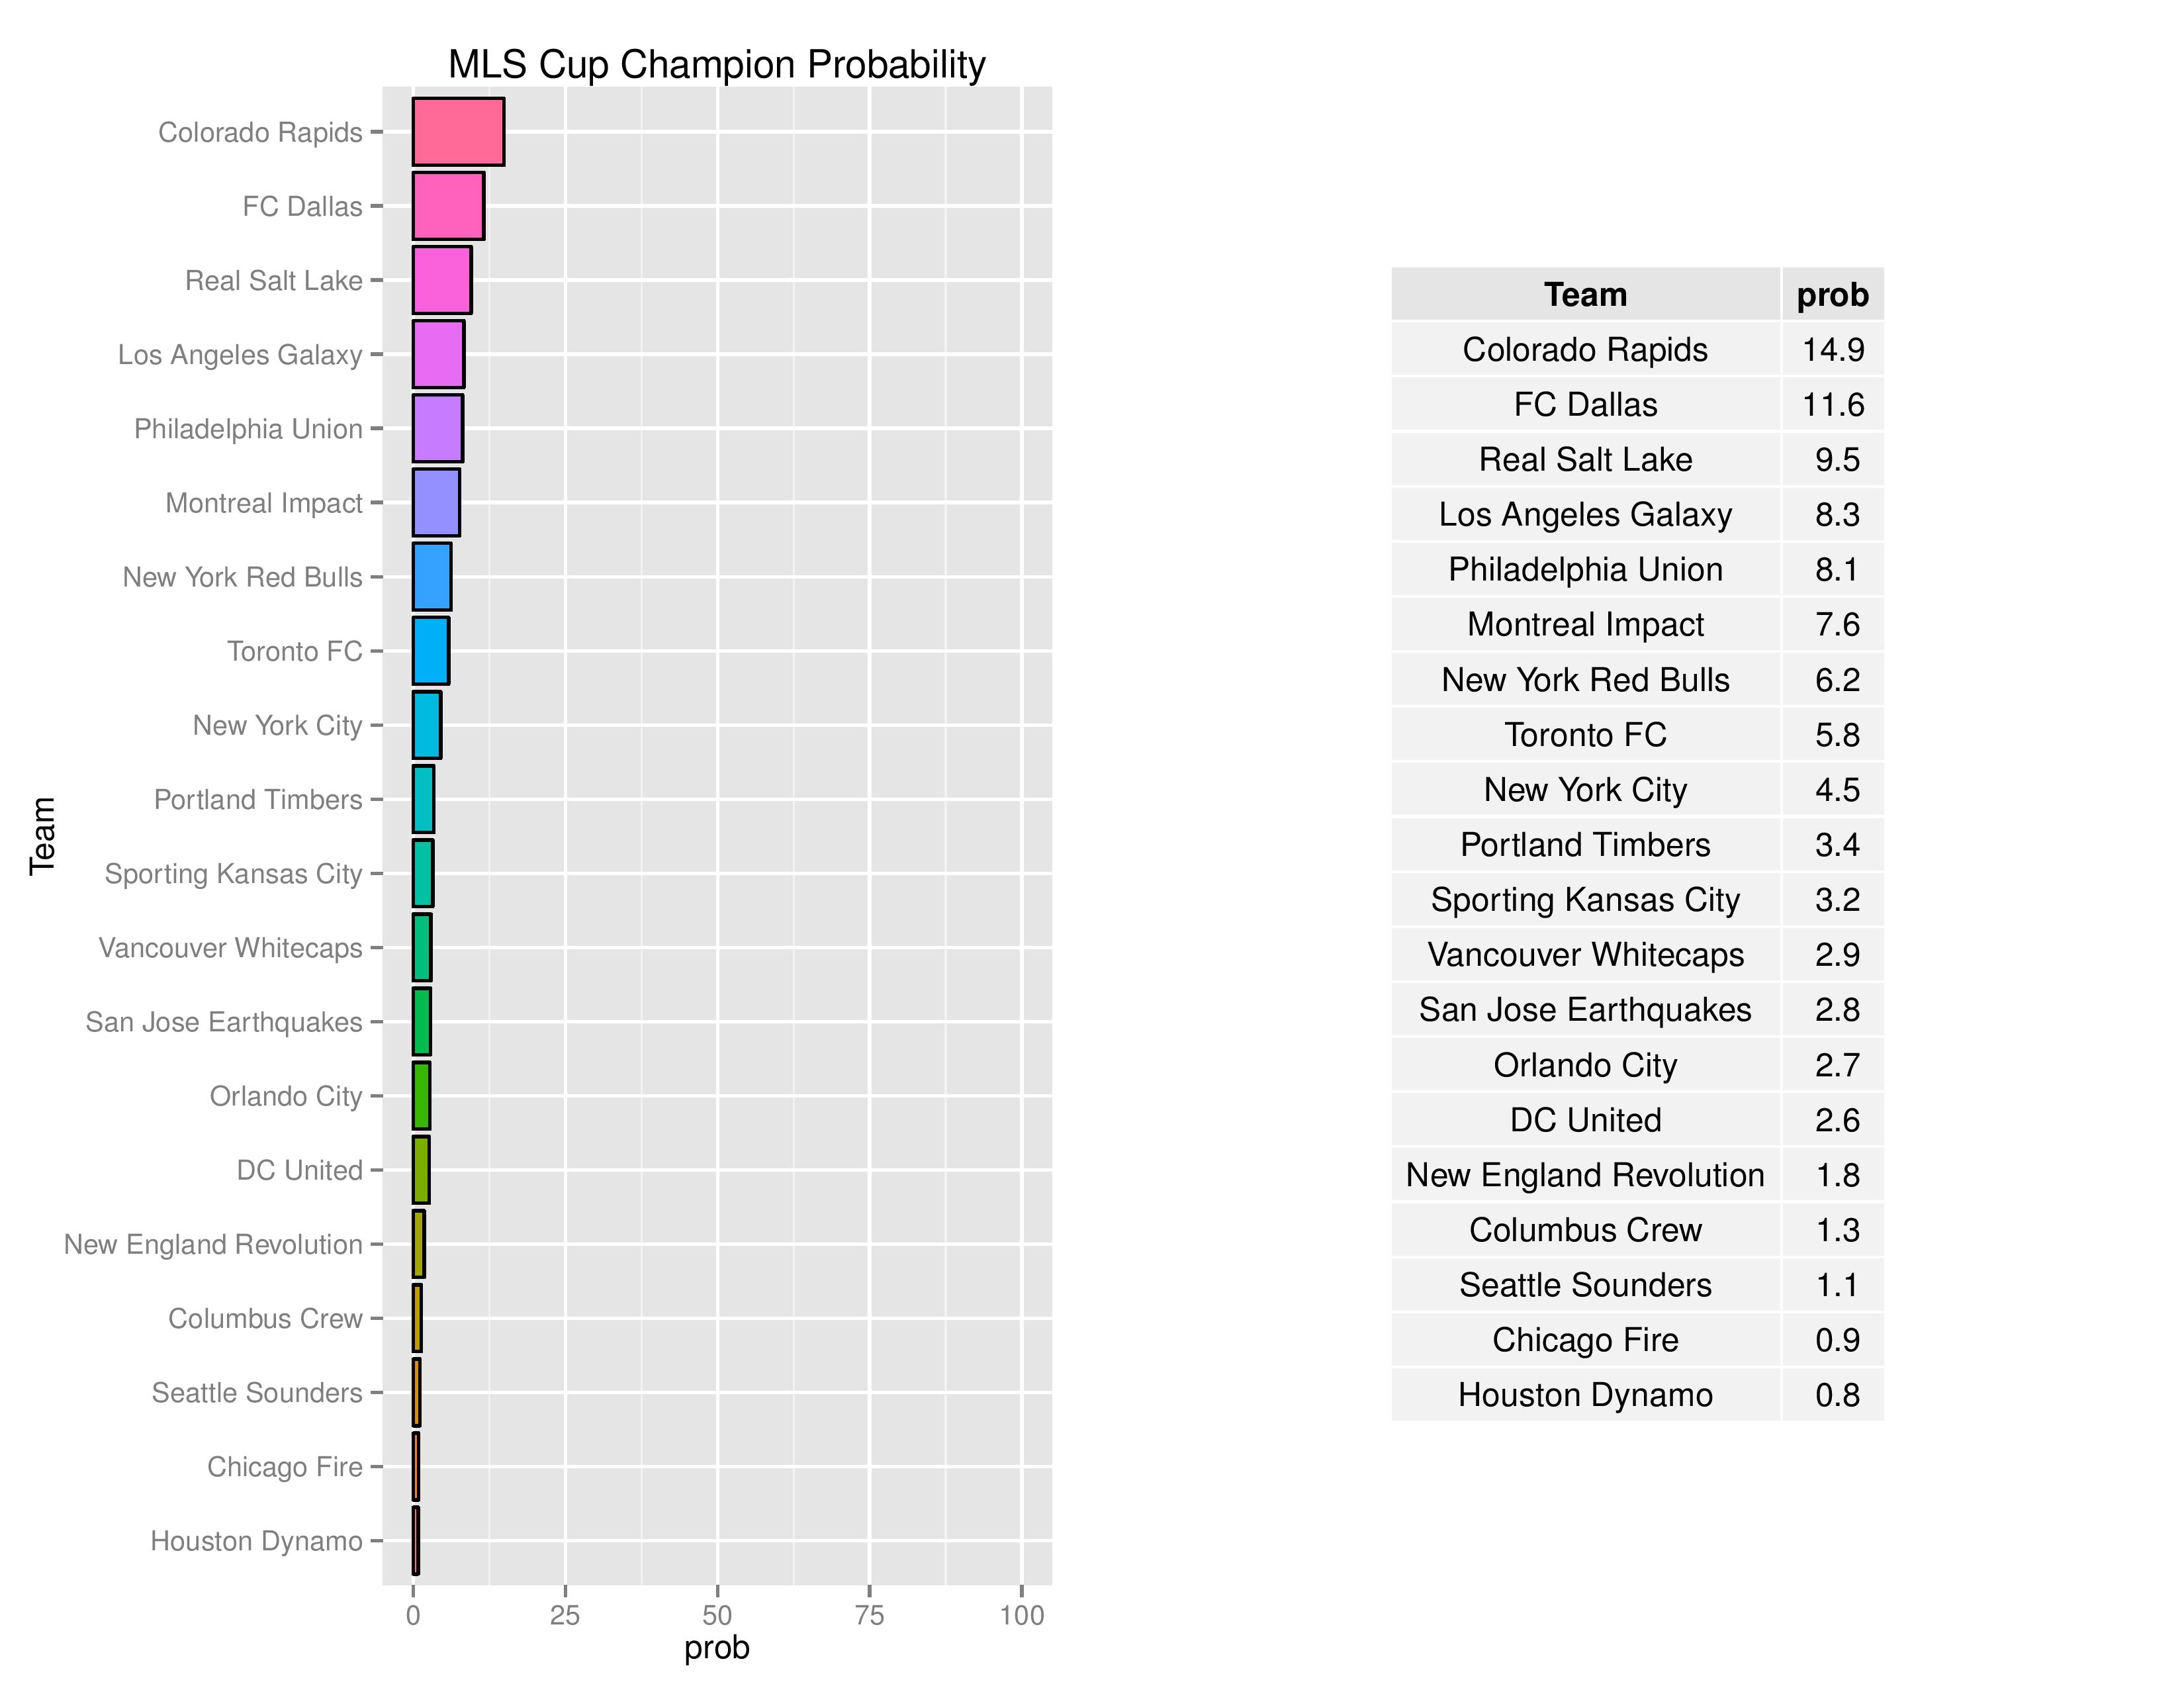
The Union decreased their odds slightly from 8.3% last week to 8.1%.
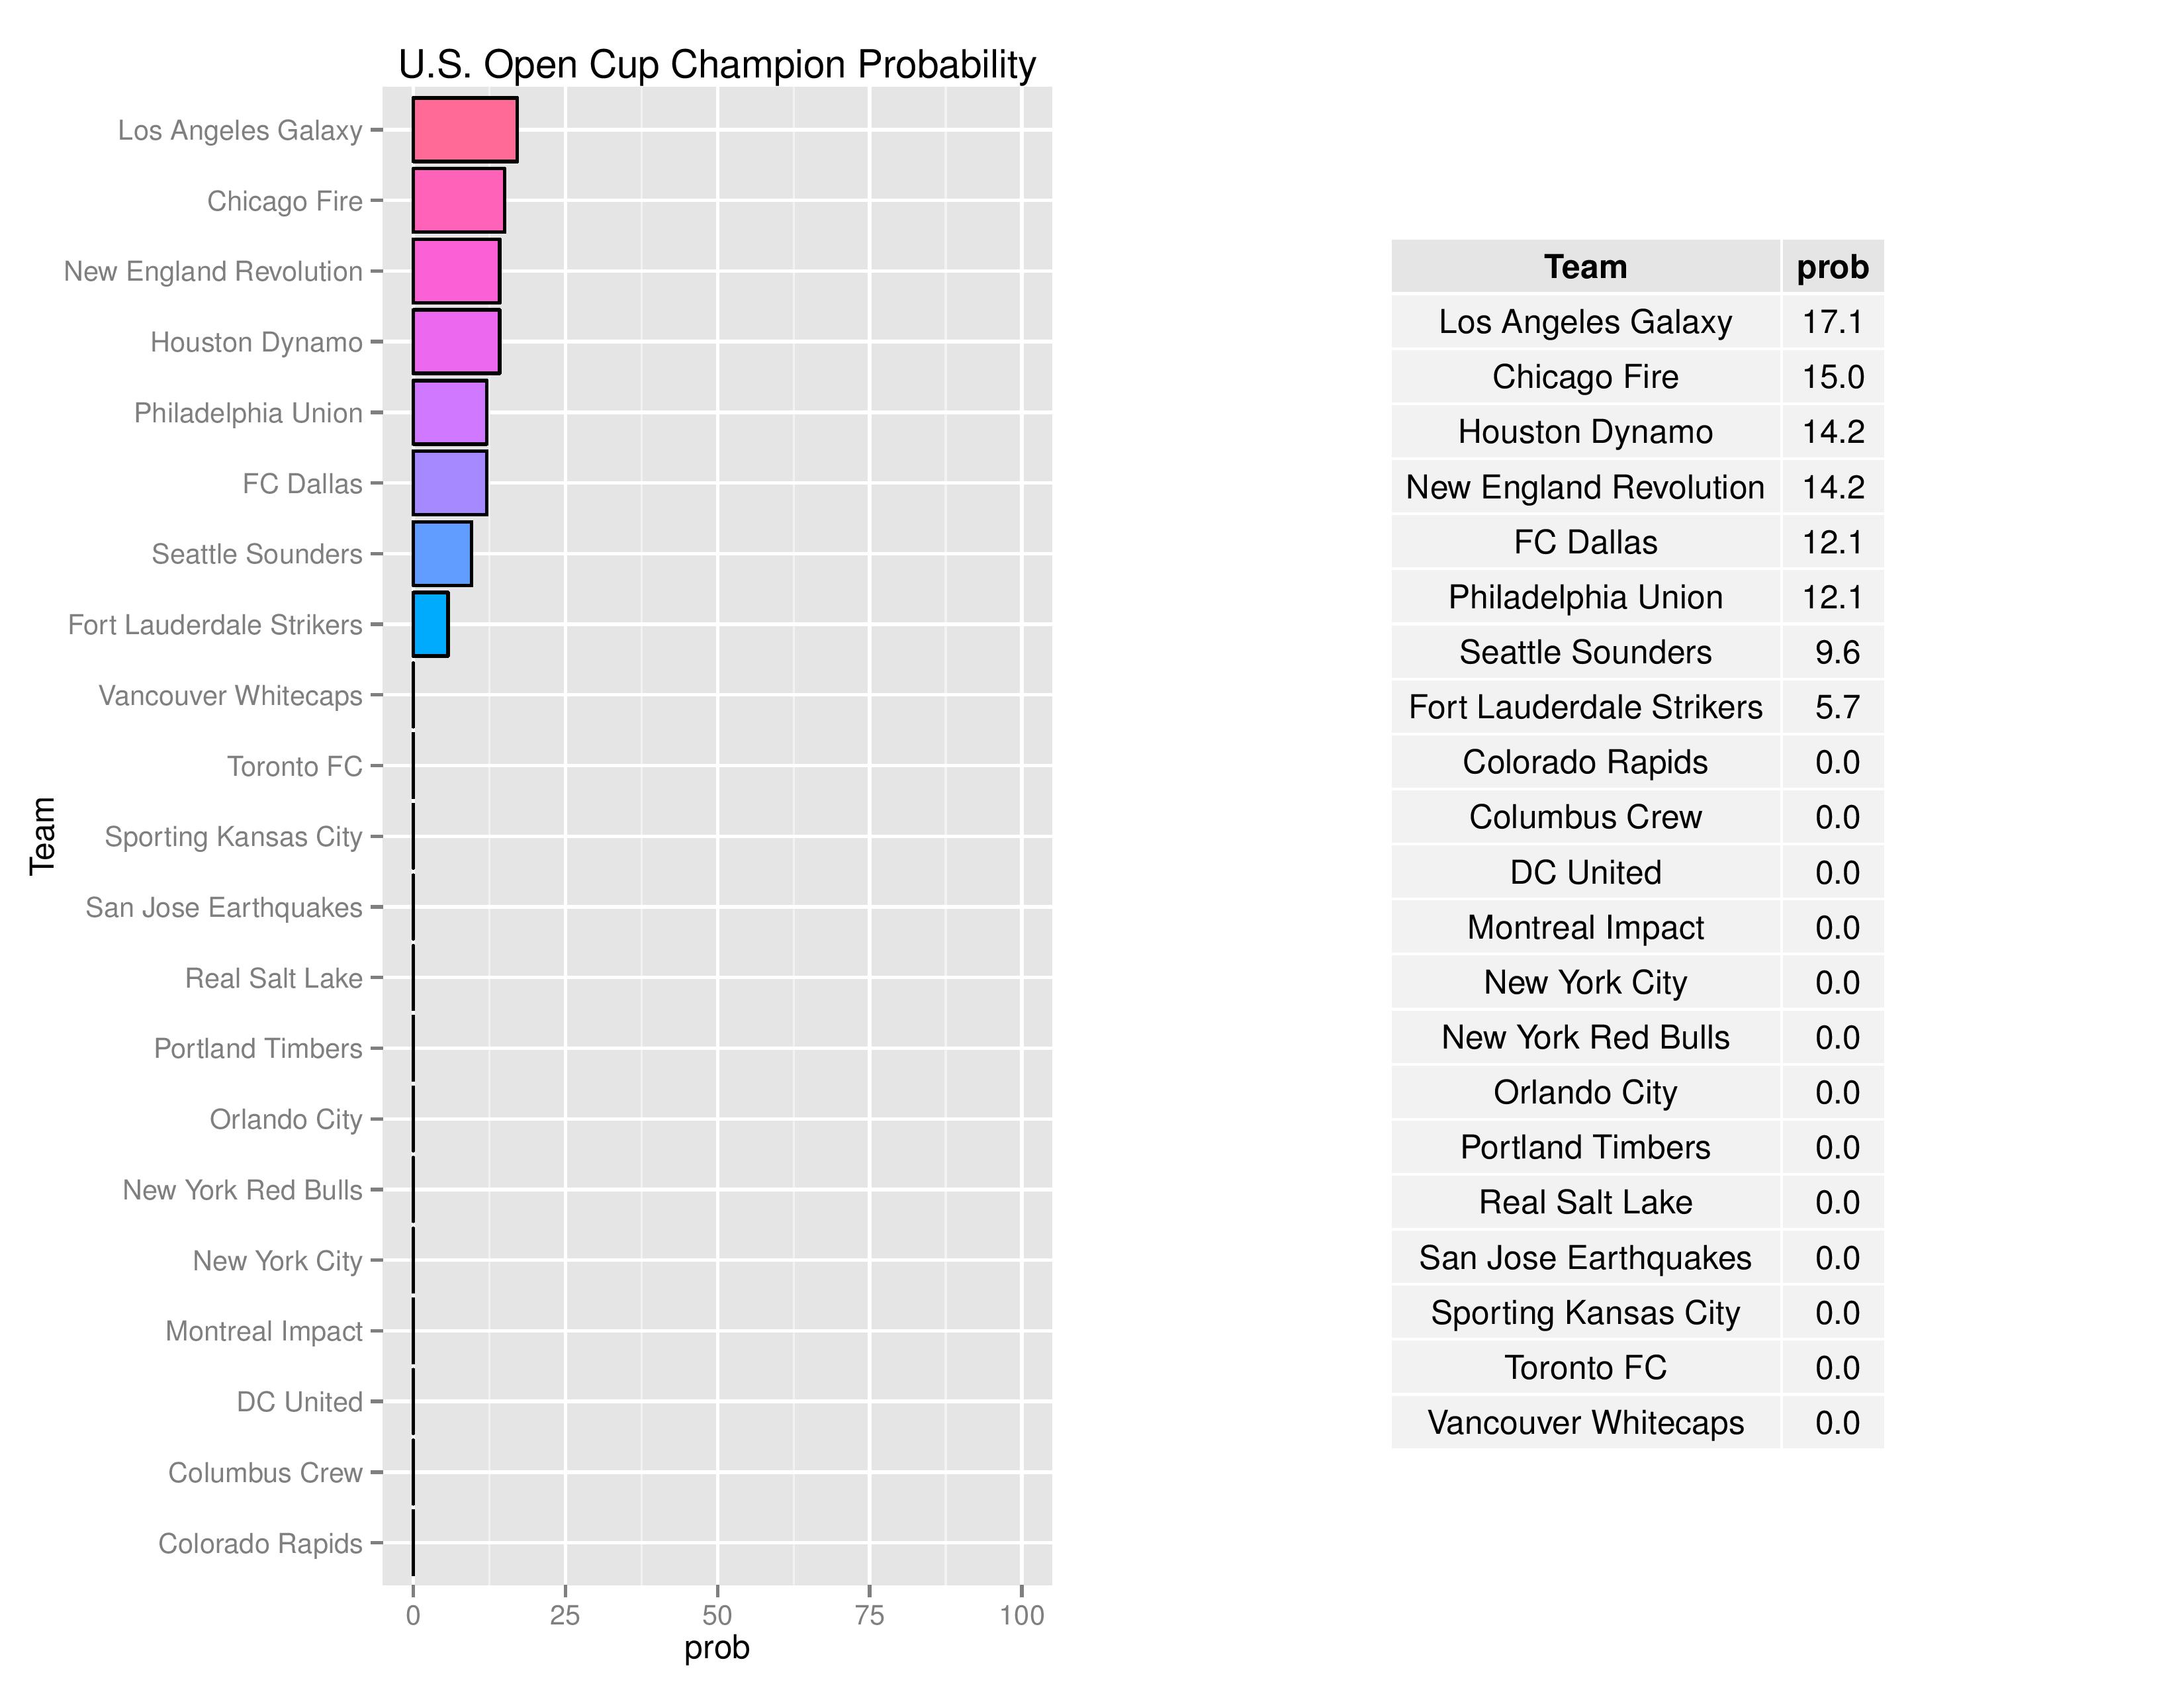
Philadelphia improved to 12.1% from 7.8% in their probability to win the US Open Cup. Now that Philadelphia’s only pre-determined match is Away, they are among the less probable teams.
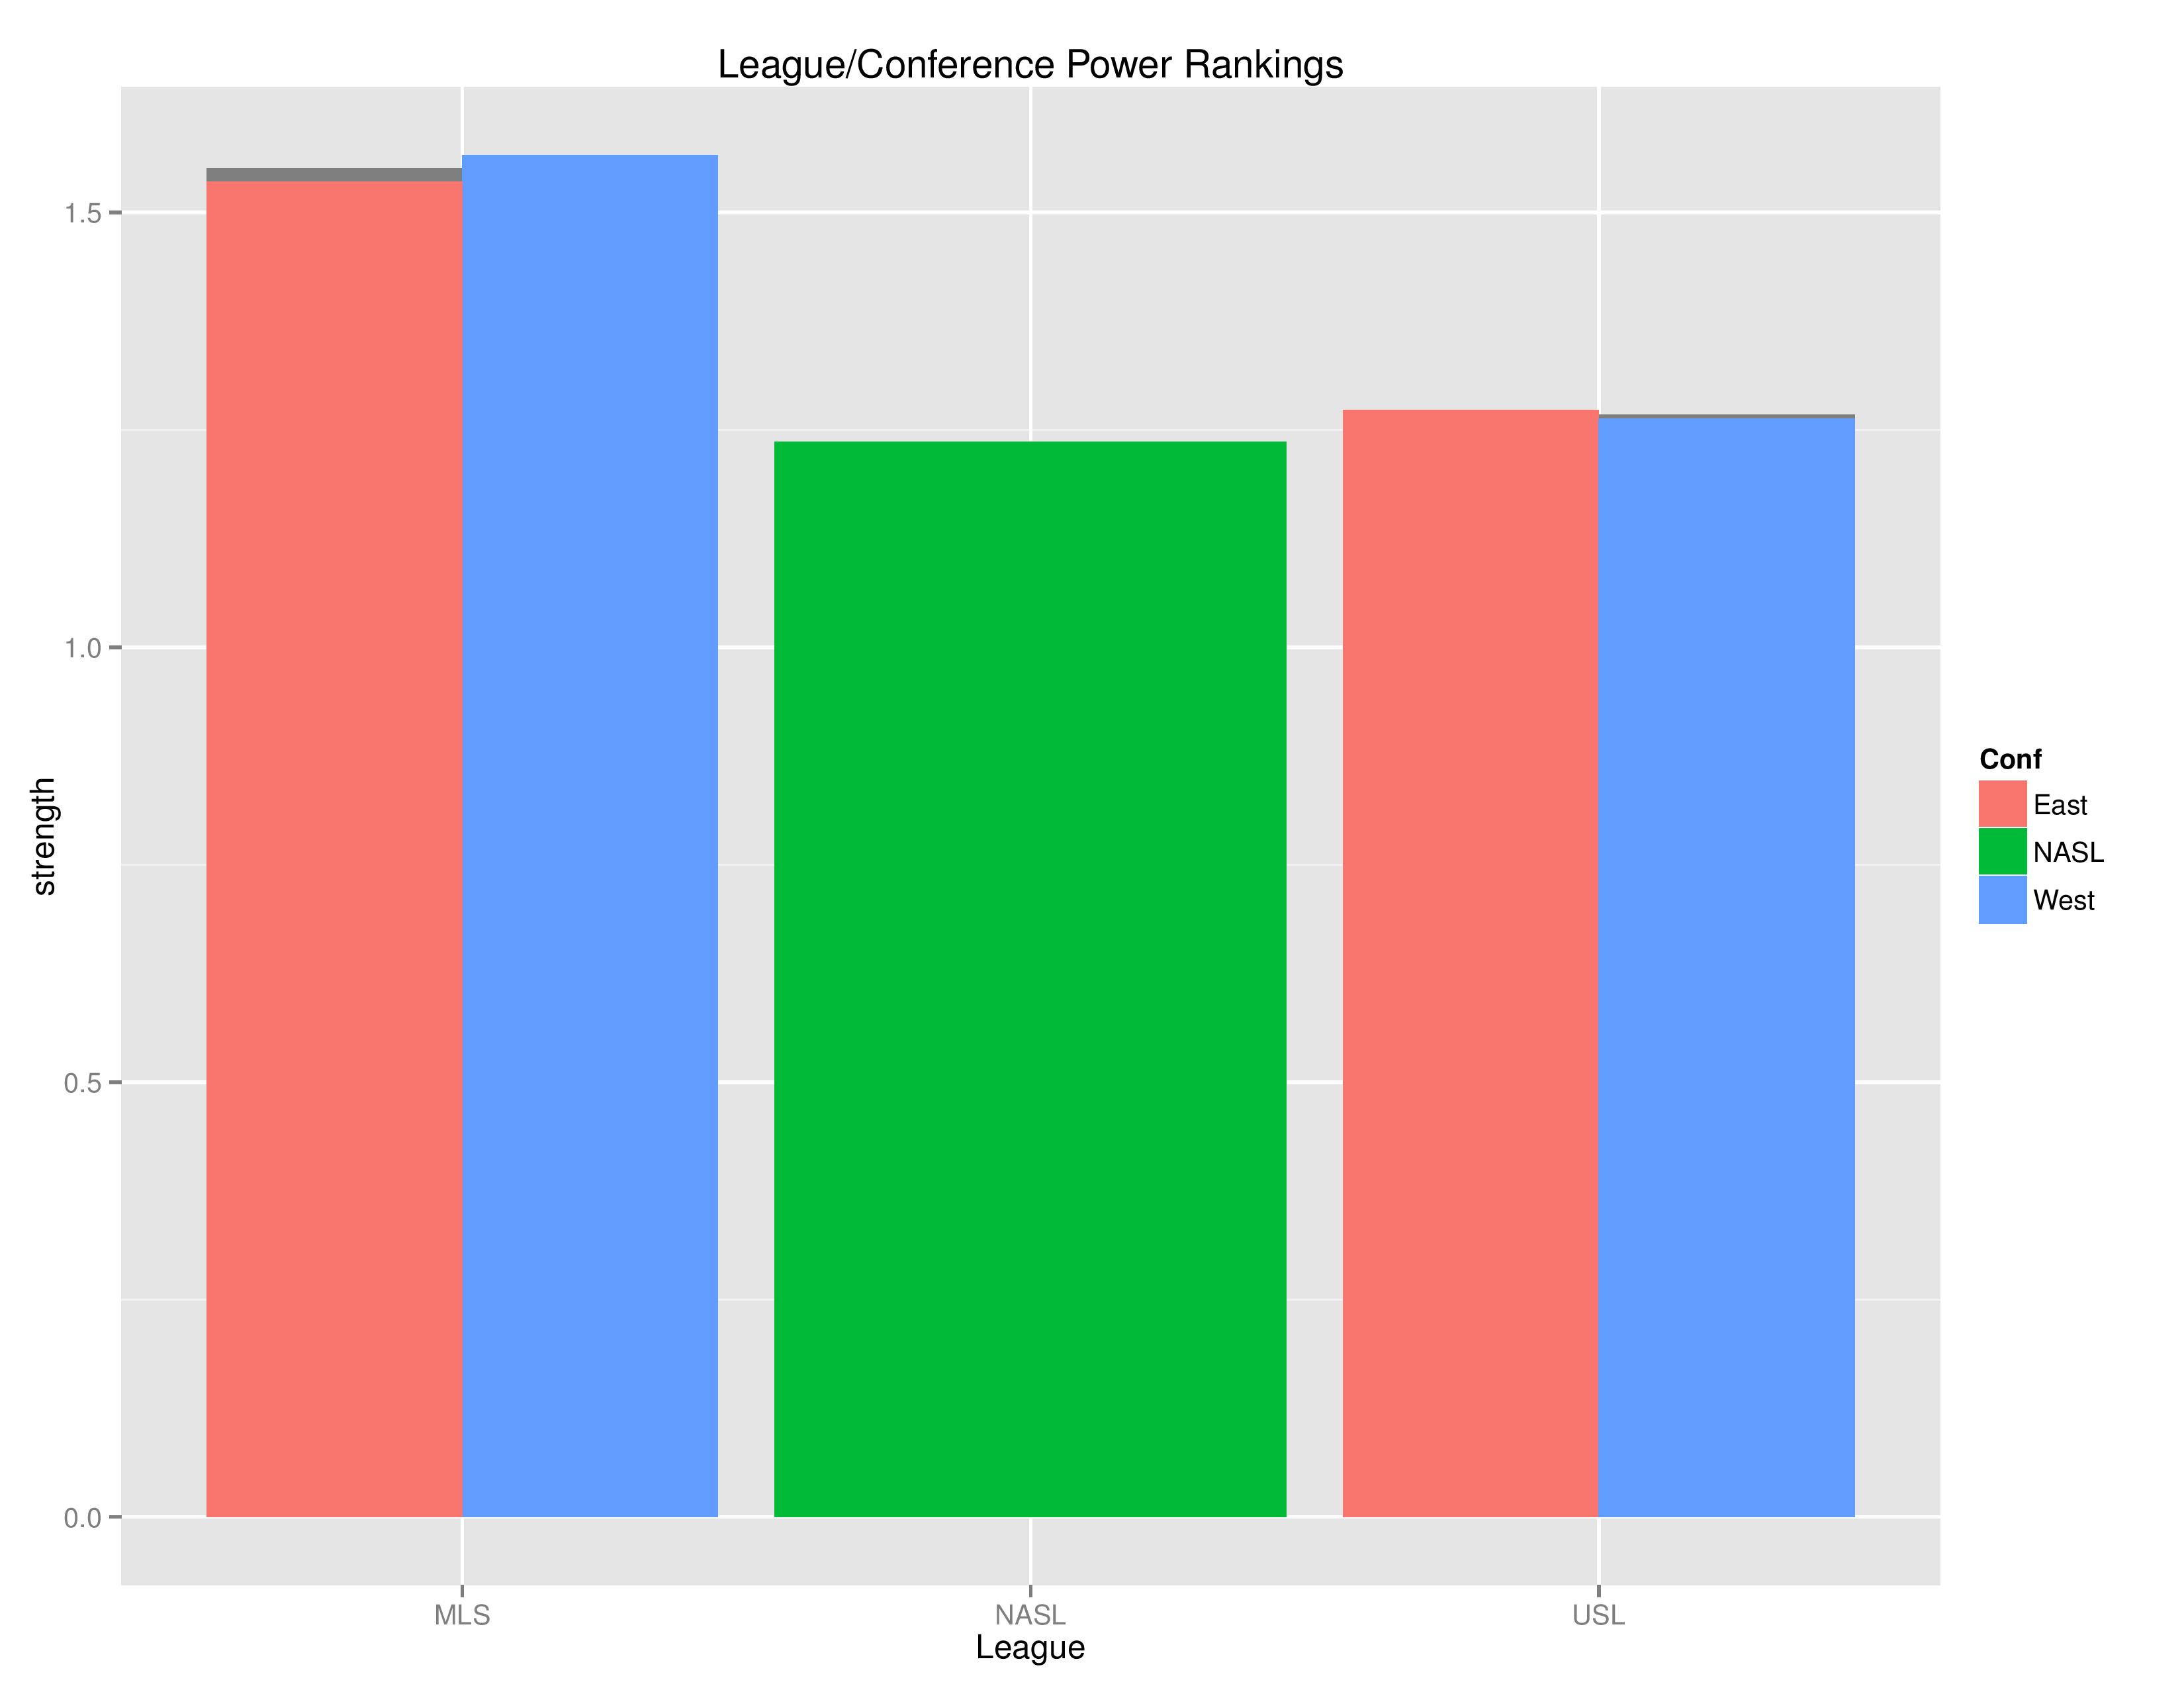
The above shows how the model rates each U.S. league & conference compared to one another. This is based on an all vs. all assessment rather than a top vs. top assessment. MLS is clearly rated as superior to either NASL or USL. USL has a slight edge over NASL though despite NASL still having two teams available in the USOC. This also shows the MLS-West outperforming MLS-East and USL-East slightly outperforming USL-West.
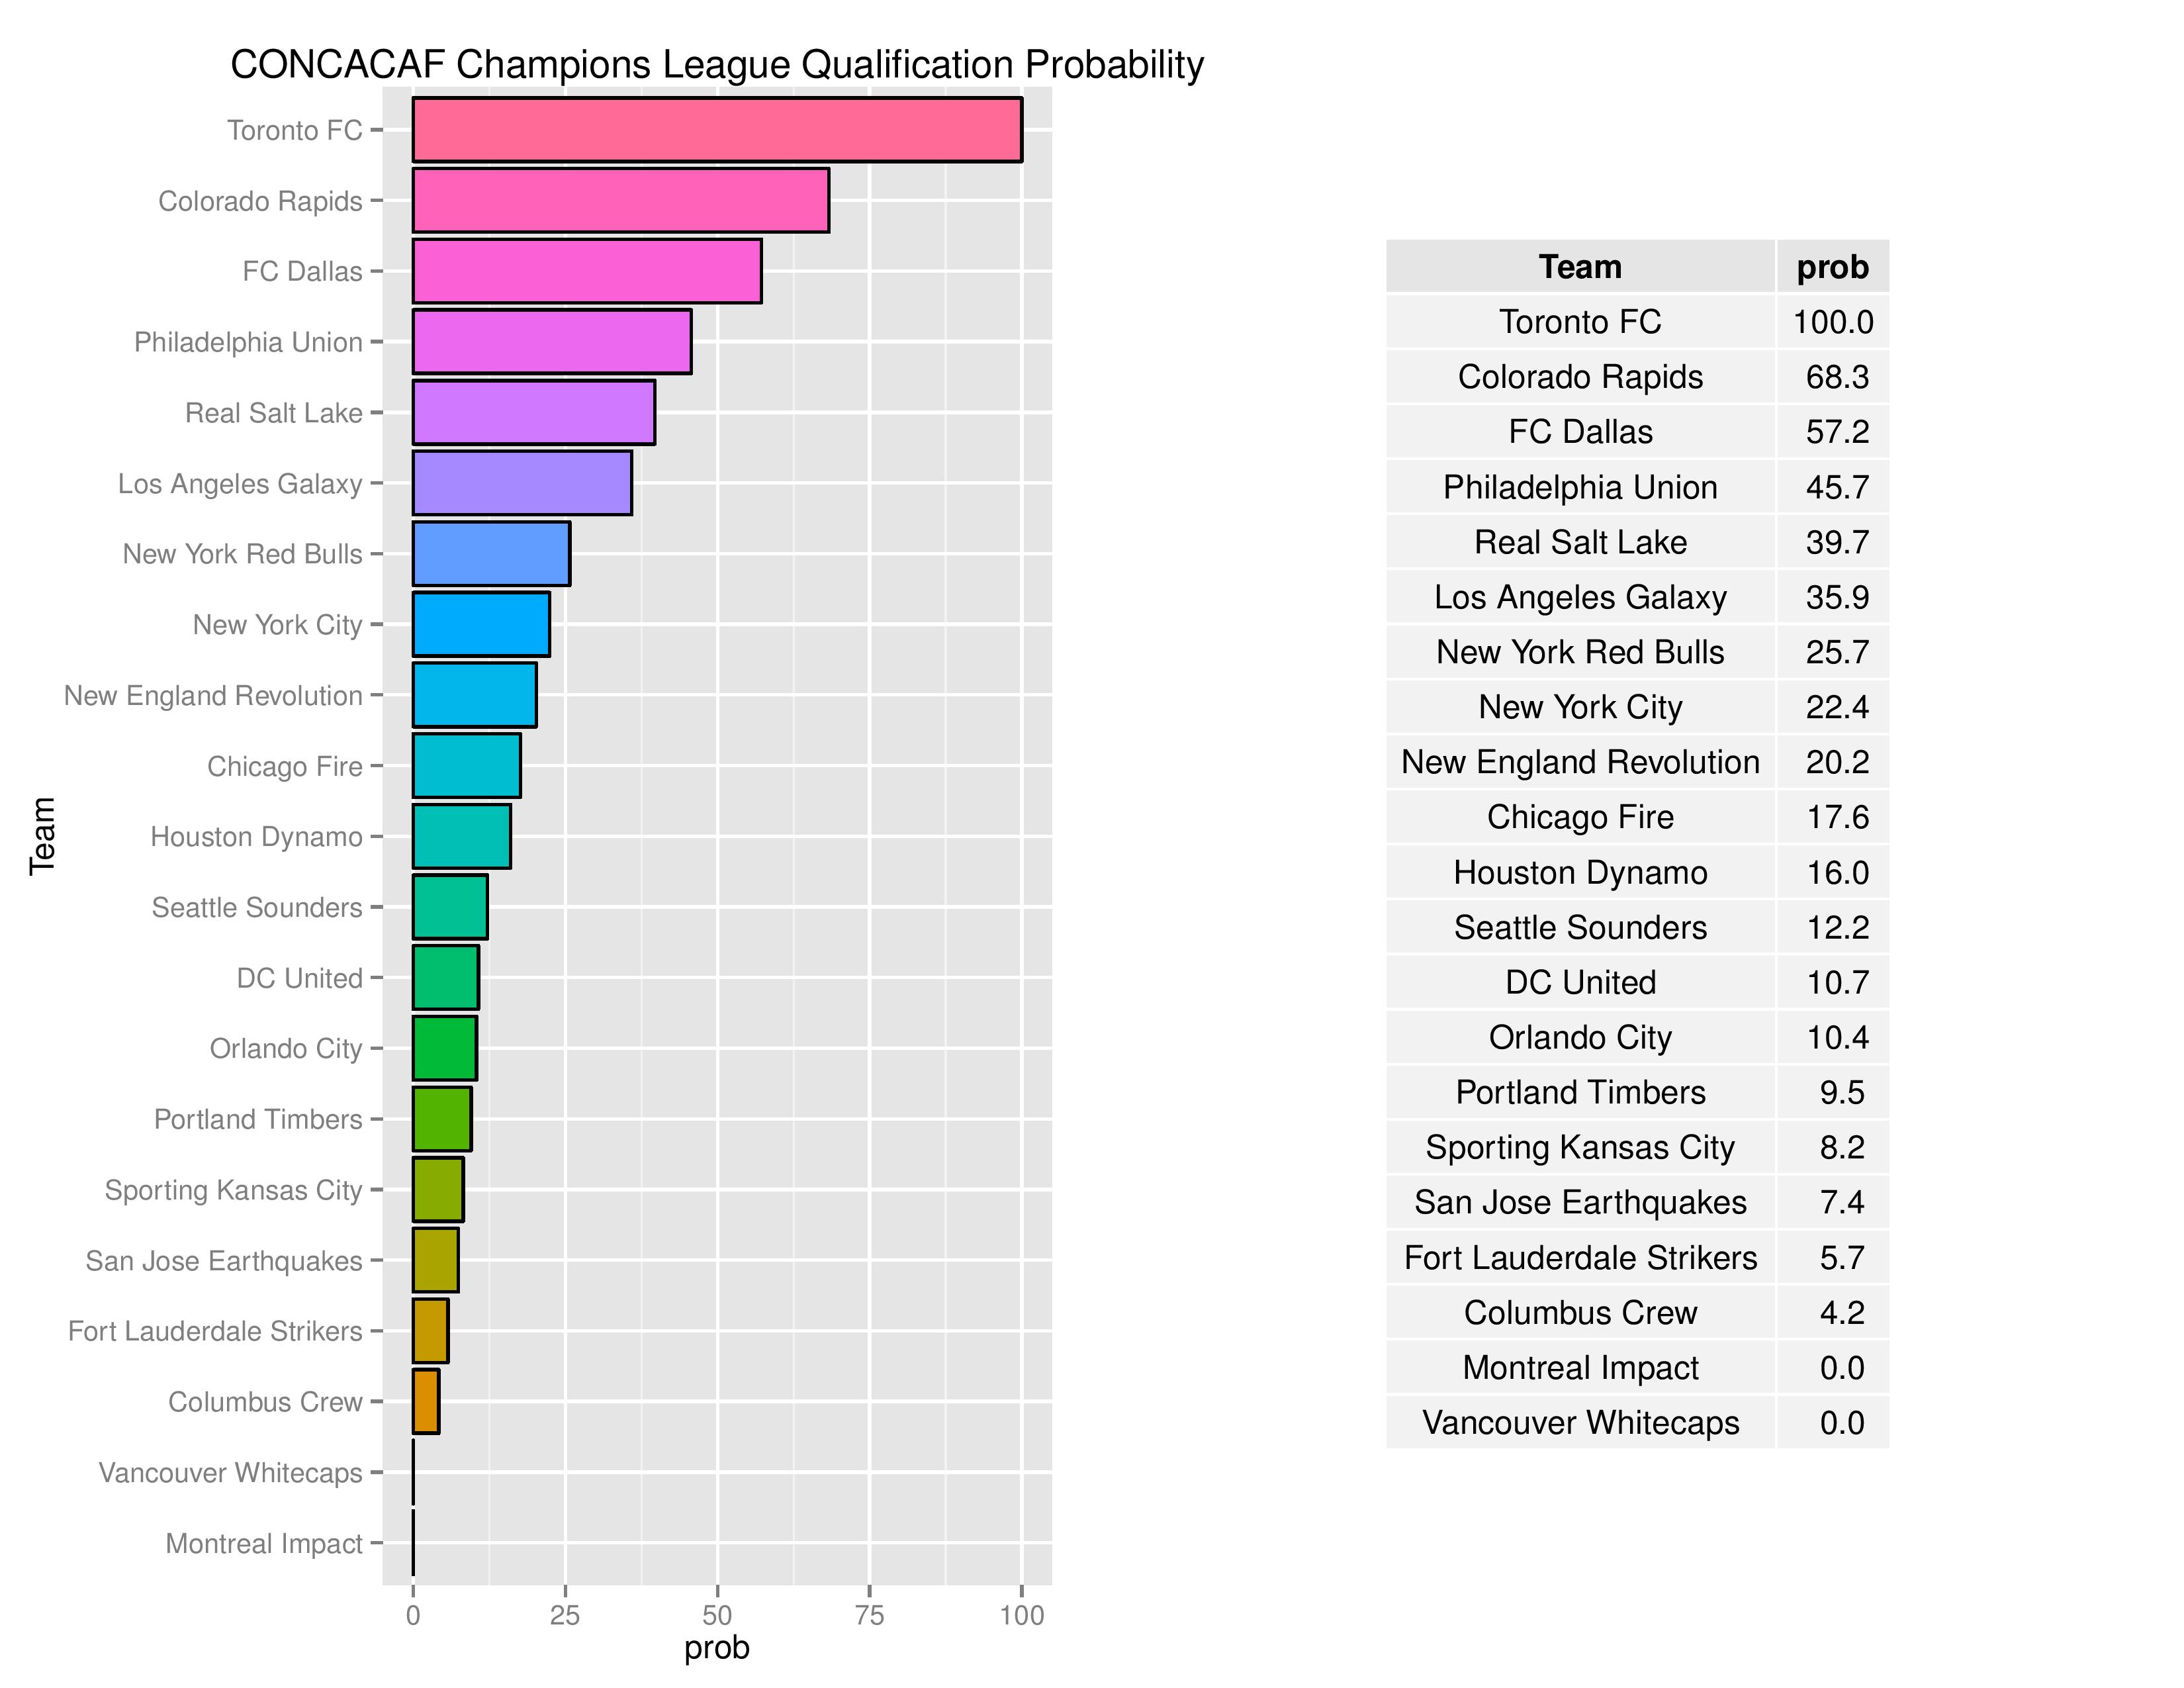
Philadelphia’s probability of qualifying for the CCL reduced slightly from 46.0% to 45.7%. Toronto FC has clinched their spot in the CONCACAF Champions League by winning the Canadian Championship last week. I also find it amusing to see the Fort Lauderdale Strikers (NASL) have a better chance of qualifying for the CCL than the Columbus Crew.
As a reminder, U.S. teams qualify for the CCL by winning the MLS Cup, winning a conference in the regular season (including Supporters’ Shield), and by winning the U.S. Open Cup (or being a top single-table-performer if the former qualifications don’t count for 4 slots). Canadian teams qualify by winning the Canadian Championship.
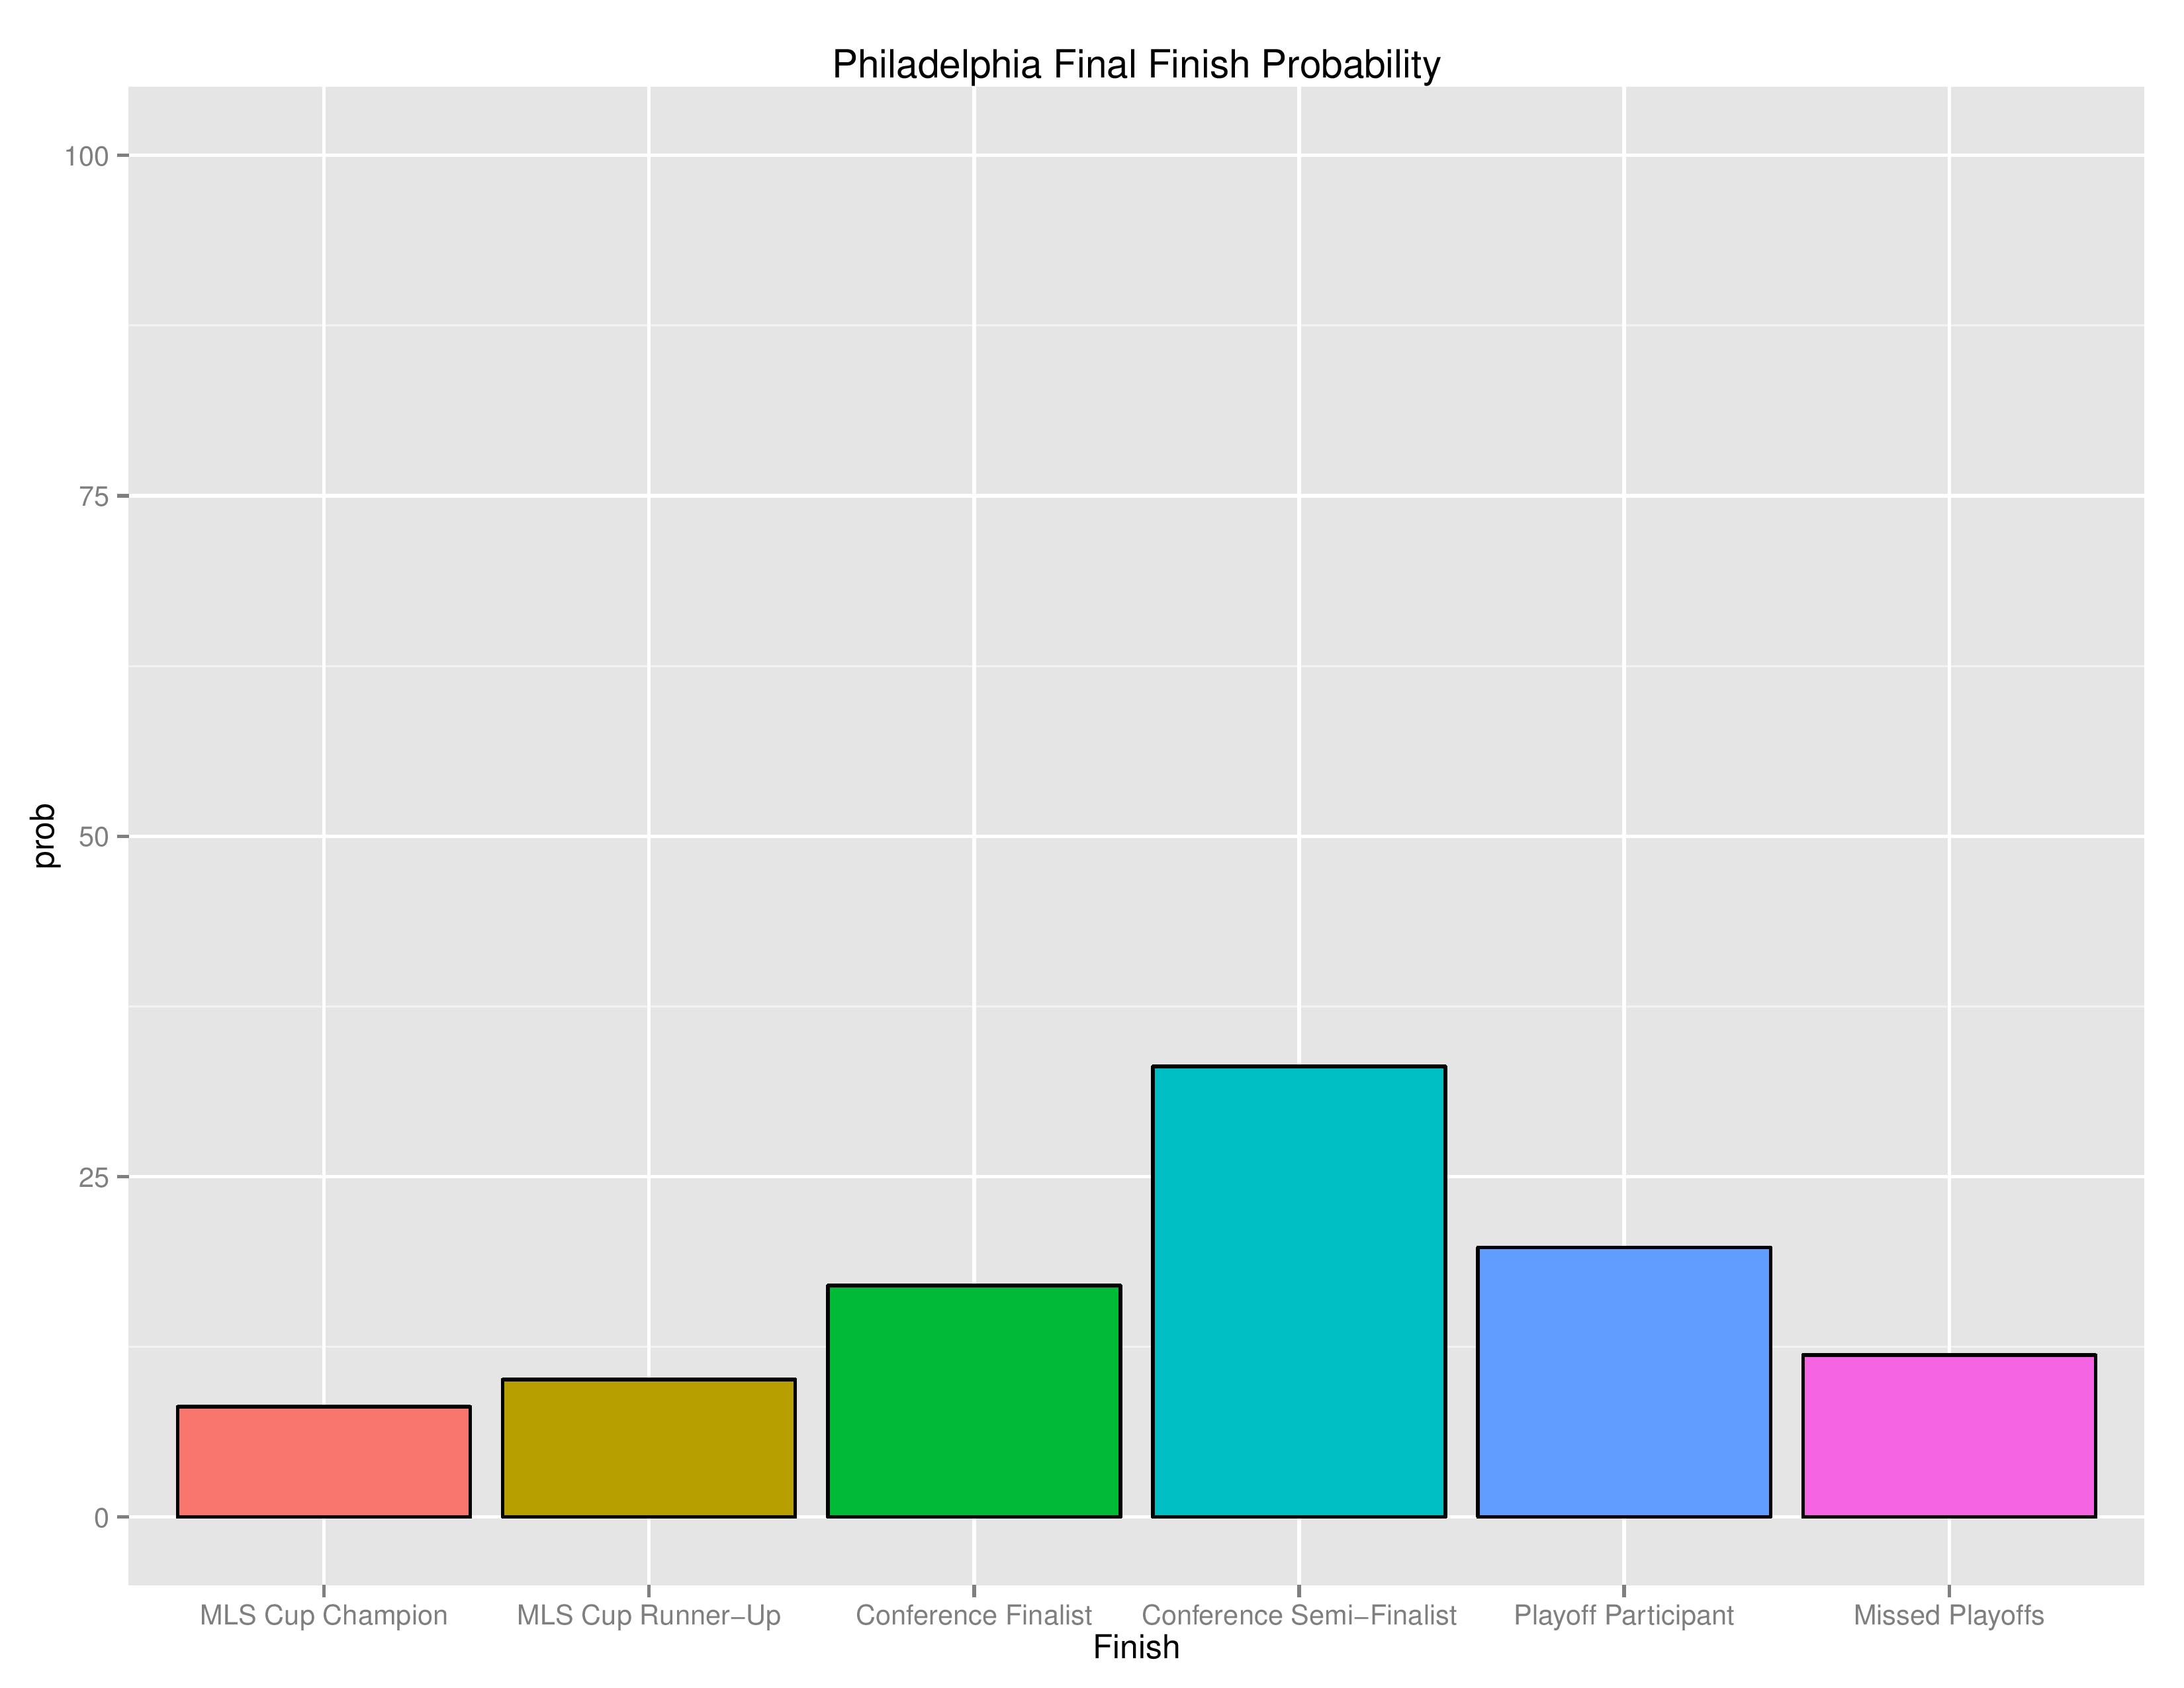
Philadelphia finishing
The following shows the probability of various Playoff categories and Philadelphia’s probability of each of them.
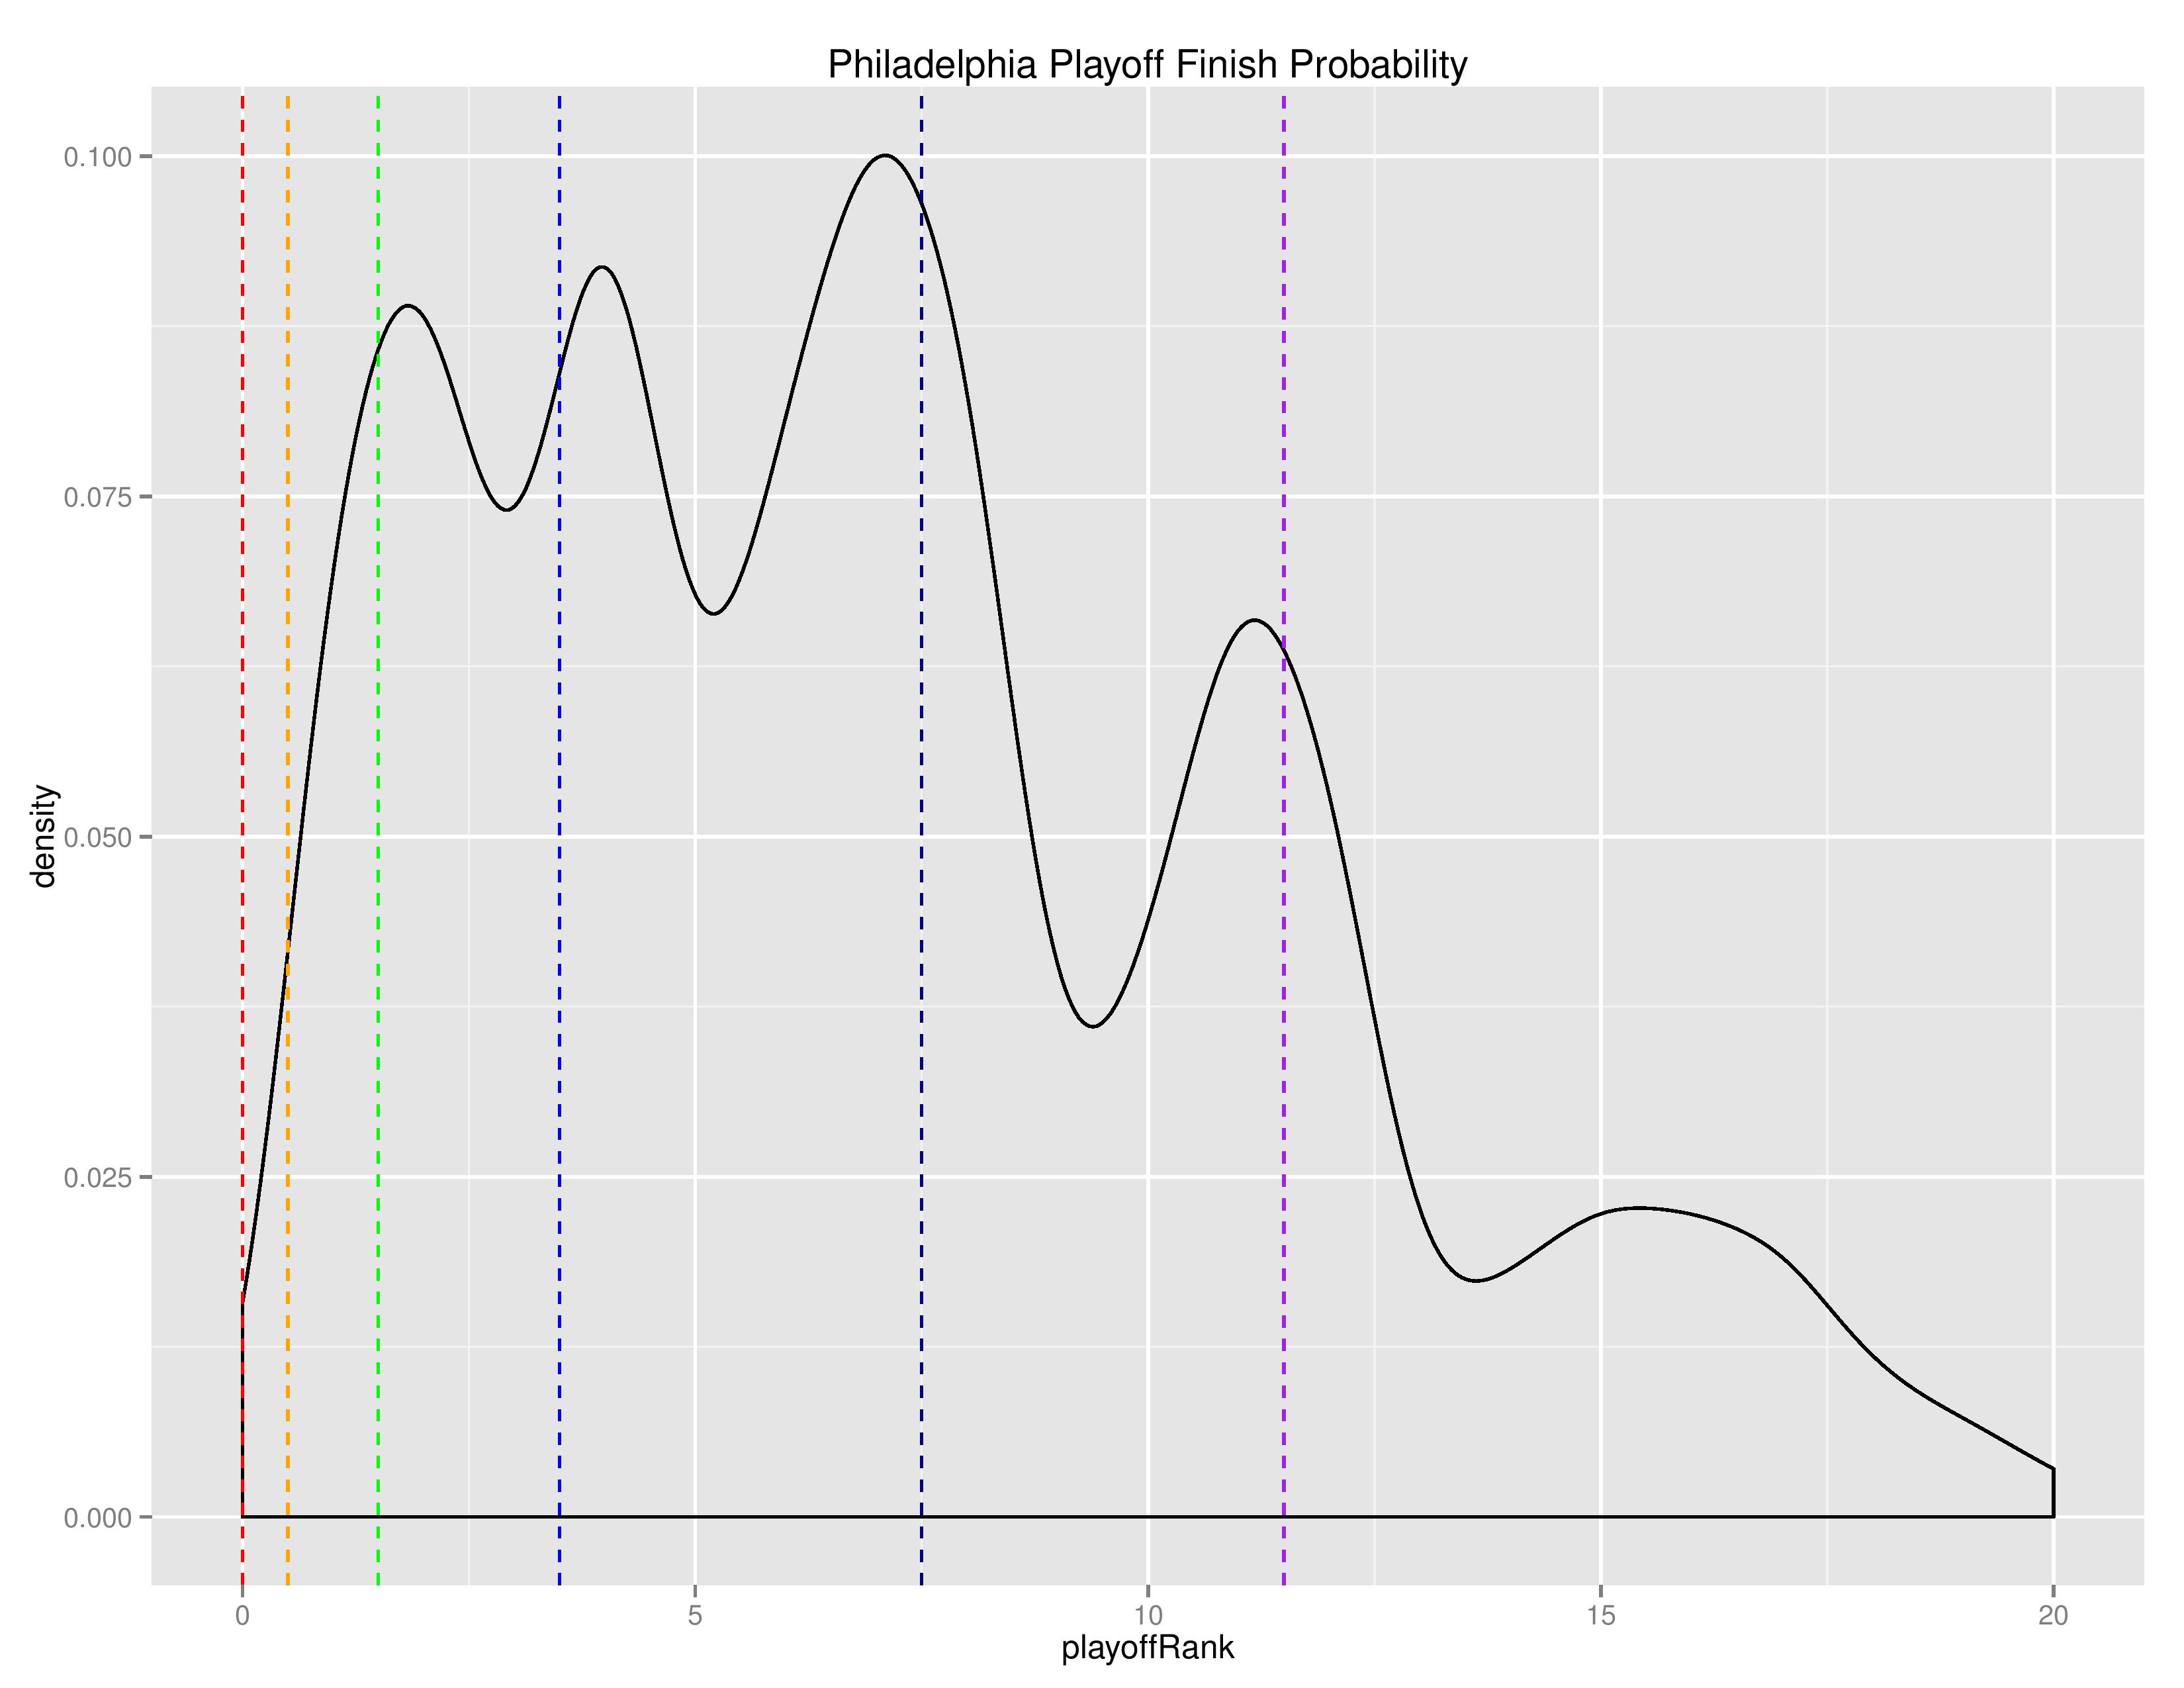
The following is a “density” chart showing the relative probability of Philadelphia finishing at the different after-playoffs rankings from 1 to 20.
To repeat myself, the loopy-ness you see in the higher ranks is likely due to the disparity in conference strength. If Philadelphia finishes in a higher round than a Western team, they are automatically ranked higher, but if they finish in the same round, Philadelphia will often be ranked lower (based on regular season single-table finishing).
The following is the list of Philadelphia’s remaining scheduled matches accompanied by result probabilities as predicted by SEBA.
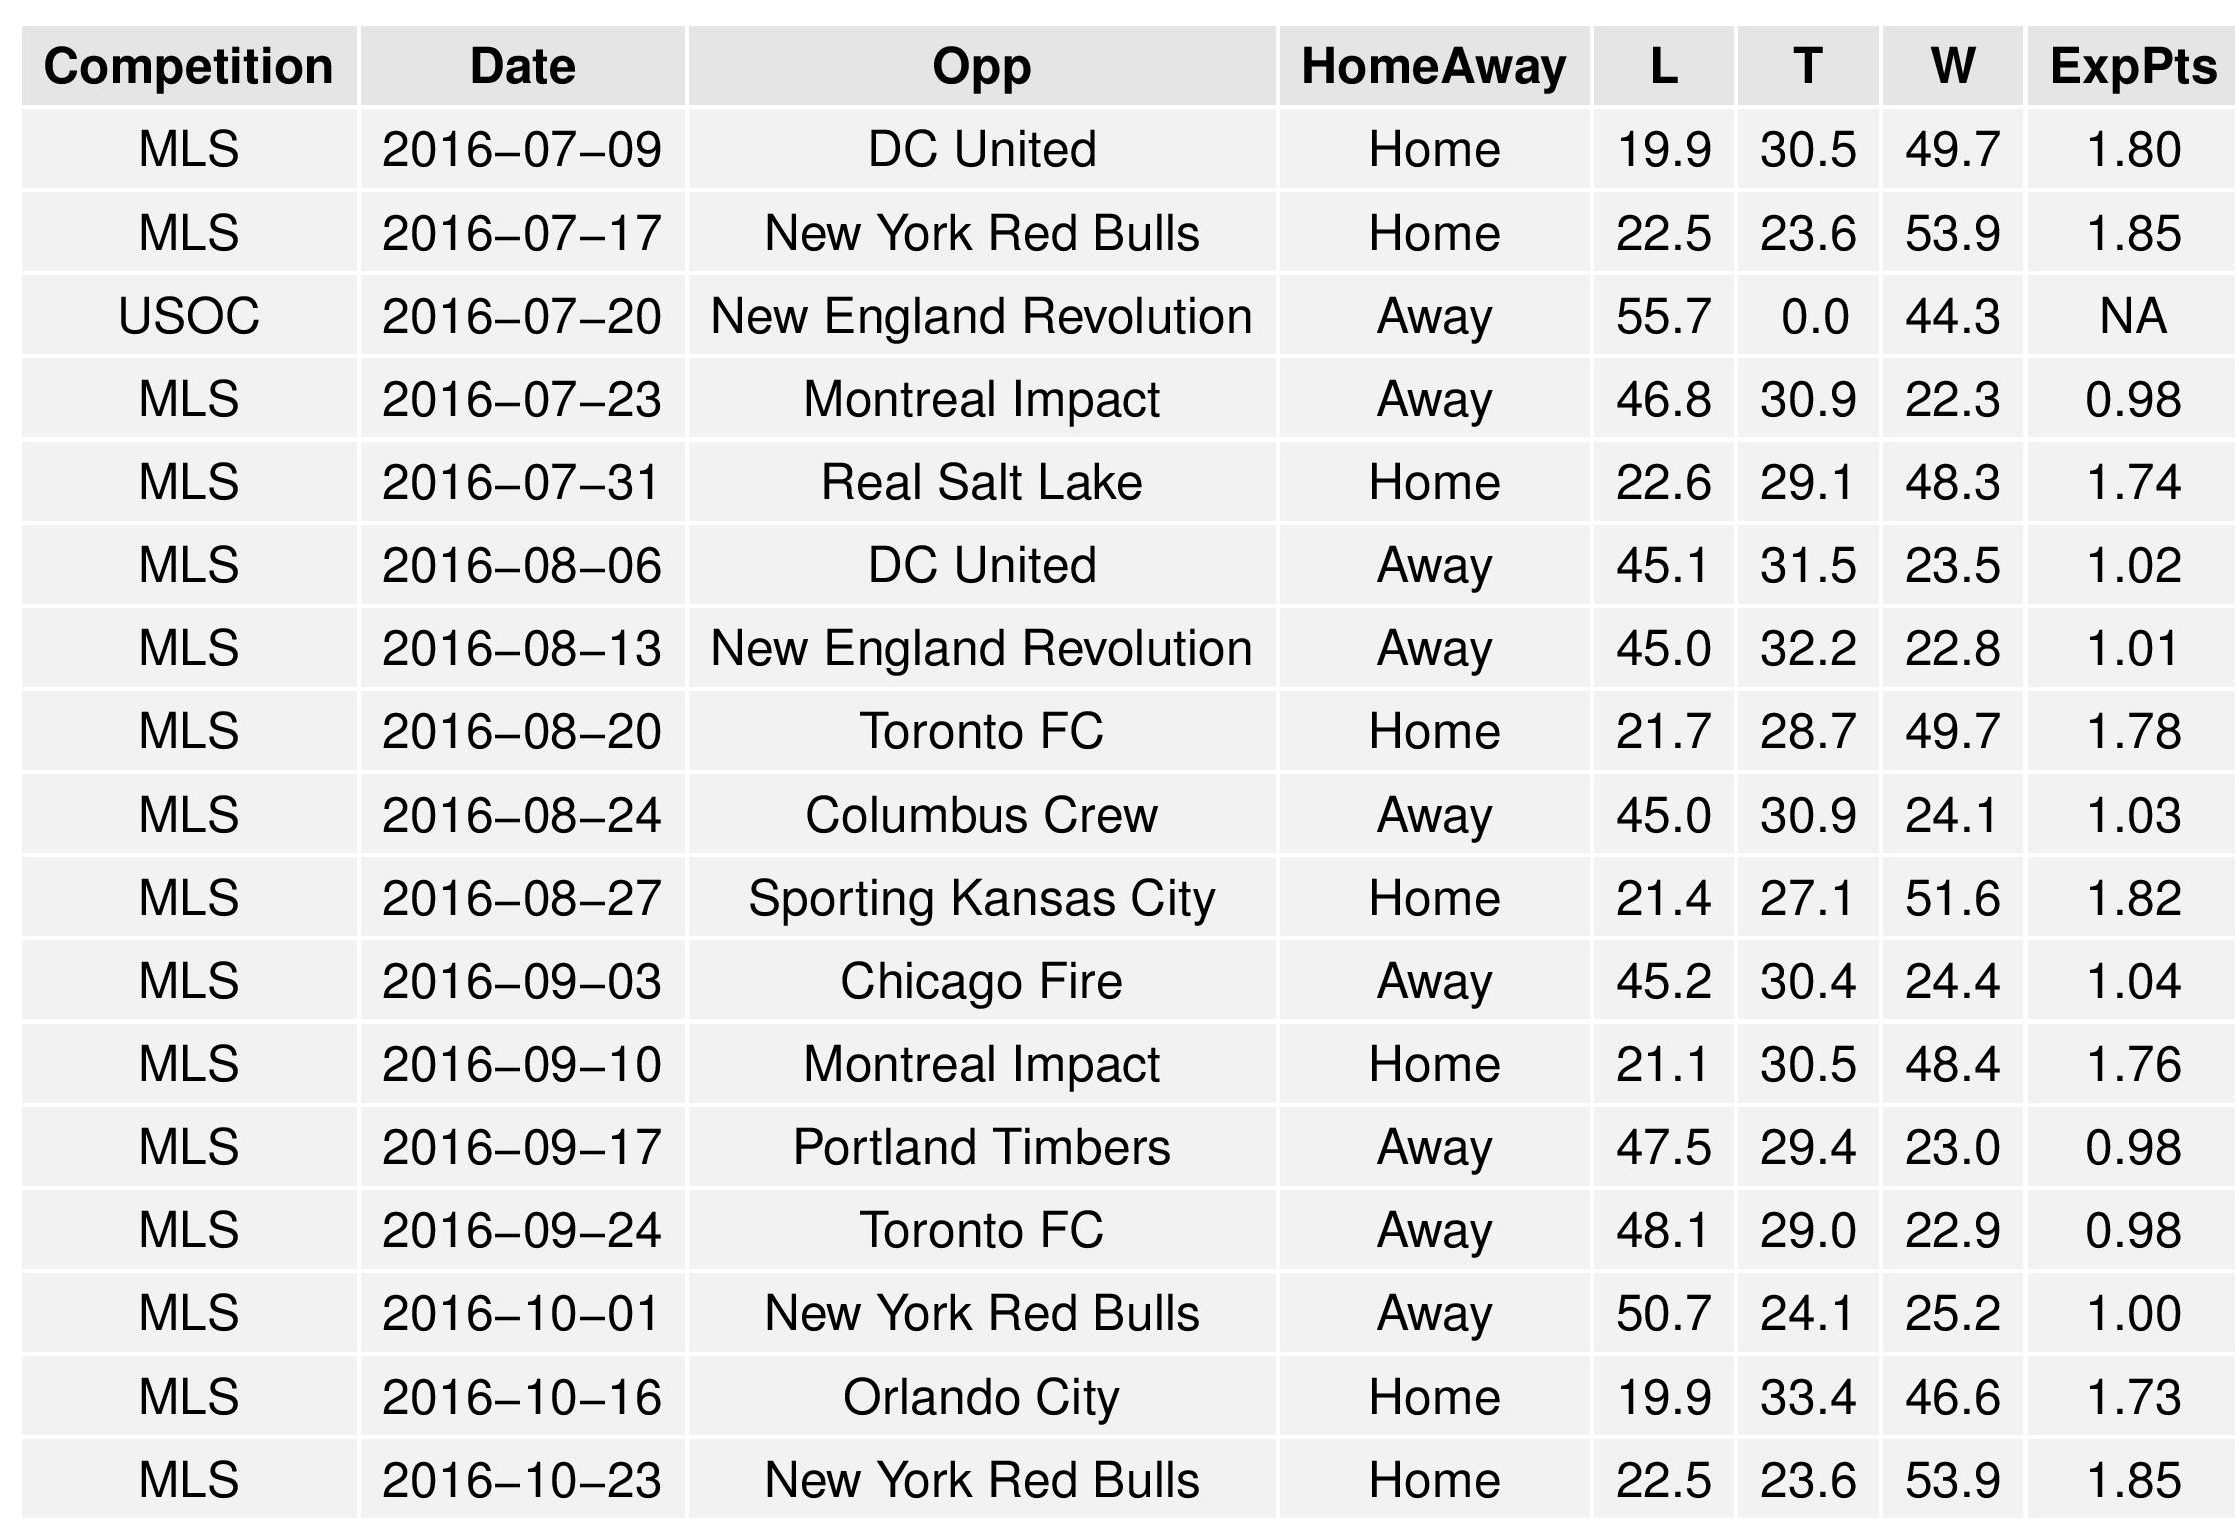
The charts below shows the average results of all the simulations and the probabilities associated with all of the above. The chart is broken up into two parts in order to better fit on your screen.
(Note: CCLAlternate refers to qualifying for CONCACAF Champions League non-traditionally. U.S. teams qualify by winning the MLS Cup, winning the Supporters’ Shield, winning the Conference in the regular season, and by winning the U.S. Open Cup. If a Canadian team wins any of these or a U.S. team wins more than one, the extra slots are filled by top regular season performers.)
Changes Over Time
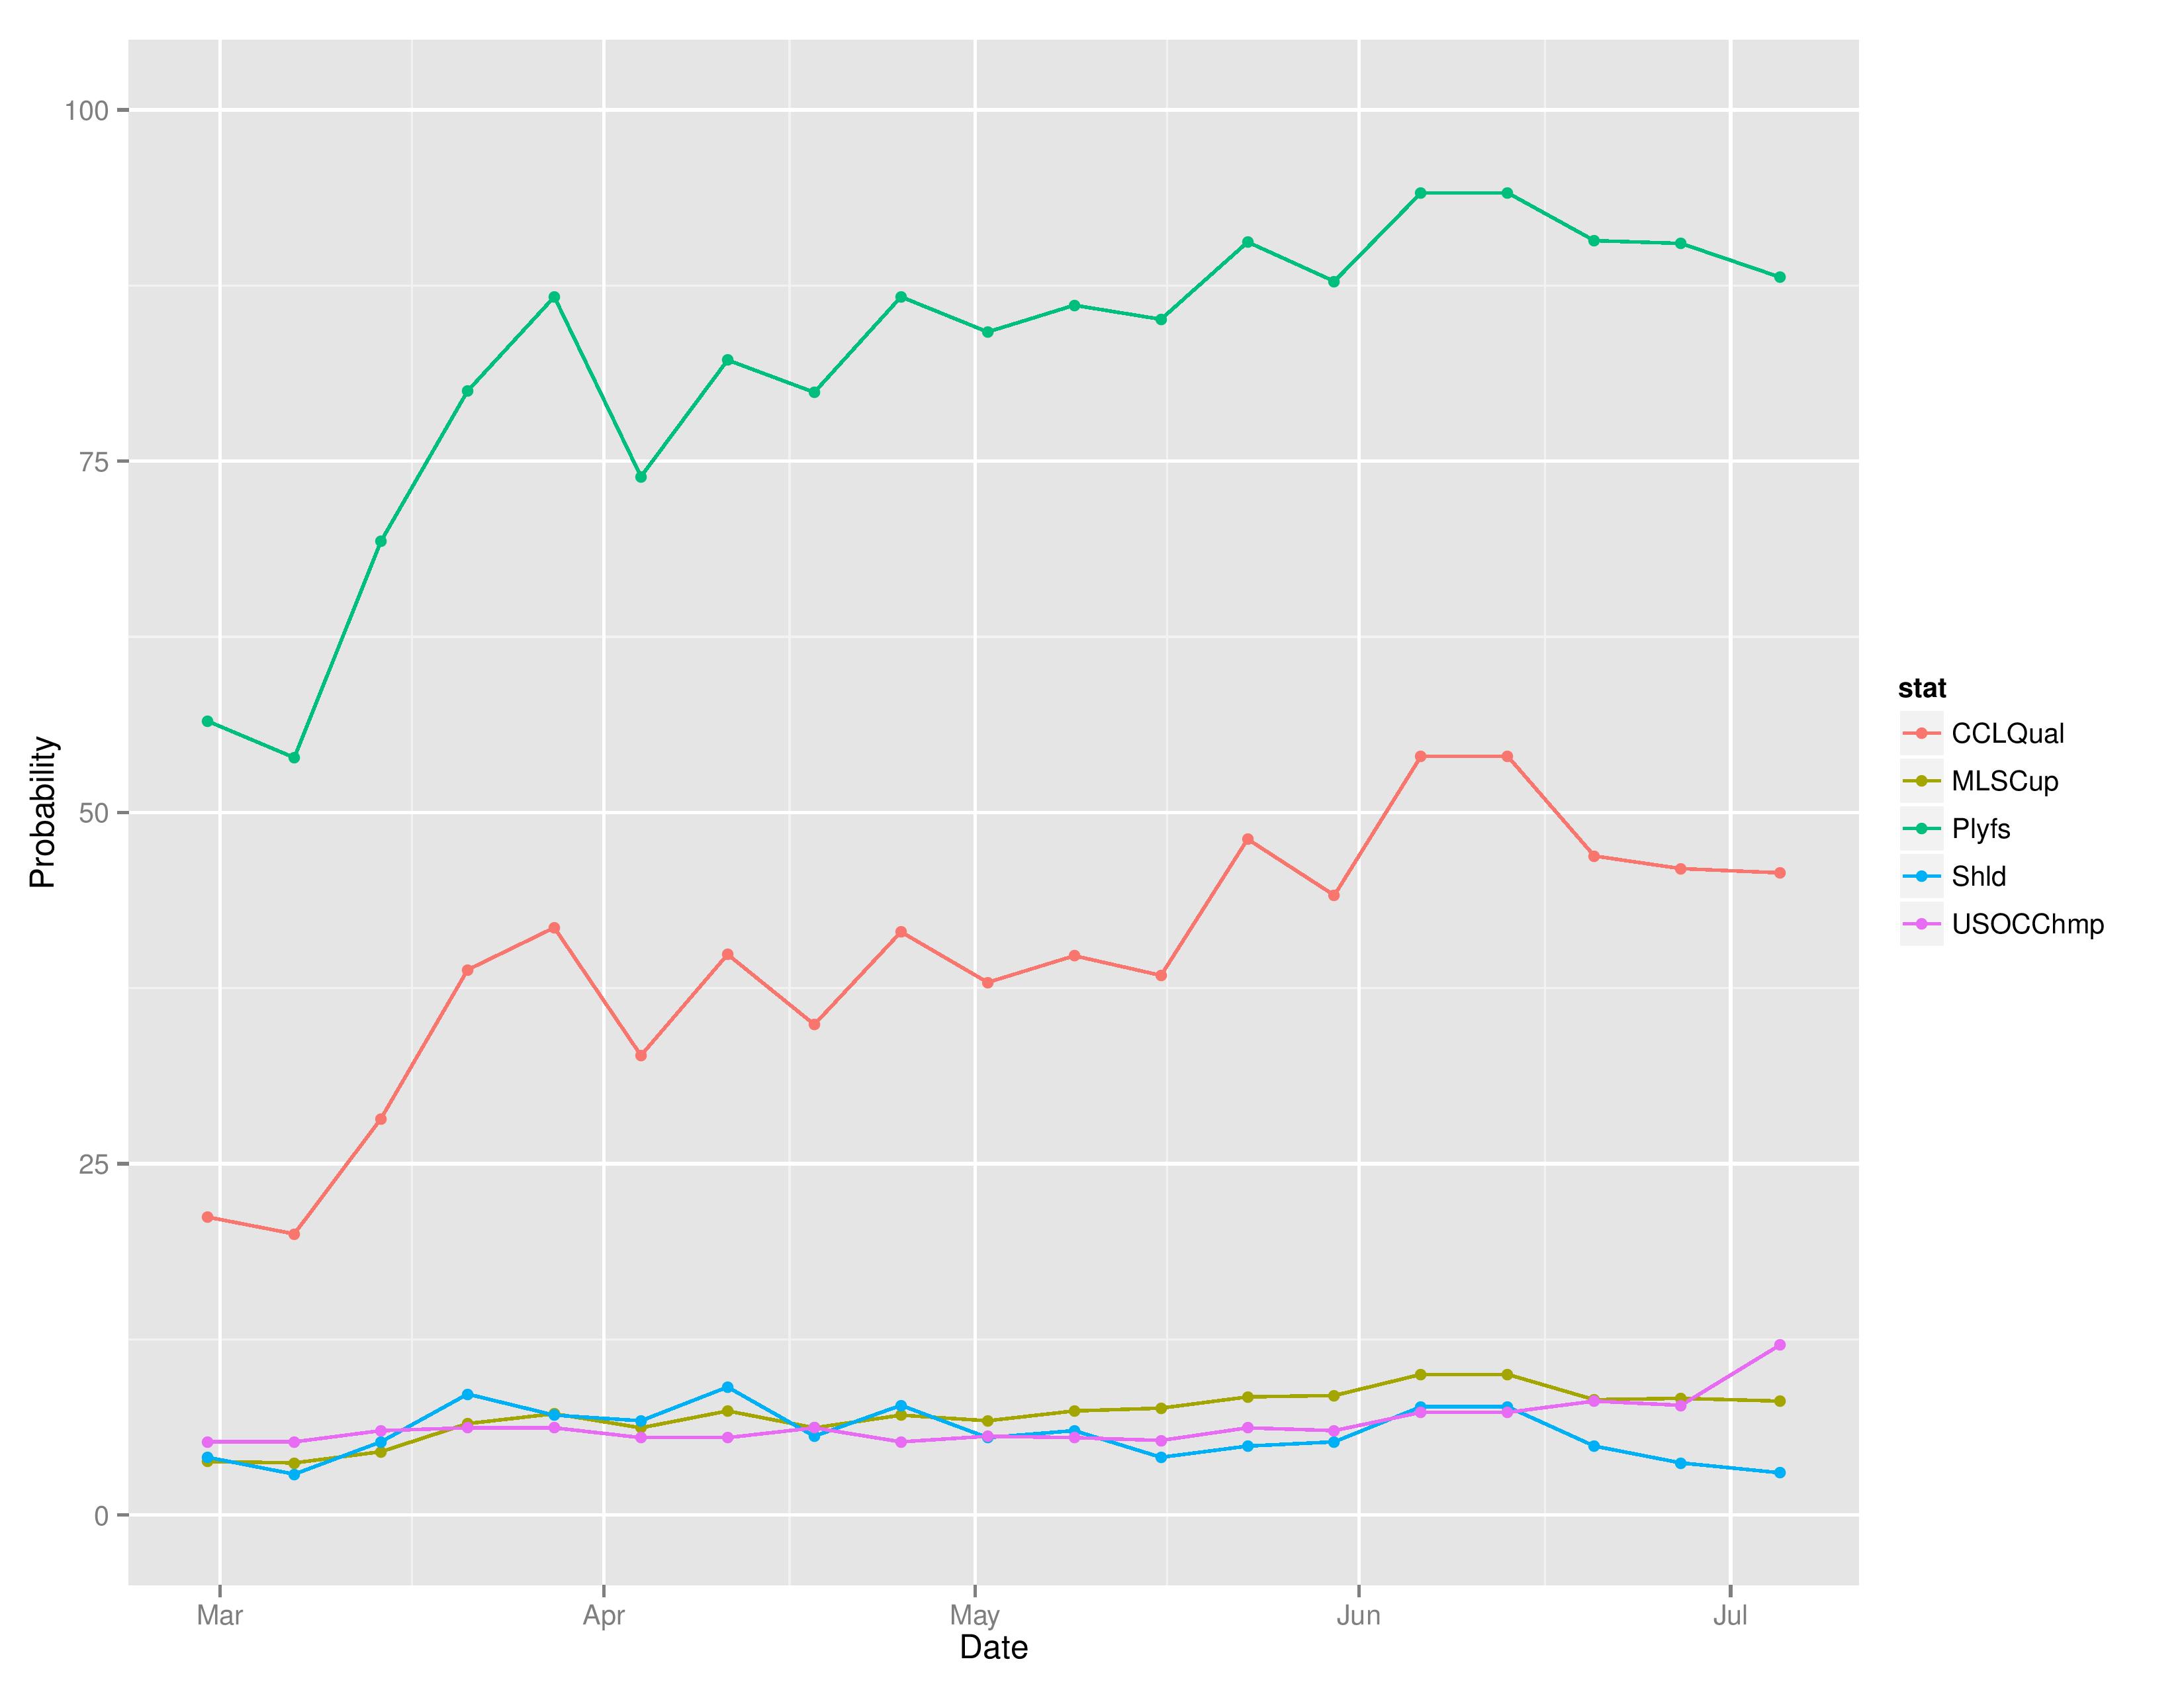
This chart shows how Philadelphia’s chances at each of the outcomes has evolved over the course of the season. These probabilities were calculated weekly, almost always through Sunday’s matches (this time through July 4 as there were Monday matches).
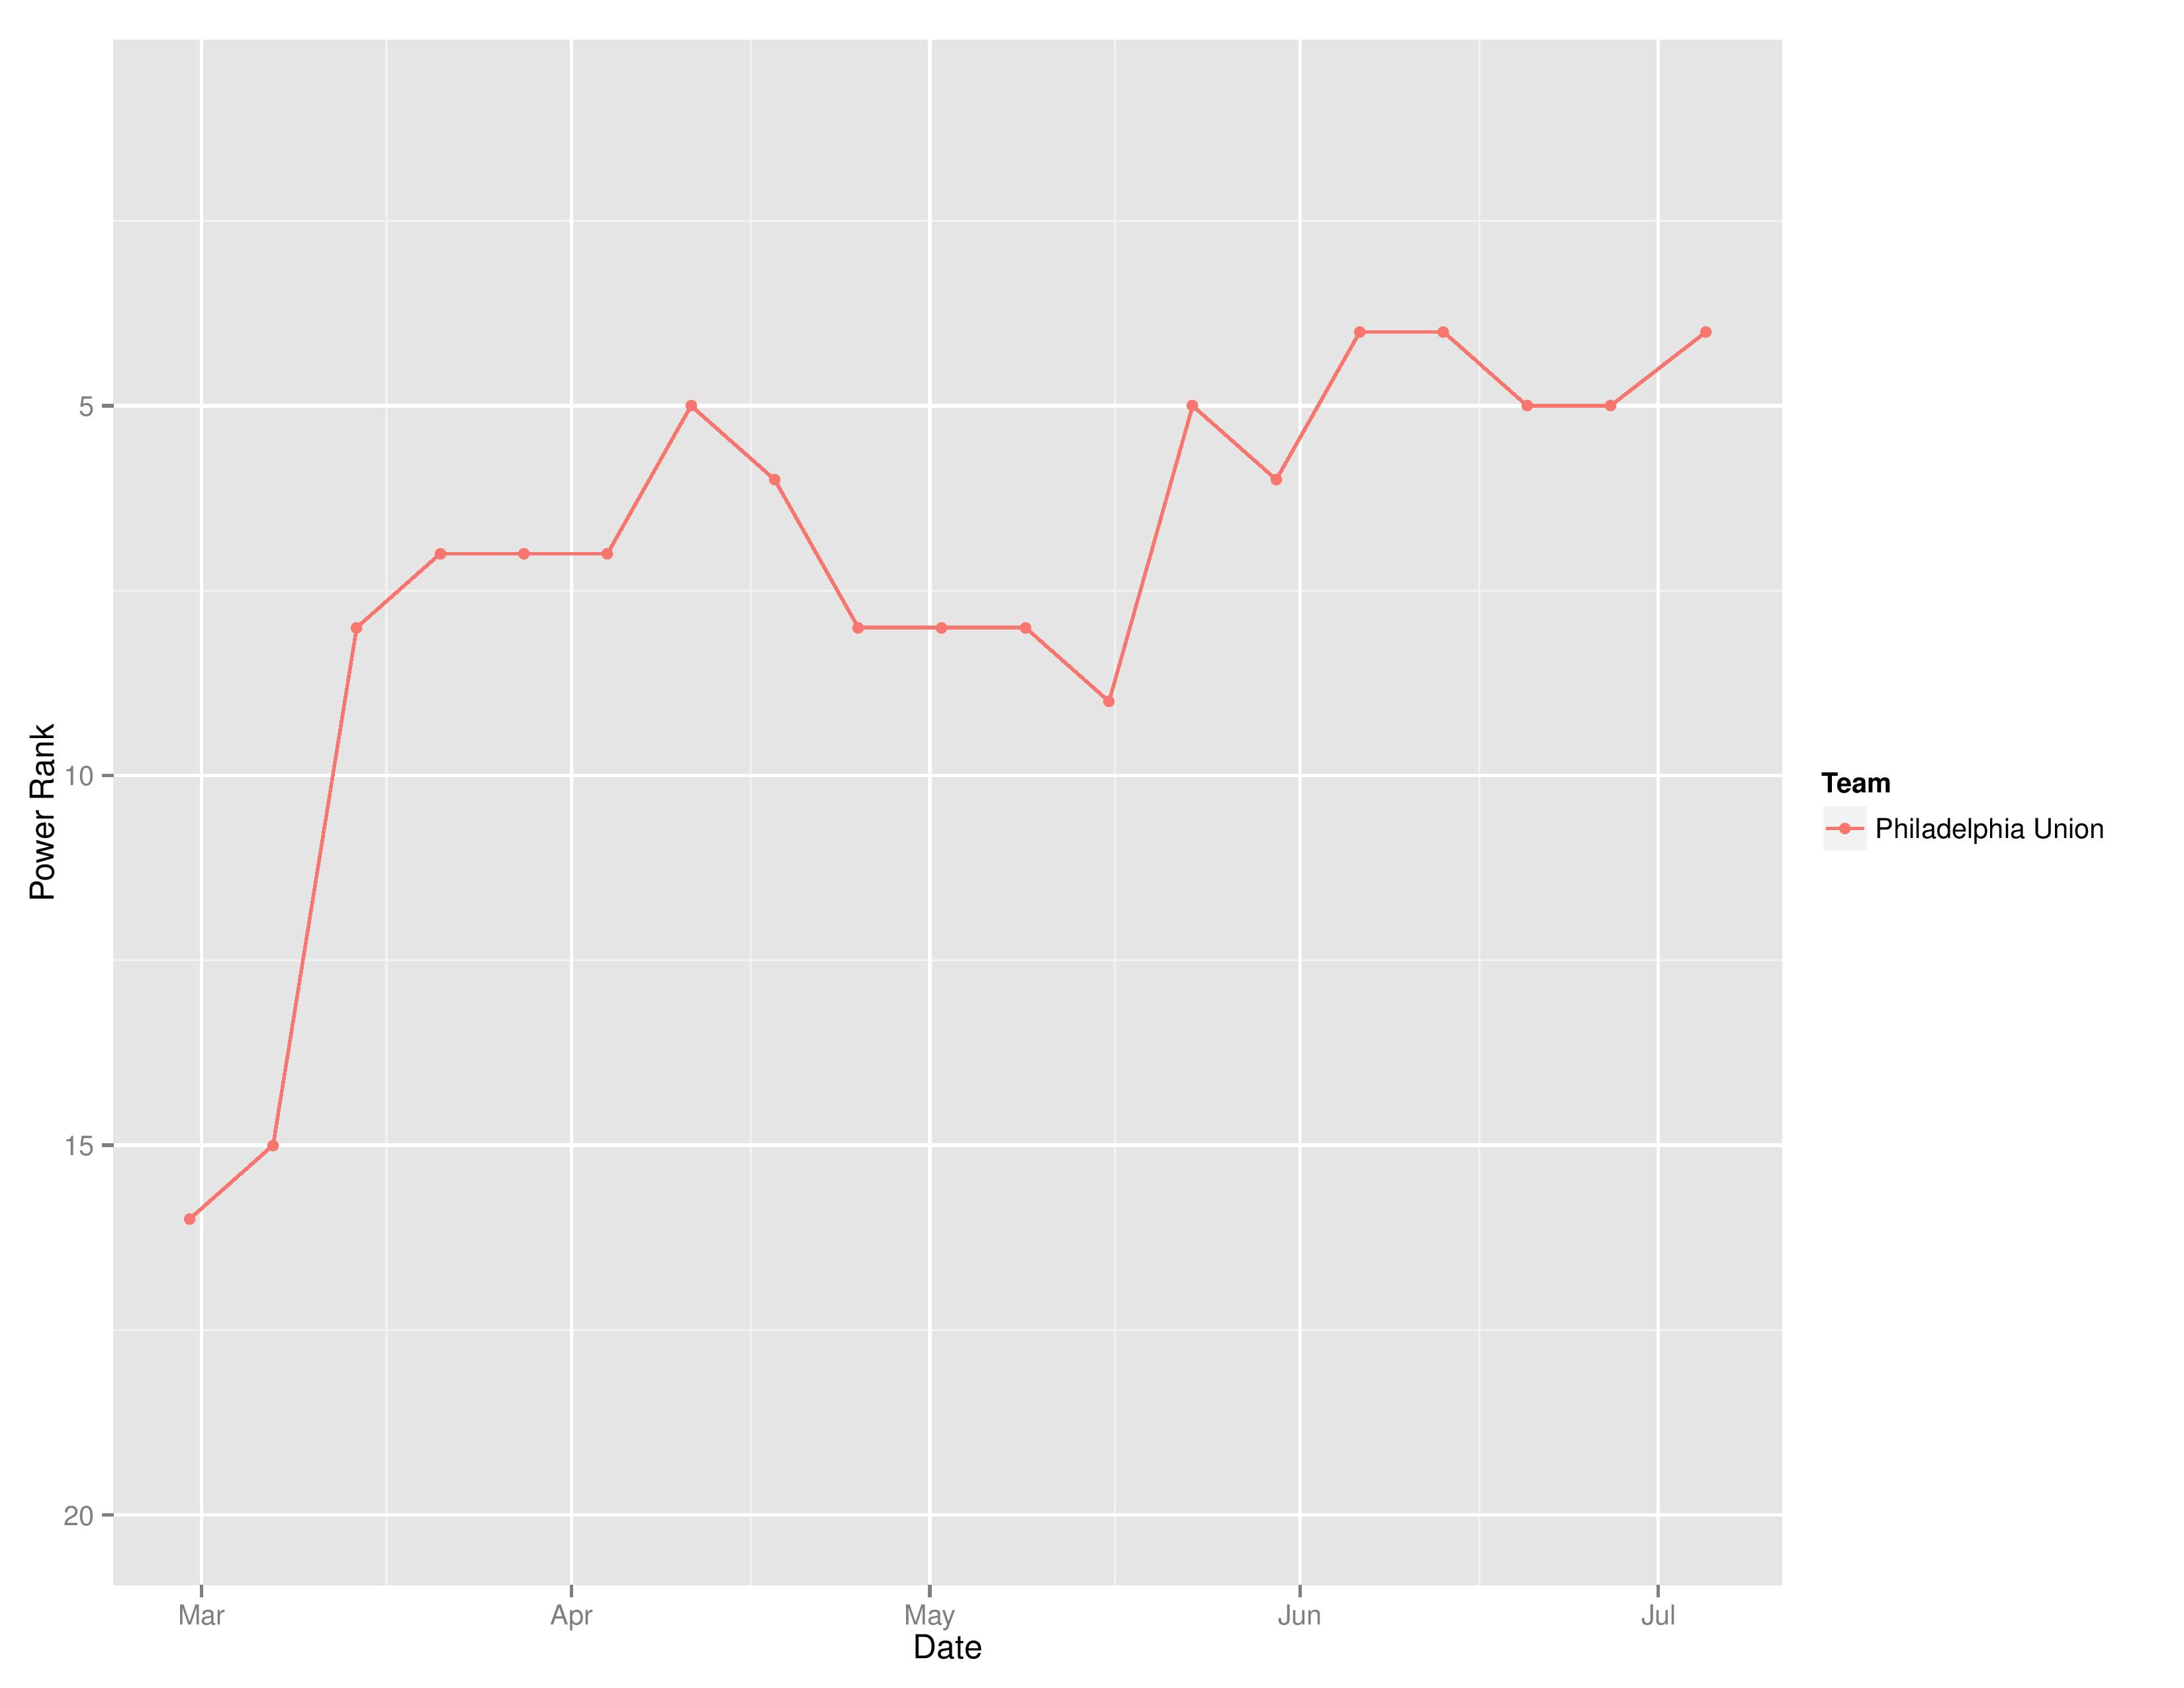
This shows the evolution of Philadelphia’s movement within SEBA’s power rankings.
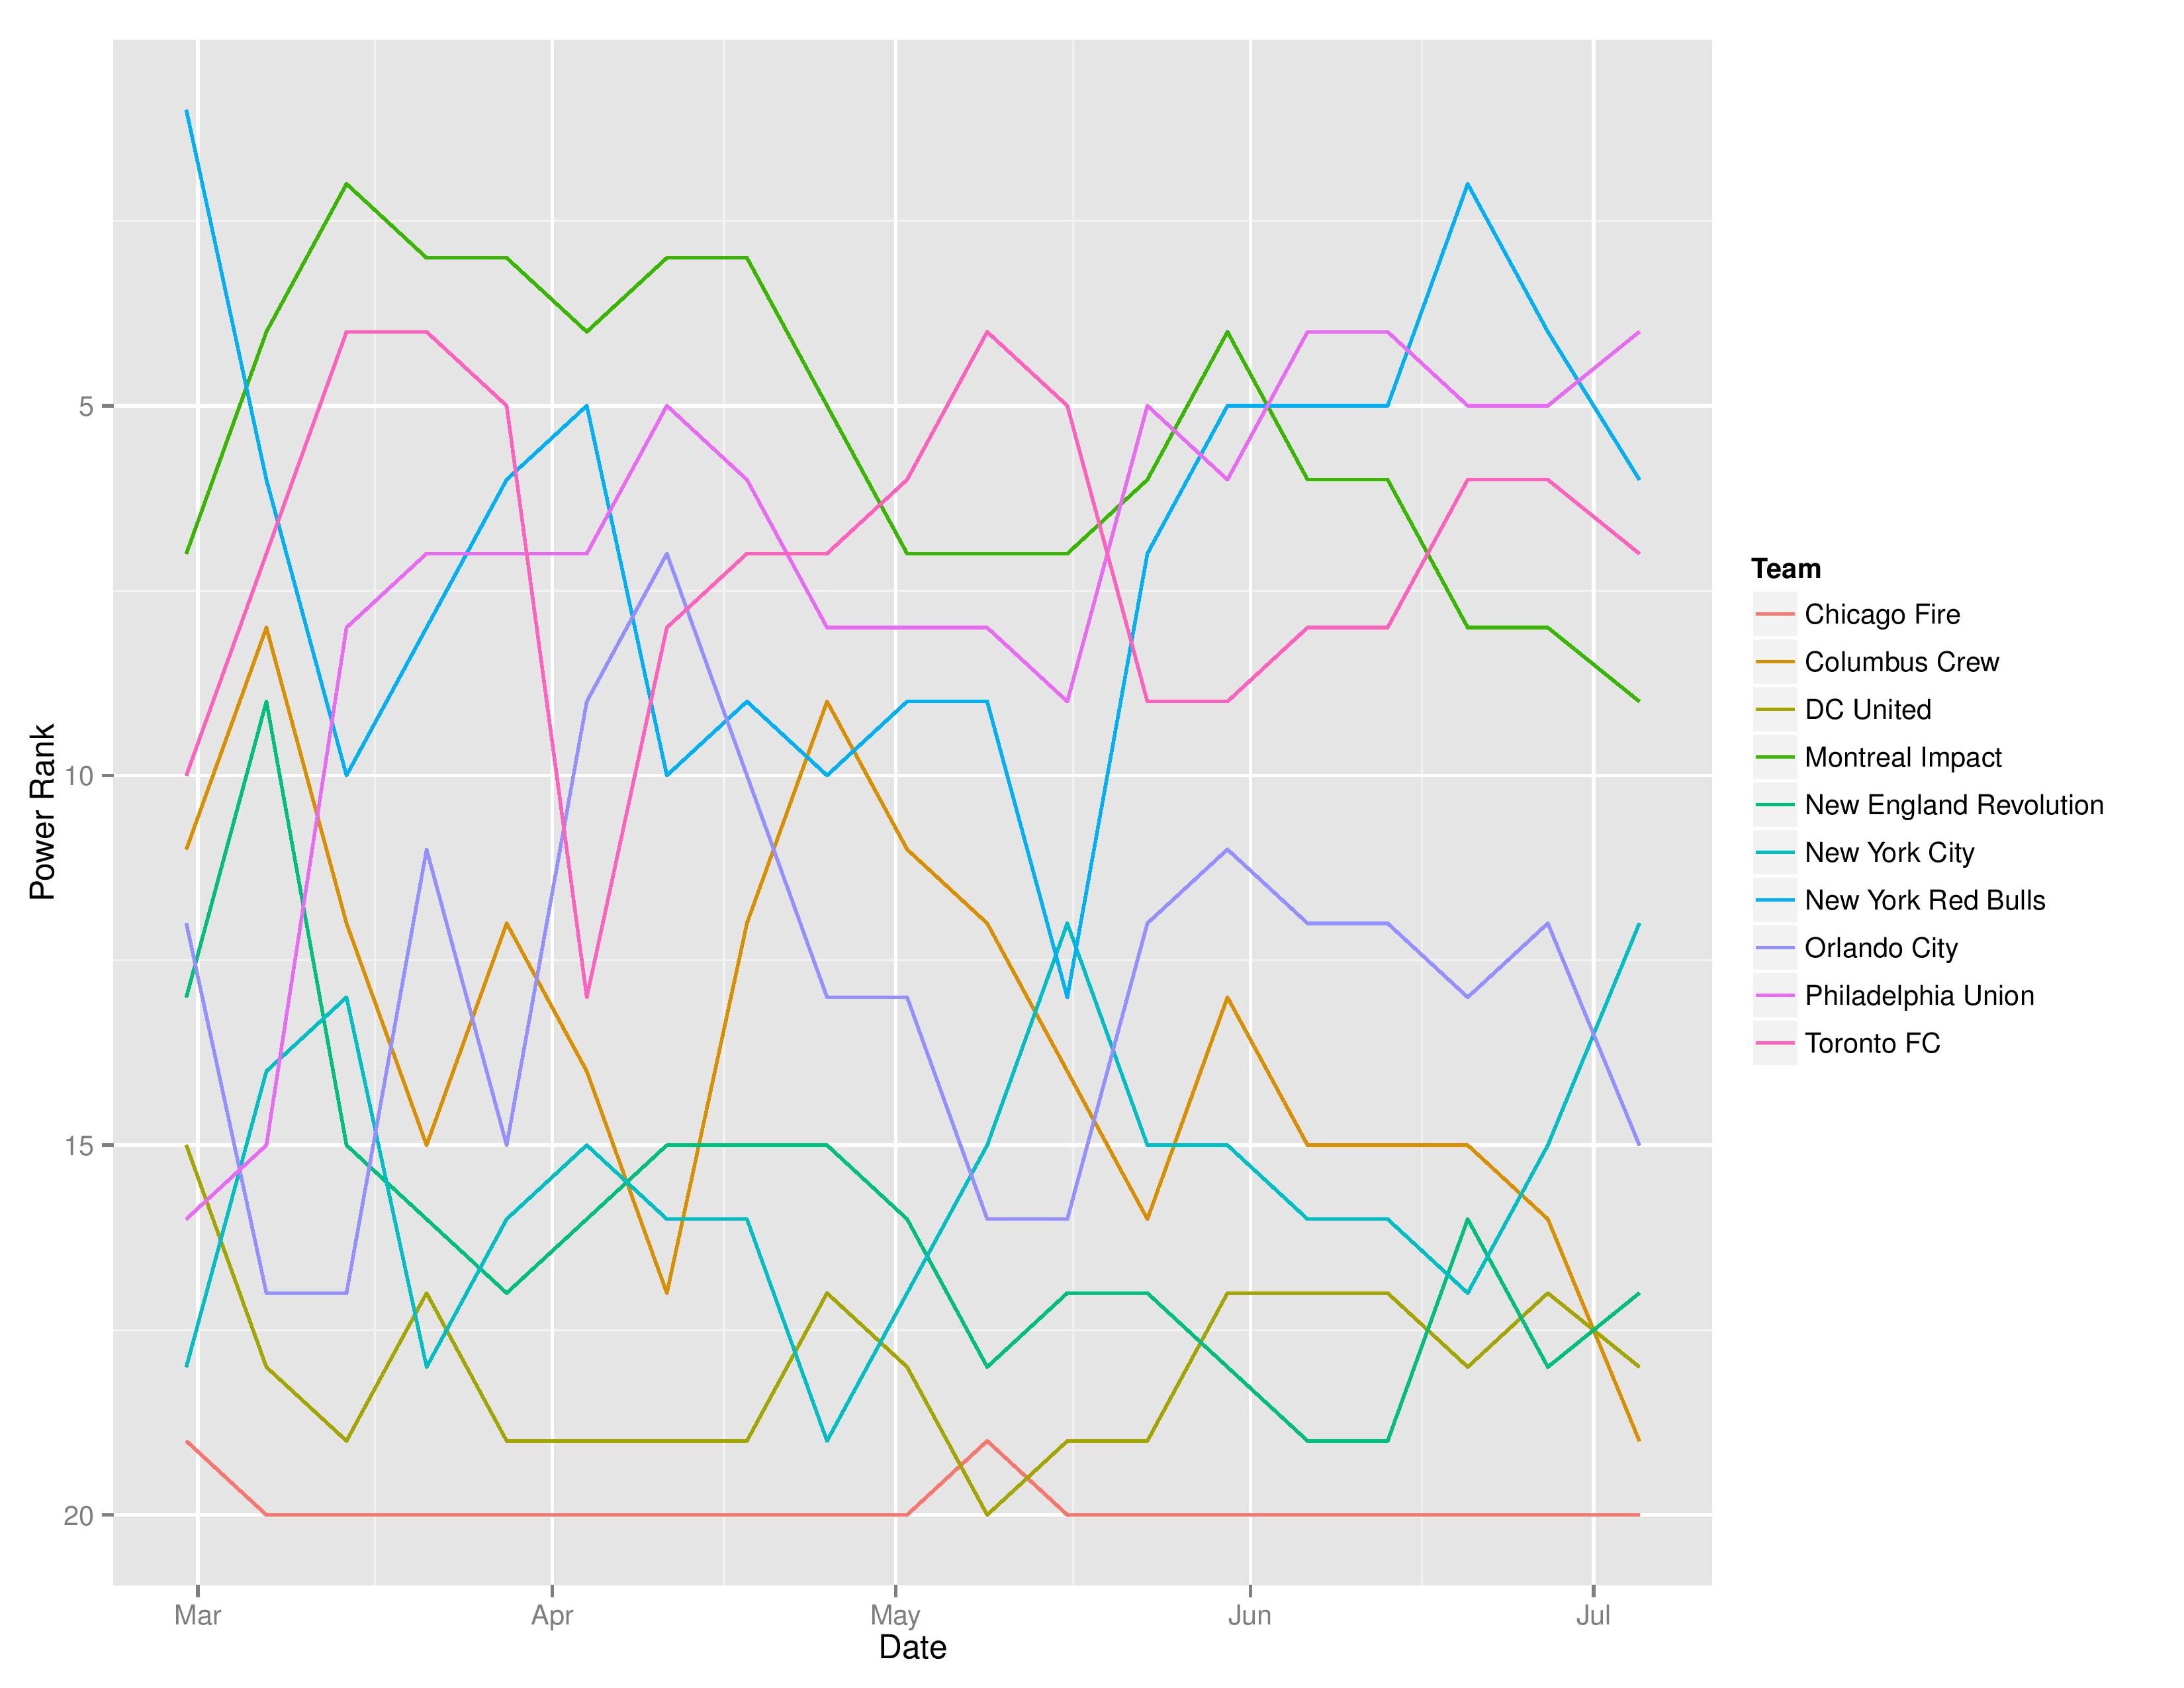
This shows the MLS Eastern Conference’s evolution of power rankings throughout the season.
Records
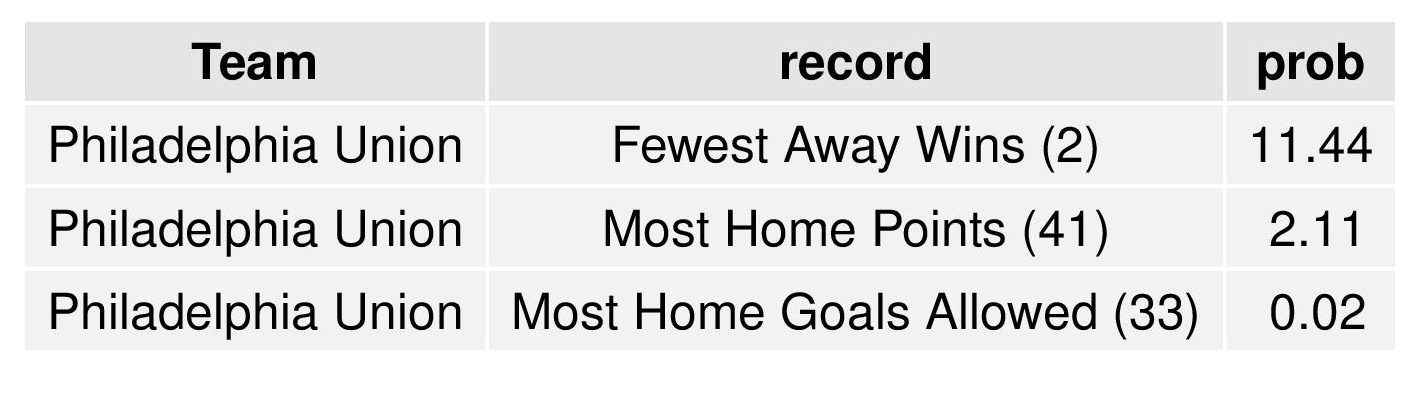
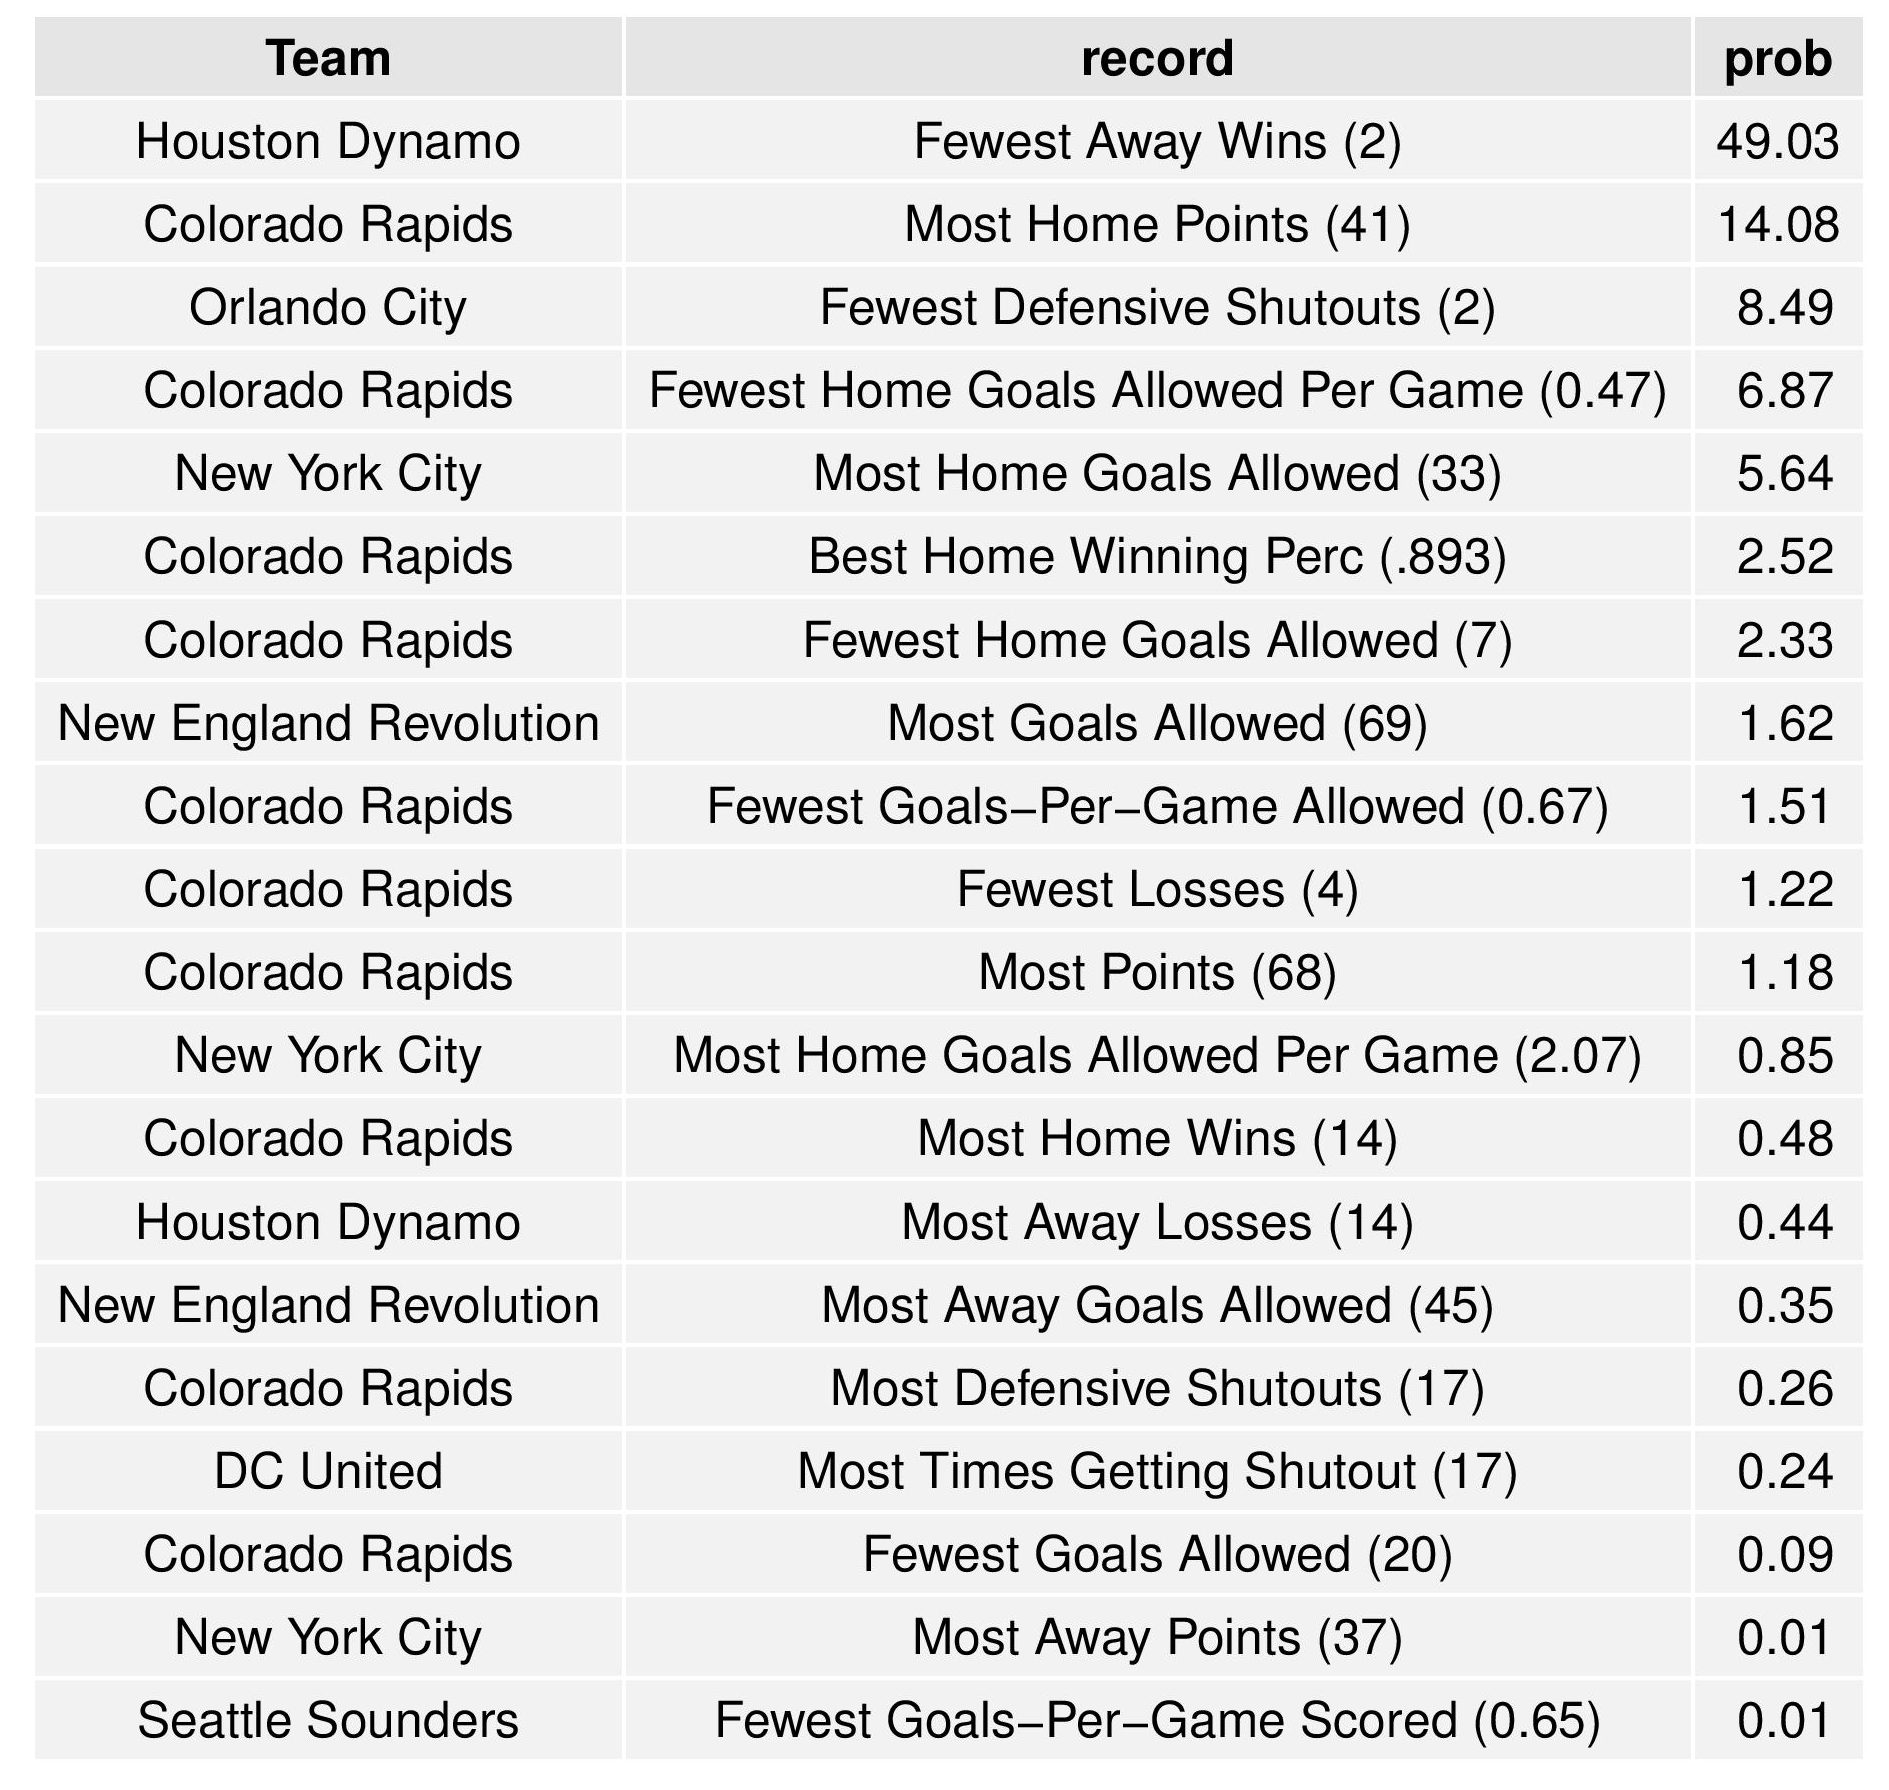
It should be noted that, with both of these tables, it shows the odds of breaking MLS single-season records, not of holding them. If more than one team would break the same record this season, they would both be represented below.
The following table shows Philadelphia’s odds at breaking various MLS single-season records
The following table shows all single-season records that had at least one simulation break the record. However, it limits the records to show only the most probable team for breaking each record.
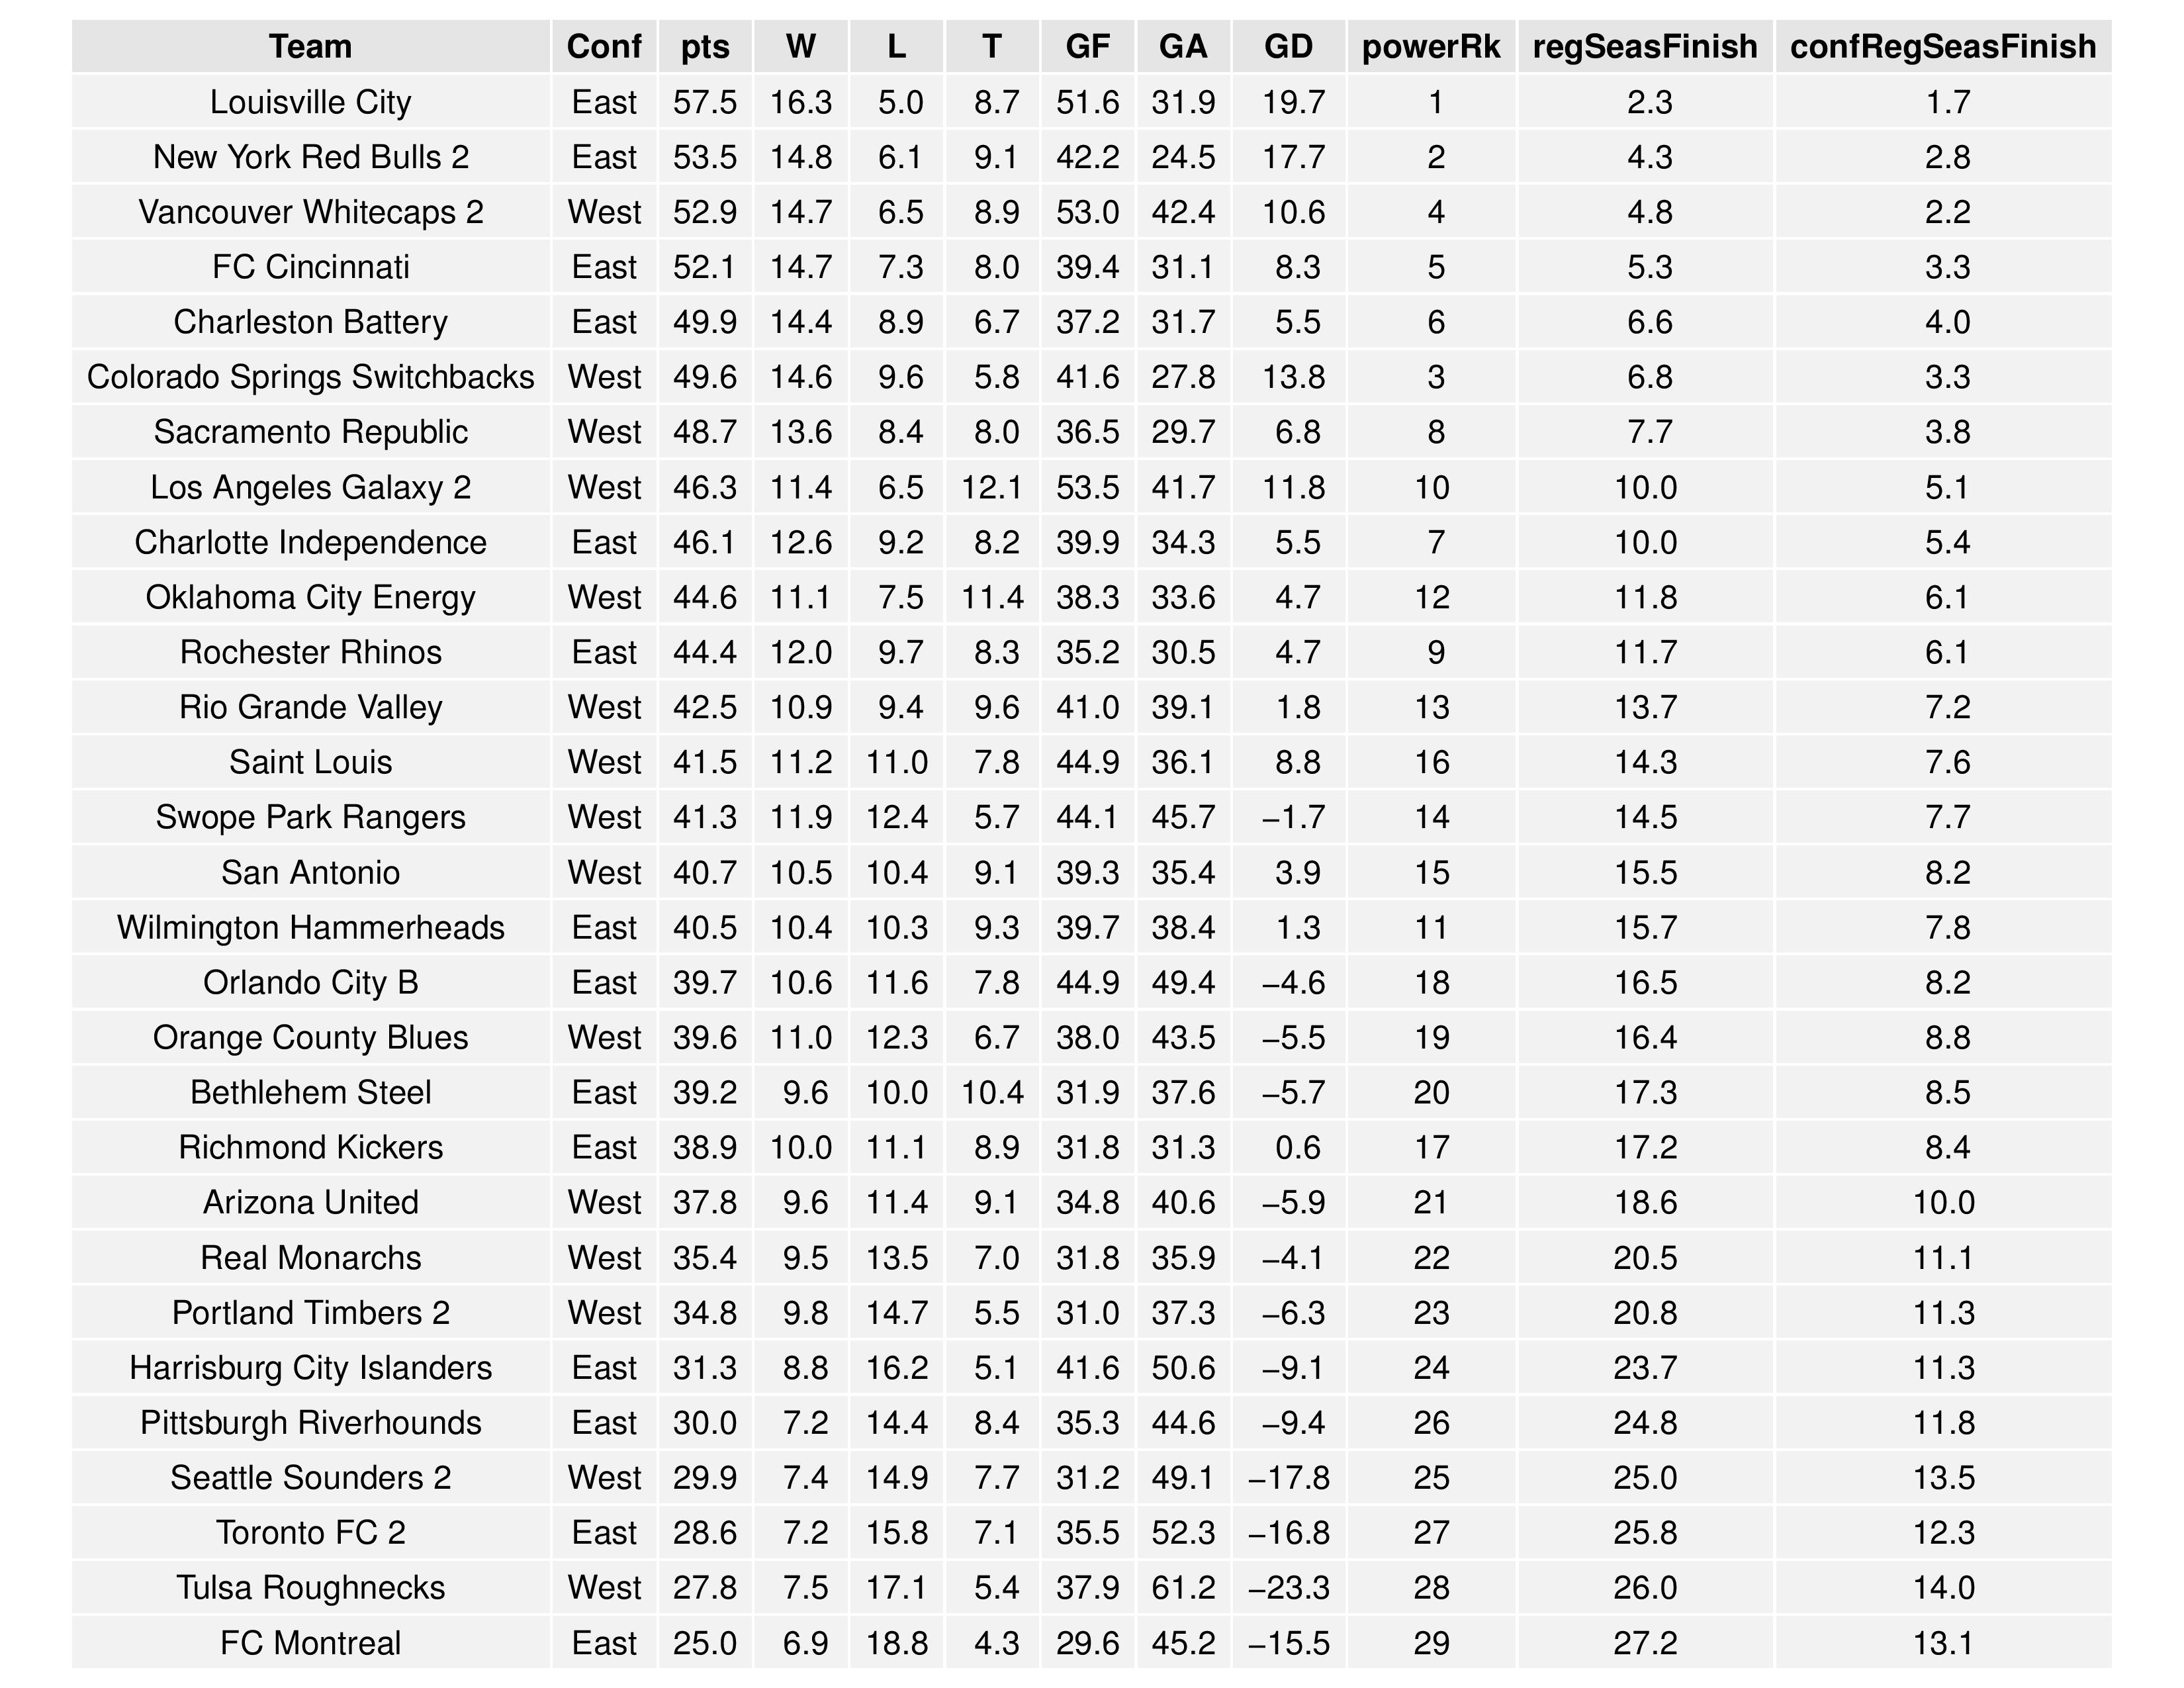
USL Projections
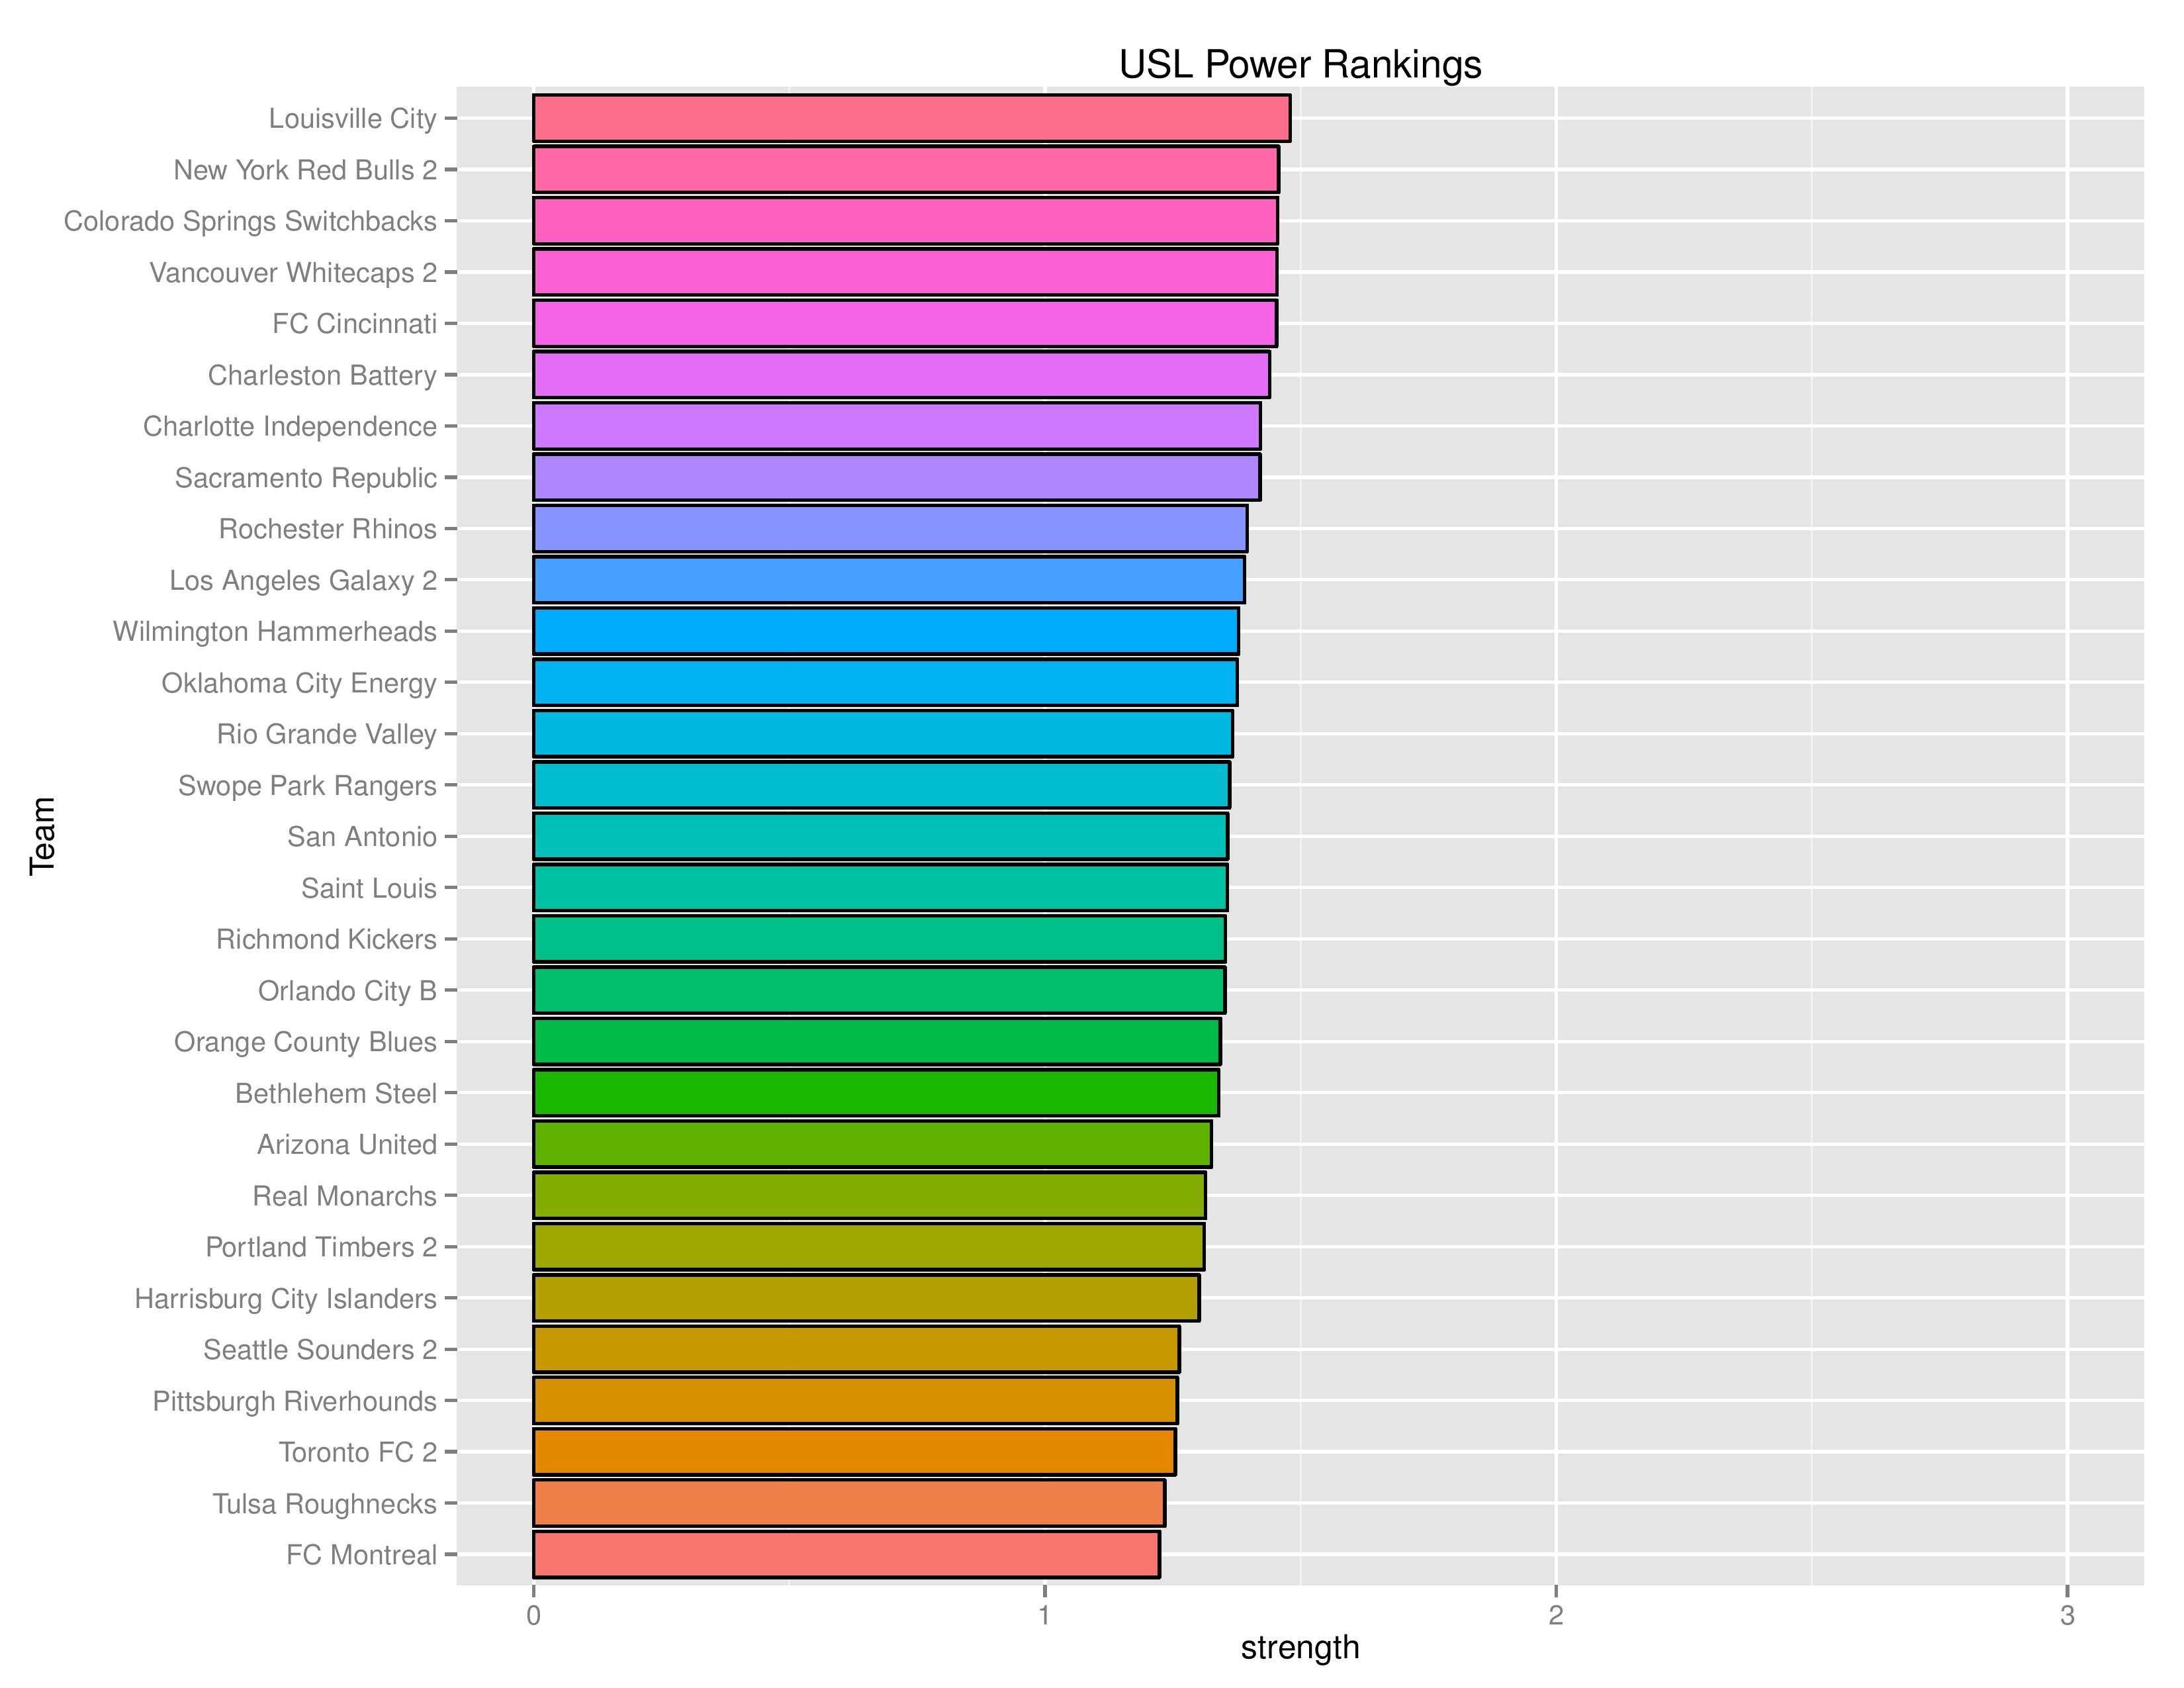
Bethlehem drops to 20th from 18th and Harrisburg City Islanders remains at 24th. USLSoccer.com‘s top 10 rankings do not include either team.
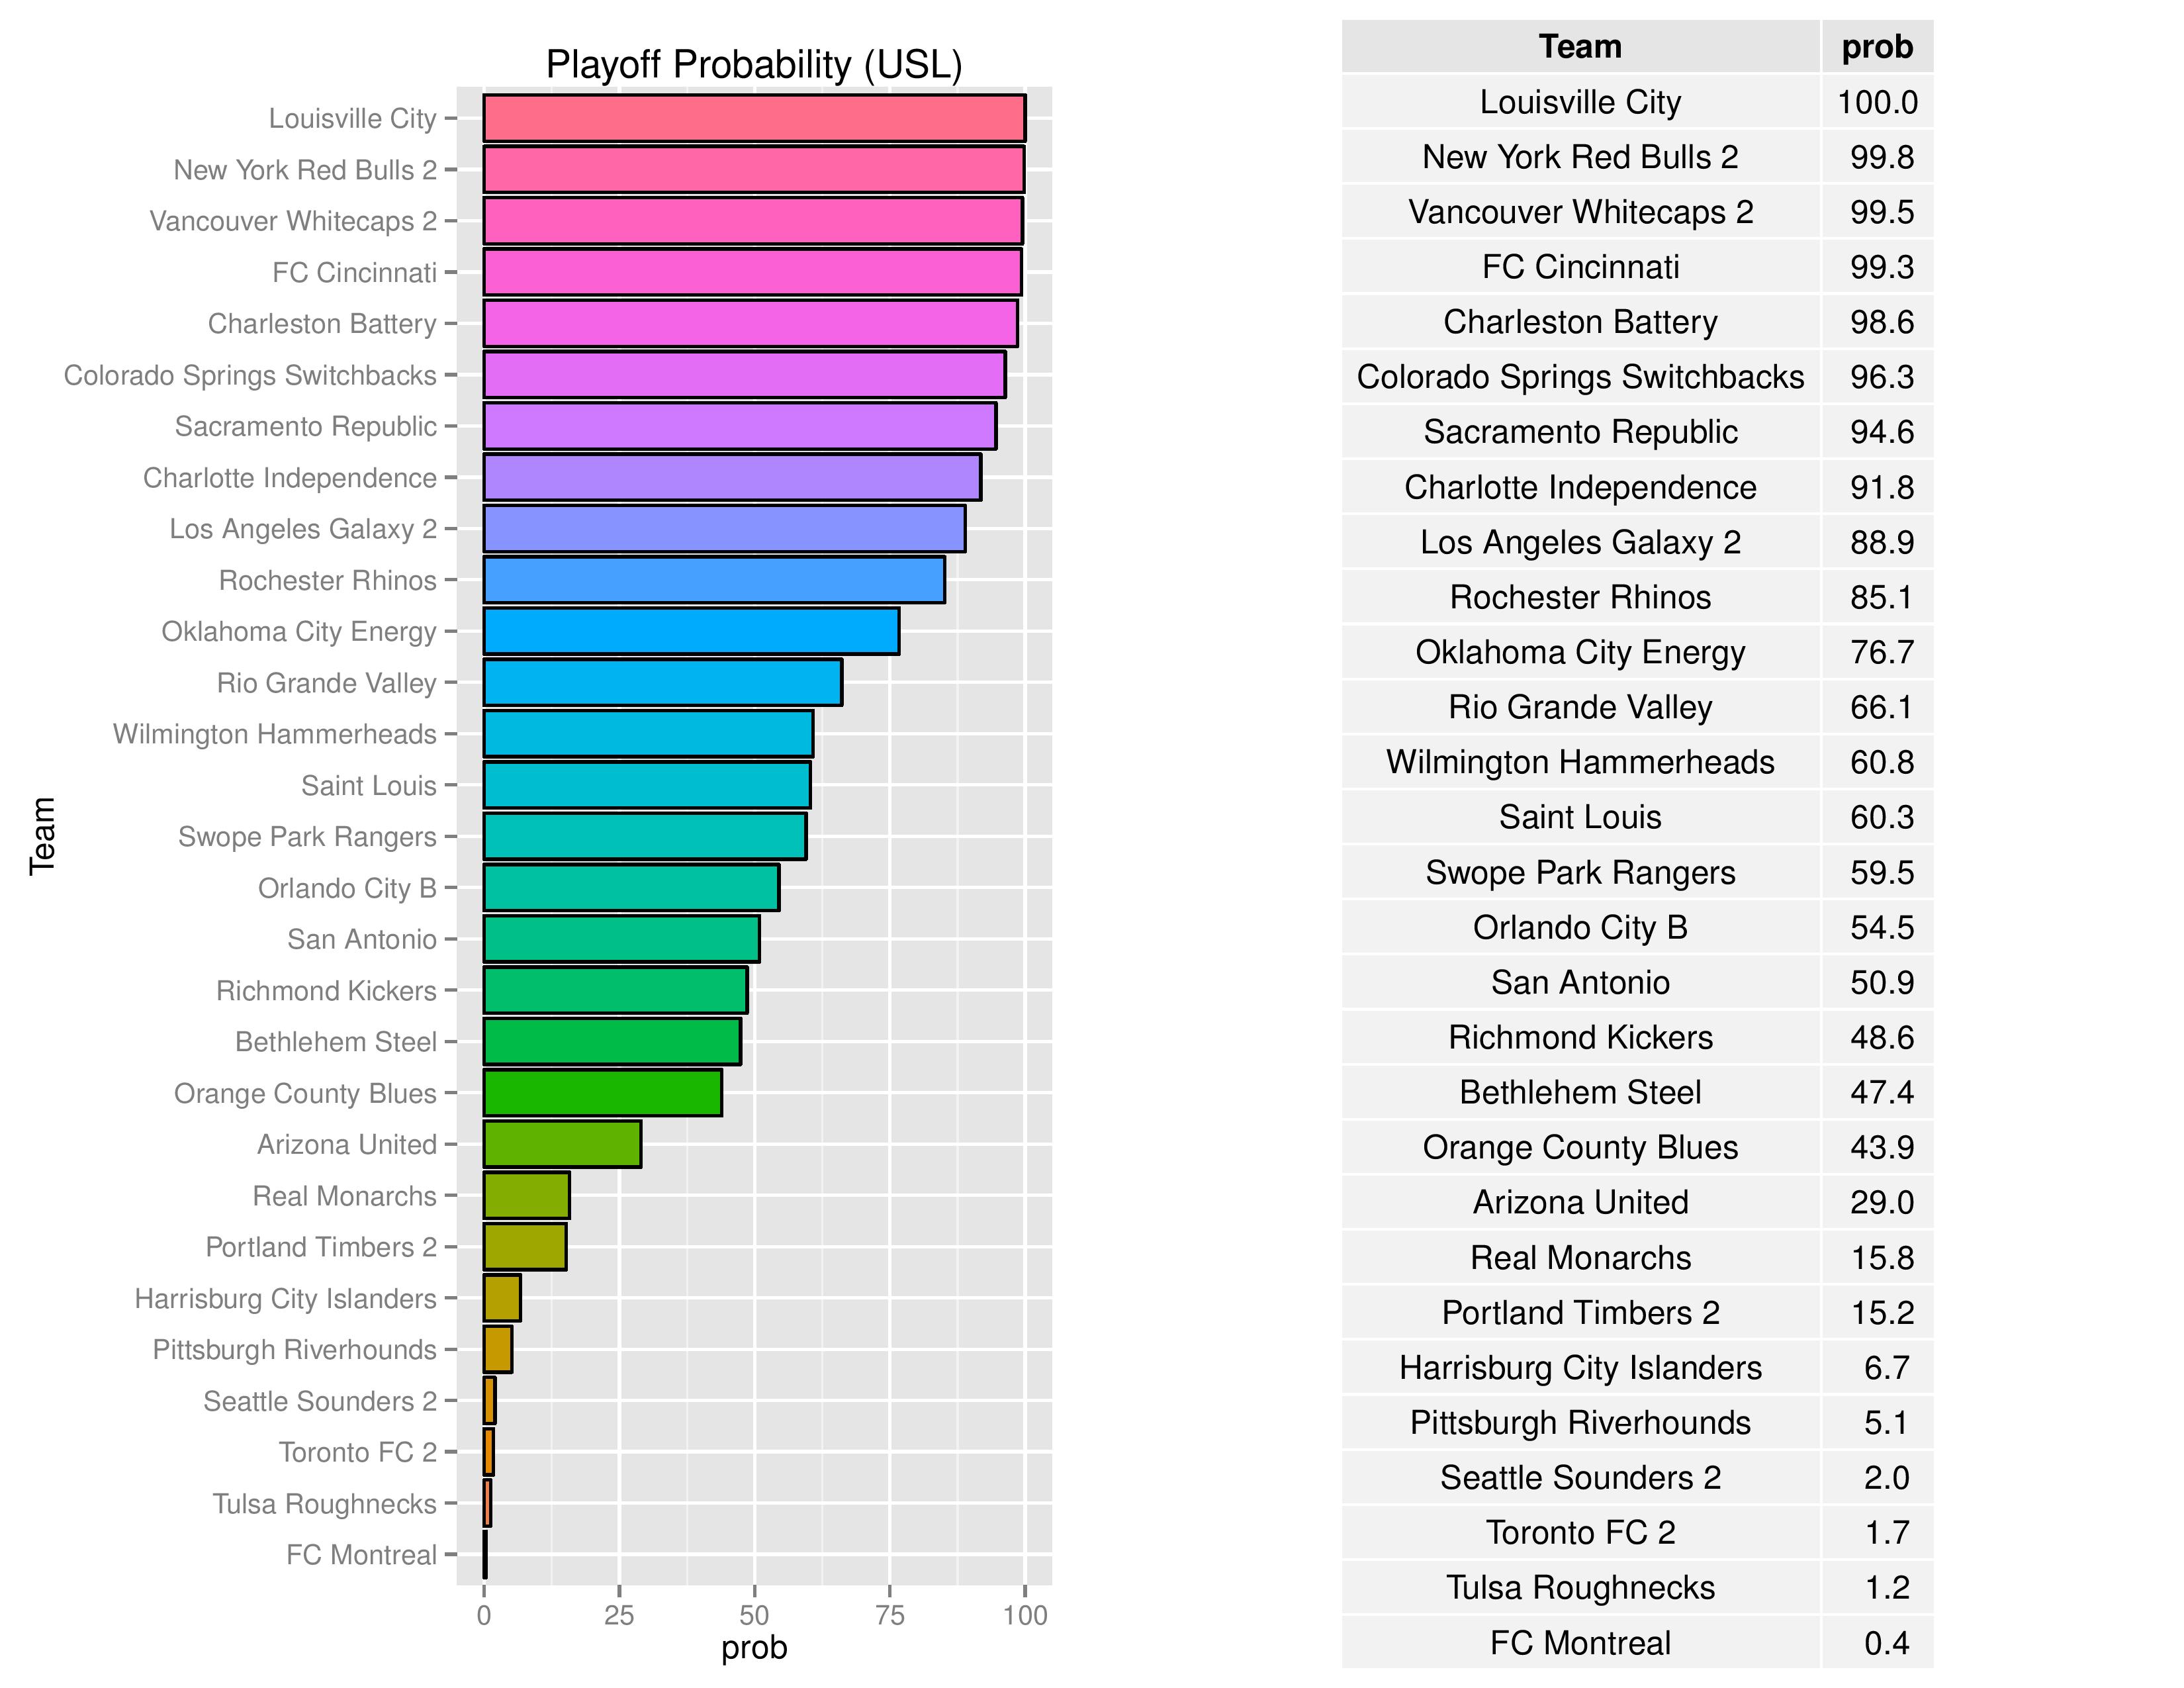
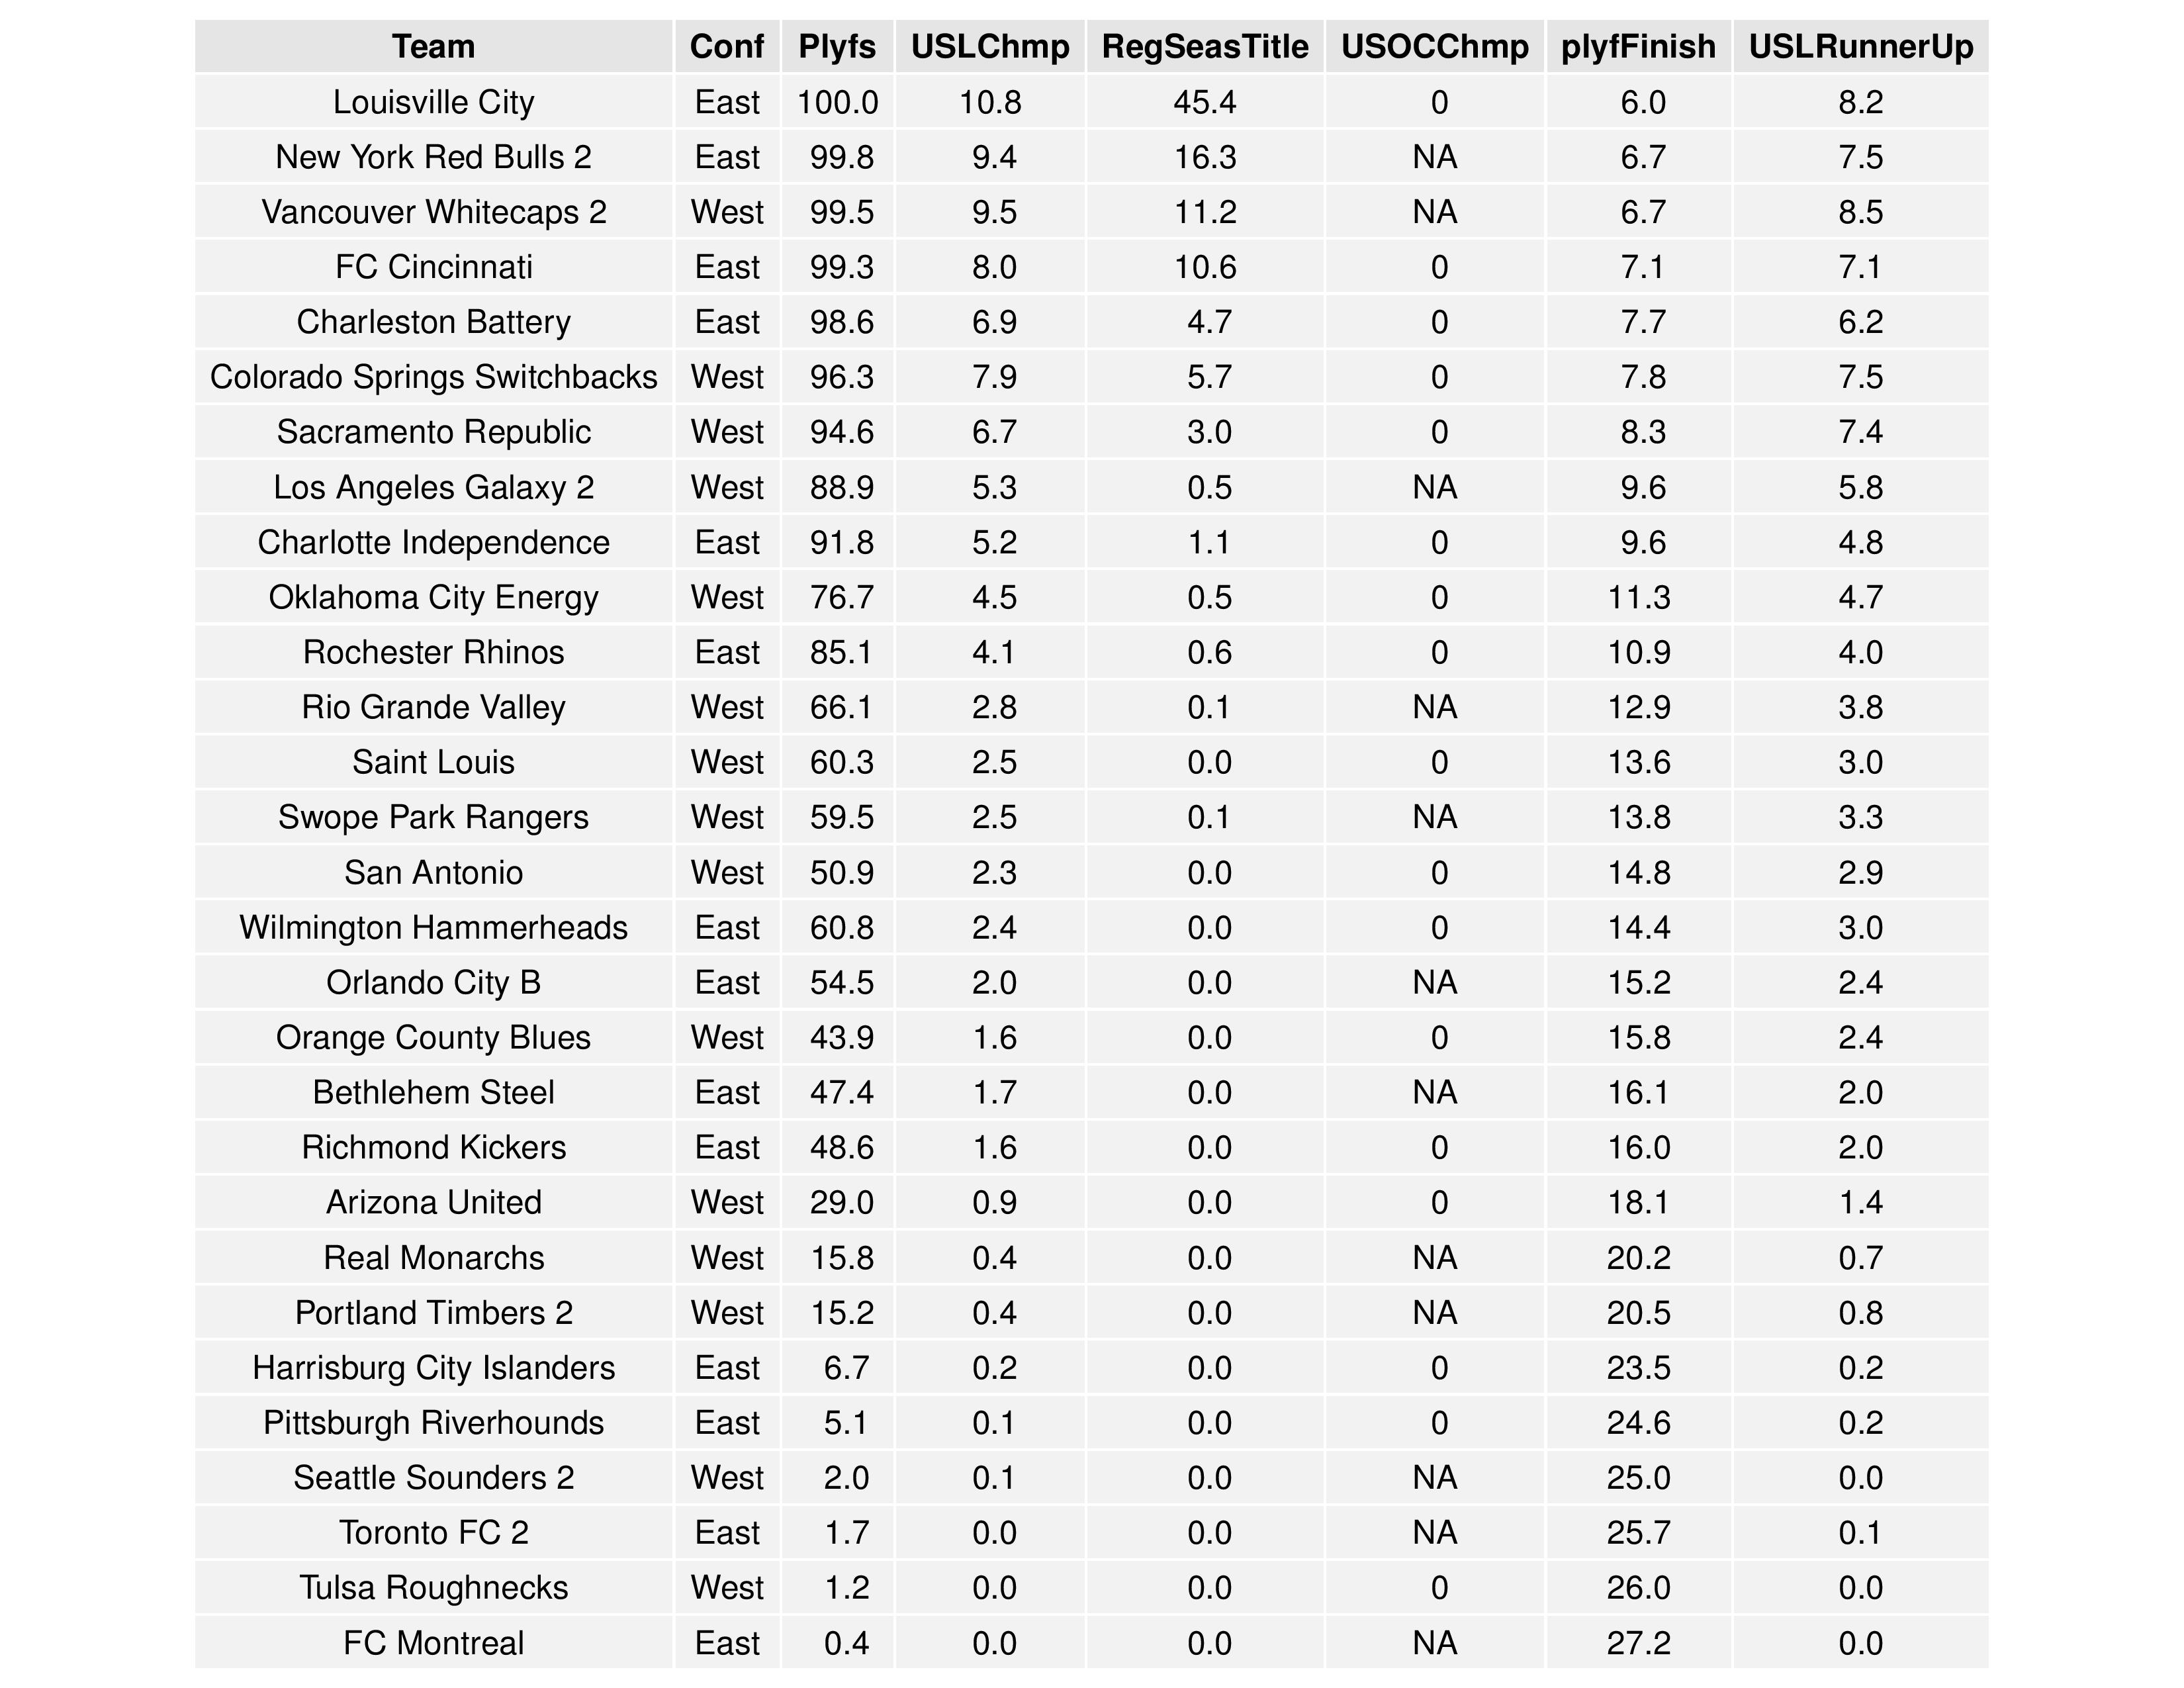
Bethlehem’s probability of making the playoffs declined again from 54.6% to 47.4%. Harrisburg City’s chances remained at 6.7%.
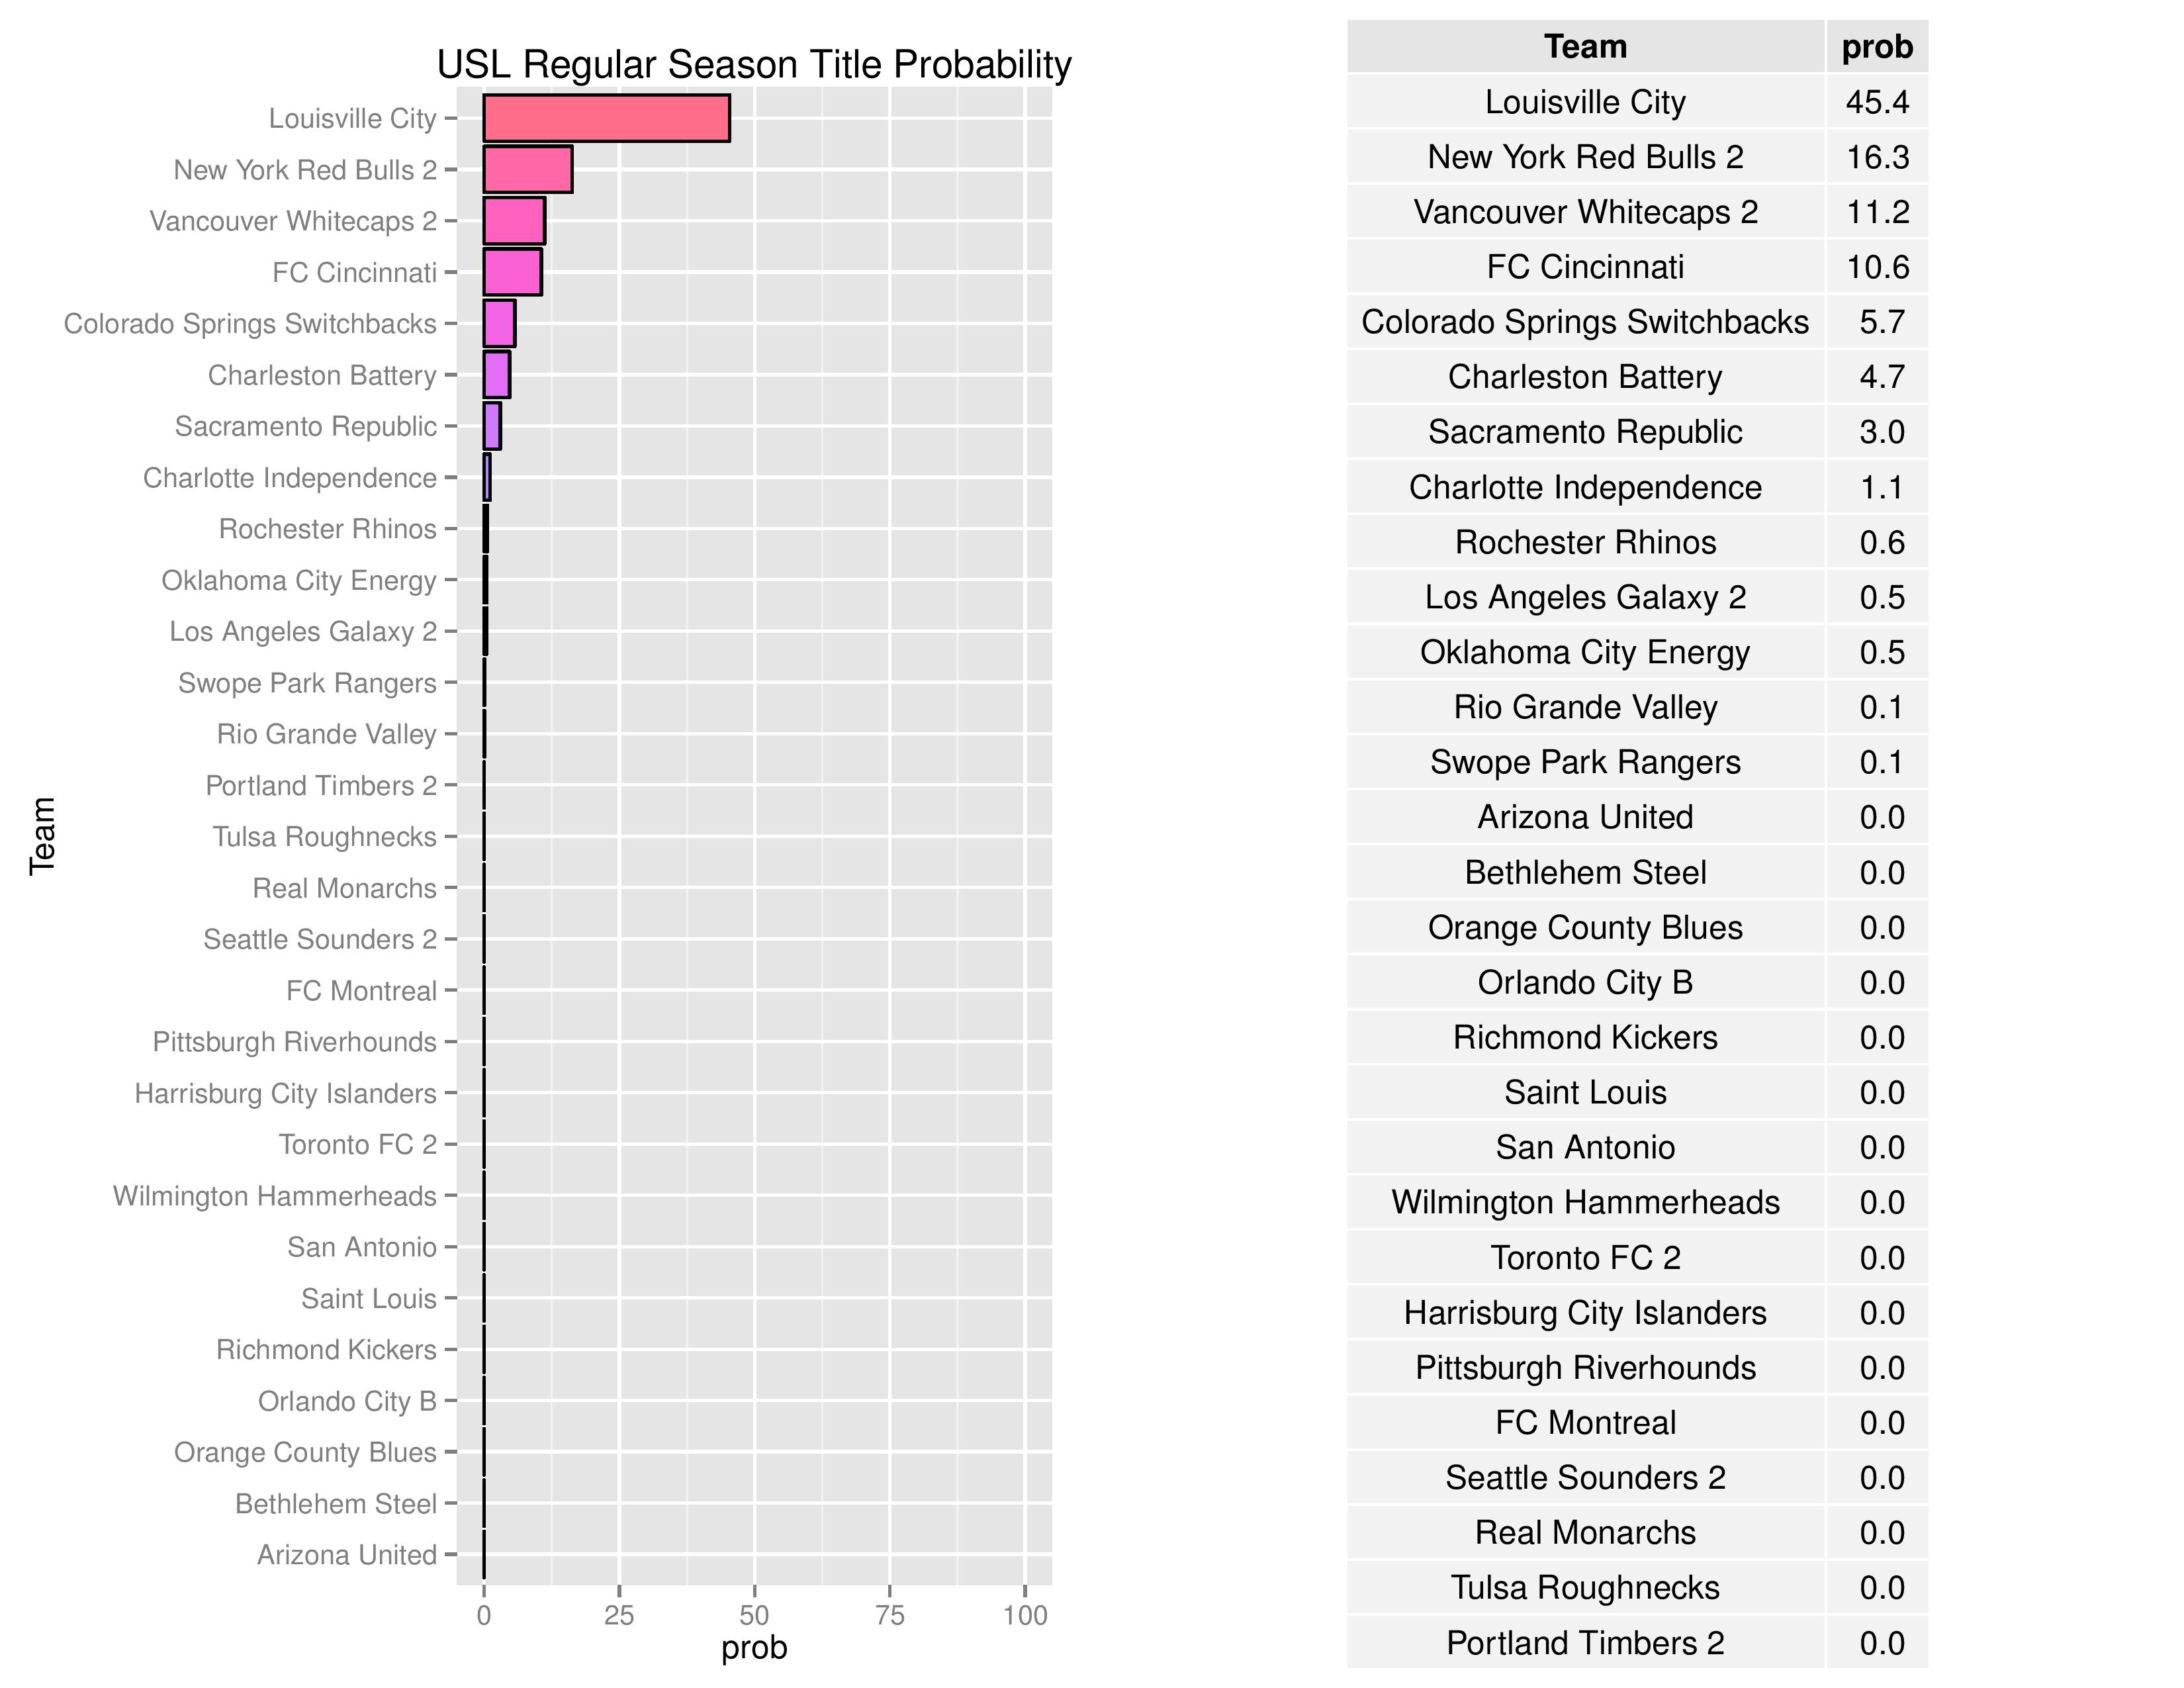
Both Bethlehem and Harrisburg City have effectively no chance of winning the USL regular season title.
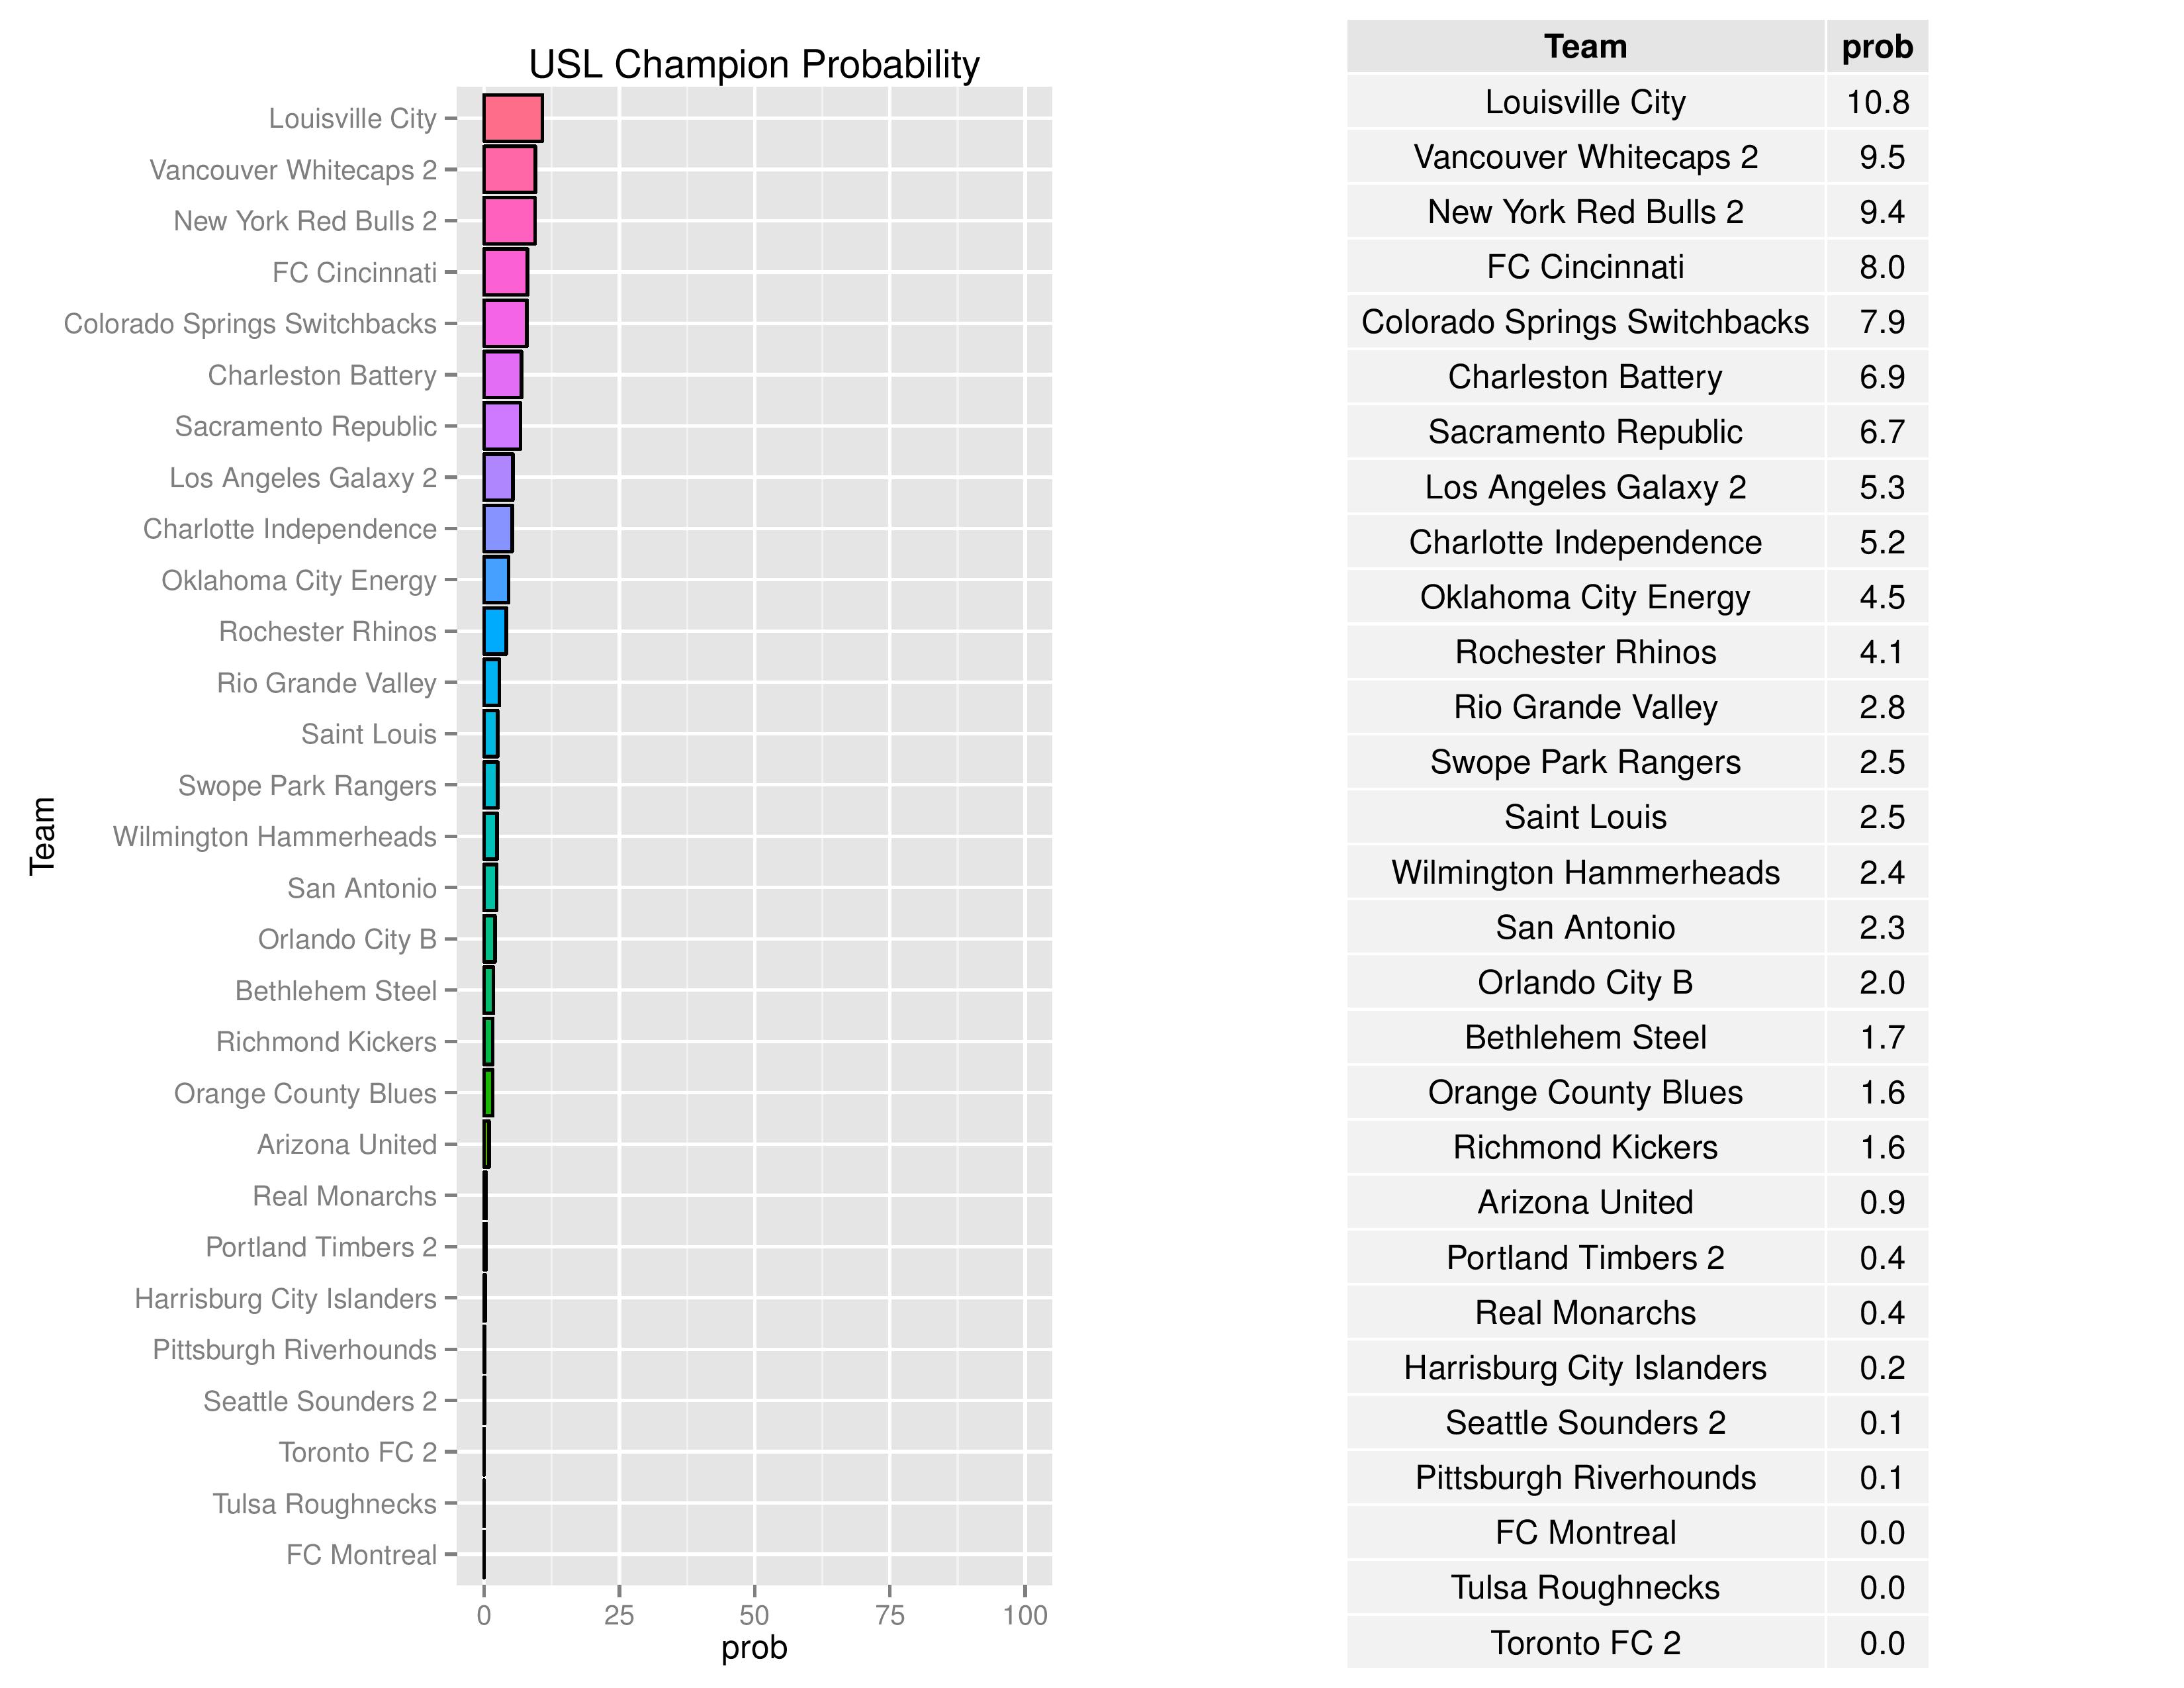
Bethlehem’s probability of winning the USL Championship declined from 2.4% to 1.7%. Harrisburg City’s chances have remained at 0.2%.
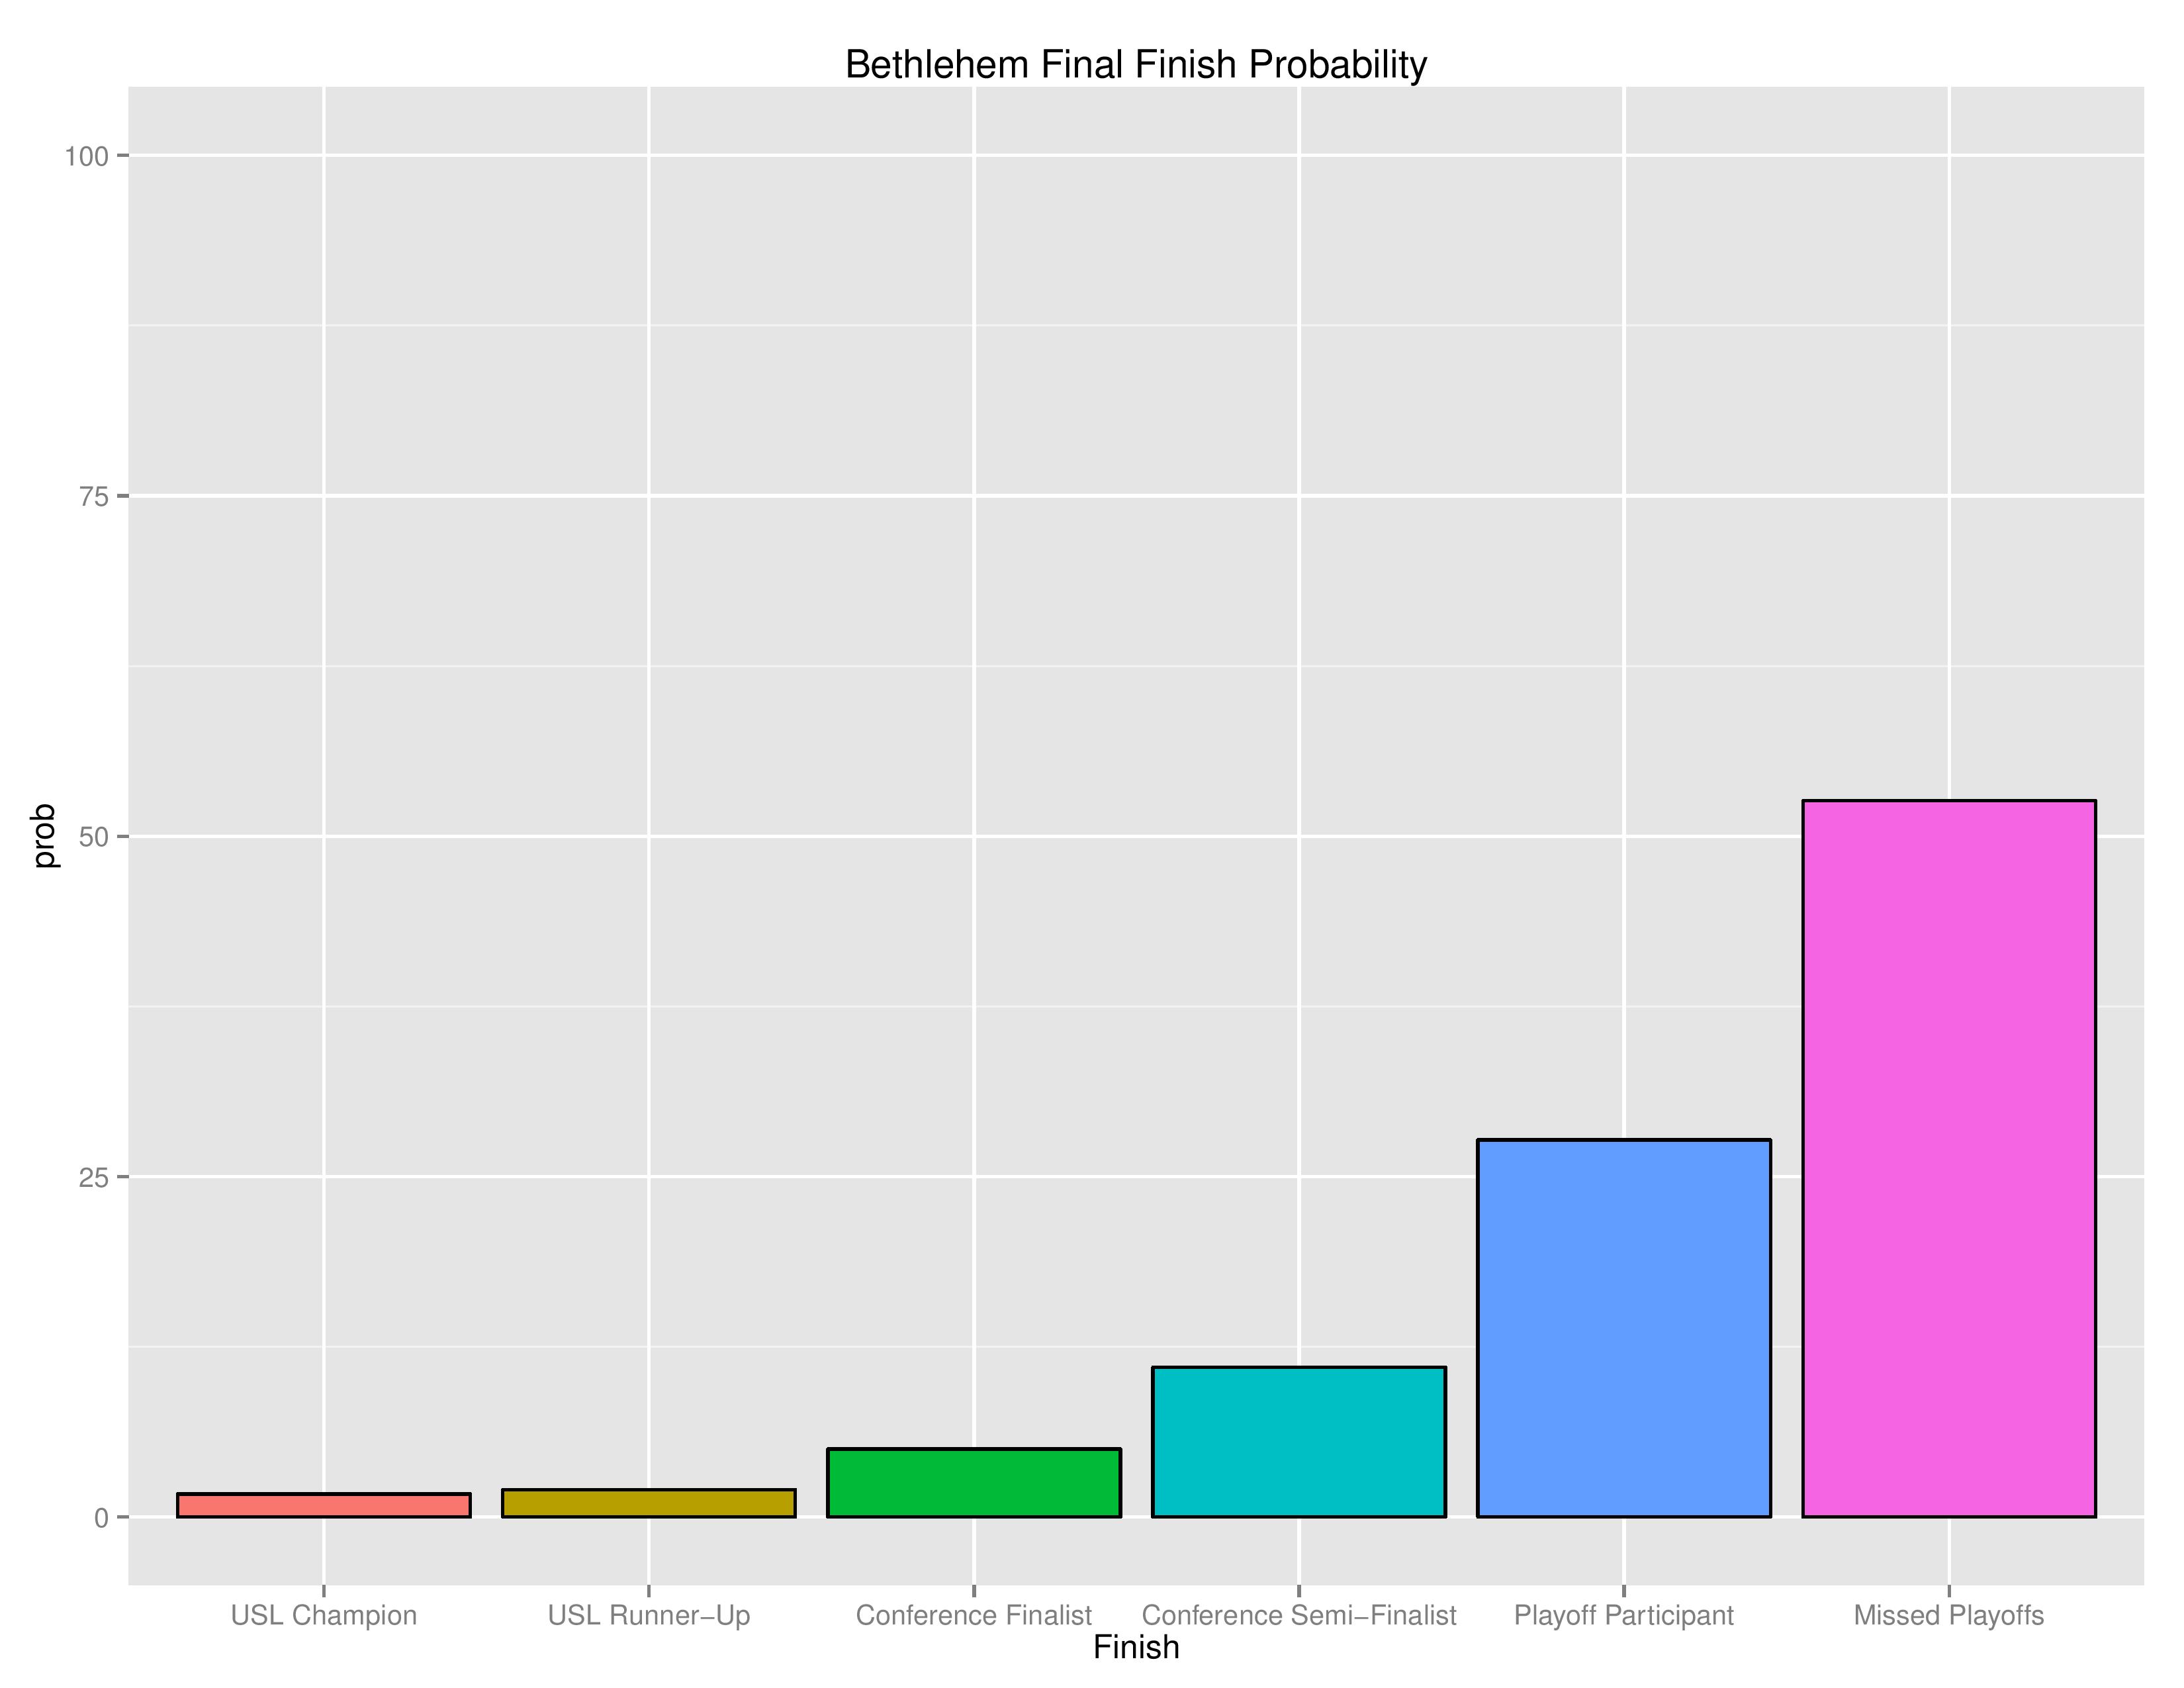
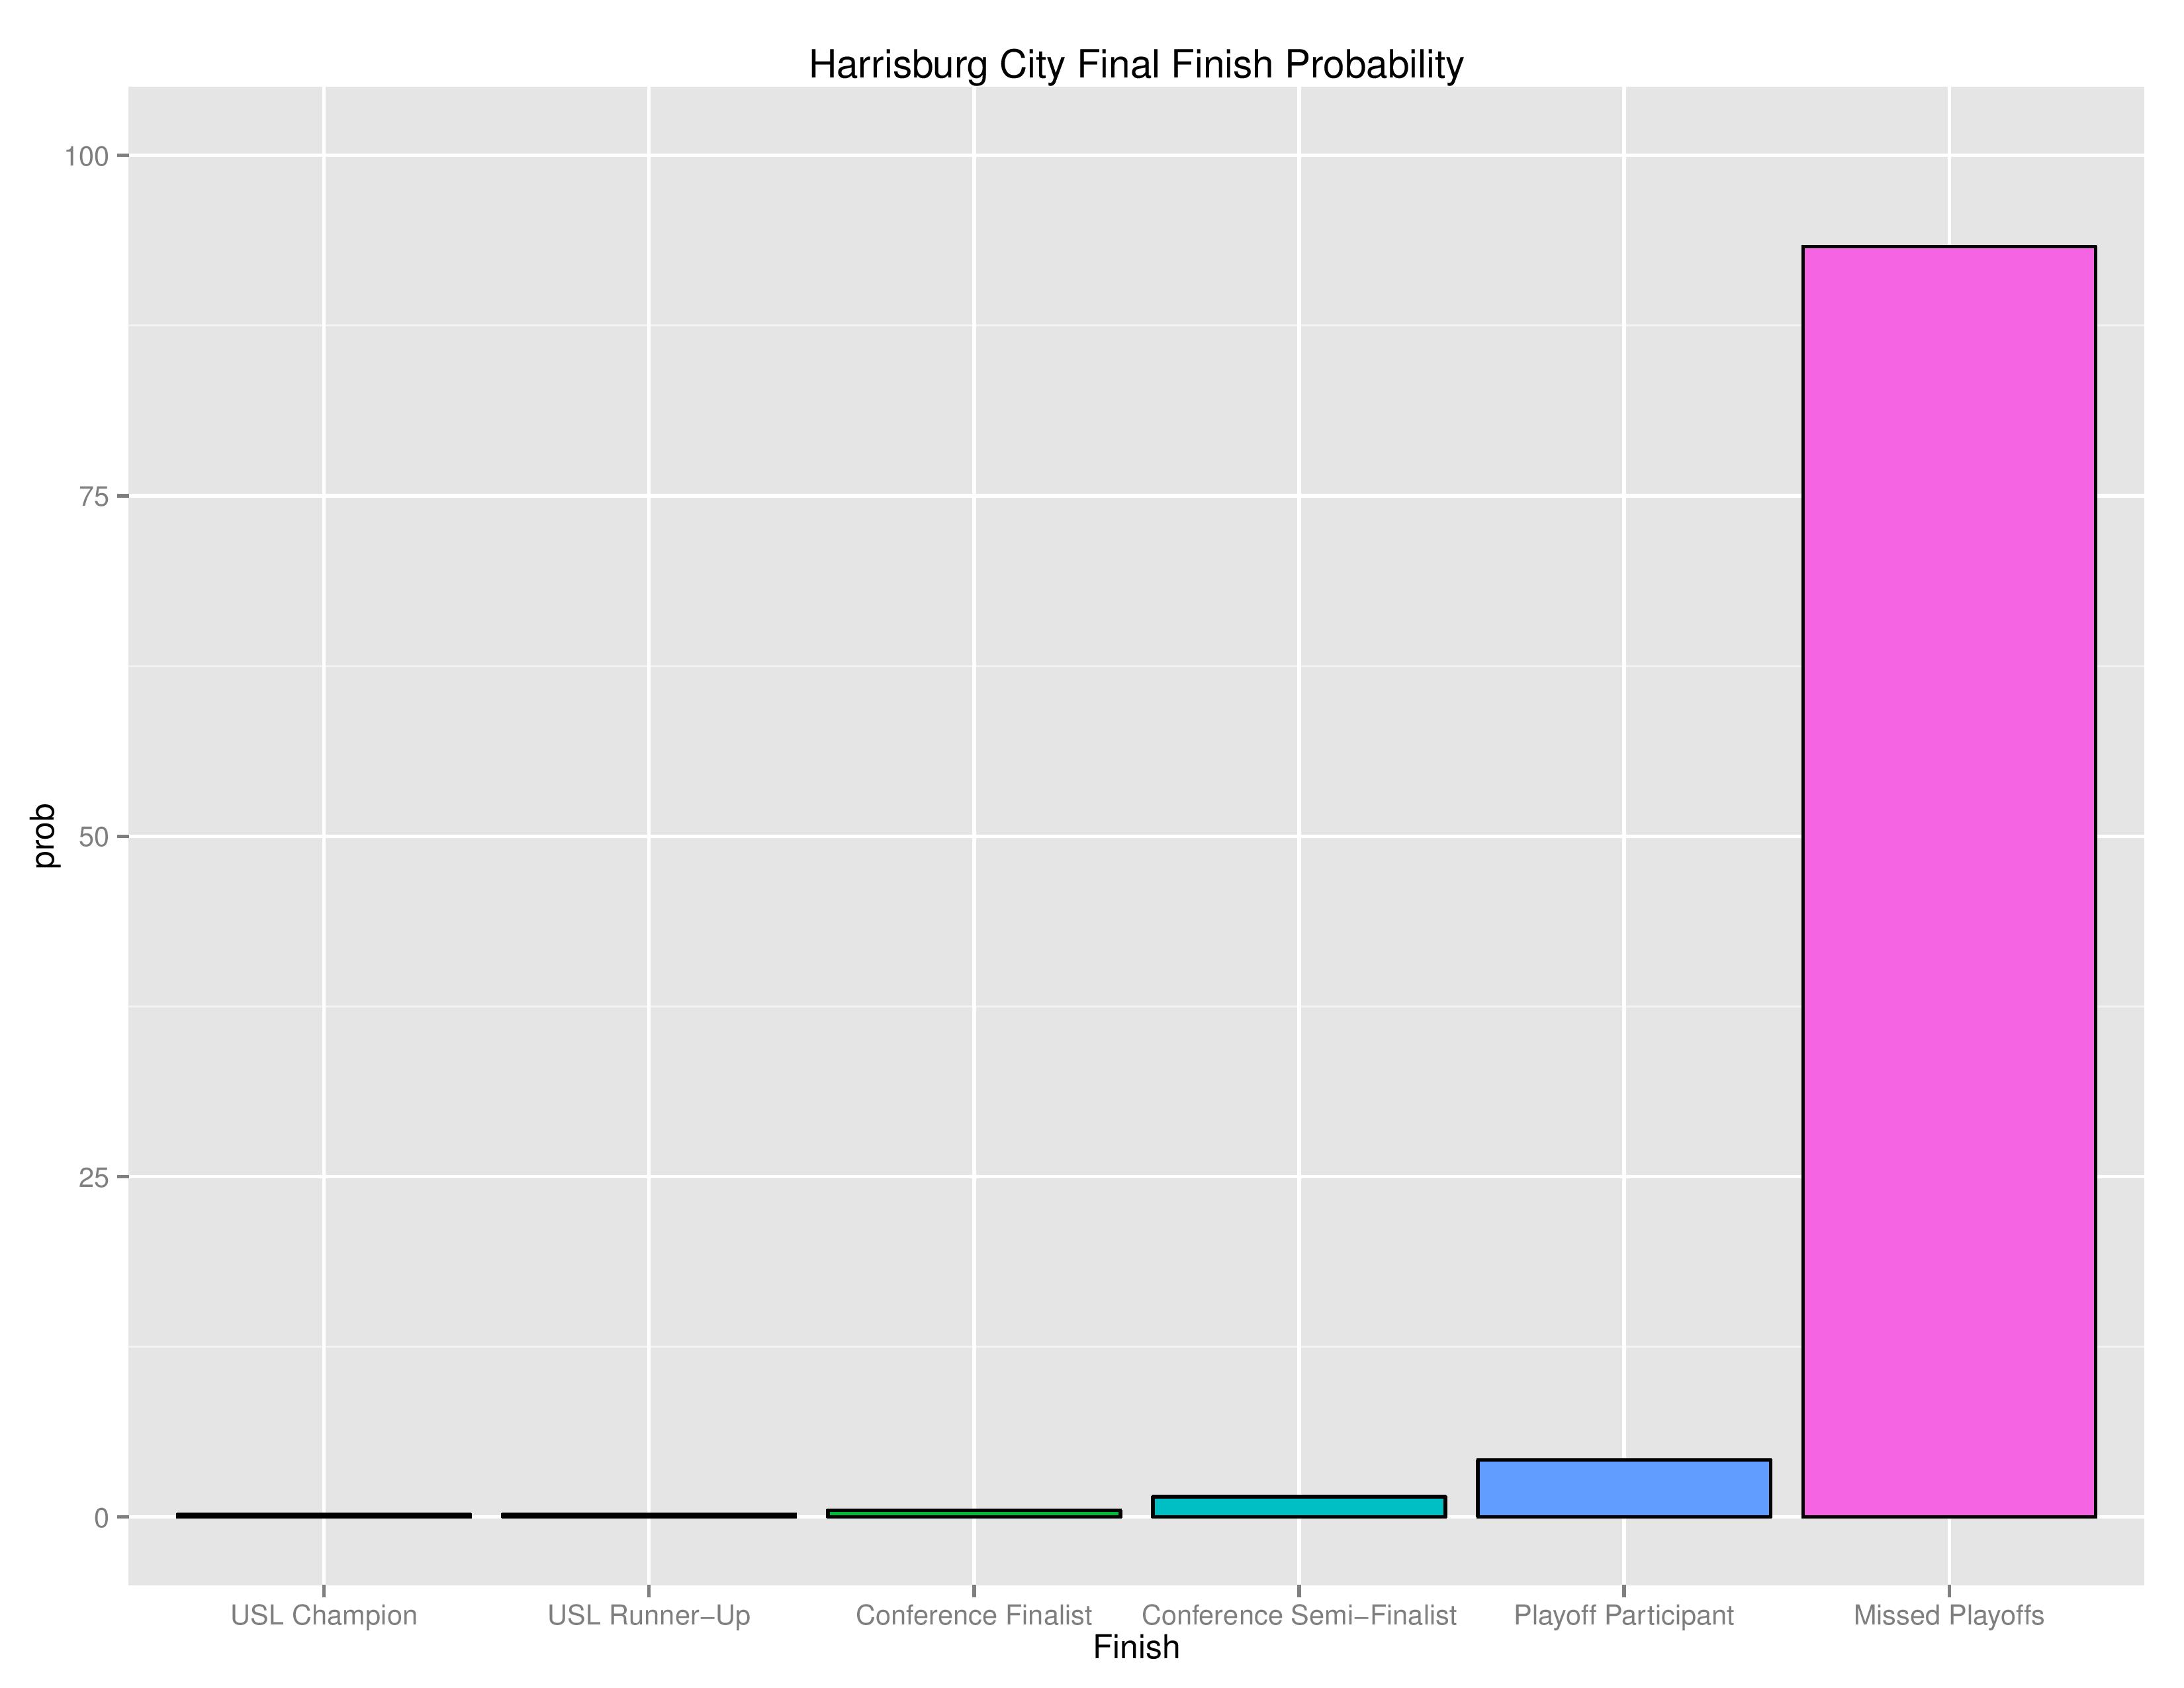
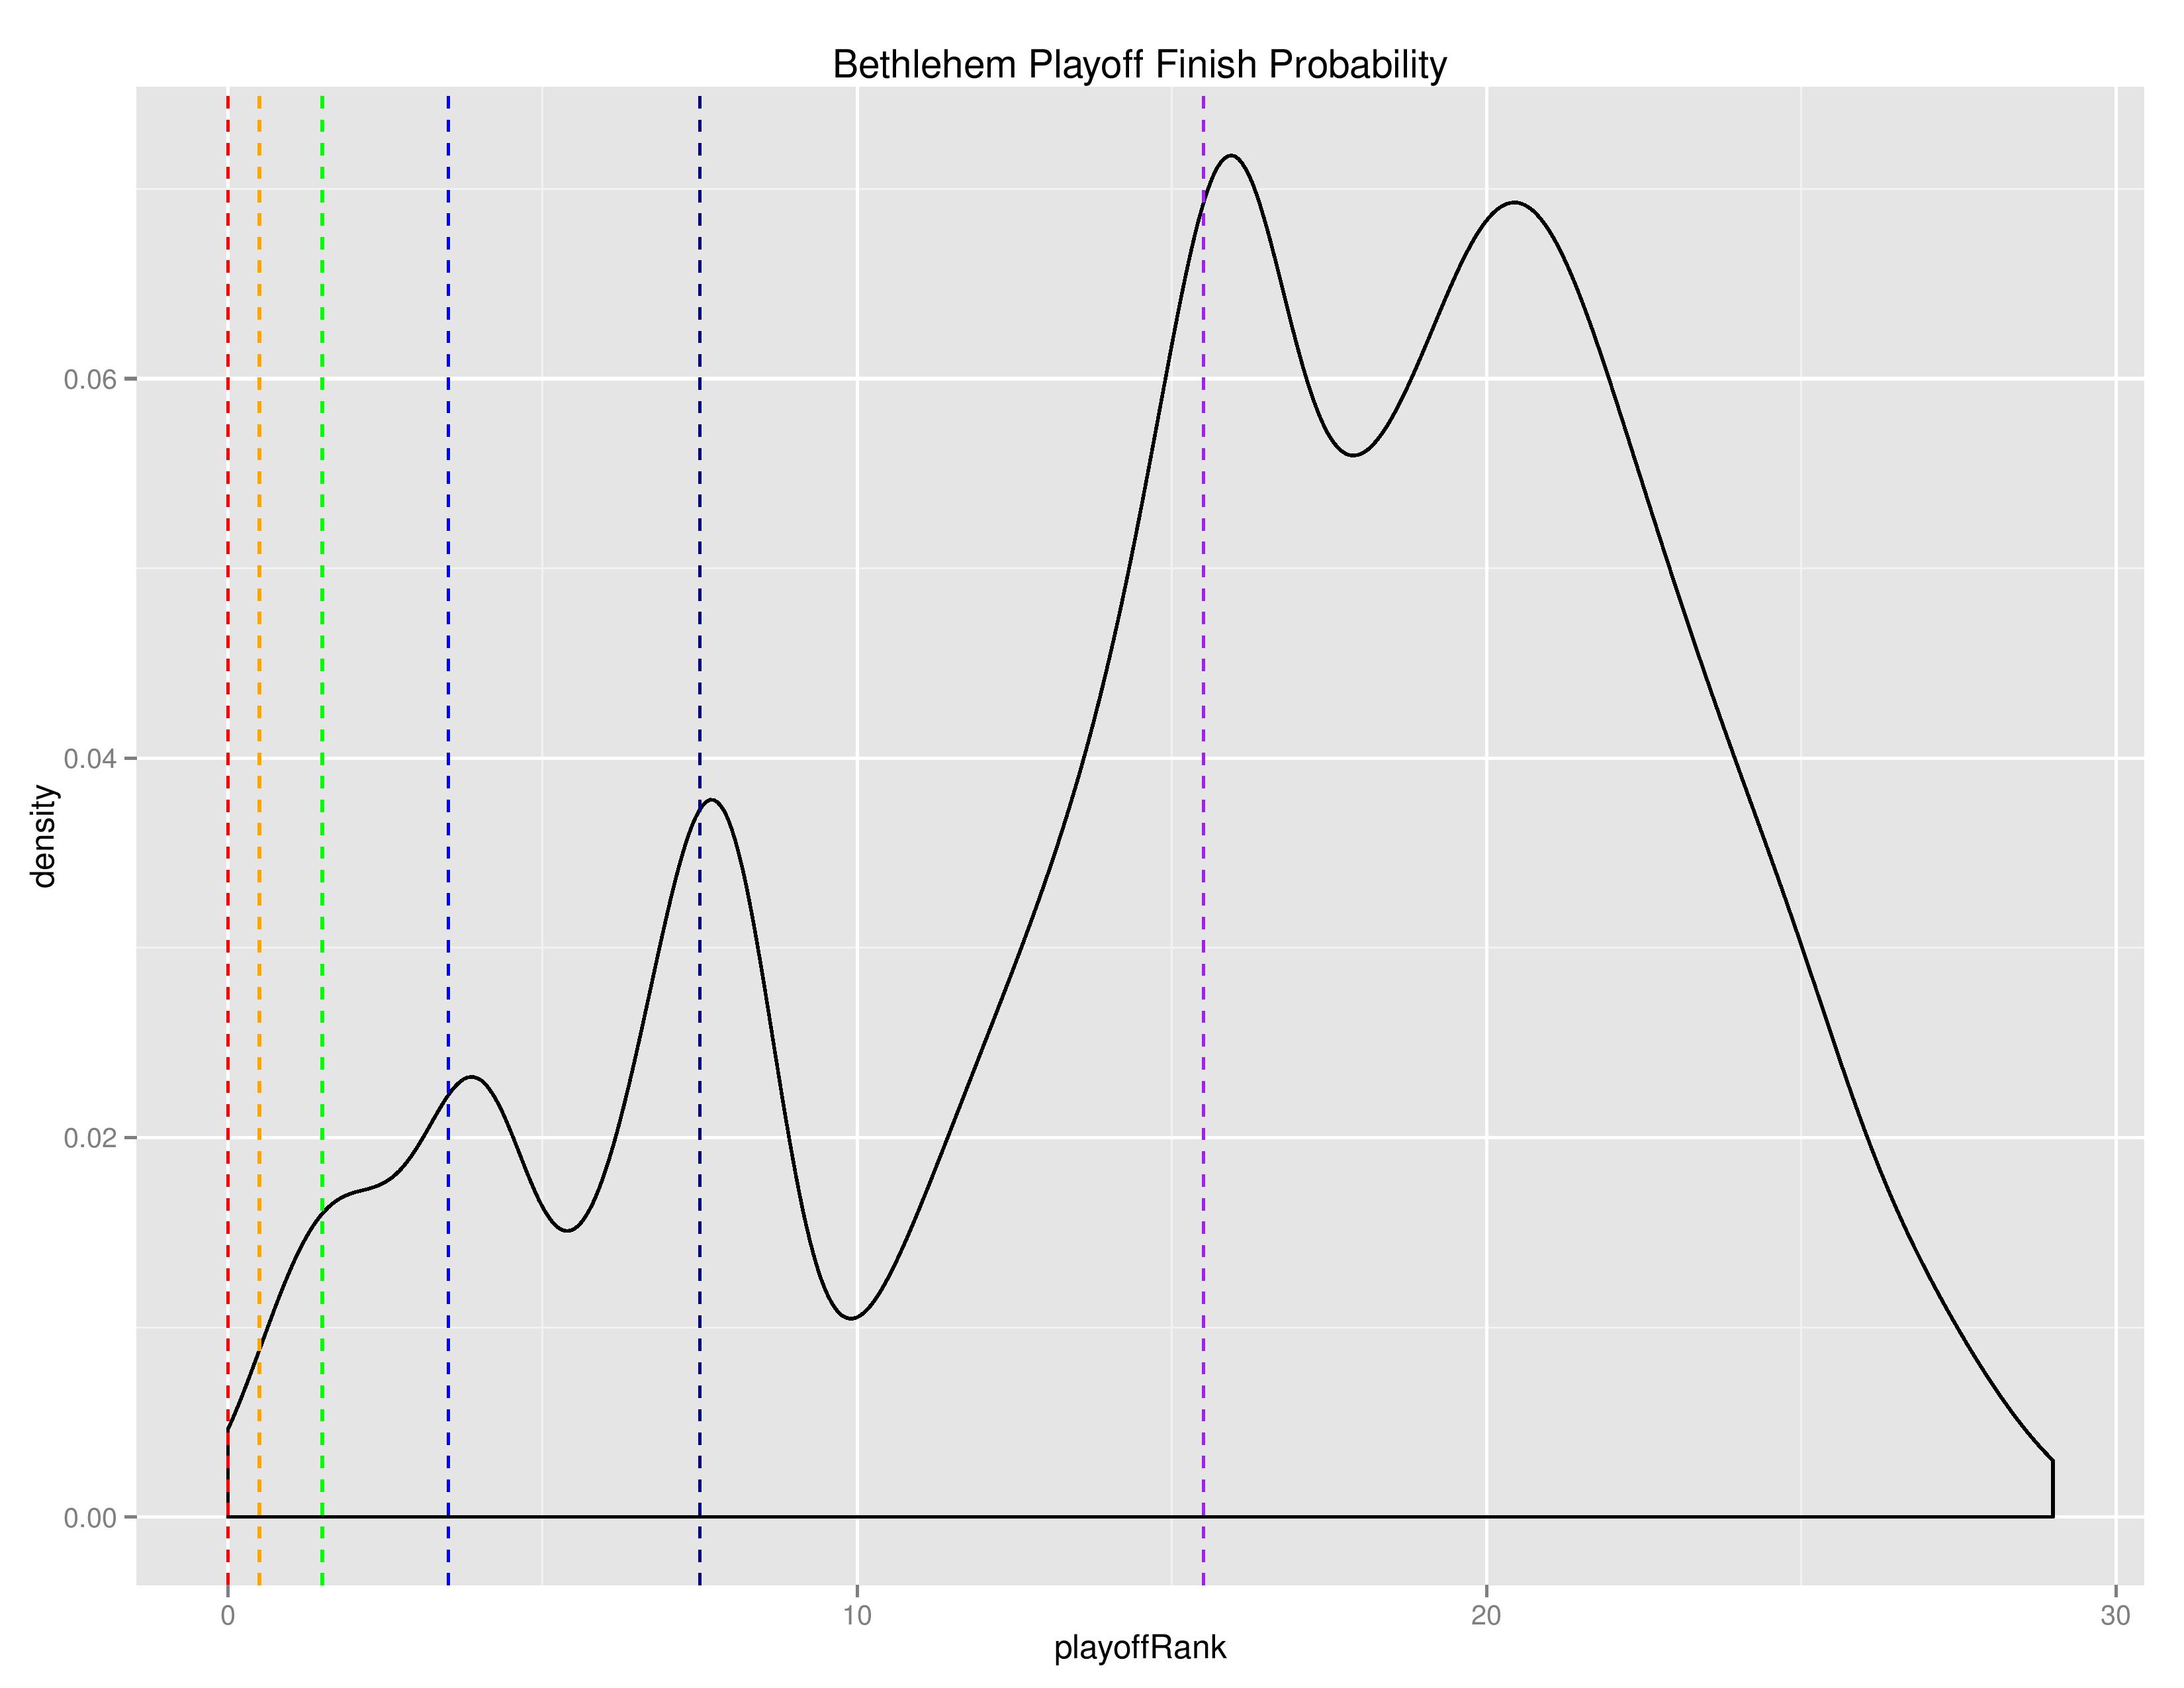
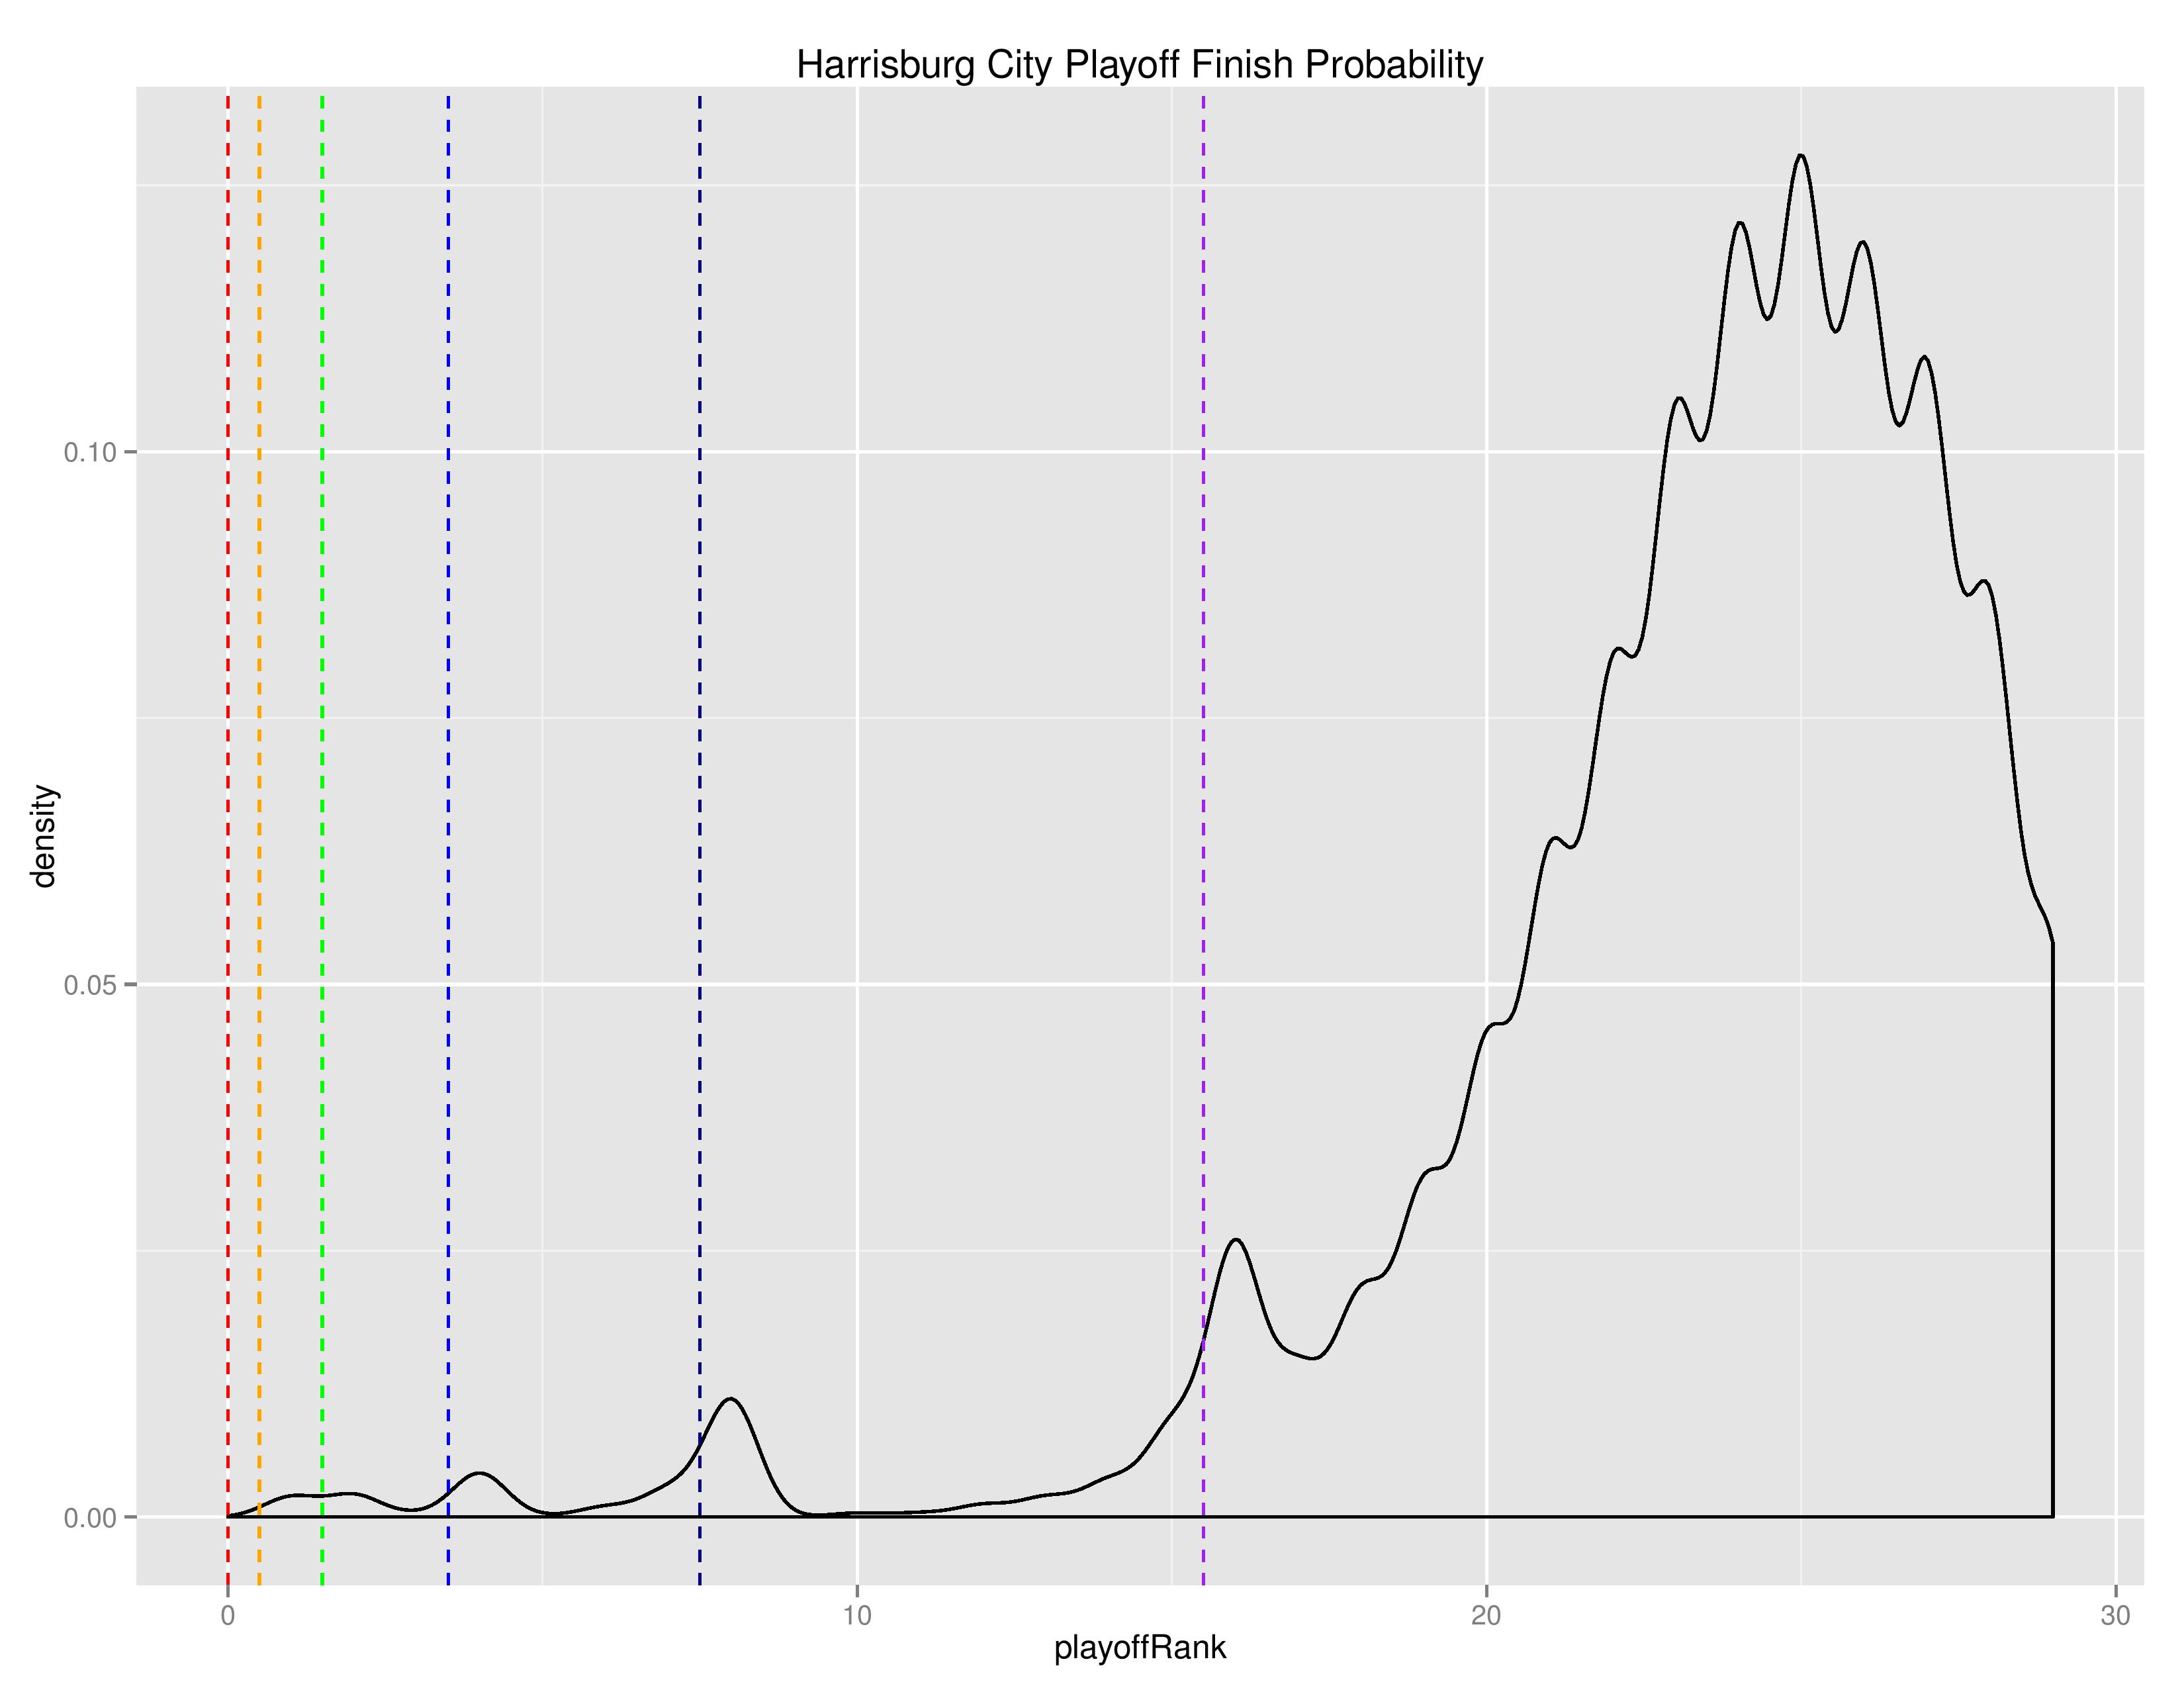
As with MLS, the below density charts show the relative probabilities of Bethlehem and Harrisburg finishing for their final playoff-rank.
The following are the upcoming matches and associated probabilities for Bethlehem and Harrisburg City.
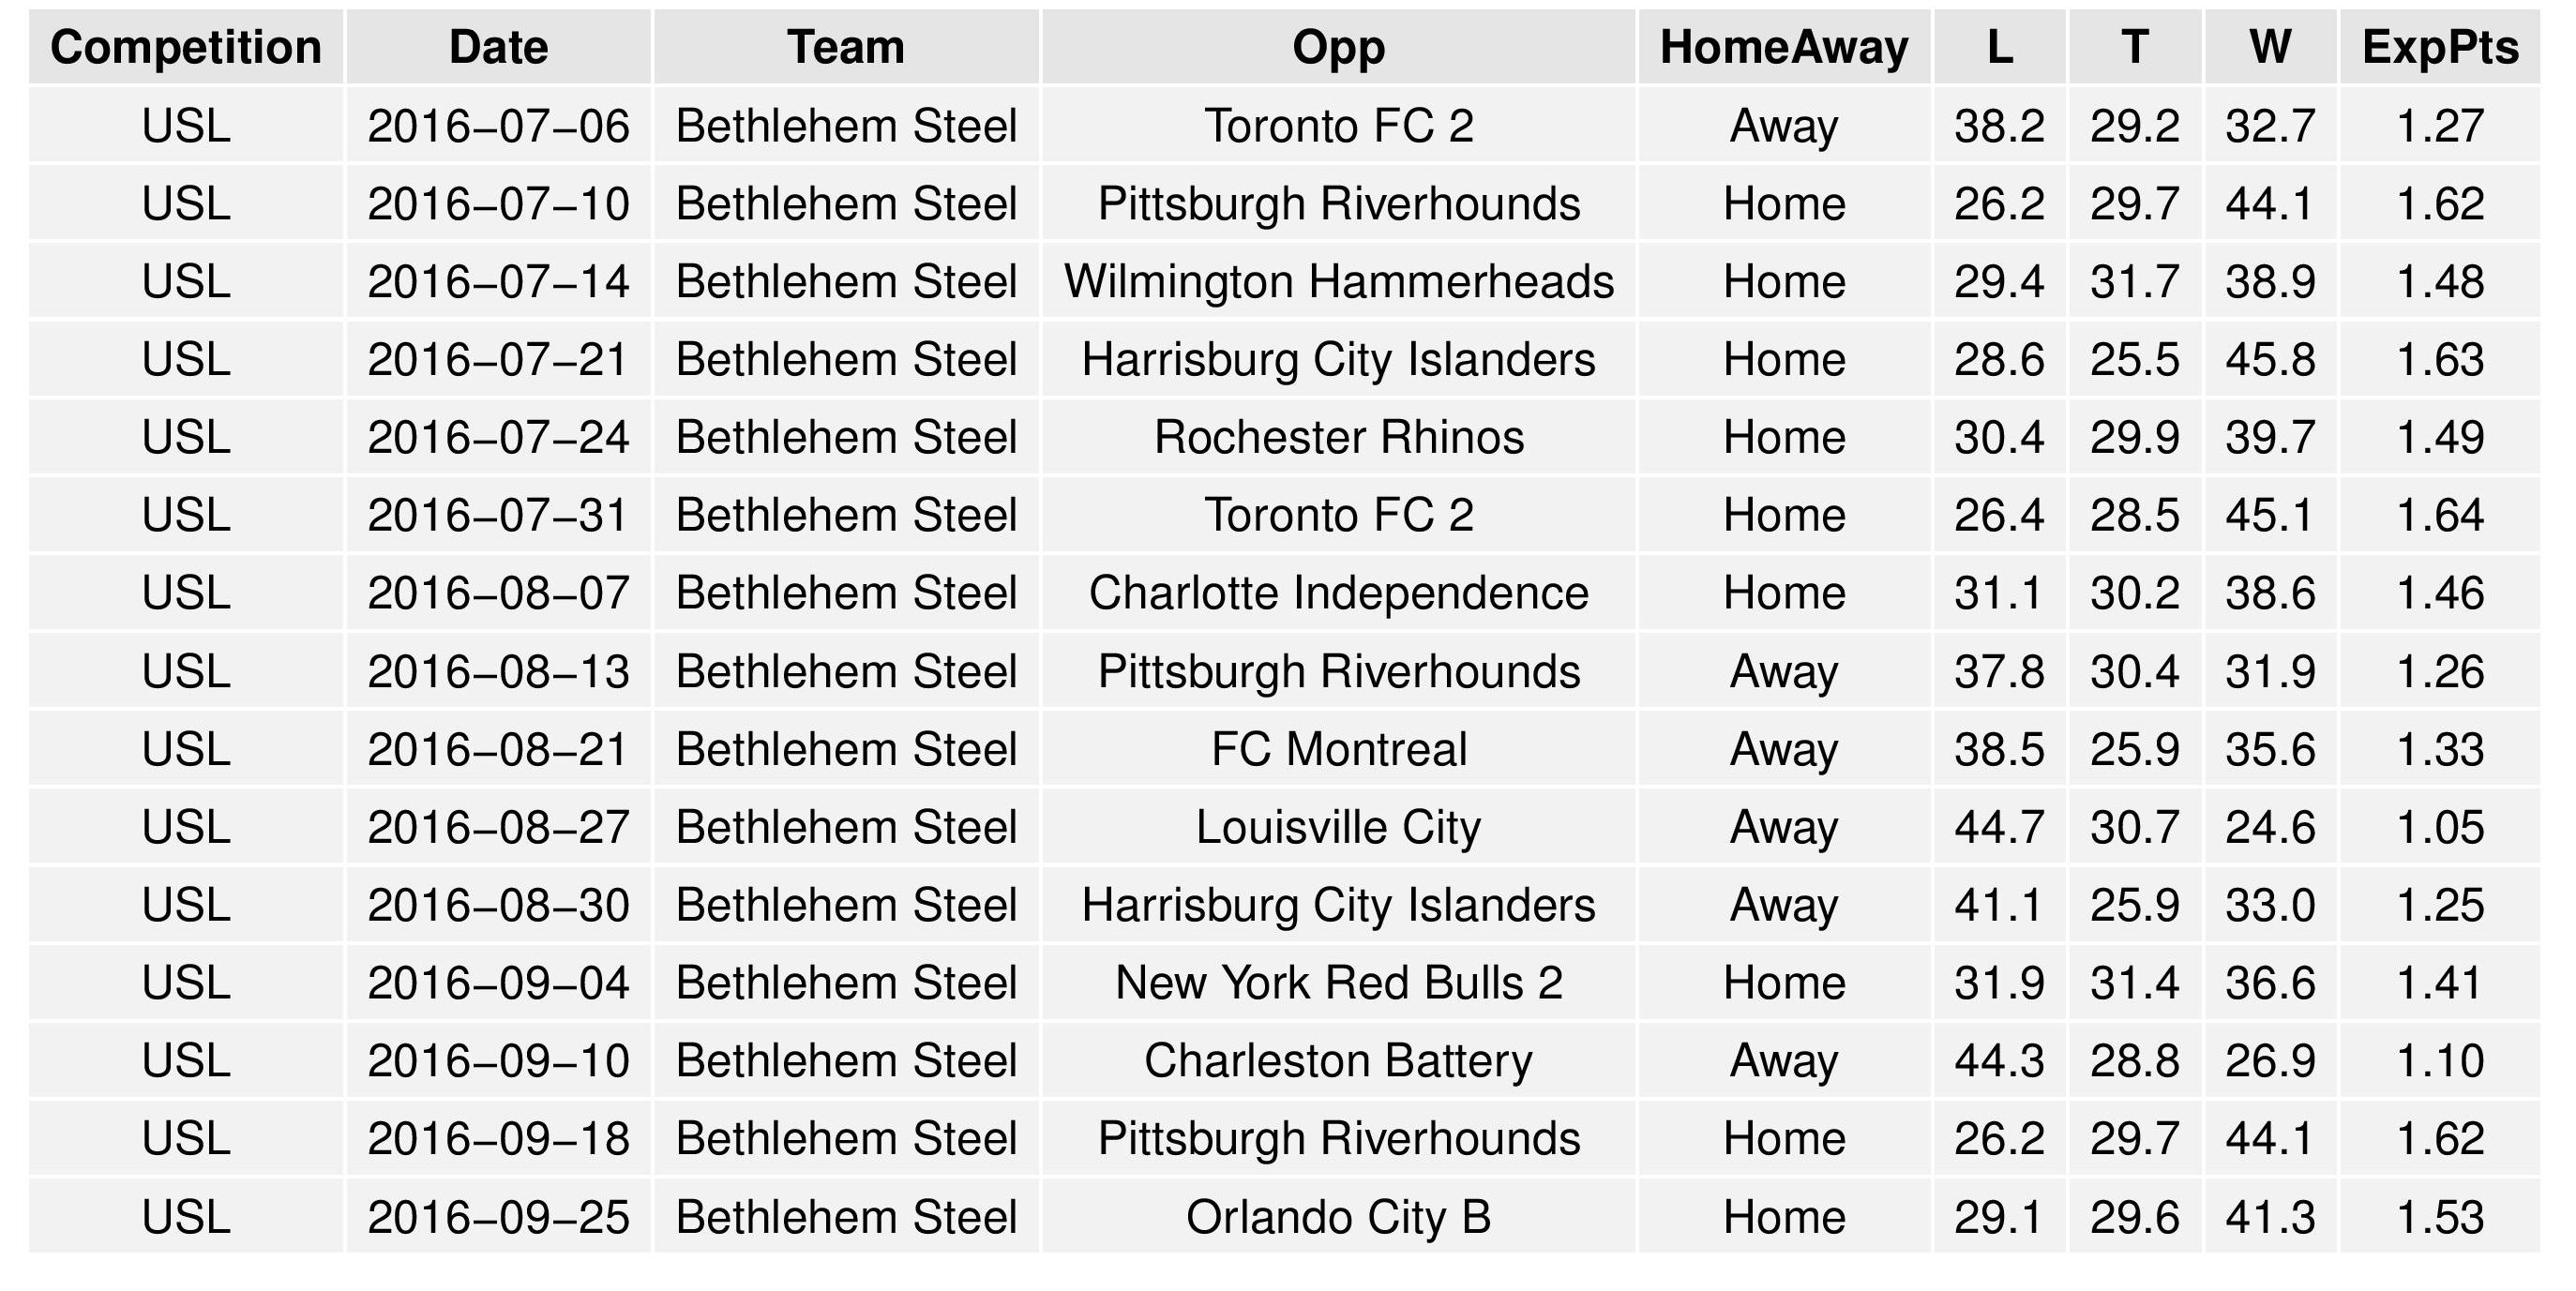
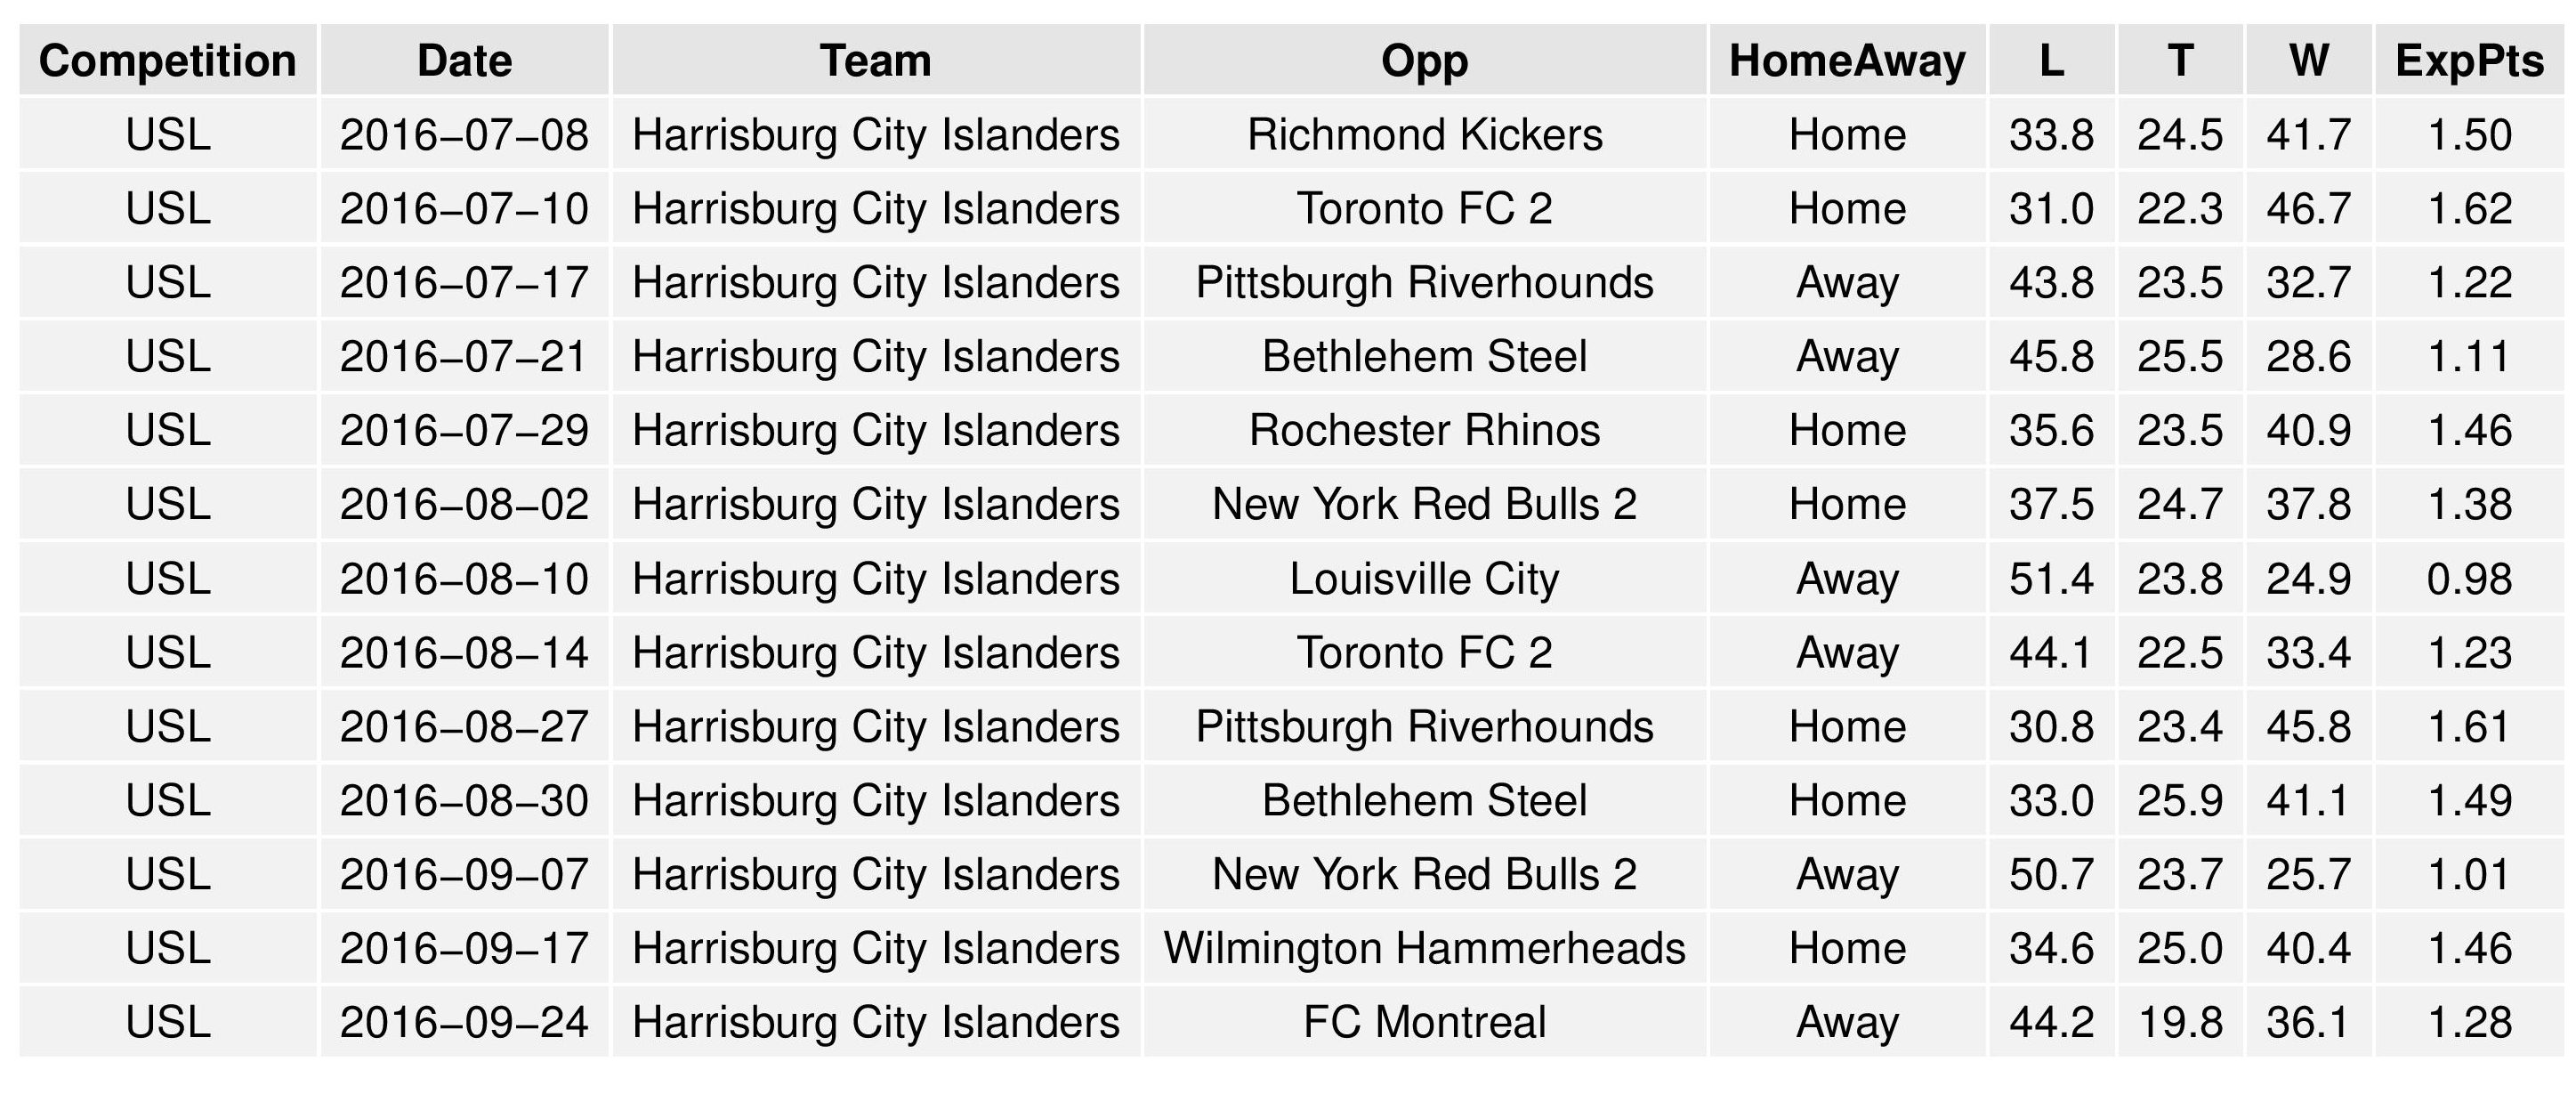
The following tables show the average simulation results. They are divided into two tables to present better to your screen.
Changes Over Time
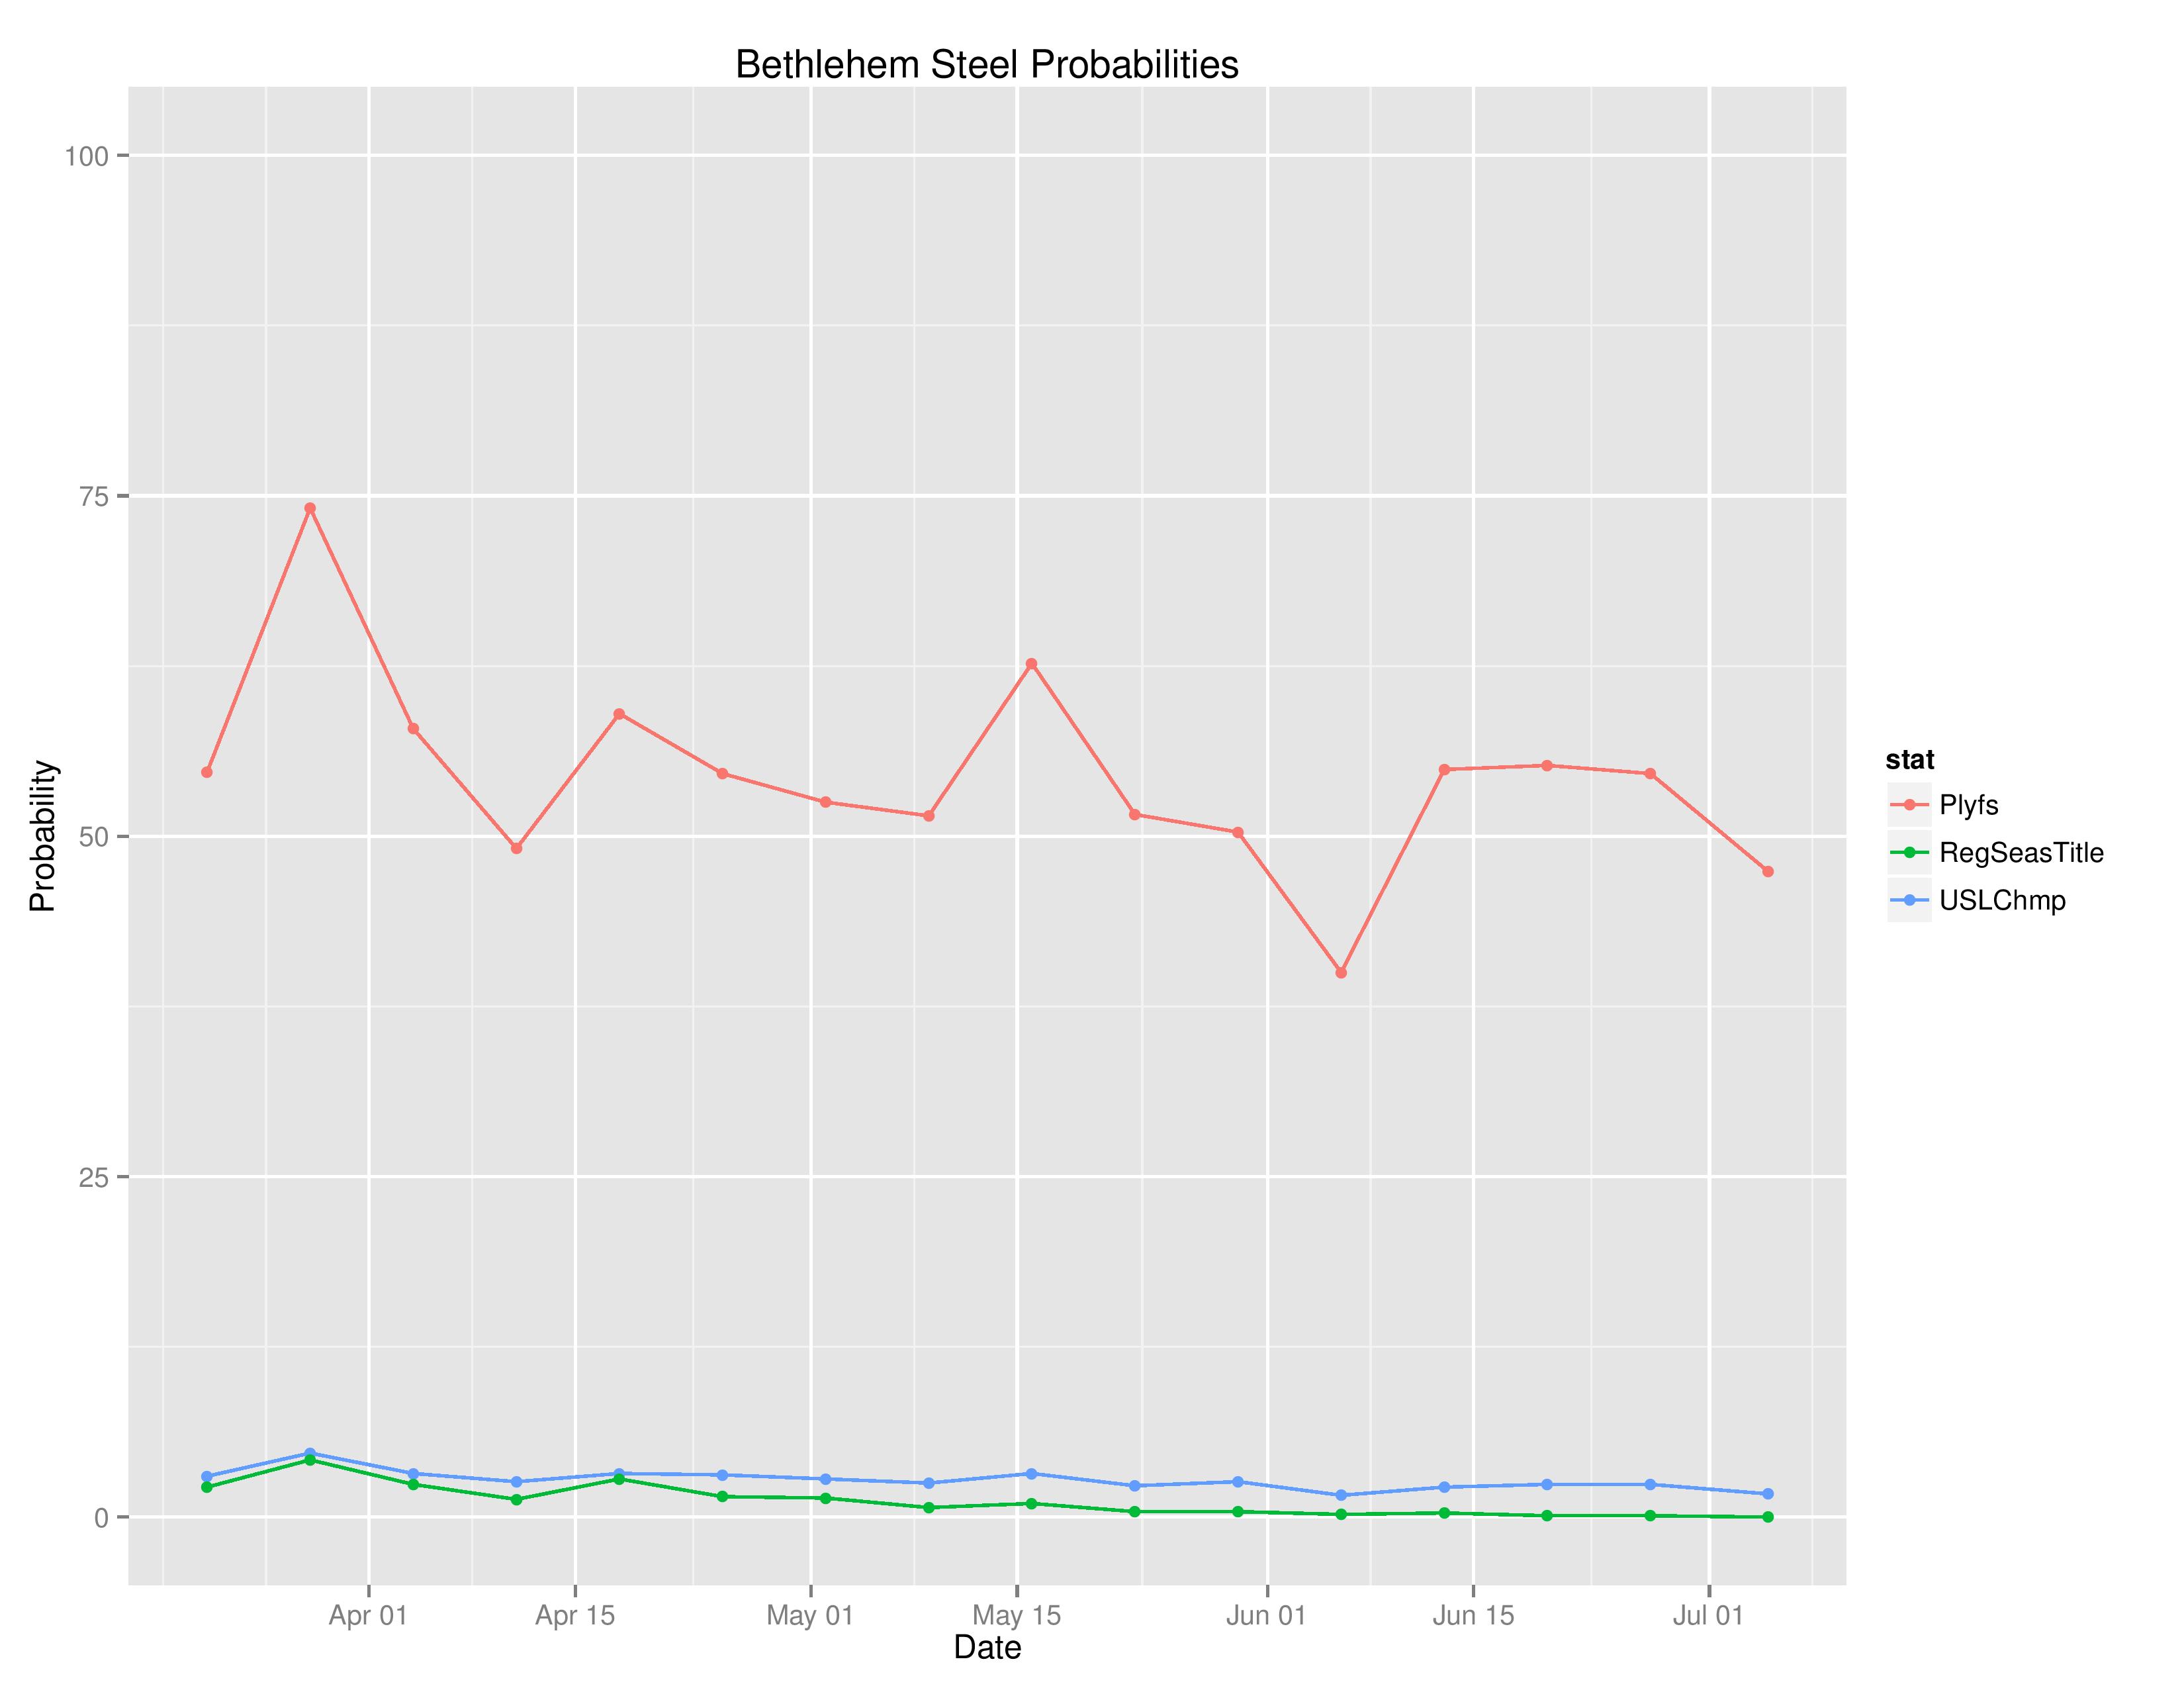
Above shows the probabilities of various outcomes for Bethlehem over the course of the season.
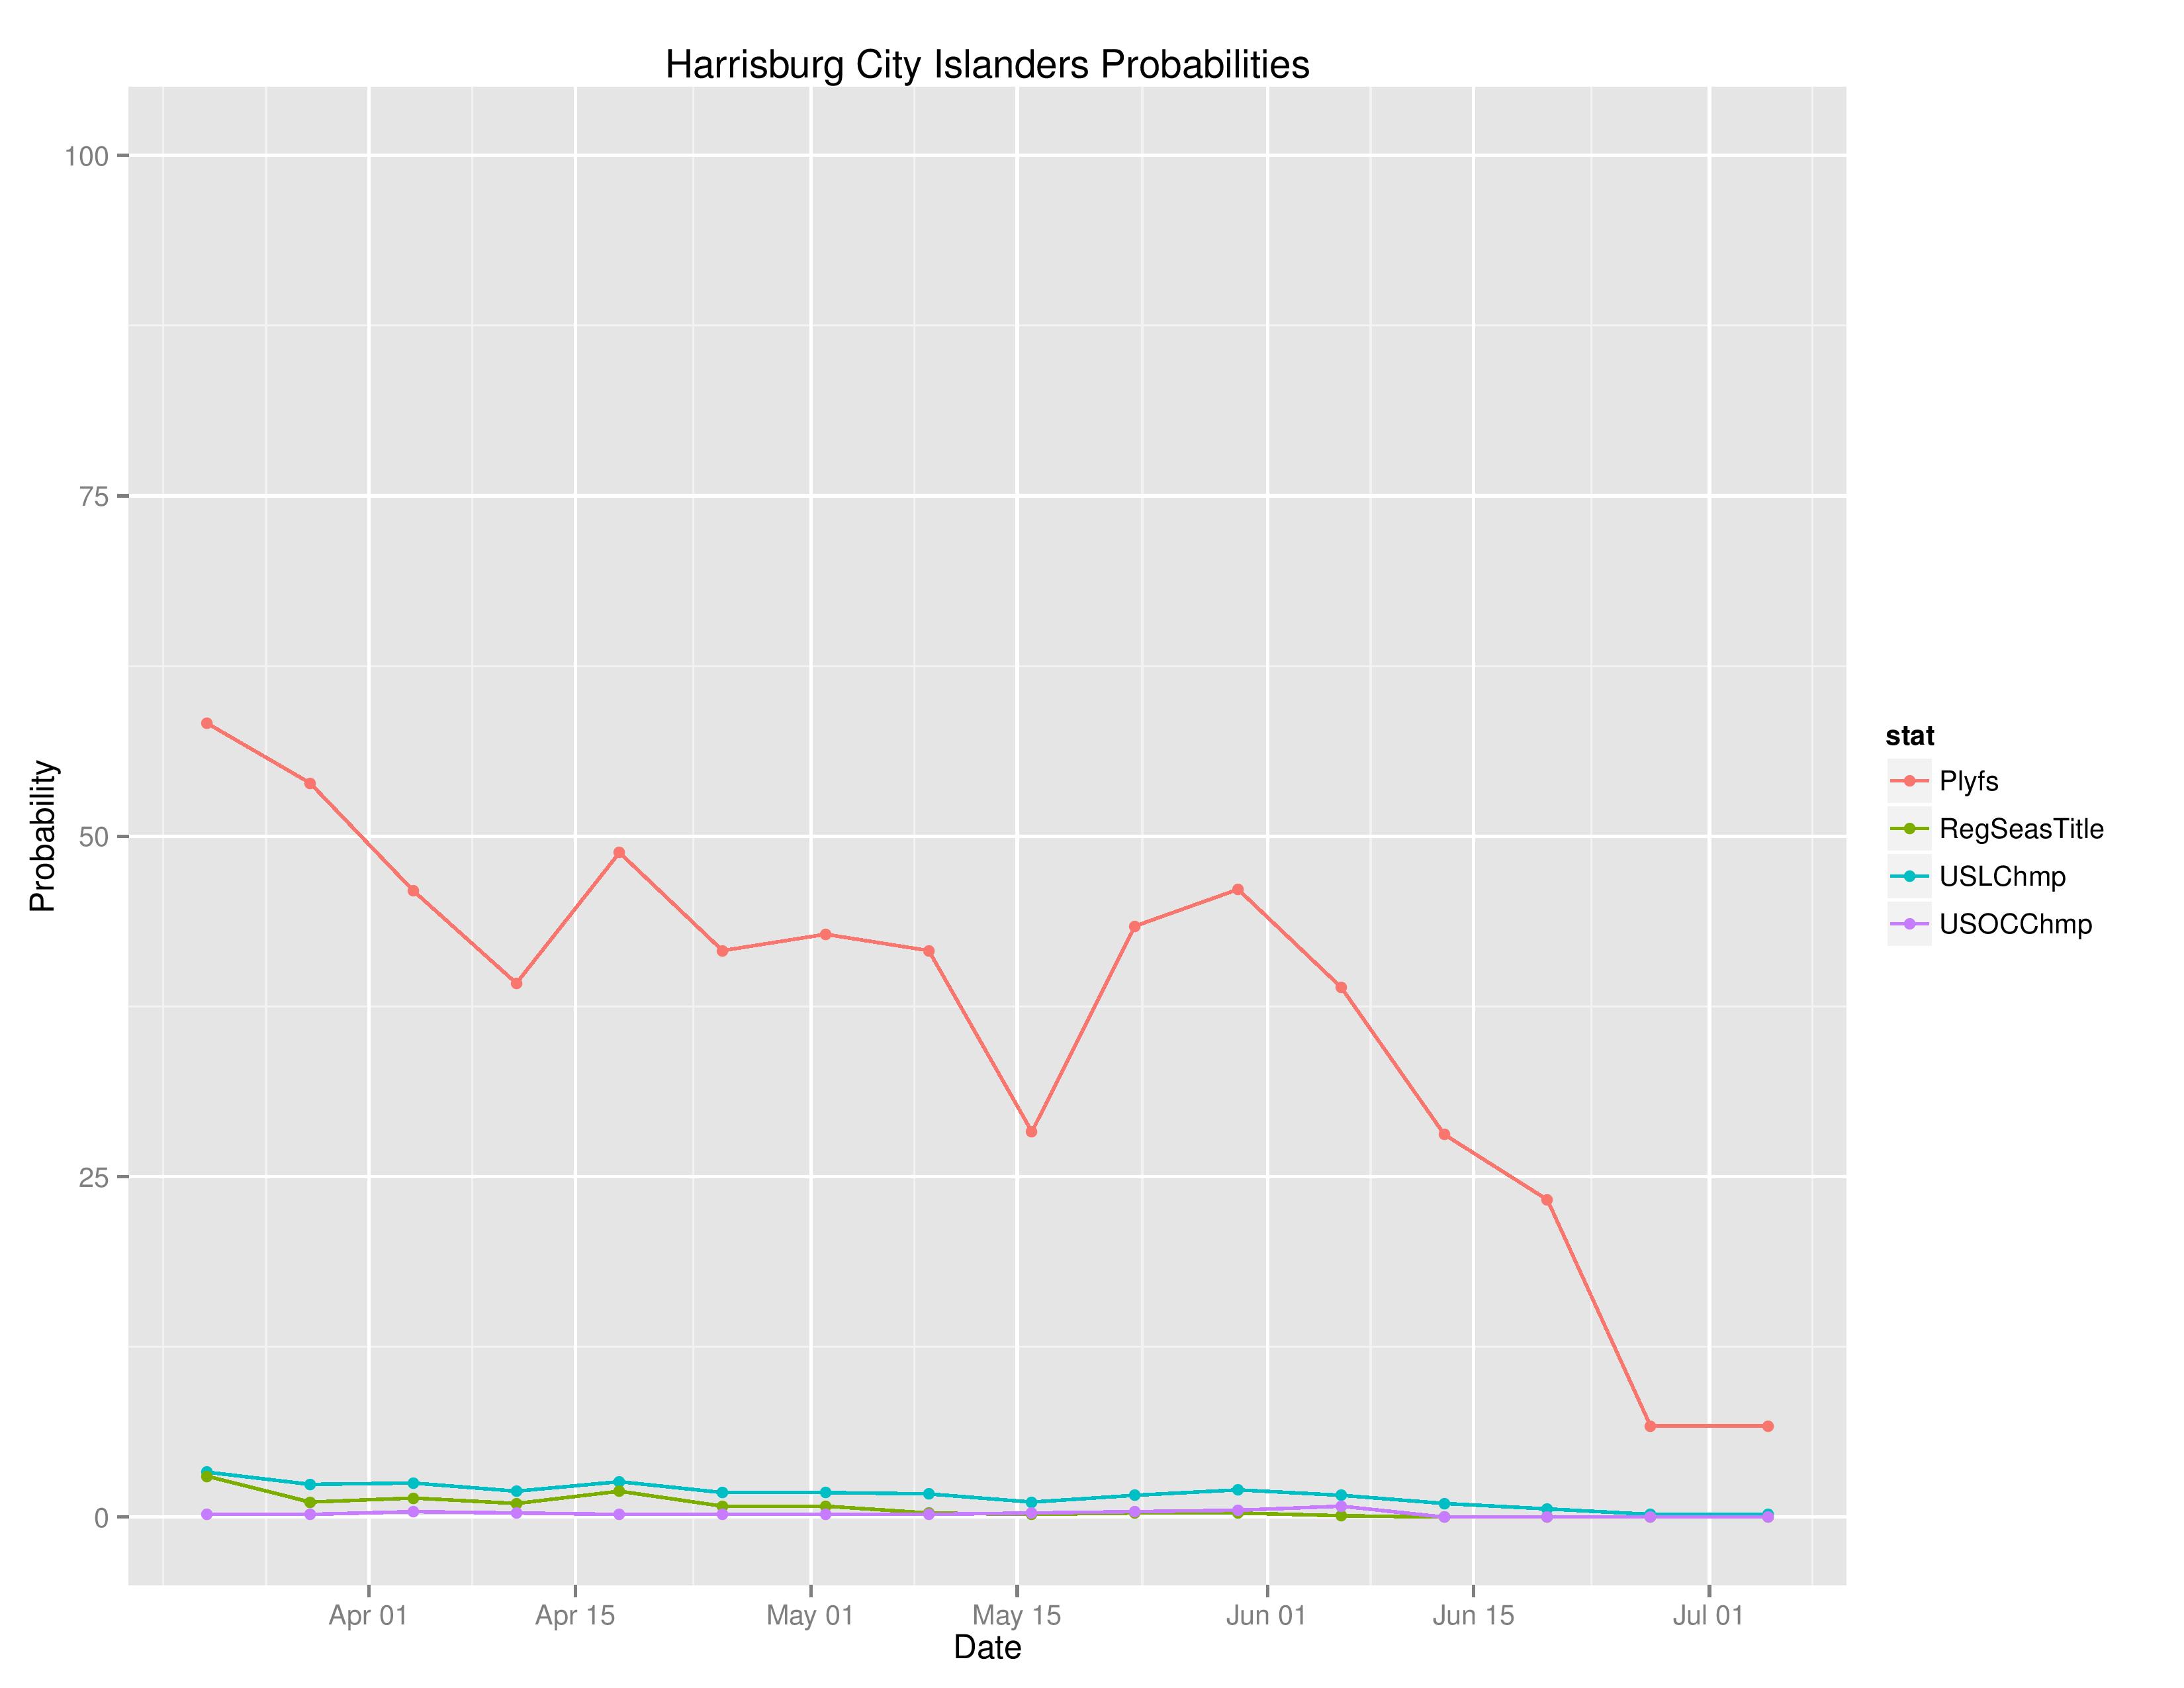
Above shows the probabilities of various outcomes for Harrisburg over the course of the season.
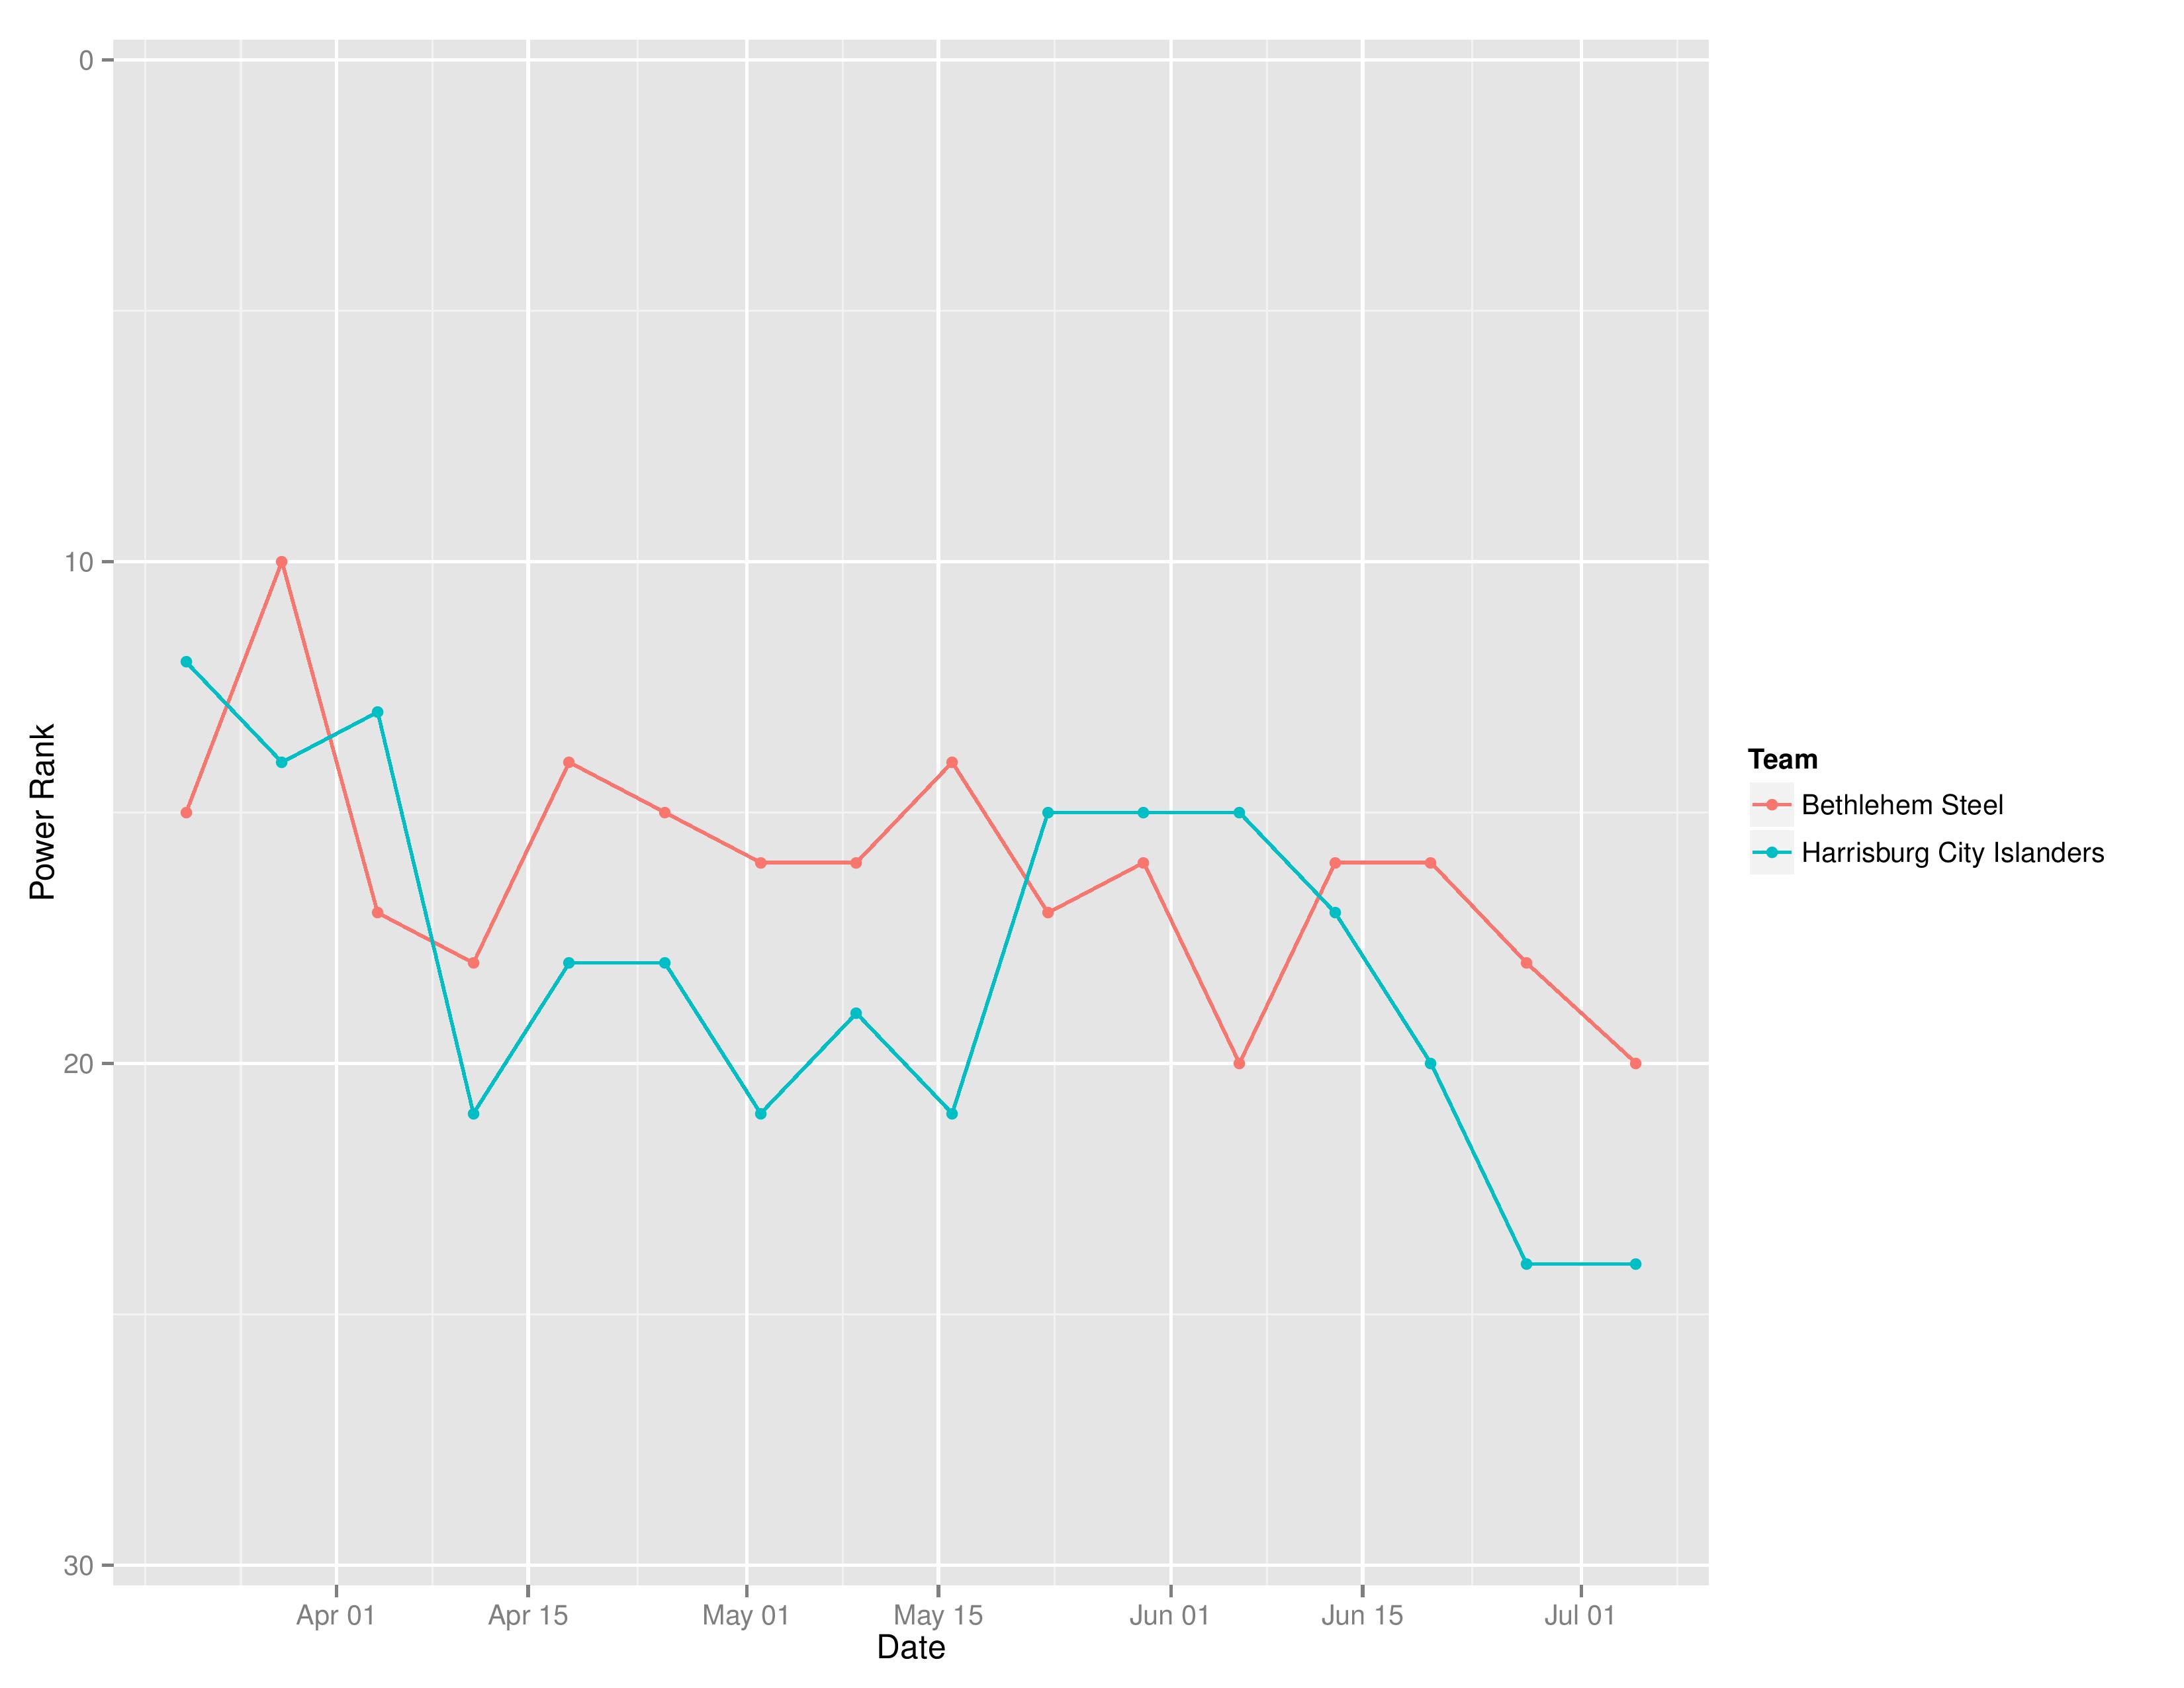
Above shows the evolution of SEBA’s power rankings for Bethlehem Steel FC and the Harrisburg City Islanders.
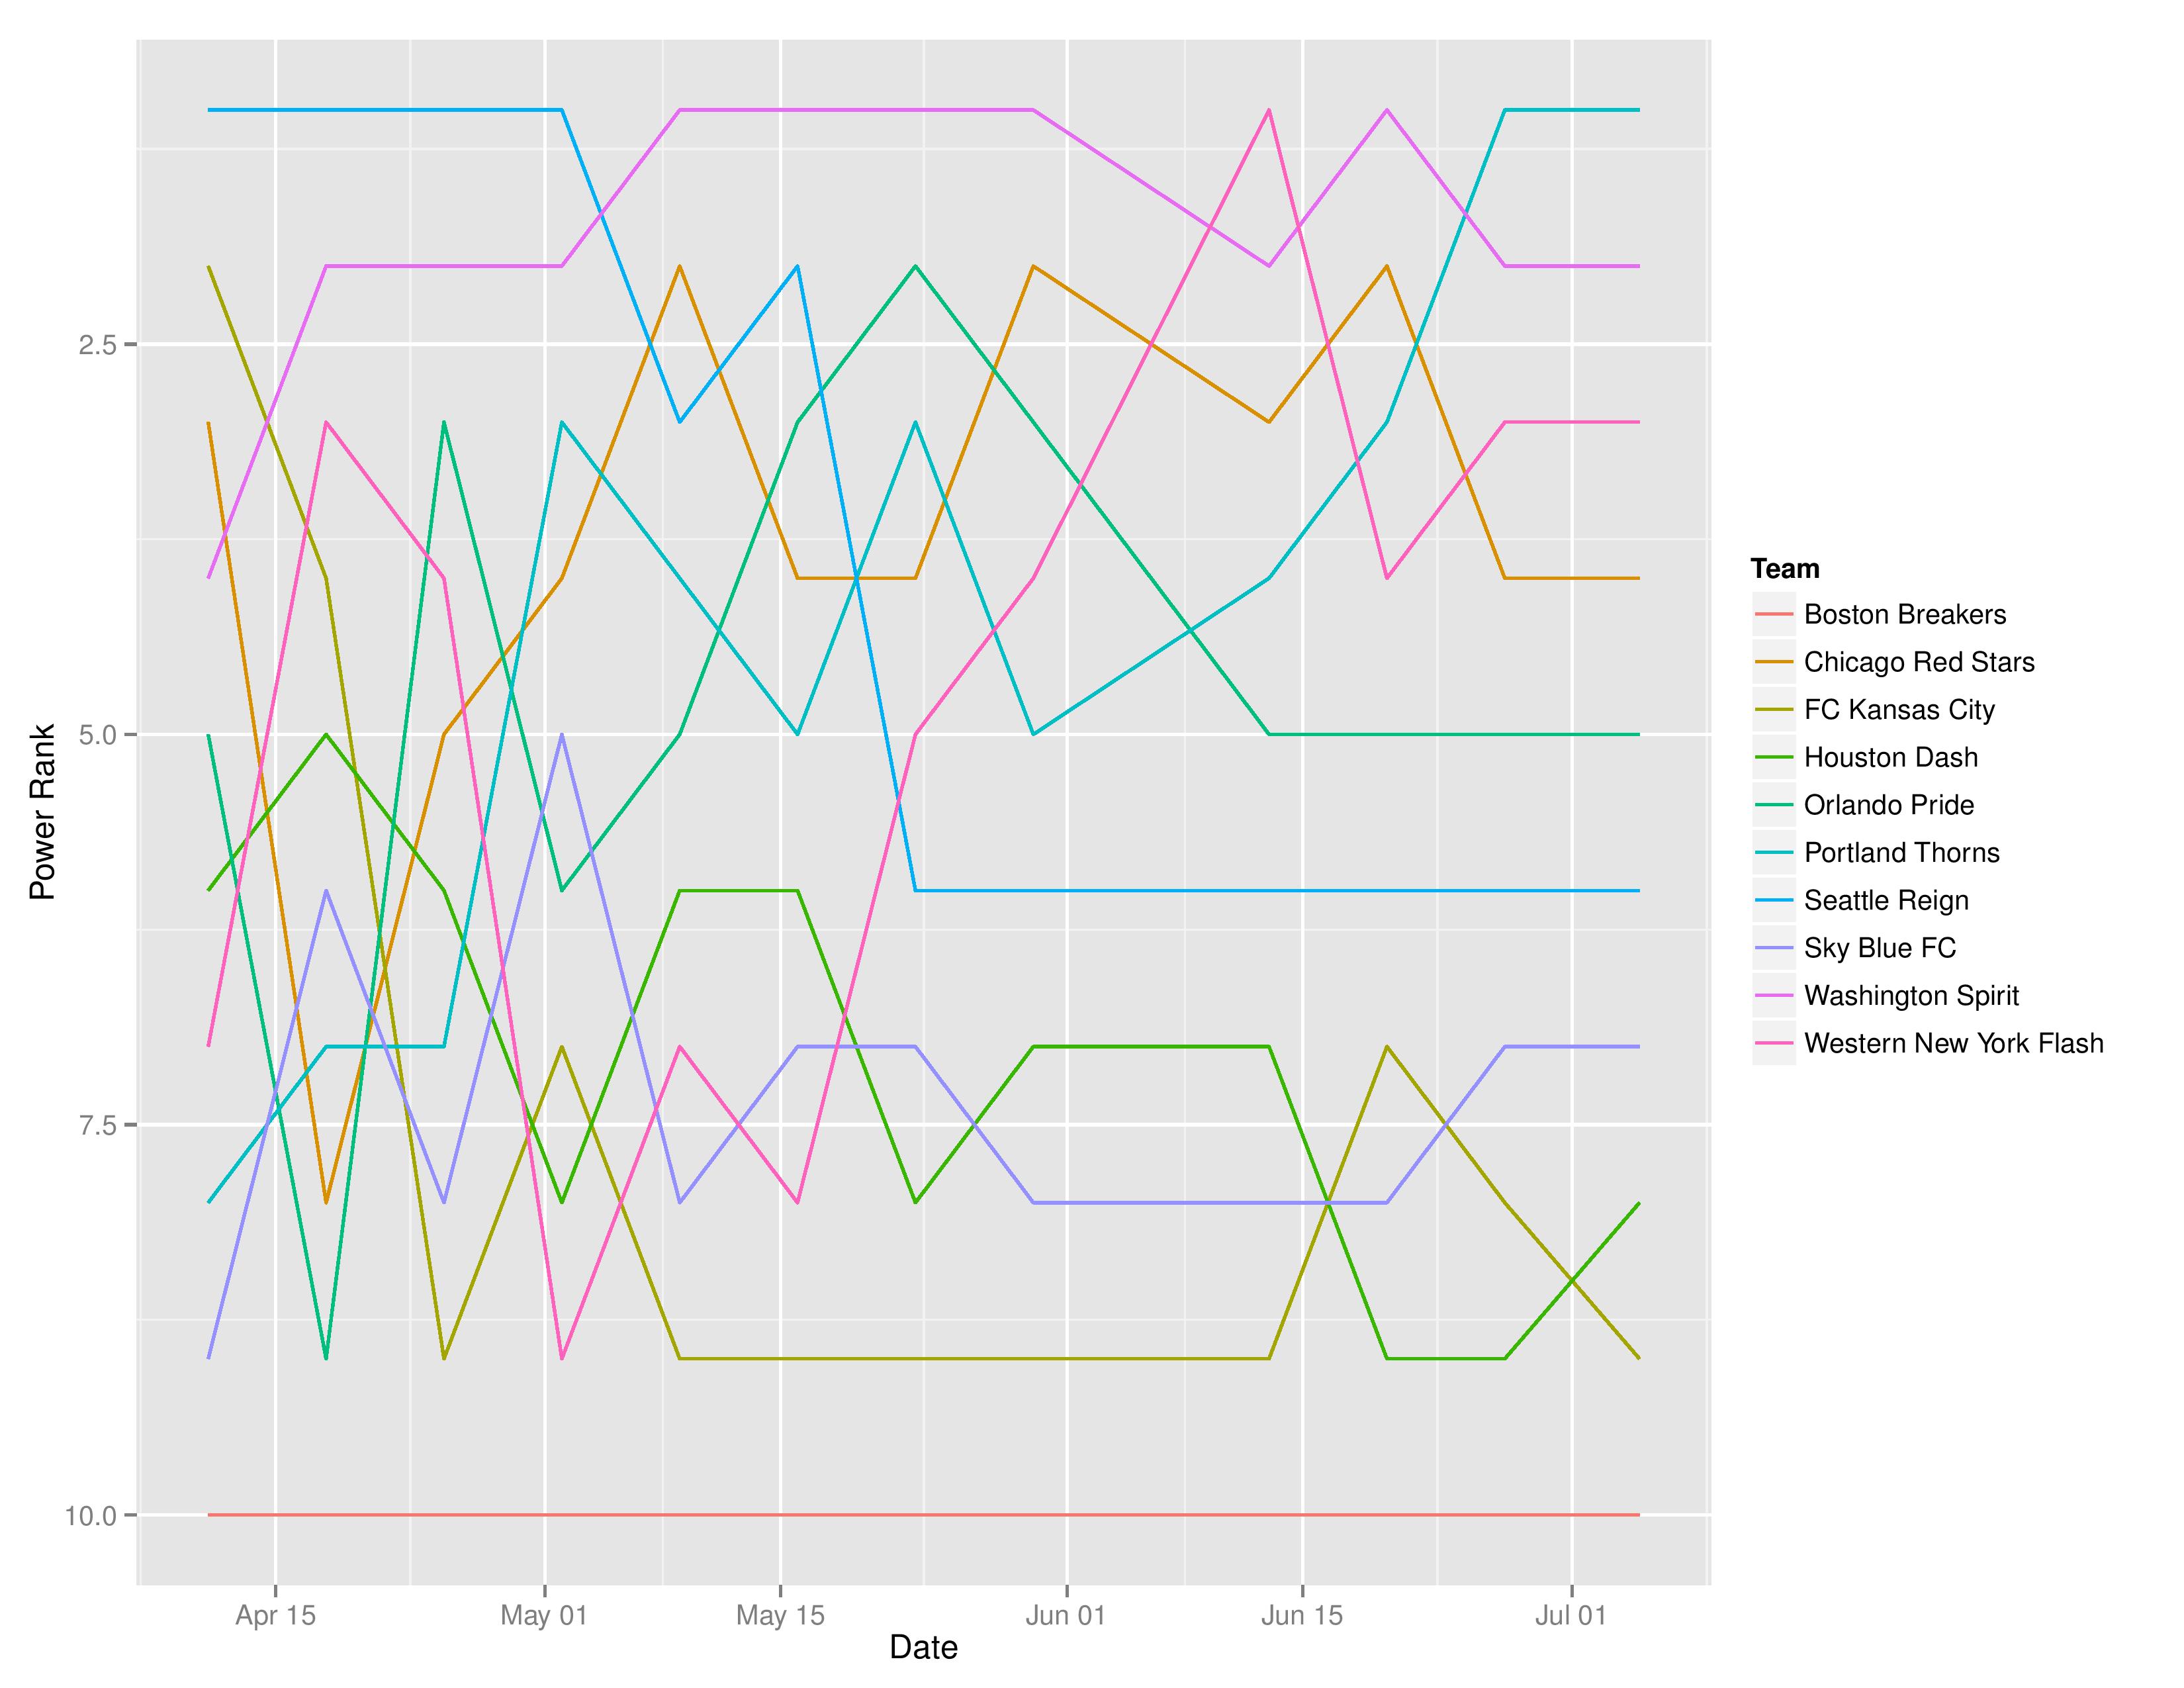
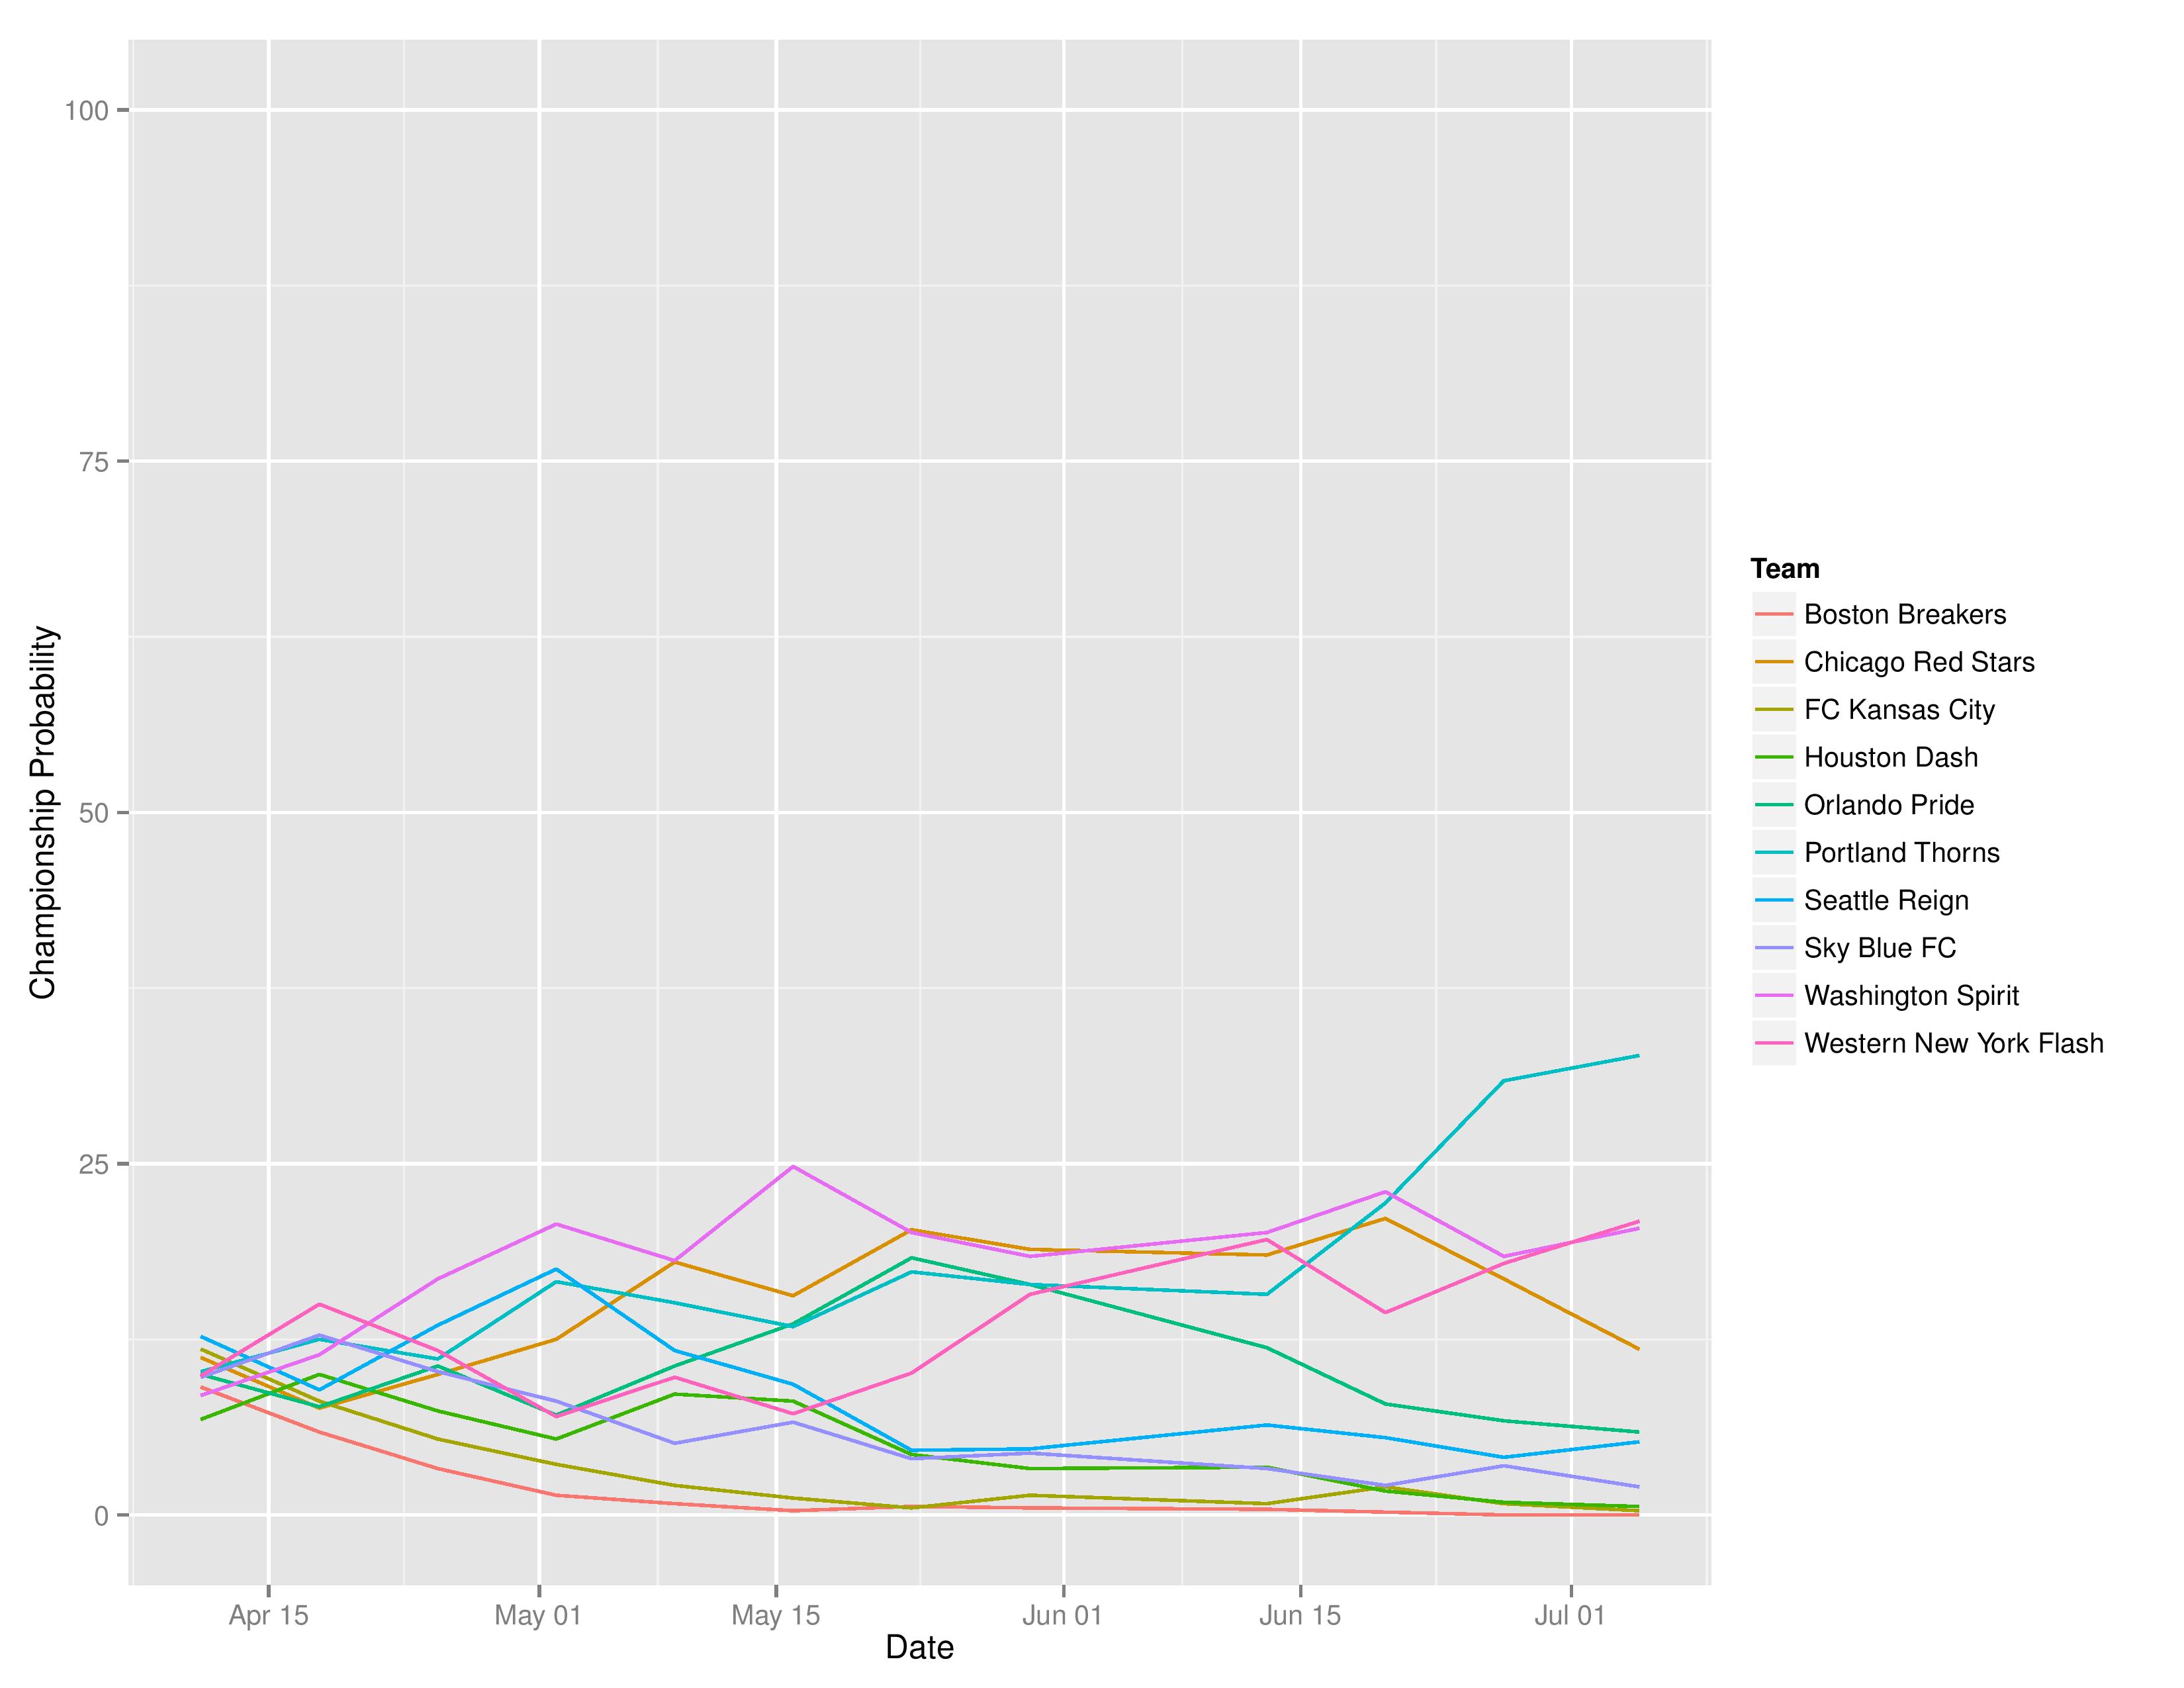
NWSL Projections
The following tables are the average simulation results produced by SEBA.

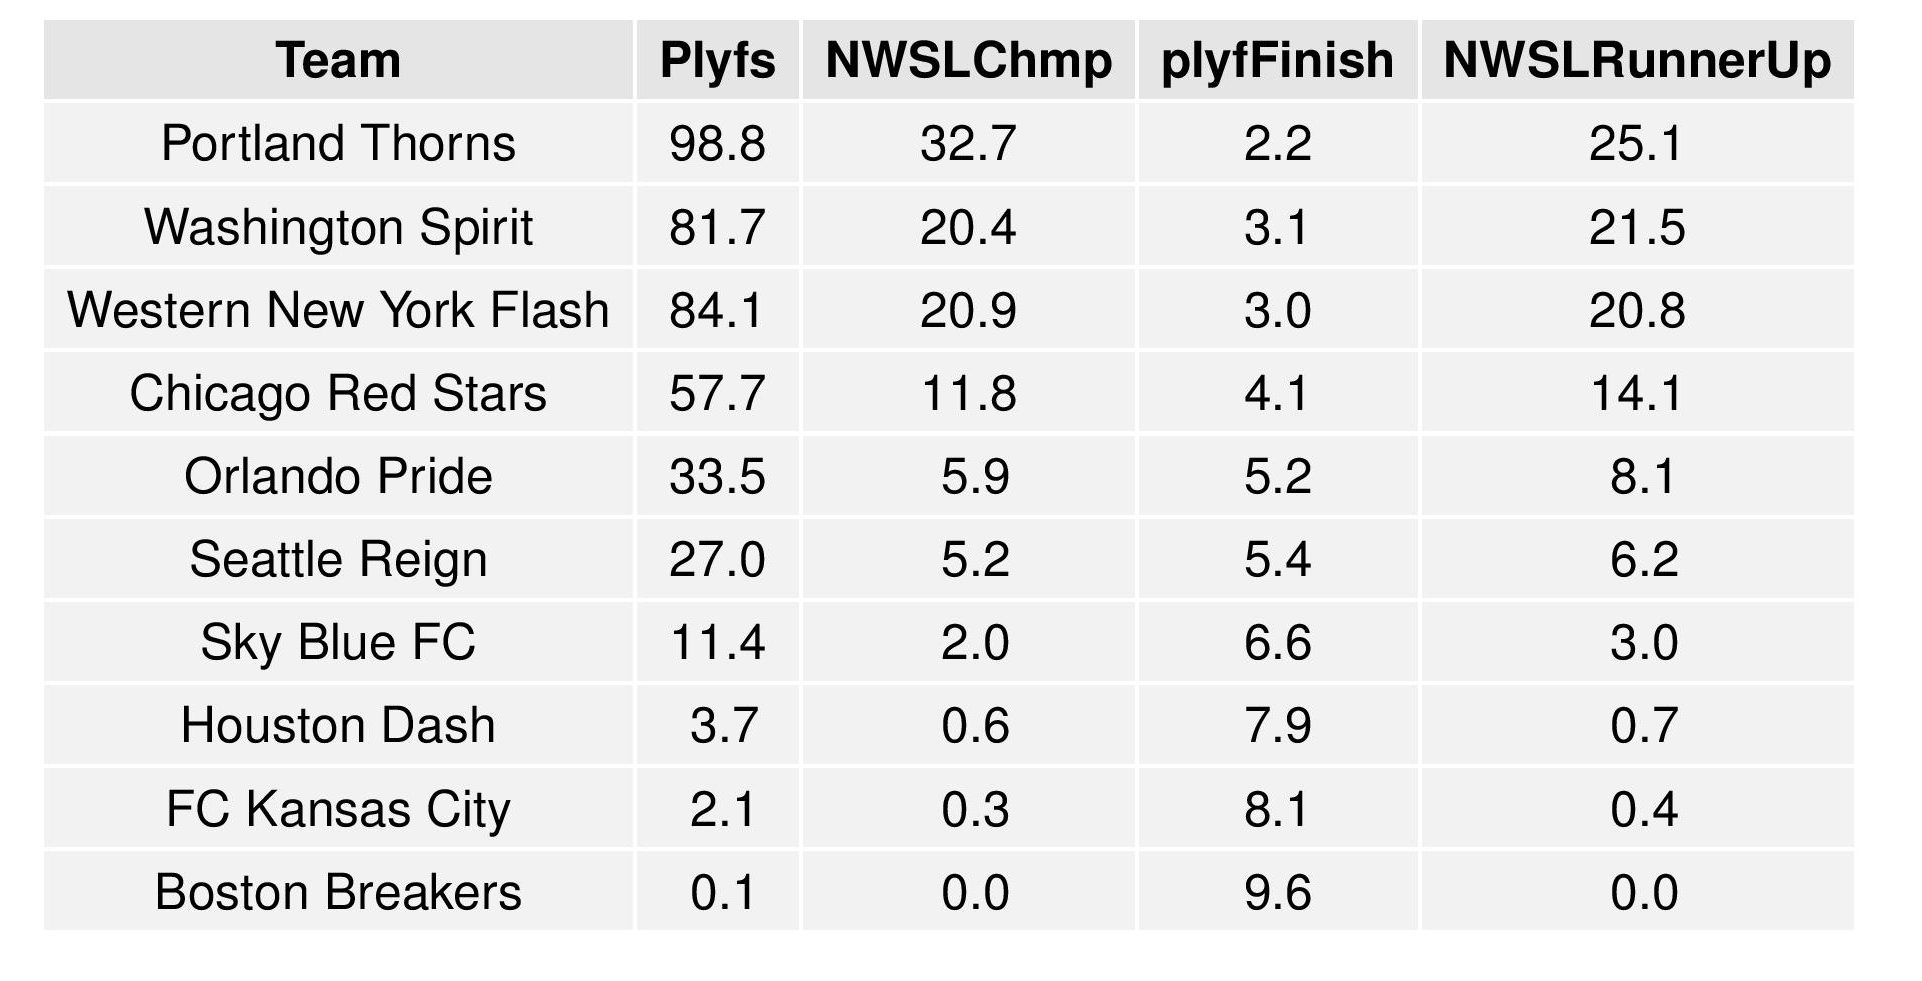


A couple of things jump out at me. Philadelphia is ahead of both NYCFC and Montreal in most categories despite both teams having a higher PPG than Philly.
.
The Union have a higher point expectation against NYRB in a week and a half than against DC United Saturday despite NYRB being way ahead of DC in the power rankings.
So NYCFC is easier to explain (also recall that SEBA was not aware of their win yesterday). For starters, NYCFC had 10 away games left and only 6 home games. Additionally, SEBA only ranks NYCFC as the 12th best team. While they’ve accumulated points, their home record shows a lot of missed points (27%-27%-45% compared to MLS’ 52%-17%-31%) including a 7-0 loss and plus a home-loss to NASL-side NY Cosmos. While they’ve won a majority of their road games, these have largely (exception Portland) come from weaker opponents (Chicago, DC, Seattle) which causes the model to expect those wins to be more luck-based.
–
Montreal’s lesser odds than Philadelphia are all about rank. Montreal is ranked as the 9th best team while Philadelphia is ranked as 4th. Montreal and Philadelphia’s away performances, in all competitions, is fairly similar (with an edge to Montreal), but Philadelphia’s Home performance is definitely superior. Additionally, as Montreal has played fewer matches, there is greater uncertainty in the points outcome which will cause forecasts to take a more ‘average’ expectation rather than knowing the Philadelphia has done well.
—
As for the NYRB vs. DC point expectation, that NYRB have only two draws on the season while DC is closer to average. This is why the NYRB match has a lower ‘T’ probability. Ties often offer less points than a team, especially a home team, could expect on average if only W/L were permitted (1 point for Tie, 1.5 points for W/L if equal chances of occurring). This is why we expect more points while hosting the better team (only for this type of example). If you look further down the table, you’ll see that when the Union visit both NYRB and DC, in those matches we expect more points to come from playing DC United (1.02 vs. 1.00 when Ties are likelier to benefit the Union.
Thanks for the explanations, Chris. This is something I look forward to every week (although I liked it better a few weeks ago when the Union were more likely to win MLS Cup than to miss the playoffs!)