Welcome to the International version of the Statistical Extrapolation Bayesian Analyzer Projection System, which is, of course, a tortured gathering of words used to create the SEBA Projection System.
The system consists of a model projecting the probabilities of game results and then a barrage of simulations which account for the remaining luck. So the probabilities you see below show, essentially, what the odds are of an outcome if the team continues to play like it has been.
Below are the current Copa America tournament forecasts using data from games through June 22, 2016.
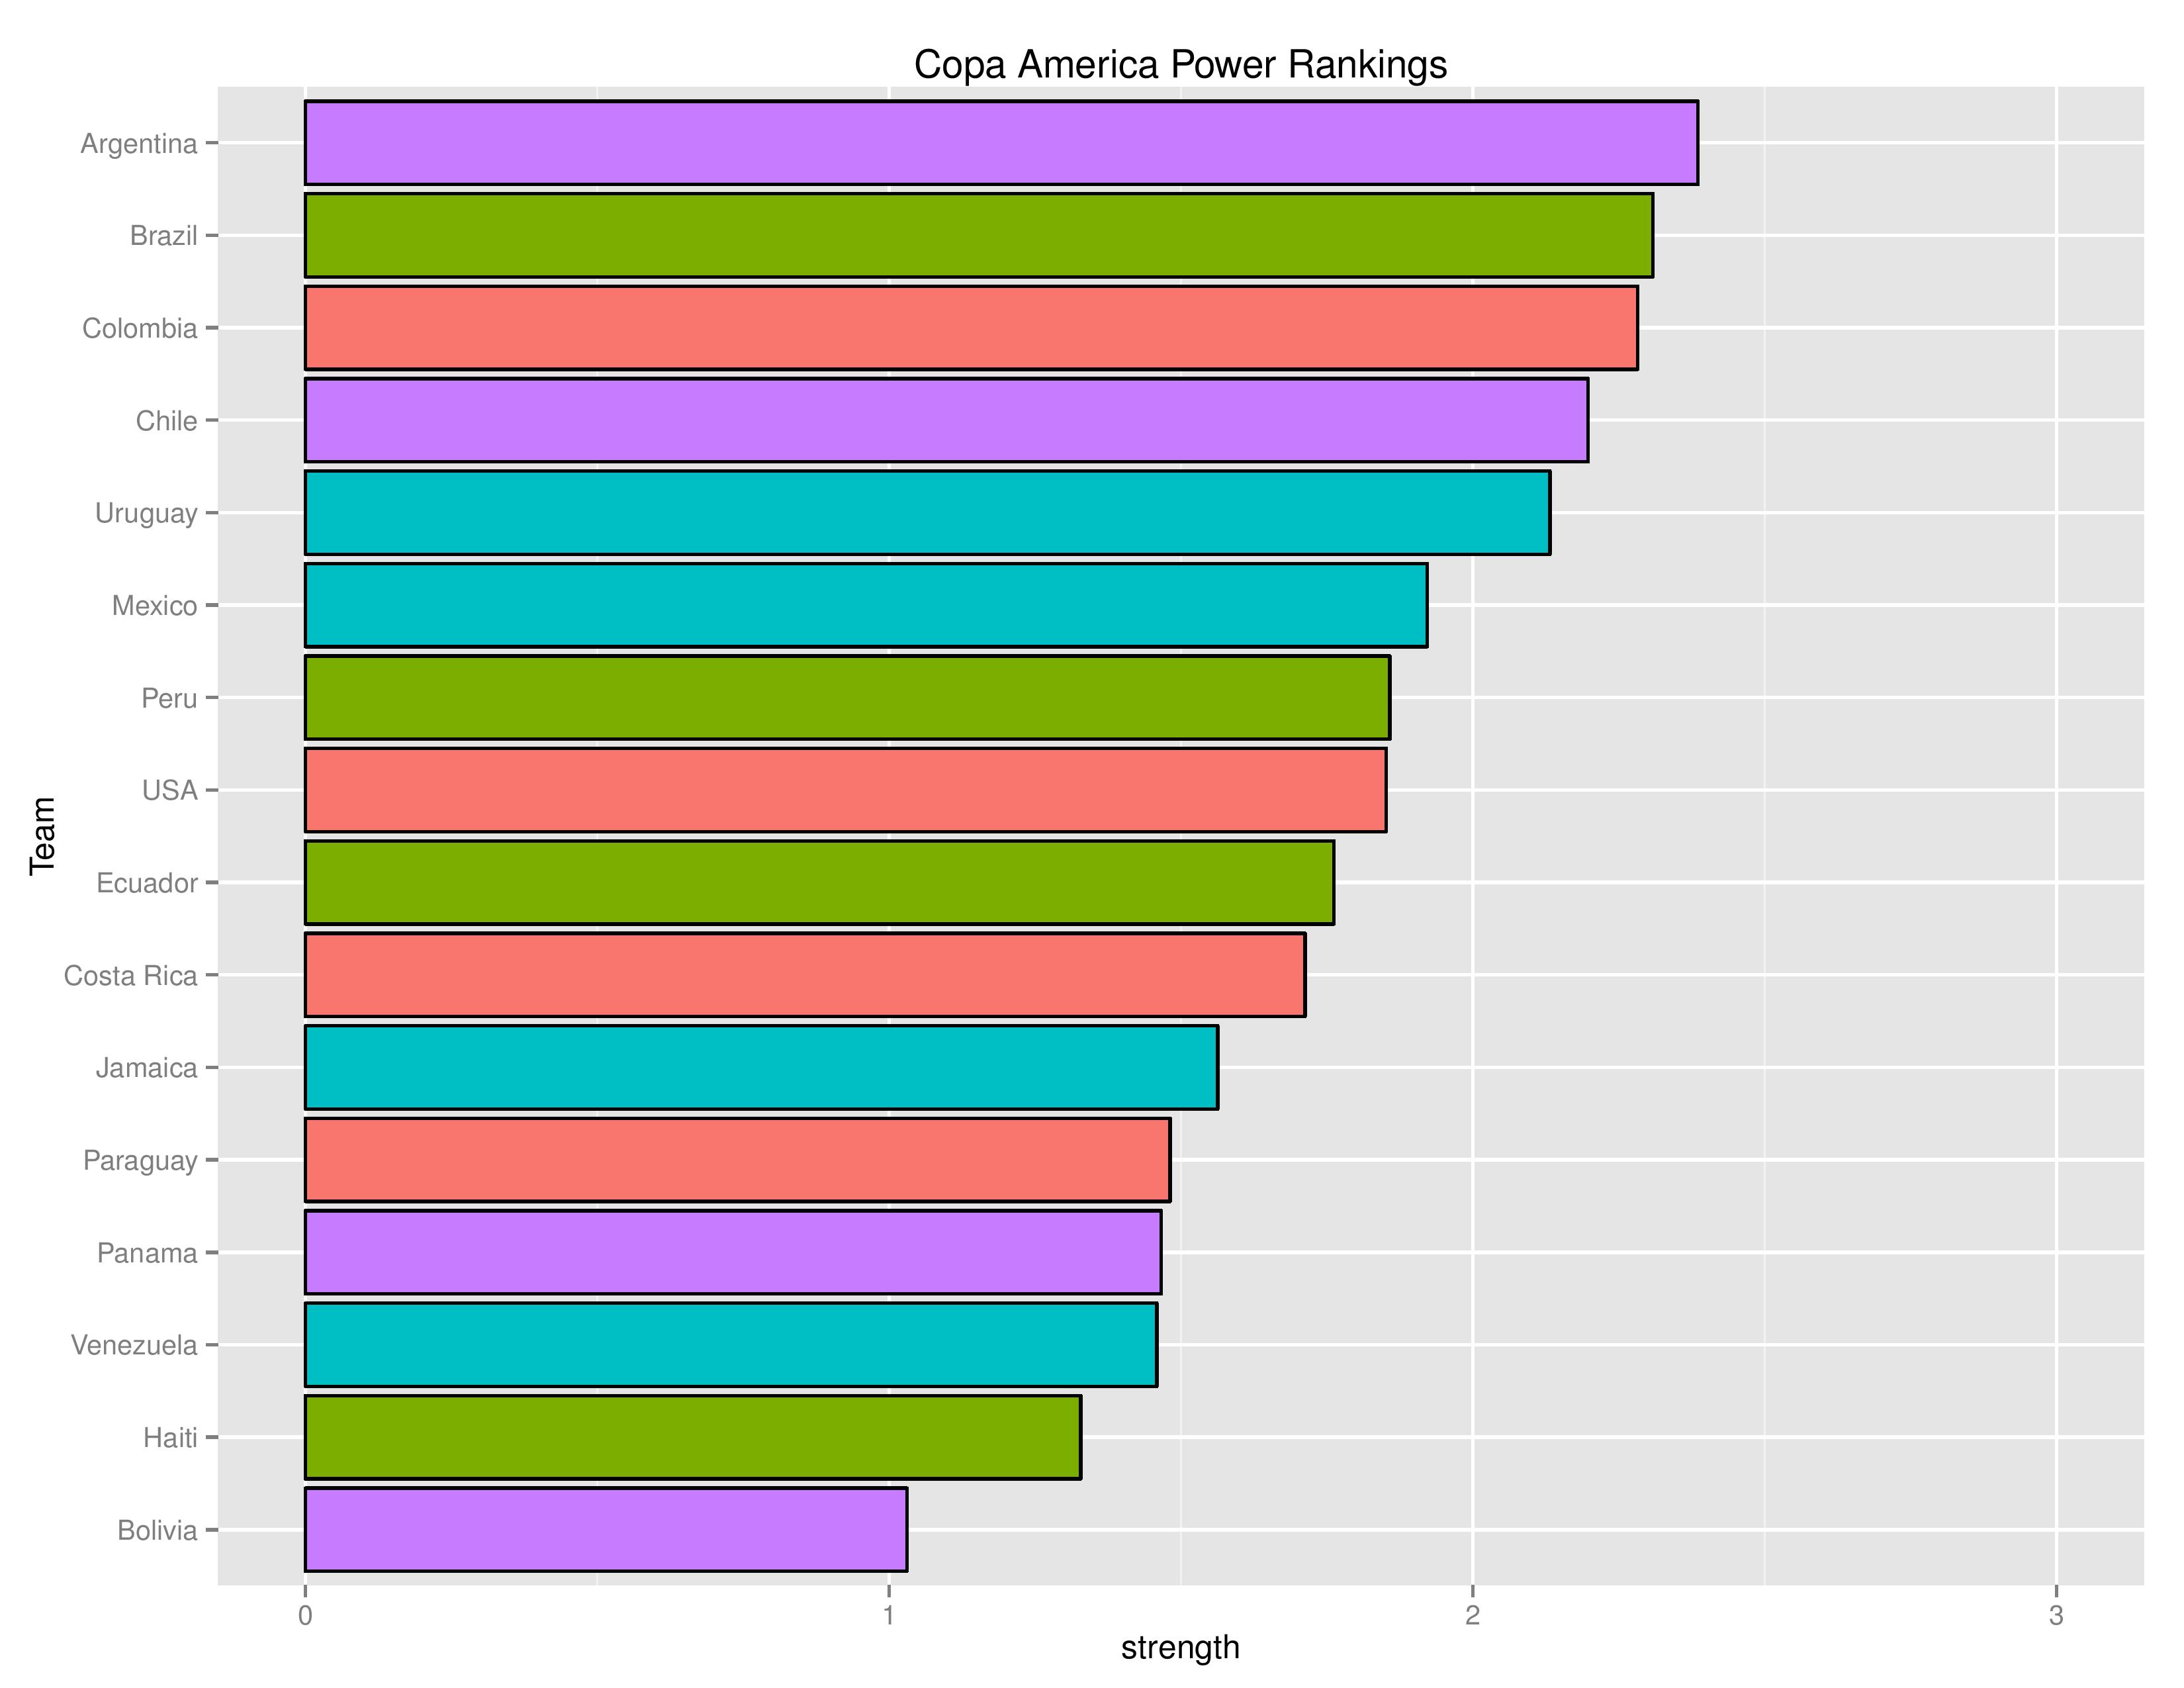
Power Rankings
The “Power Rankings” we concoct are the actual “strength” of the team according to competitive expectations. The value represented on the X-Axis is the average amount of points we expect that team to receive when playing against every national team in the world in neutral territory:
Probability Outcomes
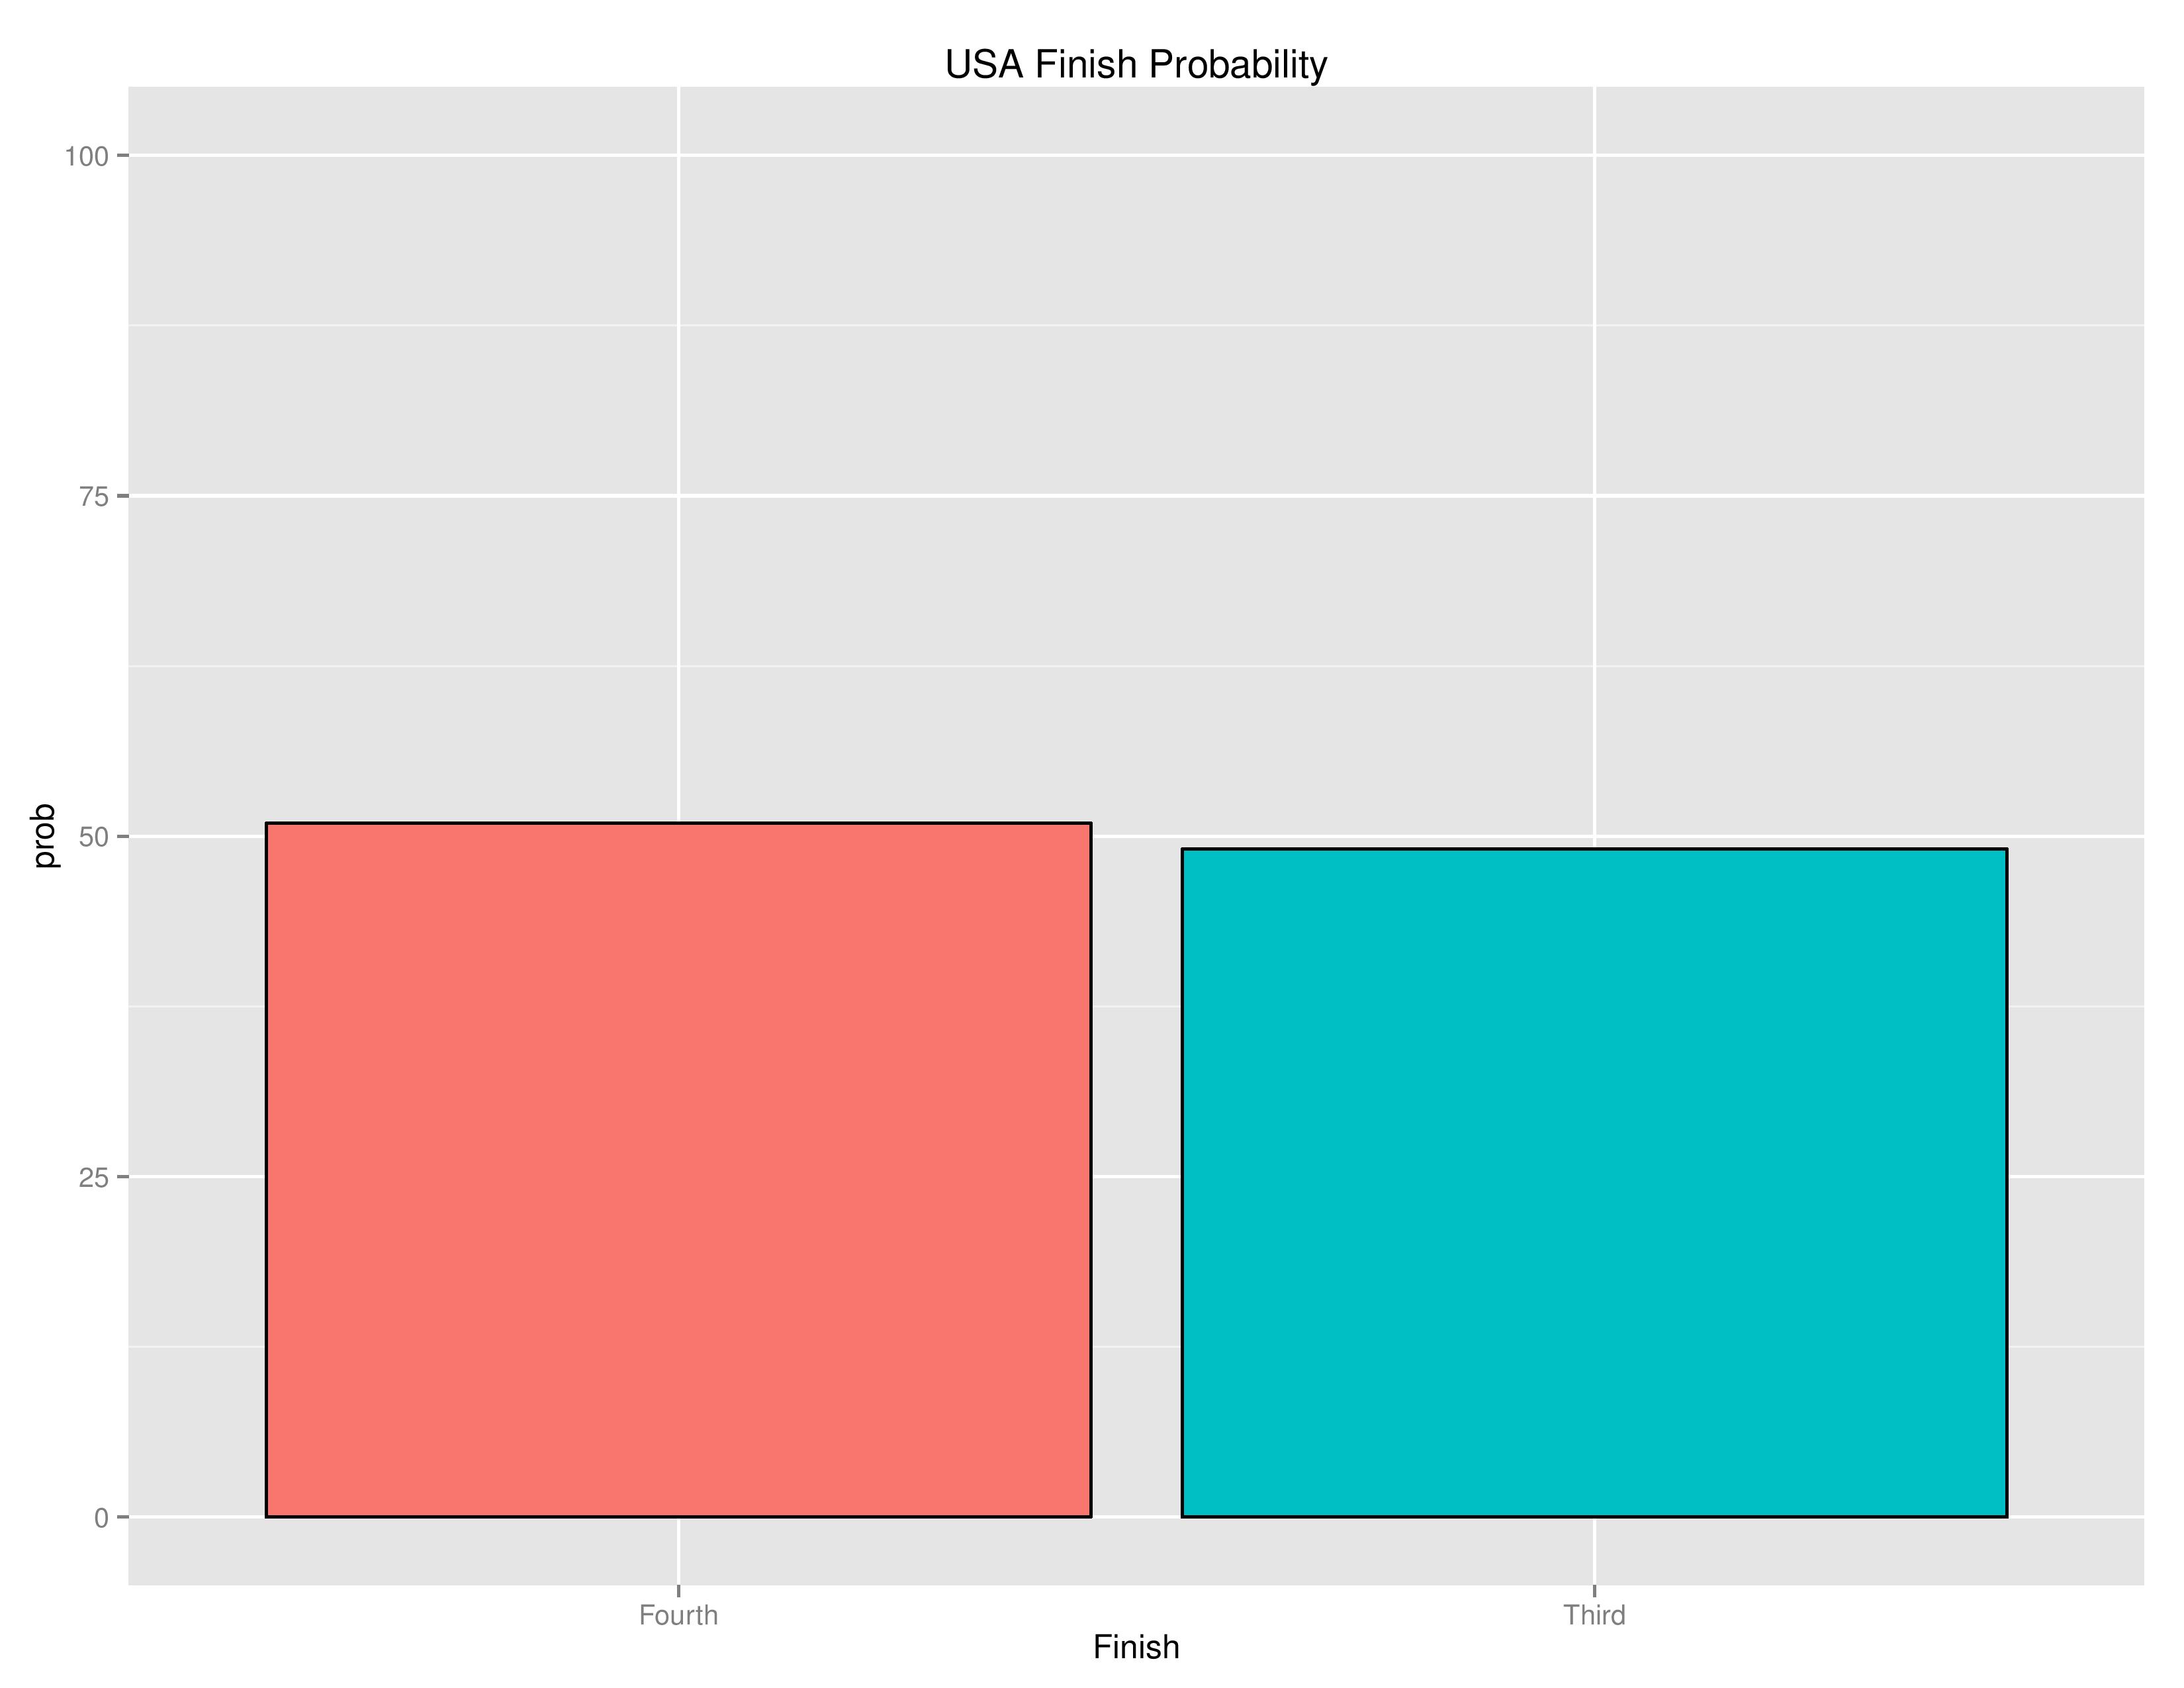
The chart above shows the probabilities of the USA team finishing in the two remaining outcomes.
This is the USMNT’s chances in the 3rd-place match:
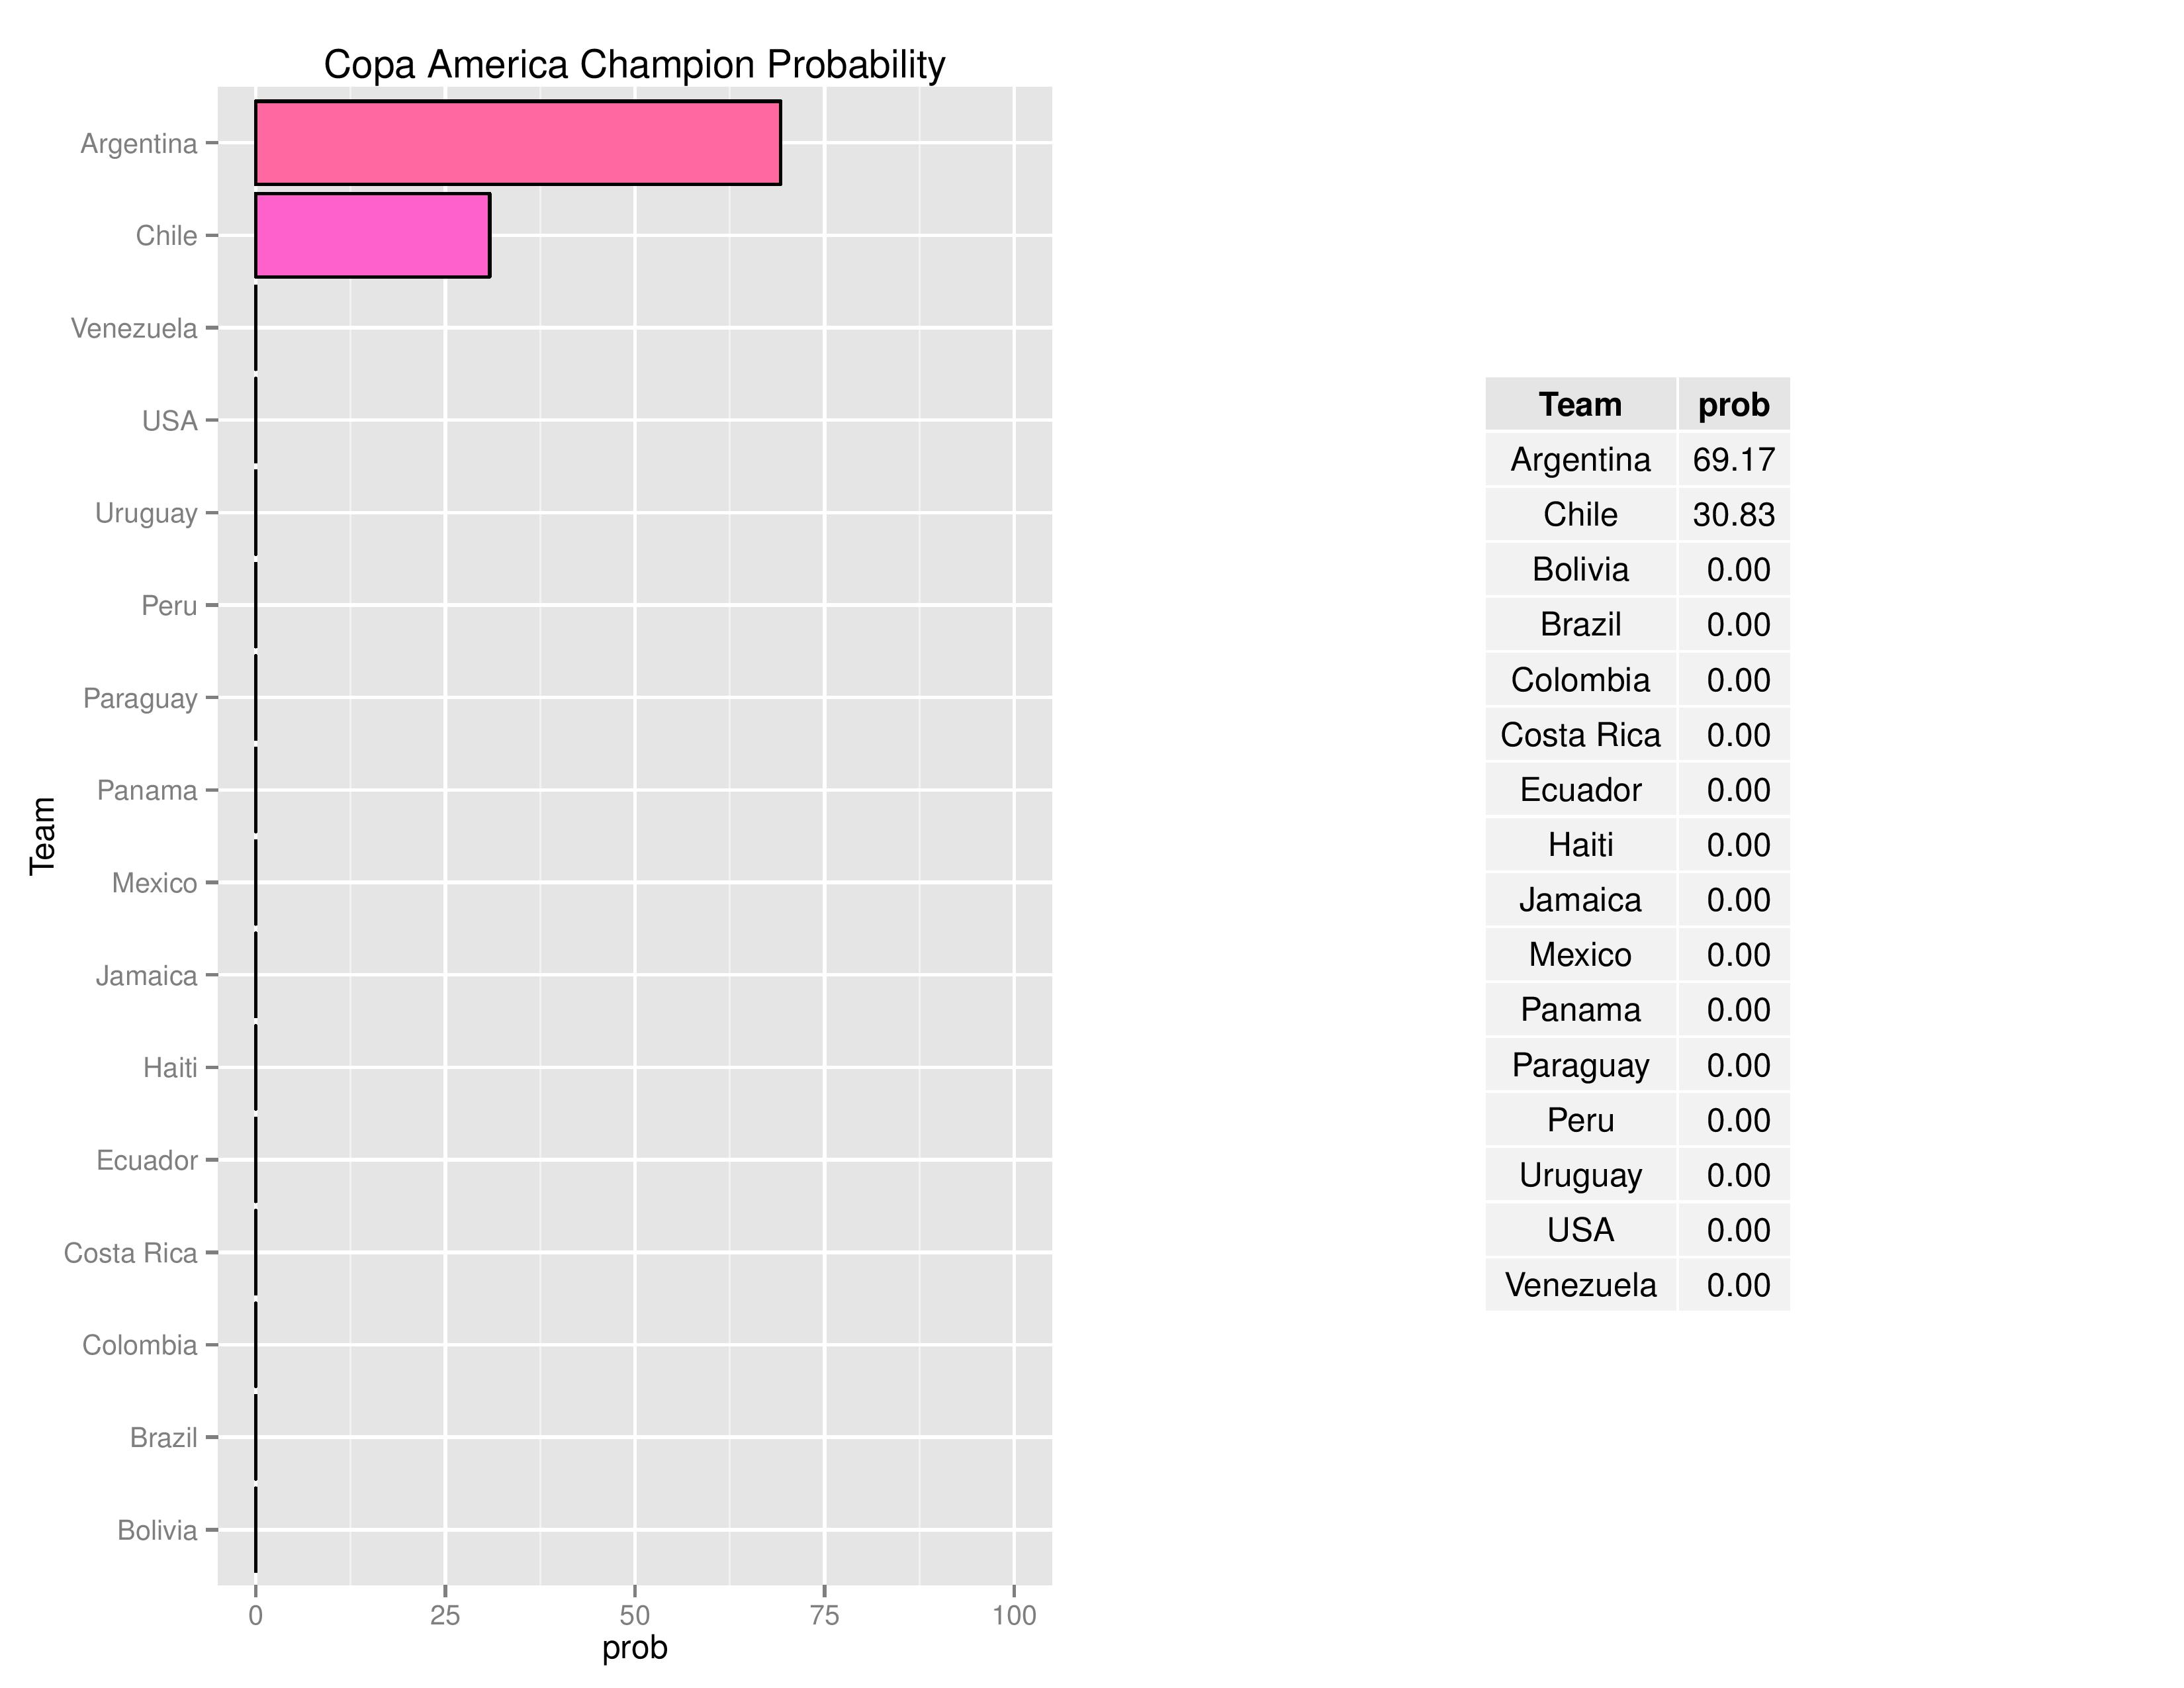
Below shows the probability of the final’s outcomes:

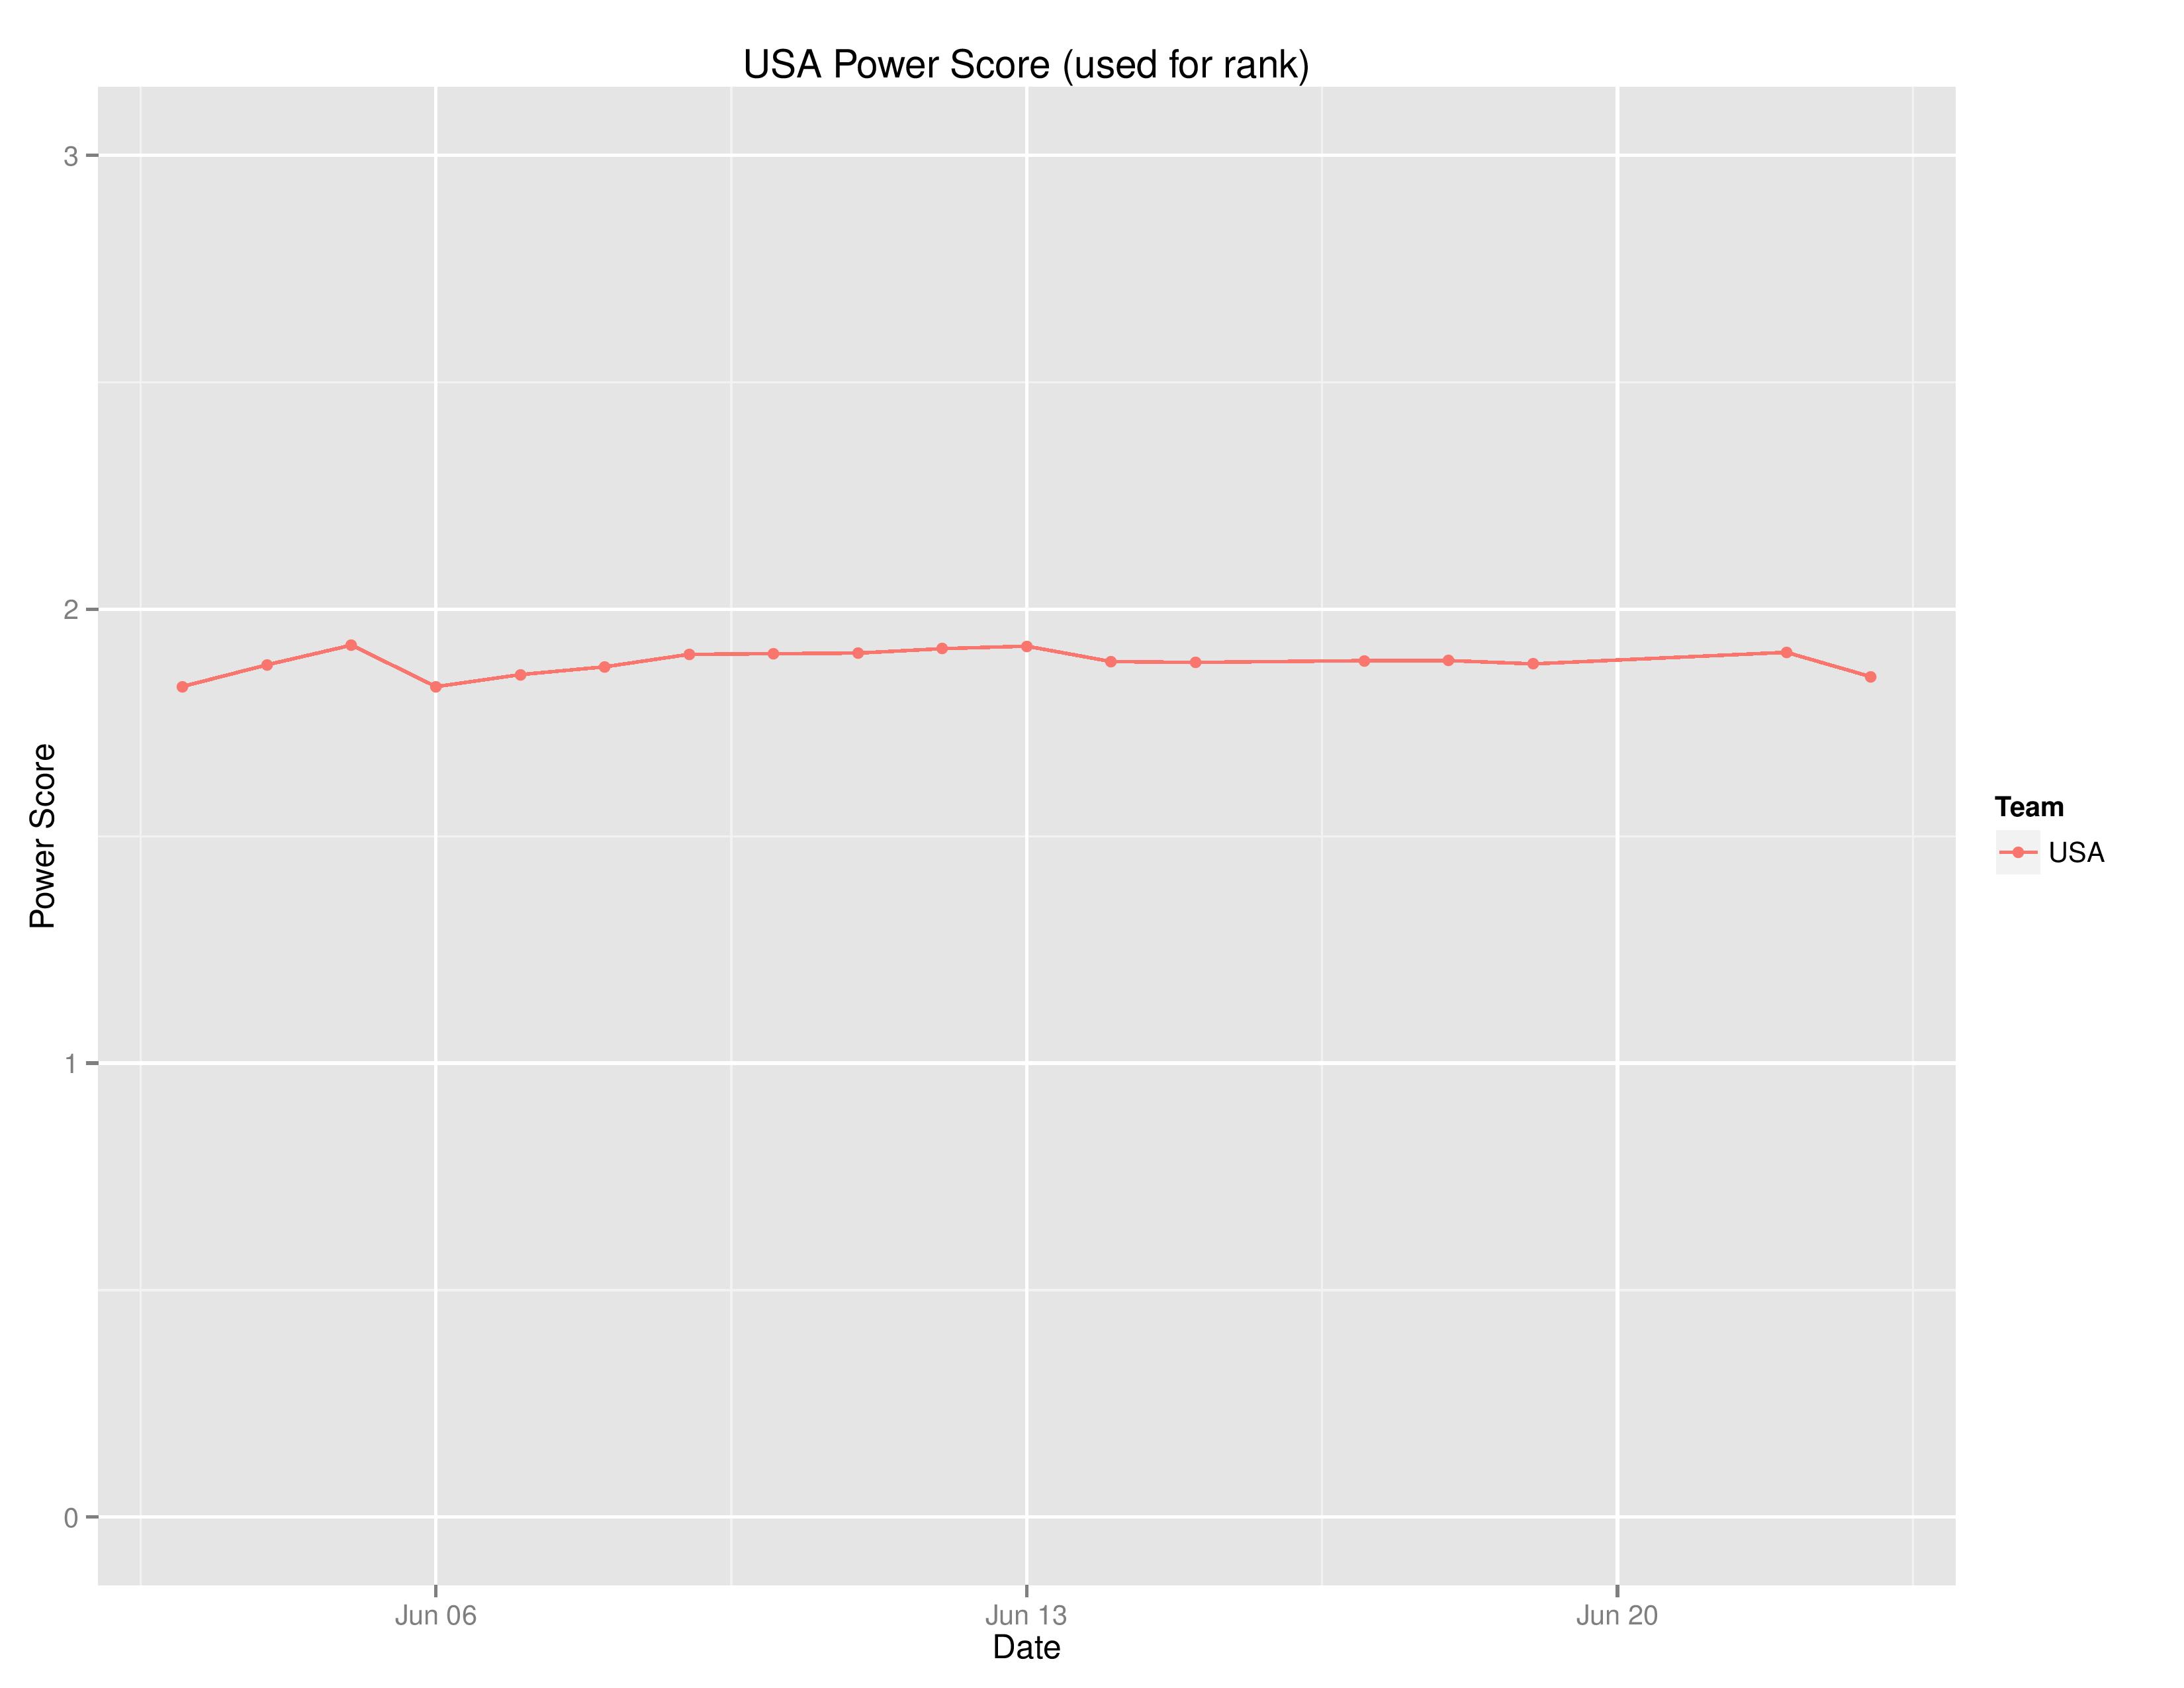
The following shows the USMNT’s power score over the course of the tournament. Again, this is the average of expected points the US could expect to earn playing every national team in the world on neutral territory. Also, I would like to point out that these scores are also affected by matches around the world, not merely the Copa America.
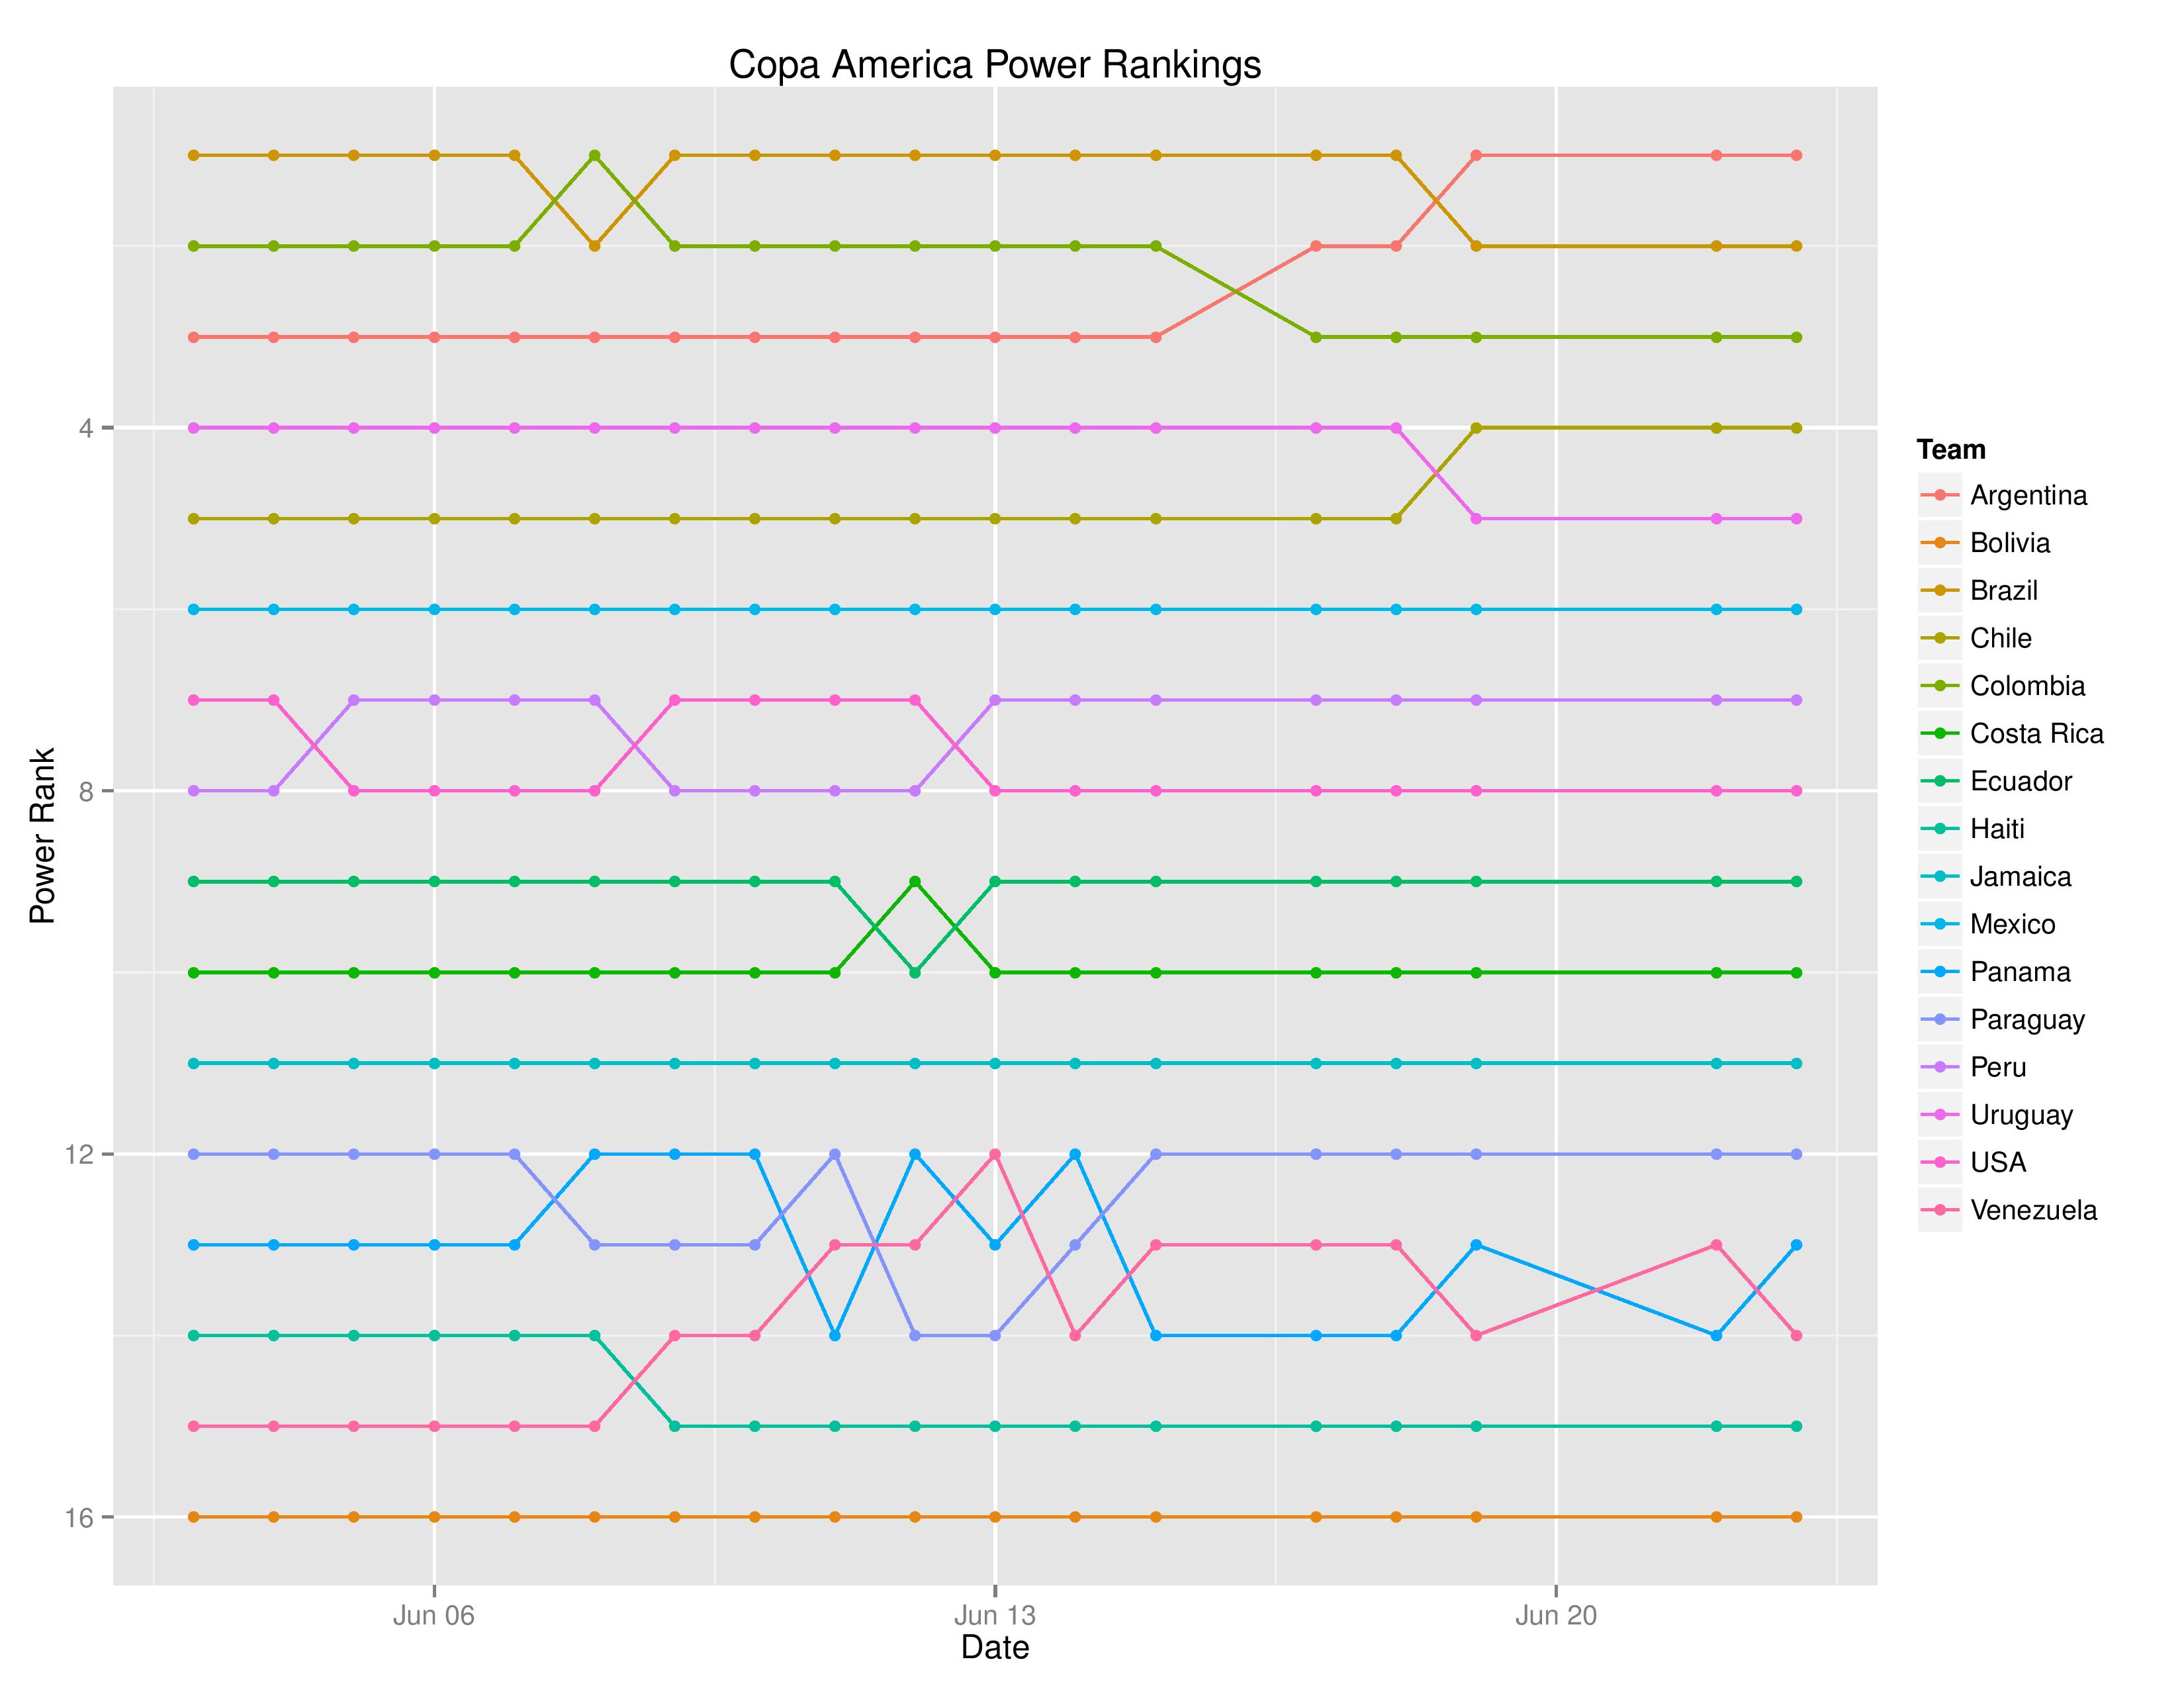
Below shows the changes in Copa America’s Power Ranking over the course of the tournament:
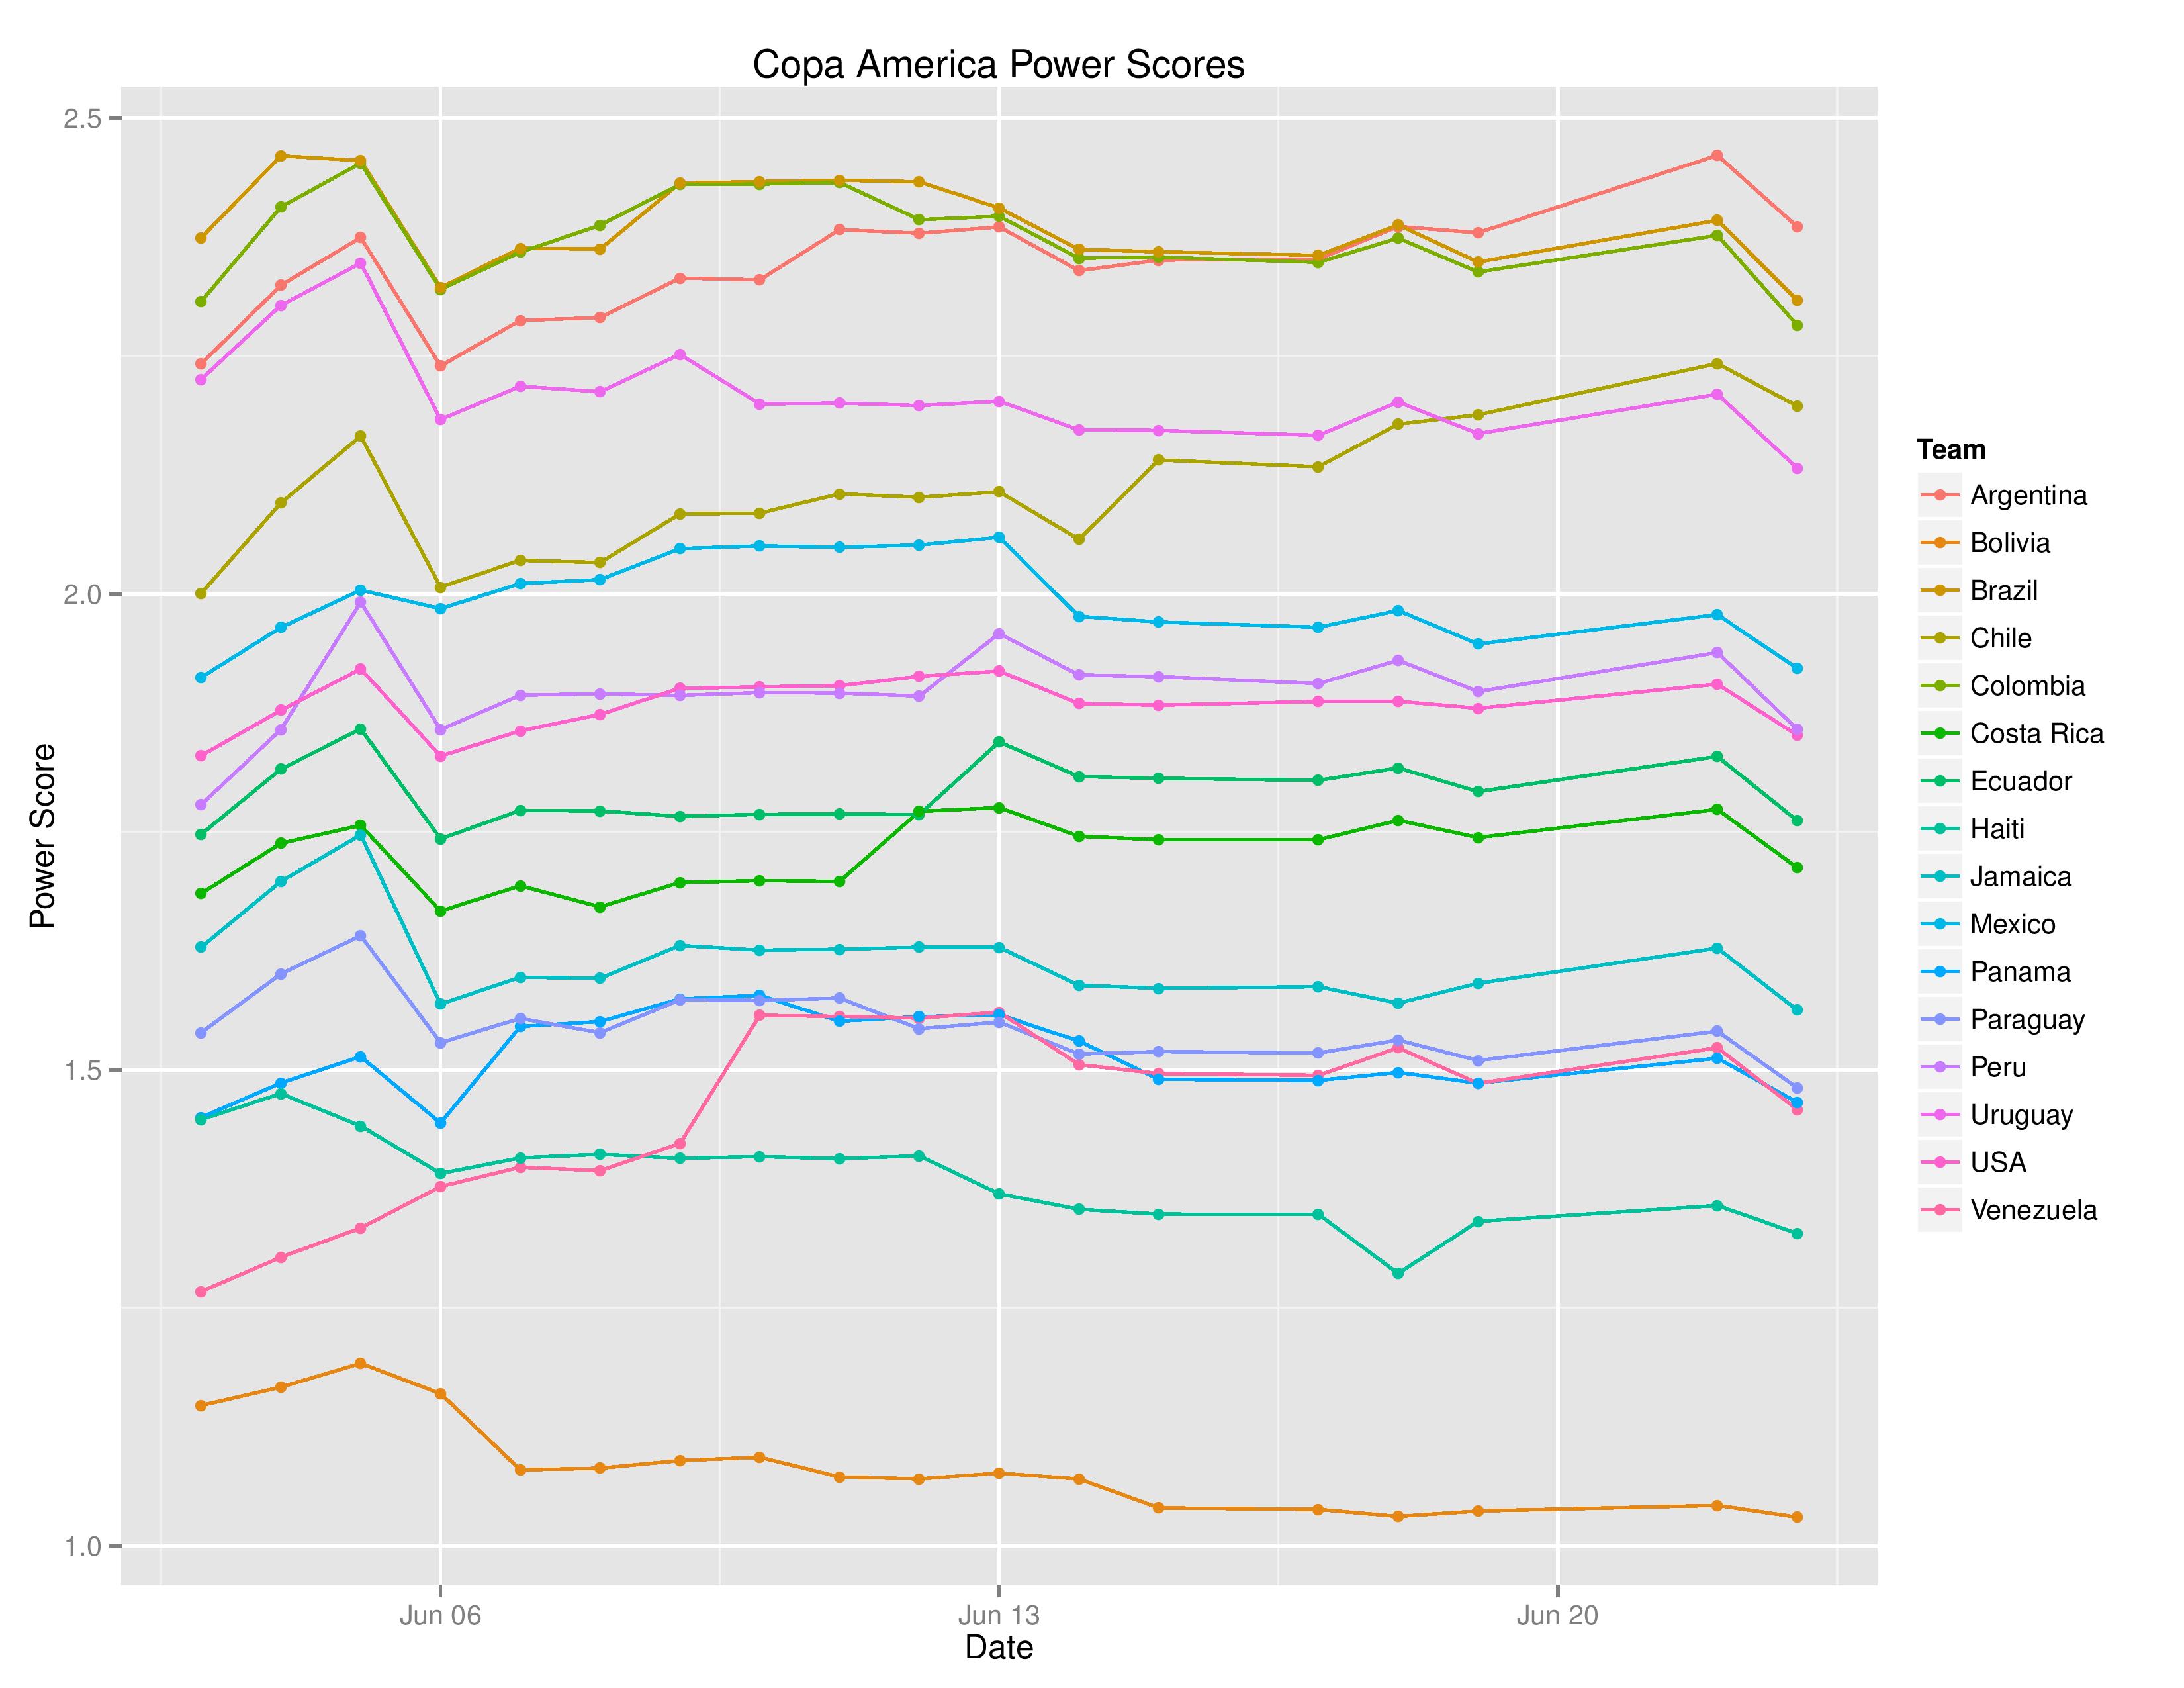
Below shows the evolution of the Power Scores which lead to the Rankings above. Brazil, Colombia, and Argentina have been battling at the top in tier 1. Uruguay started towards the top but took a hit in this tournament (Brazil might have taken a bigger hit, but their results weren’t too bad if they had happened outside a major tournament) while Chile moved into tier 2. Mexico, Peru, and USA make up the third tier (USA’s successes have partially been attributed to home field advantage in addition to, according to the model, only defeating weaker teams which is why their scores have only slightly increased). Costa Rica and Ecuador compose the 4th tier with Panama, Paraguay, Venezuela, and Jamaica making up the 5th tier (Venezuela began the tournament much lower). Finally, Haiti began in the fifth tier but bombed below to be on its own and Bolivia continues to be much further below.
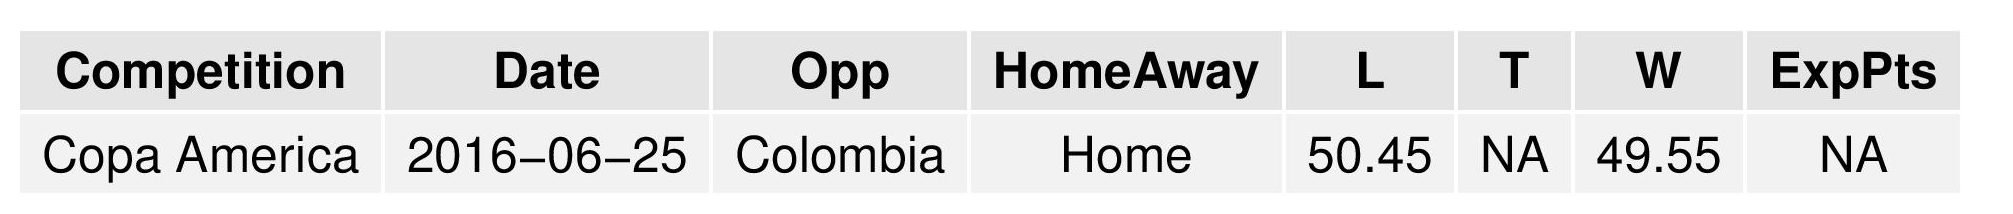
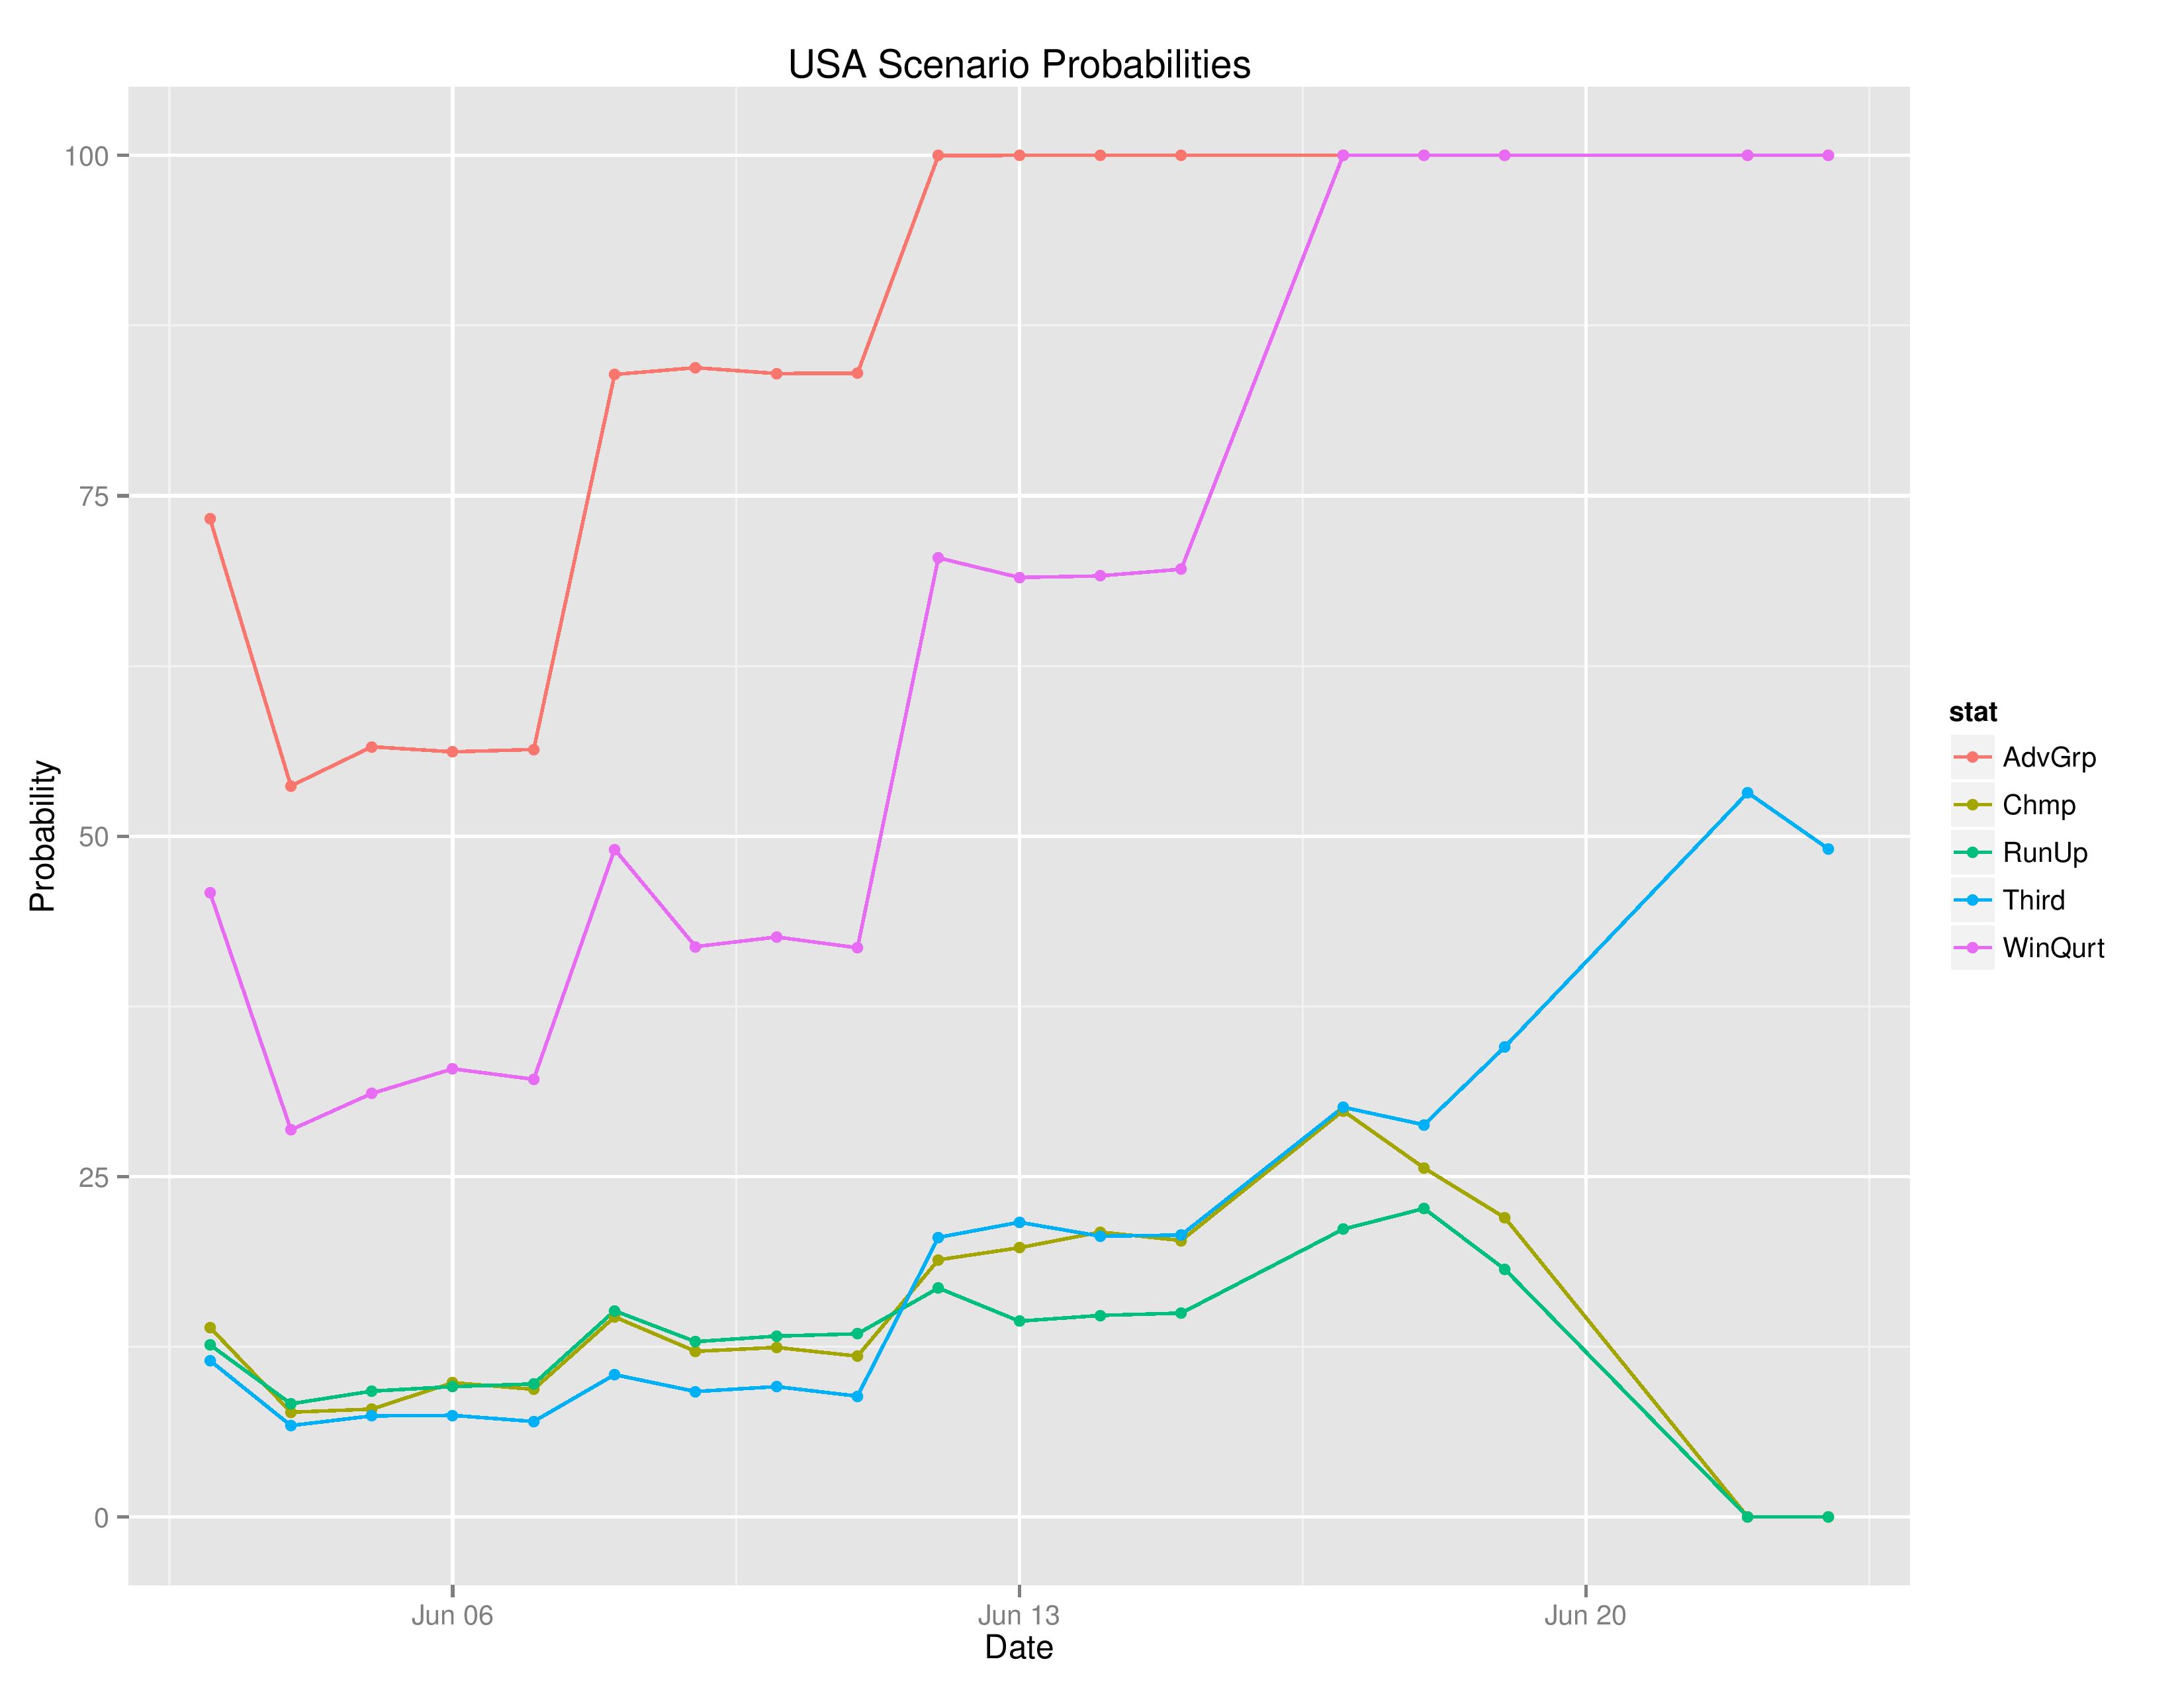
Next we show the USA’s odds of the scenarios through the Copa America:
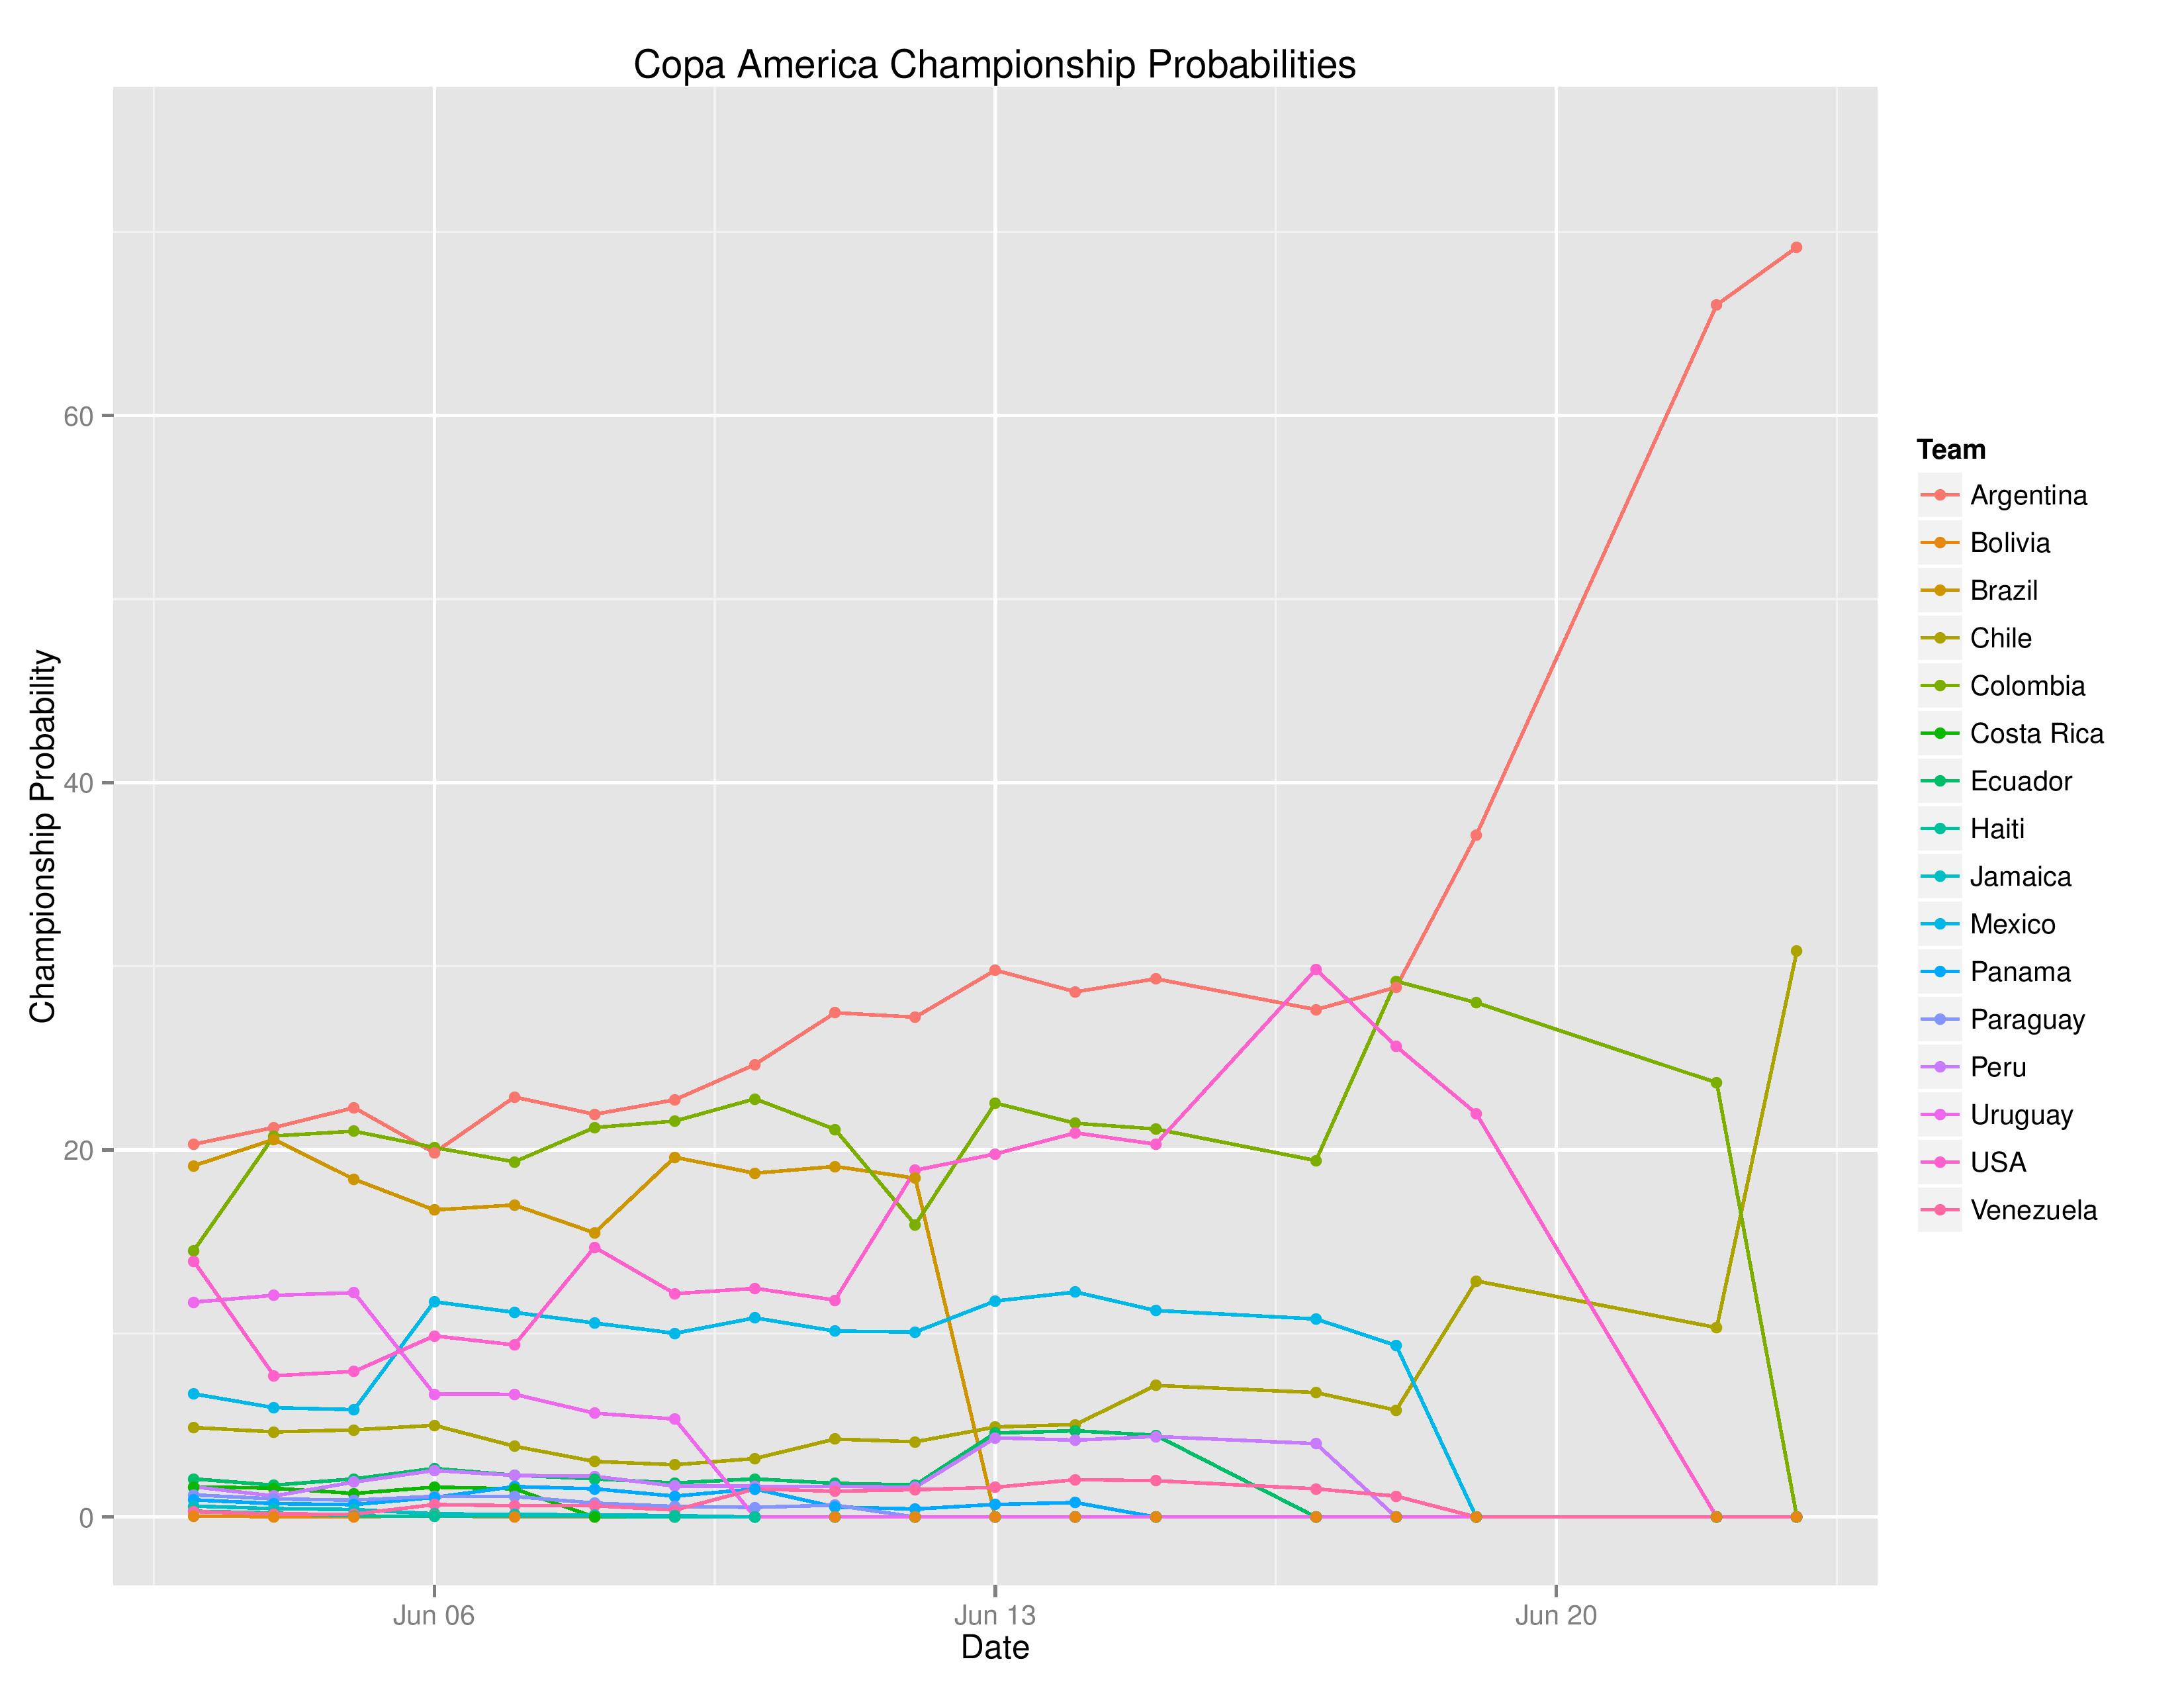
The following is the evolution in Championship probabilities over the course of the tournament:
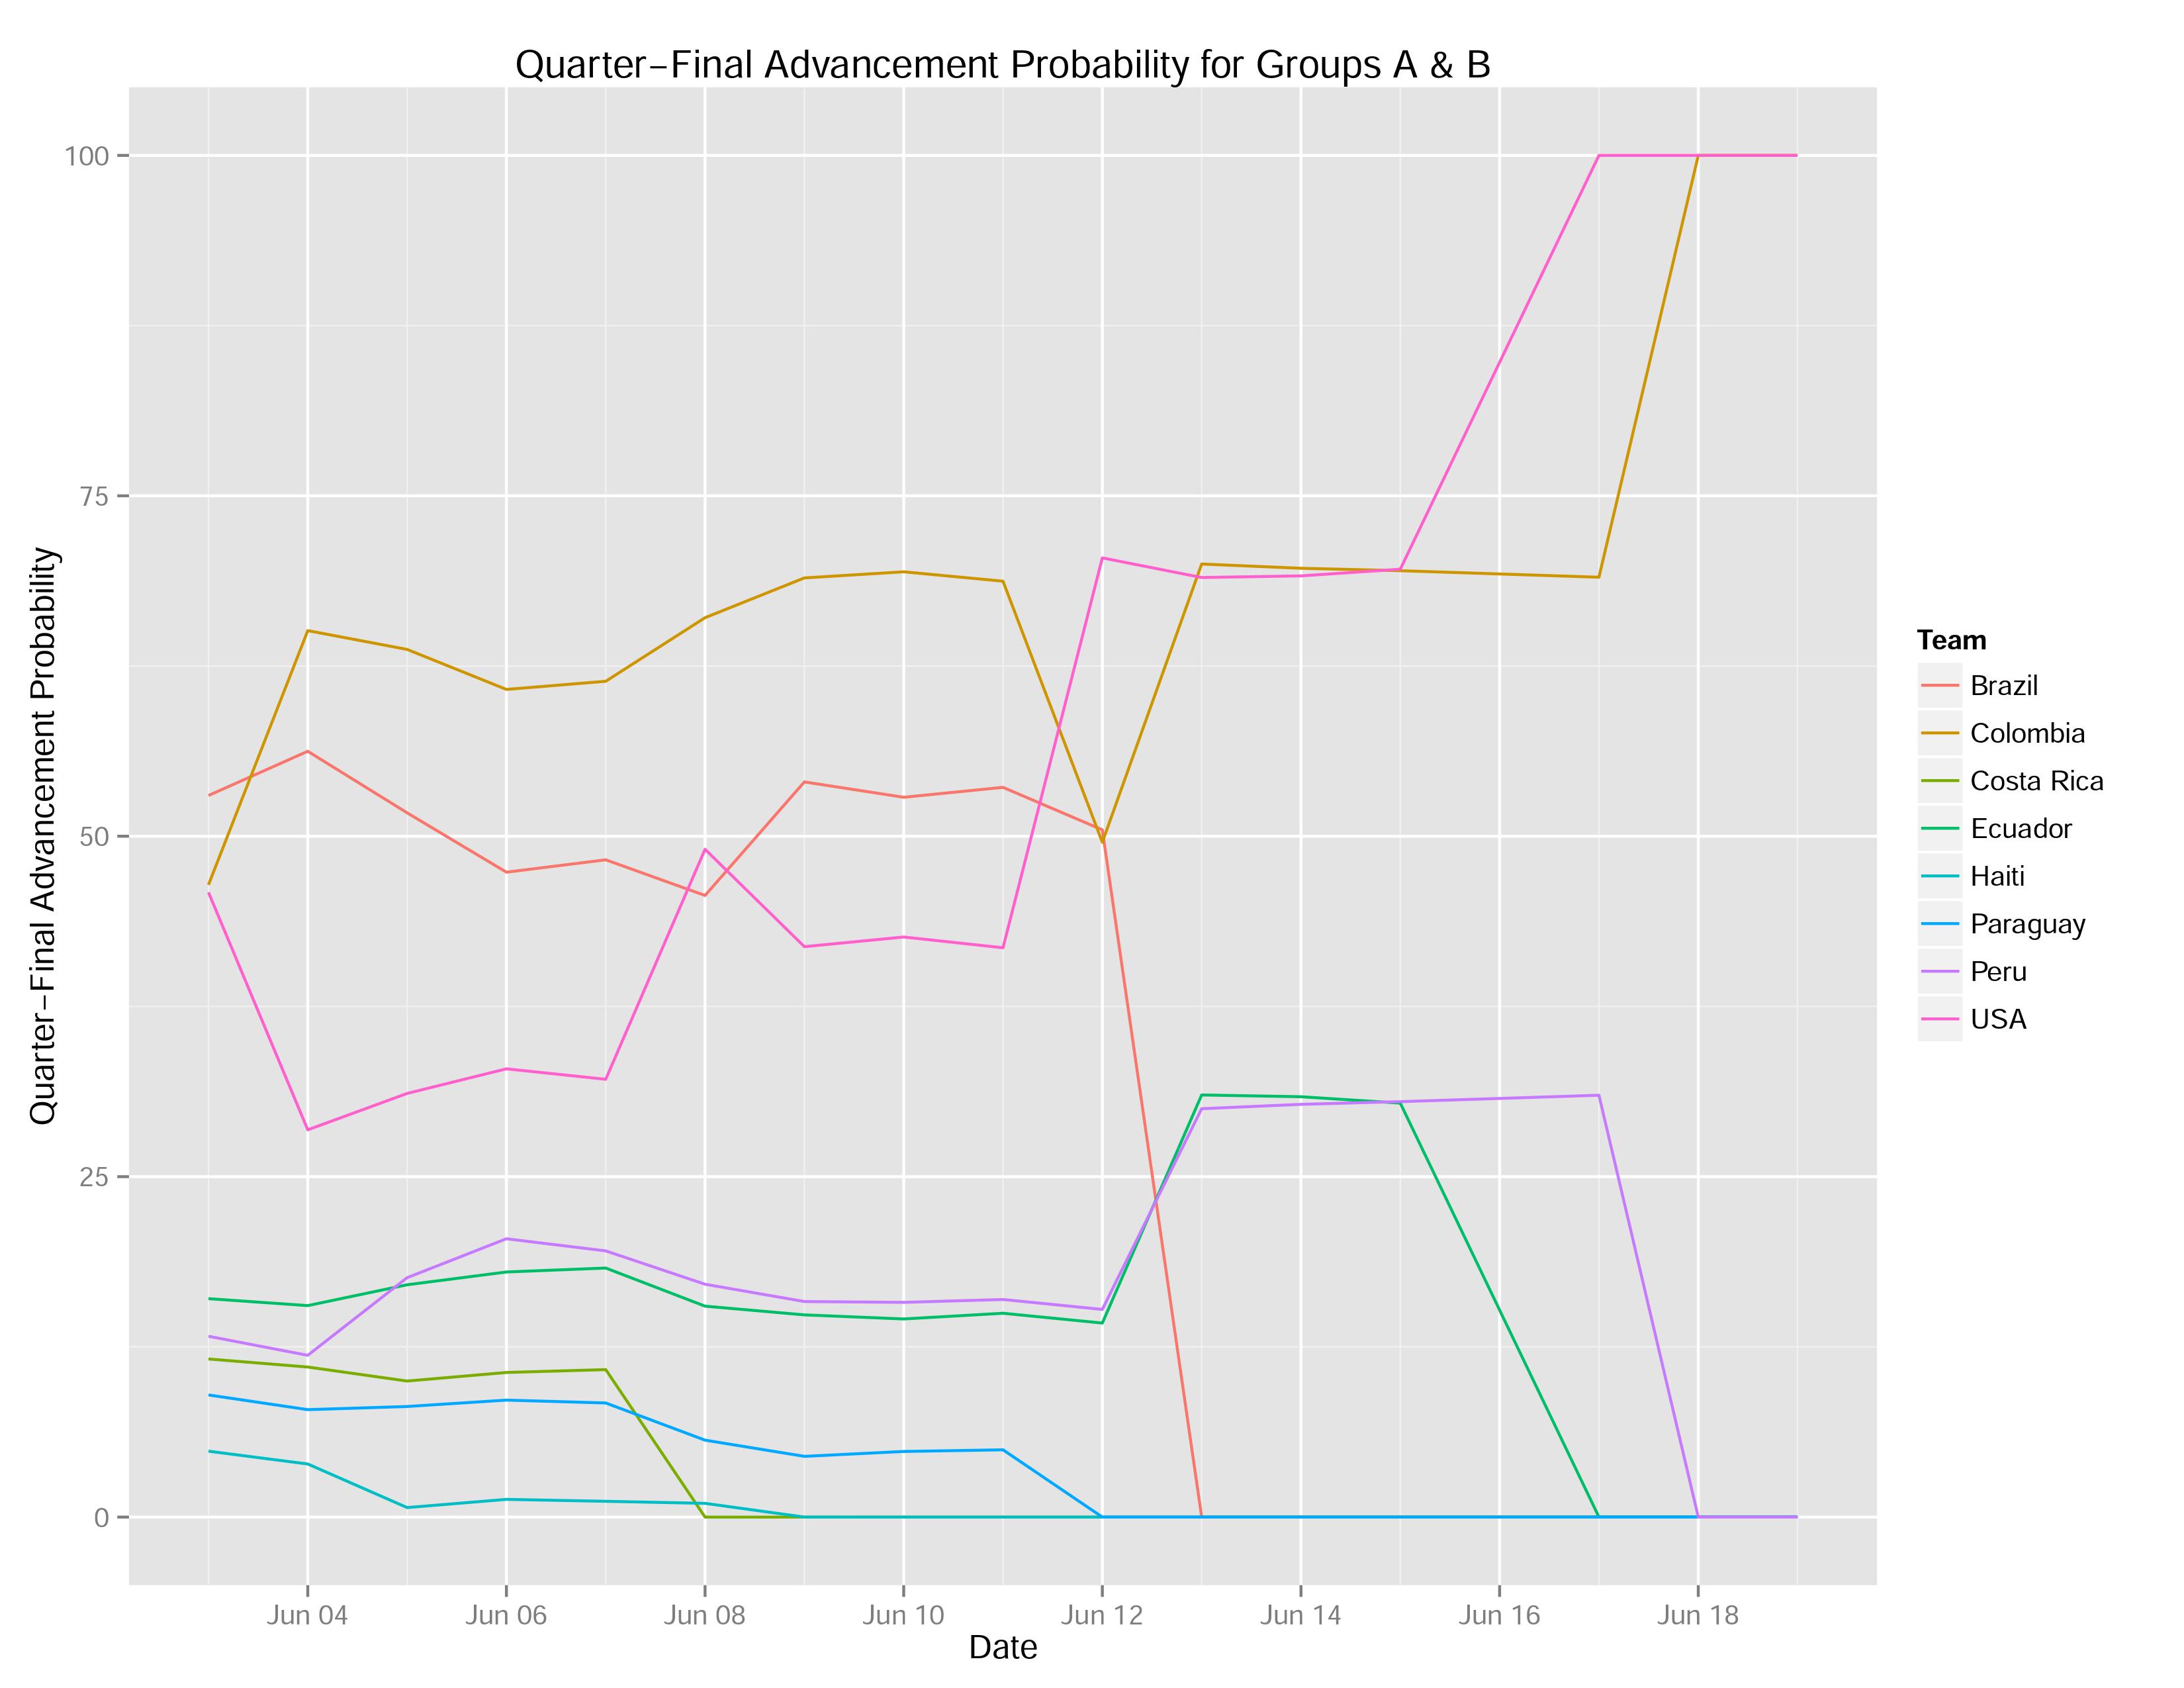
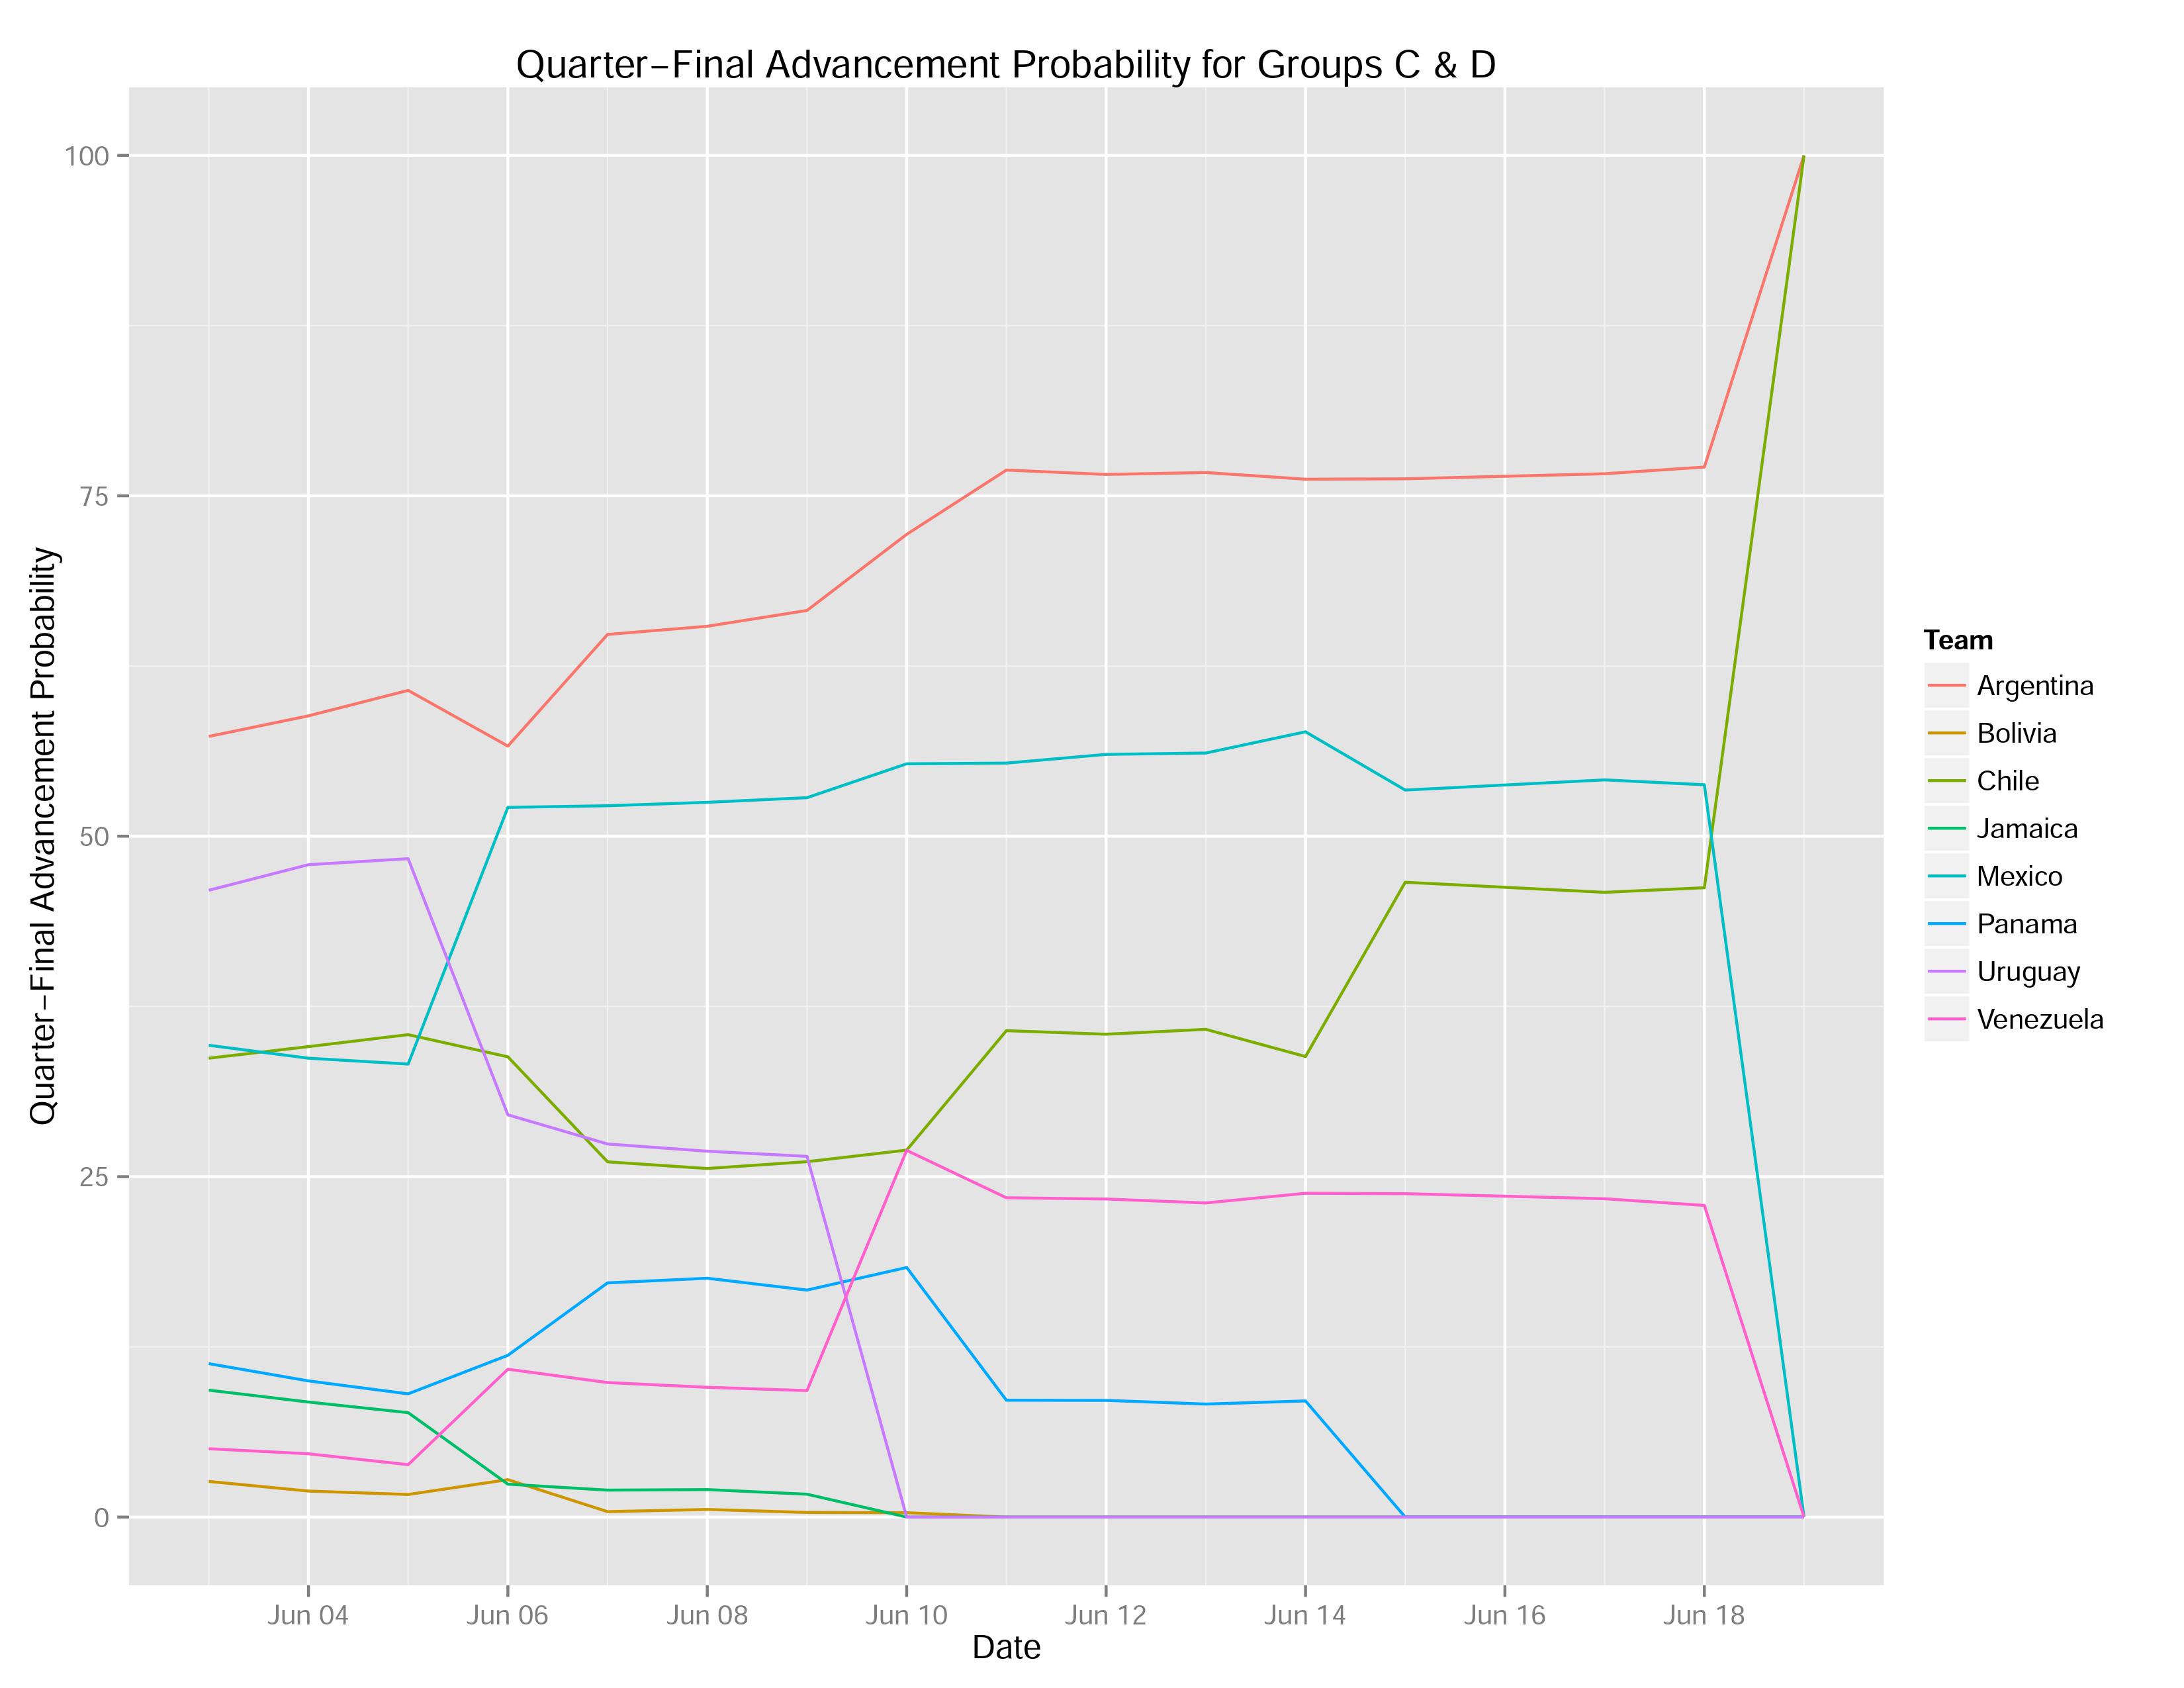
The following is the probabilities of the advancing from the Quarter Final:
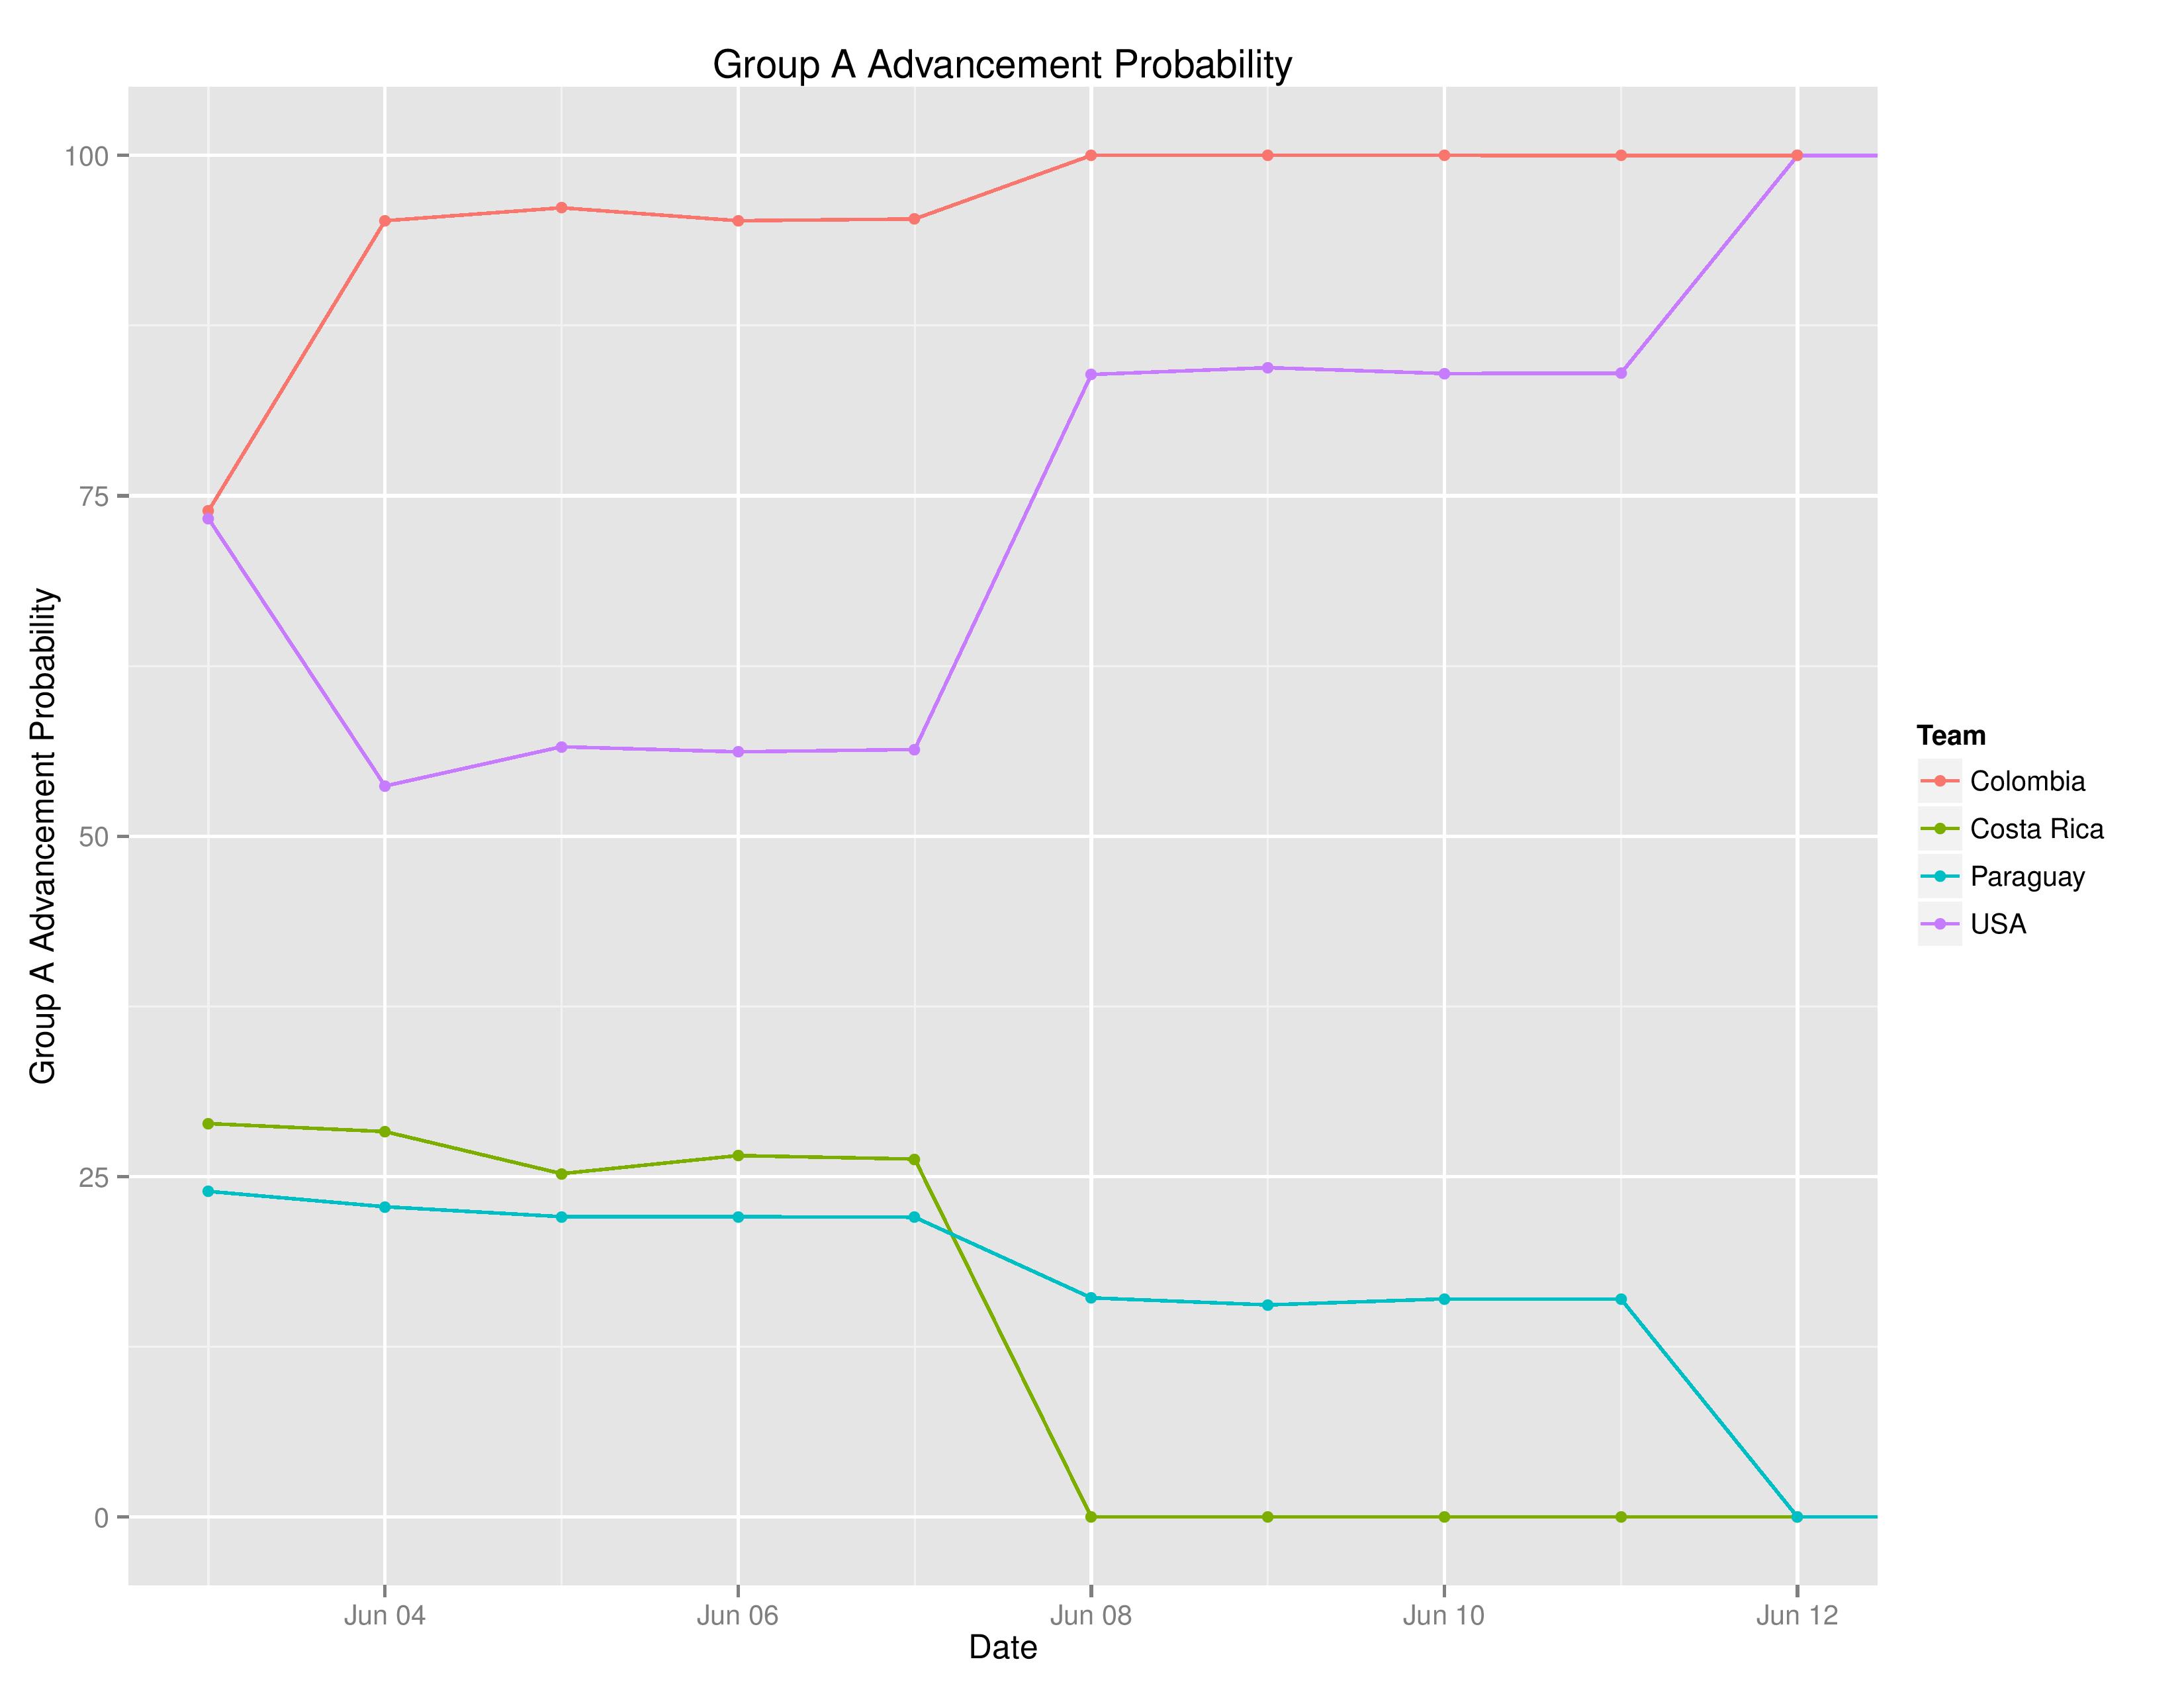
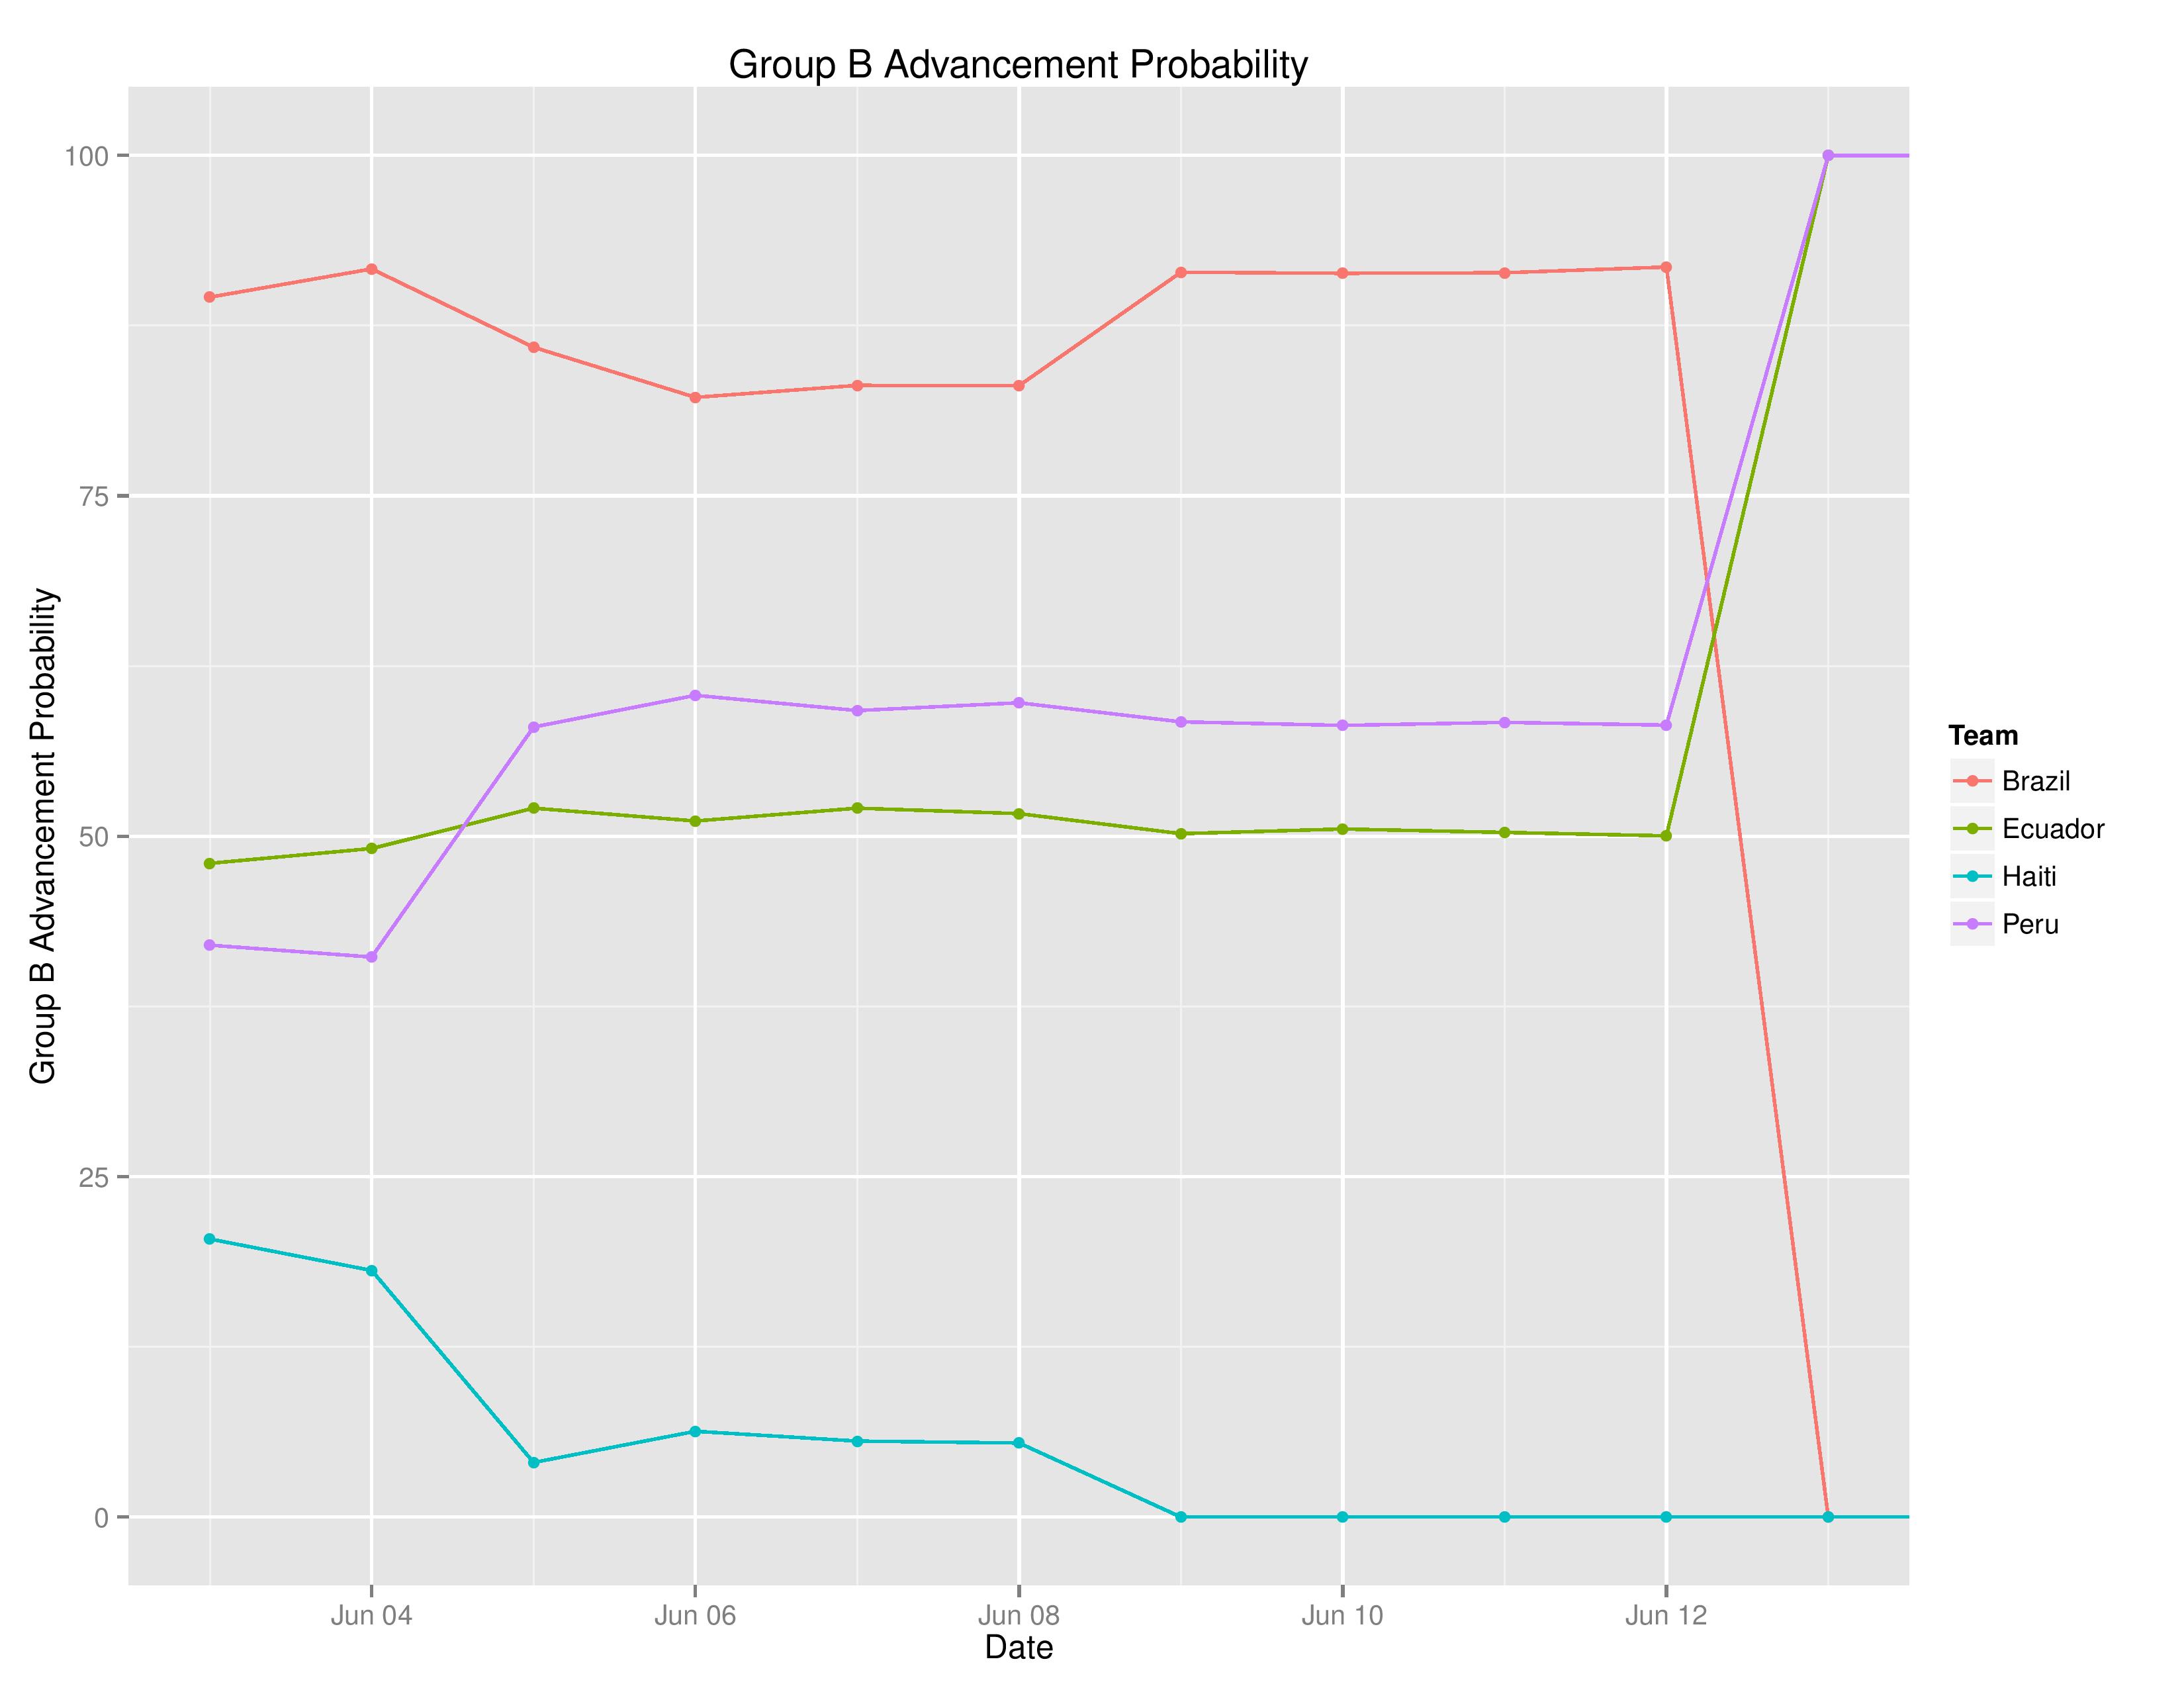
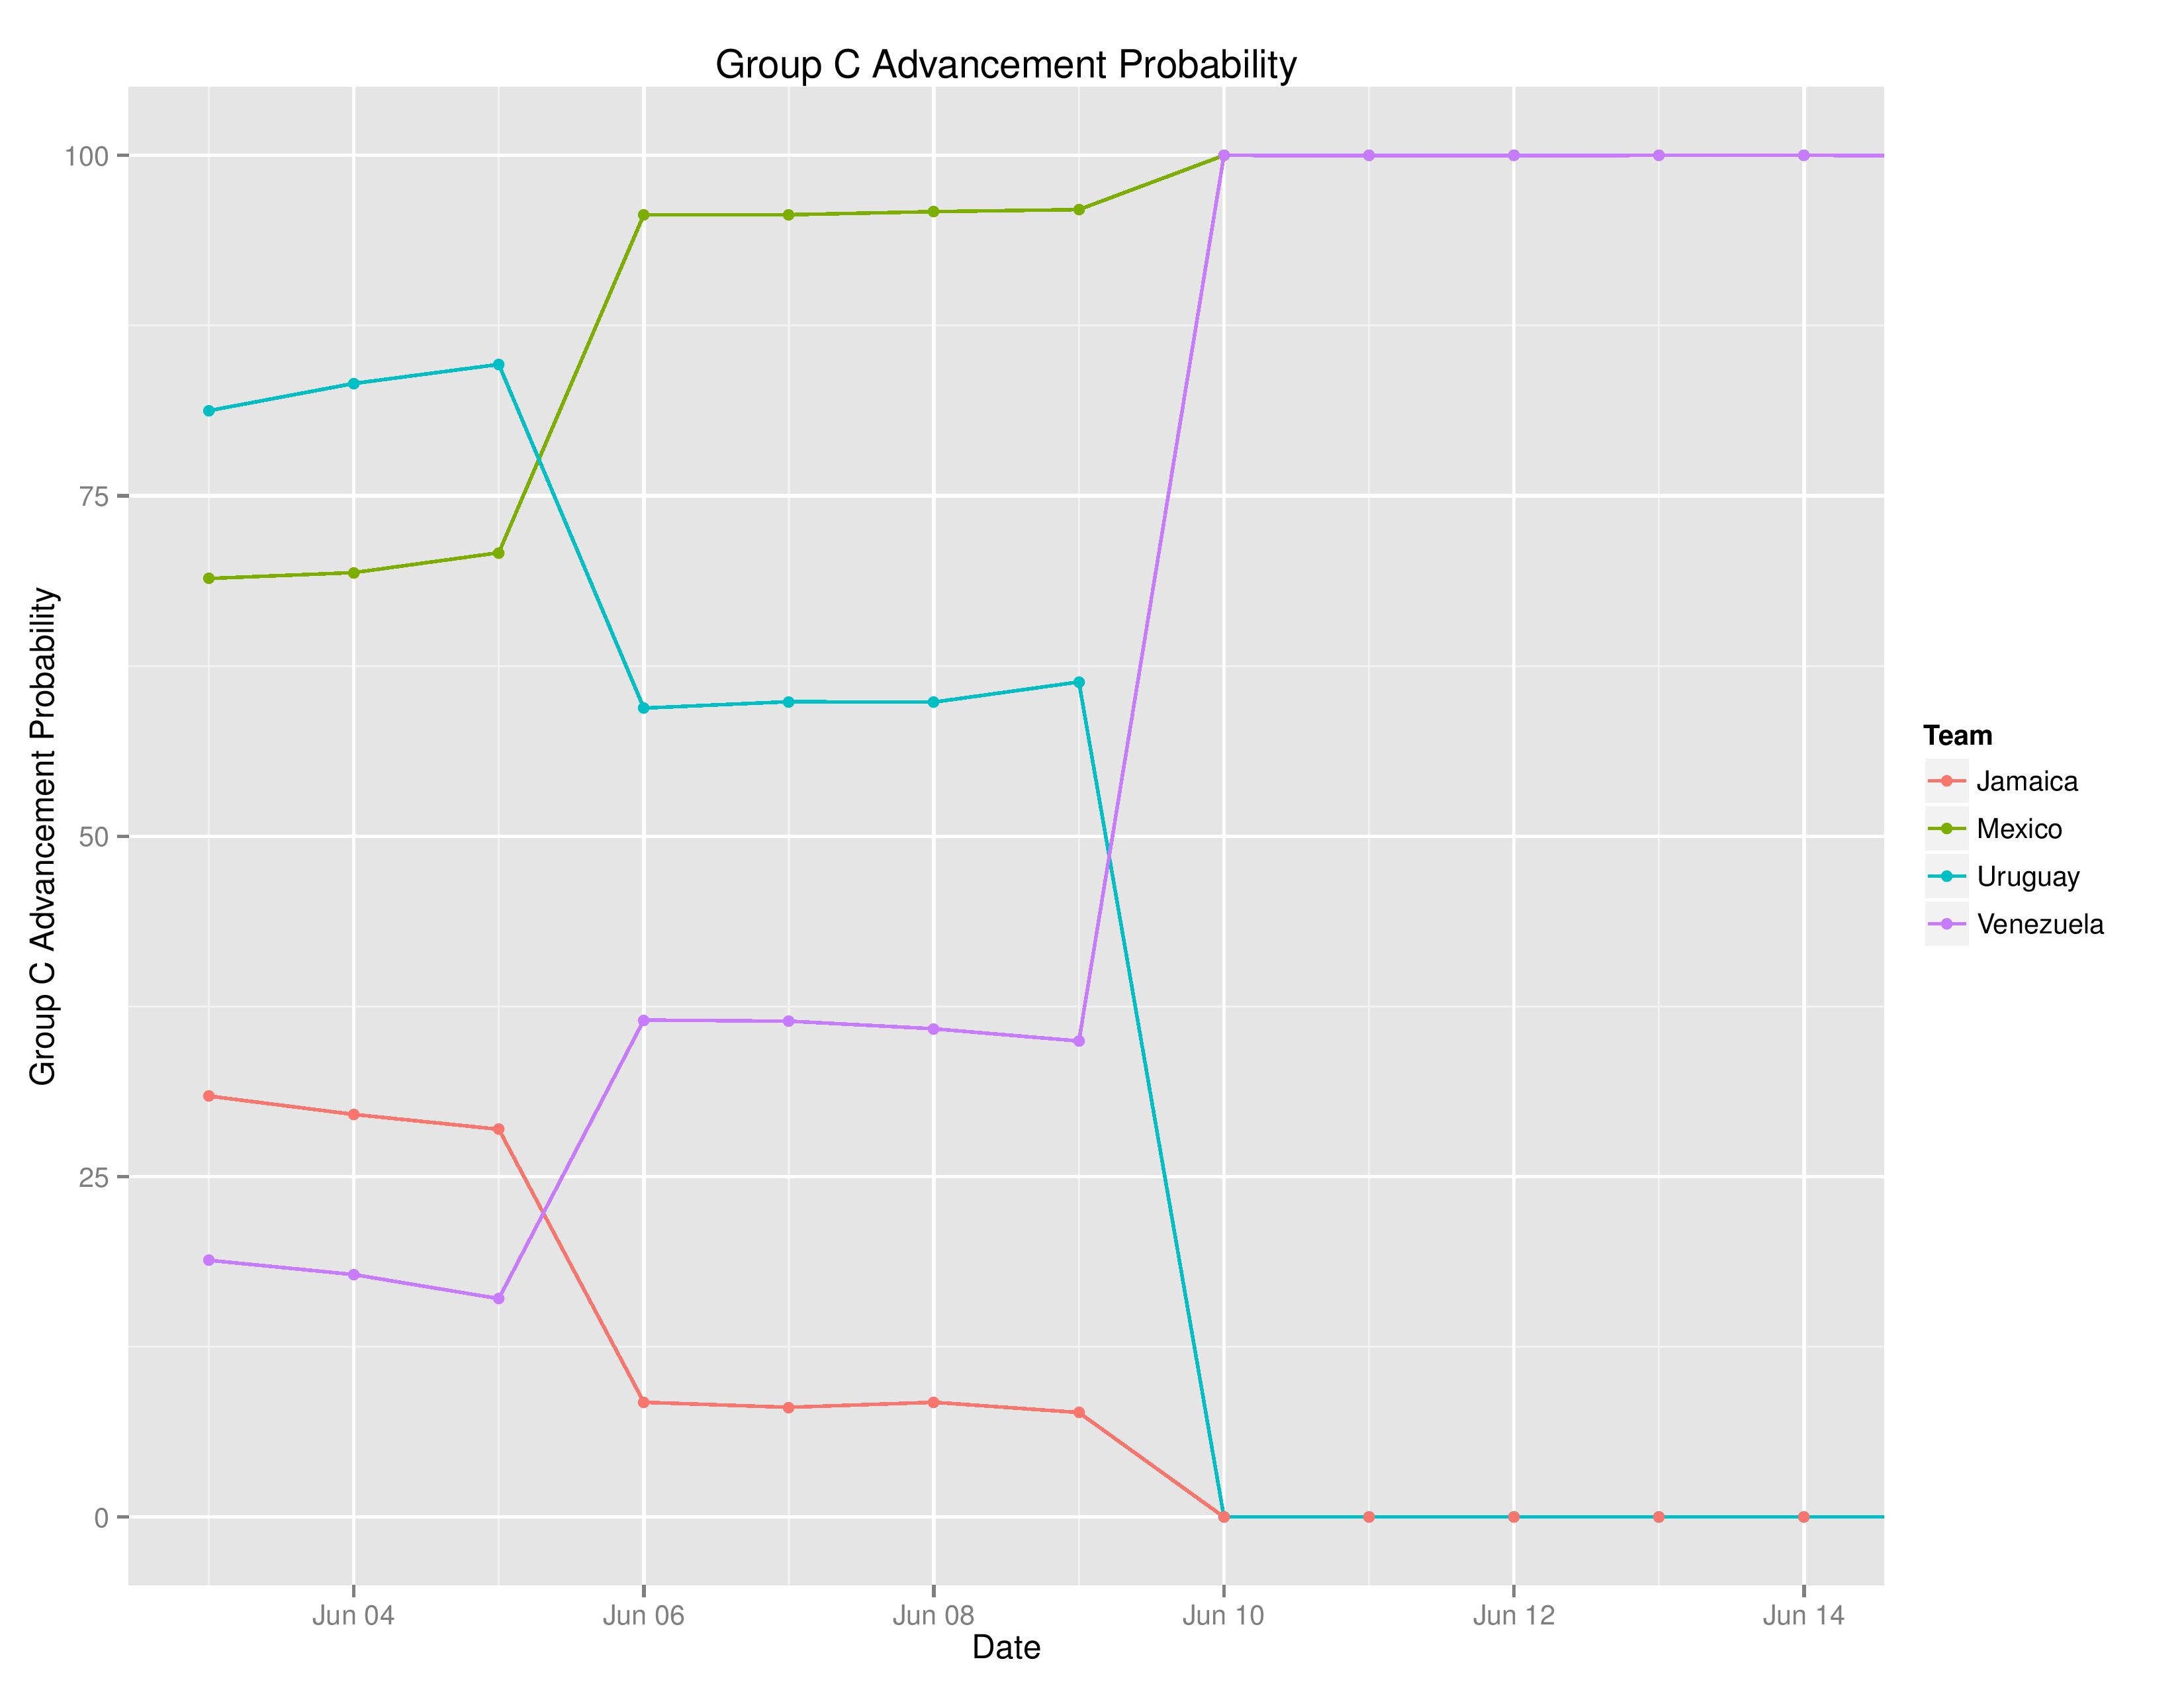
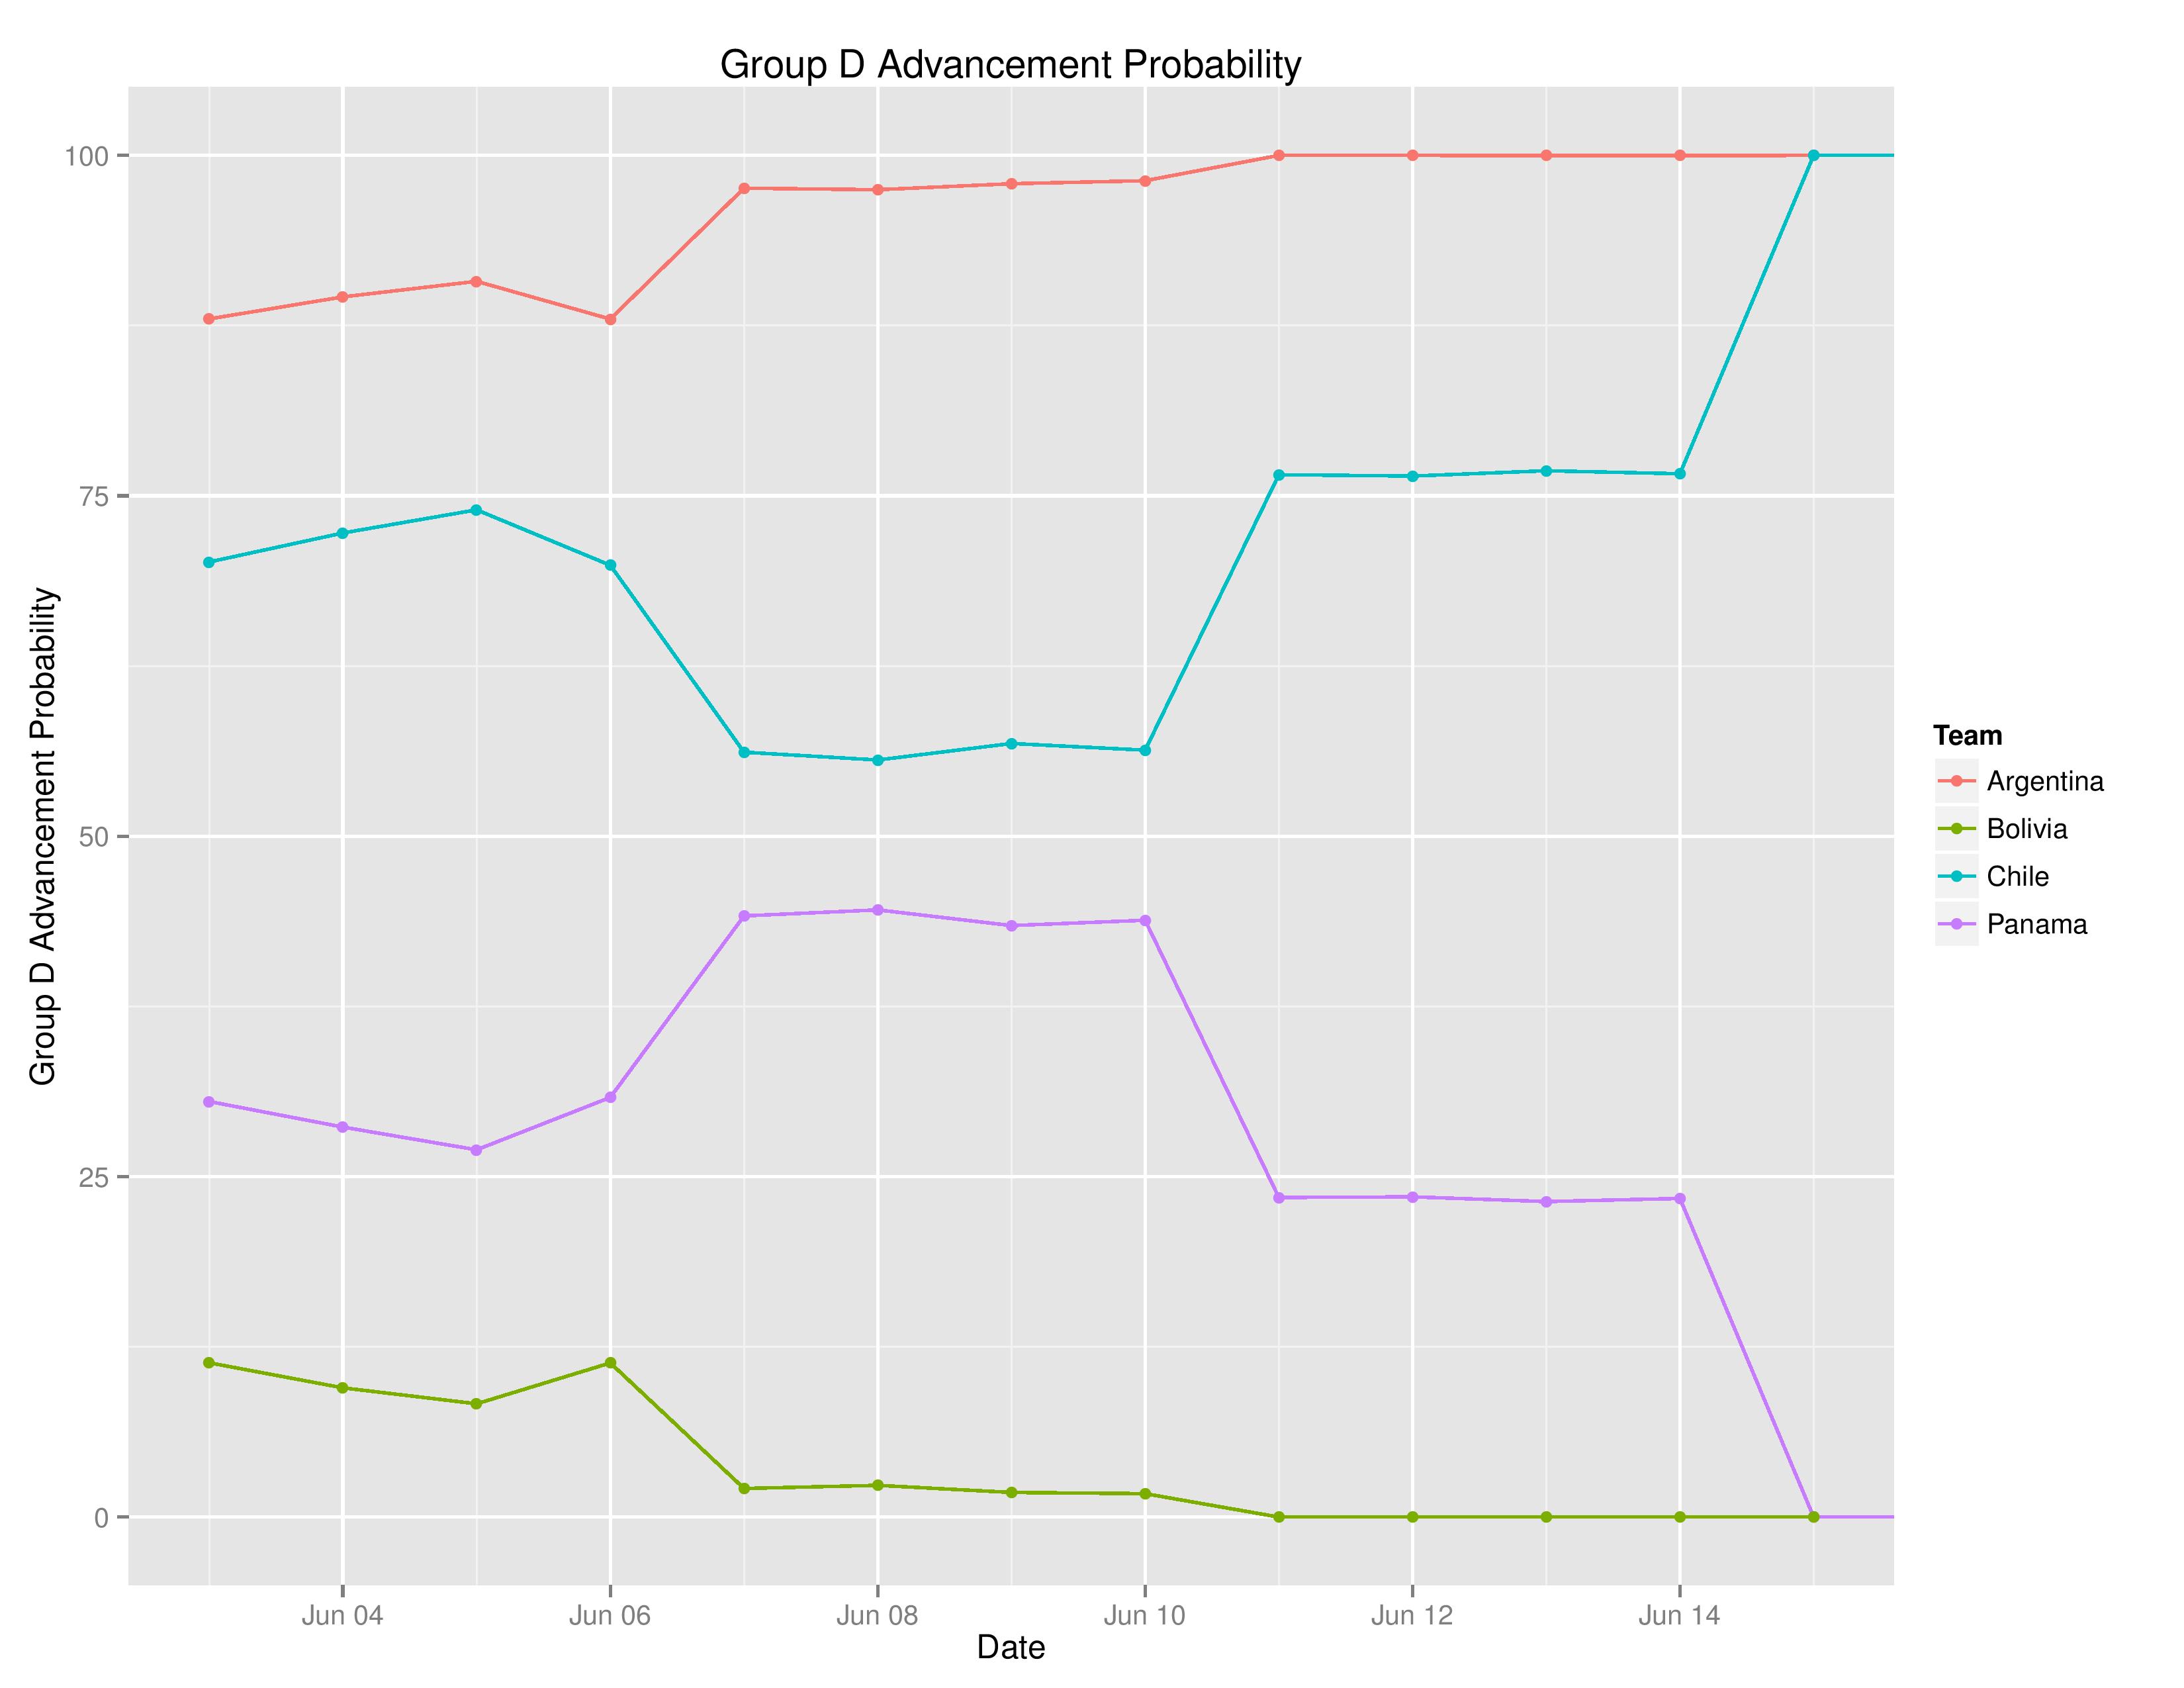
Finally, below shows the probabilities of group-stage-advancement for each group:

RECENT COMMENTS