Welcome to the Statistical Extrapolation Bayesian Analyzer Projection System, which is, of course, a tortured gathering of words used to form the SEBA Projection System.
The system consists of a model projecting the probabilities of game results and then a barrage of simulations which account for the remaining luck. So the probabilities you see below show, essentially, what the odds are of an outcome if the team continues to play like it has been.
Below are the current season forecasts using data from MLS games through June 19, 2016.
Power Rankings
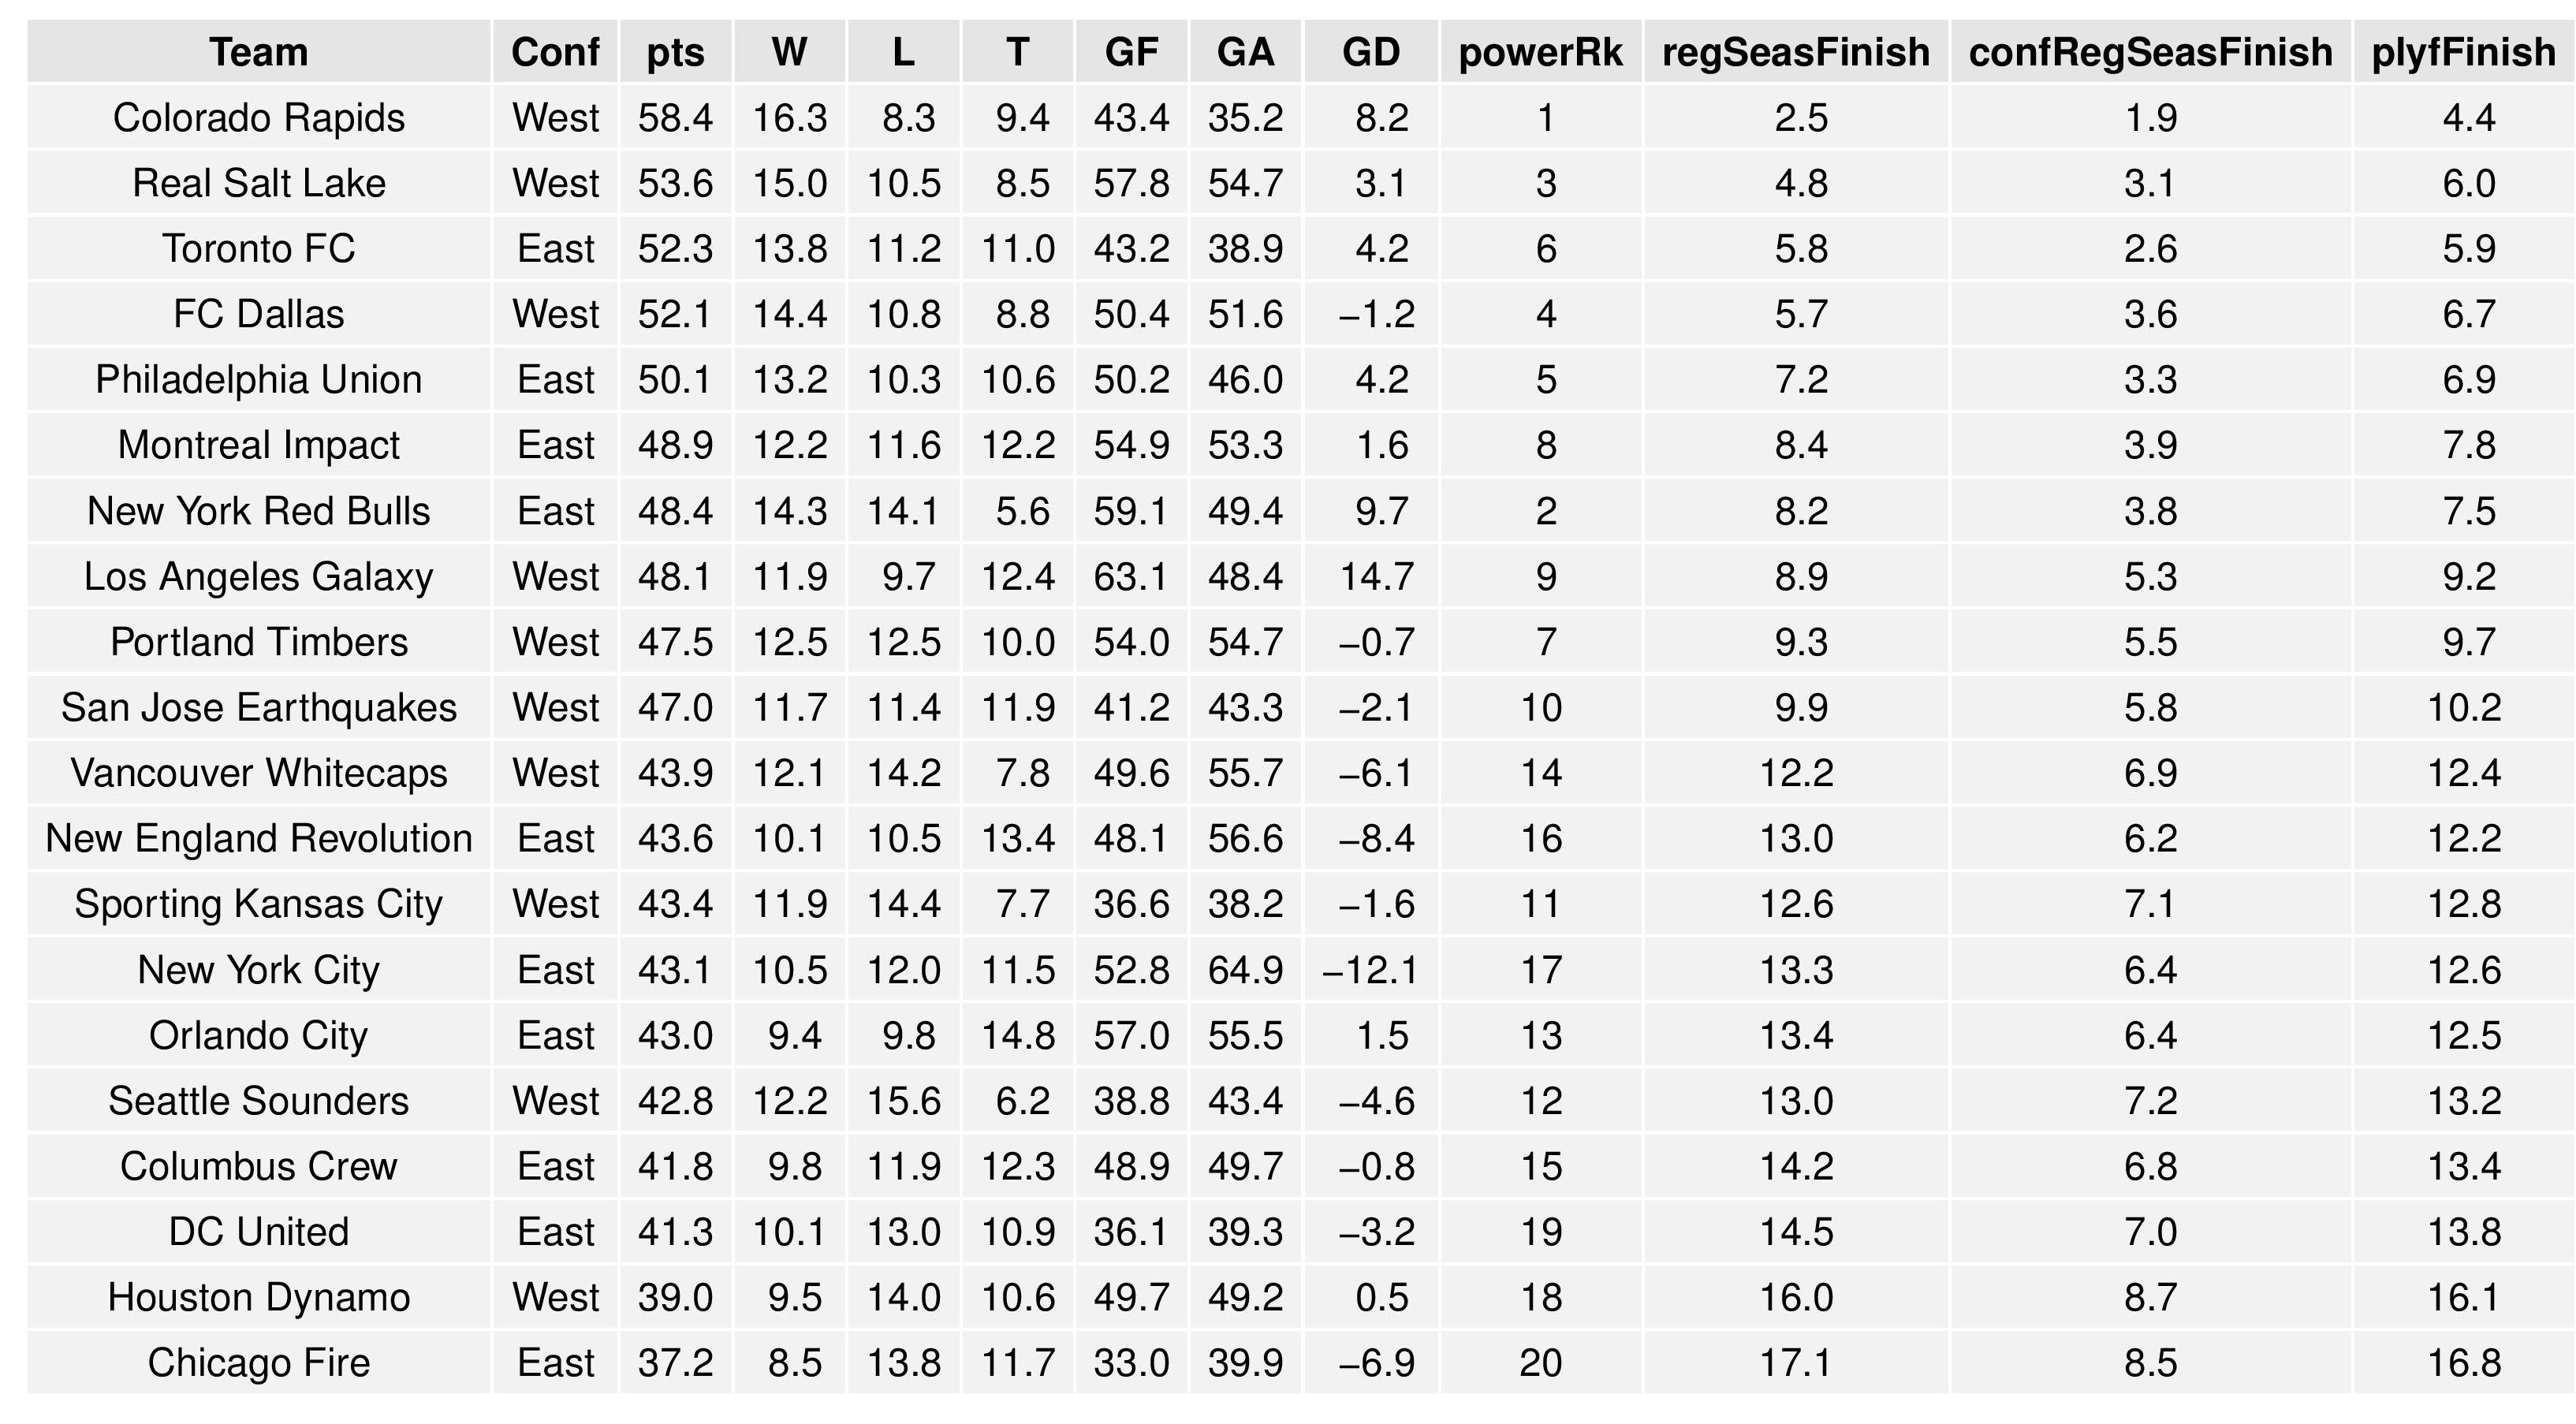
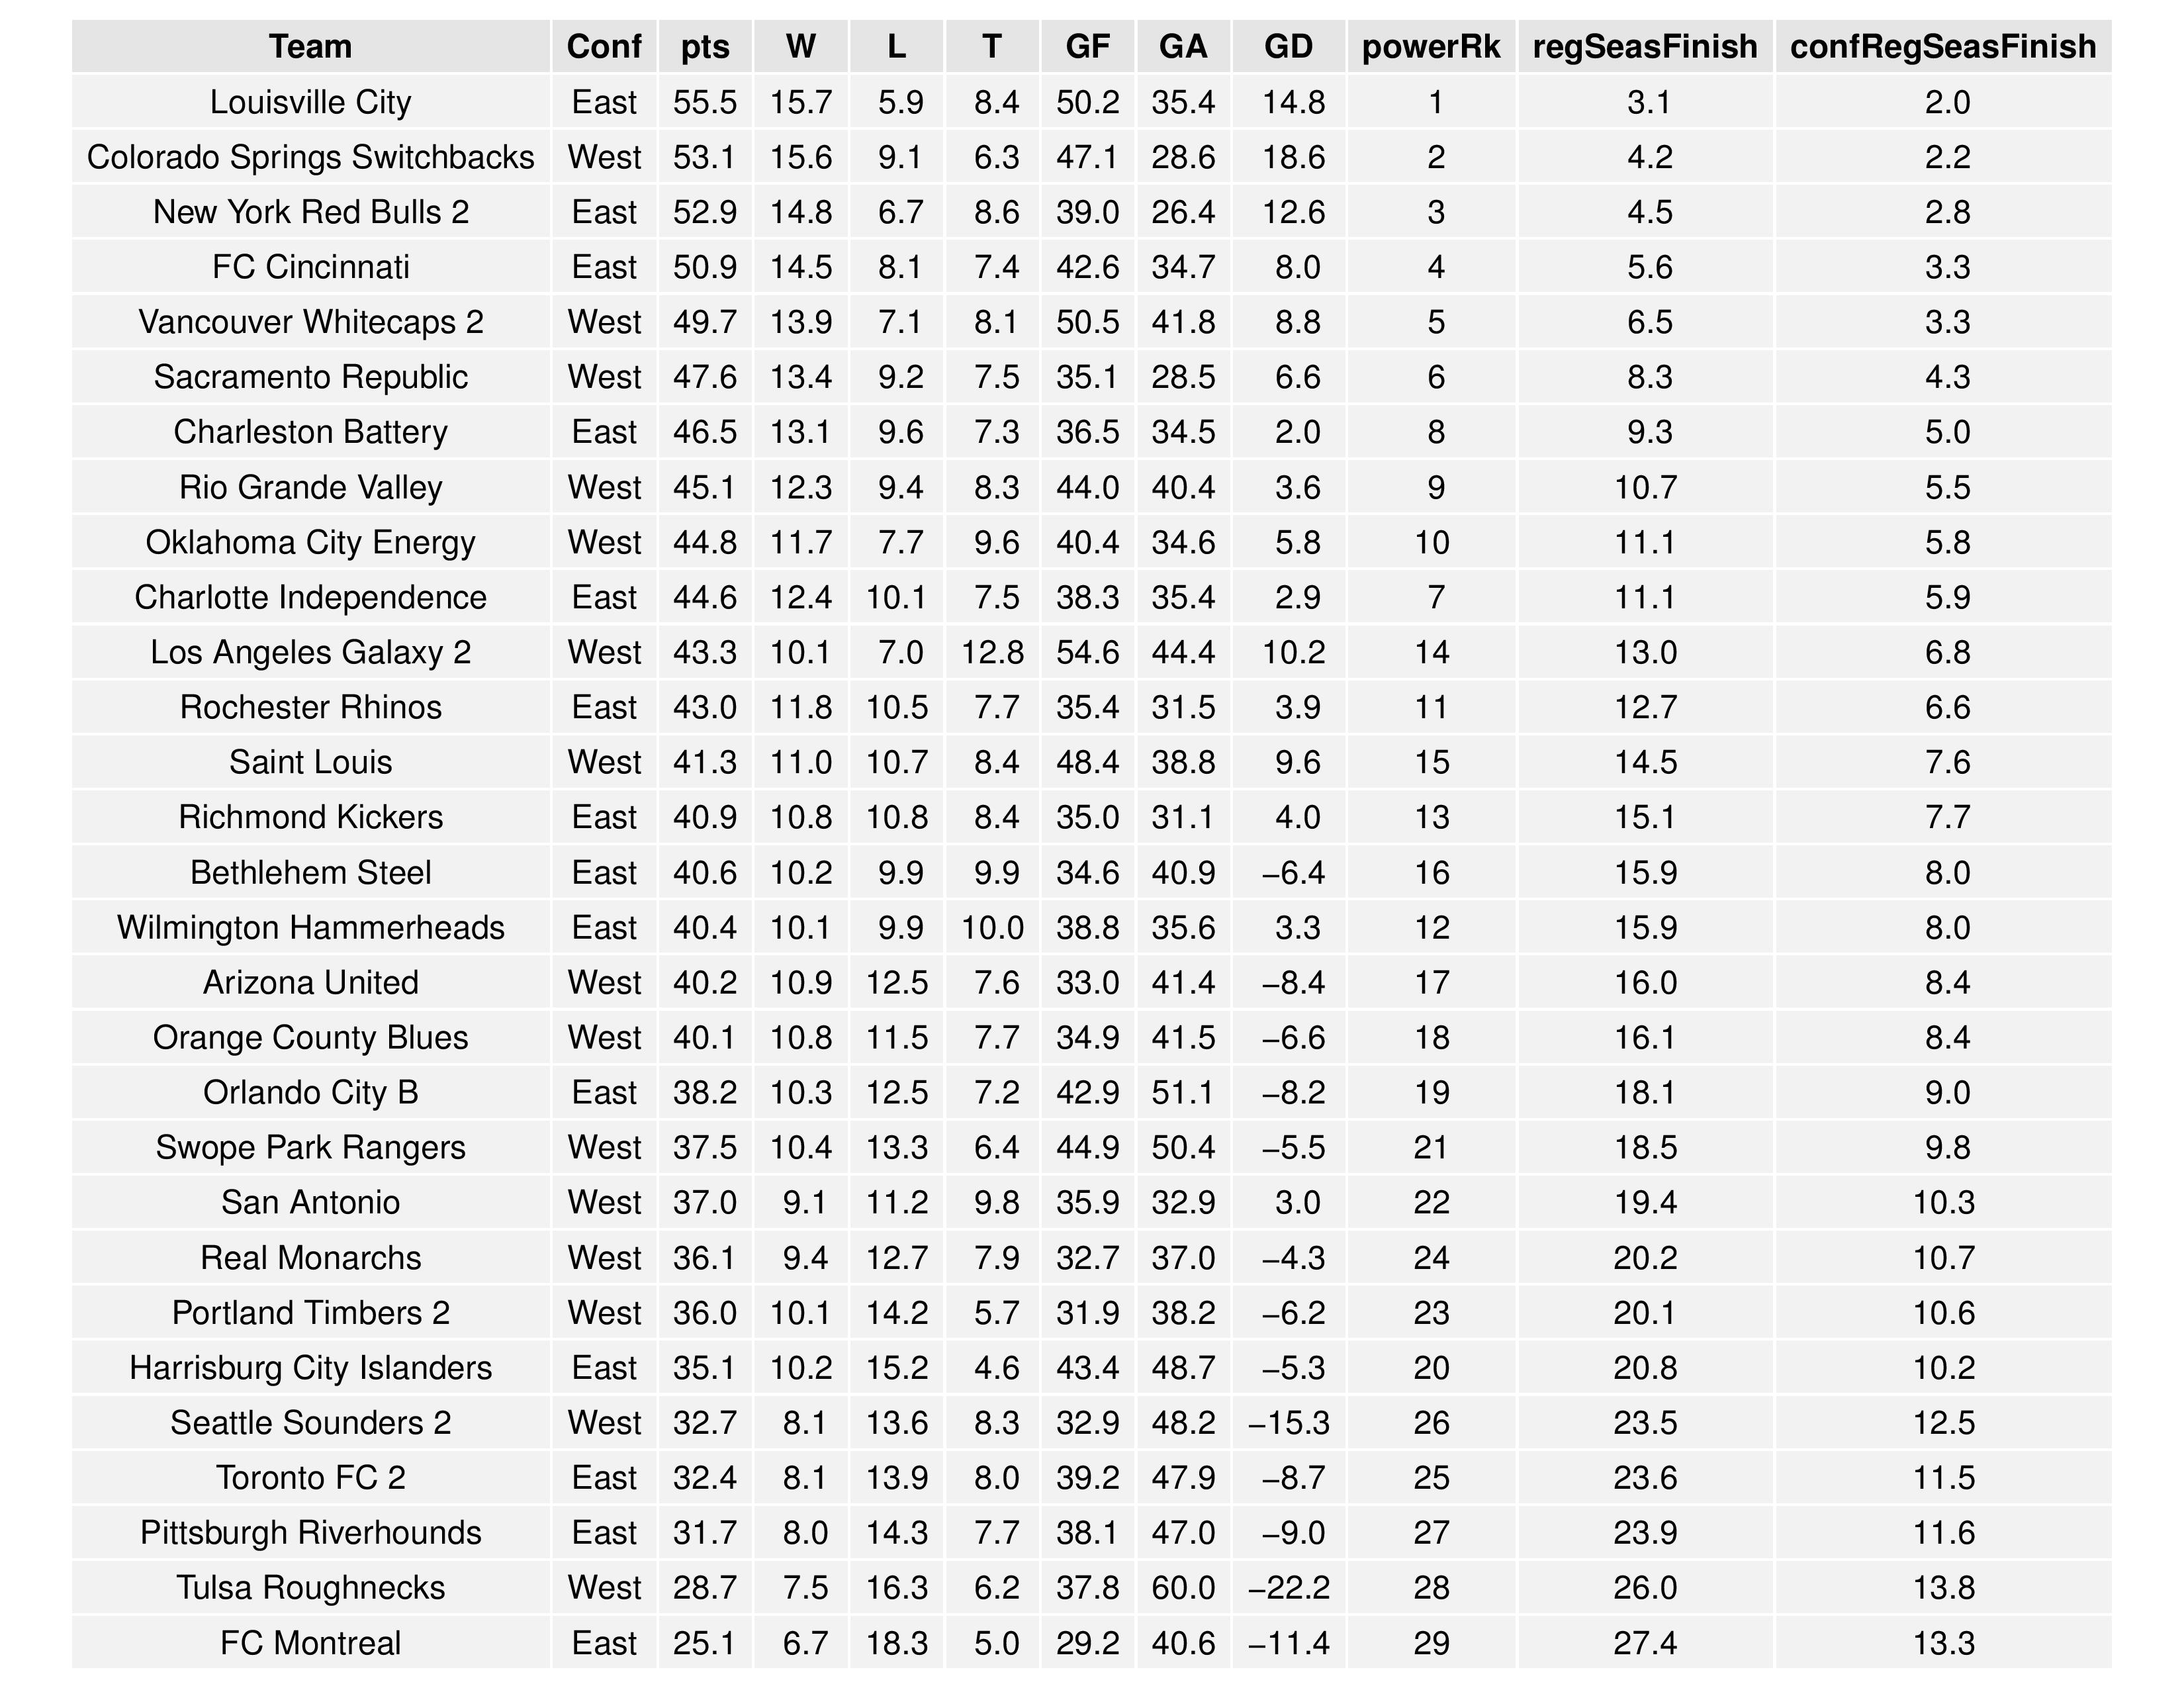
The “Power Rankings” we concoct are the actual “strength” of the team according to competitive expectations. They are computed showing average expected points result if every team in MLS played every team both home and away:
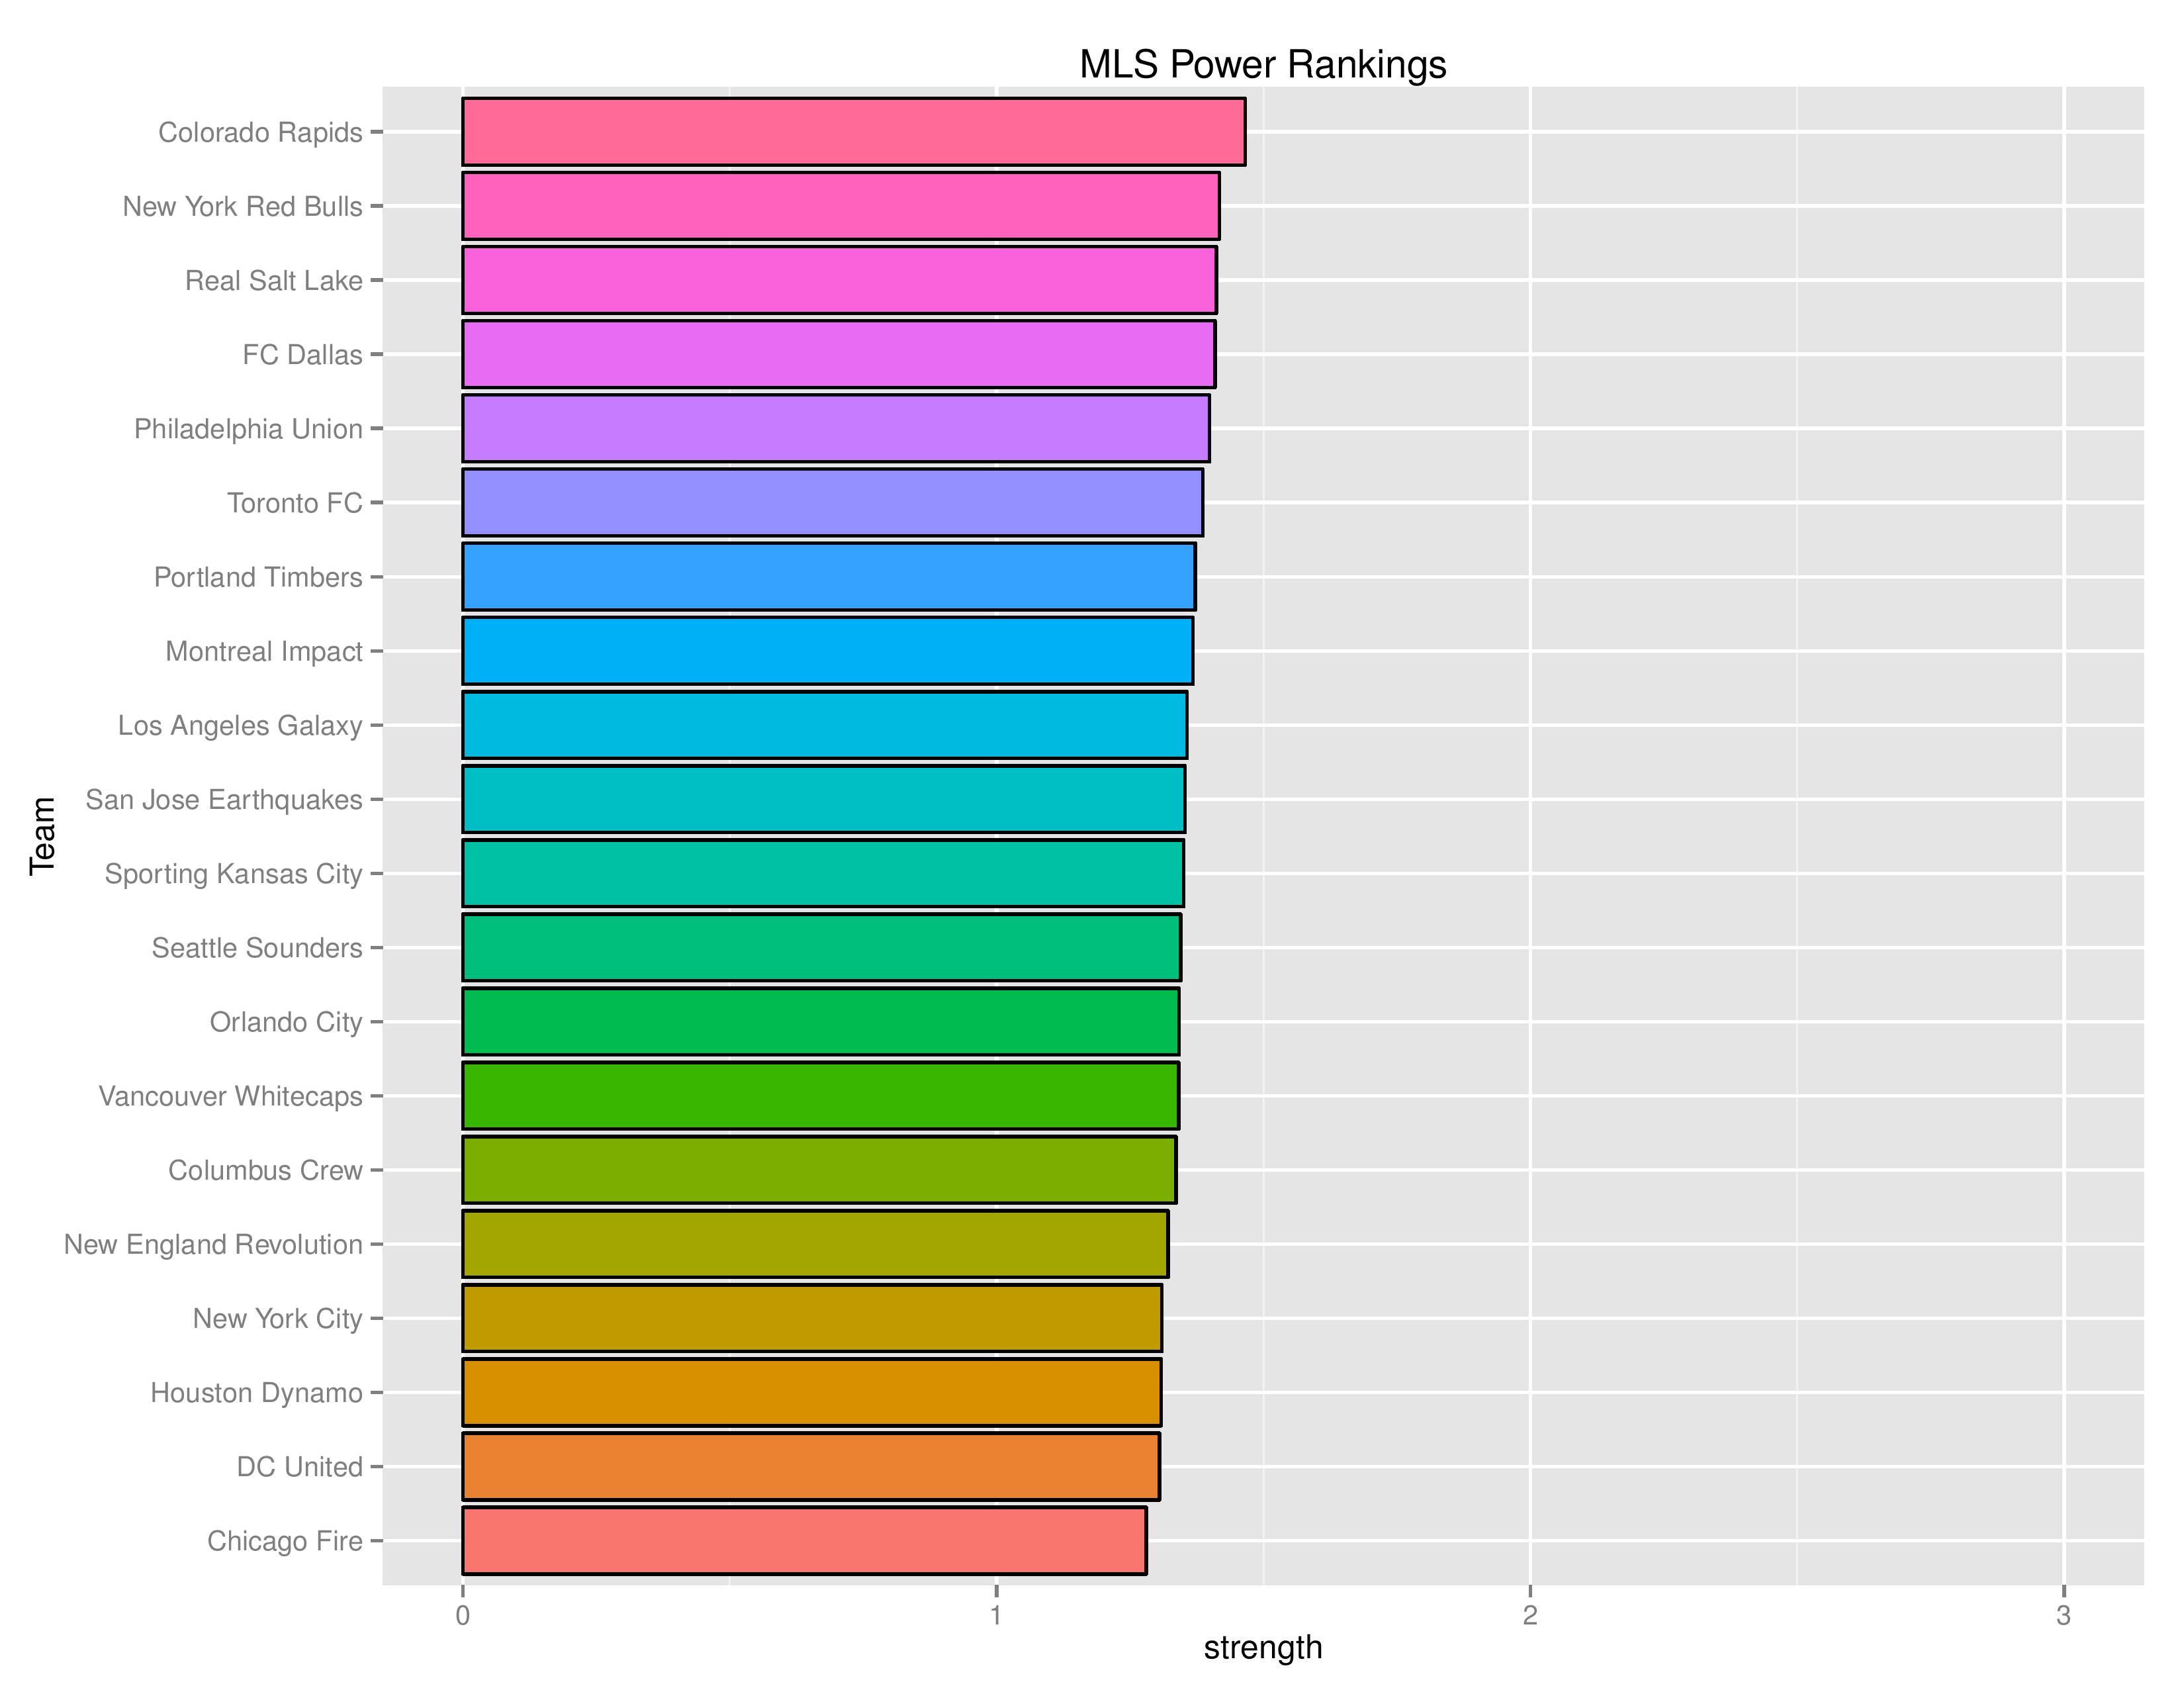
SEBA has the Union moving from No. 5 to No. 4 this week, with NYRB having jumped from 5th to 2nd pushing those former teams down. MLSSoccer.com and ESPN have the Union at No. 4 and SoccerAmerica has the Union at No. 3.
Playoffs probability and more
The following charts show the probabilities for making the playoffs, winning the Supporters’ Shield, winning the MLS Cup, winning the USOC Cup, and qualification for CONCACAF Champions League.
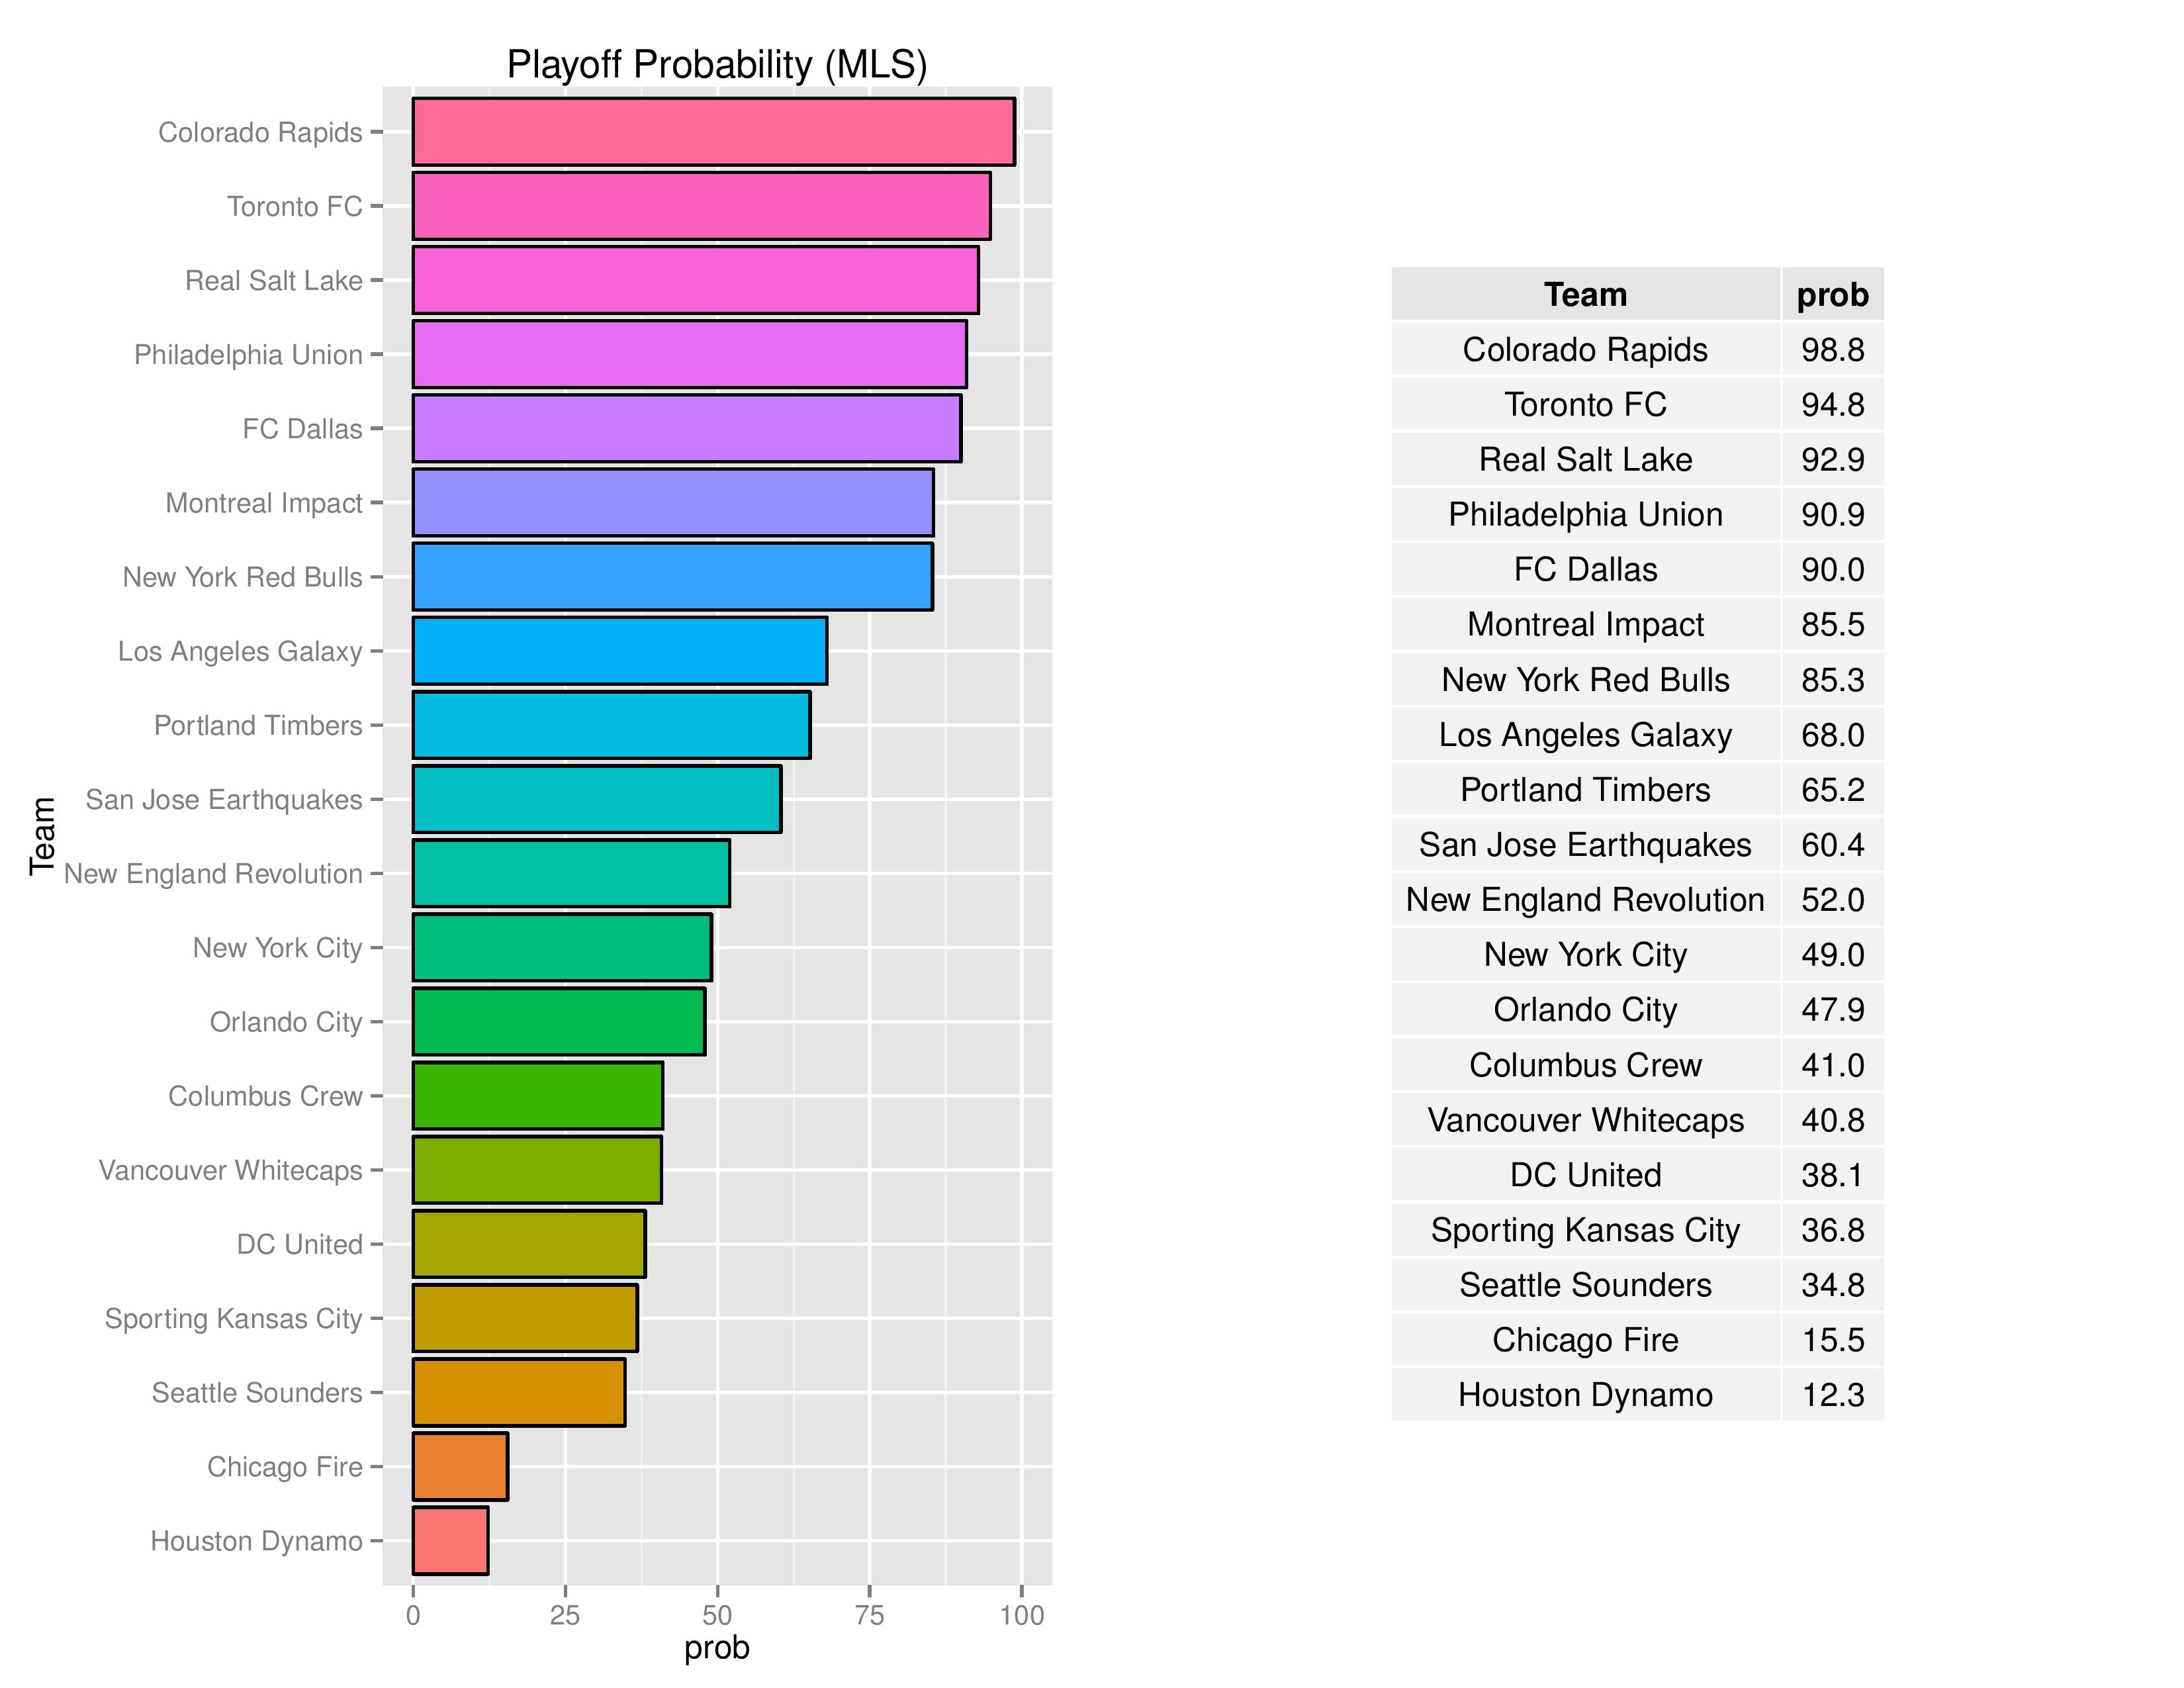
The Union took a dip going from 93.0% to 90.9% with the loss against NYCFC. Both the loss and the good week for the Eastern conference played a role in this dip.
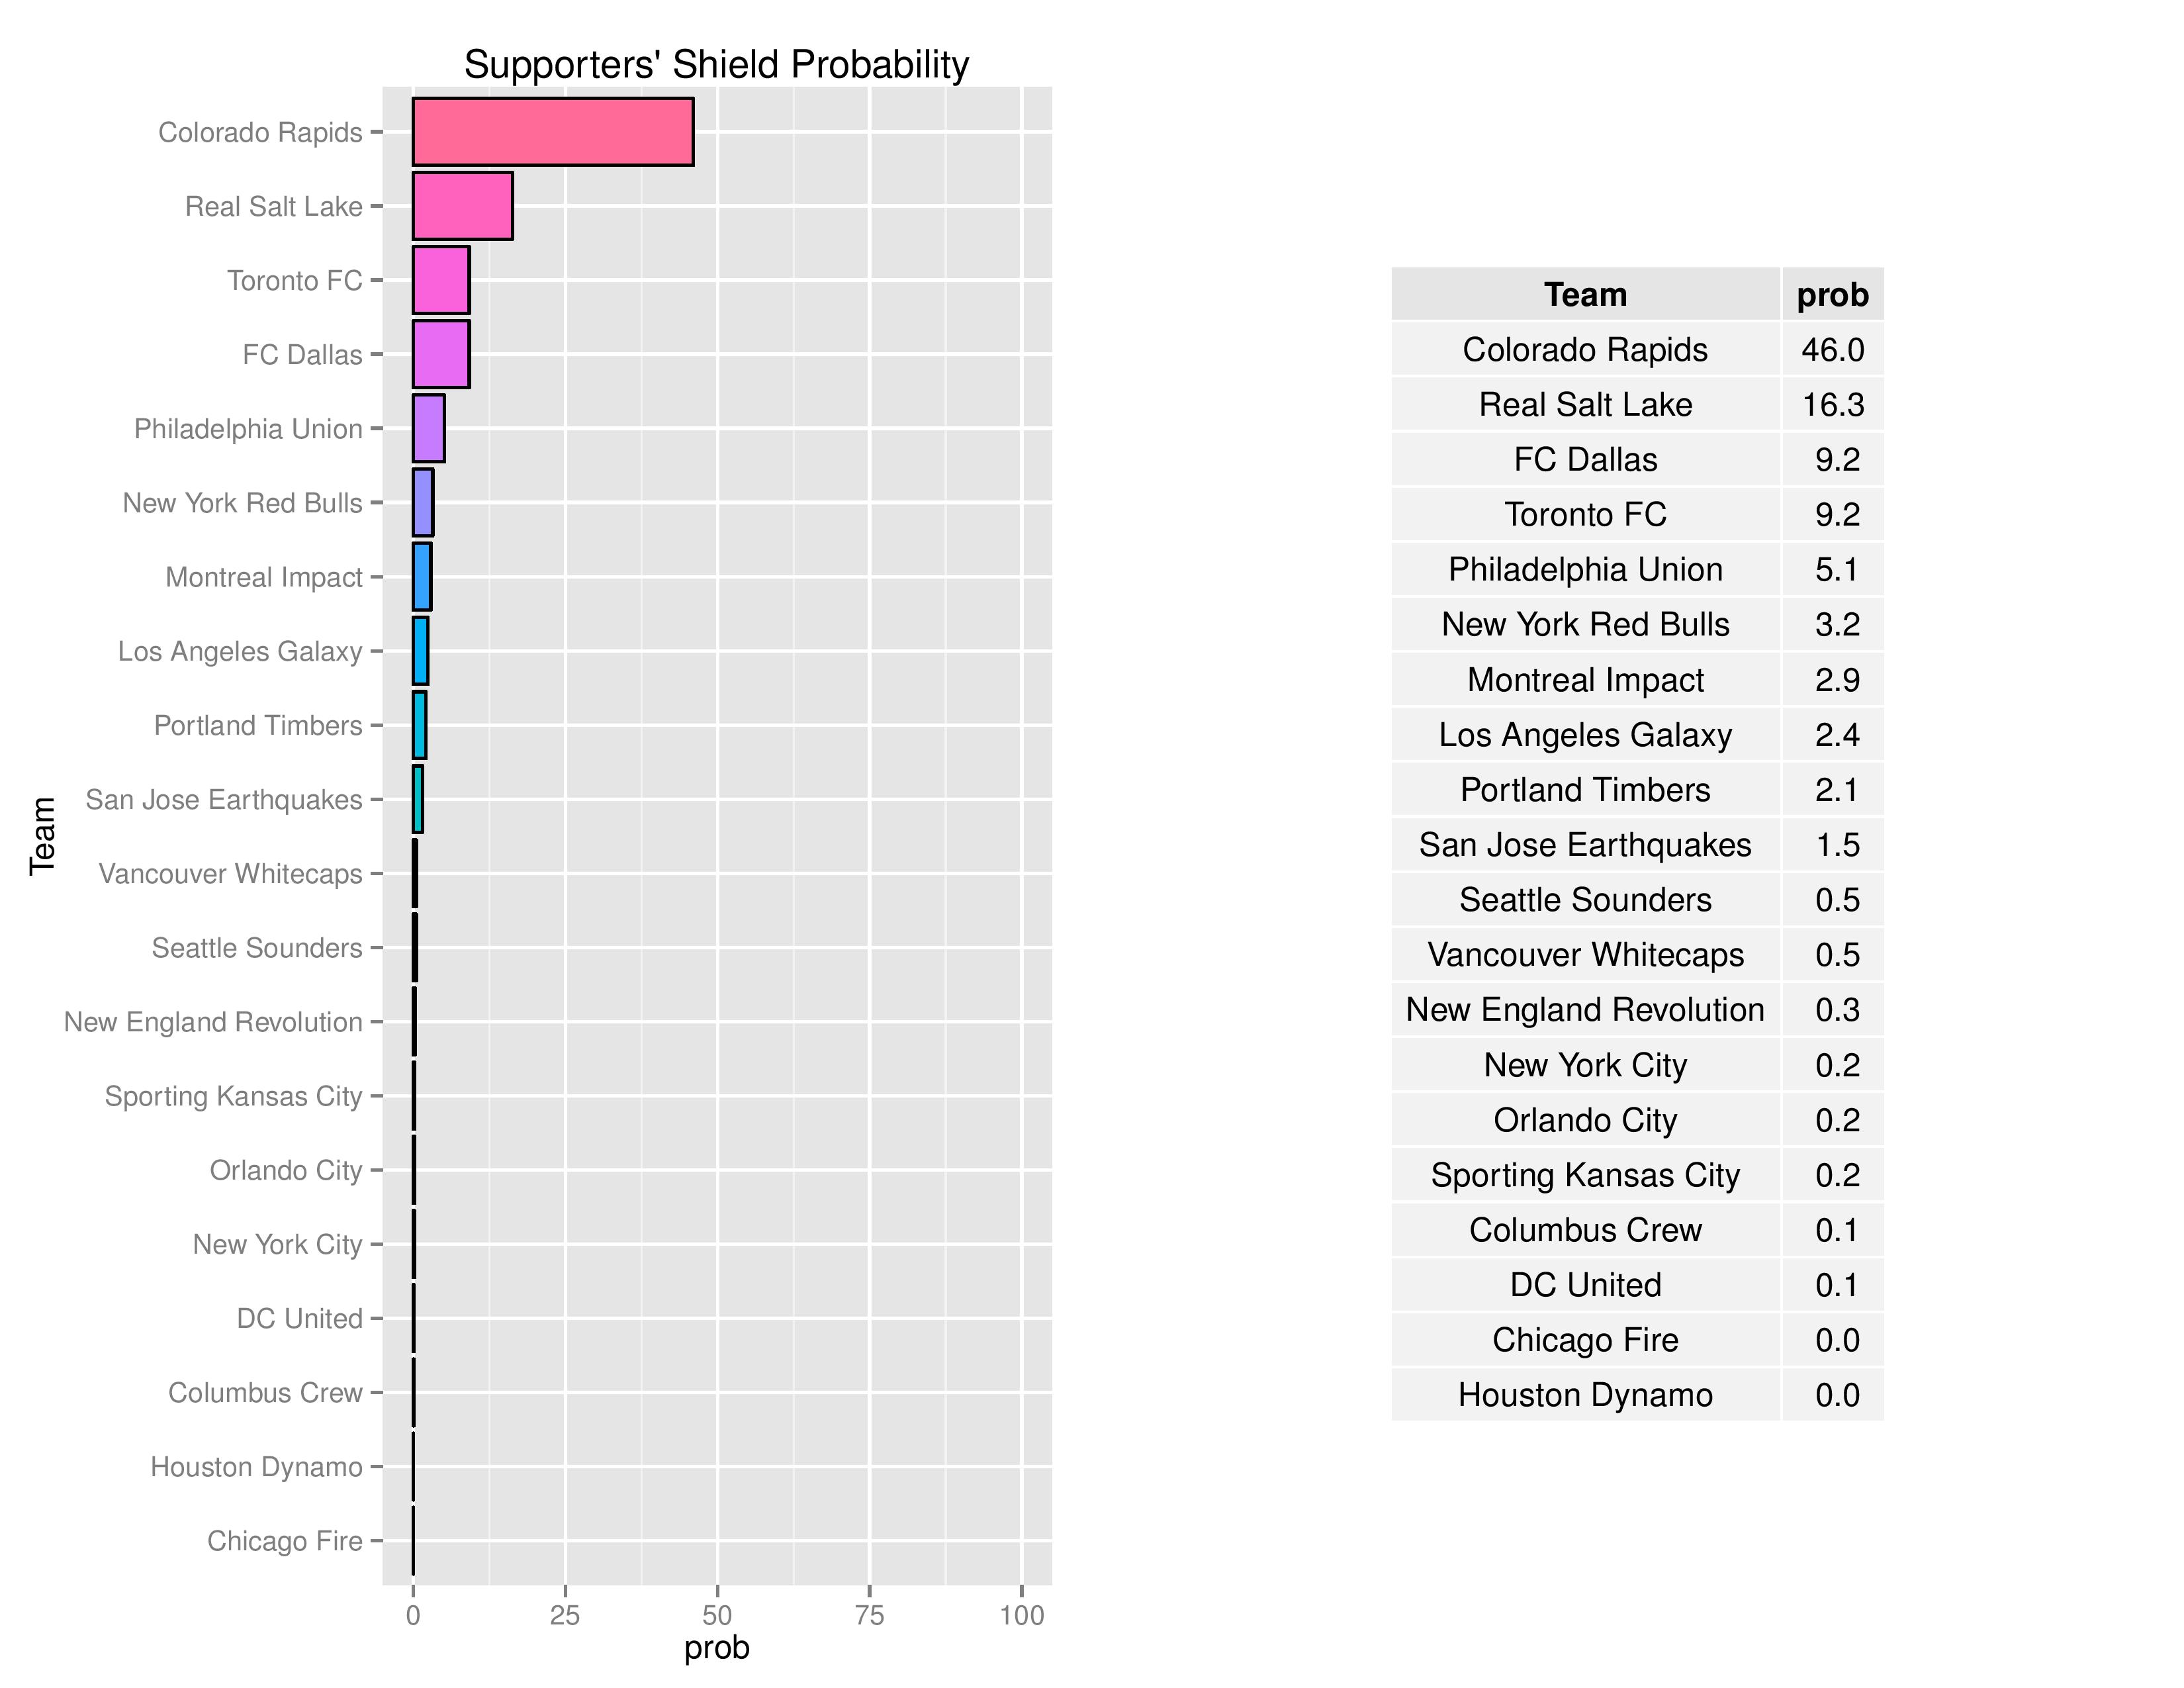
Philadelphia declined to 5.1% from 7.4% in their odds of claiming the Shield. Toronto has passes Philadelphia in the rank order and Colorado has further solidified their lead on the Shield by jumping 14% from the previous report.
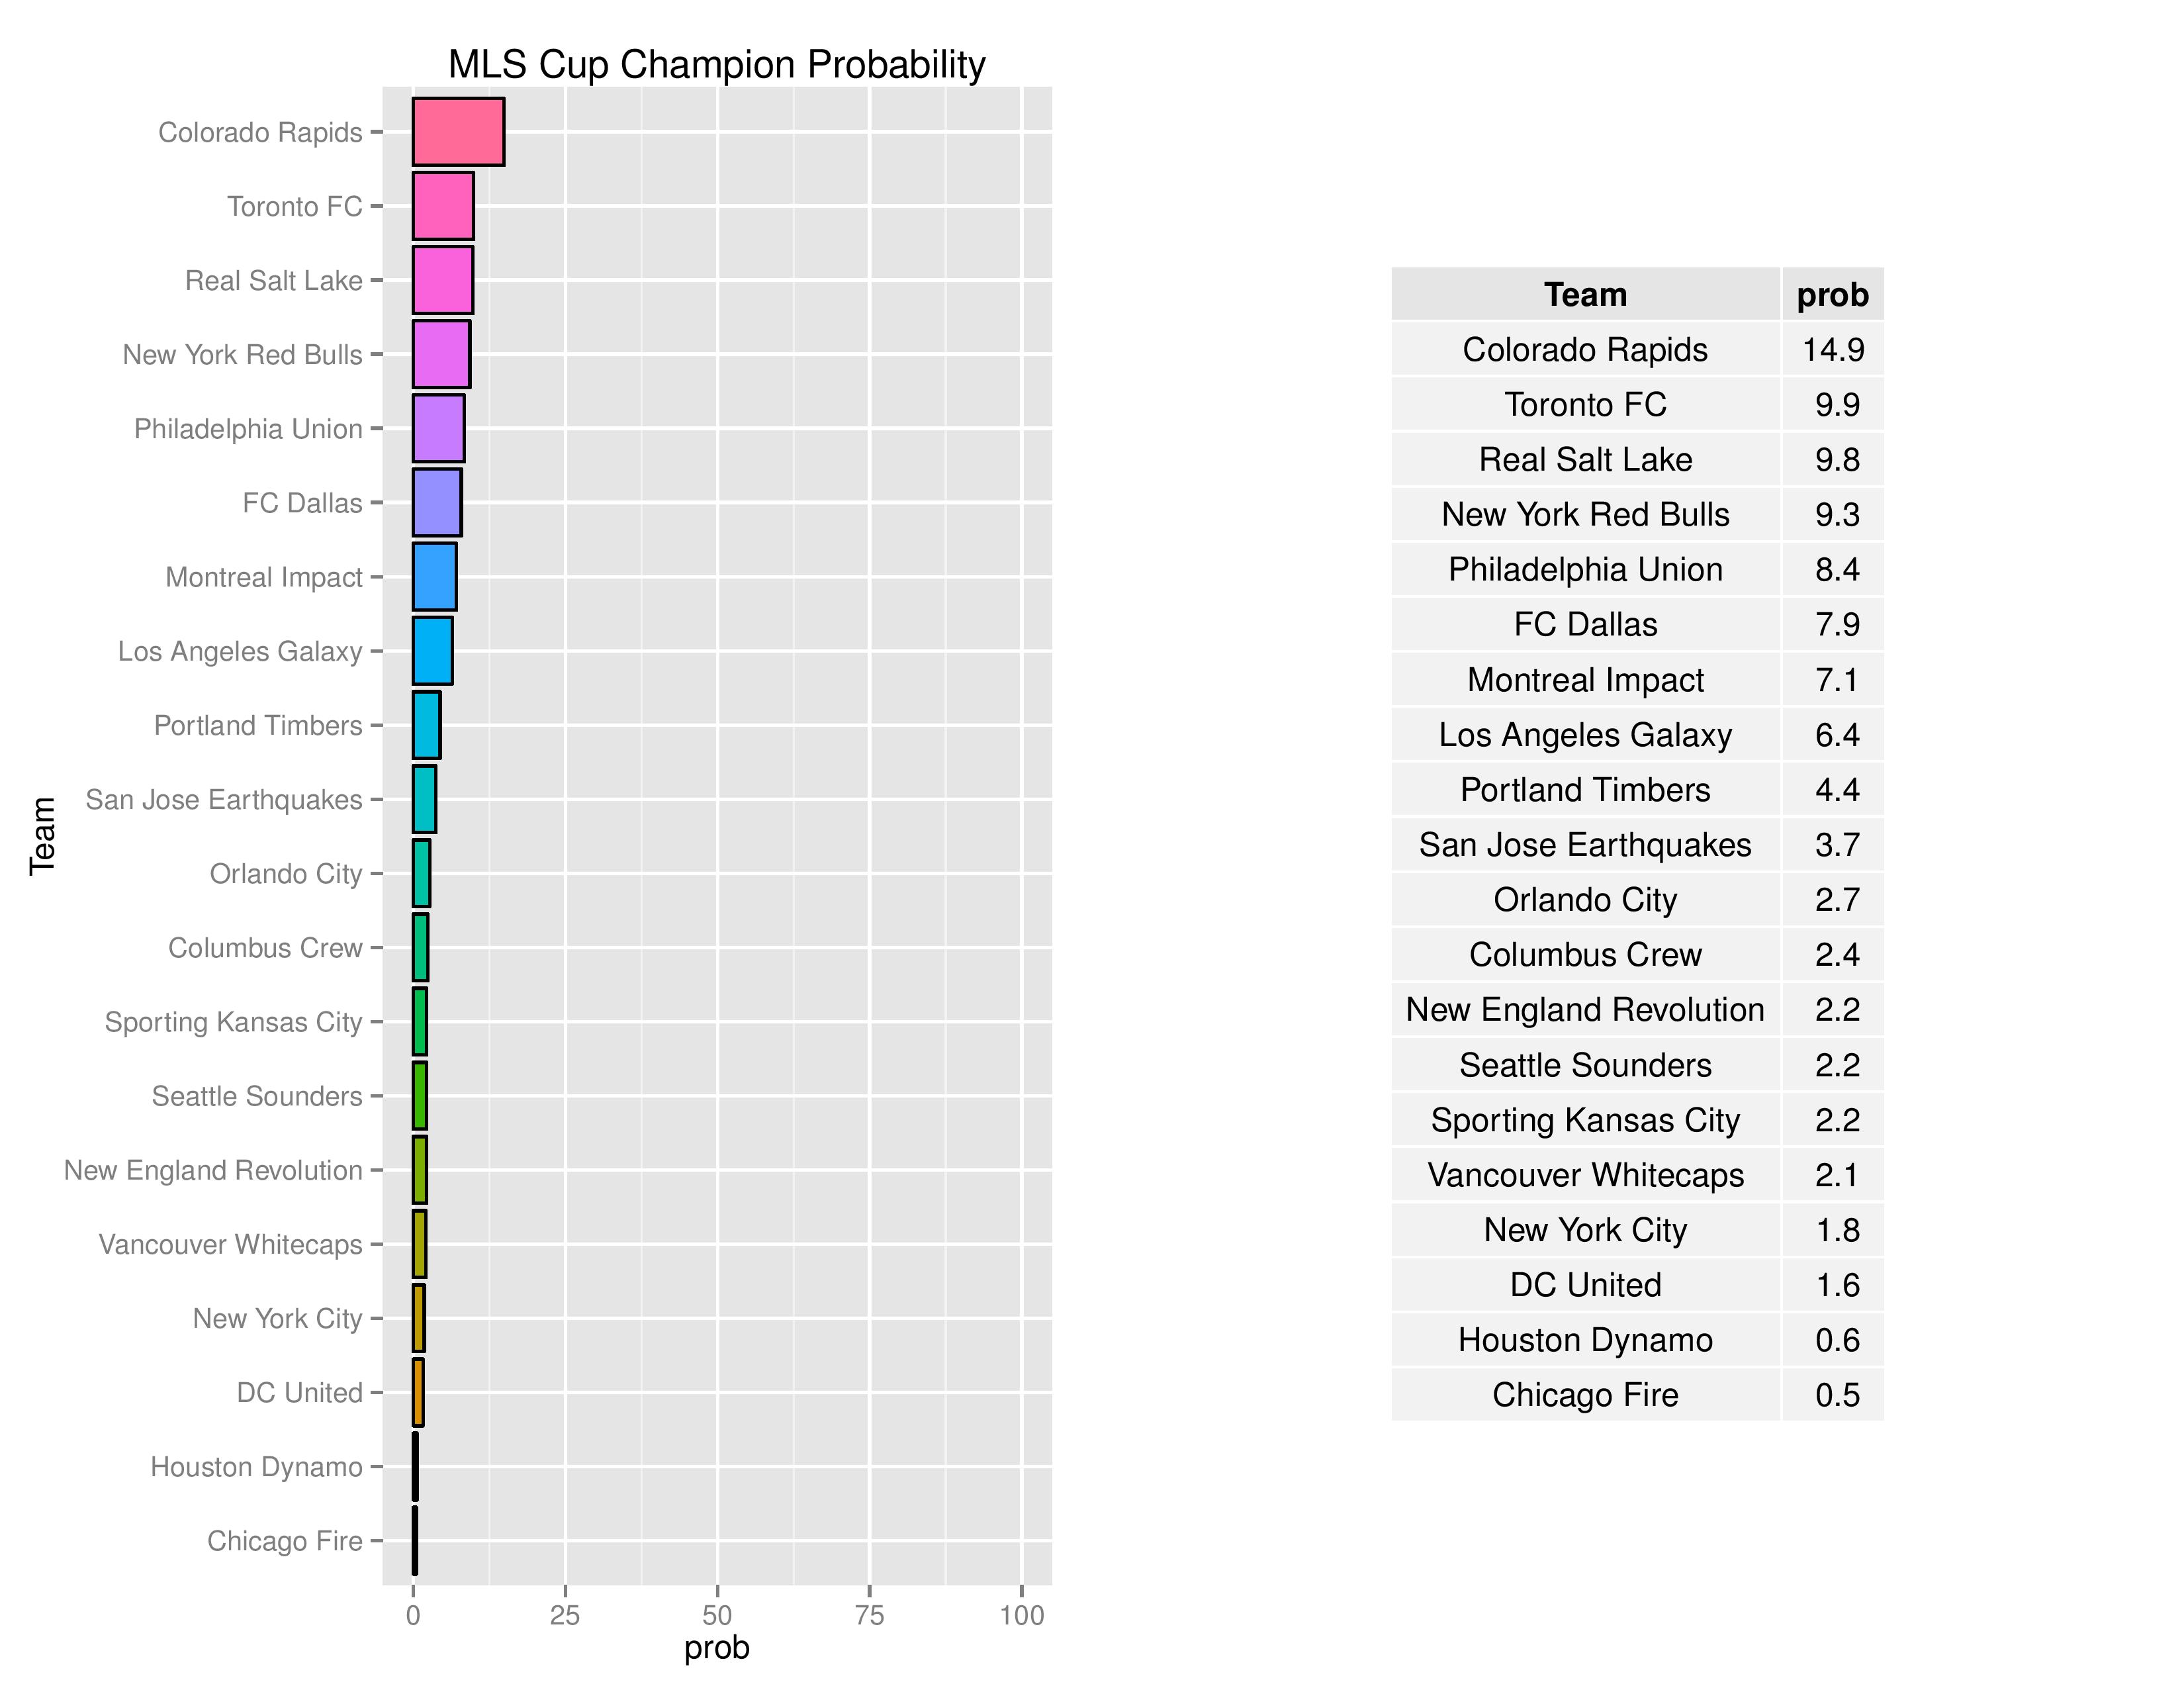
The Union decreased their odds from 9.2% last week to 8.4%. The Union moved ahead of Dallas here but behind Toronto and NYRB.
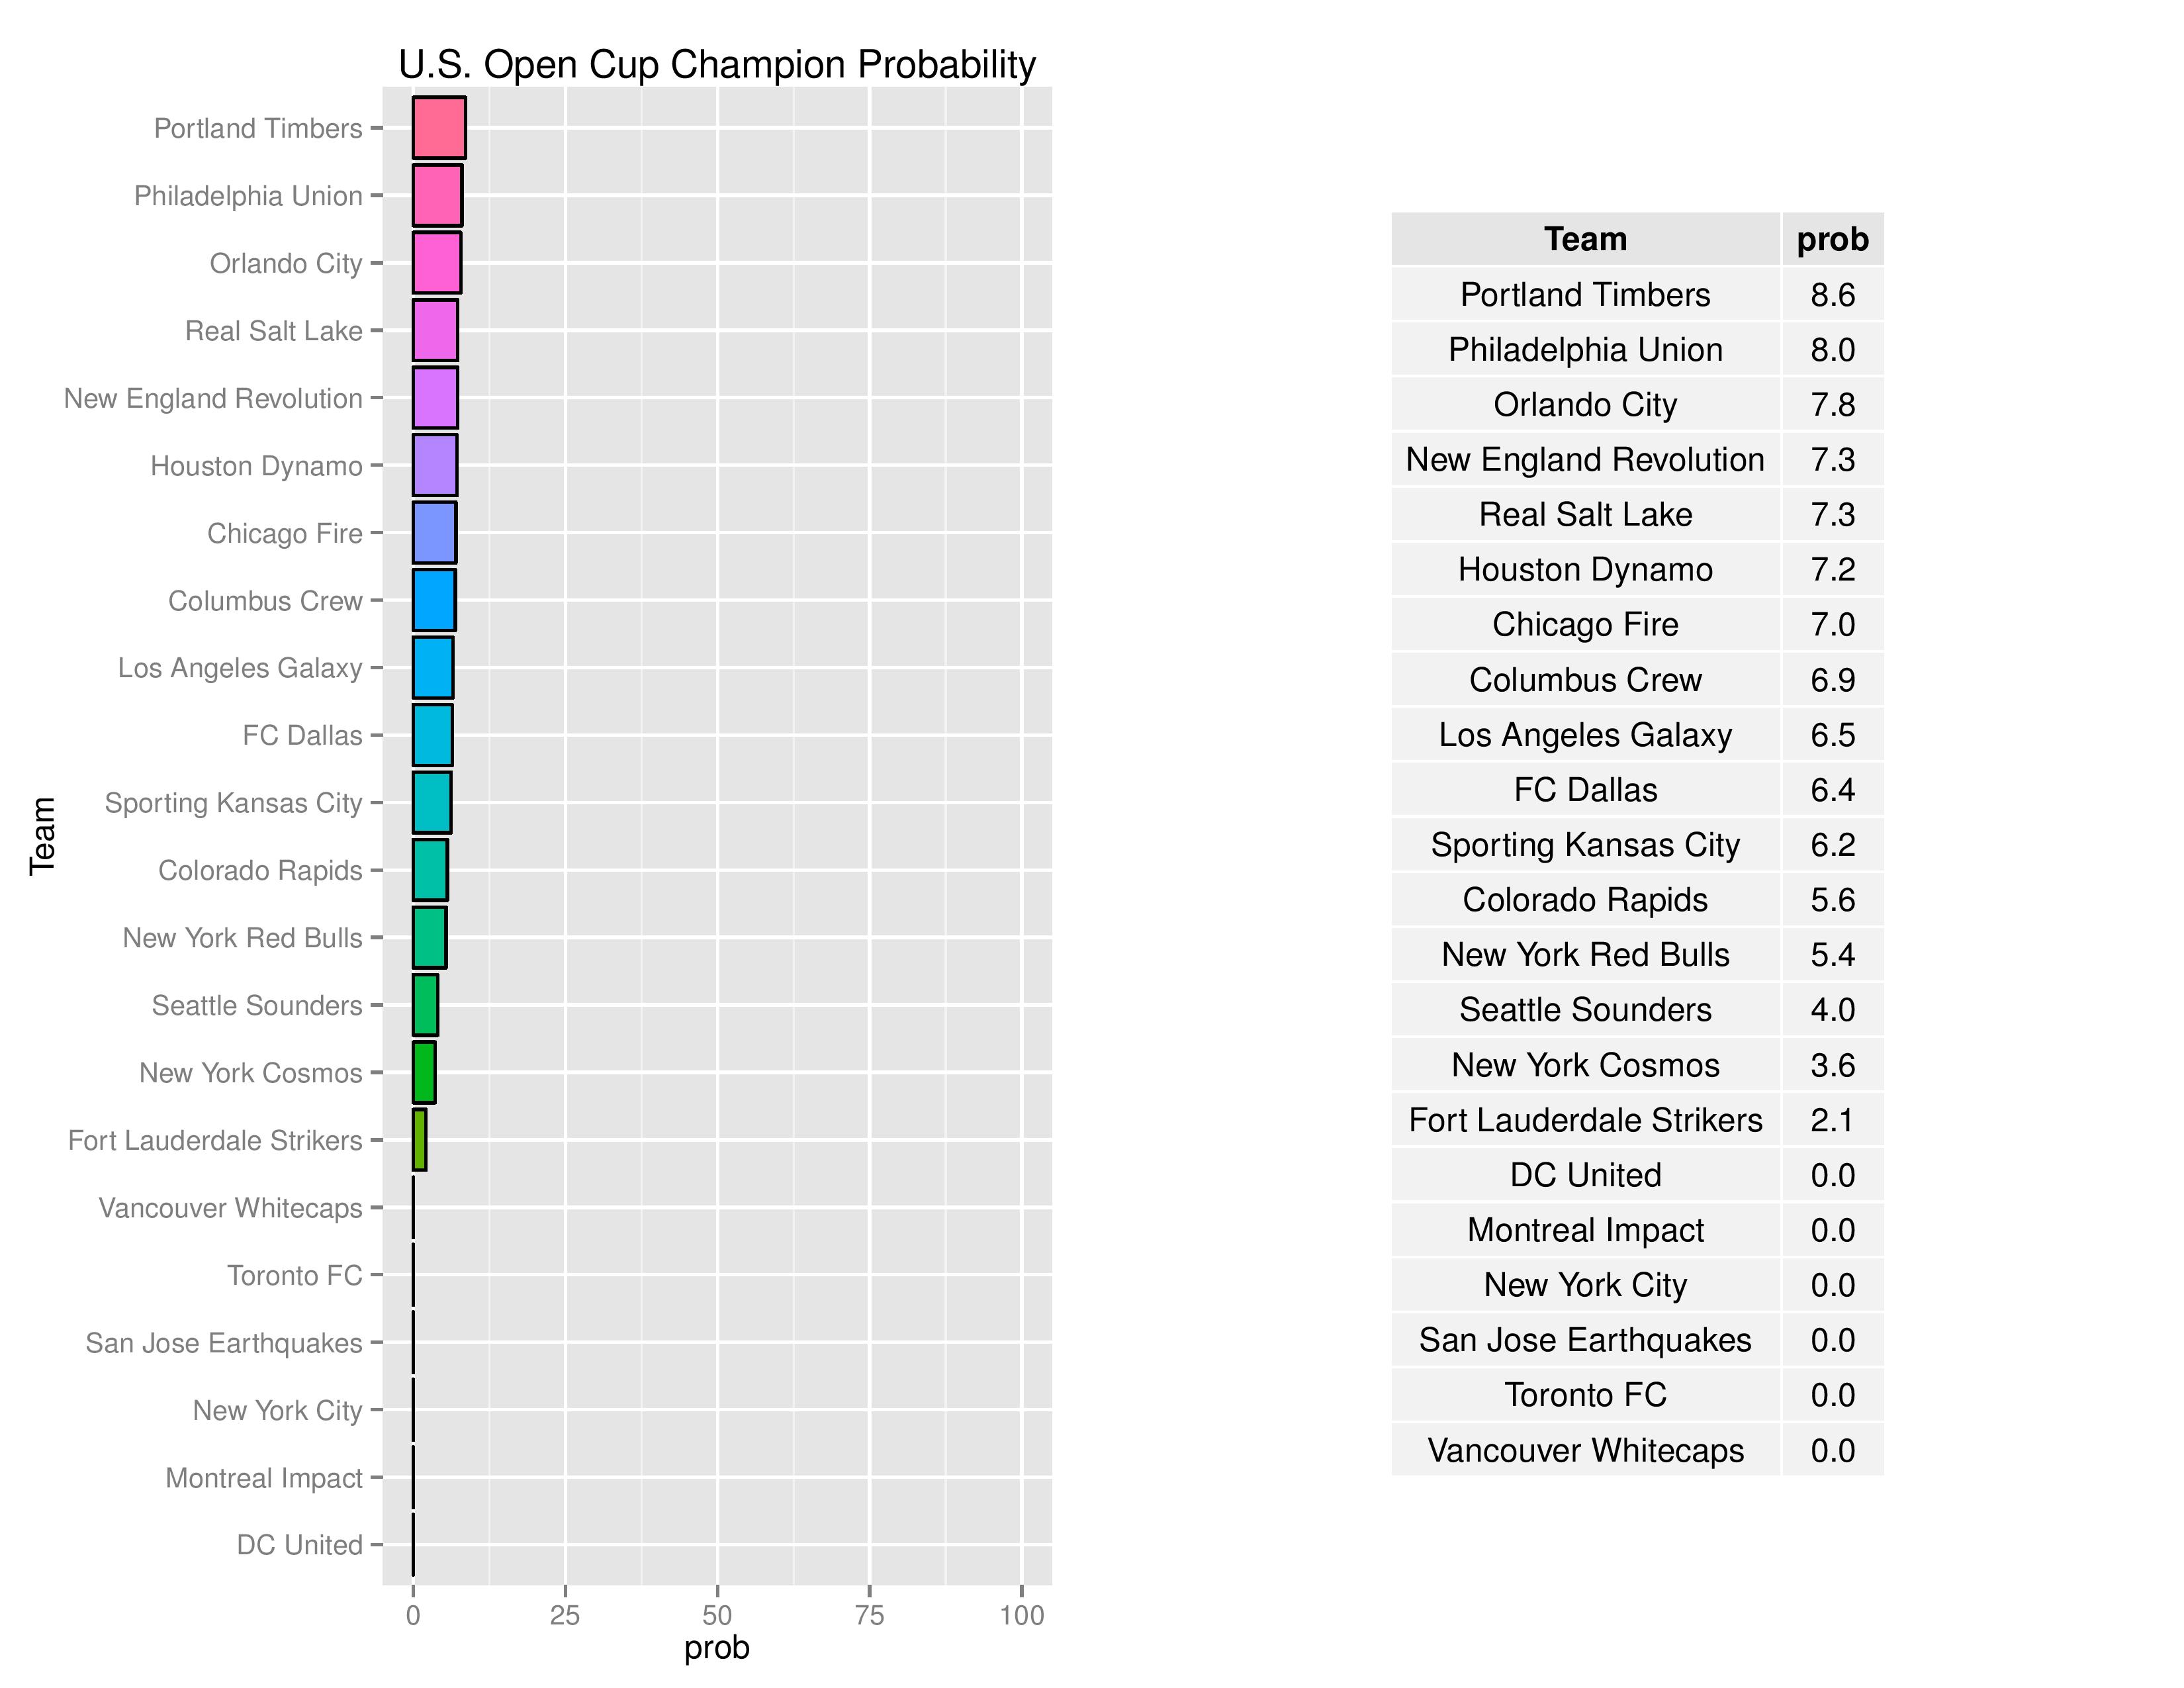
Philadelphia moved up from 5.7% last report to 8.0% in the probability to win the US Open Cup. In addition to winning against Harrisburg City, the draw (Home against NYRB, Away against Revolution/Cosmos, and then against Chicago/Columbus/Orlando/Fort Lauderdale) is more immediately favorable to the Union than other teams, especially Western conference teams, will have.
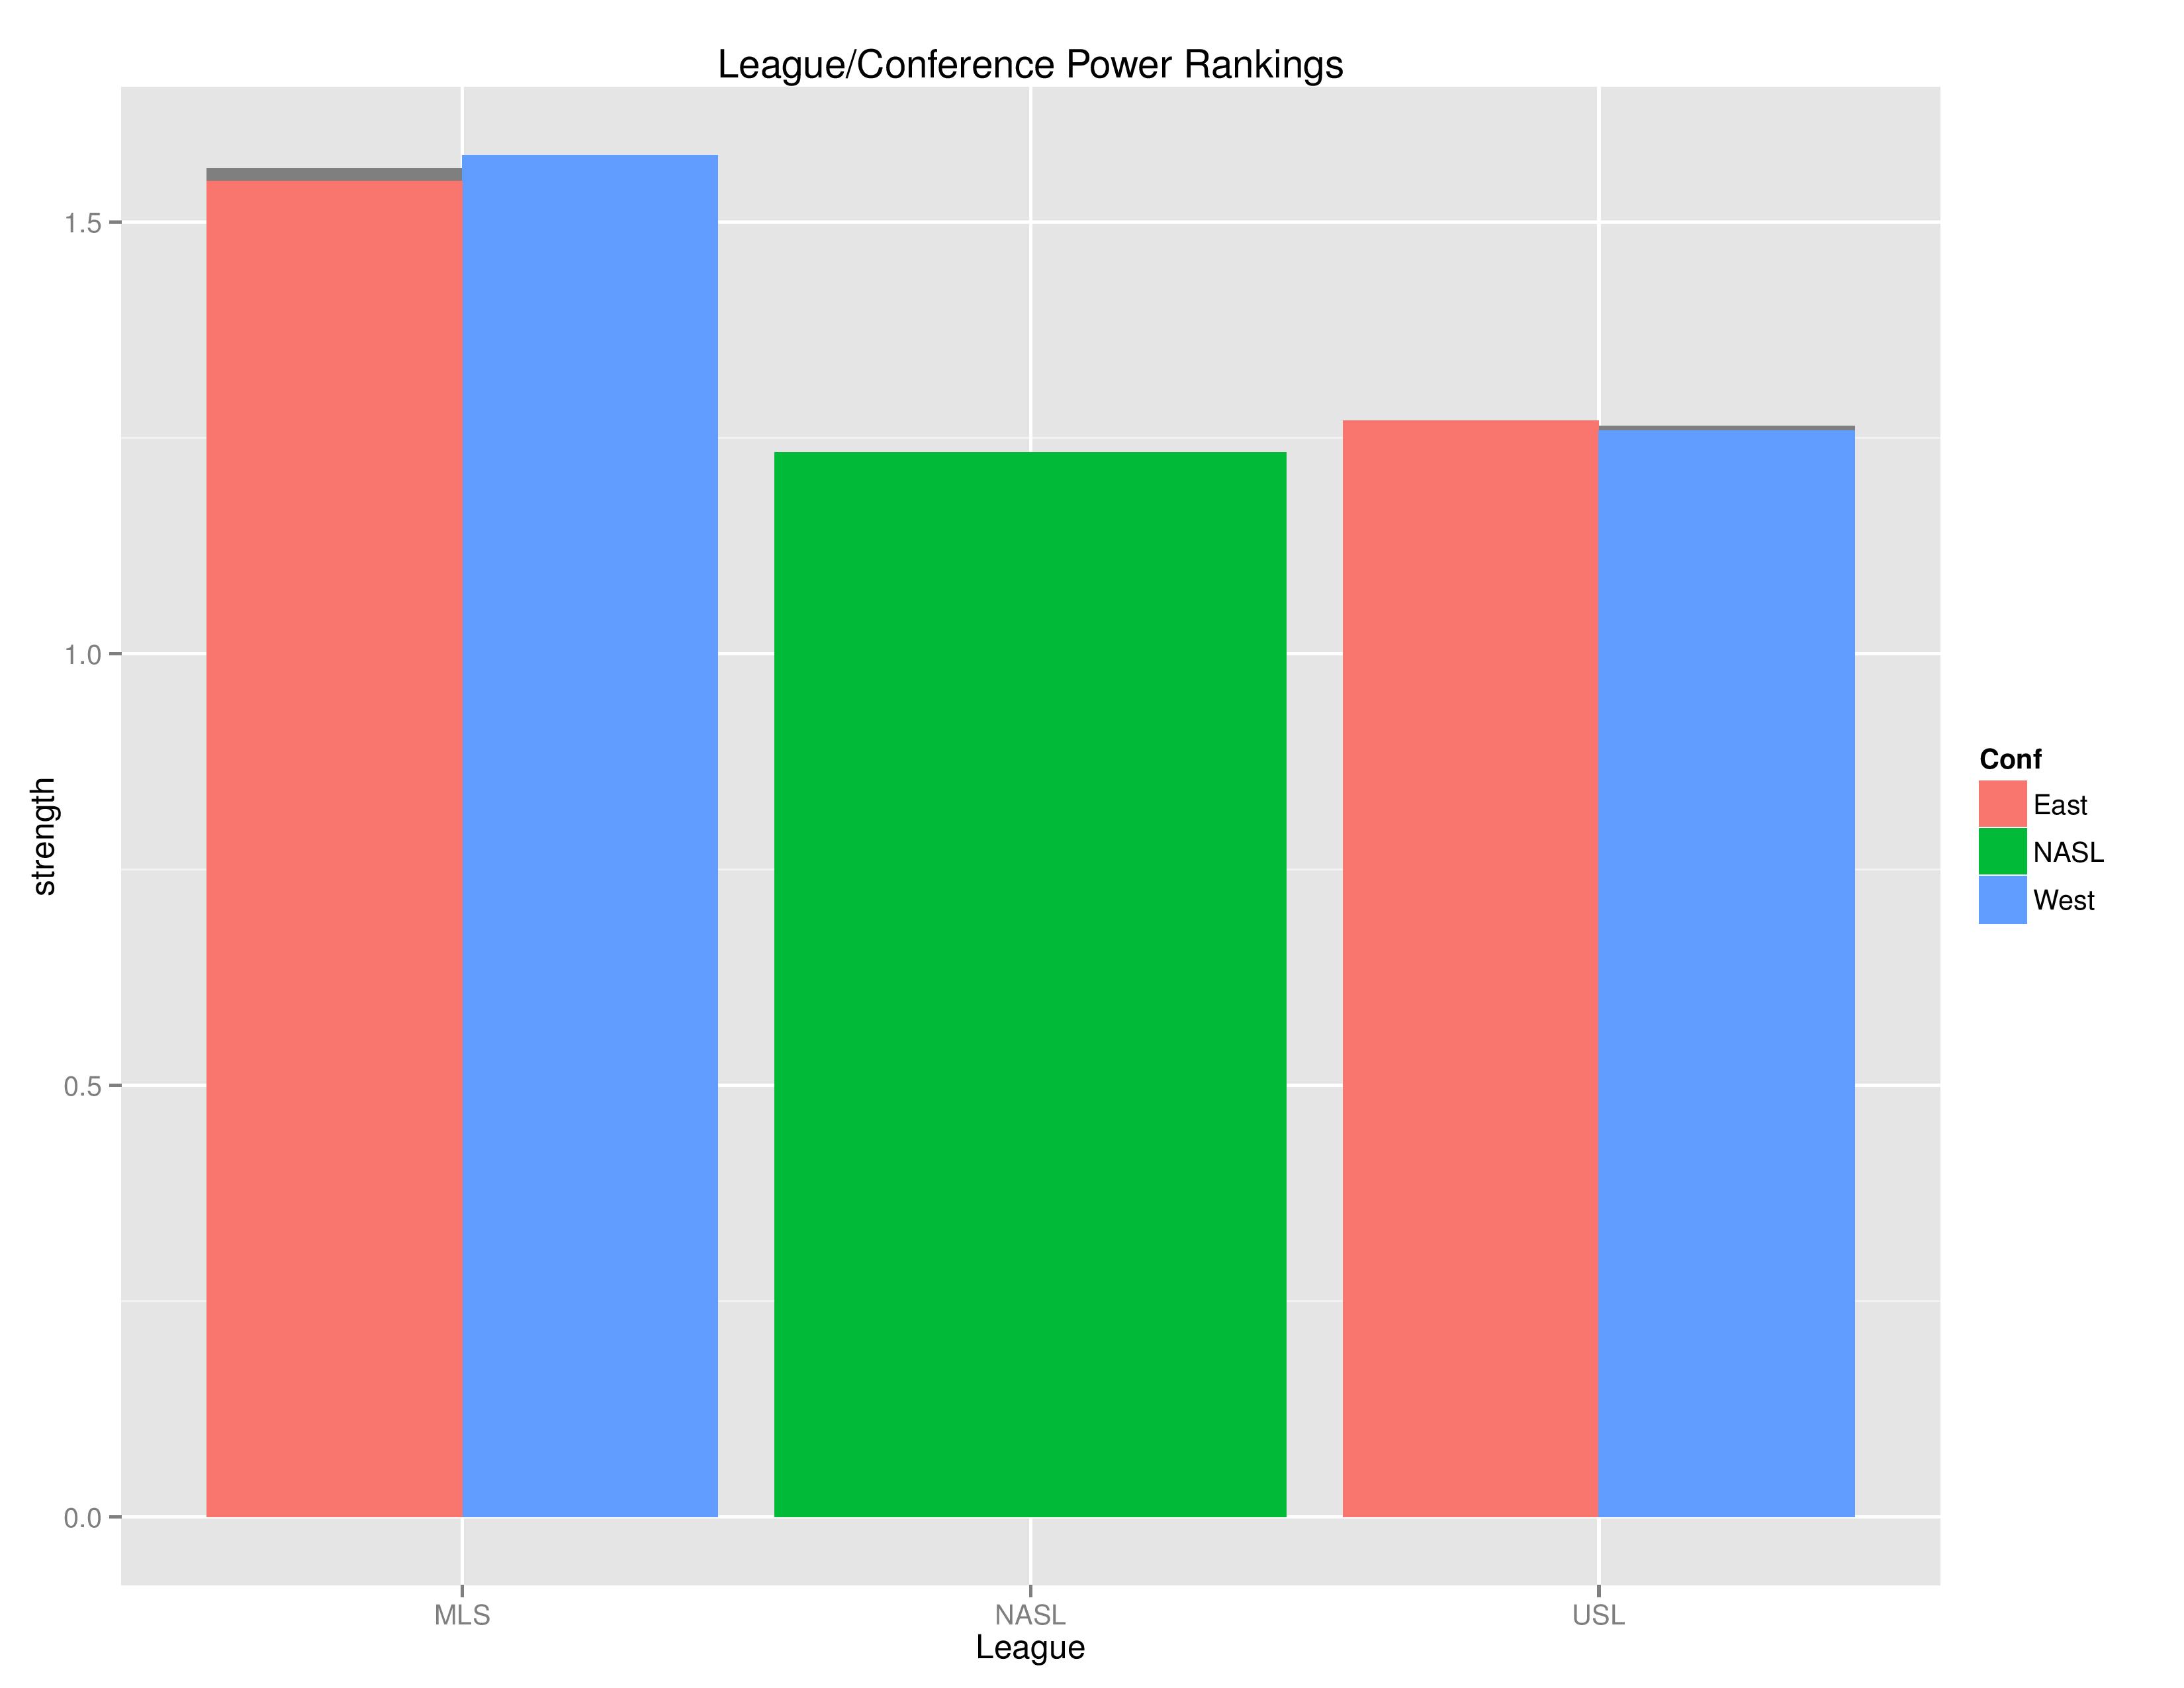
The above shows how the model rates each U.S. league & conference compared to one another. This is based on an all vs. all assessment rather than a top vs. top assessment. MLS is clearly rated as superior to either NASL or USL. USL has a slight edge over NASL though despite NASL still having two teams available in the USOC. This also shows the MLS-West outperforming MLS-East and USL-East slightly outperforming USL-West.
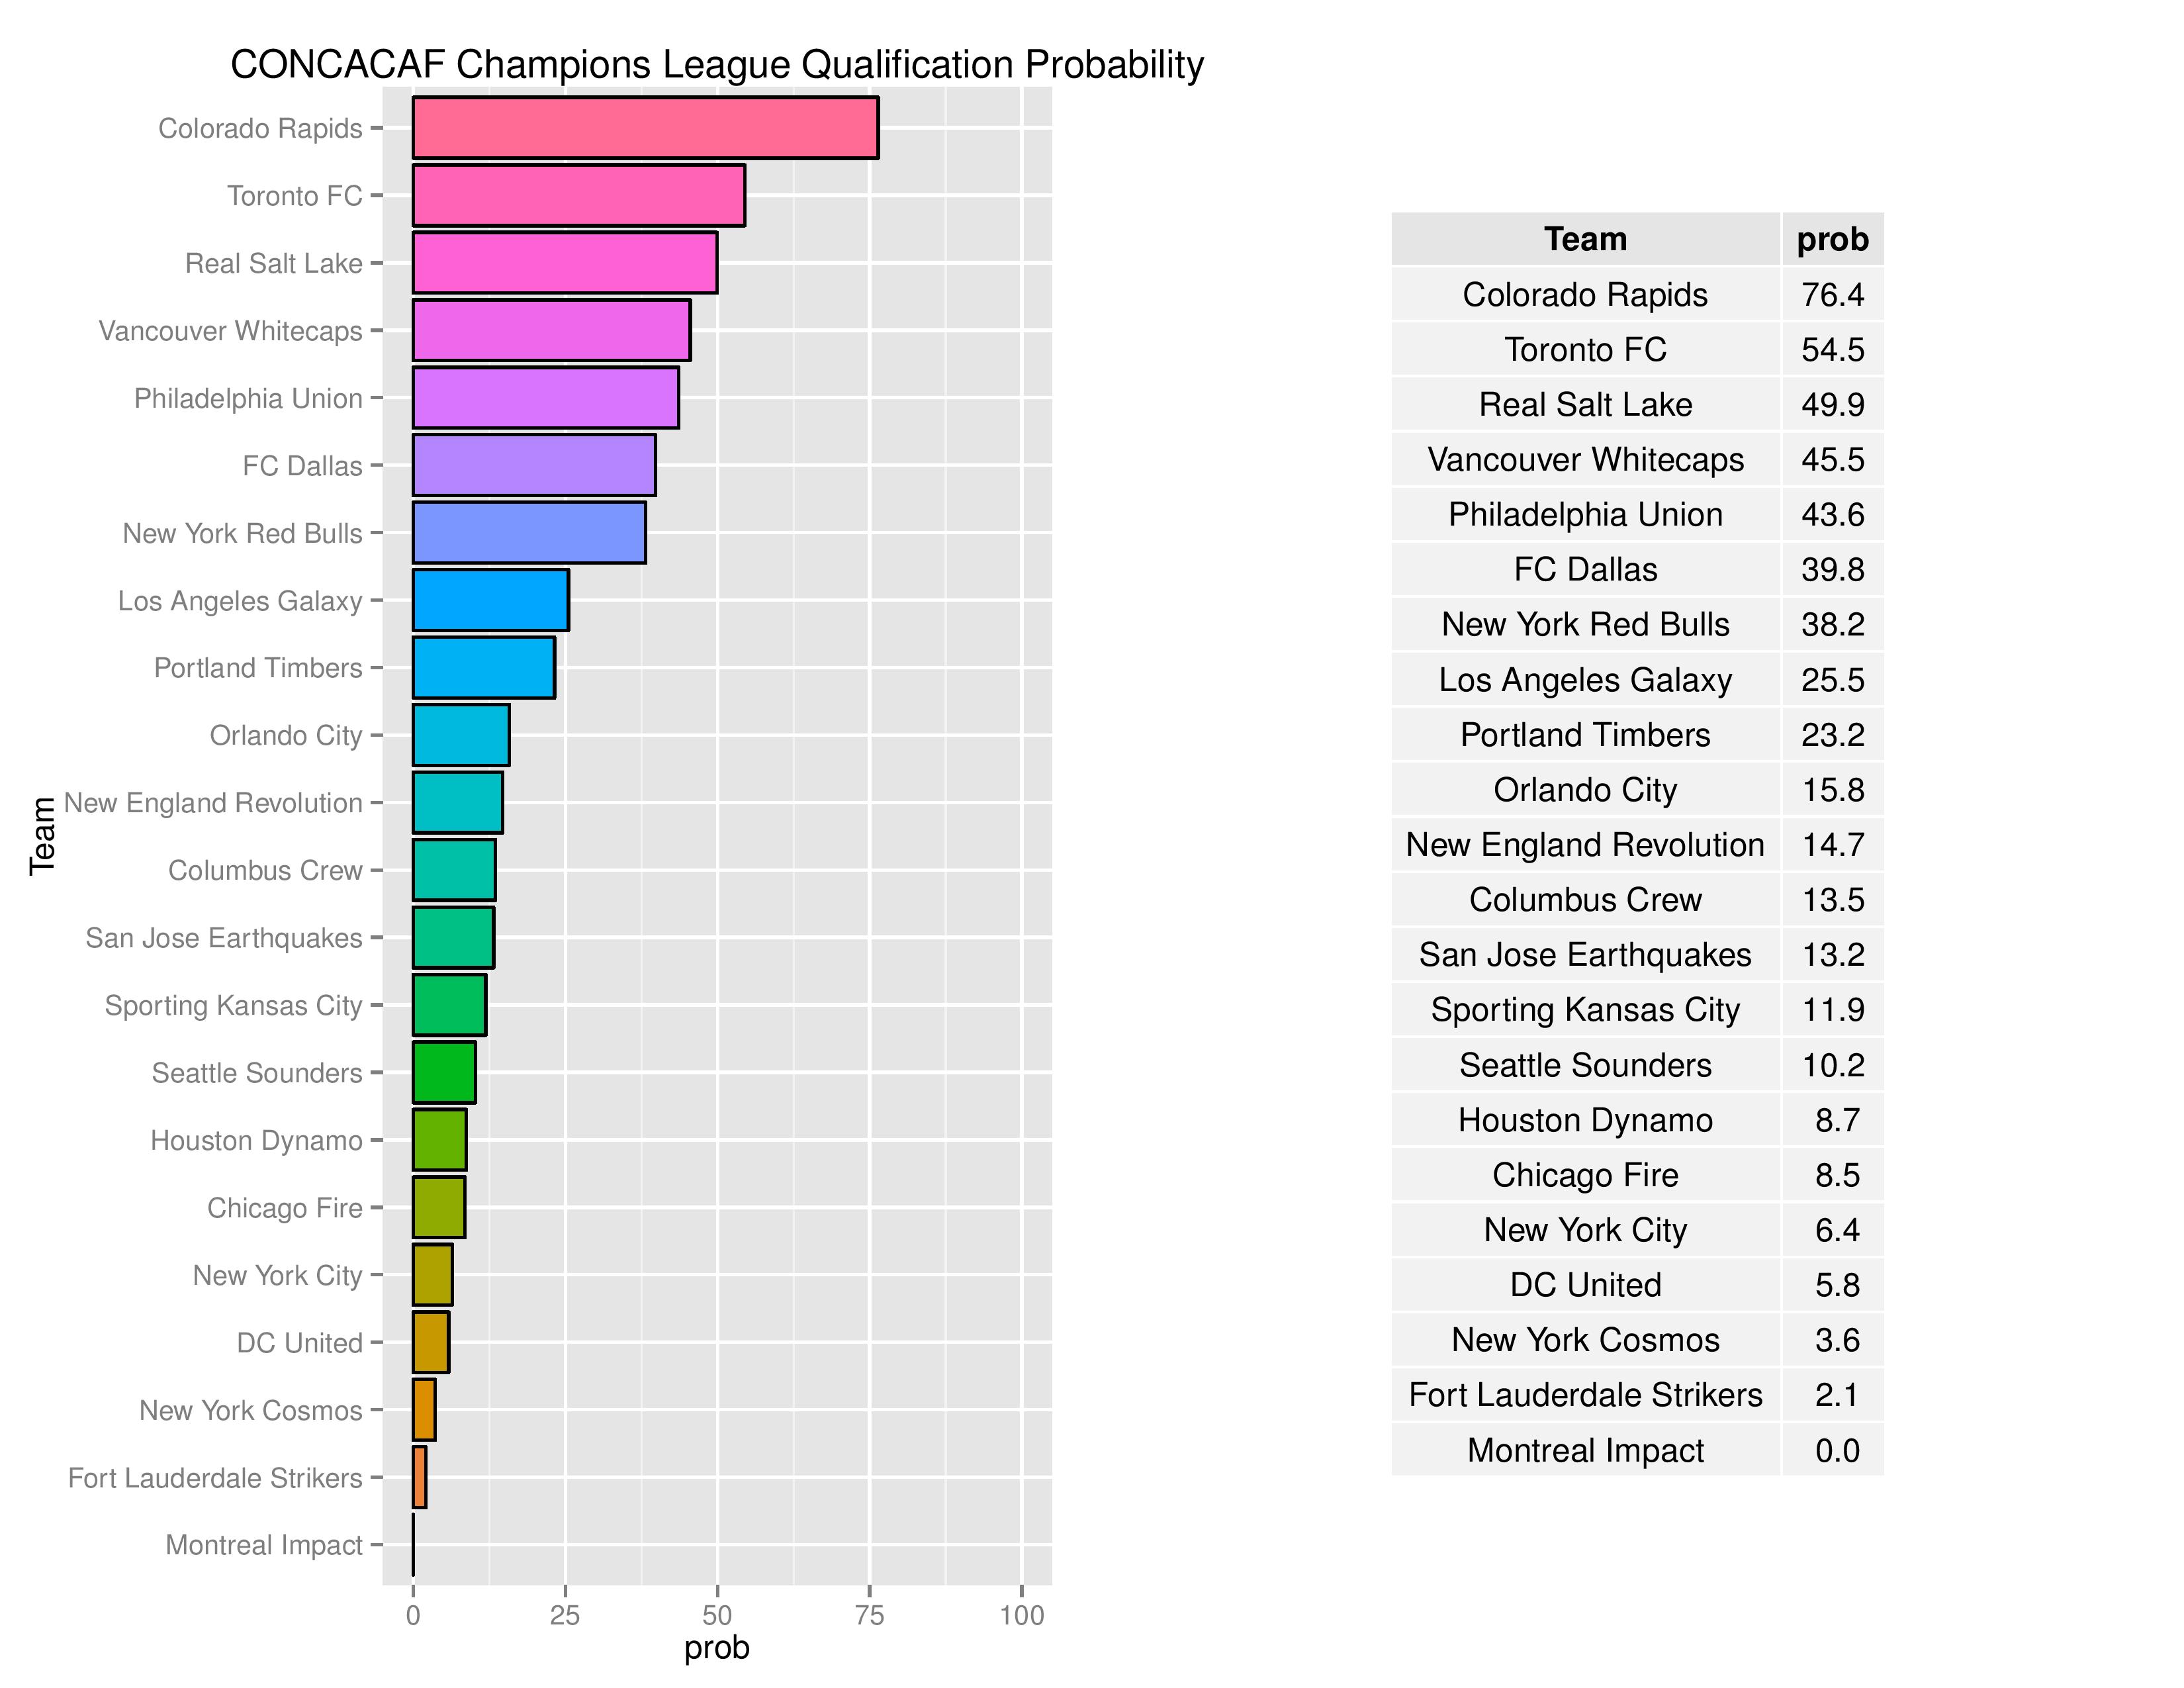
Philadelphia’s probability of qualifying for the CCL stumbled from 49.7% to 43.6%. As a reminder, U.S. teams qualify for the CCL by winning the MLS Cup, winning a conference in the regular season (including Supporters’ Shield), and by winning the U.S. Open Cup (or being a top single-table-performer if the former qualifications don’t count for 4 slots). Canadian teams qualify by winning the Canadian Championship.
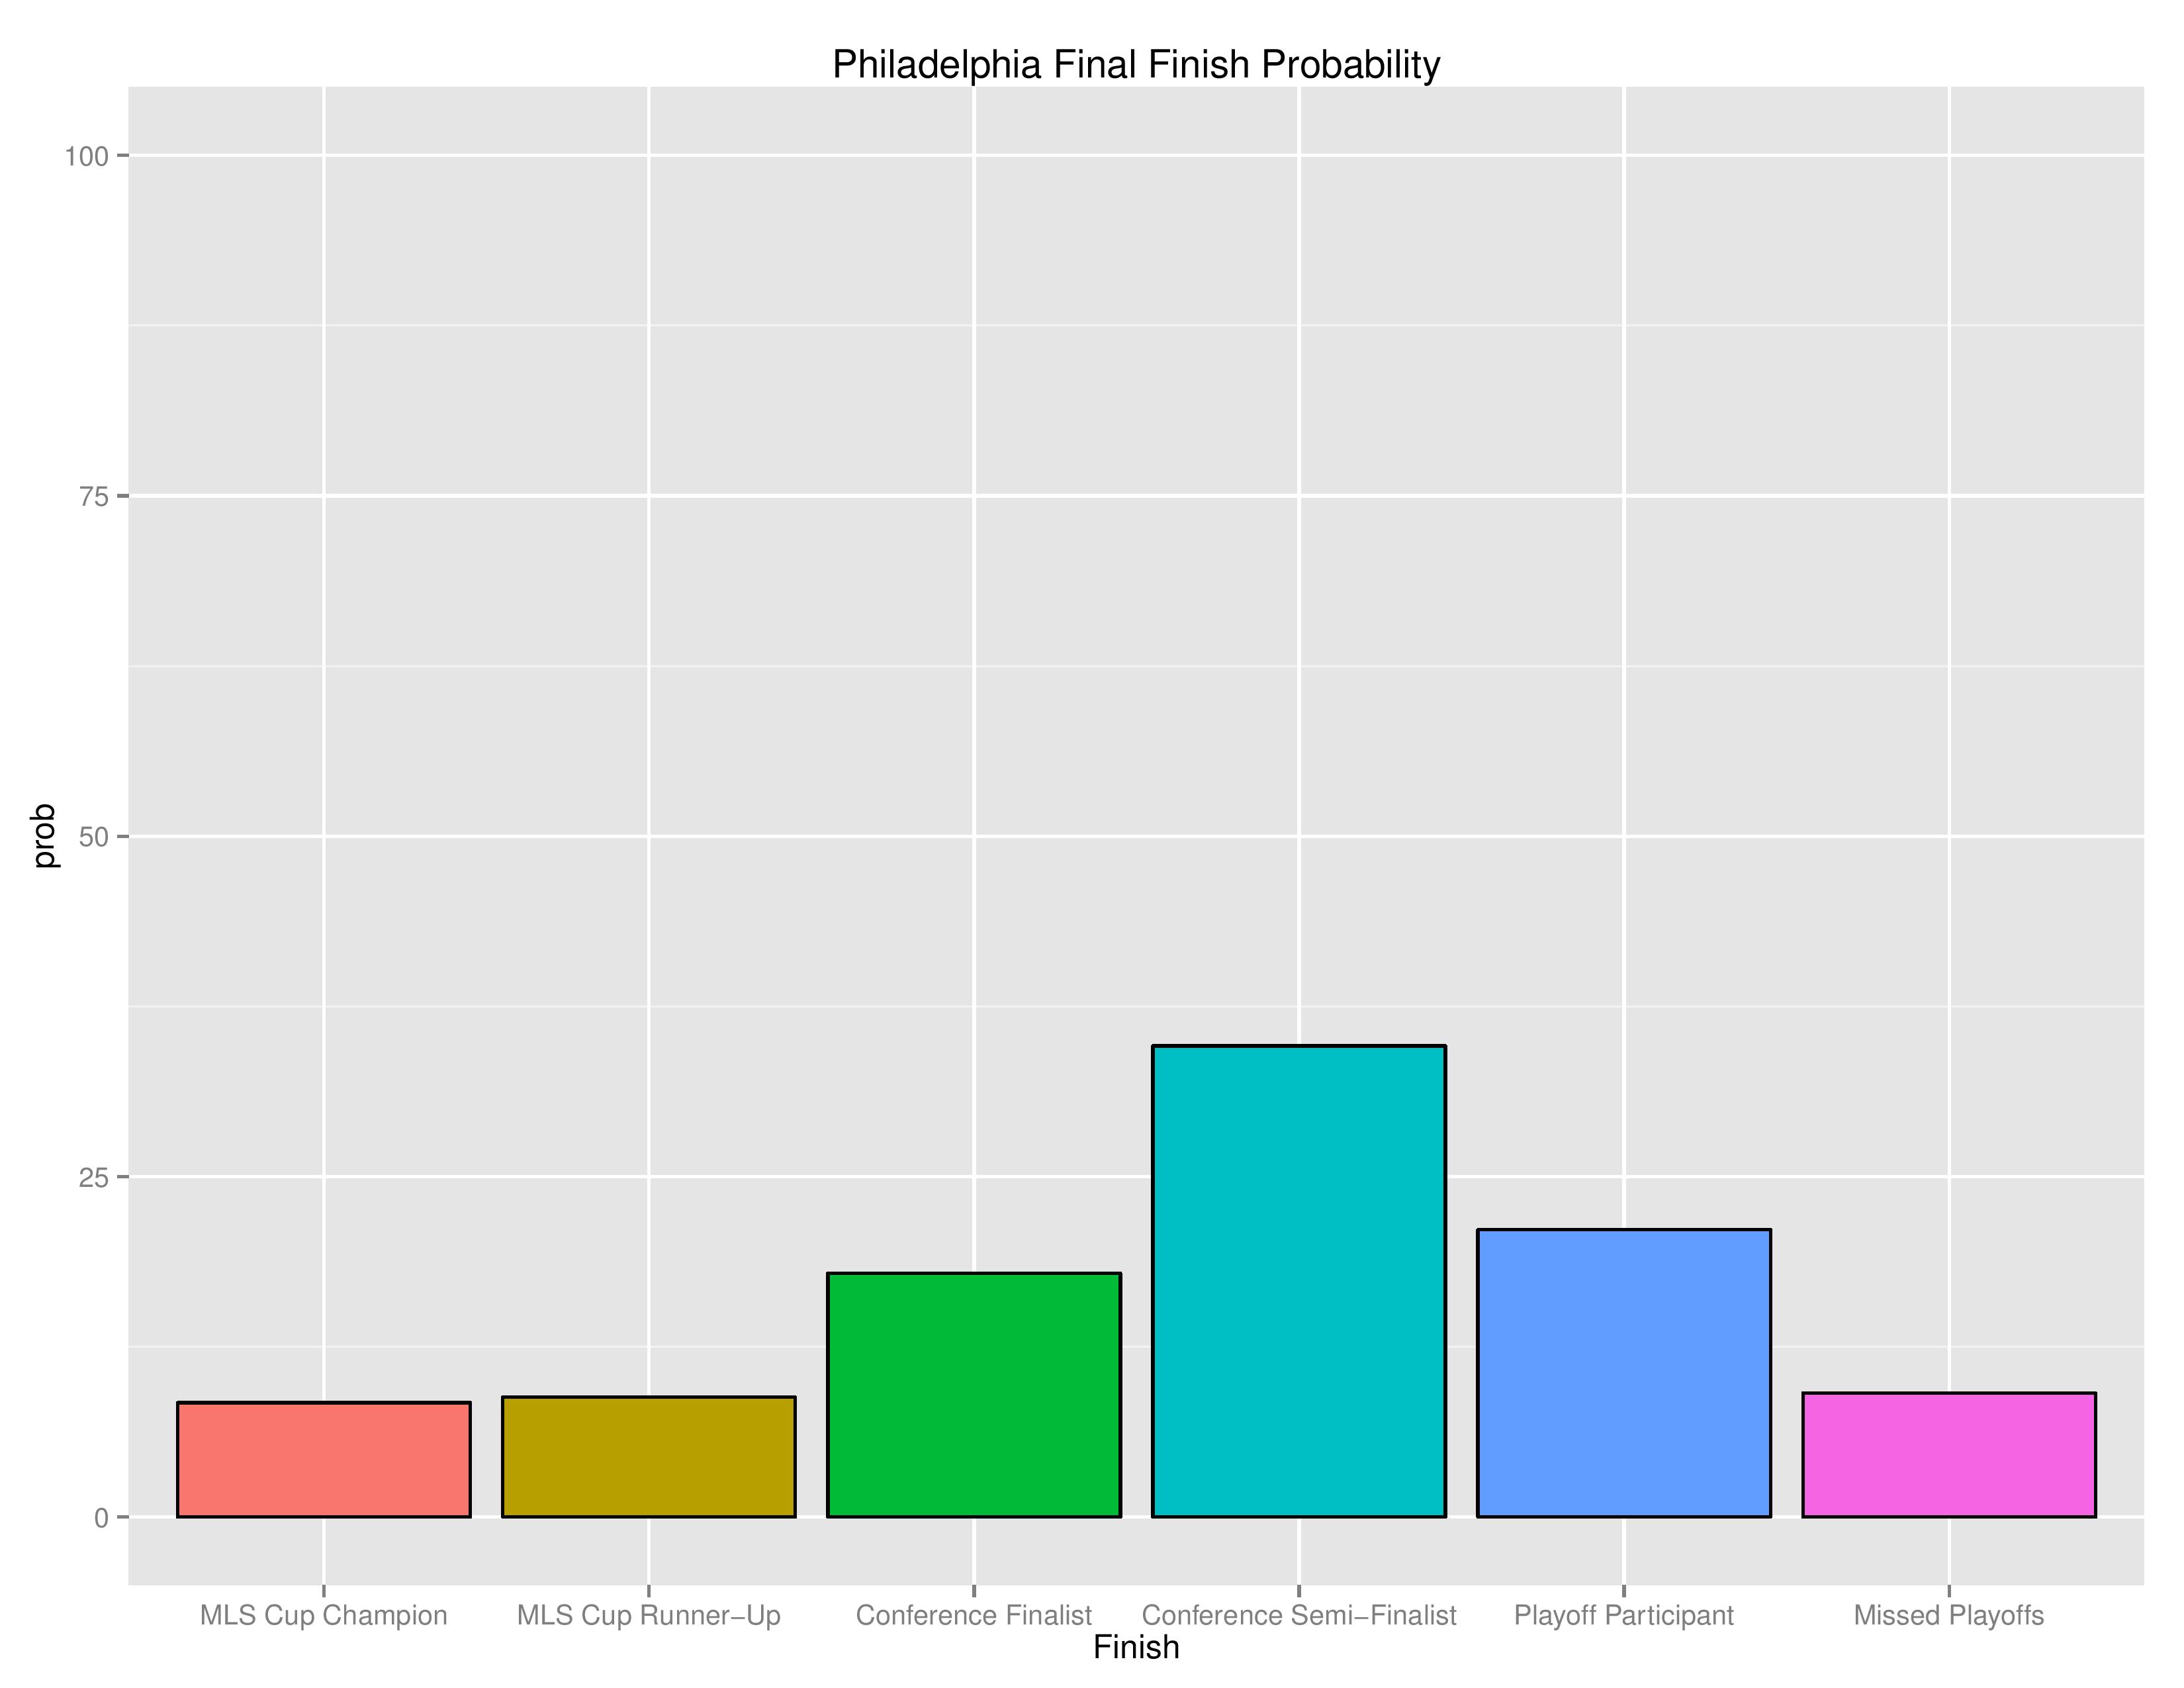
Philadelphia finishing
The following shows the probability of various Playoff categories and Philadelphia’s probability of each of them. Philadelphia no longer has a better chance of winning the MLS Cup (8.4%) than missing the playoffs (9.1%) but it is still very close.
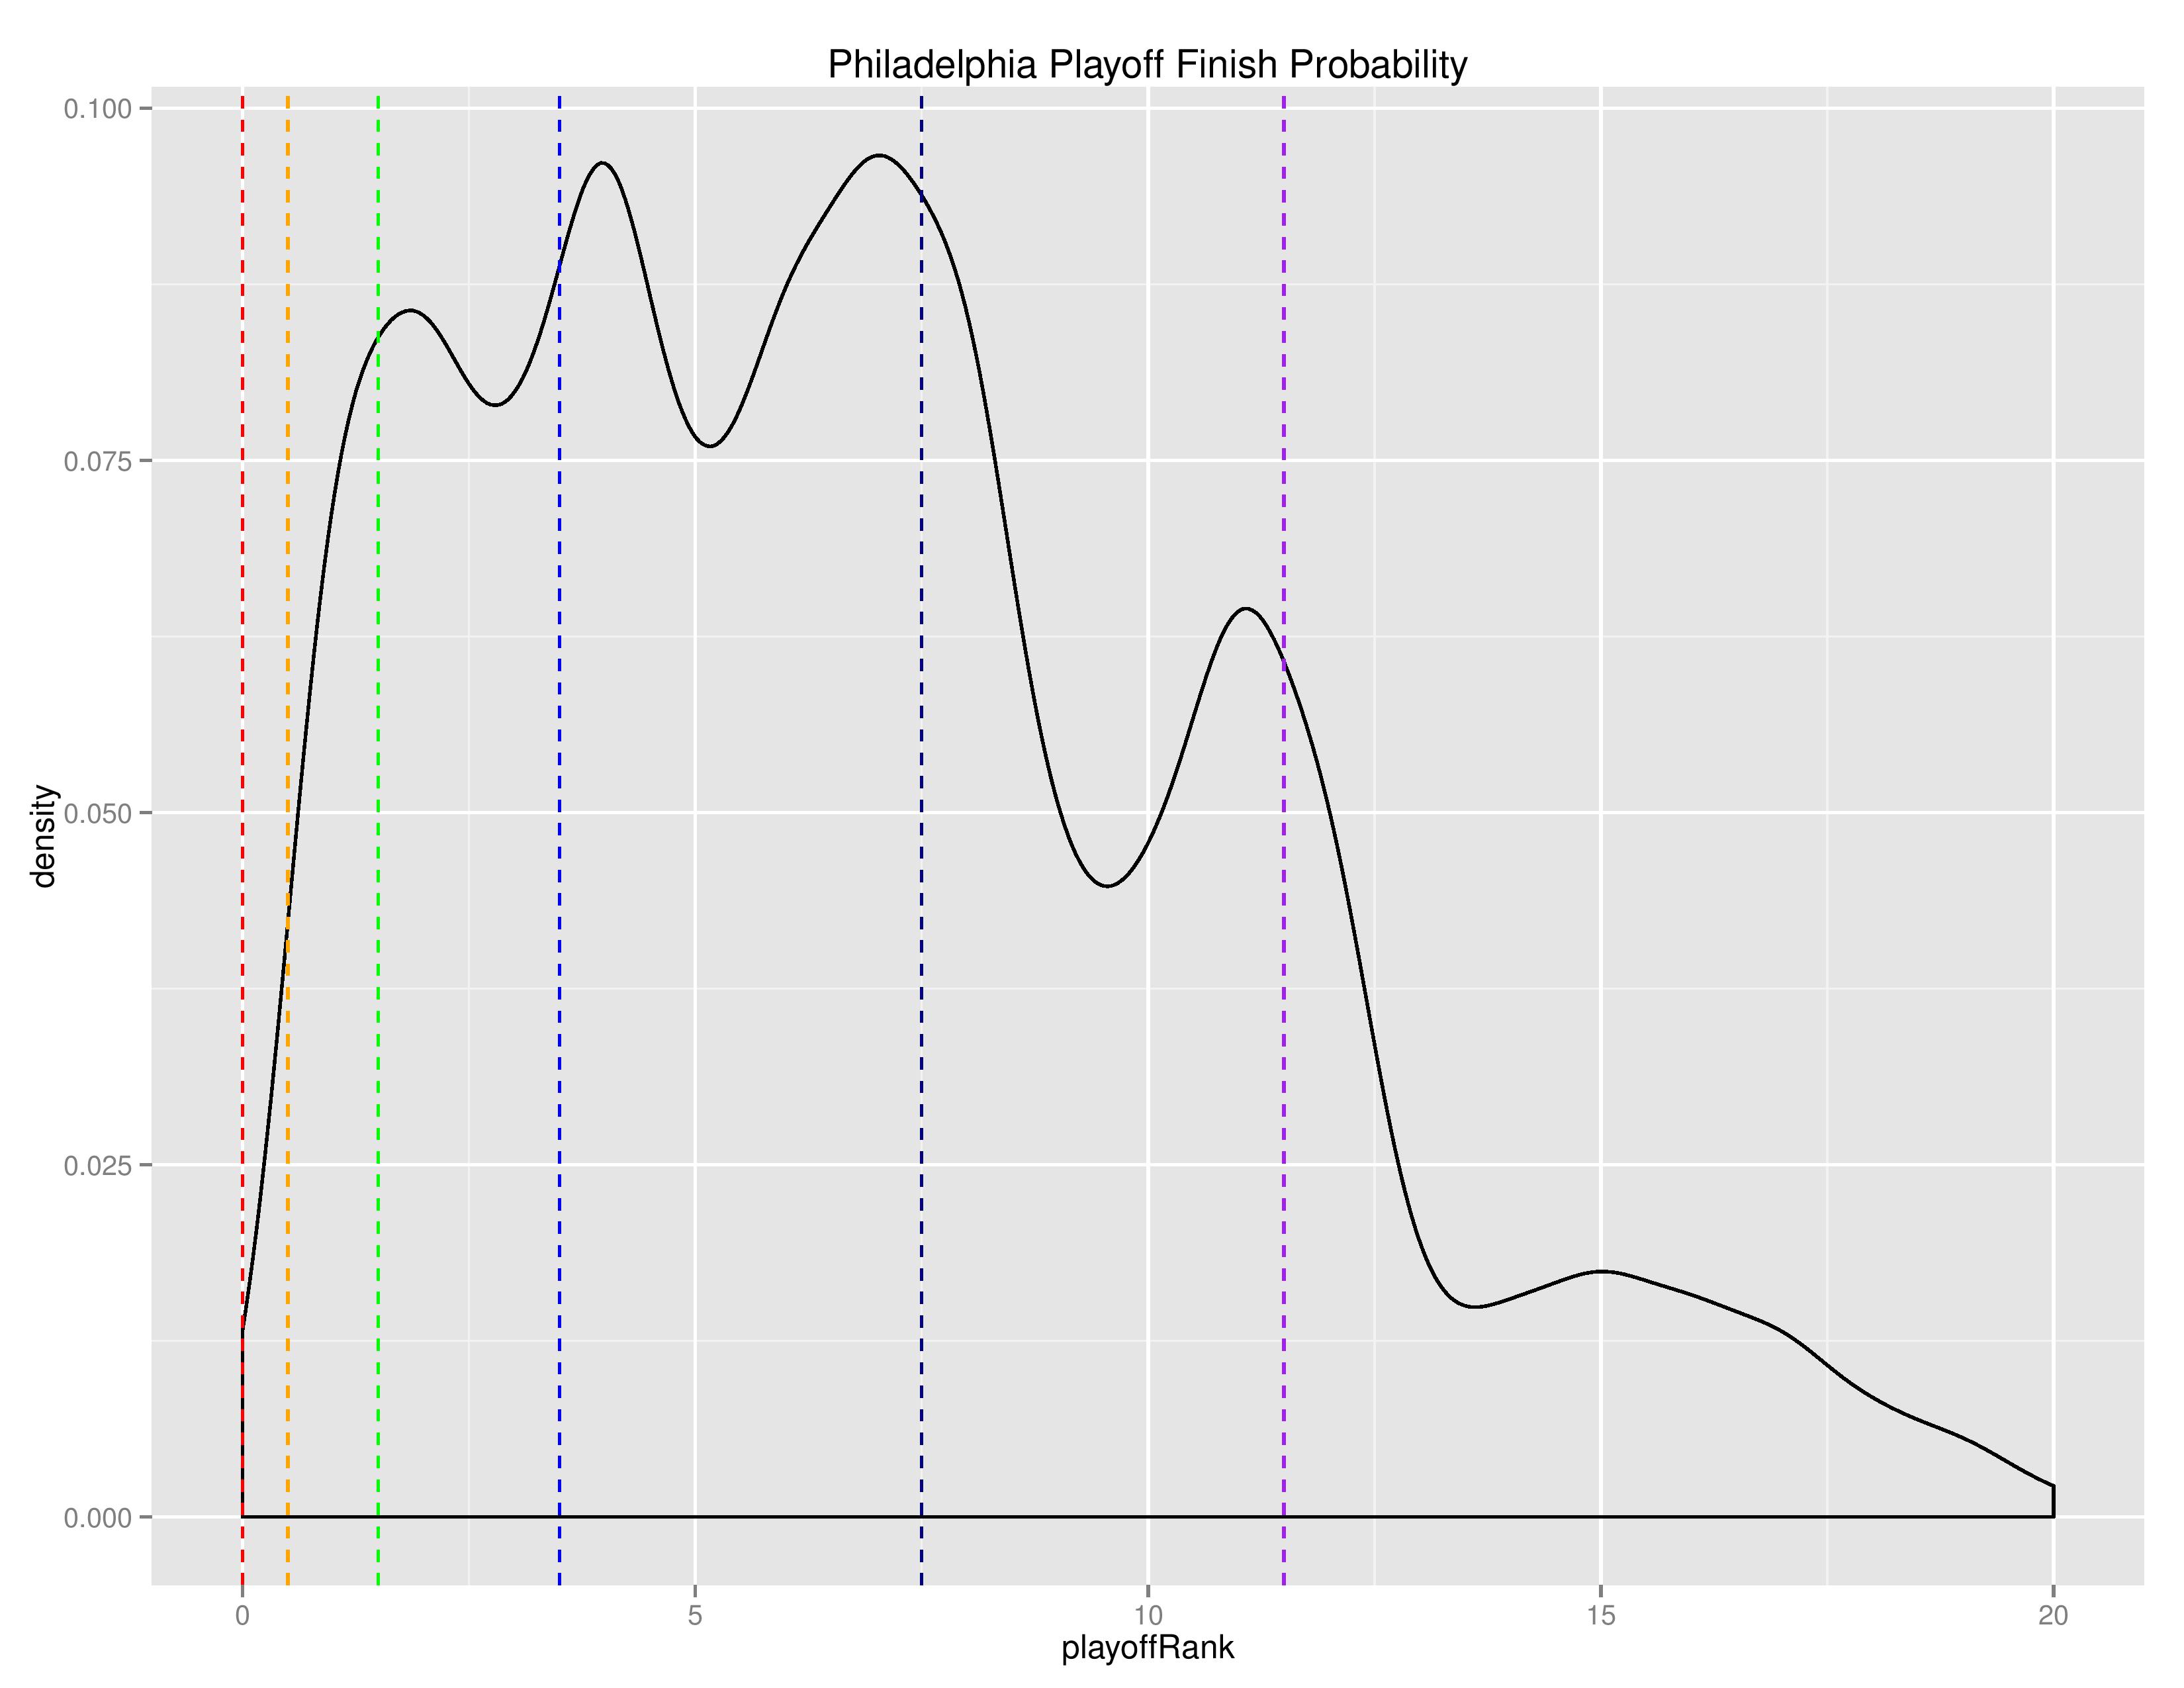
The following is a “density” chart showing the relative probability of Philadelphia finishing at the different after-playoffs rankings from 1 to 20.
To repeat myself, the loopy-ness you see in the higher ranks is likely due to the disparity in conference strength. If Philadelphia finishes in a higher round than a Western team, they are automatically ranked higher, but if they finish in the same round, Philadelphia will often be ranked lower (based on regular season single-table finishing).
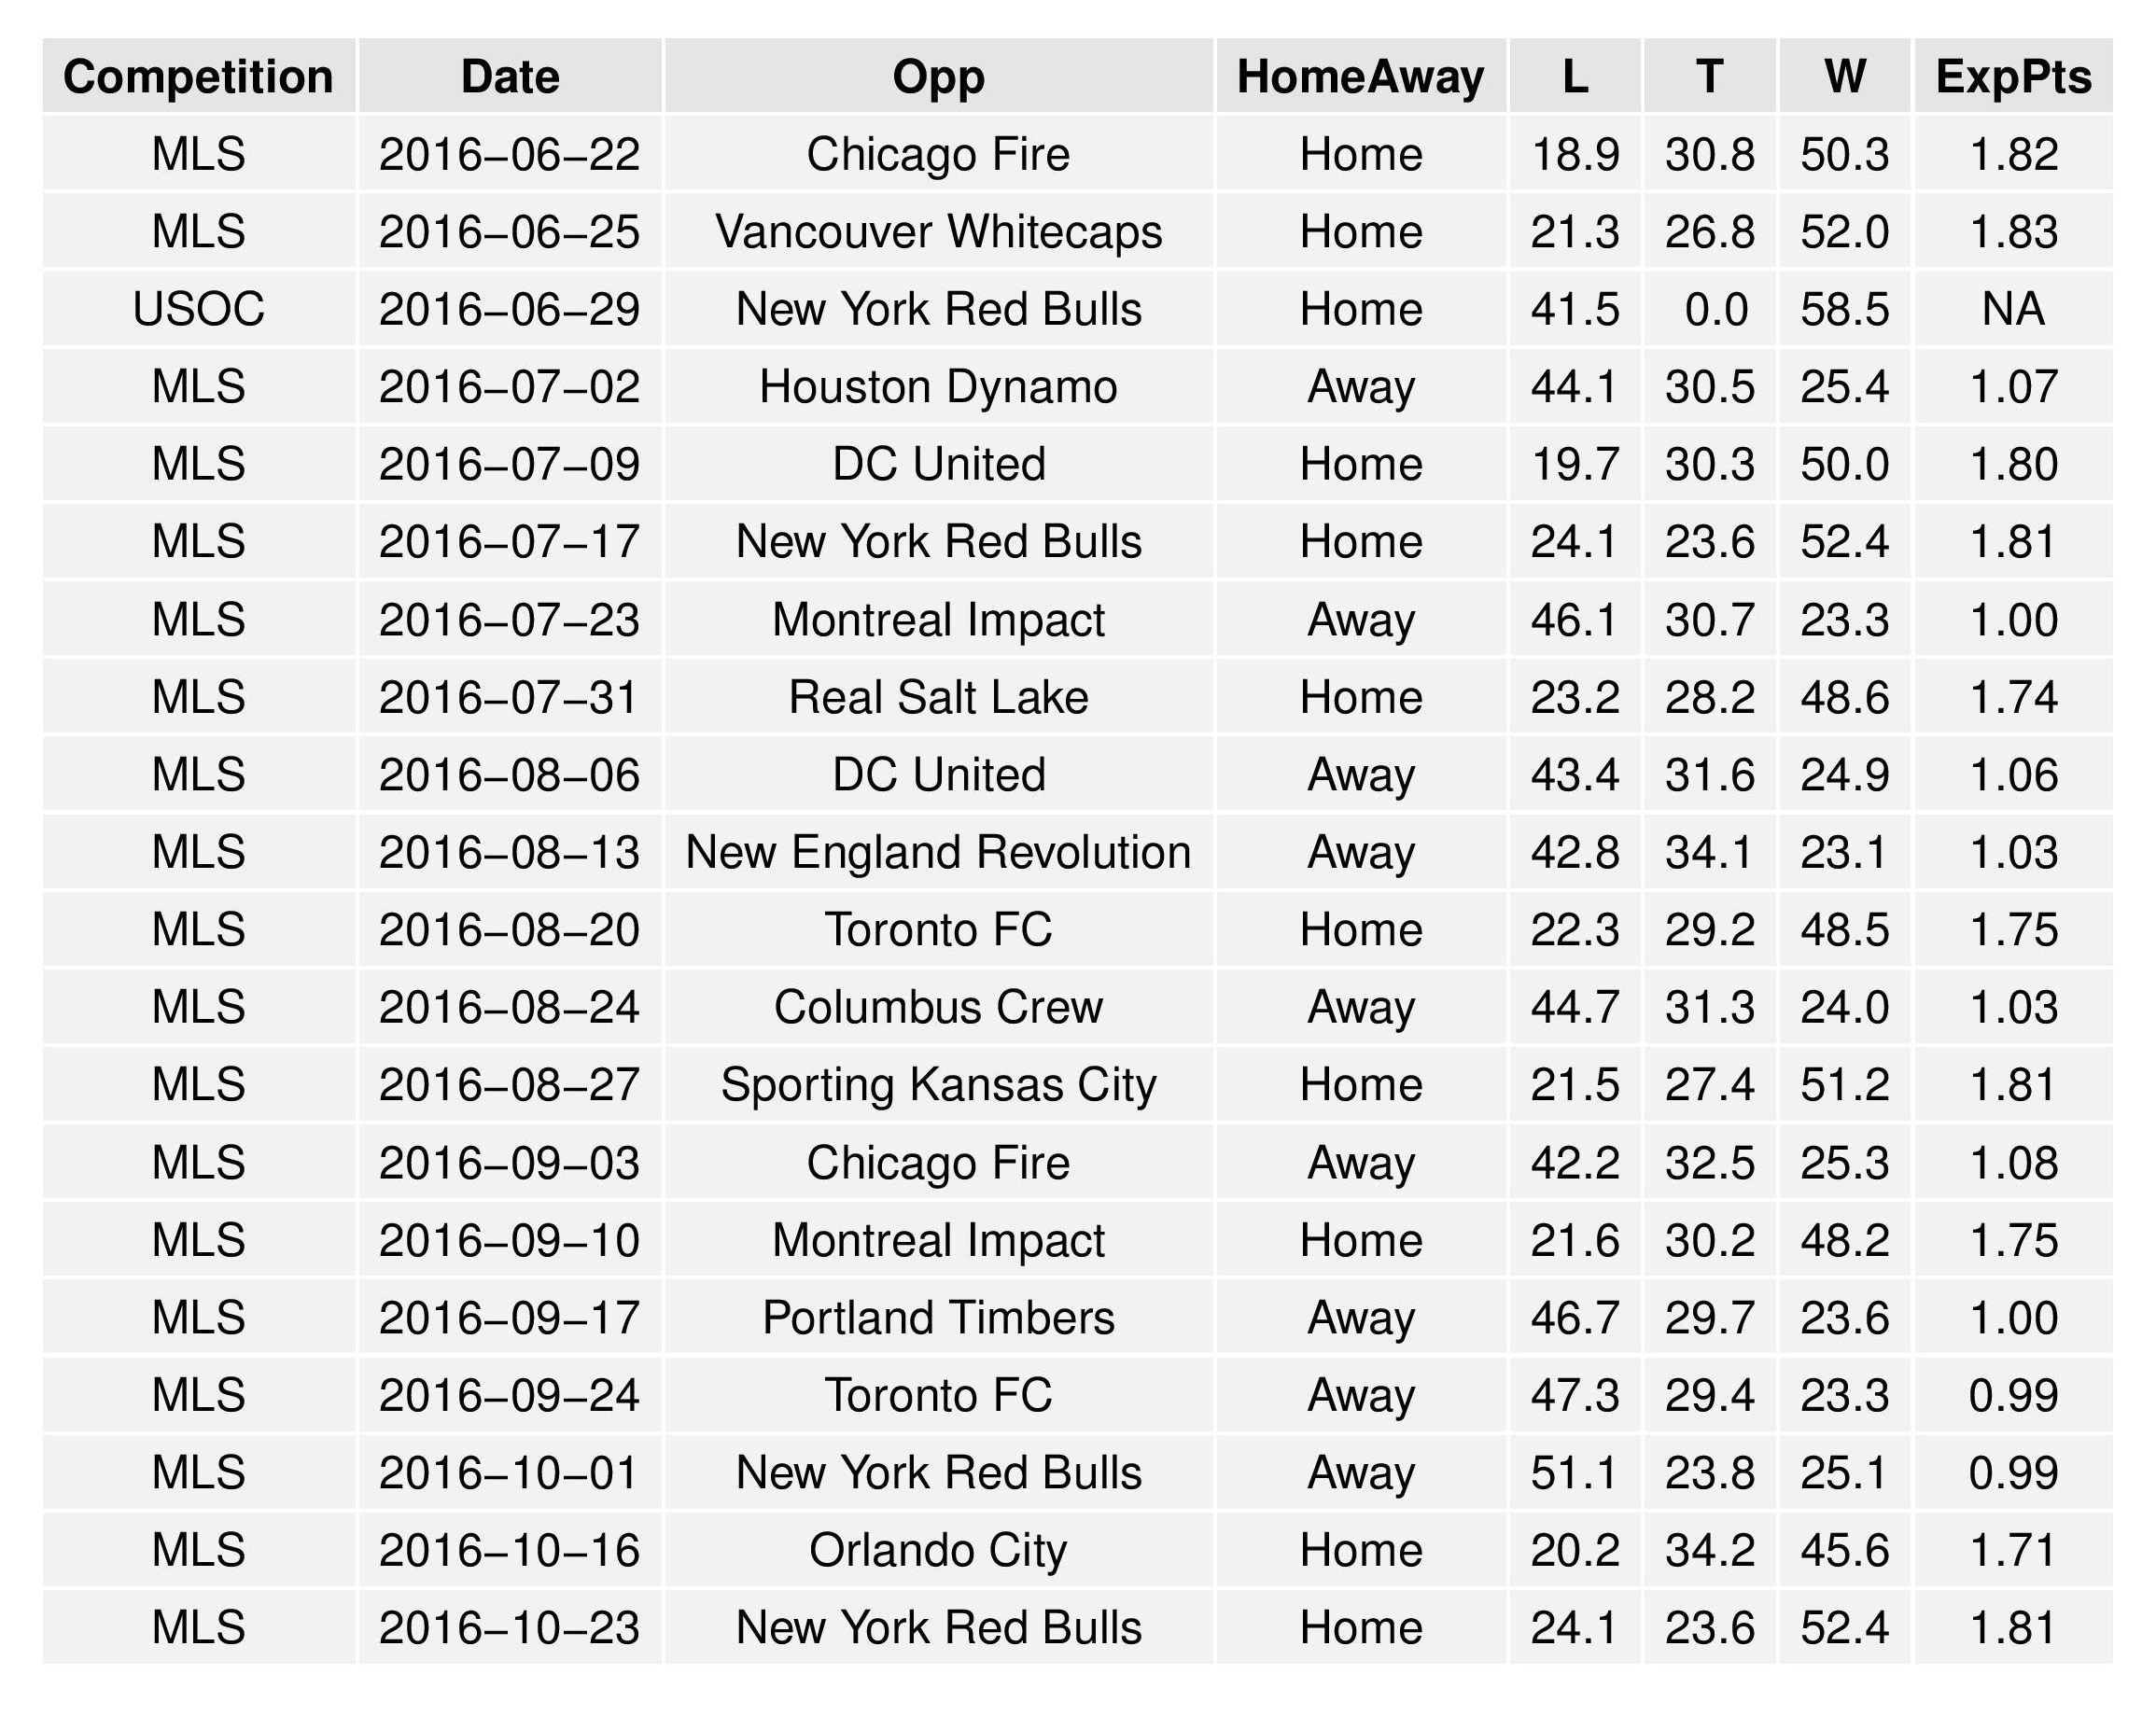
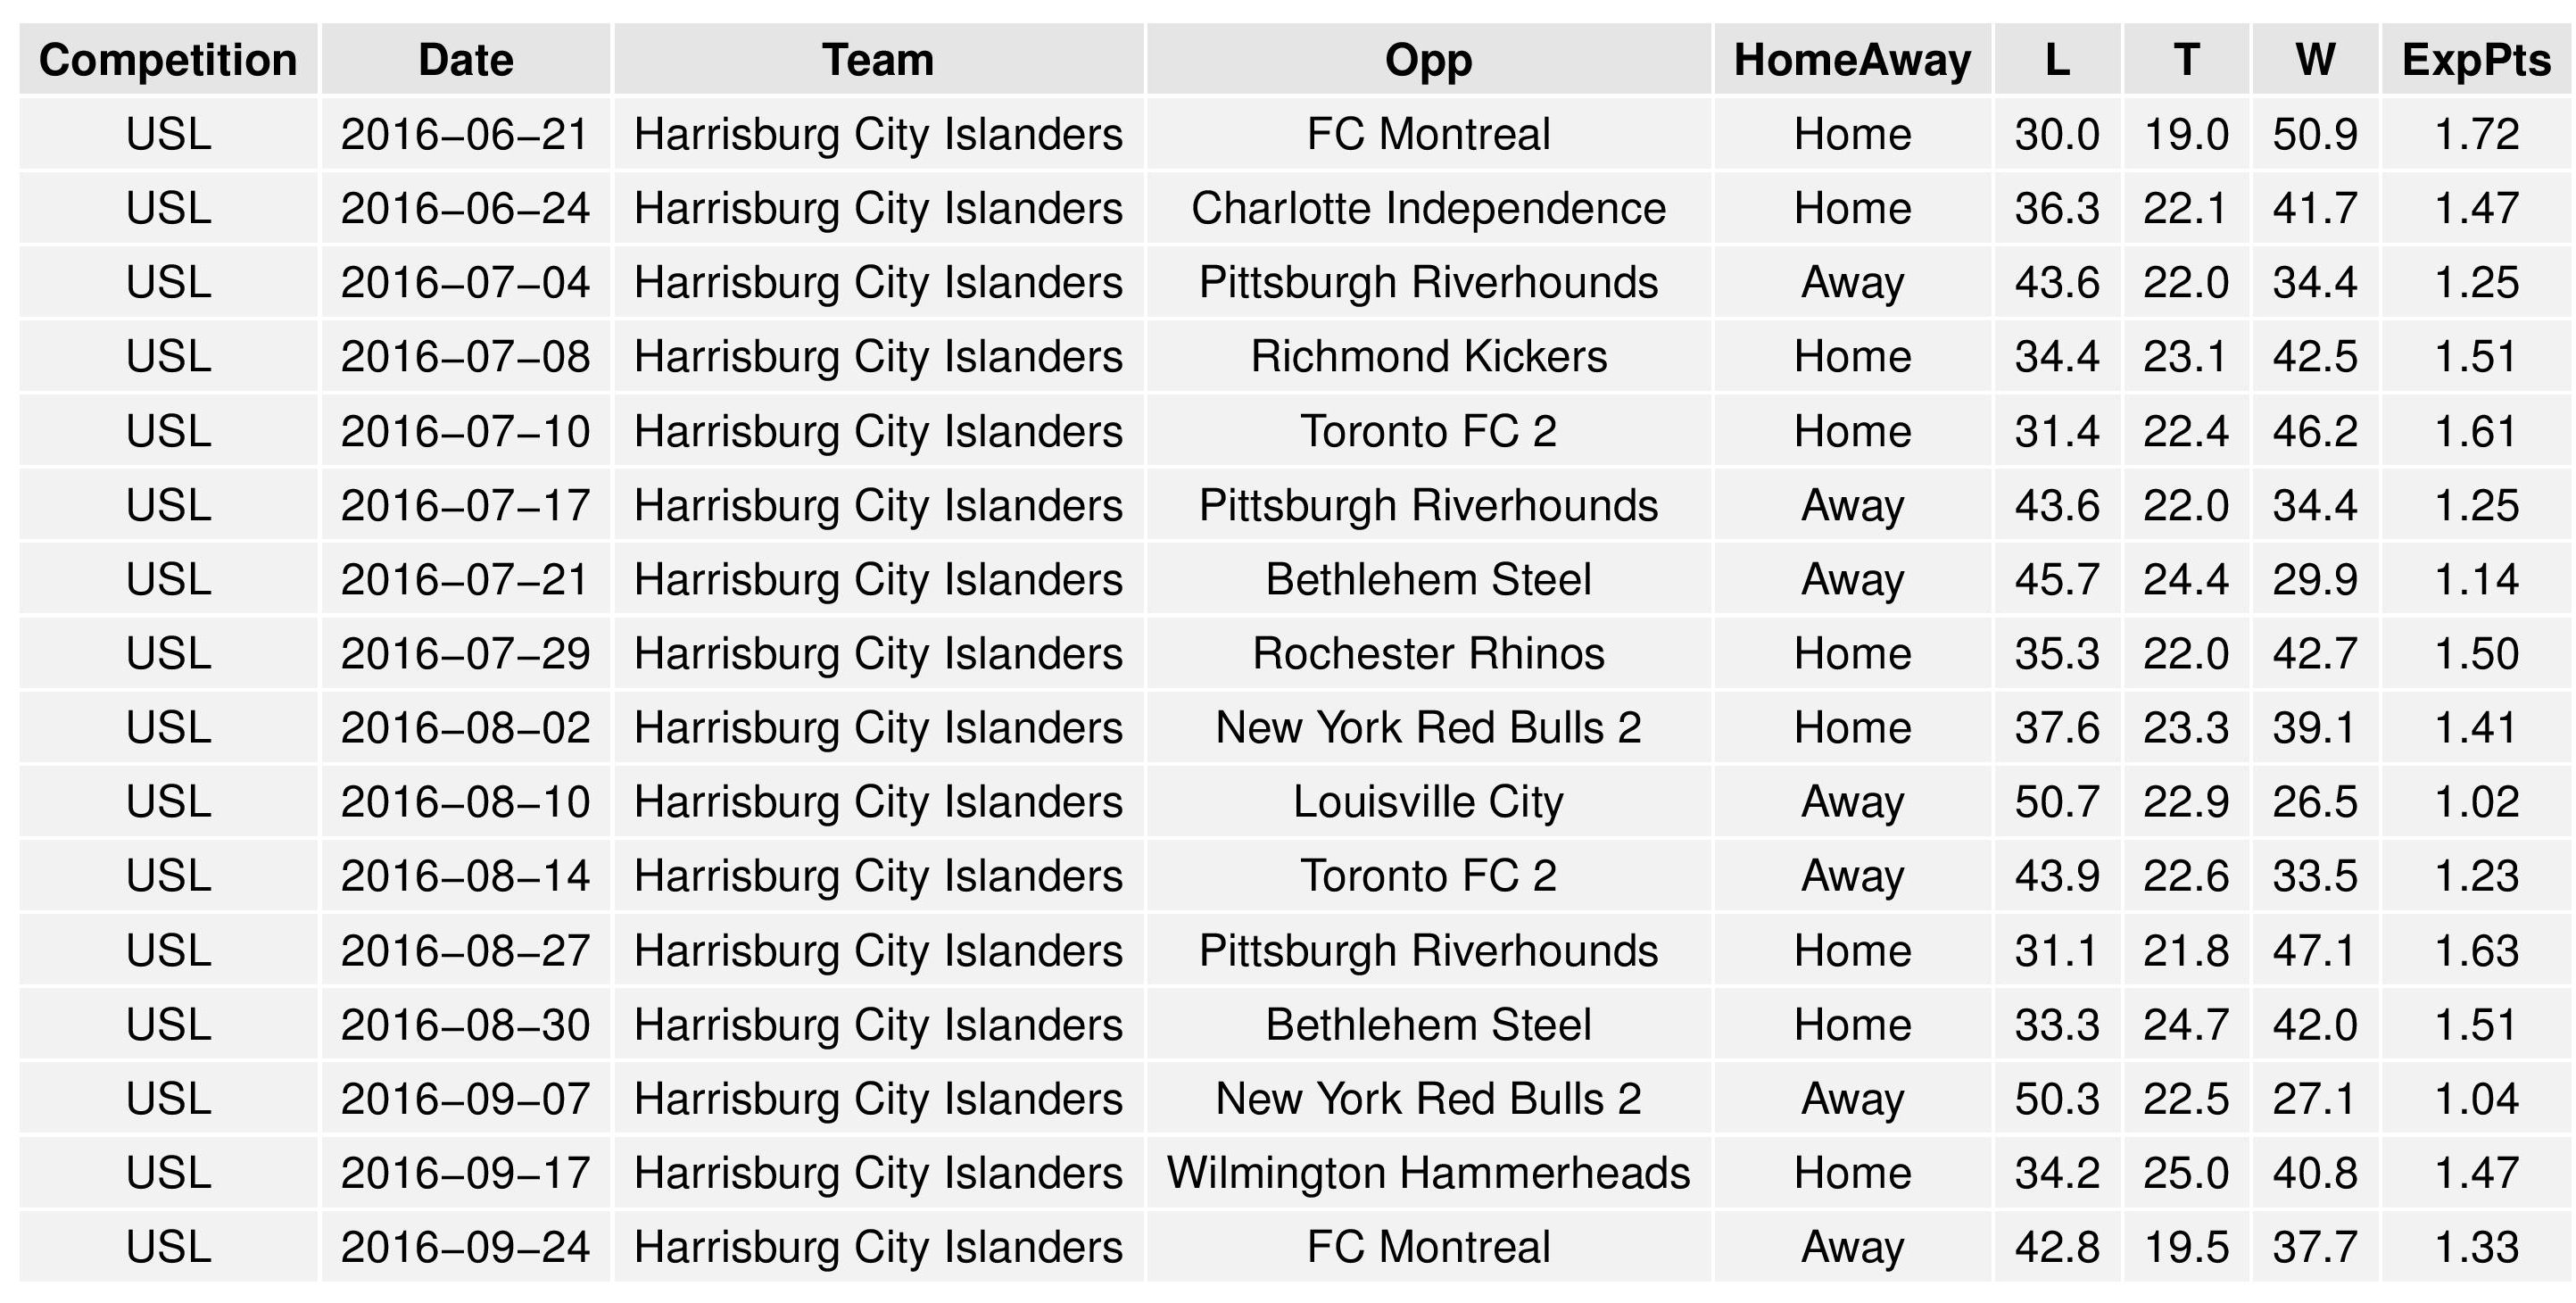
The following is the list of Philadelphia’s remaining scheduled matches accompanied by result probabilities as predicted by SEBA.
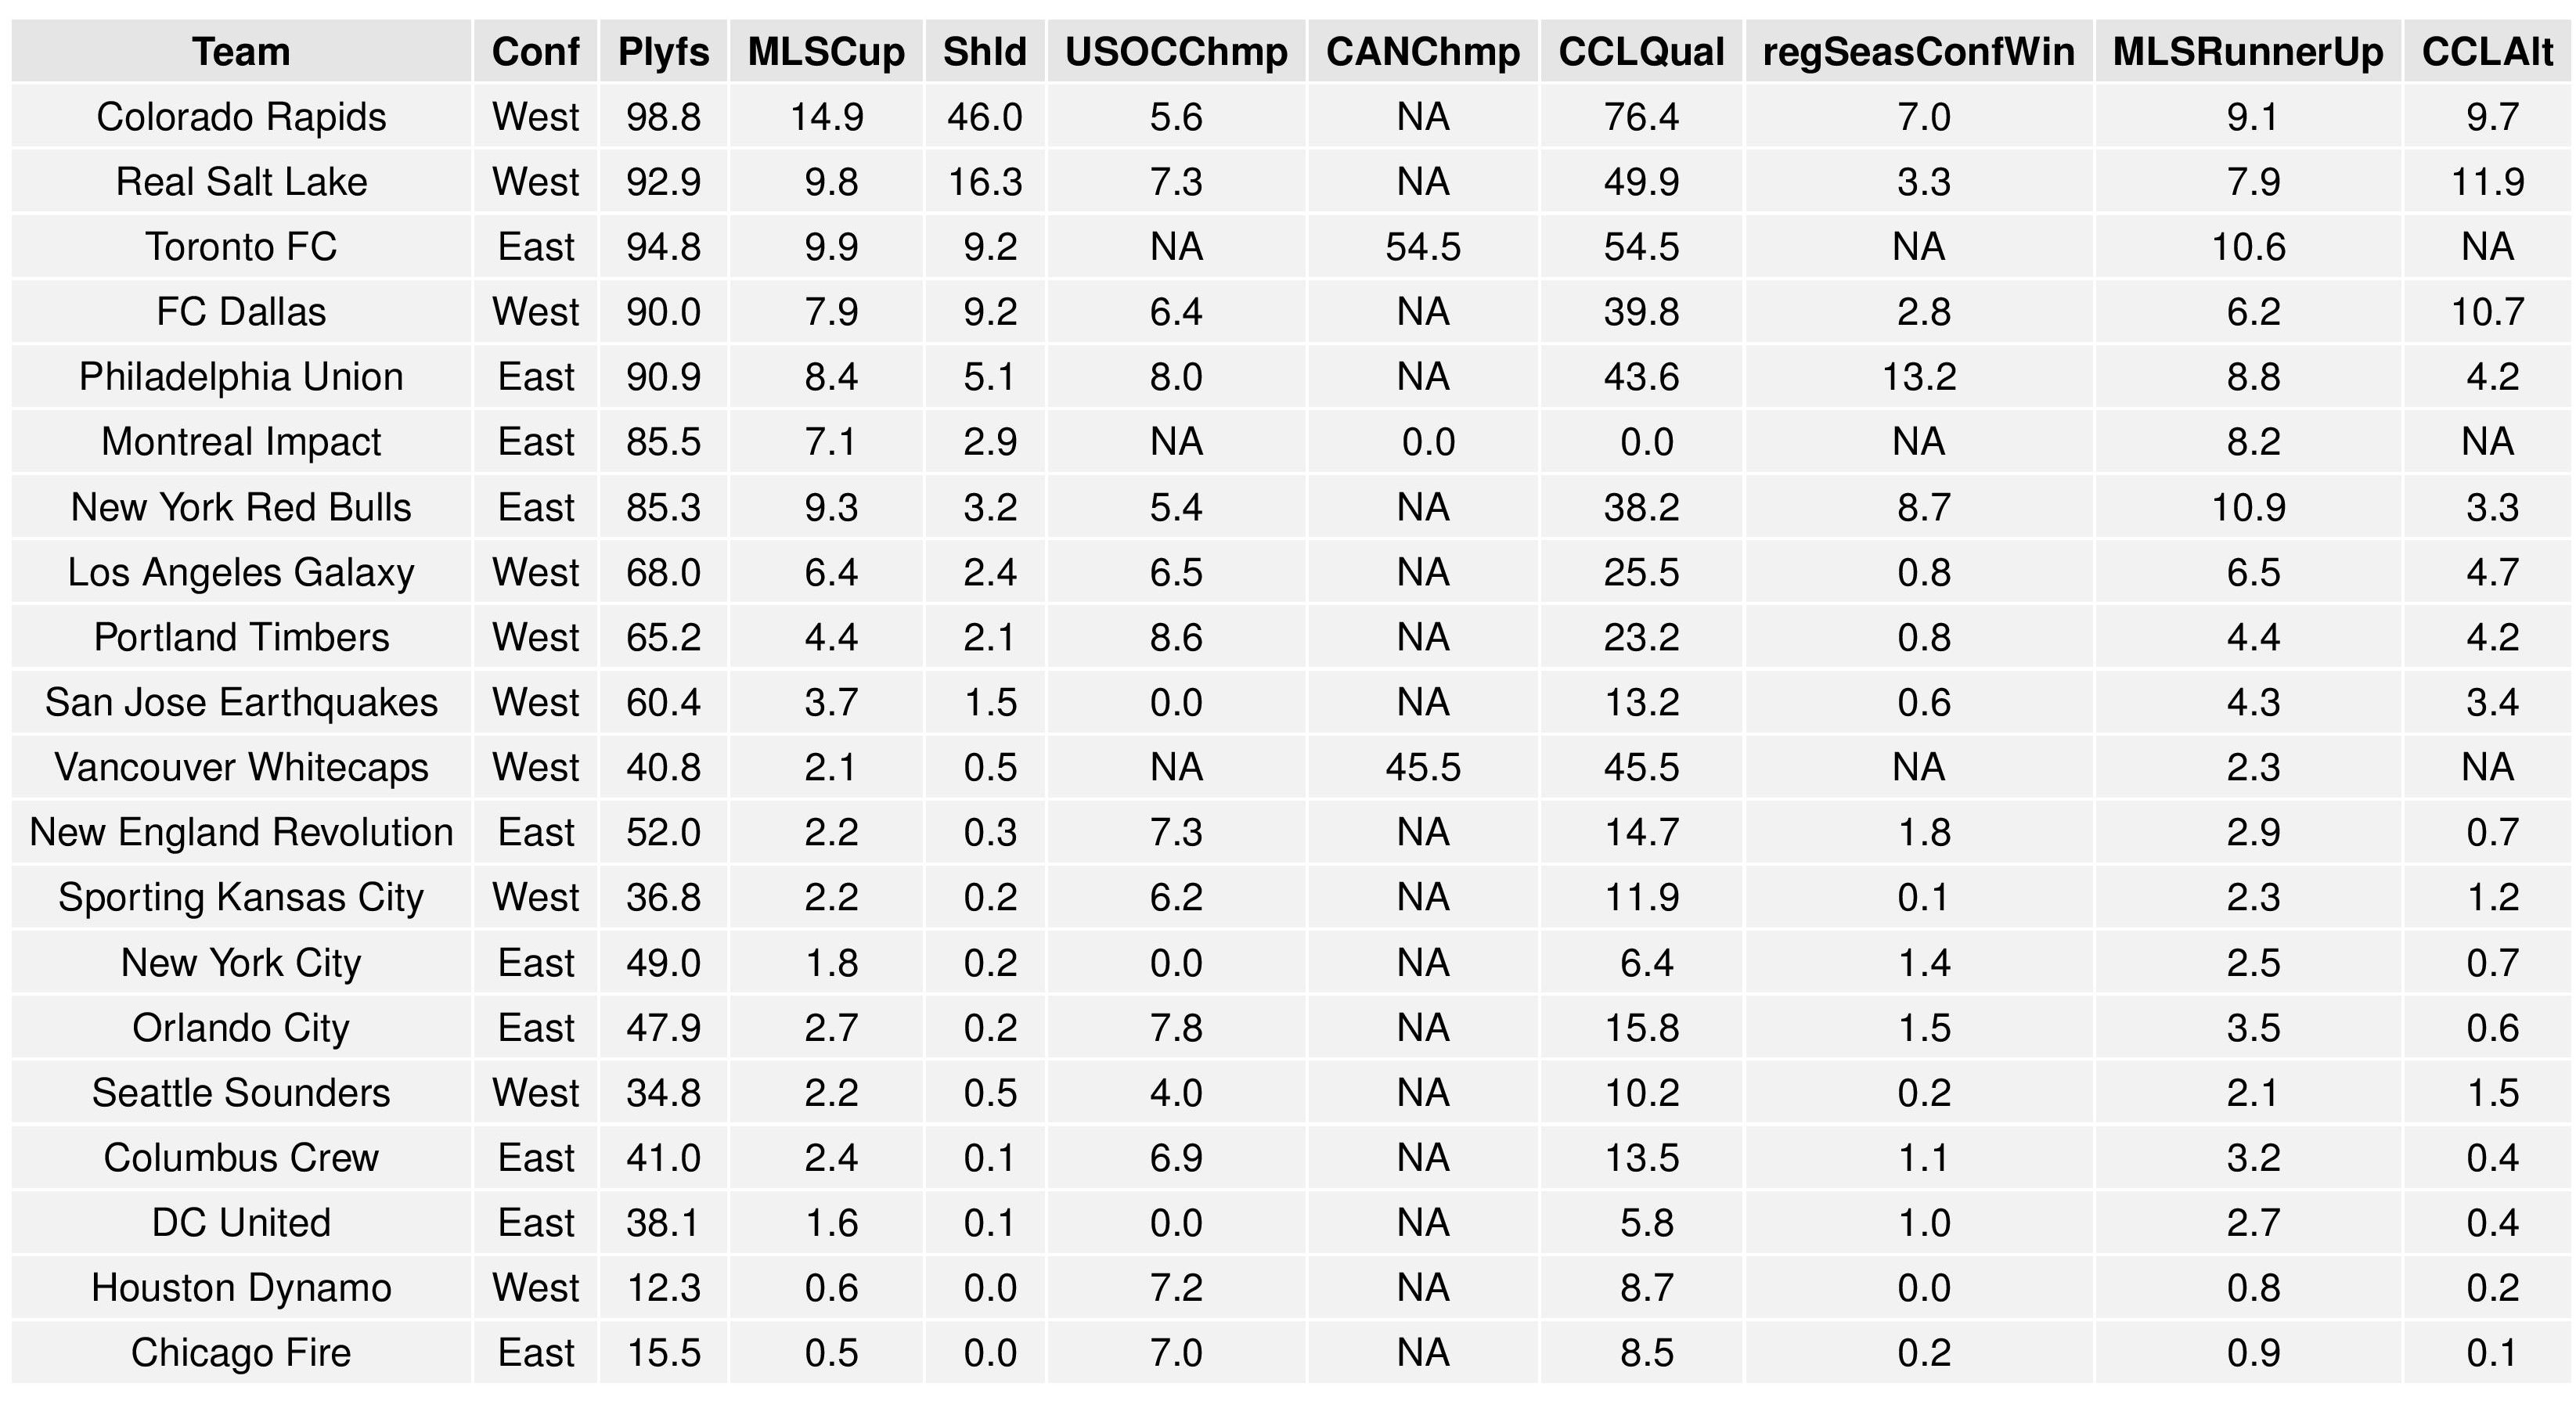
Finally, the charts below shows the average results of all the simulations and the probabilities associated with all of the above. The chart is broken up into two parts in order to better fit on your screen.
(Note: CCLAlternate refers to qualifying for CONCACAF Champions League non-traditionally. U.S. teams qualify by winning the MLS Cup, winning the Supporters’ Shield, winning the Conference in the regular season, and by winning the U.S. Open Cup. If a Canadian team wins any of these or a U.S. team wins more than one, the extra slots are filled by top regular season performers.)
Changes Over Time
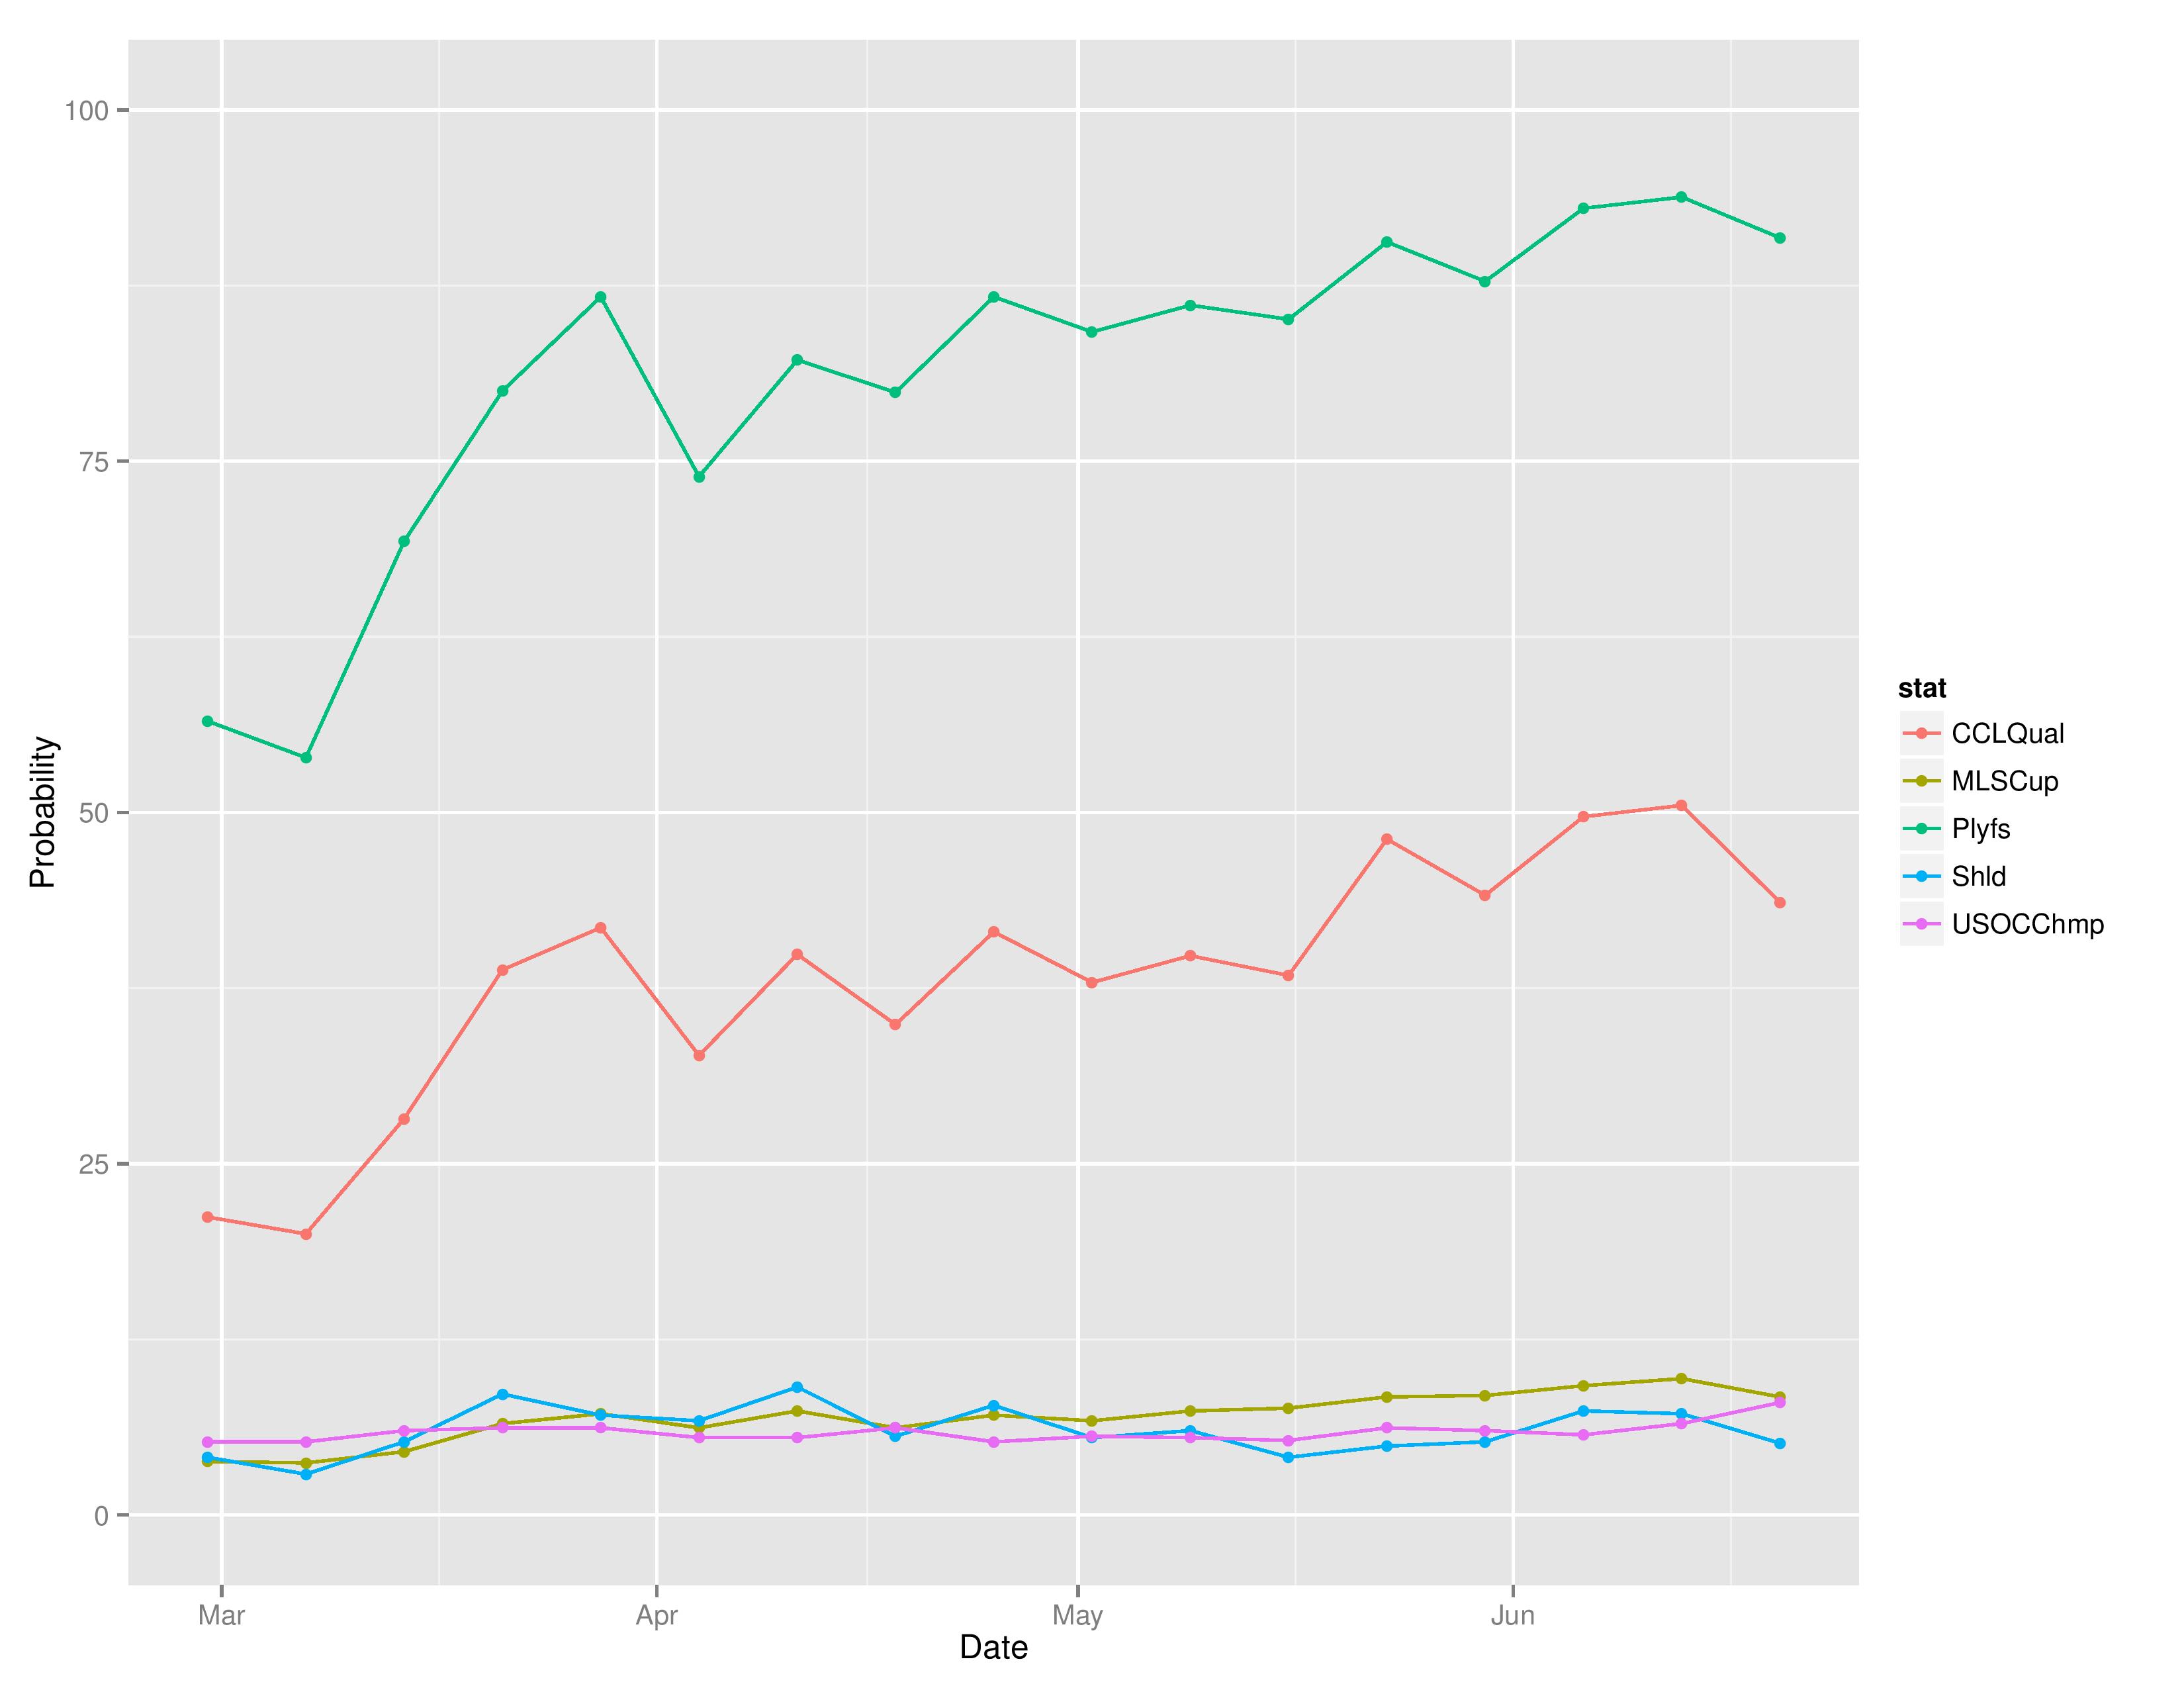
This chart shows how Philadelphia’s chances at each of the outcomes has evolved over the course of the season. These probabilities were calculated weekly, always through Sunday’s matches.
Disclosure: It is possible that I re-ran some previous simulations that I posted on, so it is possible the numbers have changed, but they should be small changes.
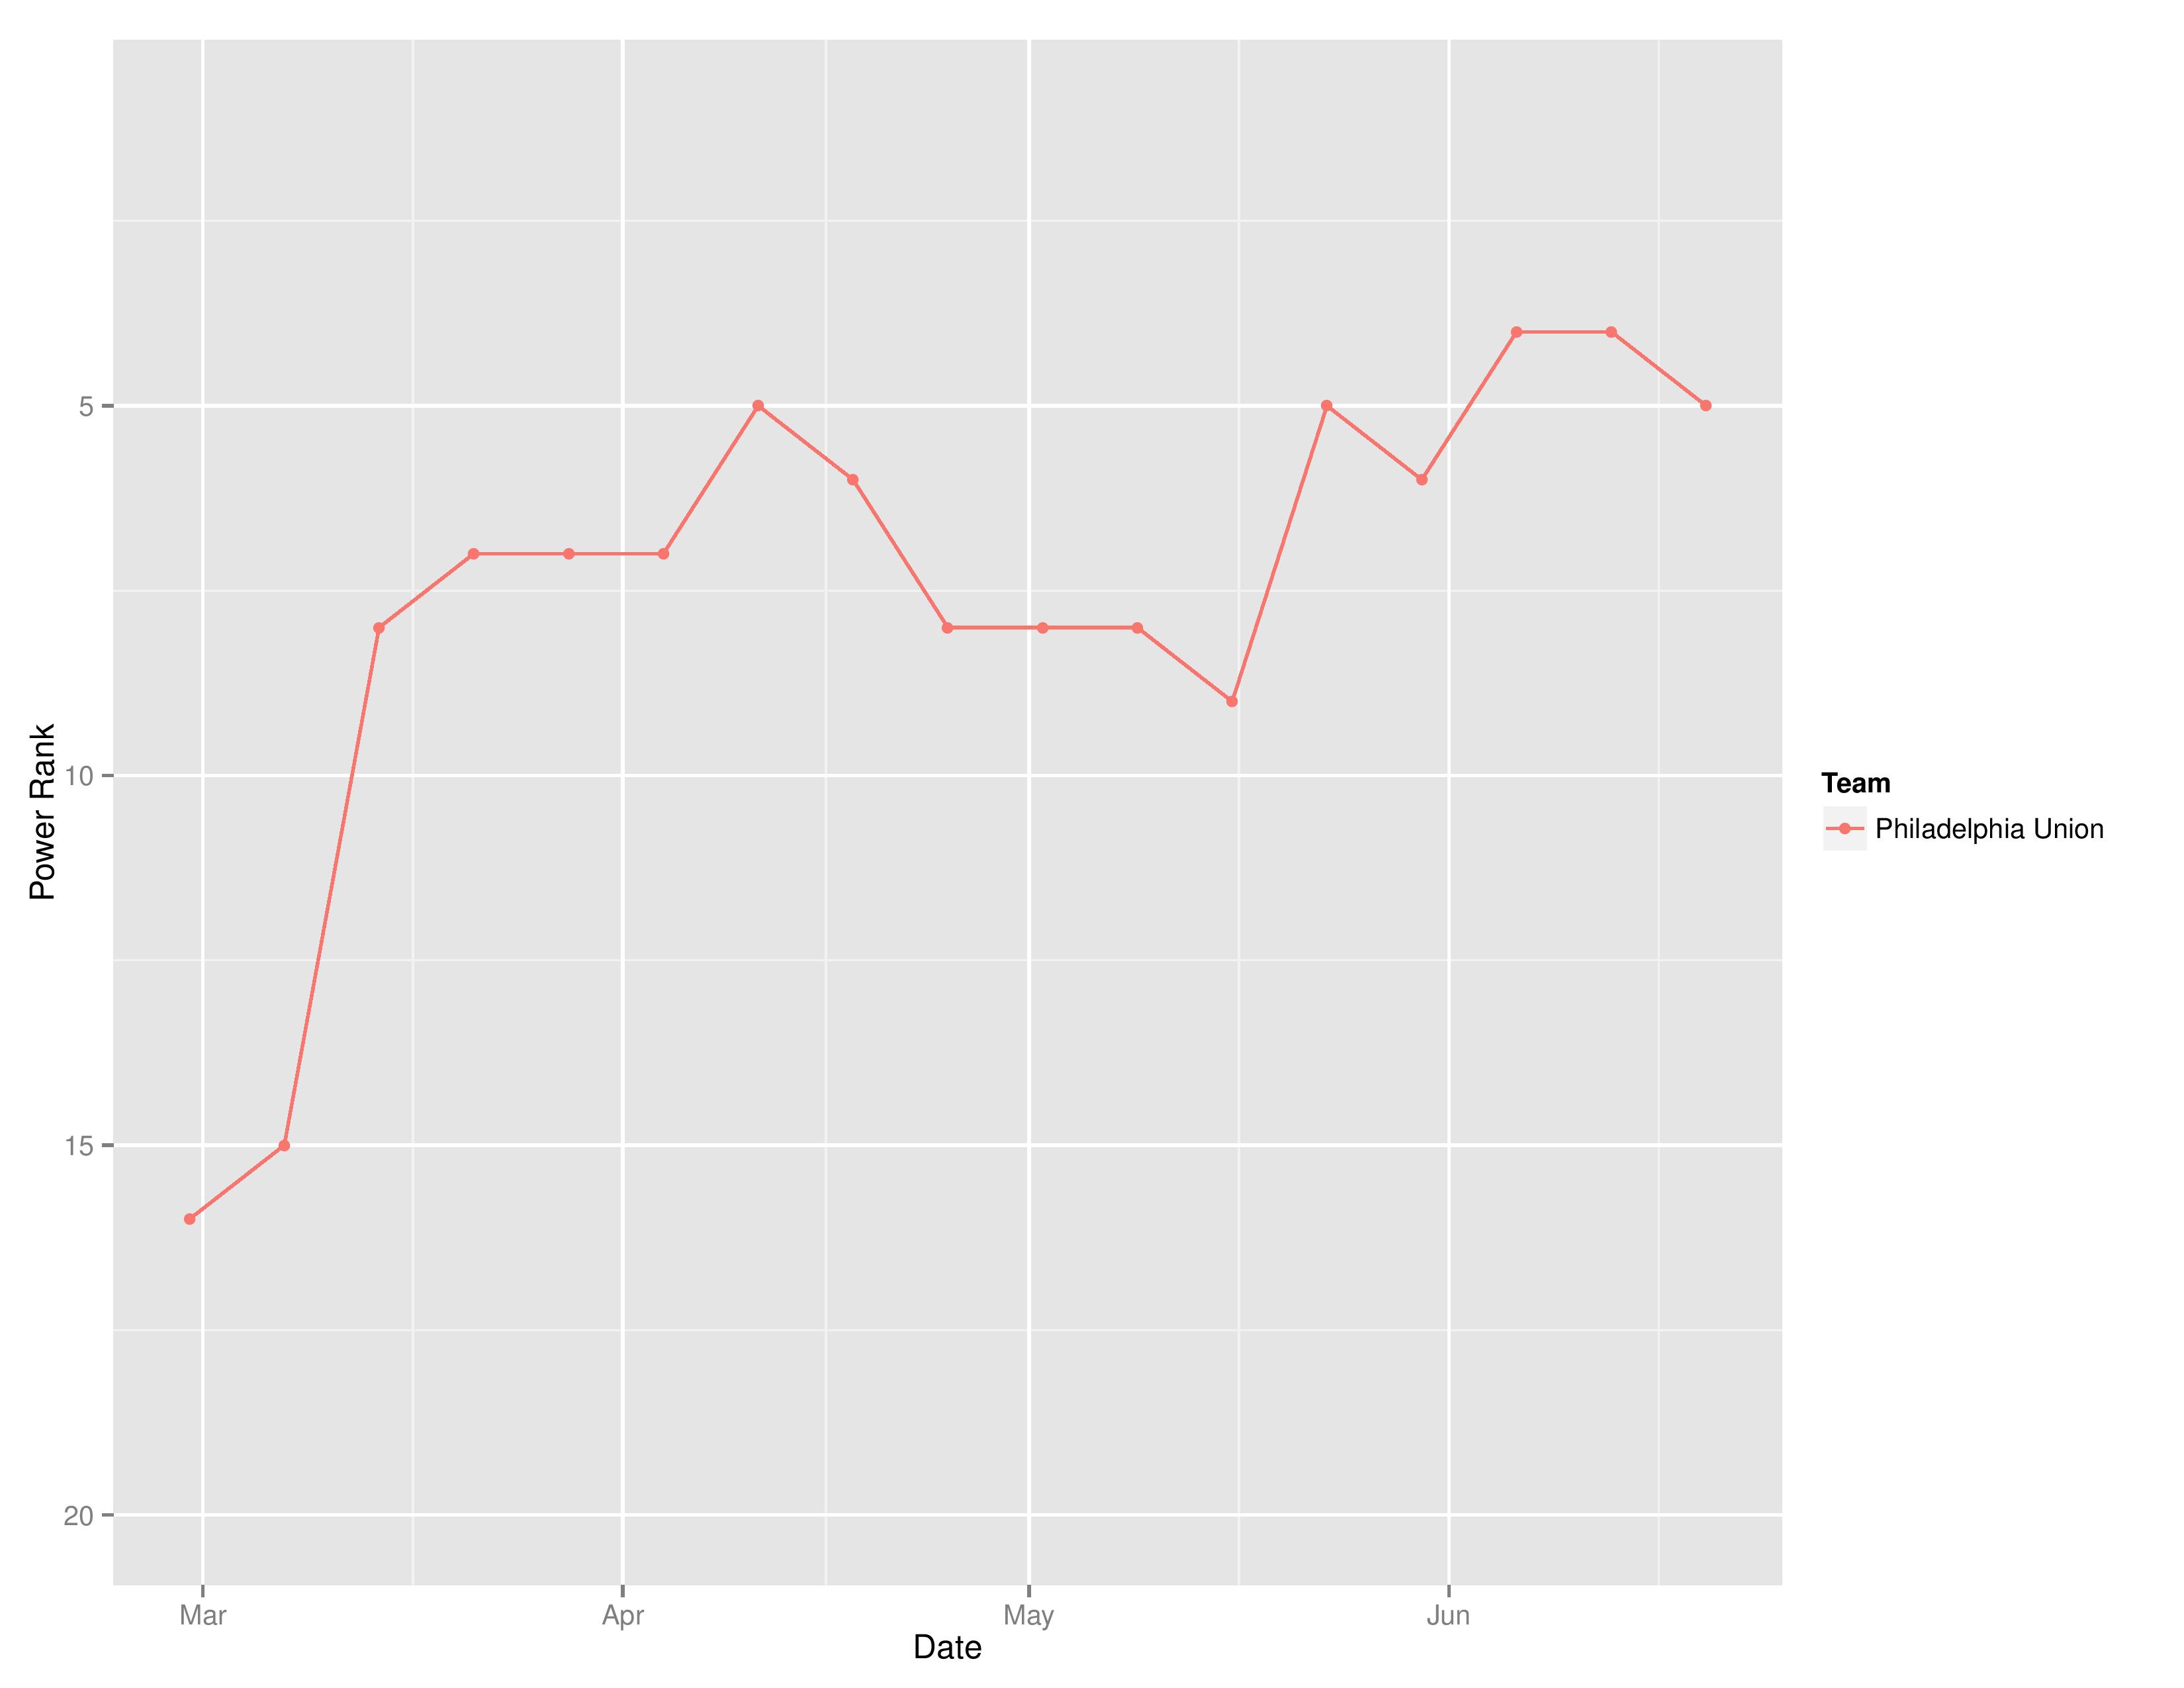
This shows the evolution of Philadelphia’s movement within SEBA’s power rankings.
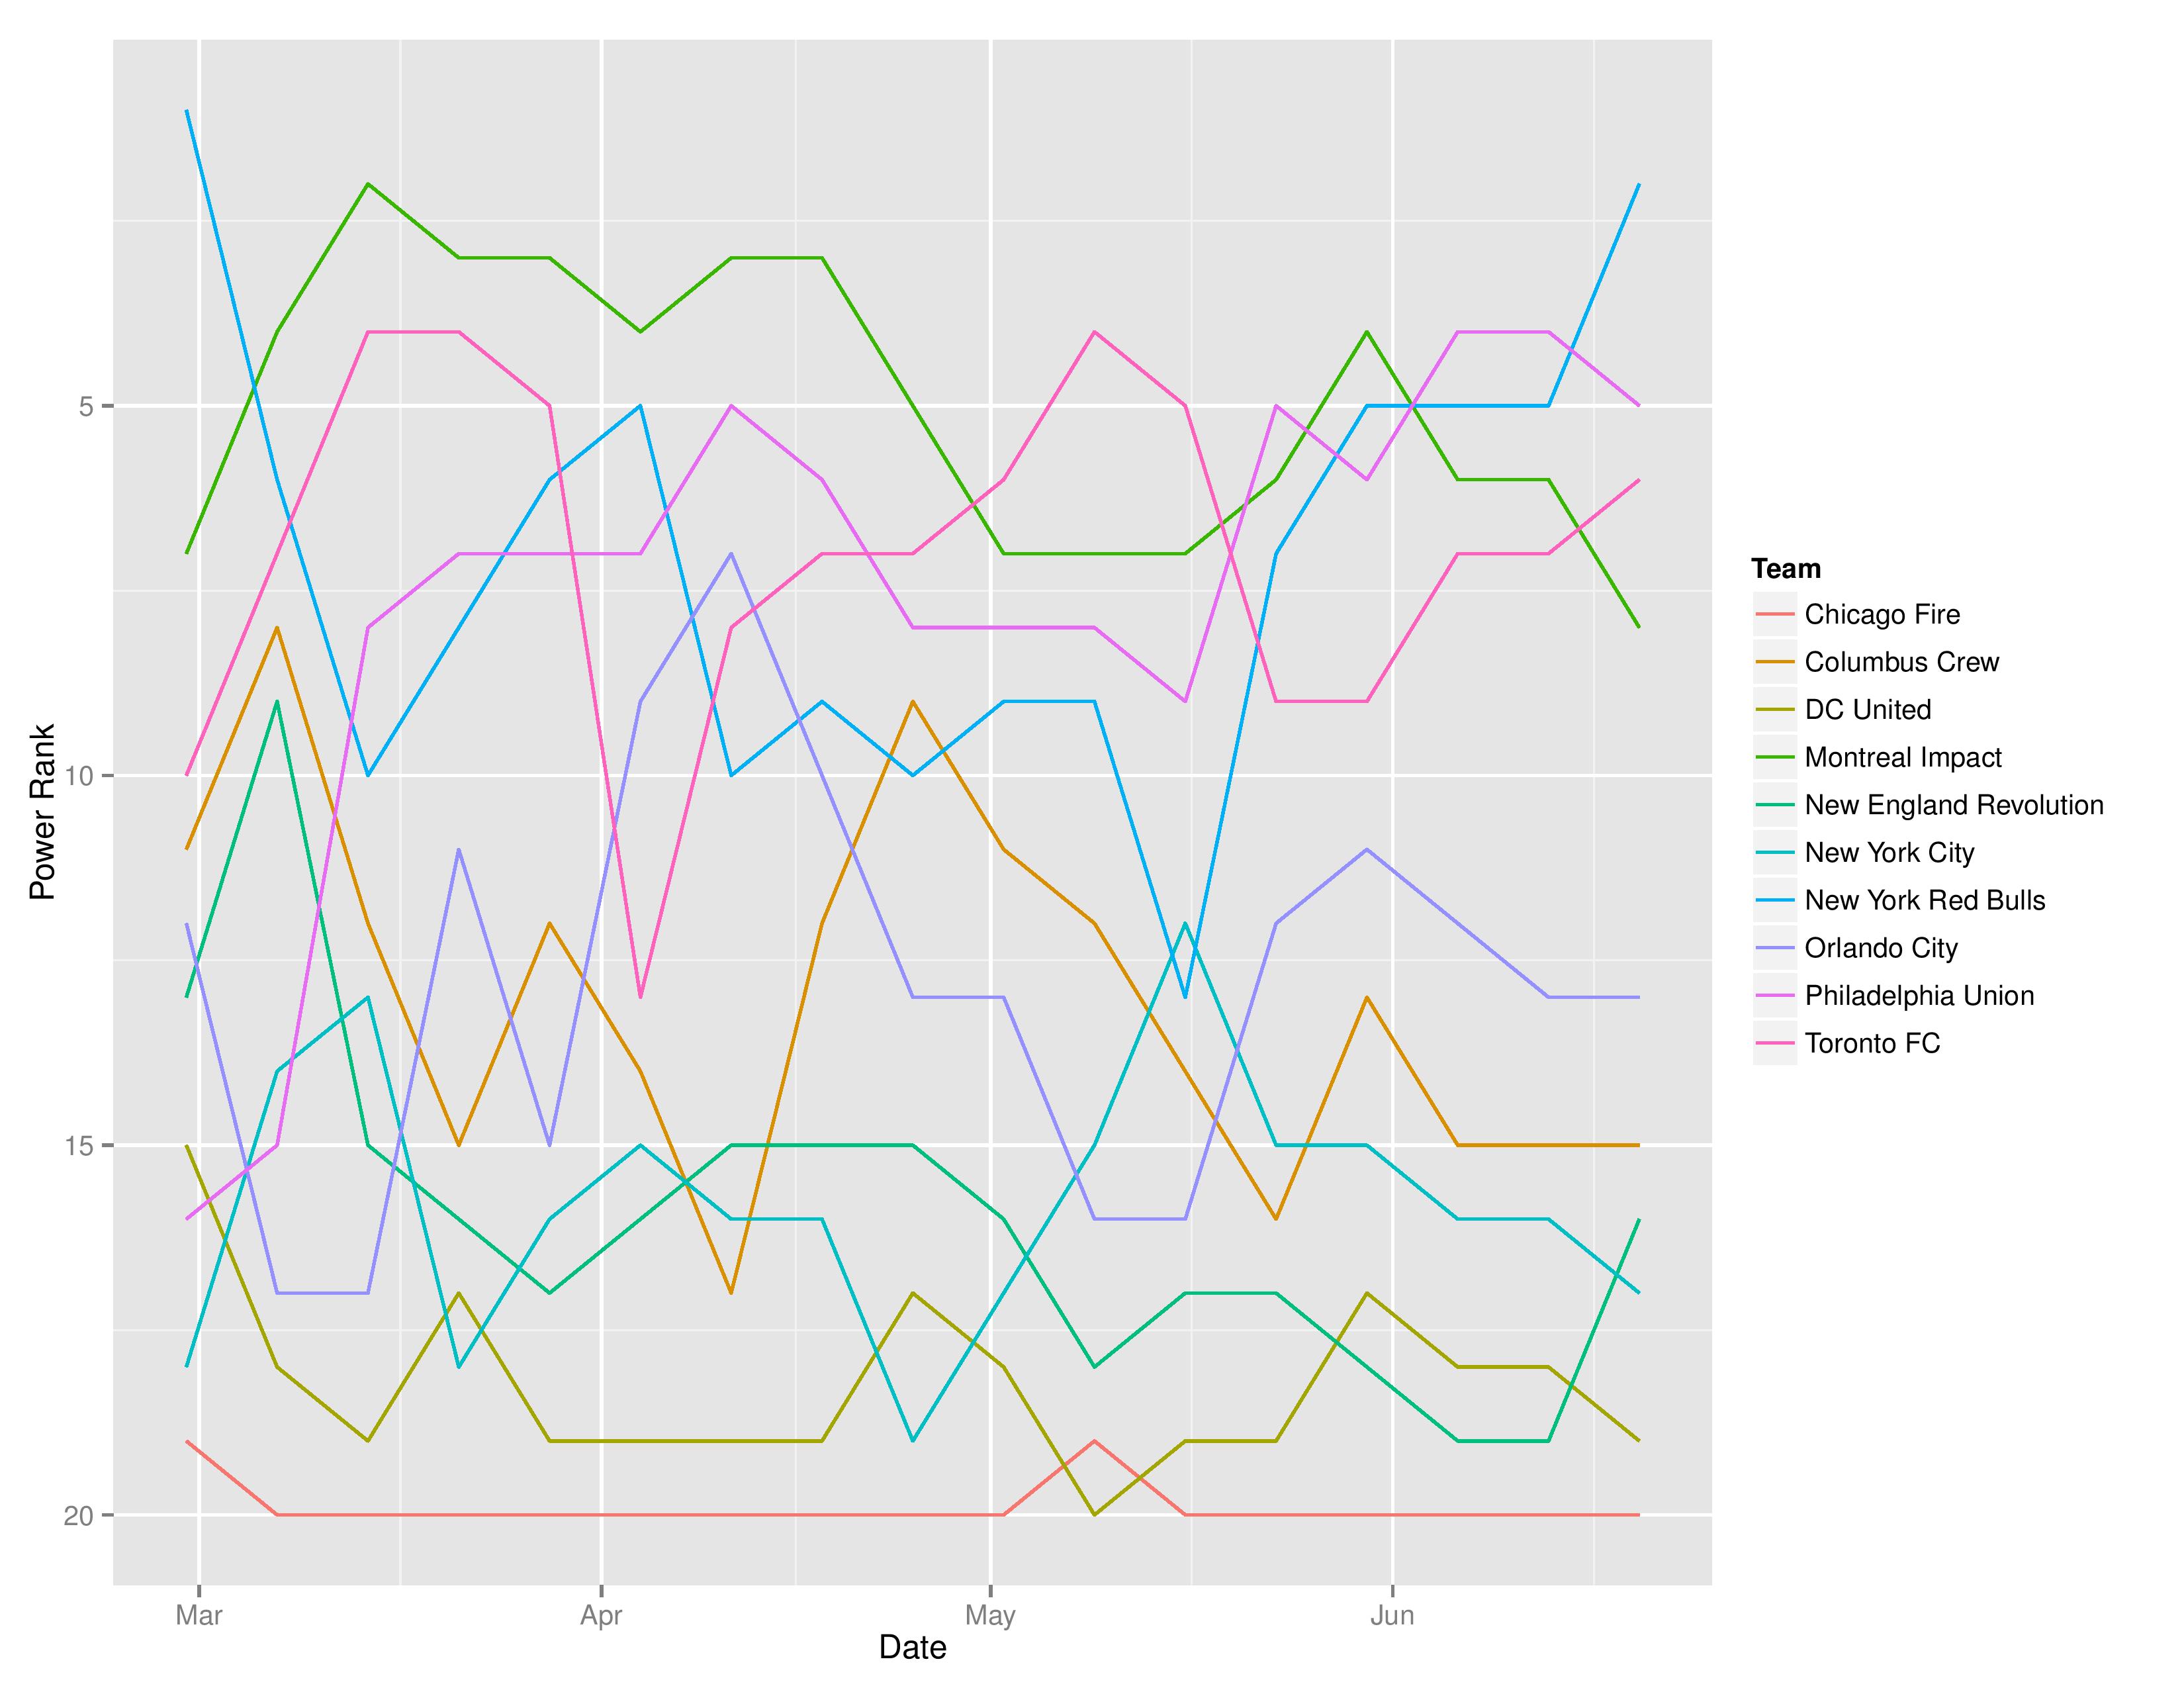
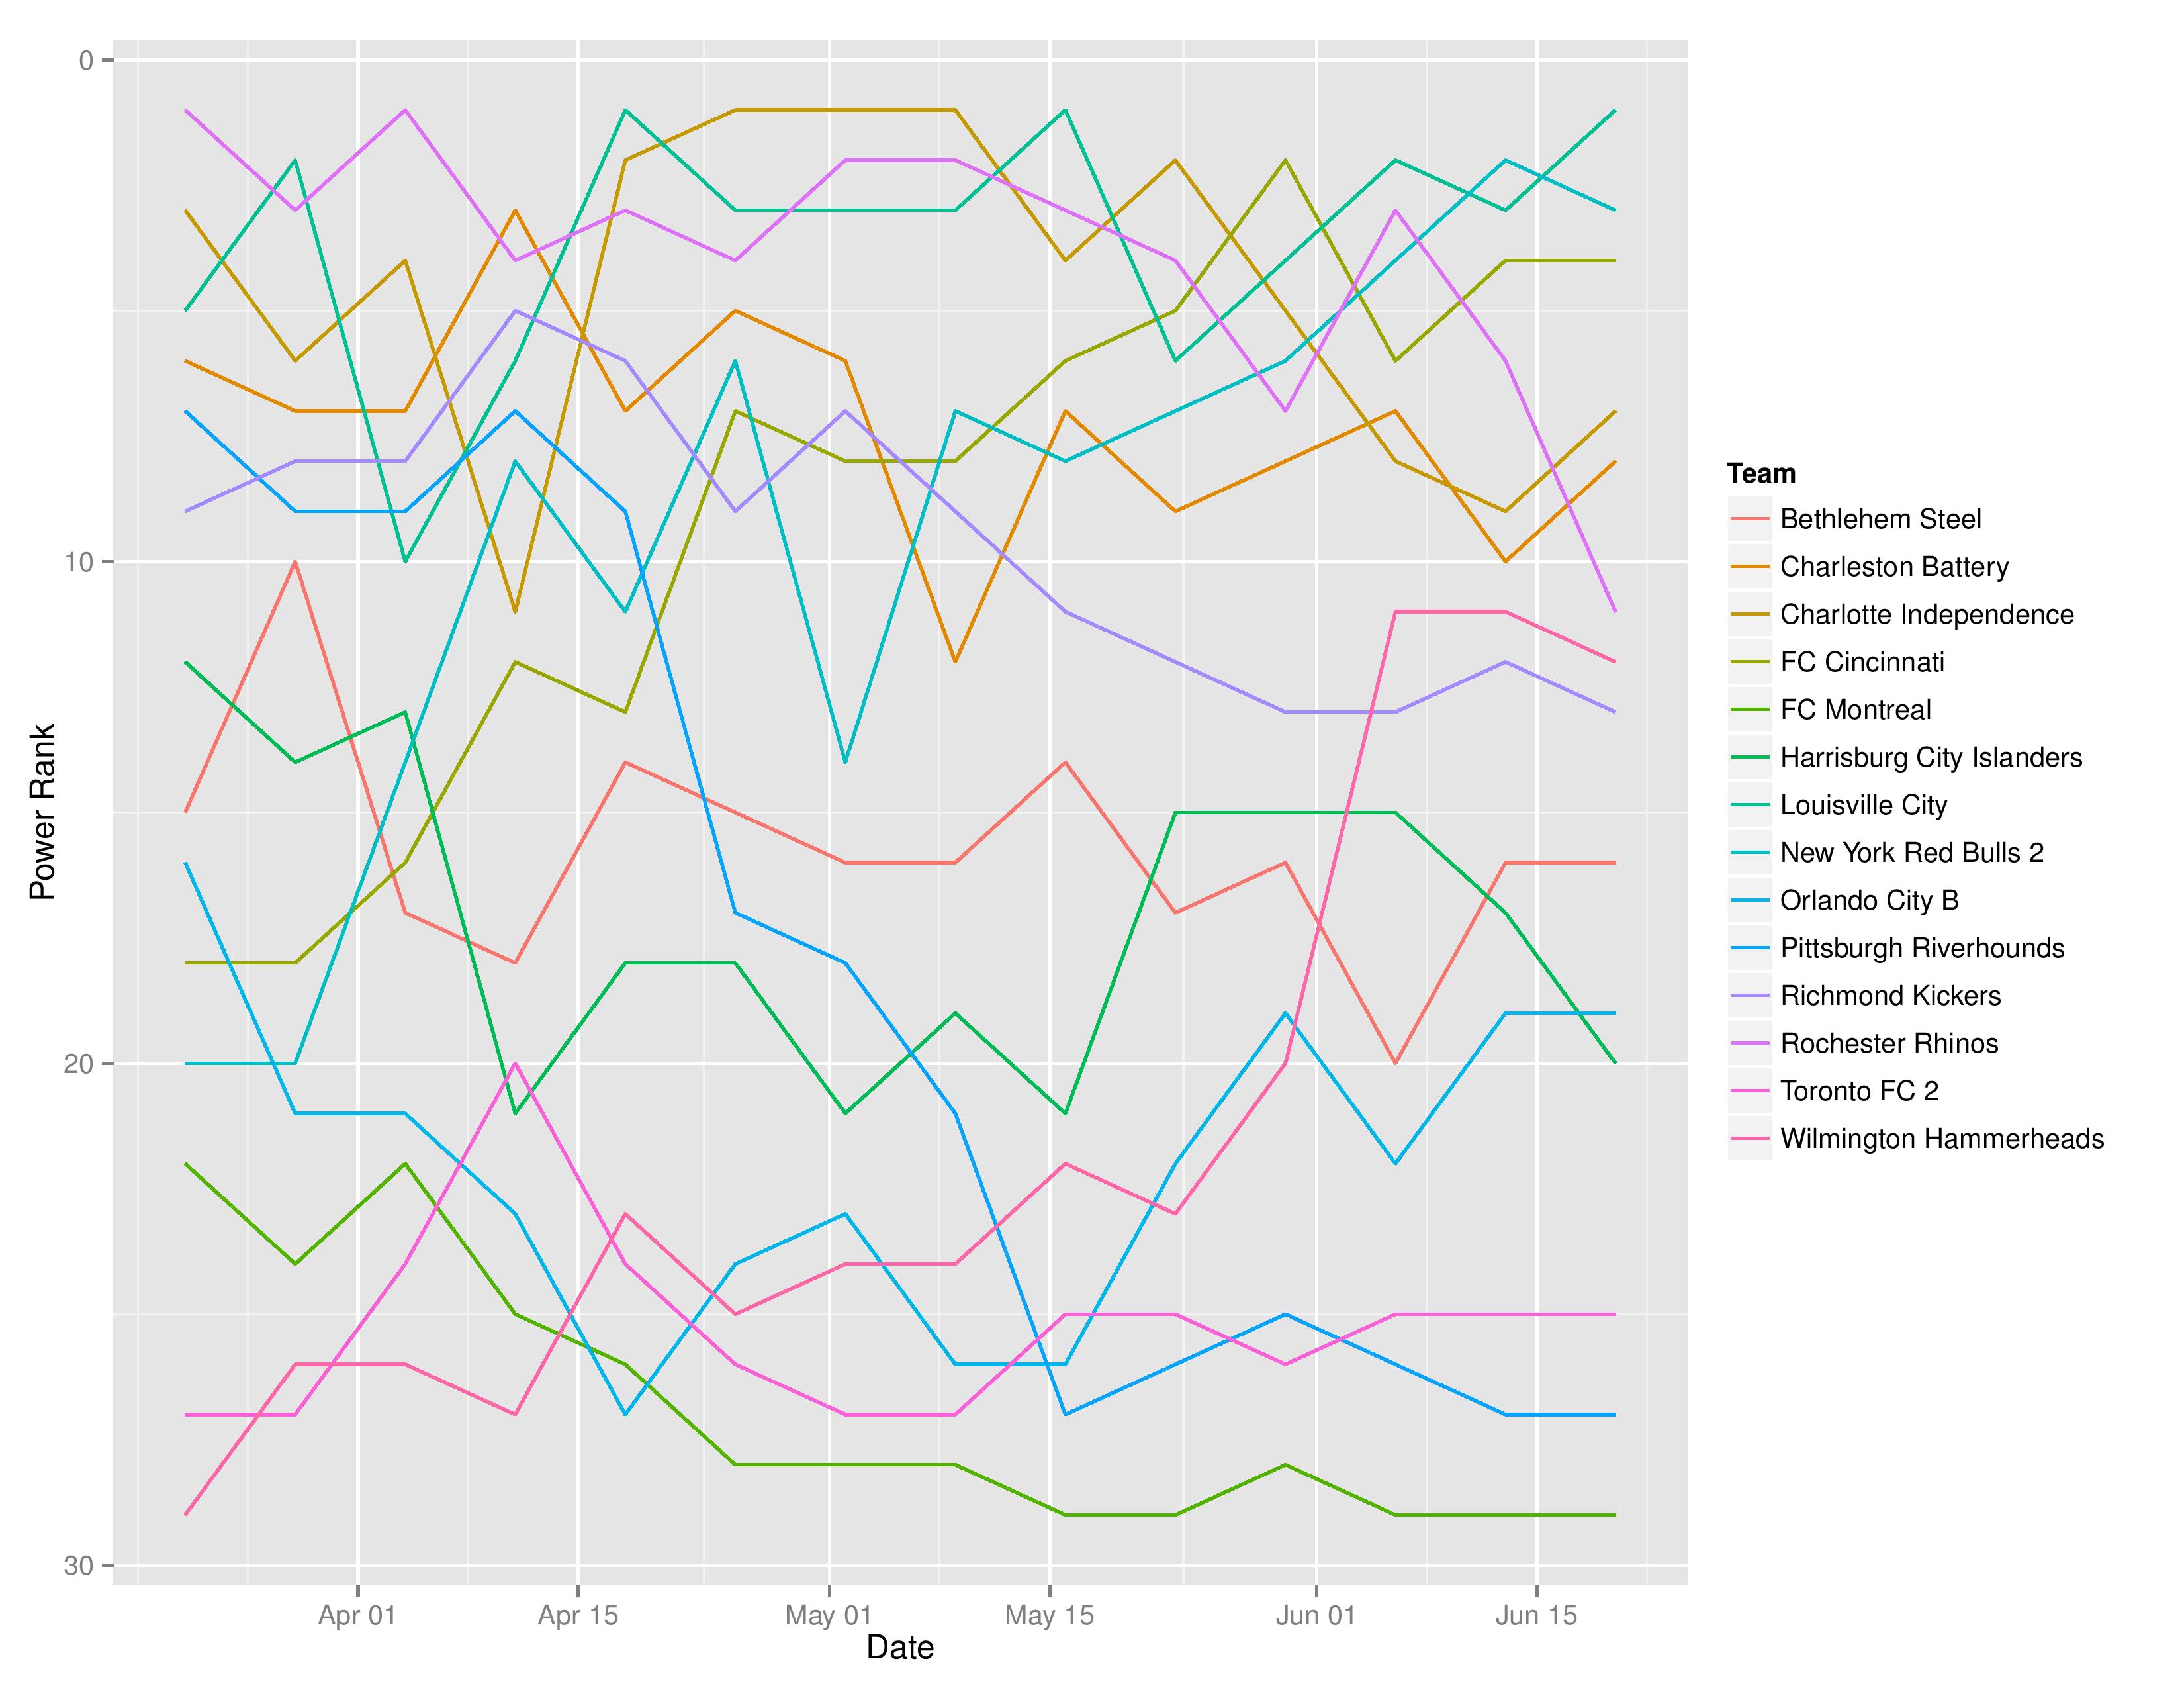
This shows the MLS Eastern Conference’s evolution of power rankings throughout the season.
Let me know in the comments how readable this is. I could cut this down to the I-95 corridor perhaps?
USL Projections
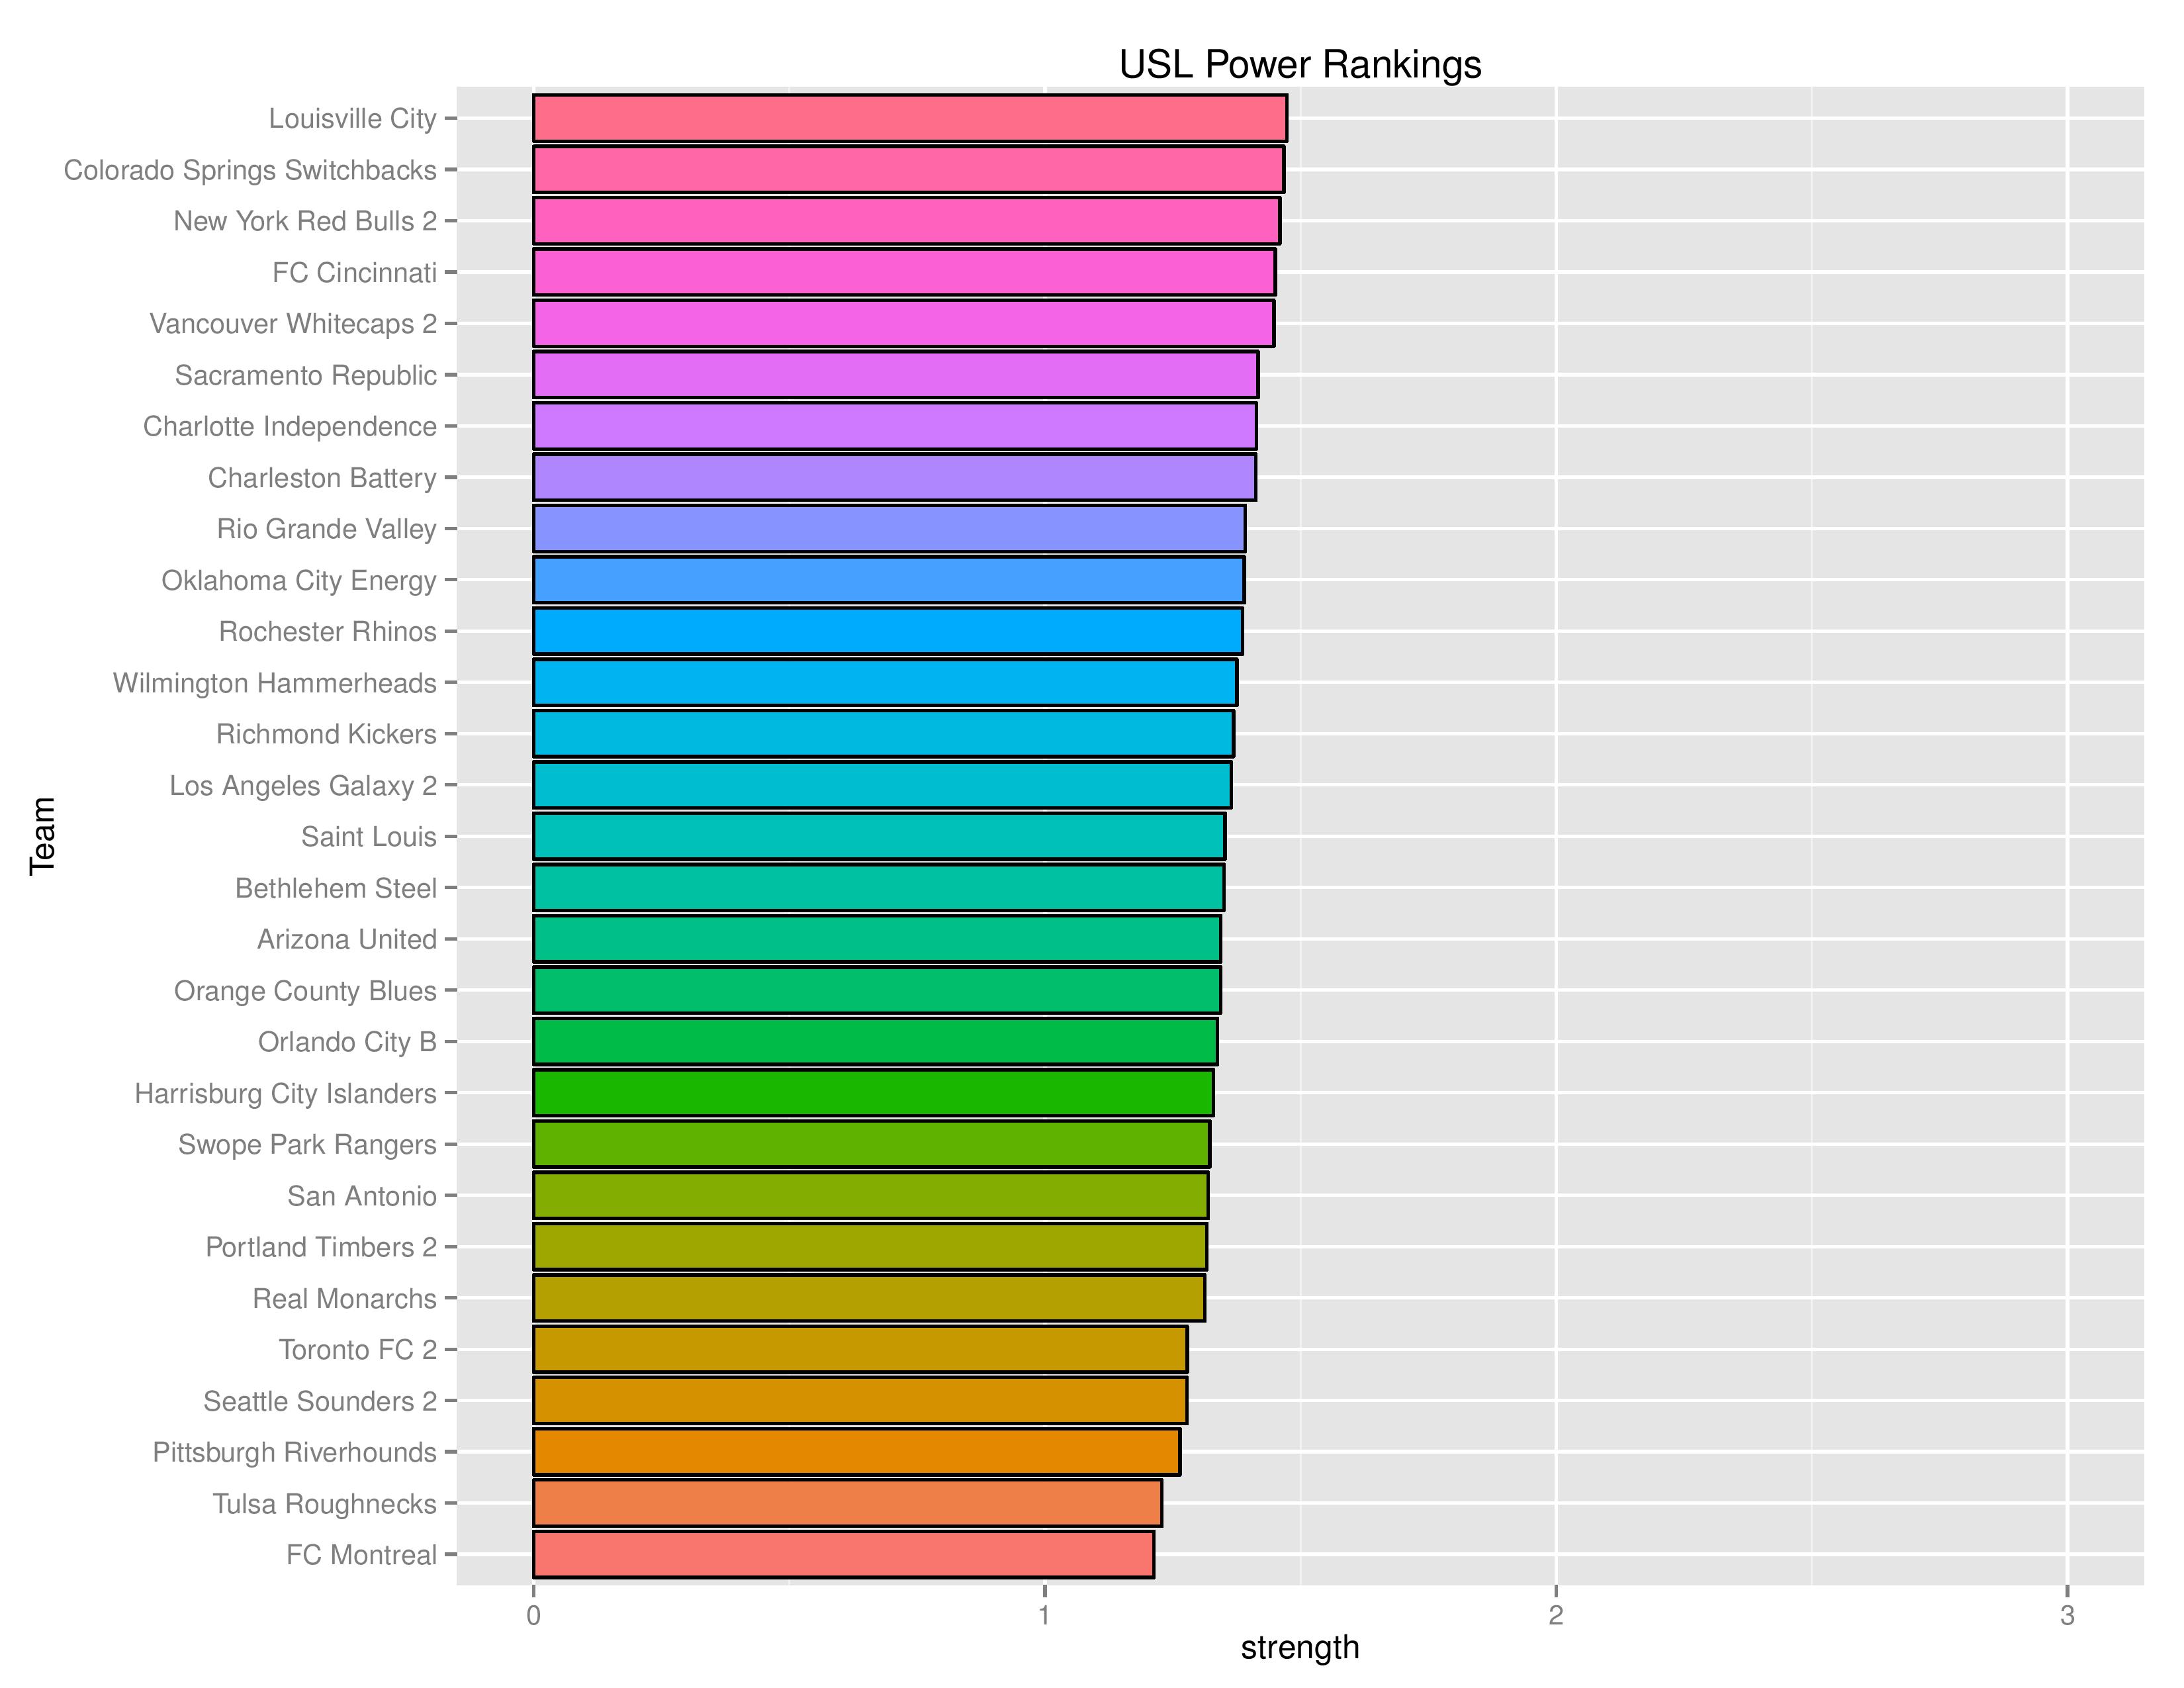
Bethlehem remains in 16th and Harrisburg City Islanders moves down from 17th to 20th. USLSoccer.com‘s top 10 rankings do not include either team.
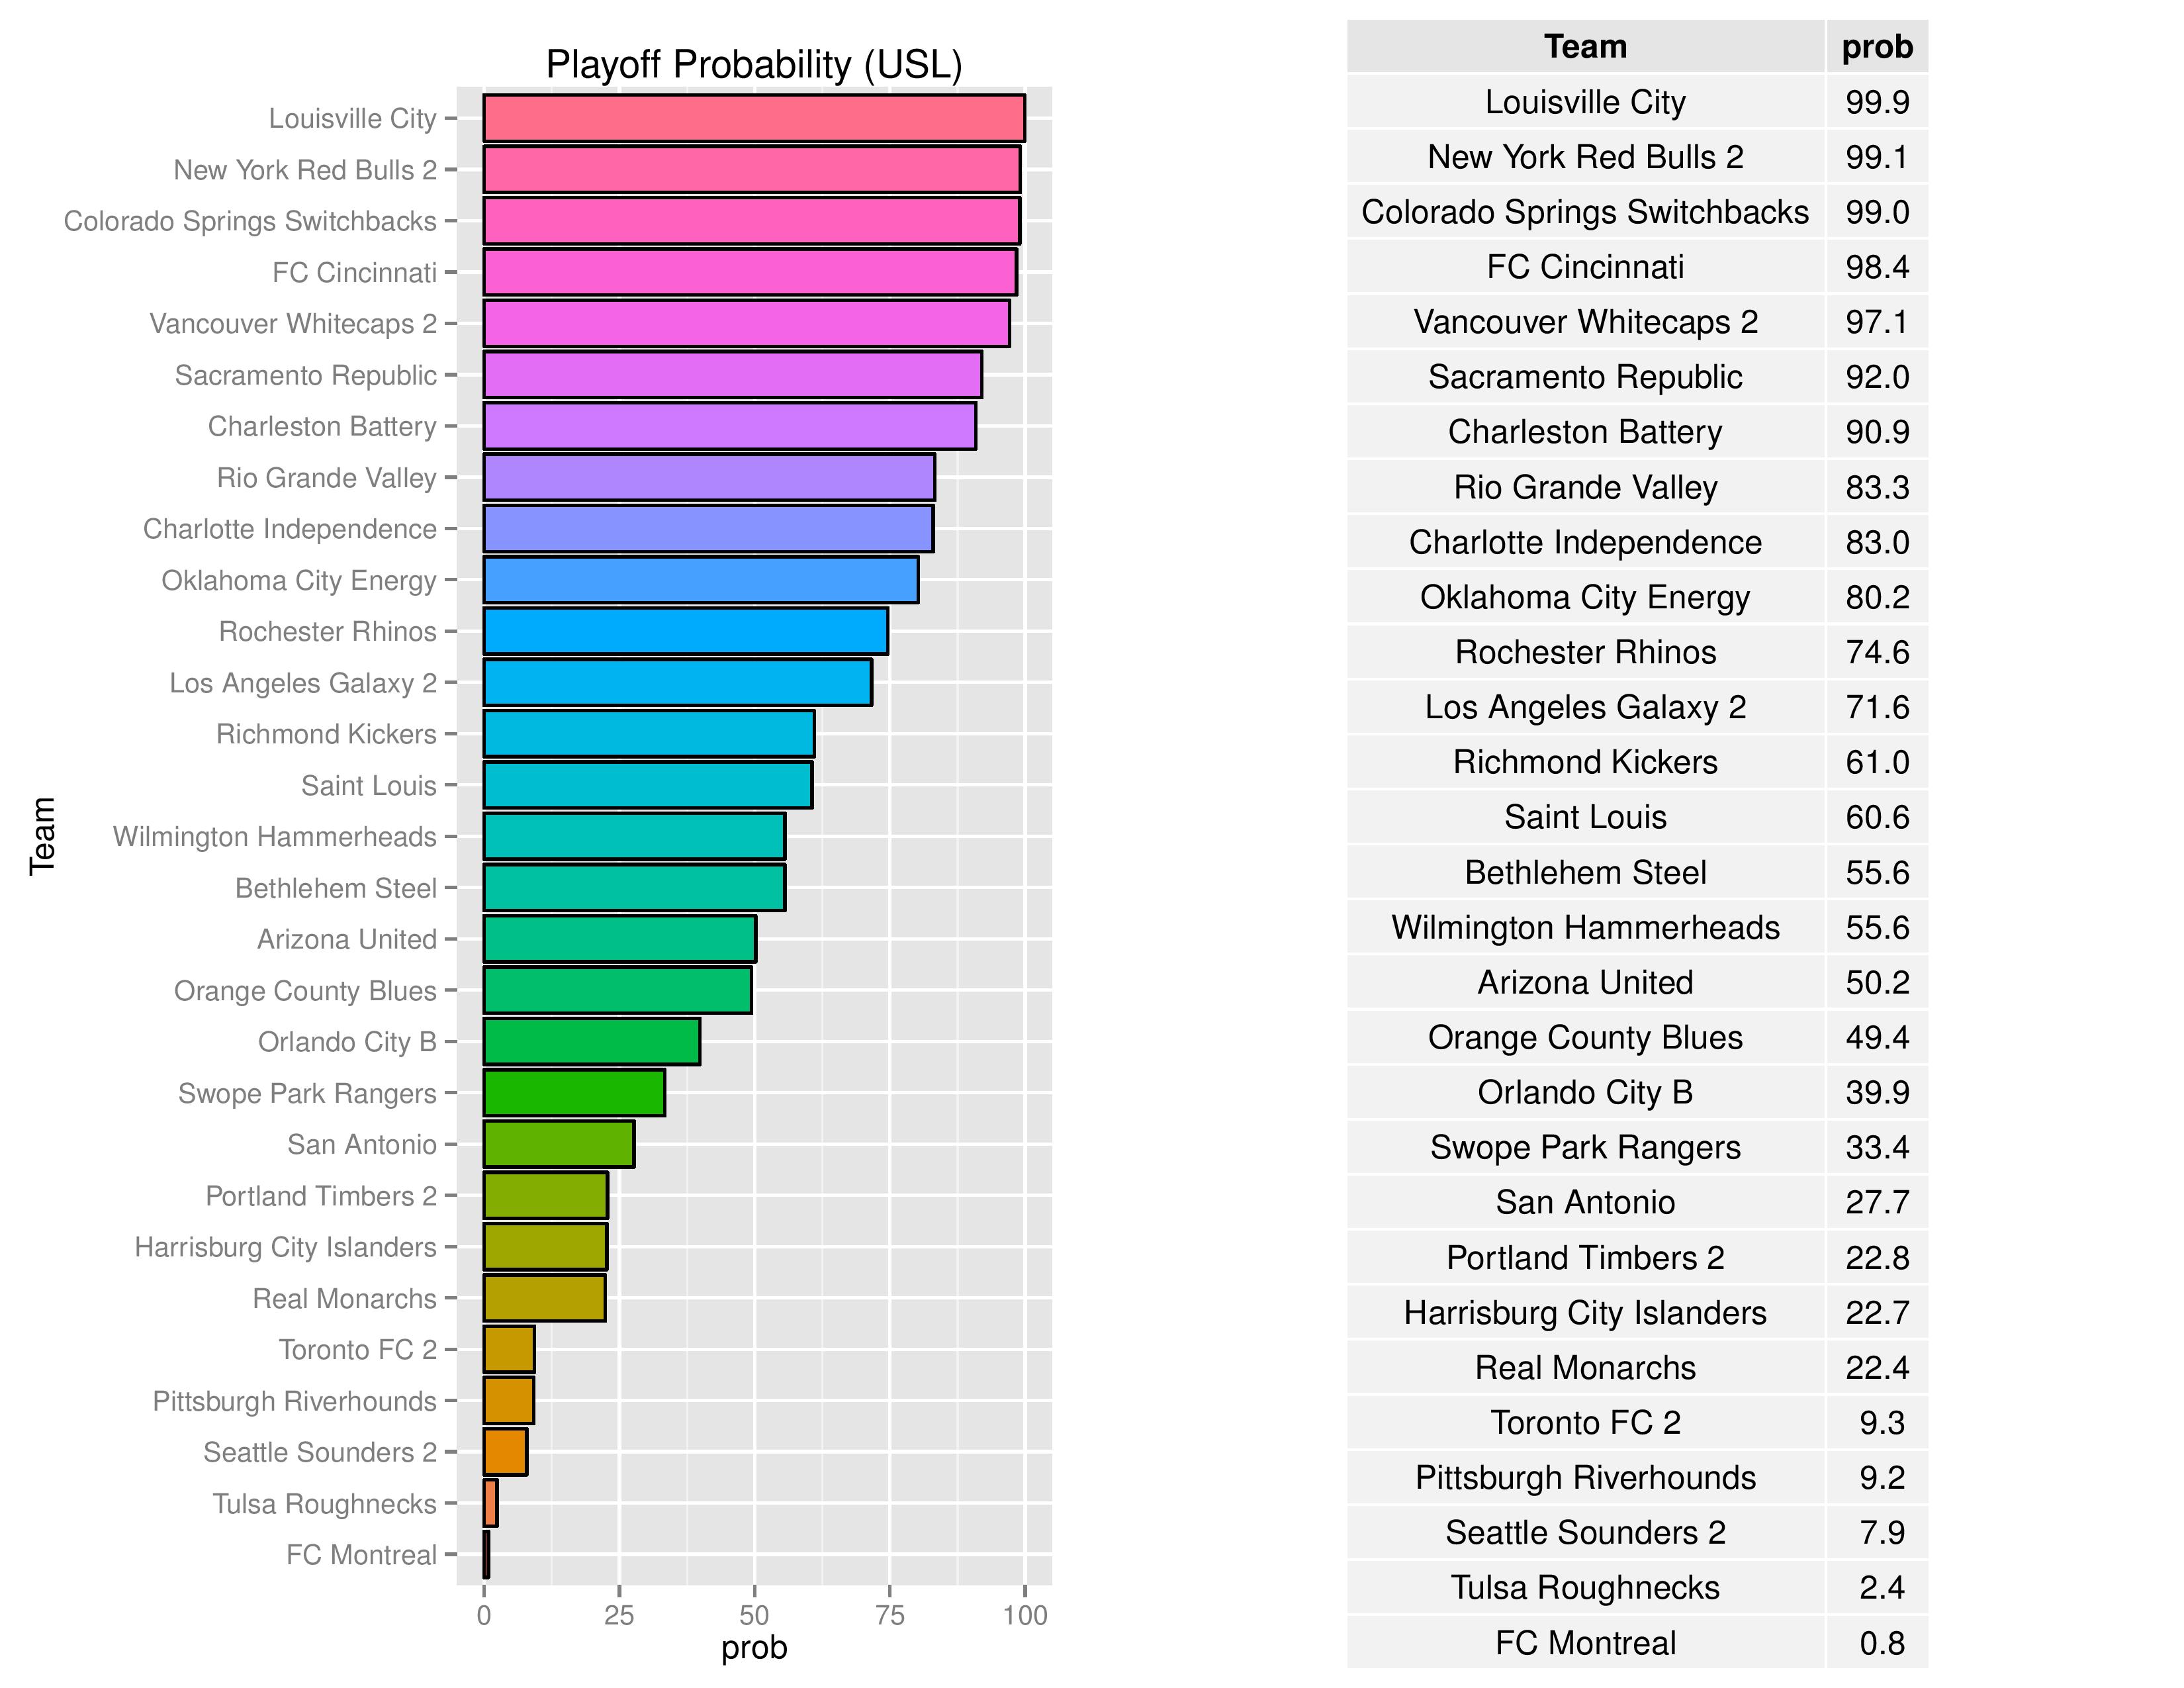
Bethlehem’s probability of making the playoffs moved up from 54.0% to 55.6%. Harrisburg’s chances continued down from 28.3% to 22.7%.
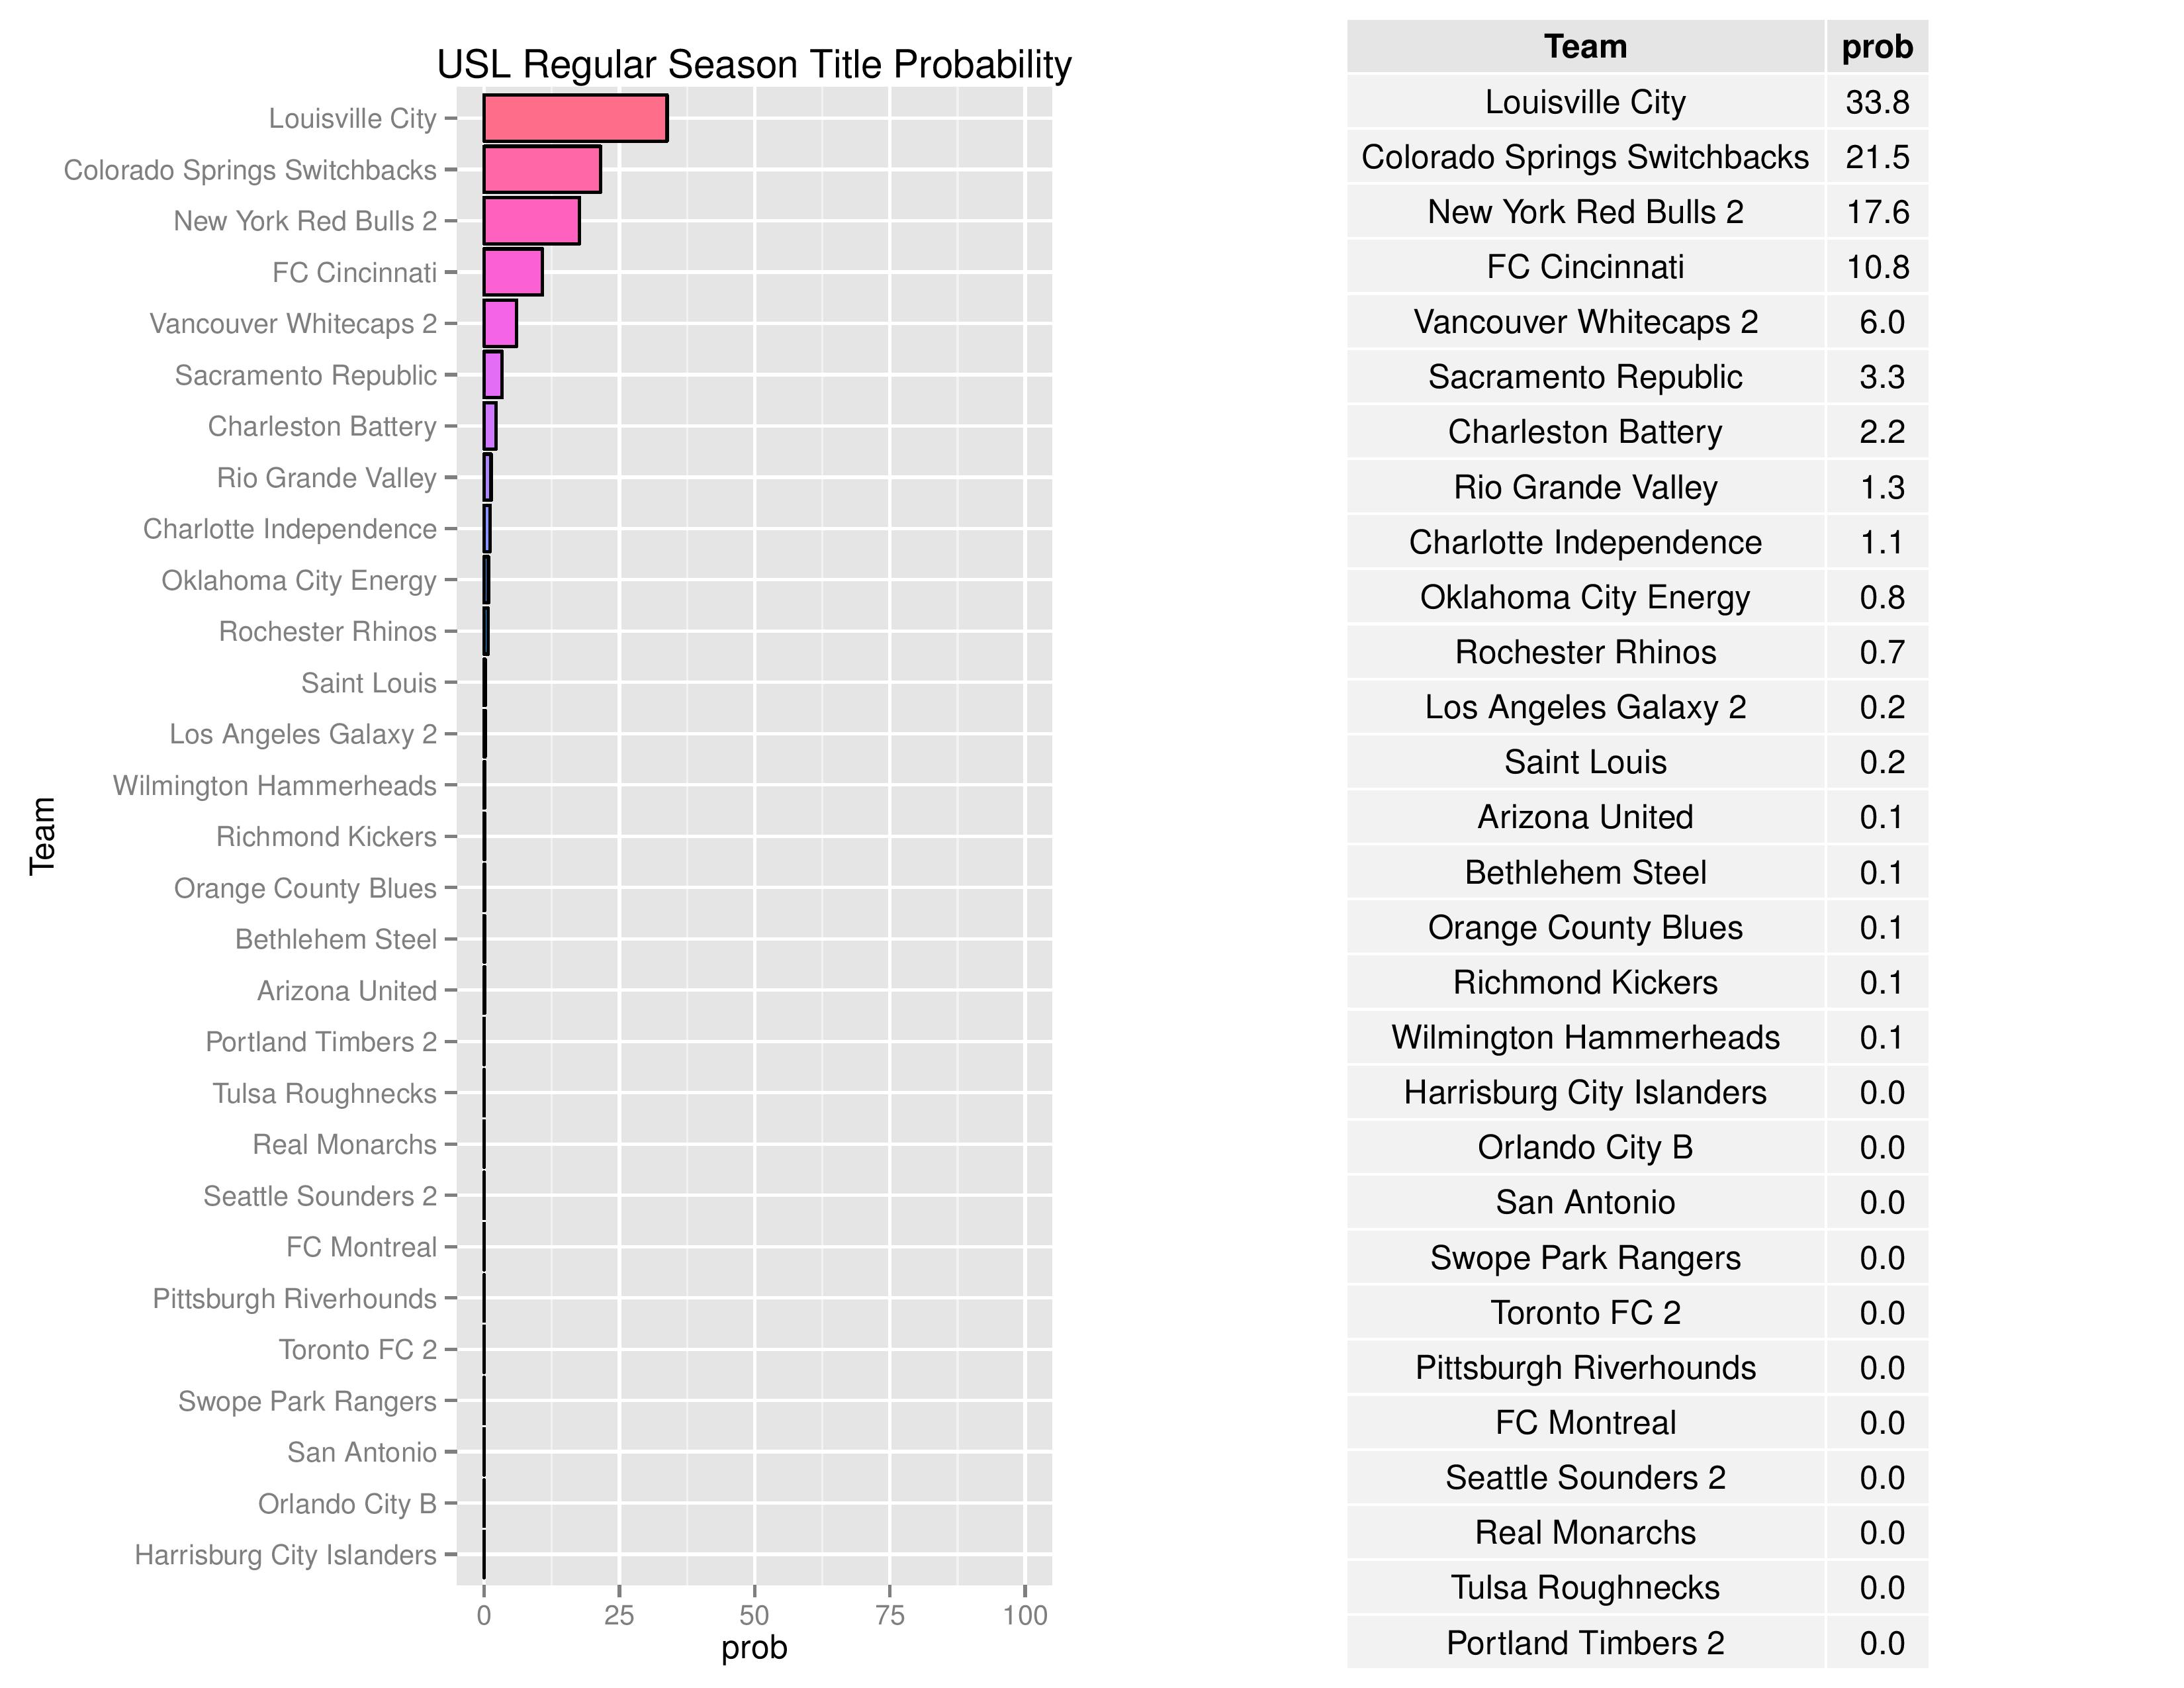
Both Bethlehem and Harrisburg City continue to have negligent chances of winning the USL regular season title.
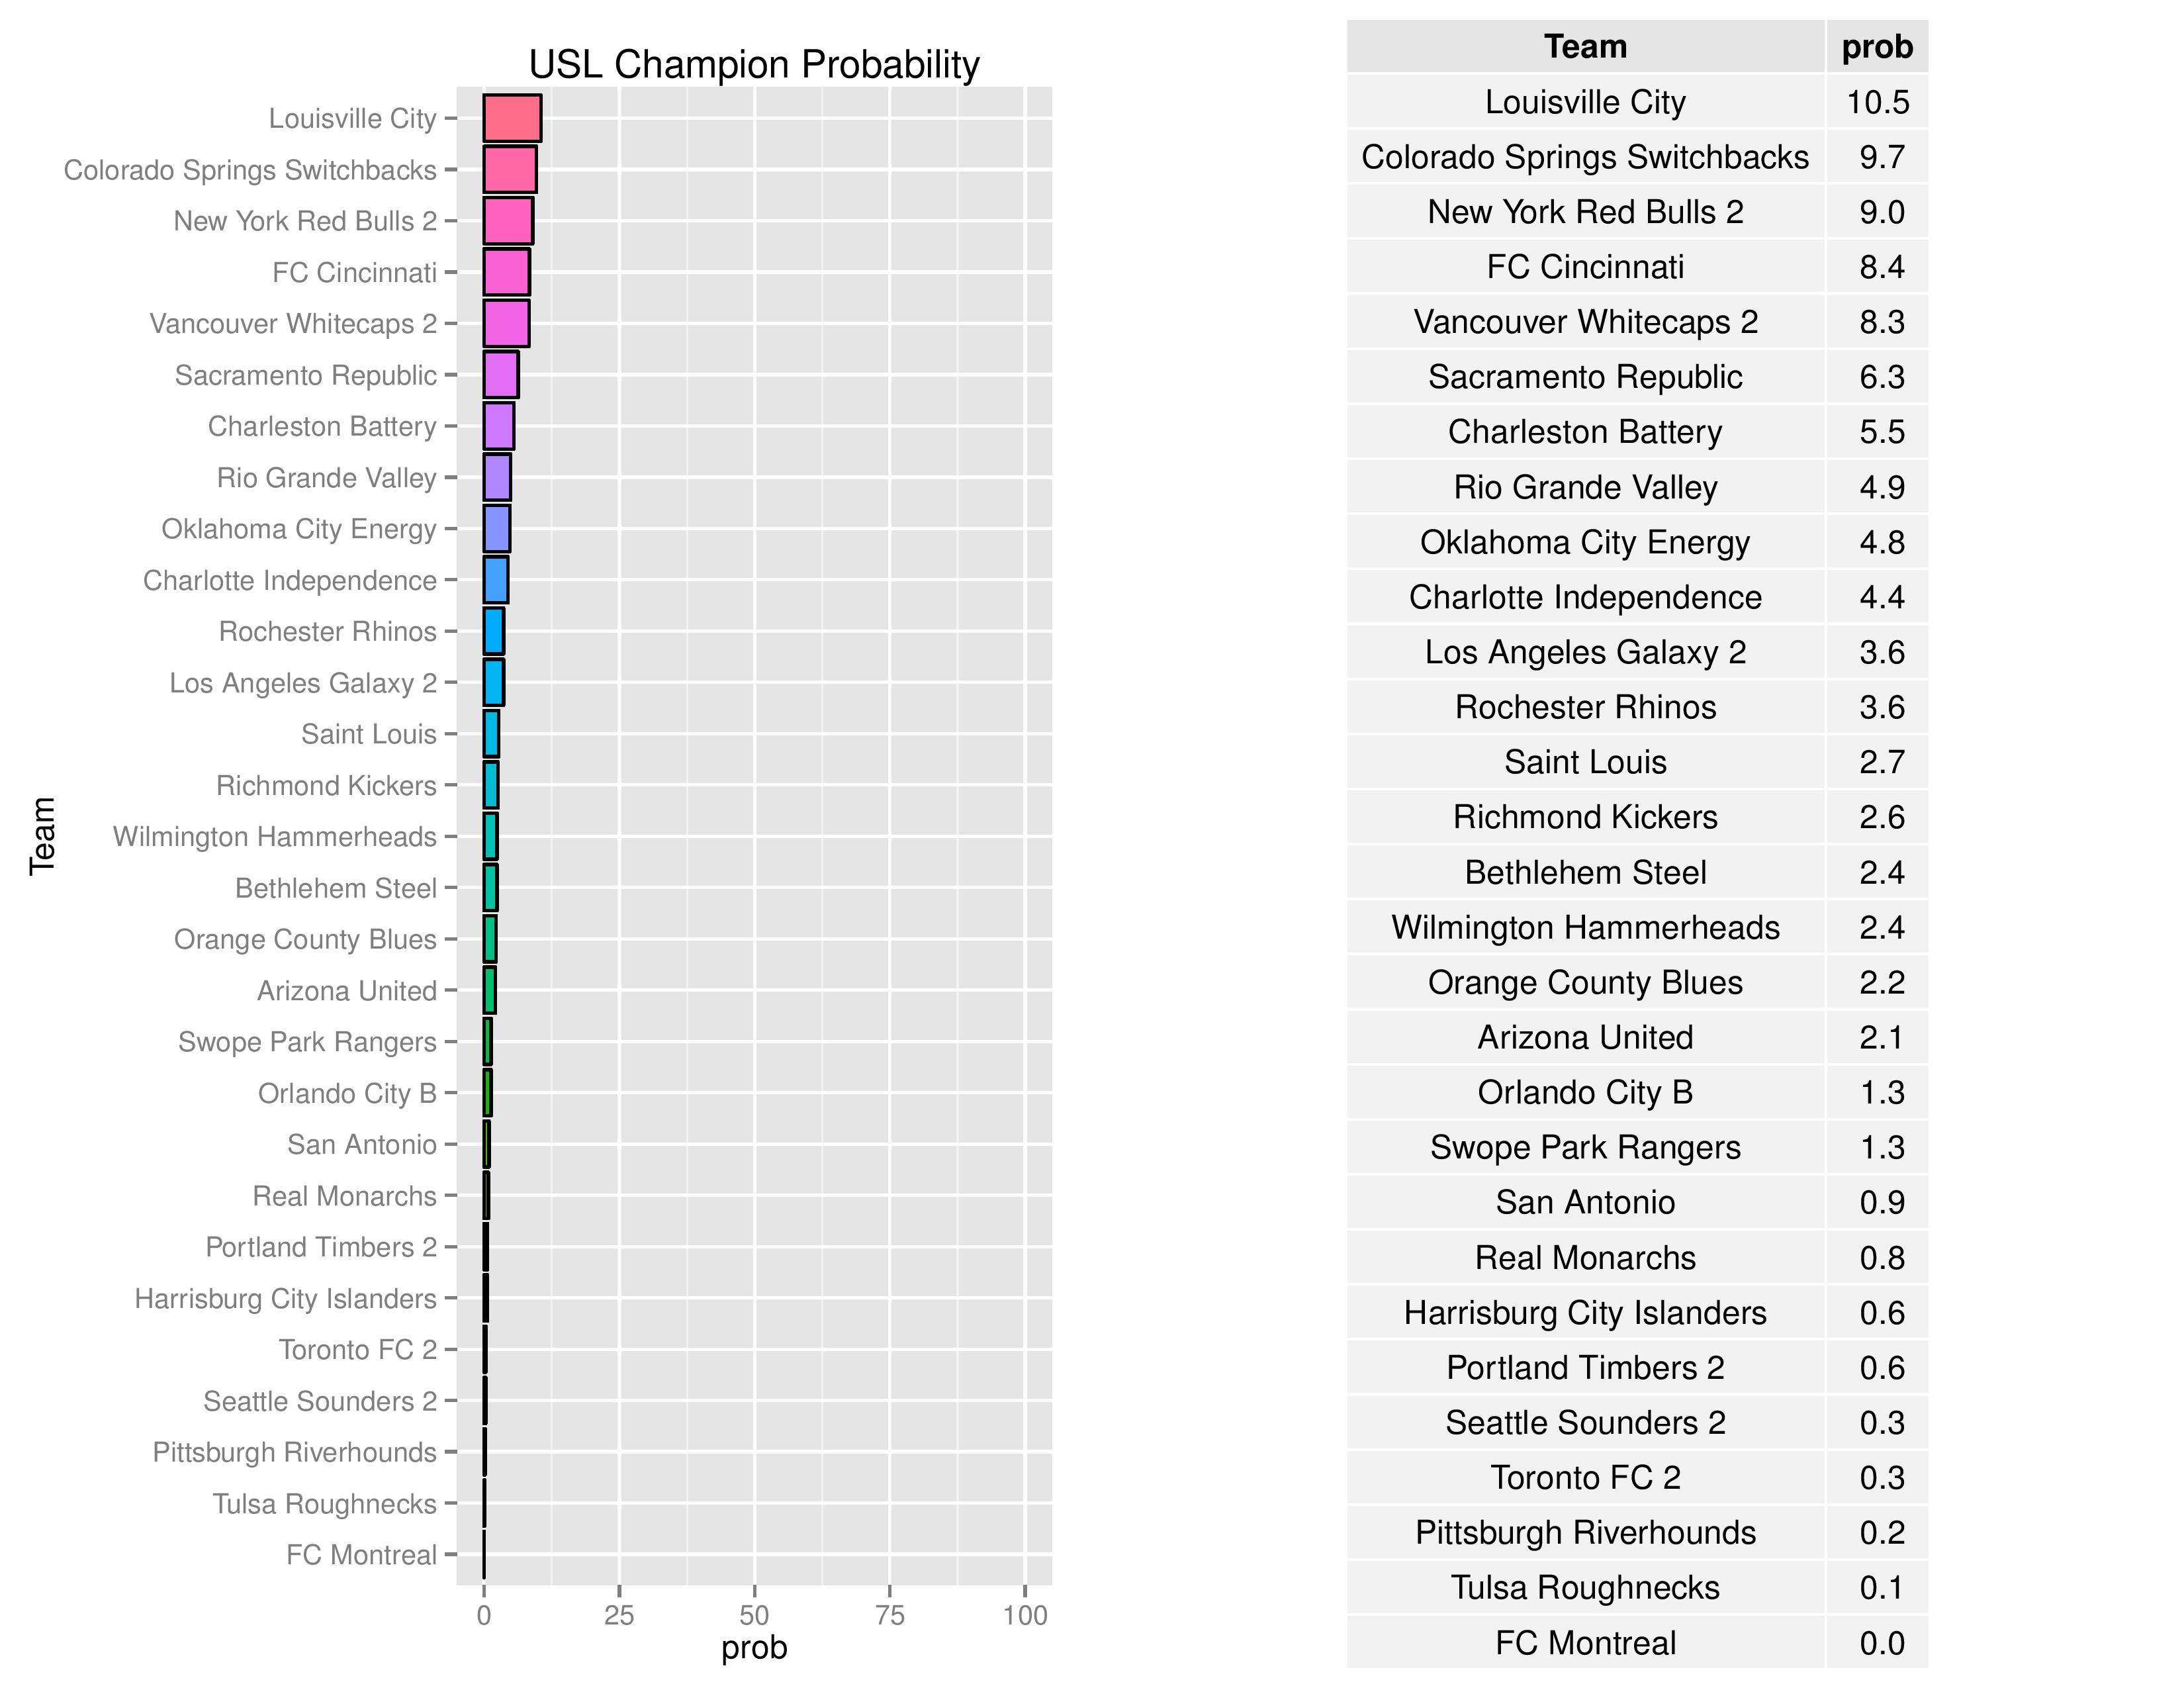
Bethlehem’s probability of winning the USL Championship remained at 2.4%. Harrisburg City’s chances dropped from 0.9% to 0.6%.
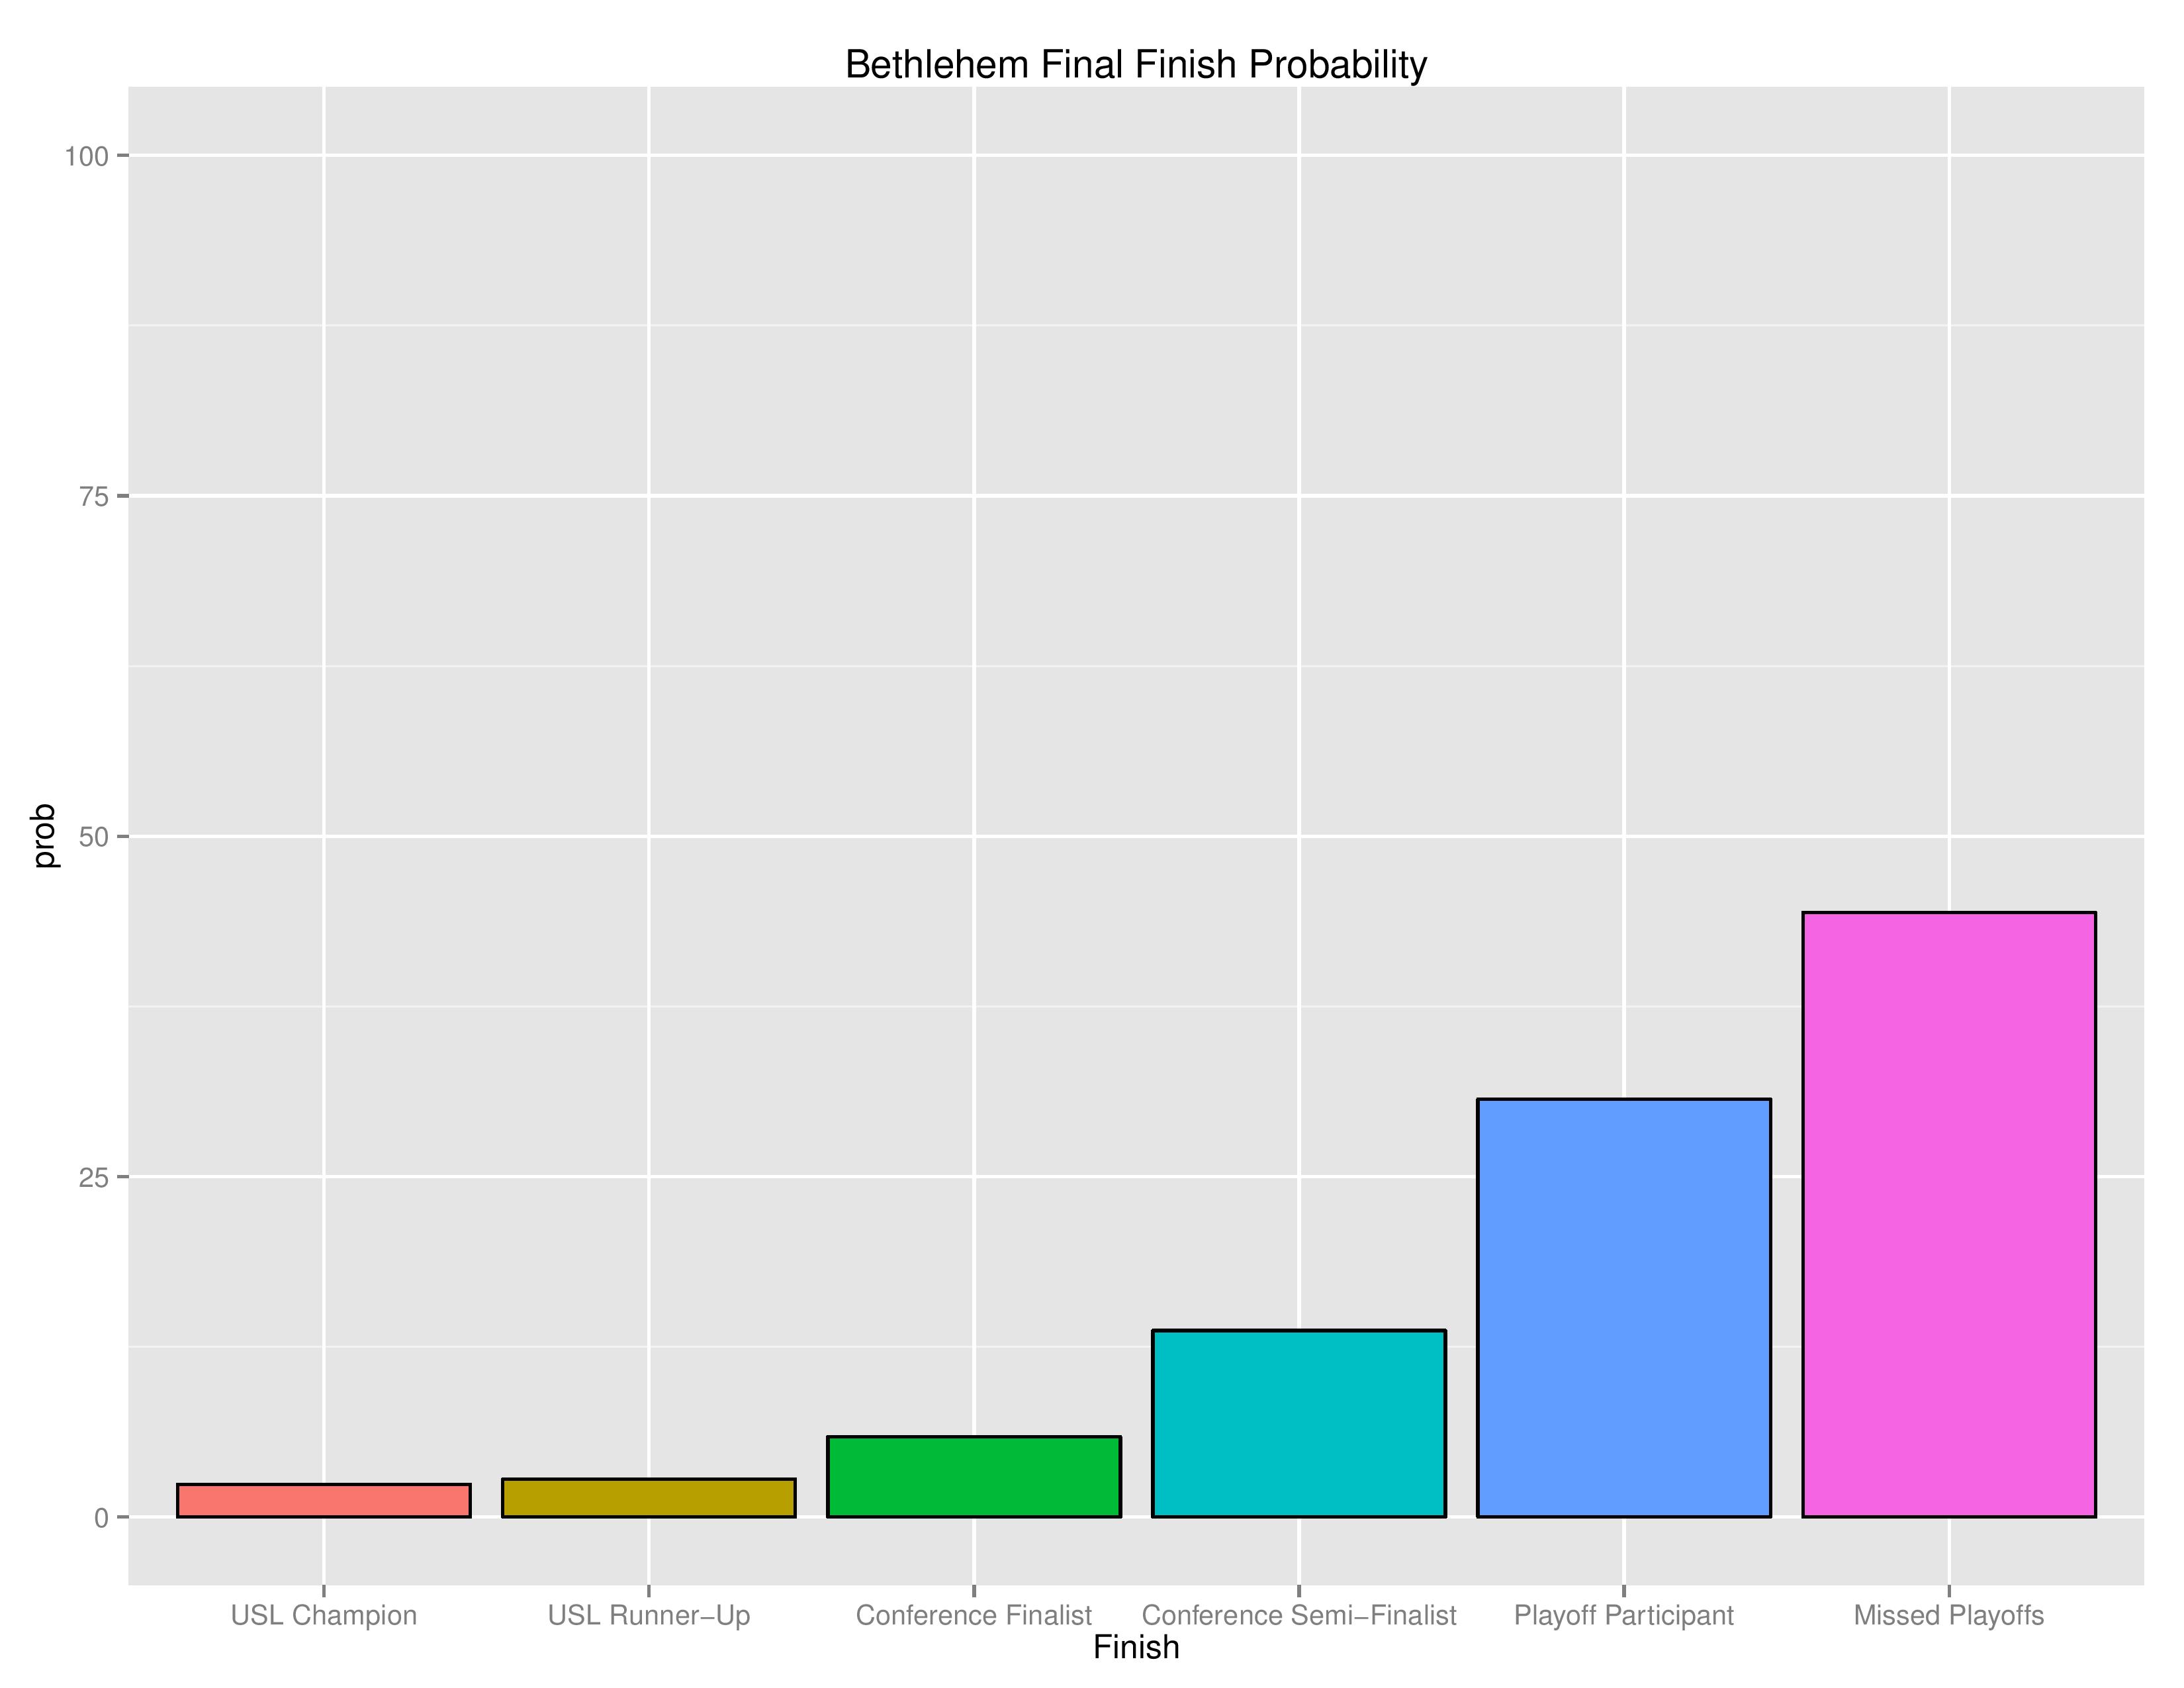
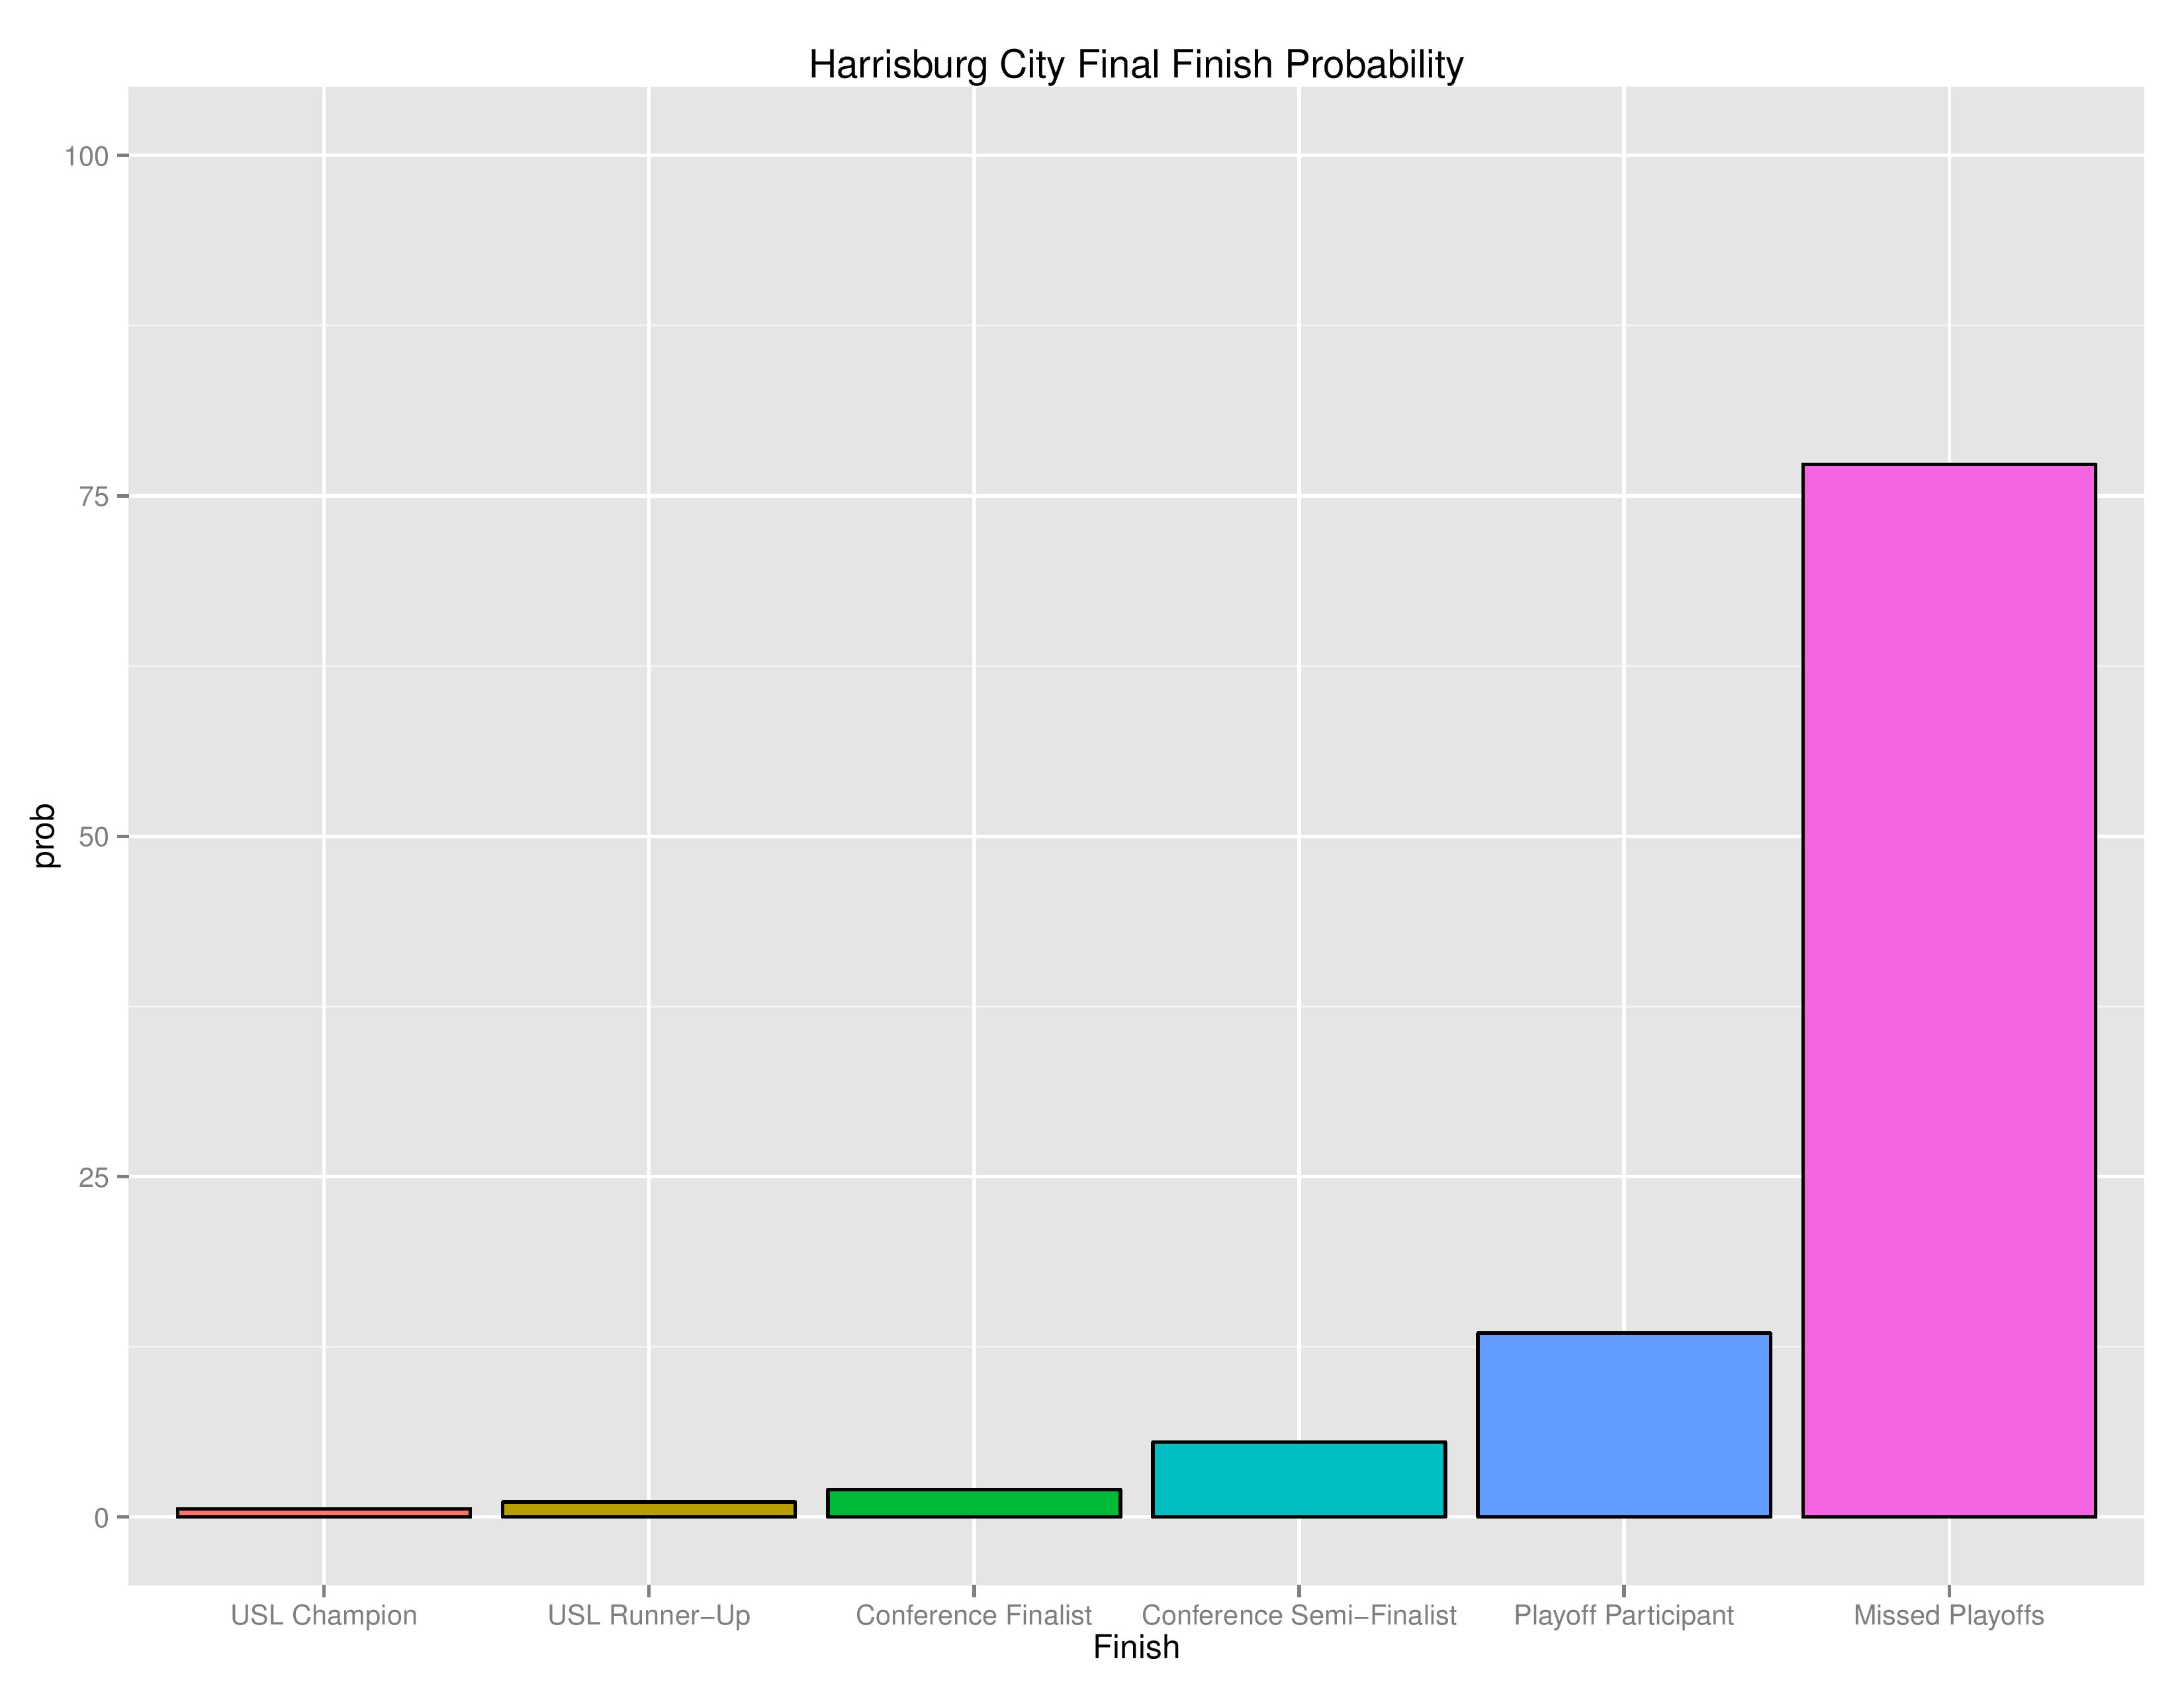
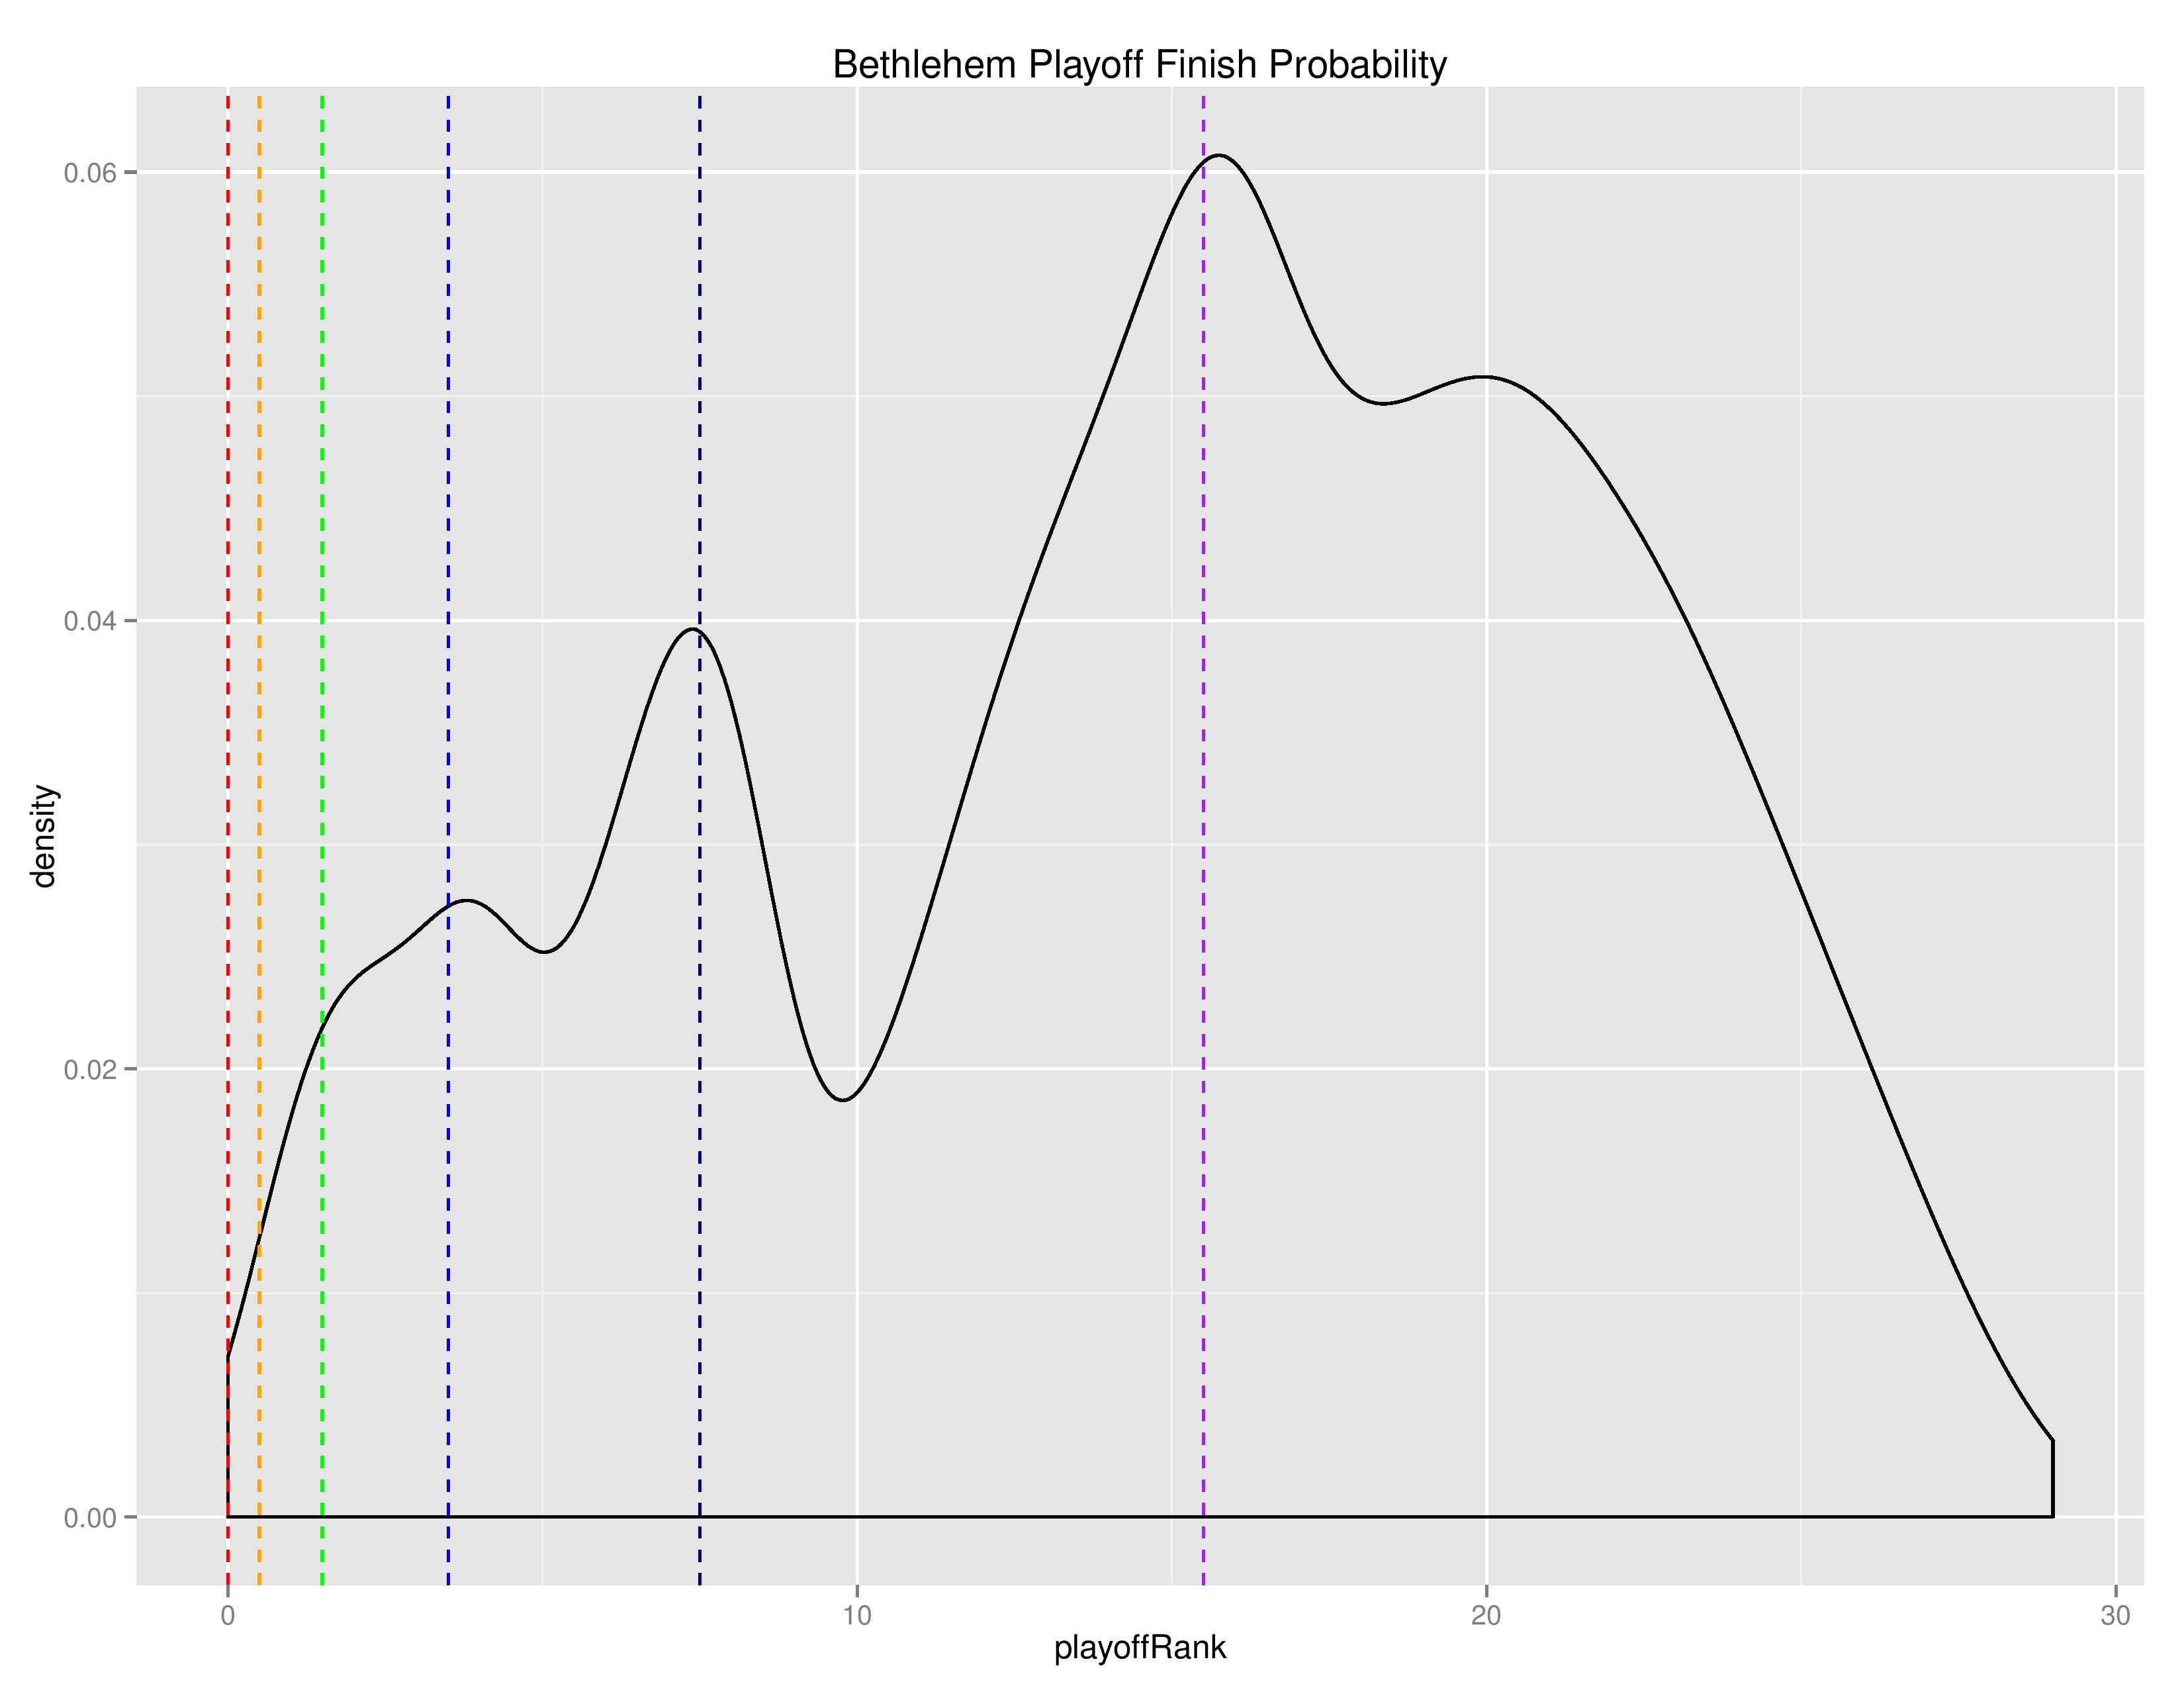
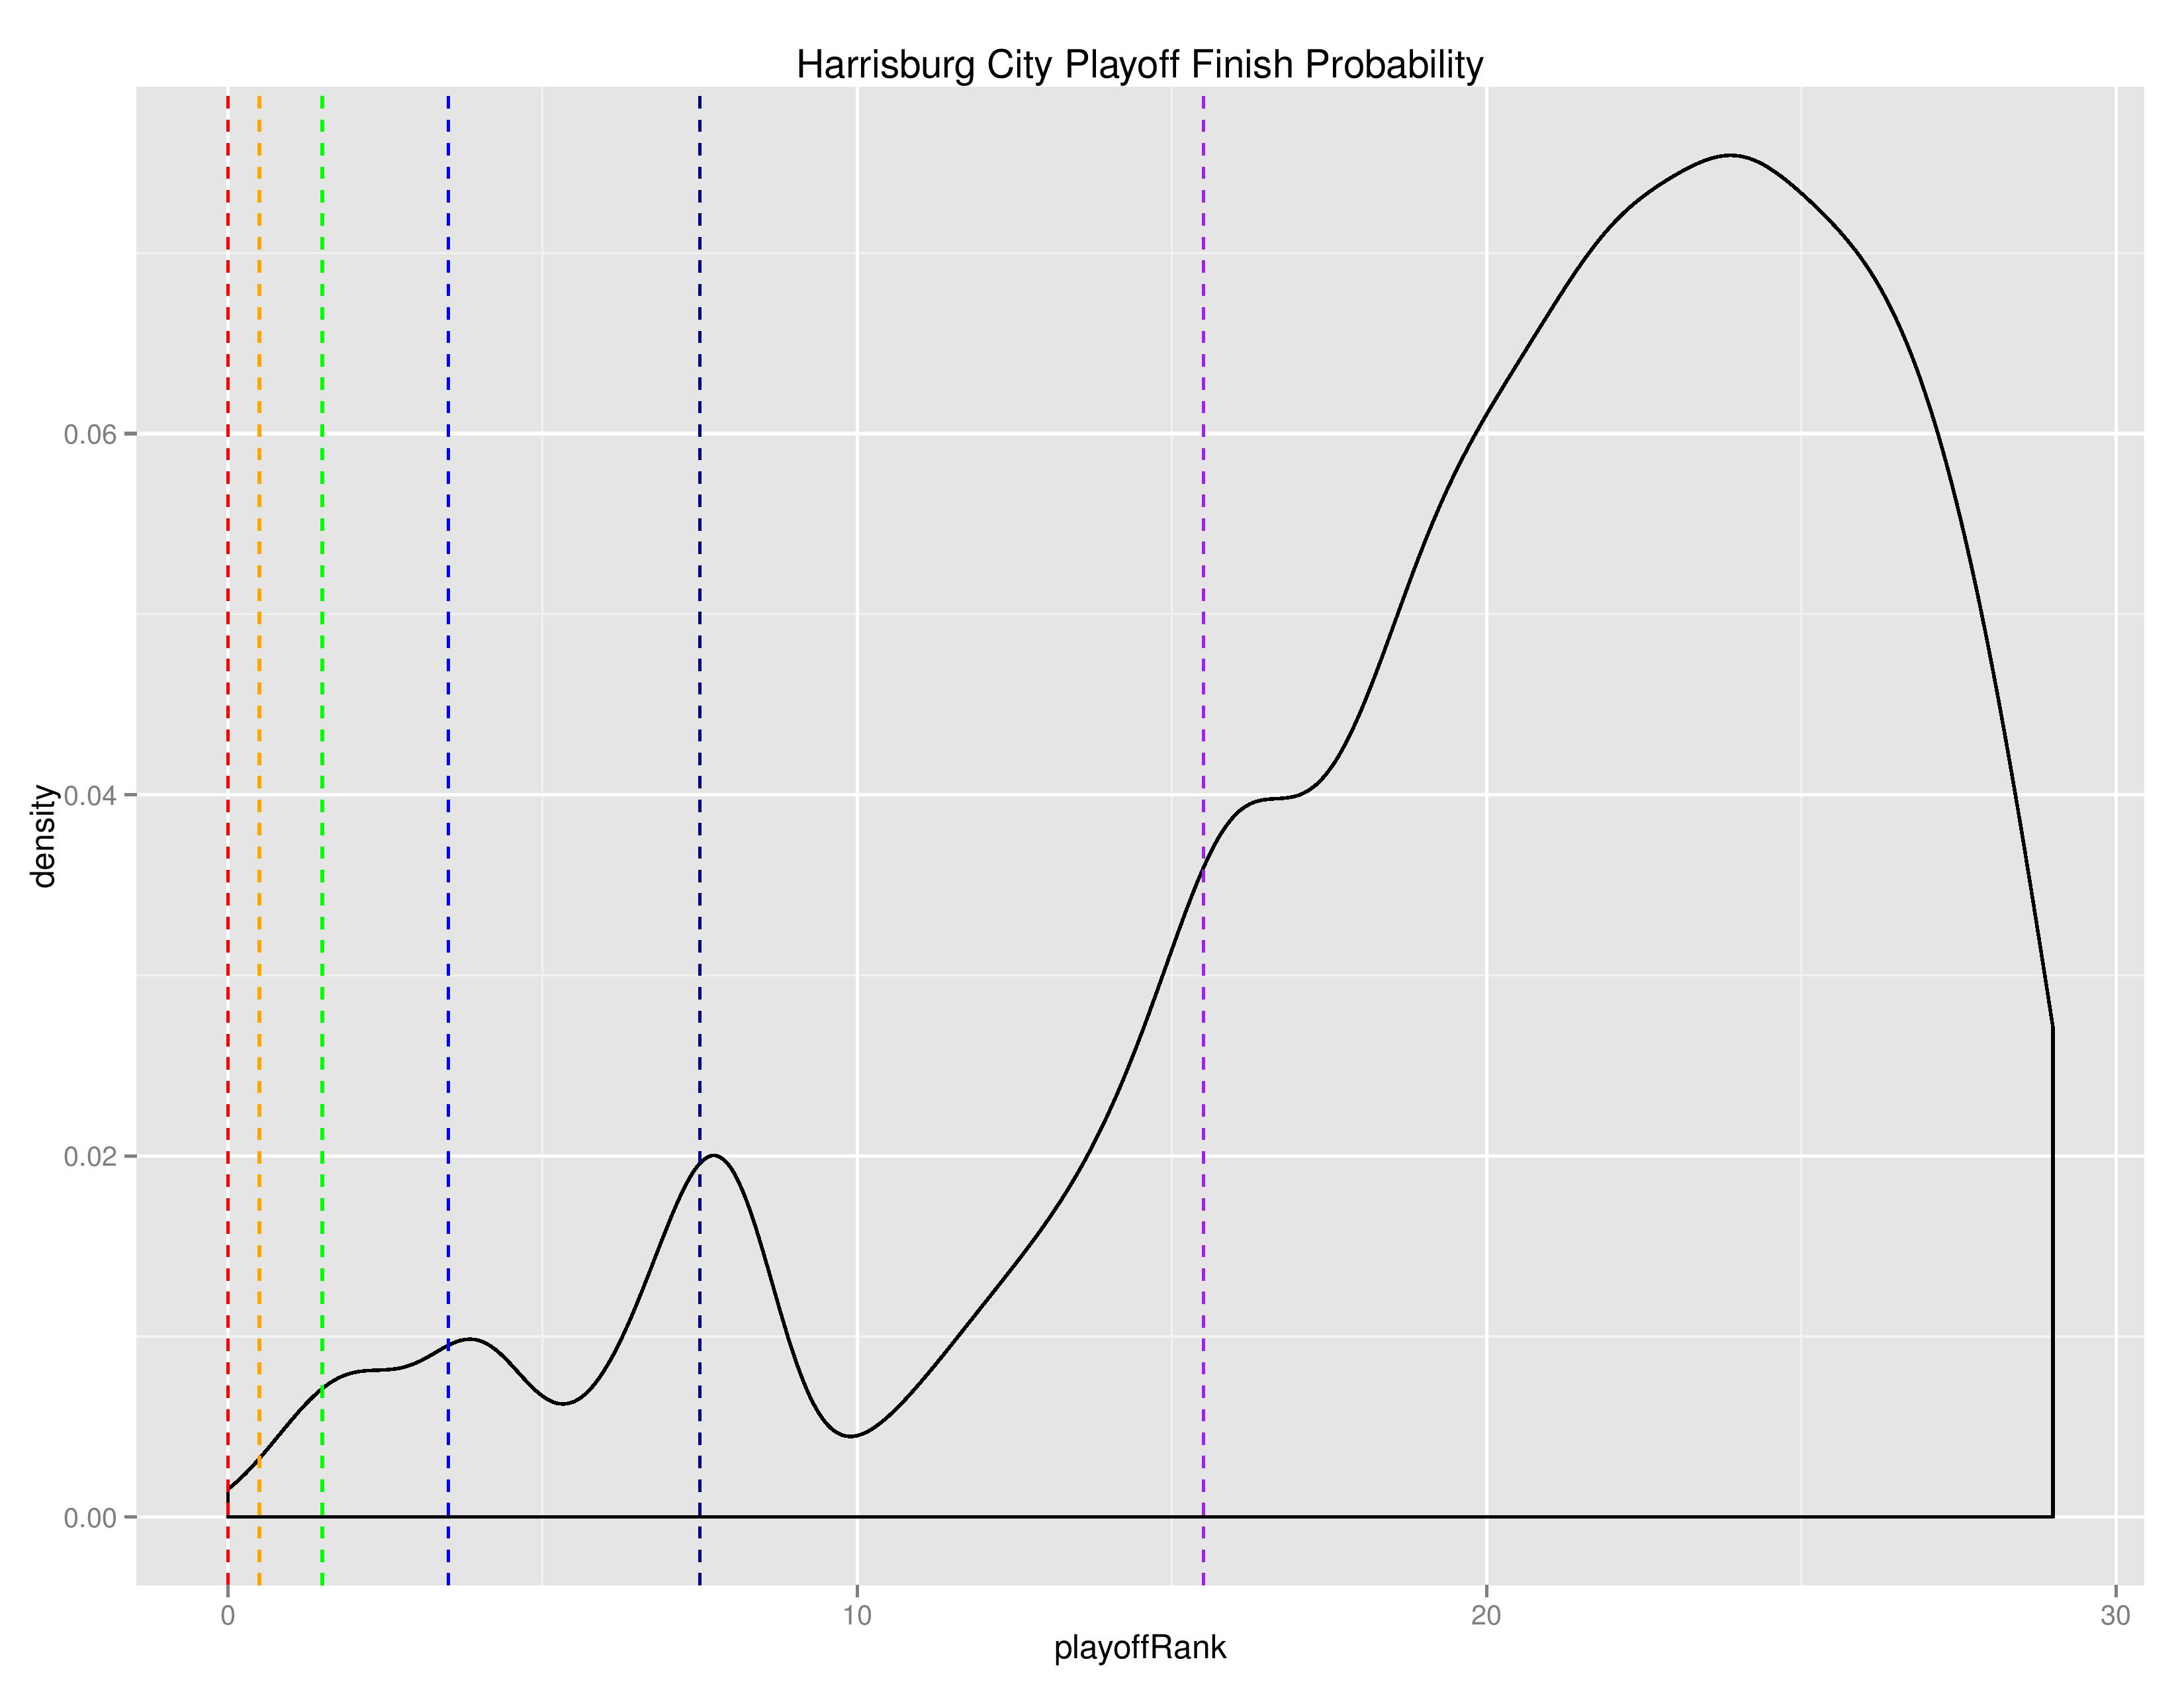
As with MLS, the below density charts show the relative probabilities of Bethlehem and Harrisburg finishing for their final playoff-rank.
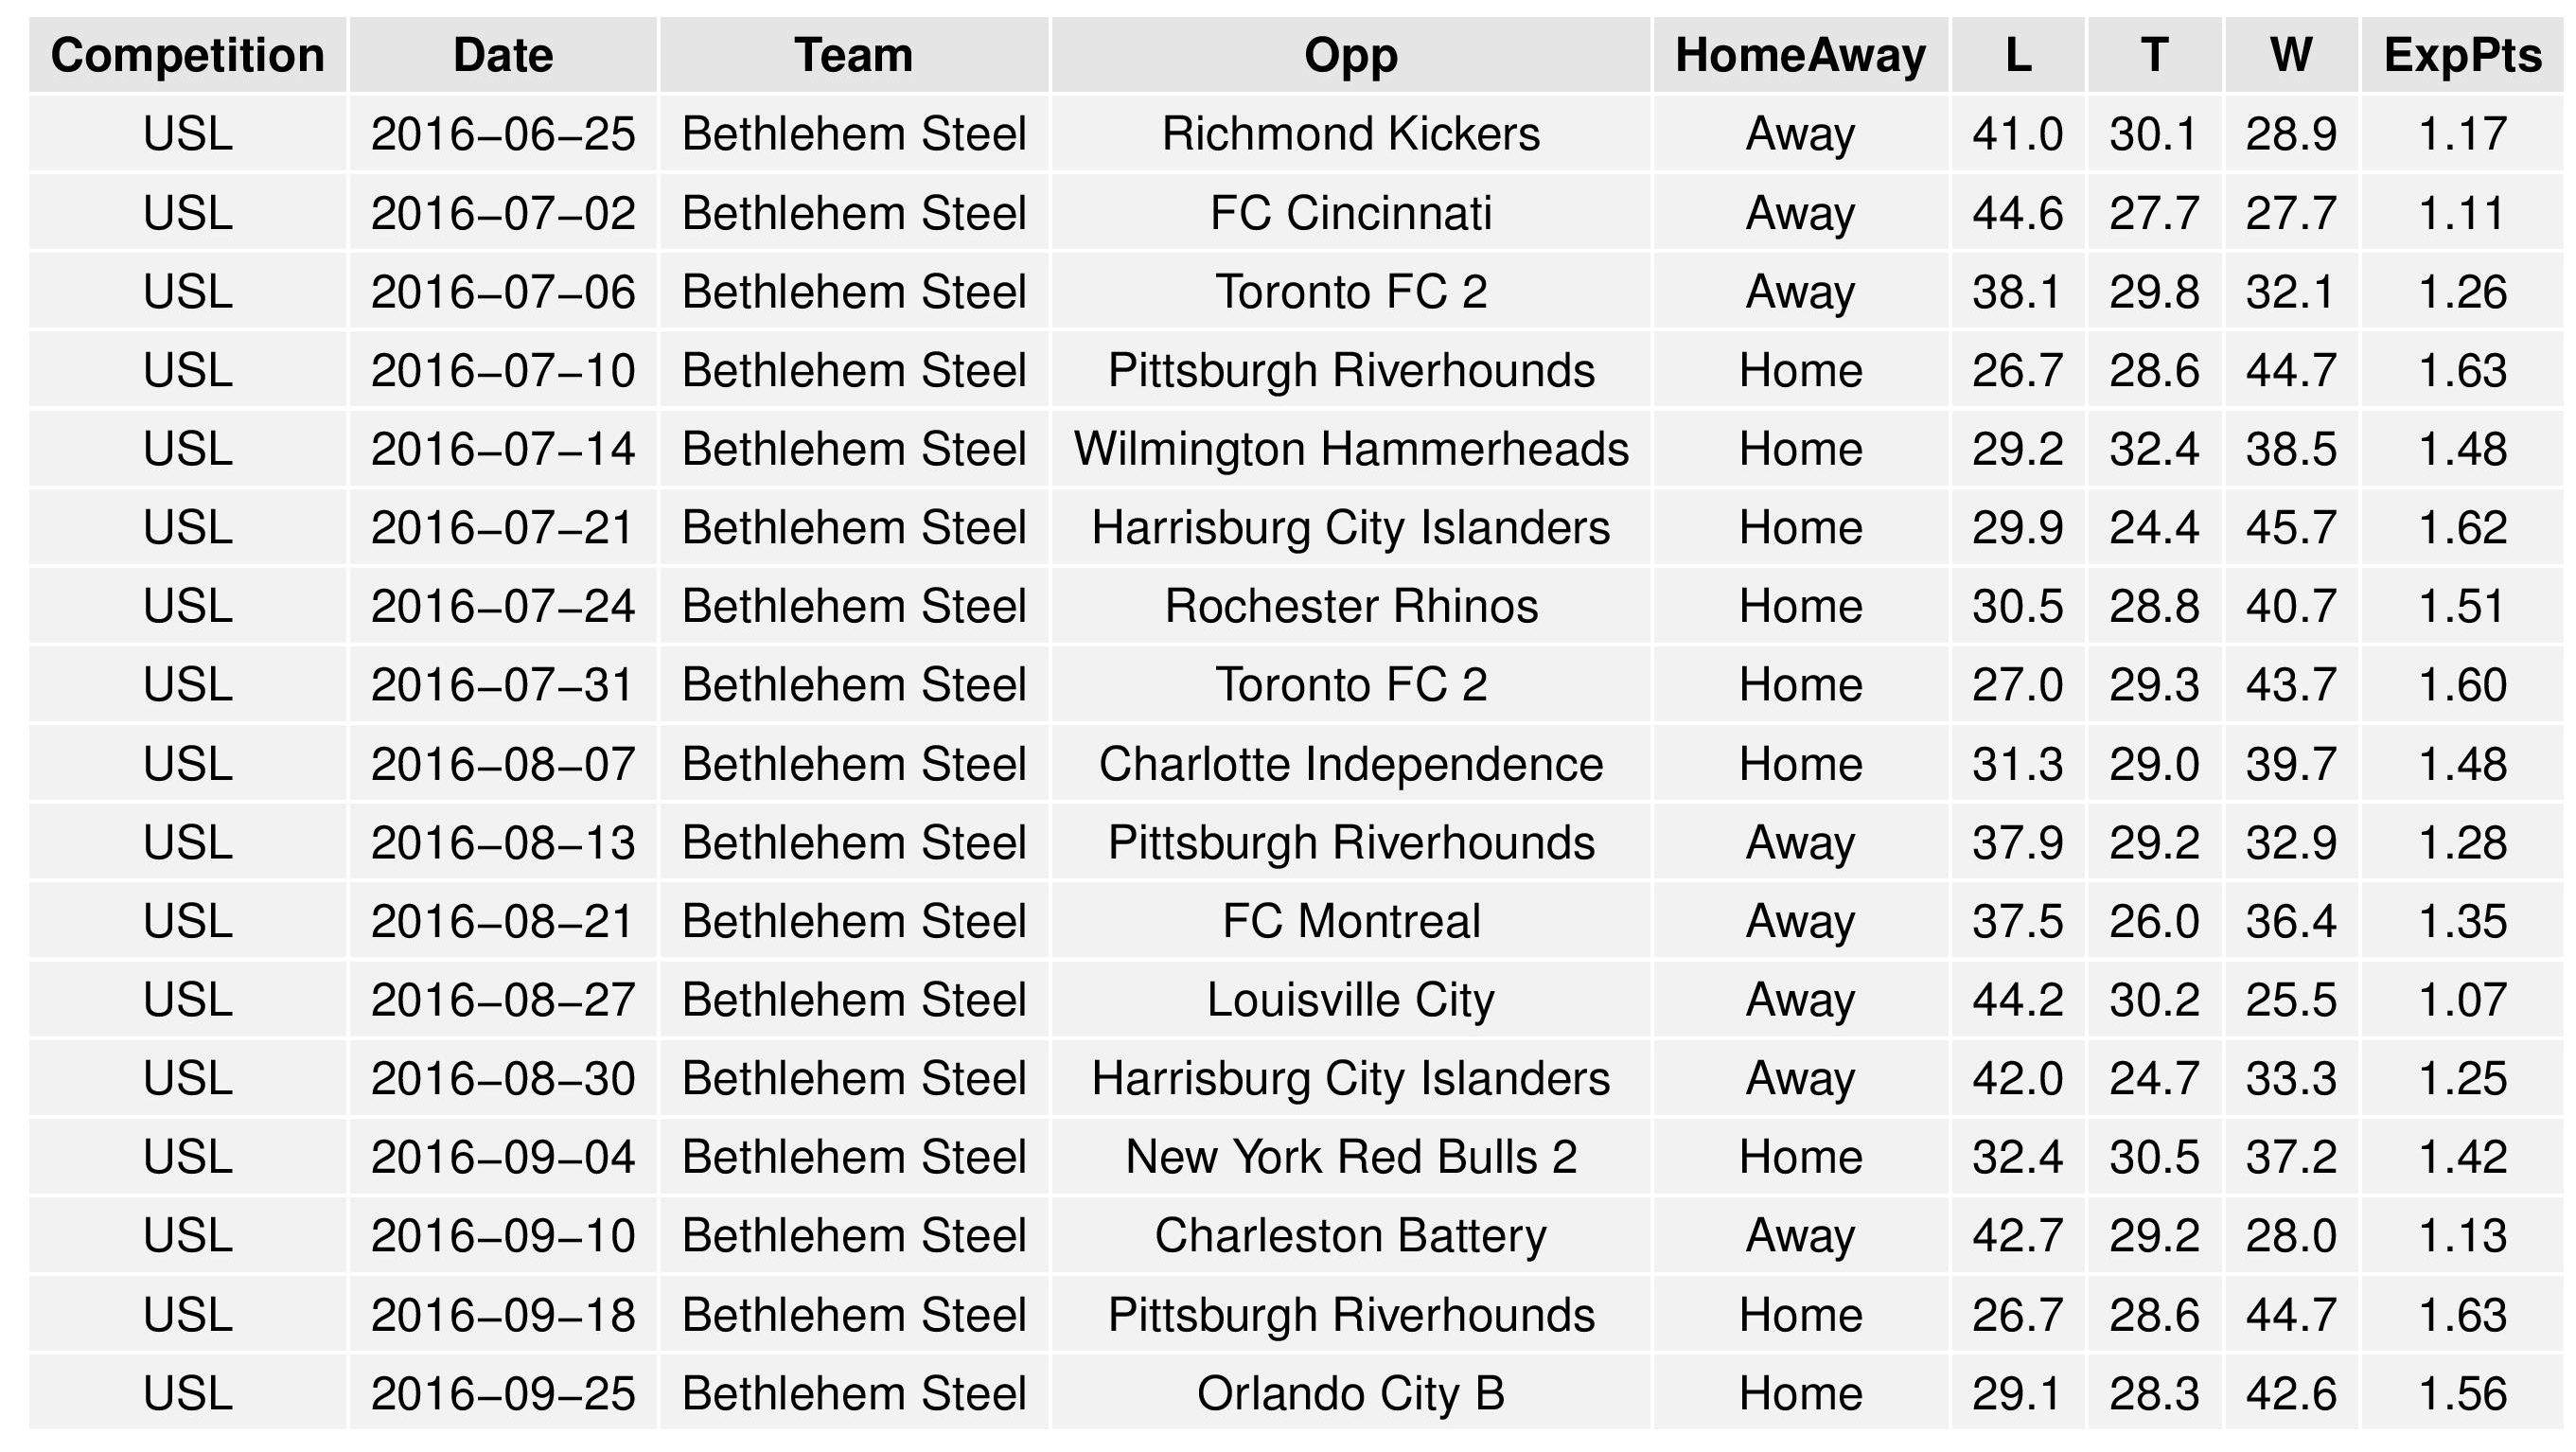
The following are the upcoming matches and associated probabilities for Bethlehem and Harrisburg.
The following tables show the average simulation results. They are divided into two tables to present better to your screen.

Changes Over Time
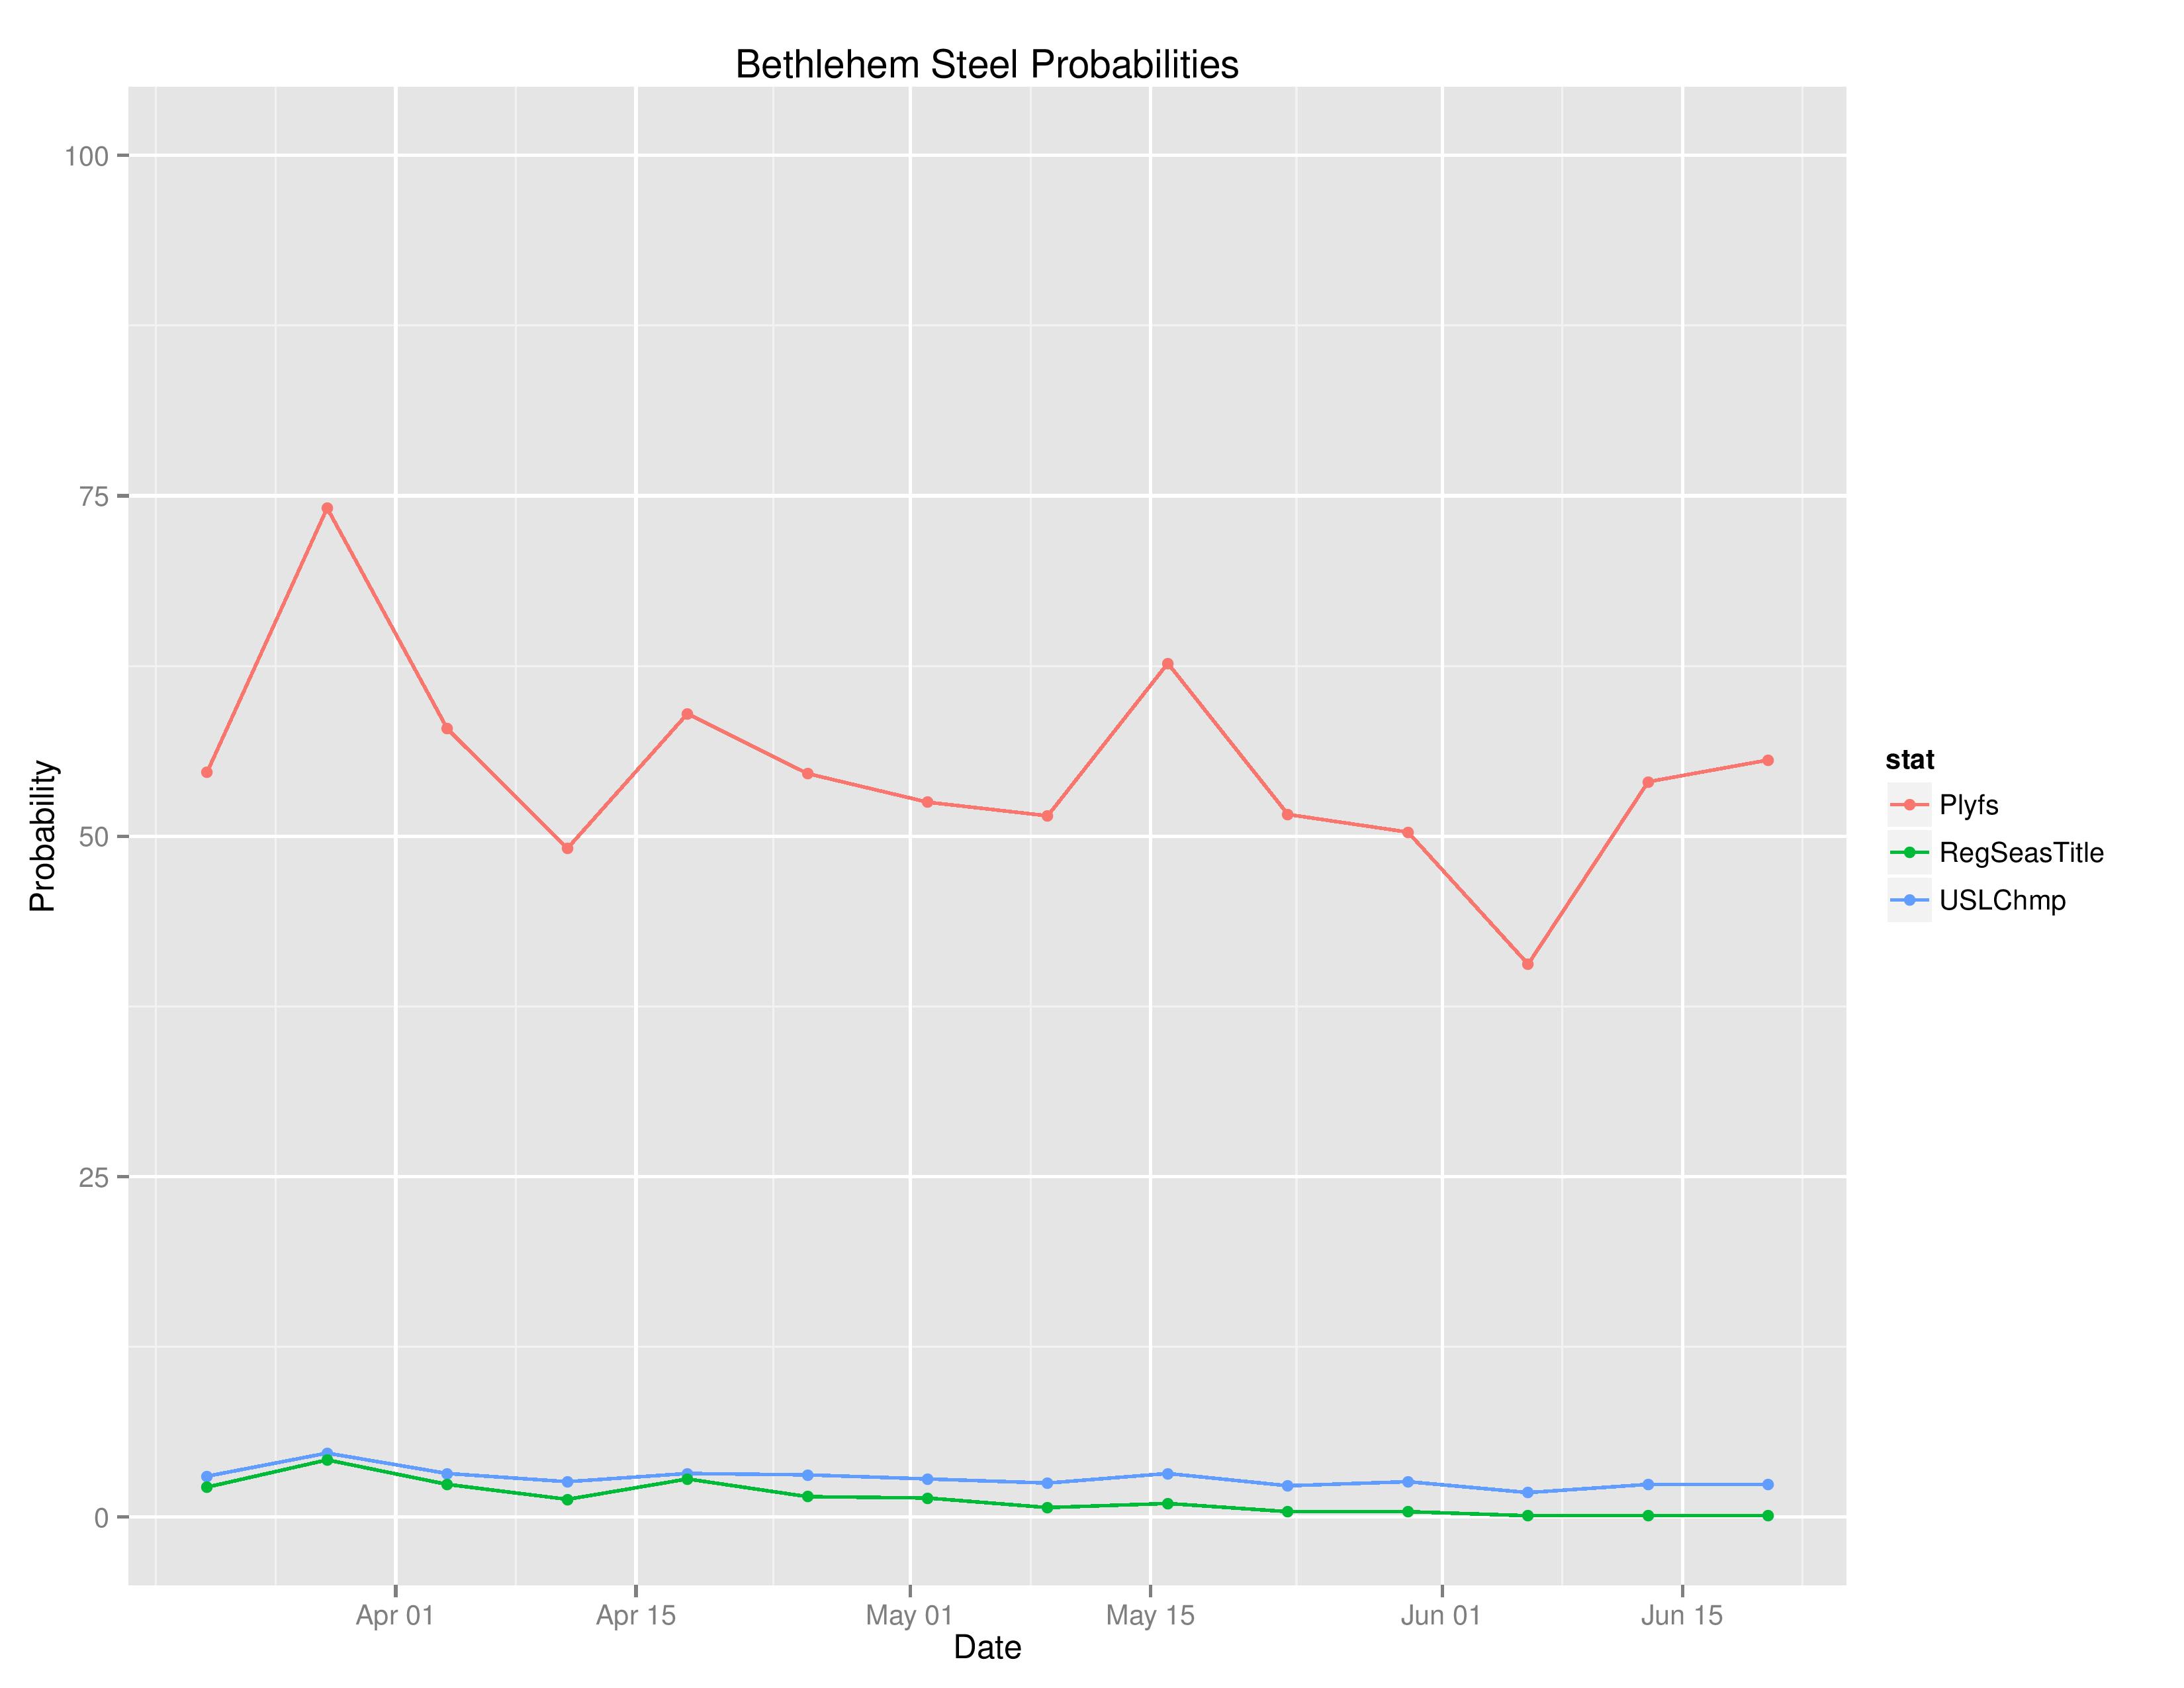
Above shows the probabilities of various outcomes for Bethlehem over the course of the season.
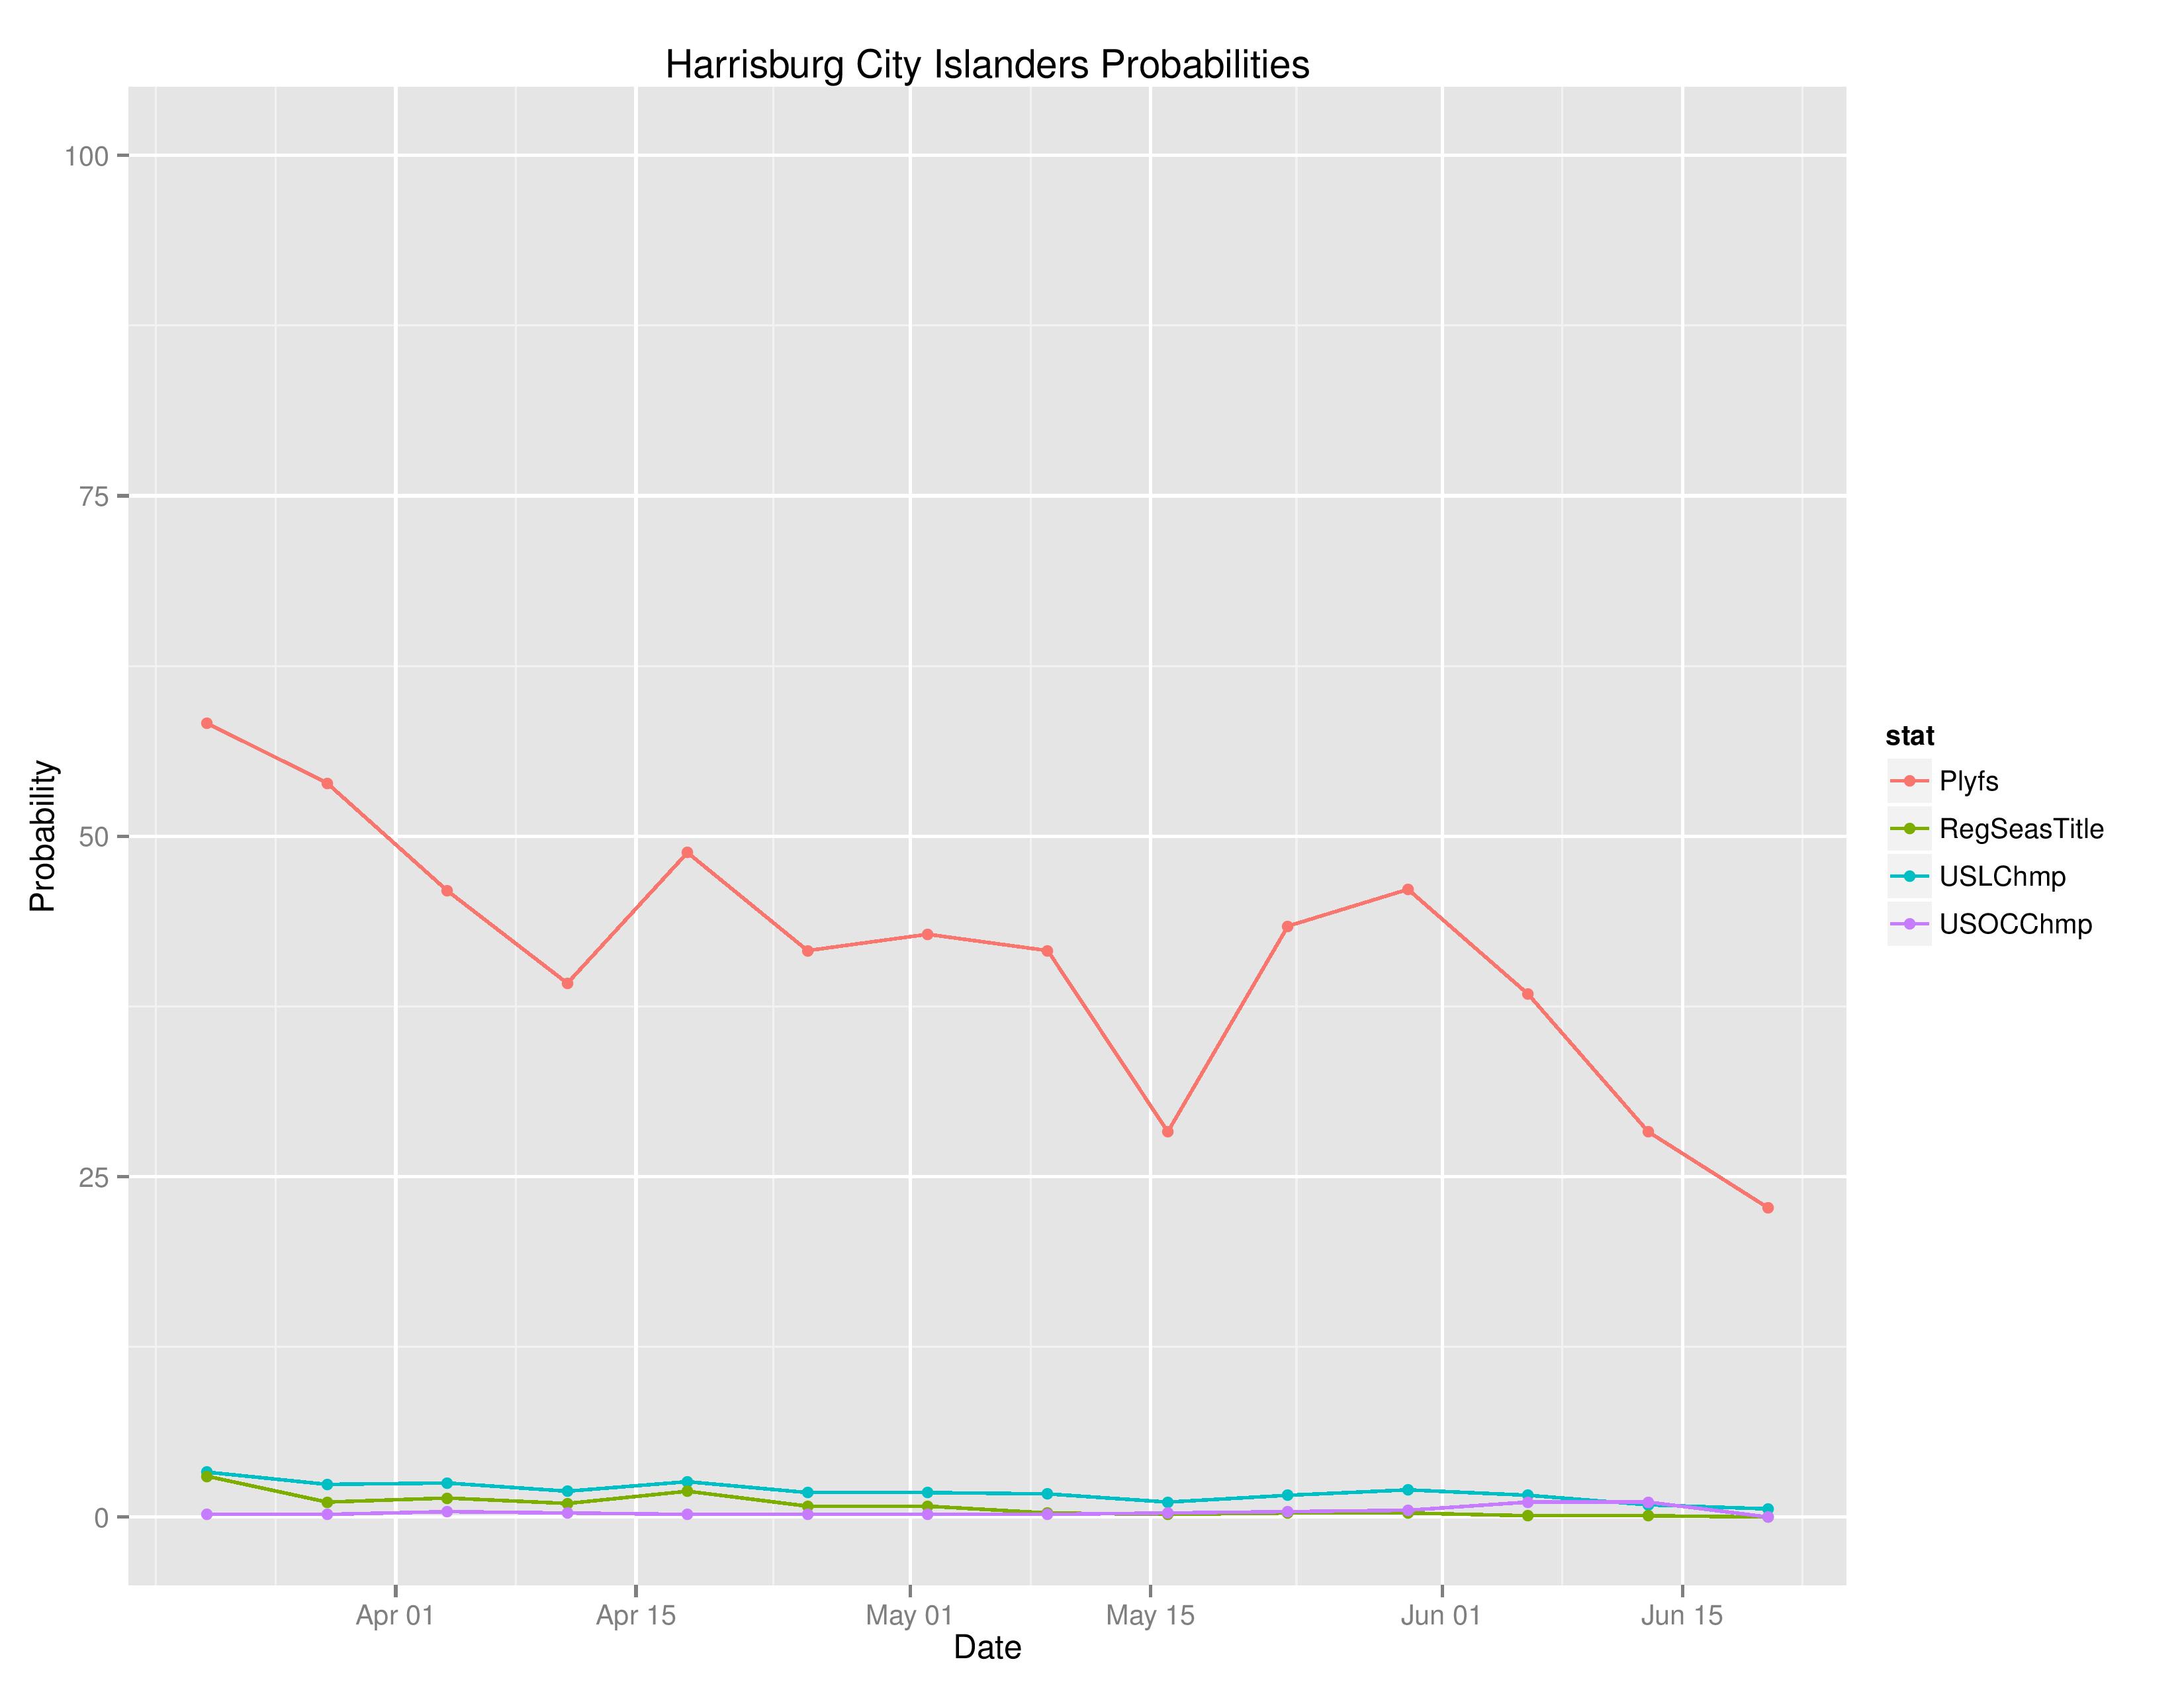
Above shows the probabilities of various outcomes for Harrisburg over the course of the season.
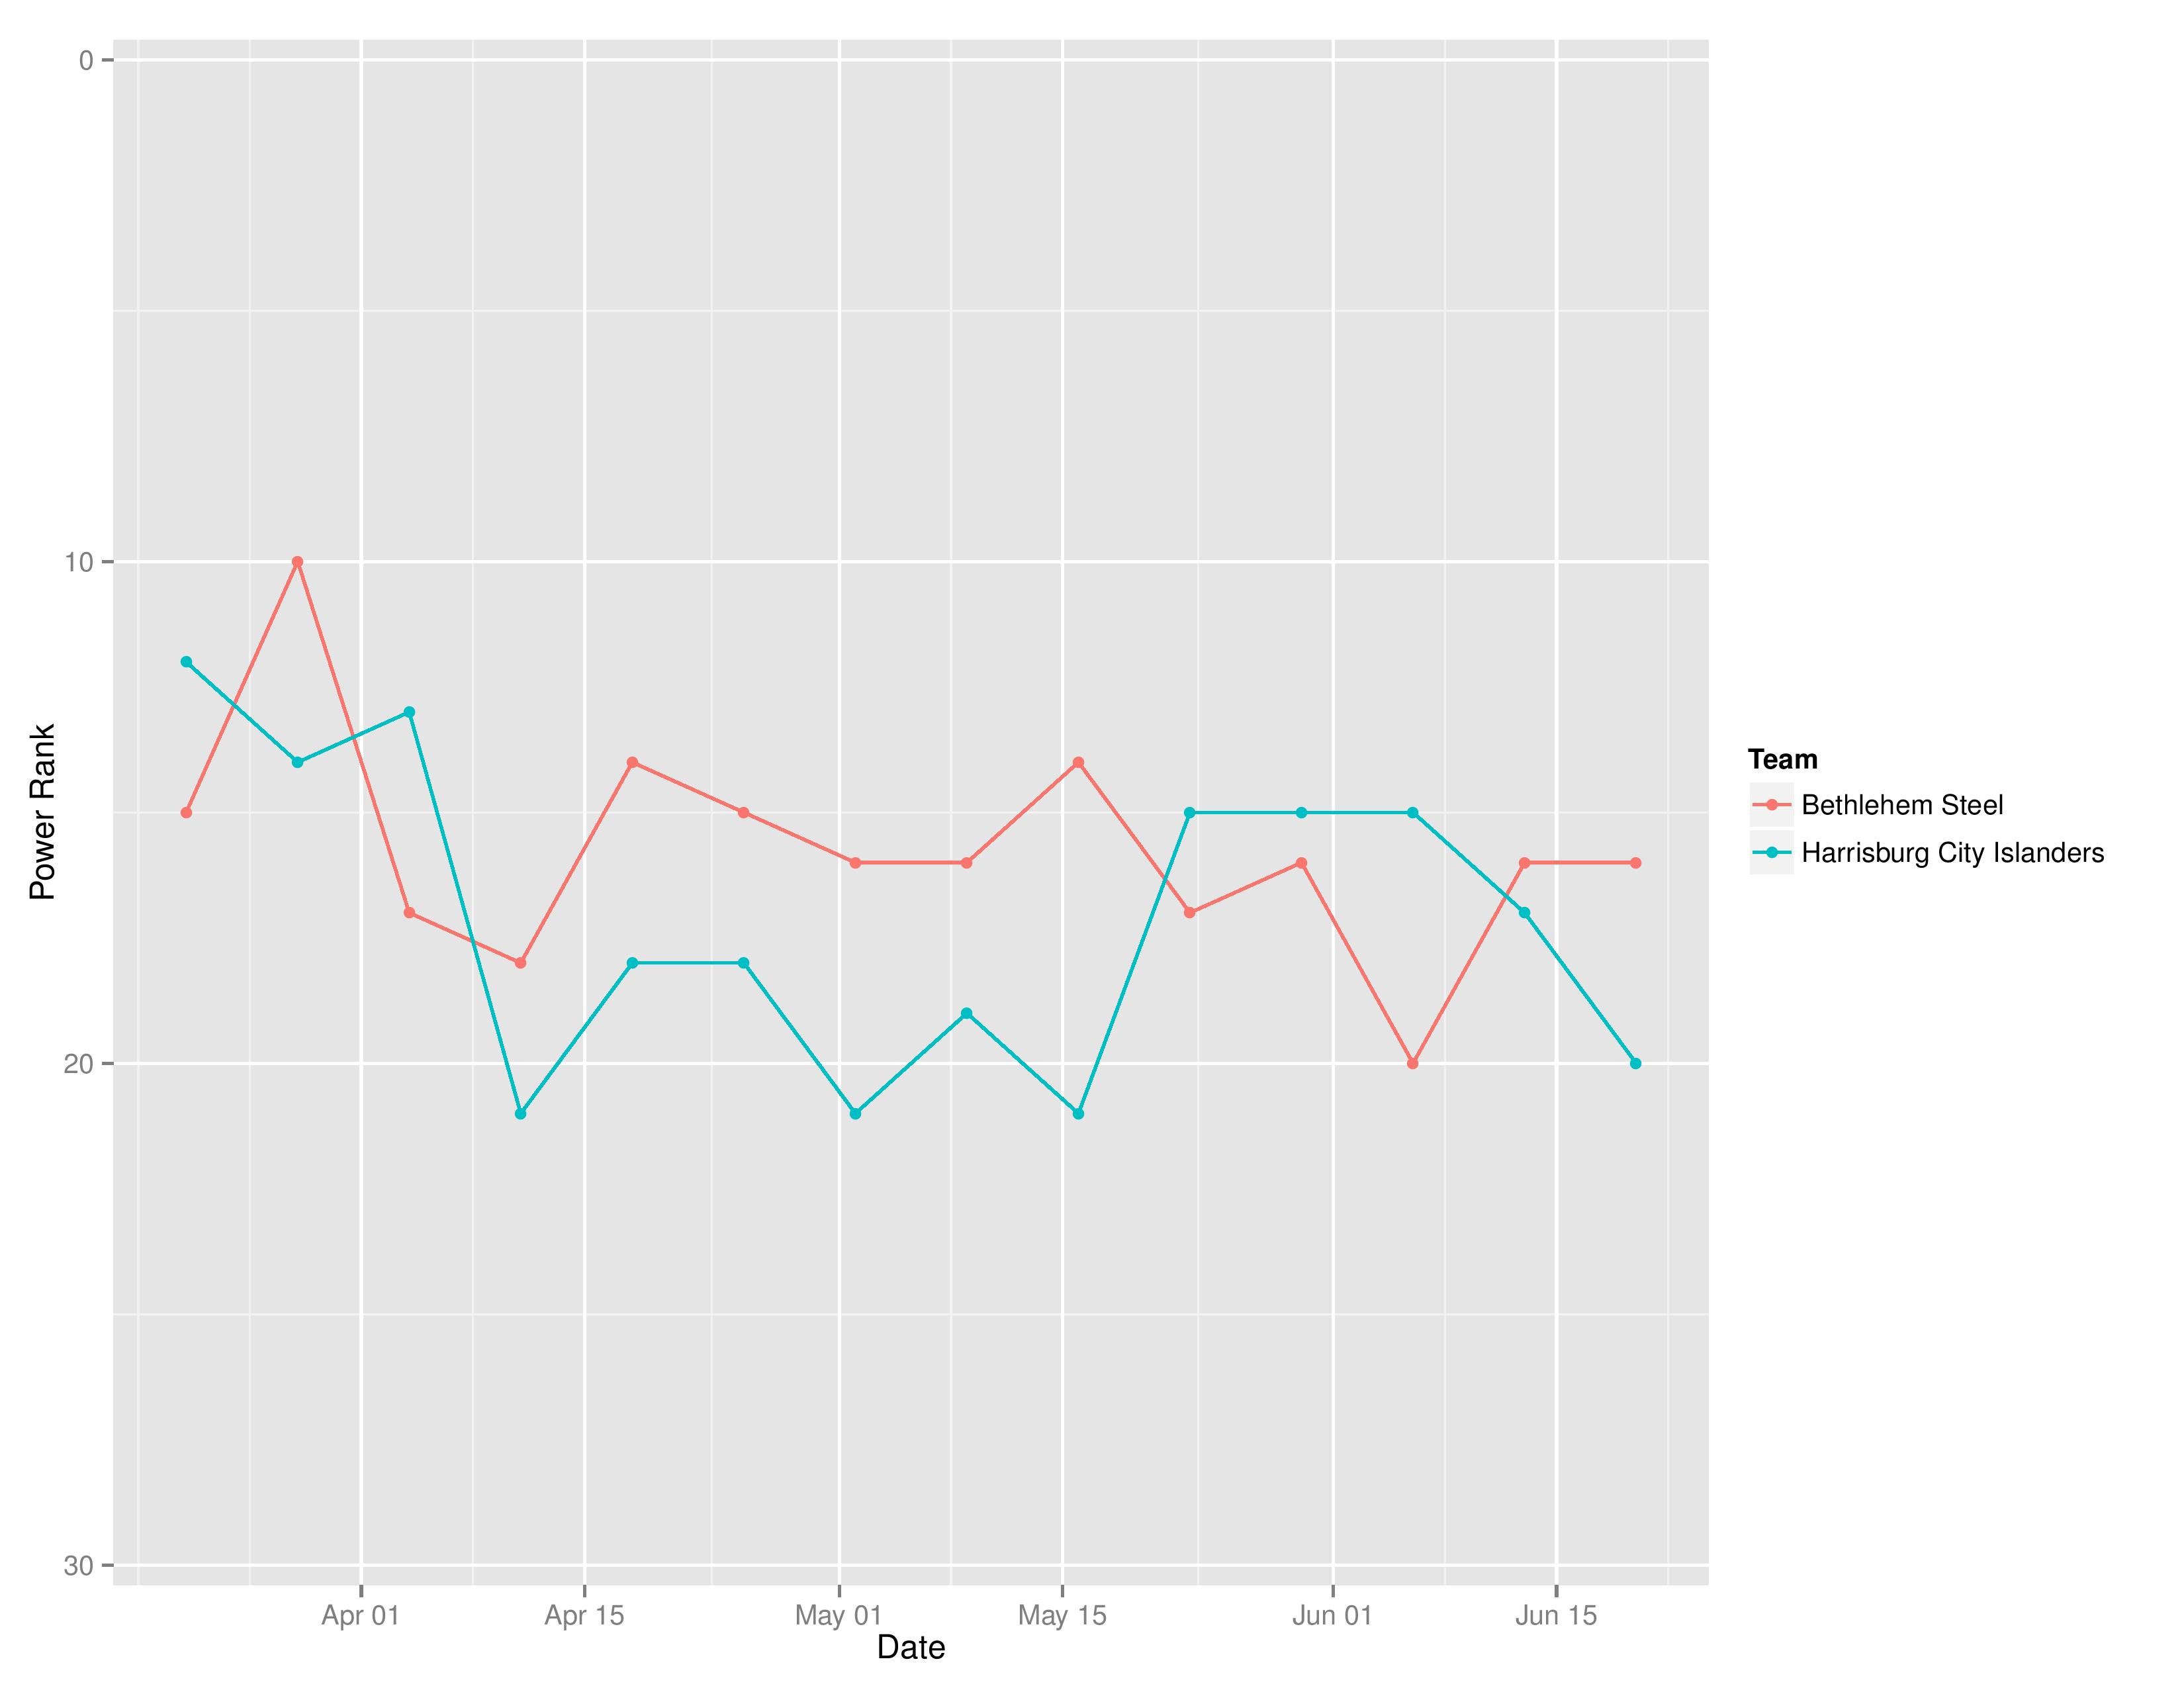
Above shows the evolution of SEBA’s power rankings for Bethlehem Steel FC and the Harrisburg City Islanders.
Again, let me know in the comments how readable/valuable this is to show the Eastern Conference of the USL.
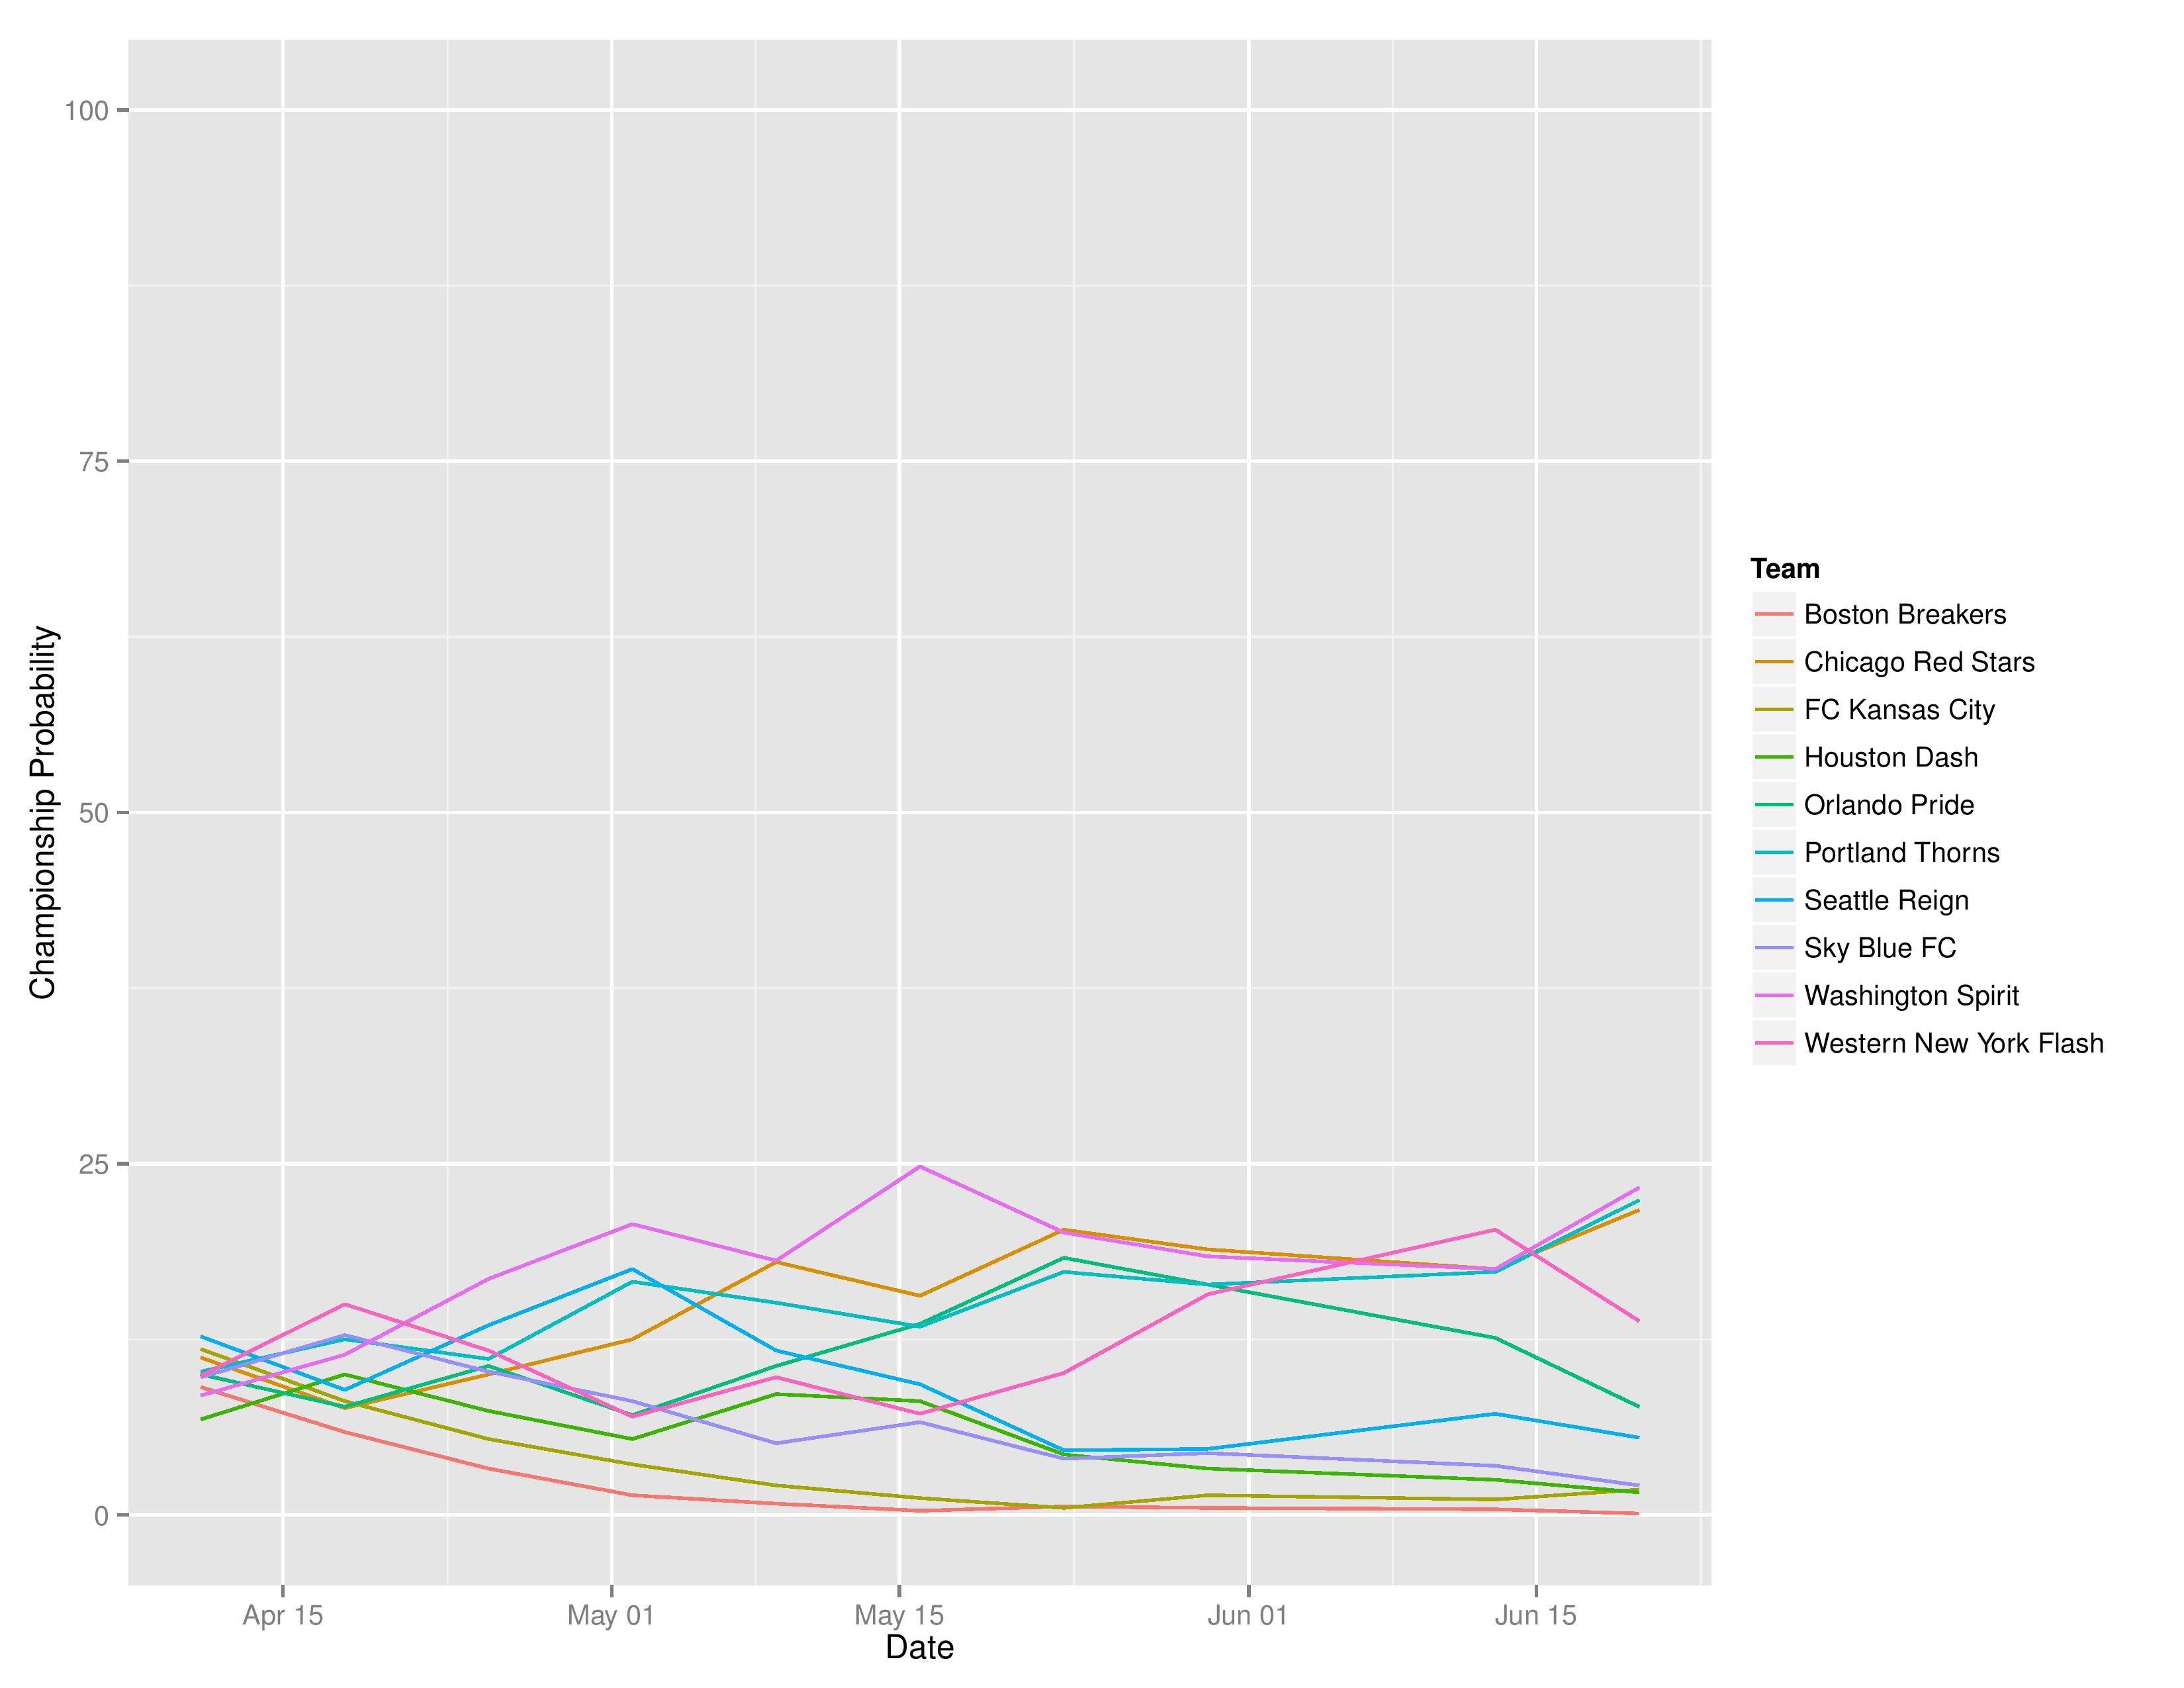
NWSL Projections
While Philadelphia does not currently have a team, I do very much hope that the league expands to Philadelphia as WPS did before it fell apart. I’ve gone to some Washington Spirit games and enjoyed myself very much (except for having to root for a Washington team).
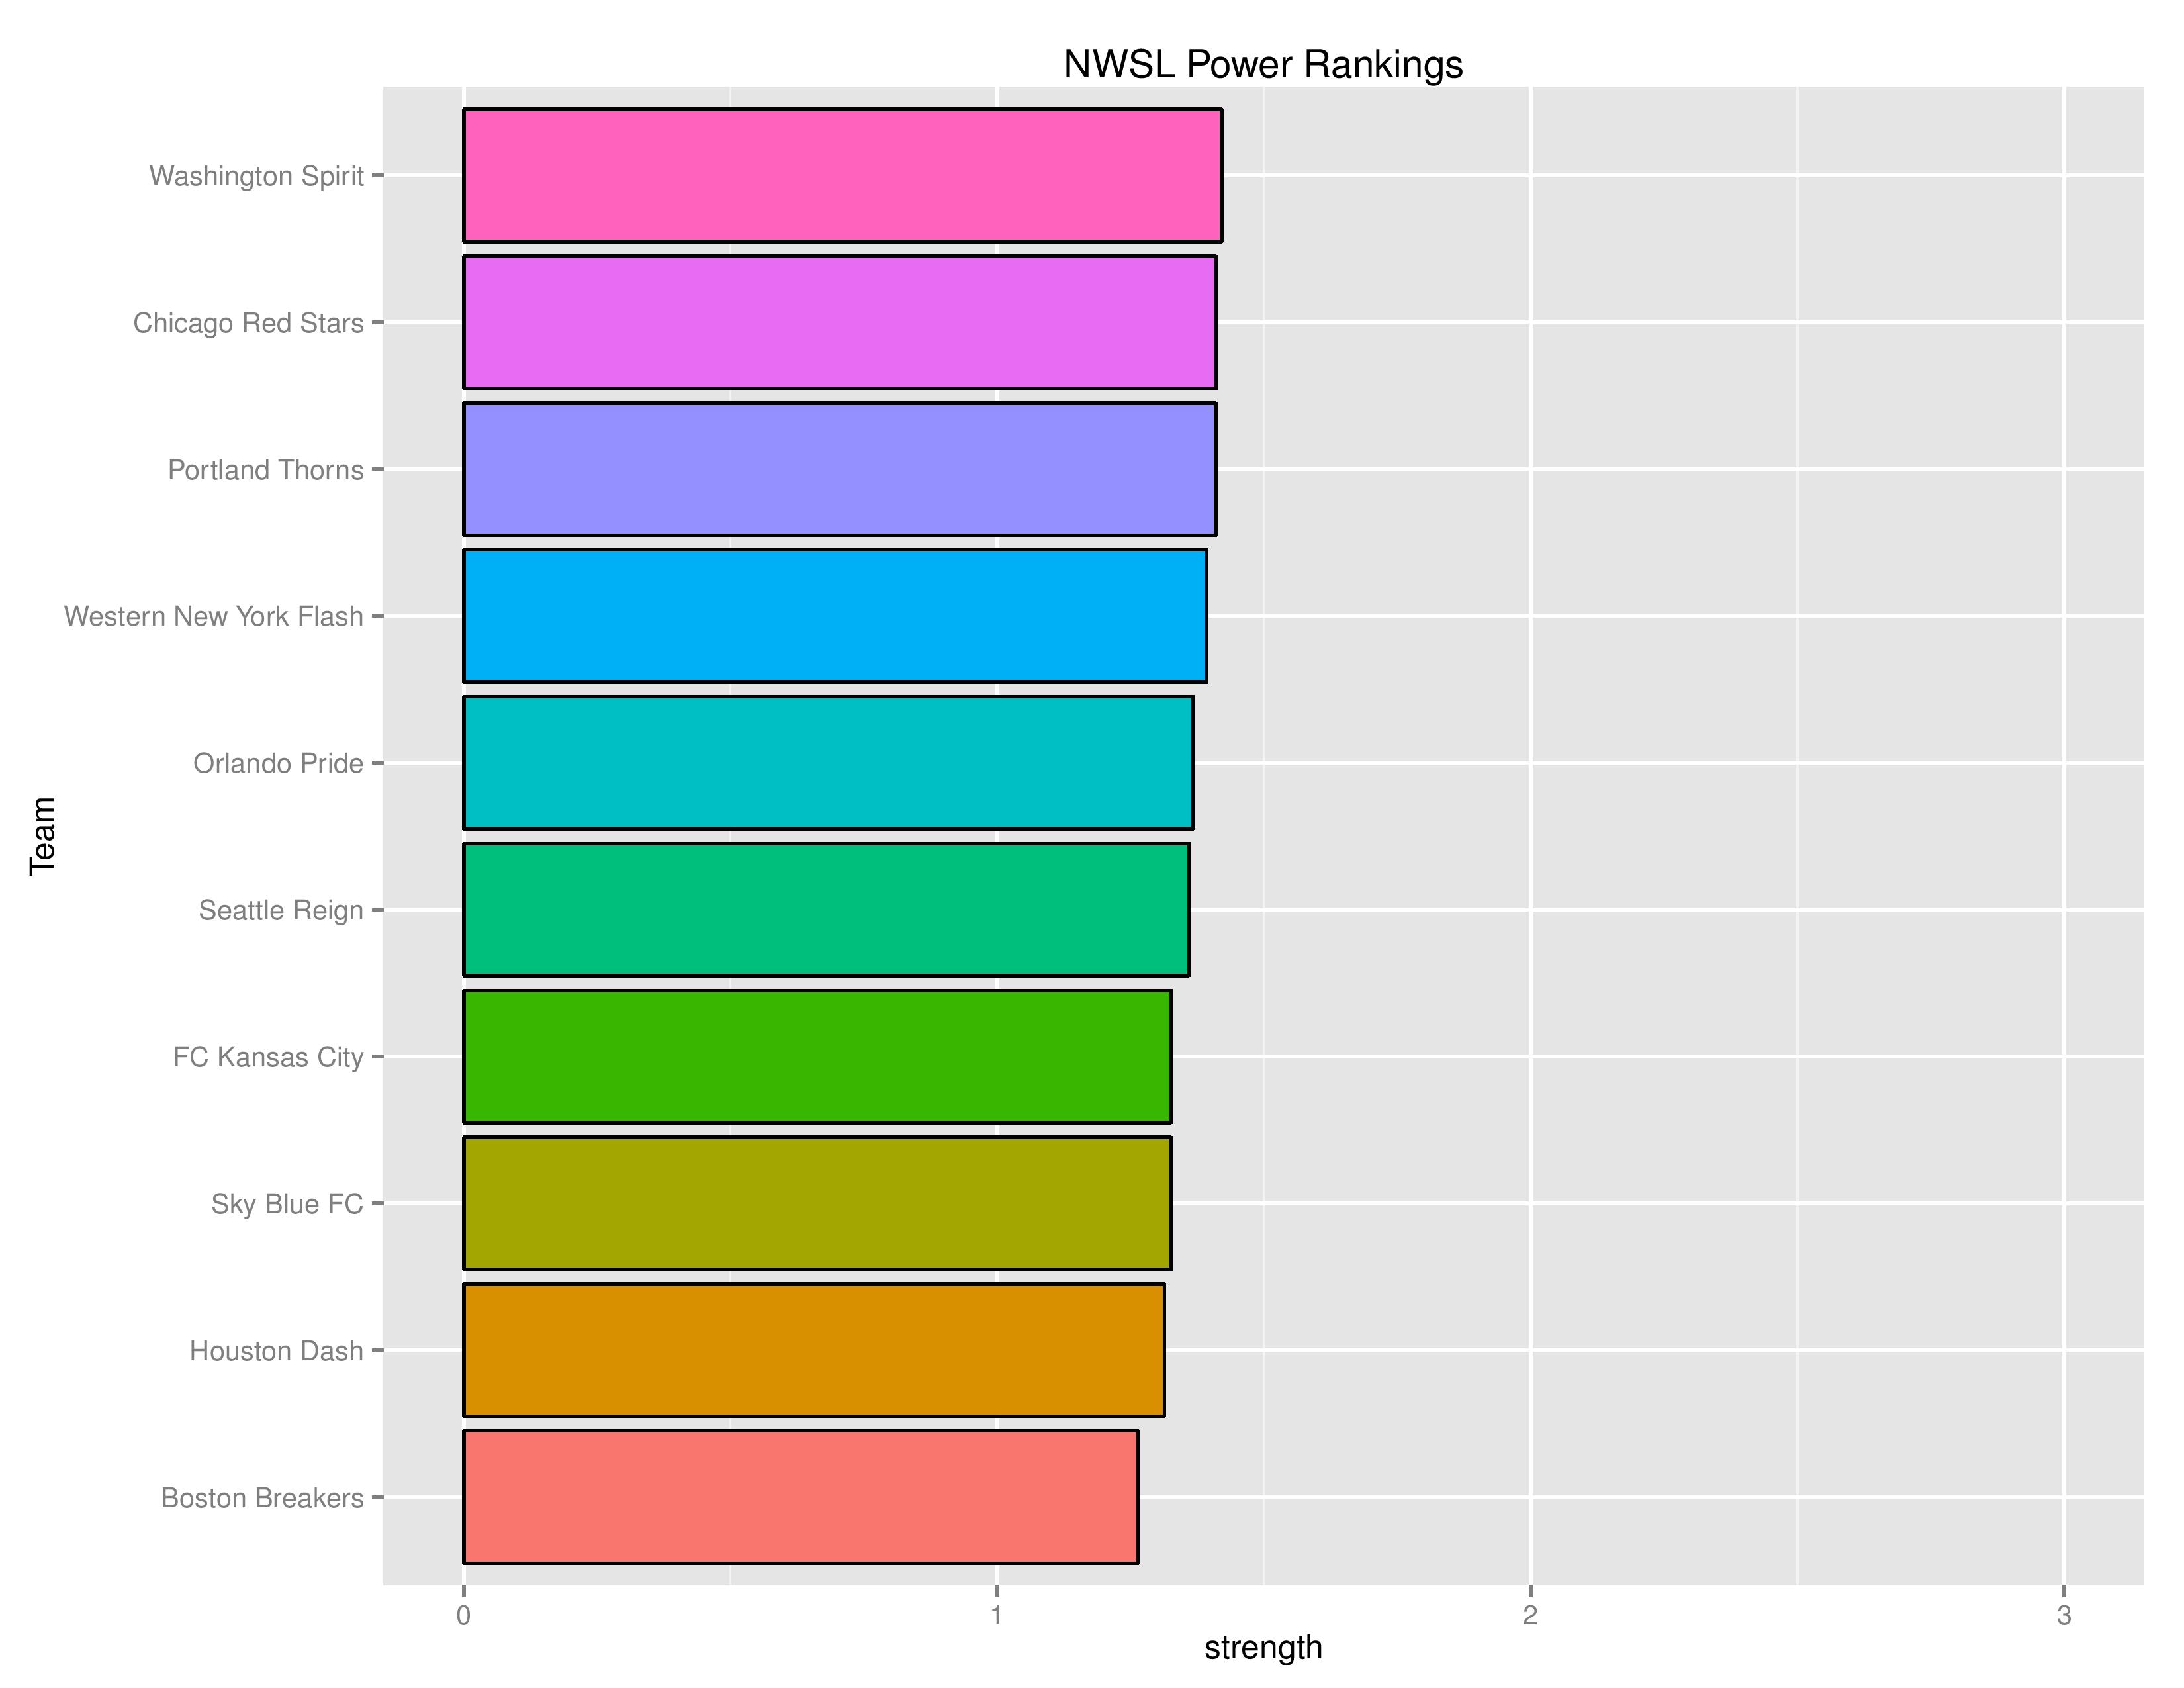
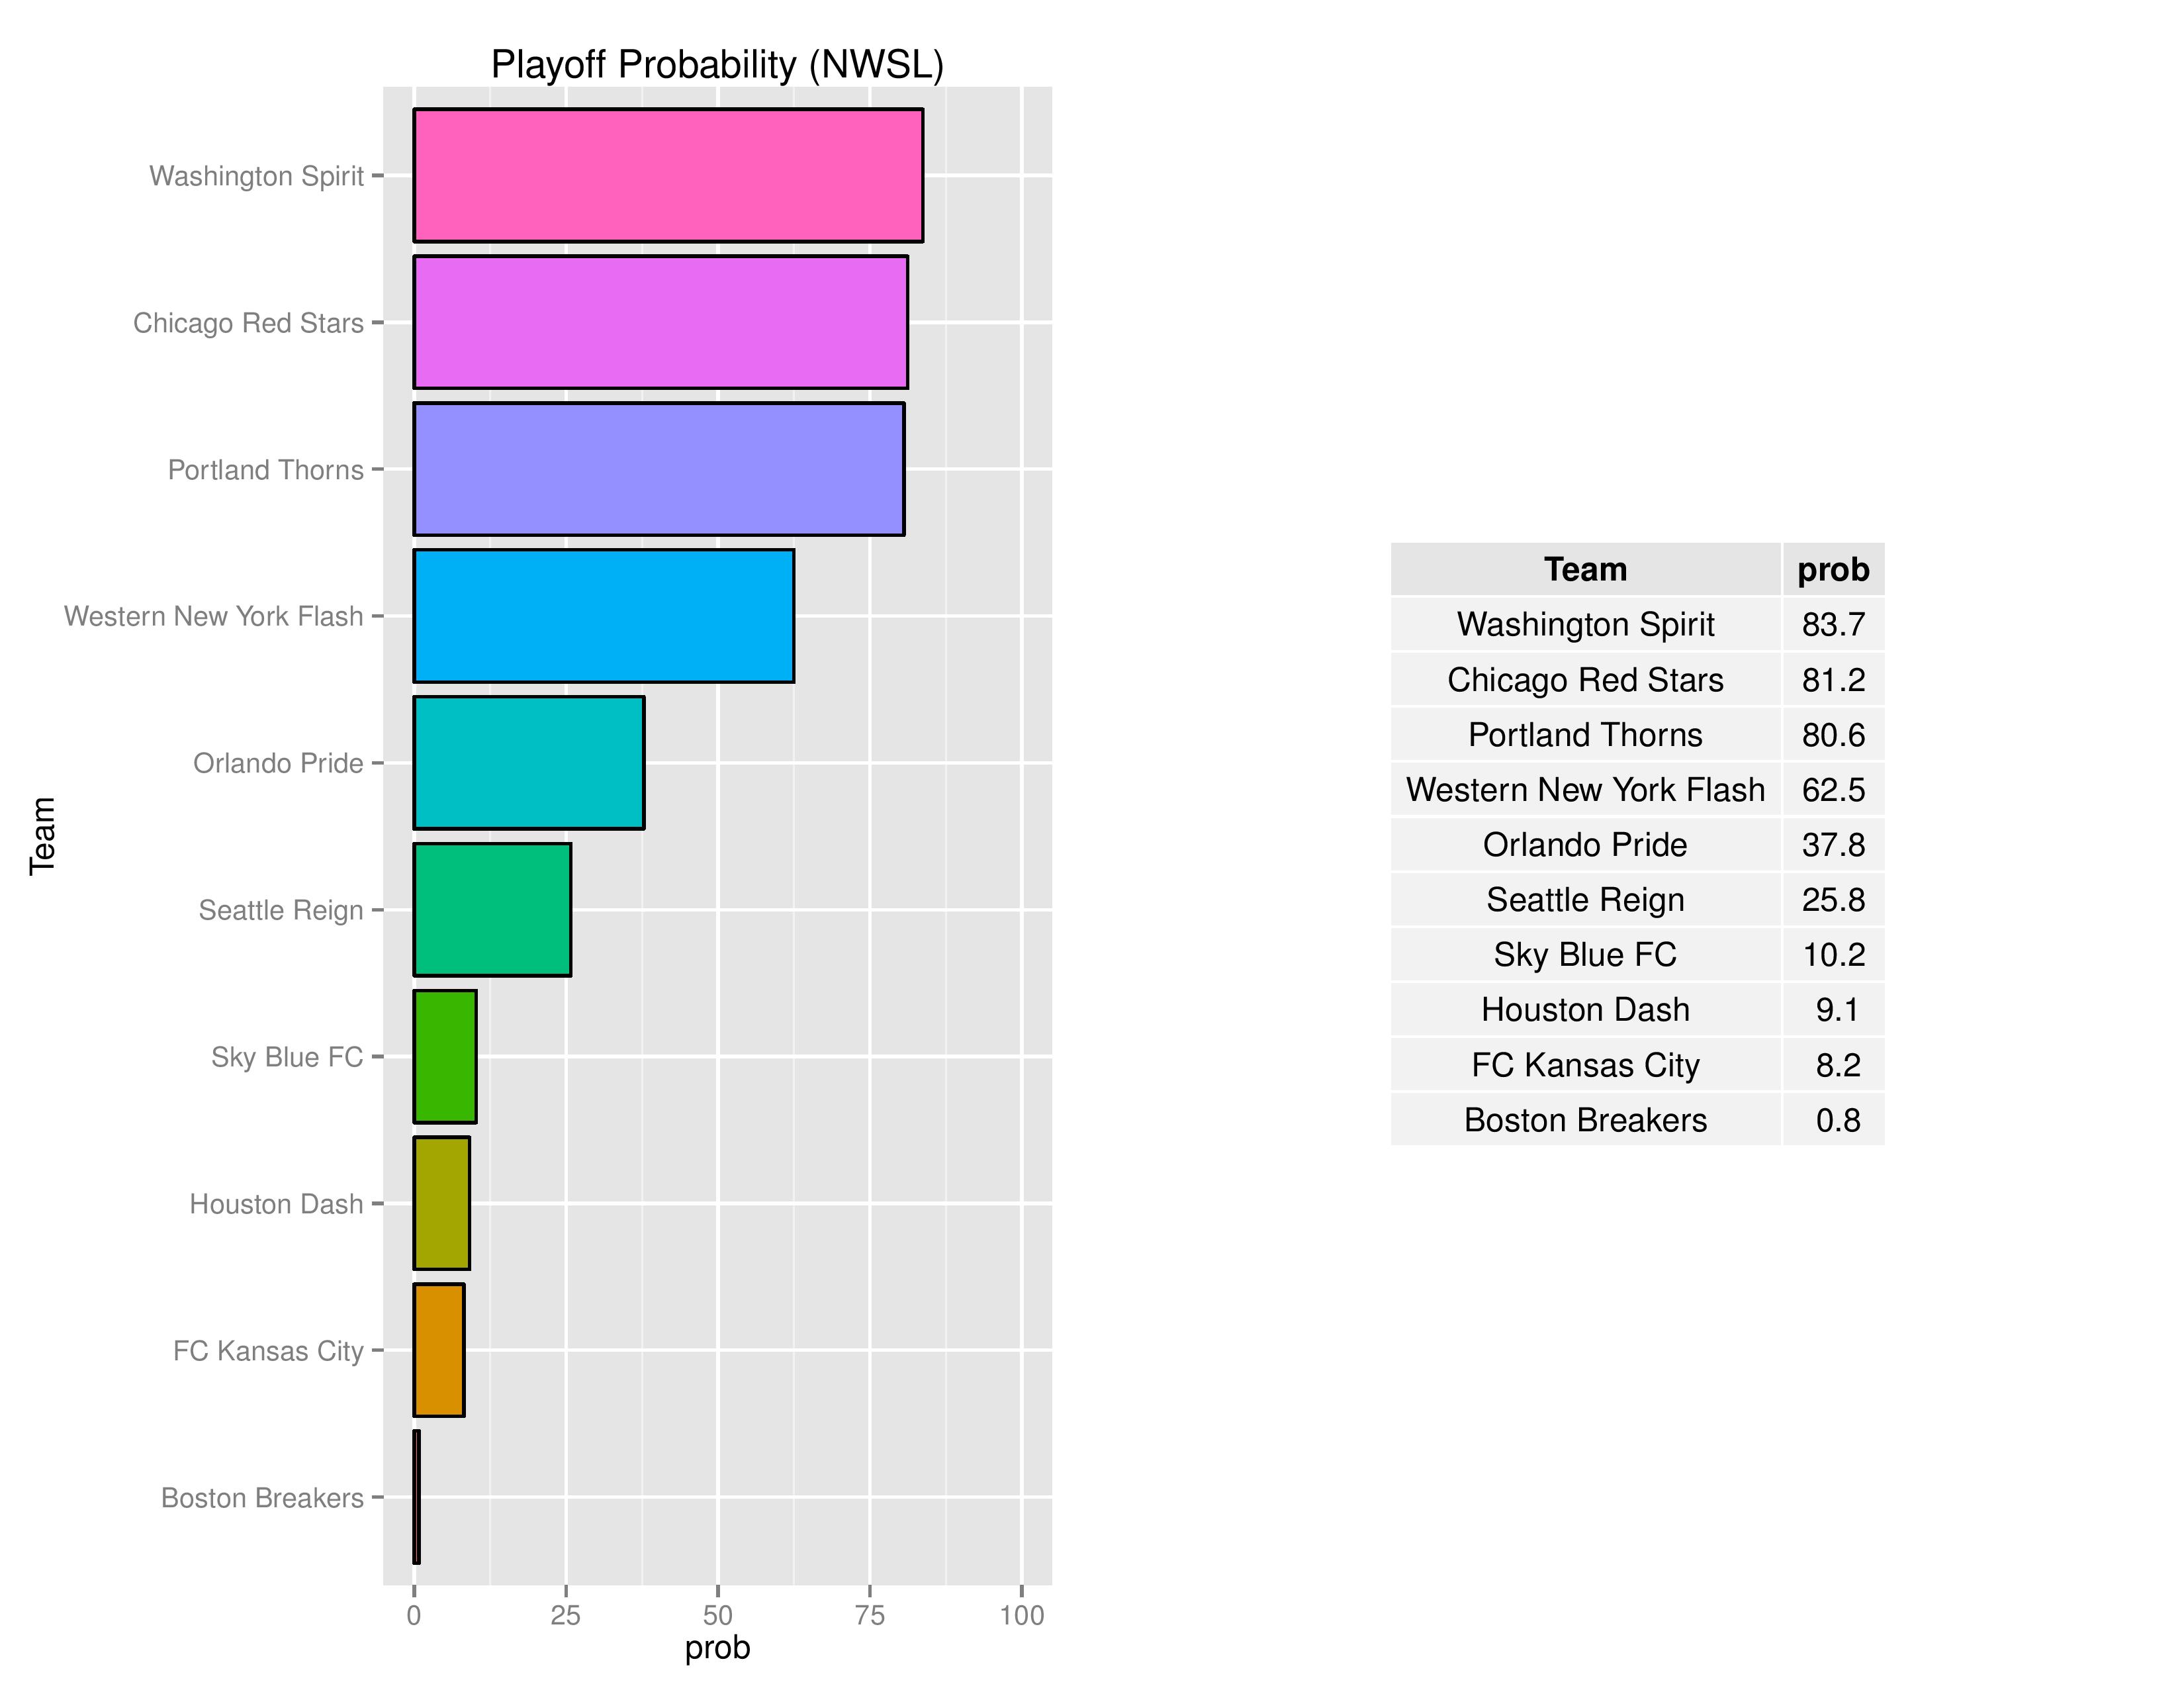
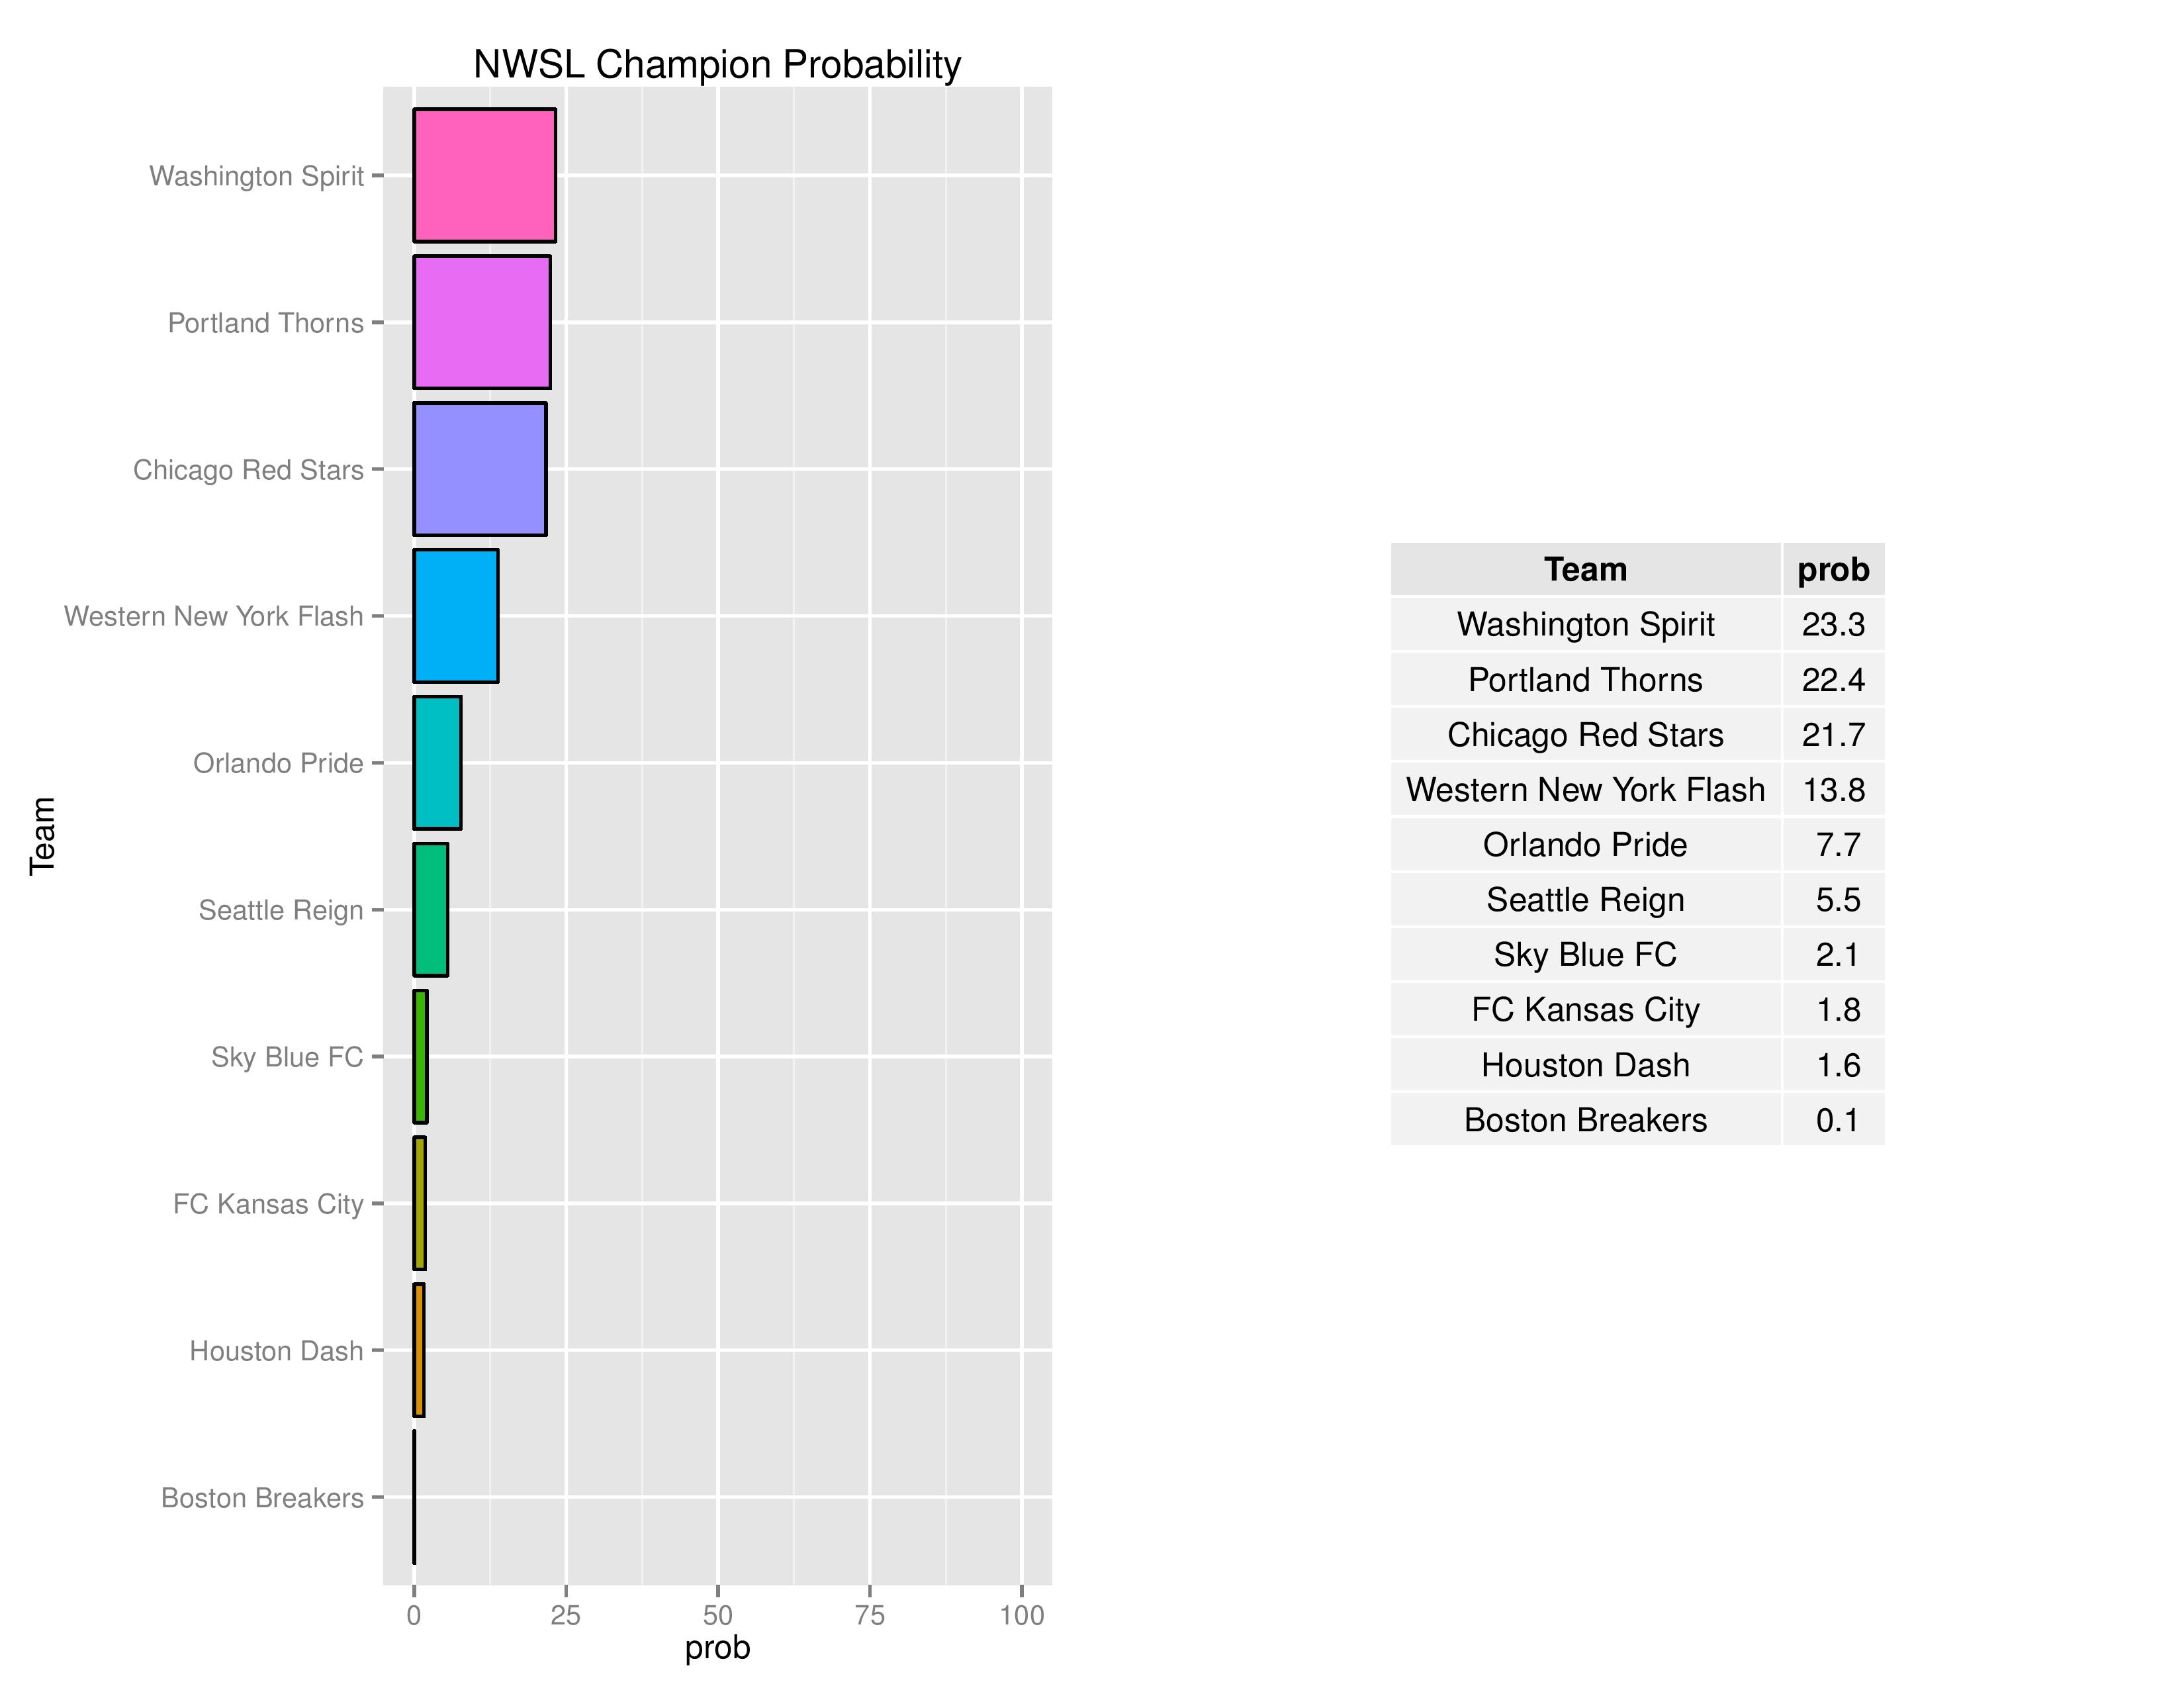
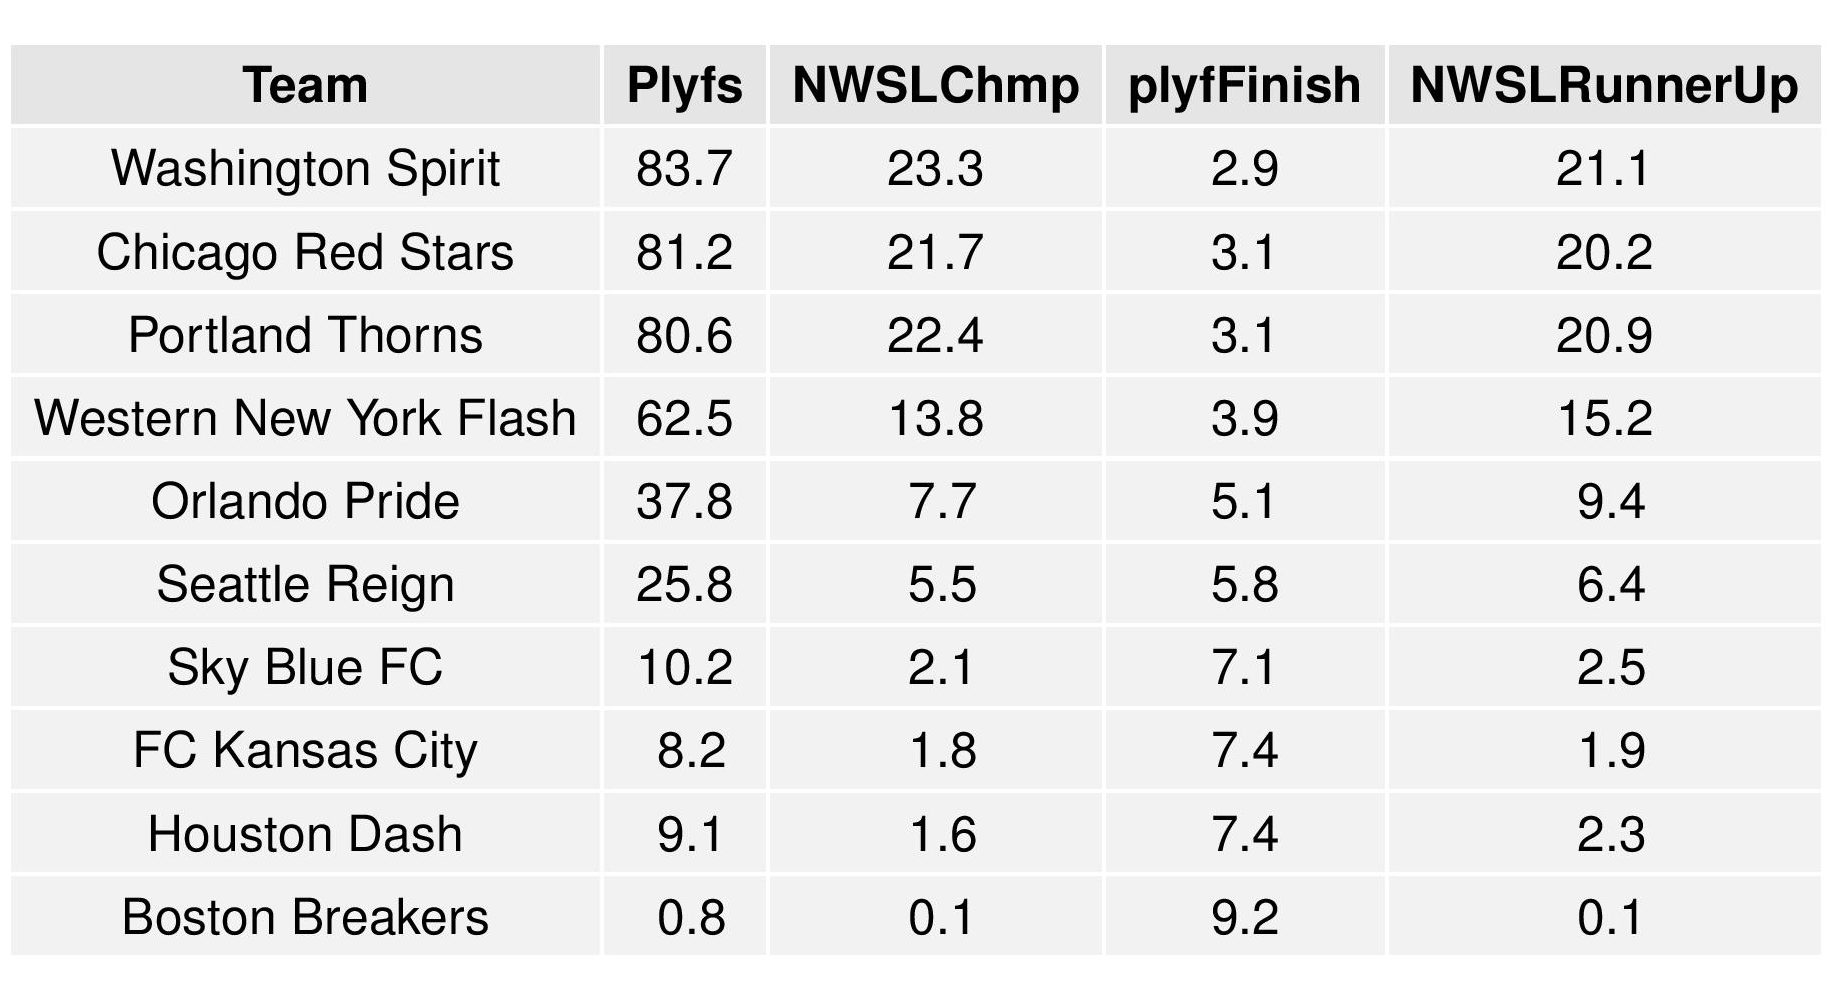
The following tables are the average simulation results produced by SEBA.


RECENT COMMENTS