Welcome to the Statistical Extrapolation Bayesian Analyzer Projection System, which is, of course, a tortured gathering of words used to form the SEBA Projection System.
The system consists of a model projecting the probabilities of game results and then a barrage of simulations which account for the remaining luck. So the probabilities you see below show, essentially, what the odds are of an outcome if the team continues to play like it has been.
Below are the current season forecasts using data from games through June 12, 2016.
As MLS did not play last week, so there are no updates for MLS except for the over-time feature addition (MLS projections can change due to increased USL/USOC knowledge, but changes would be small).
Changes Over Time
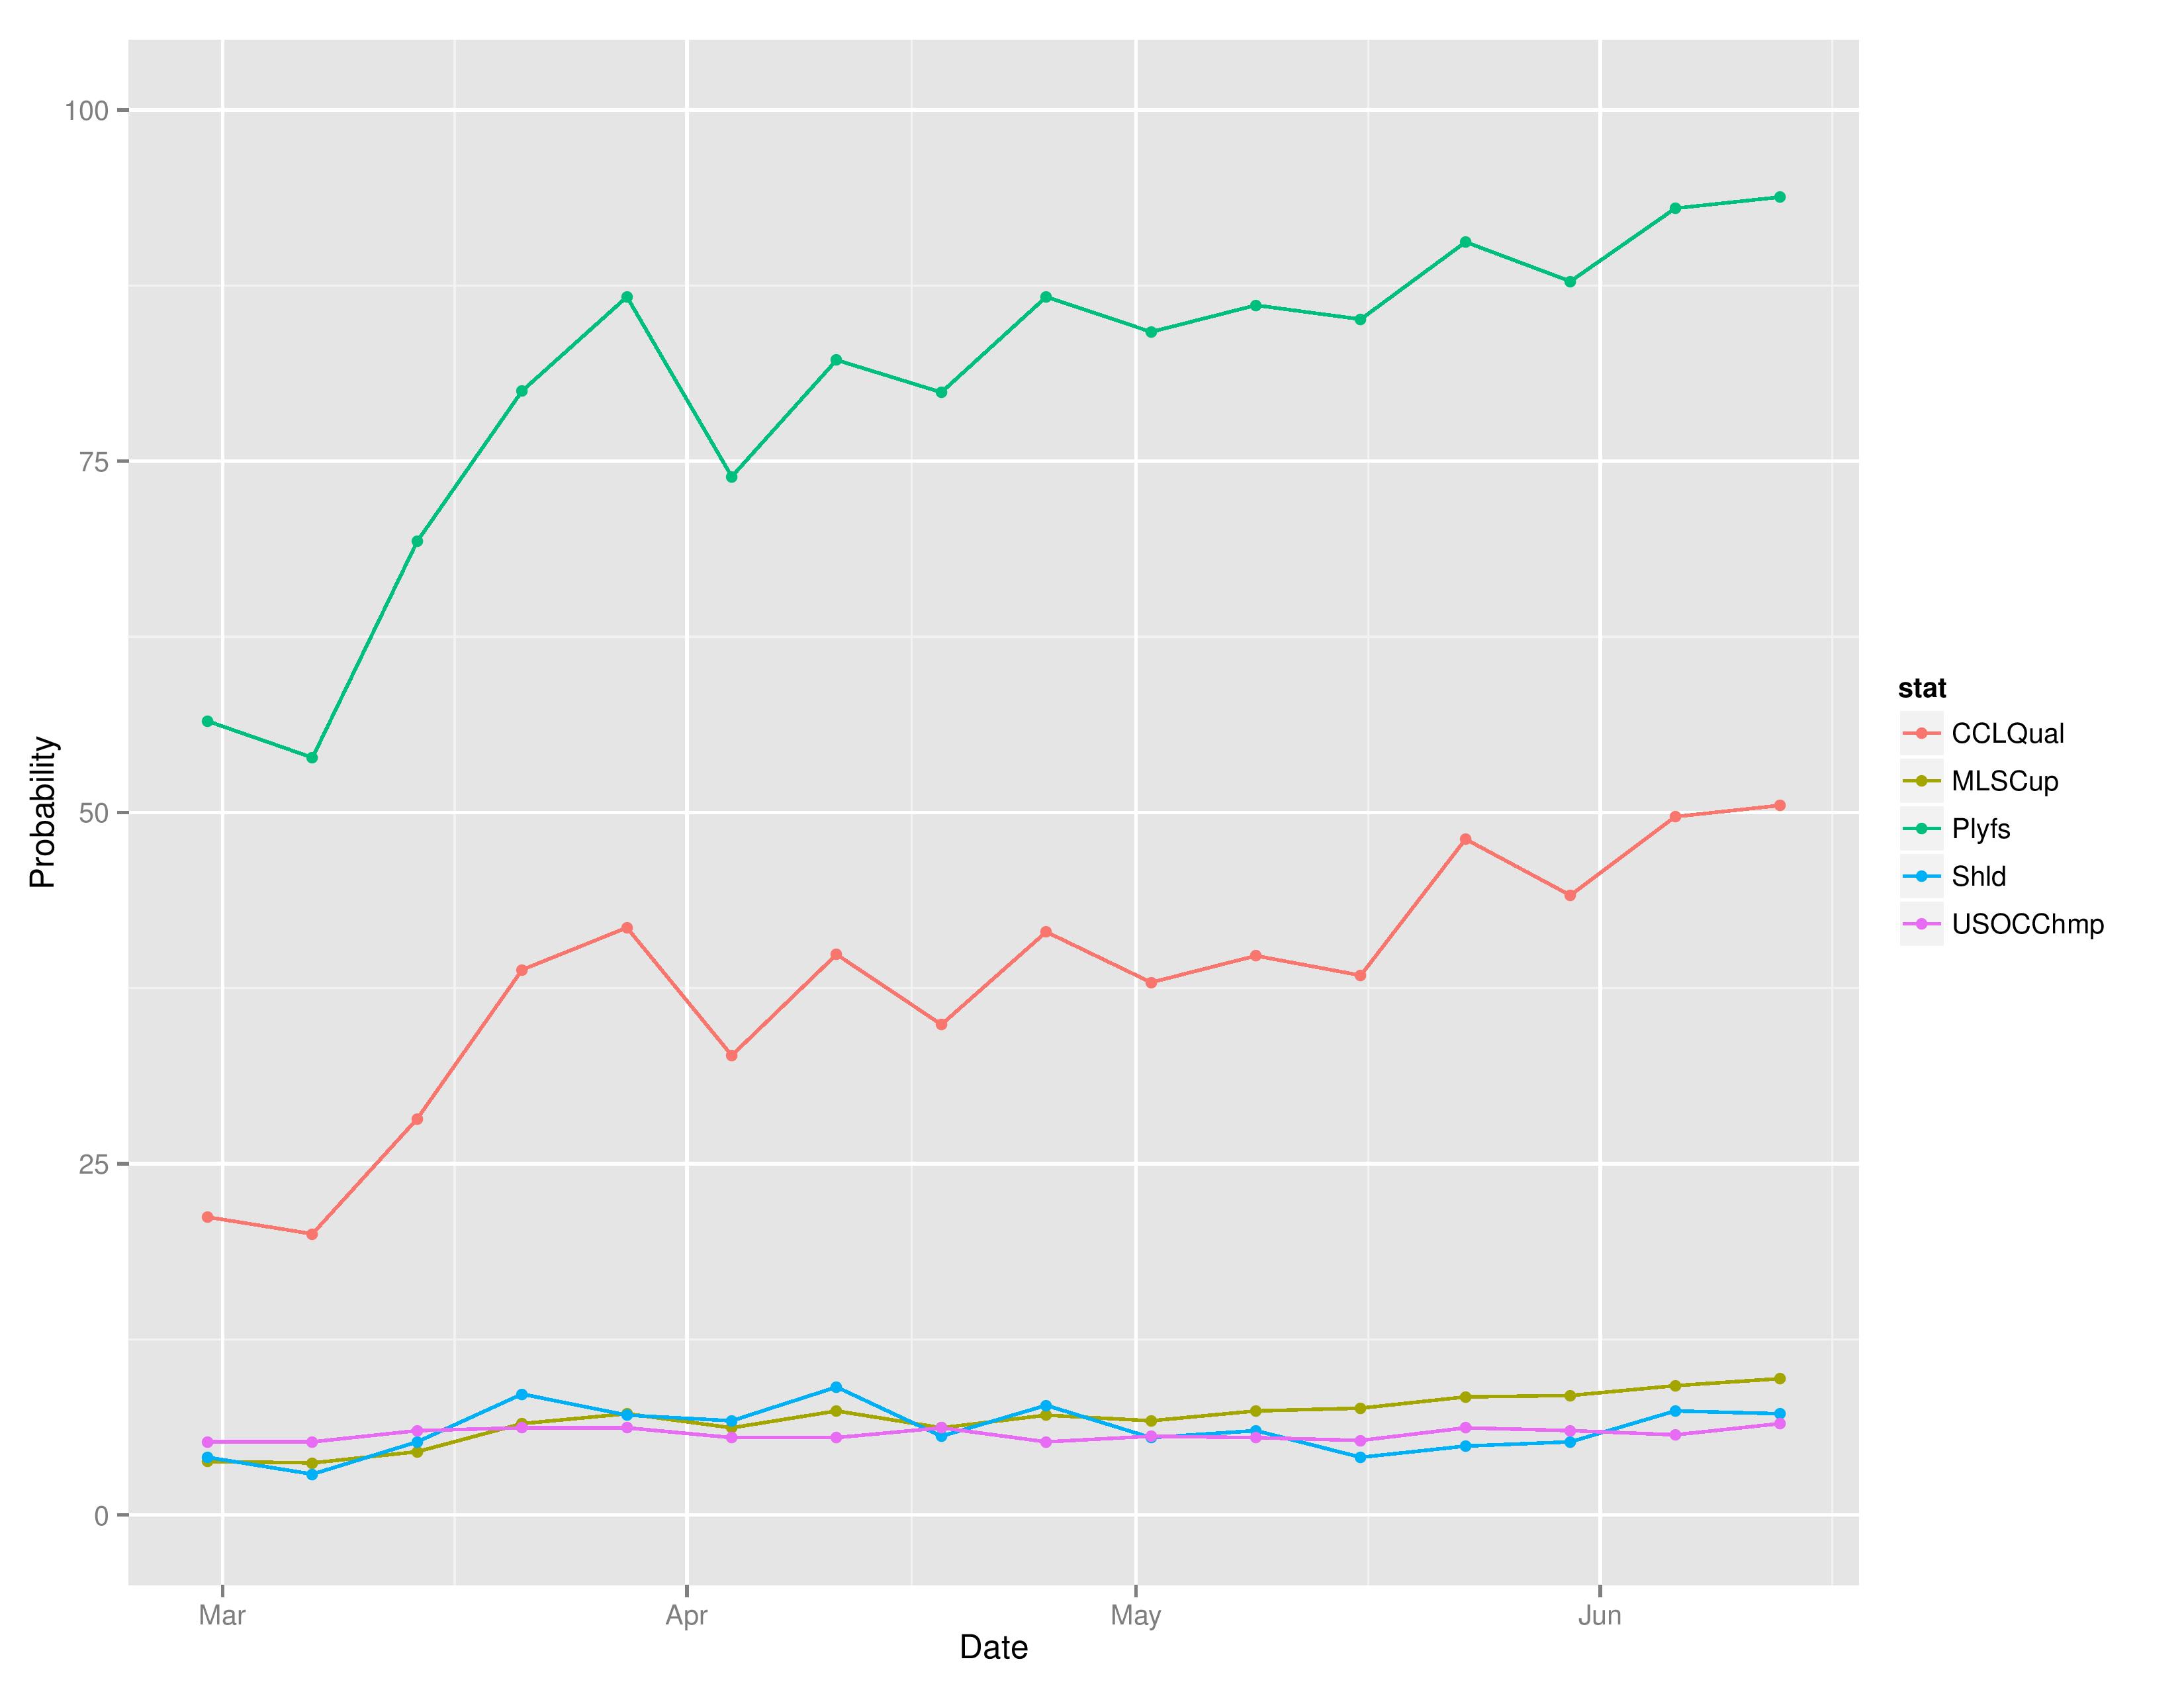
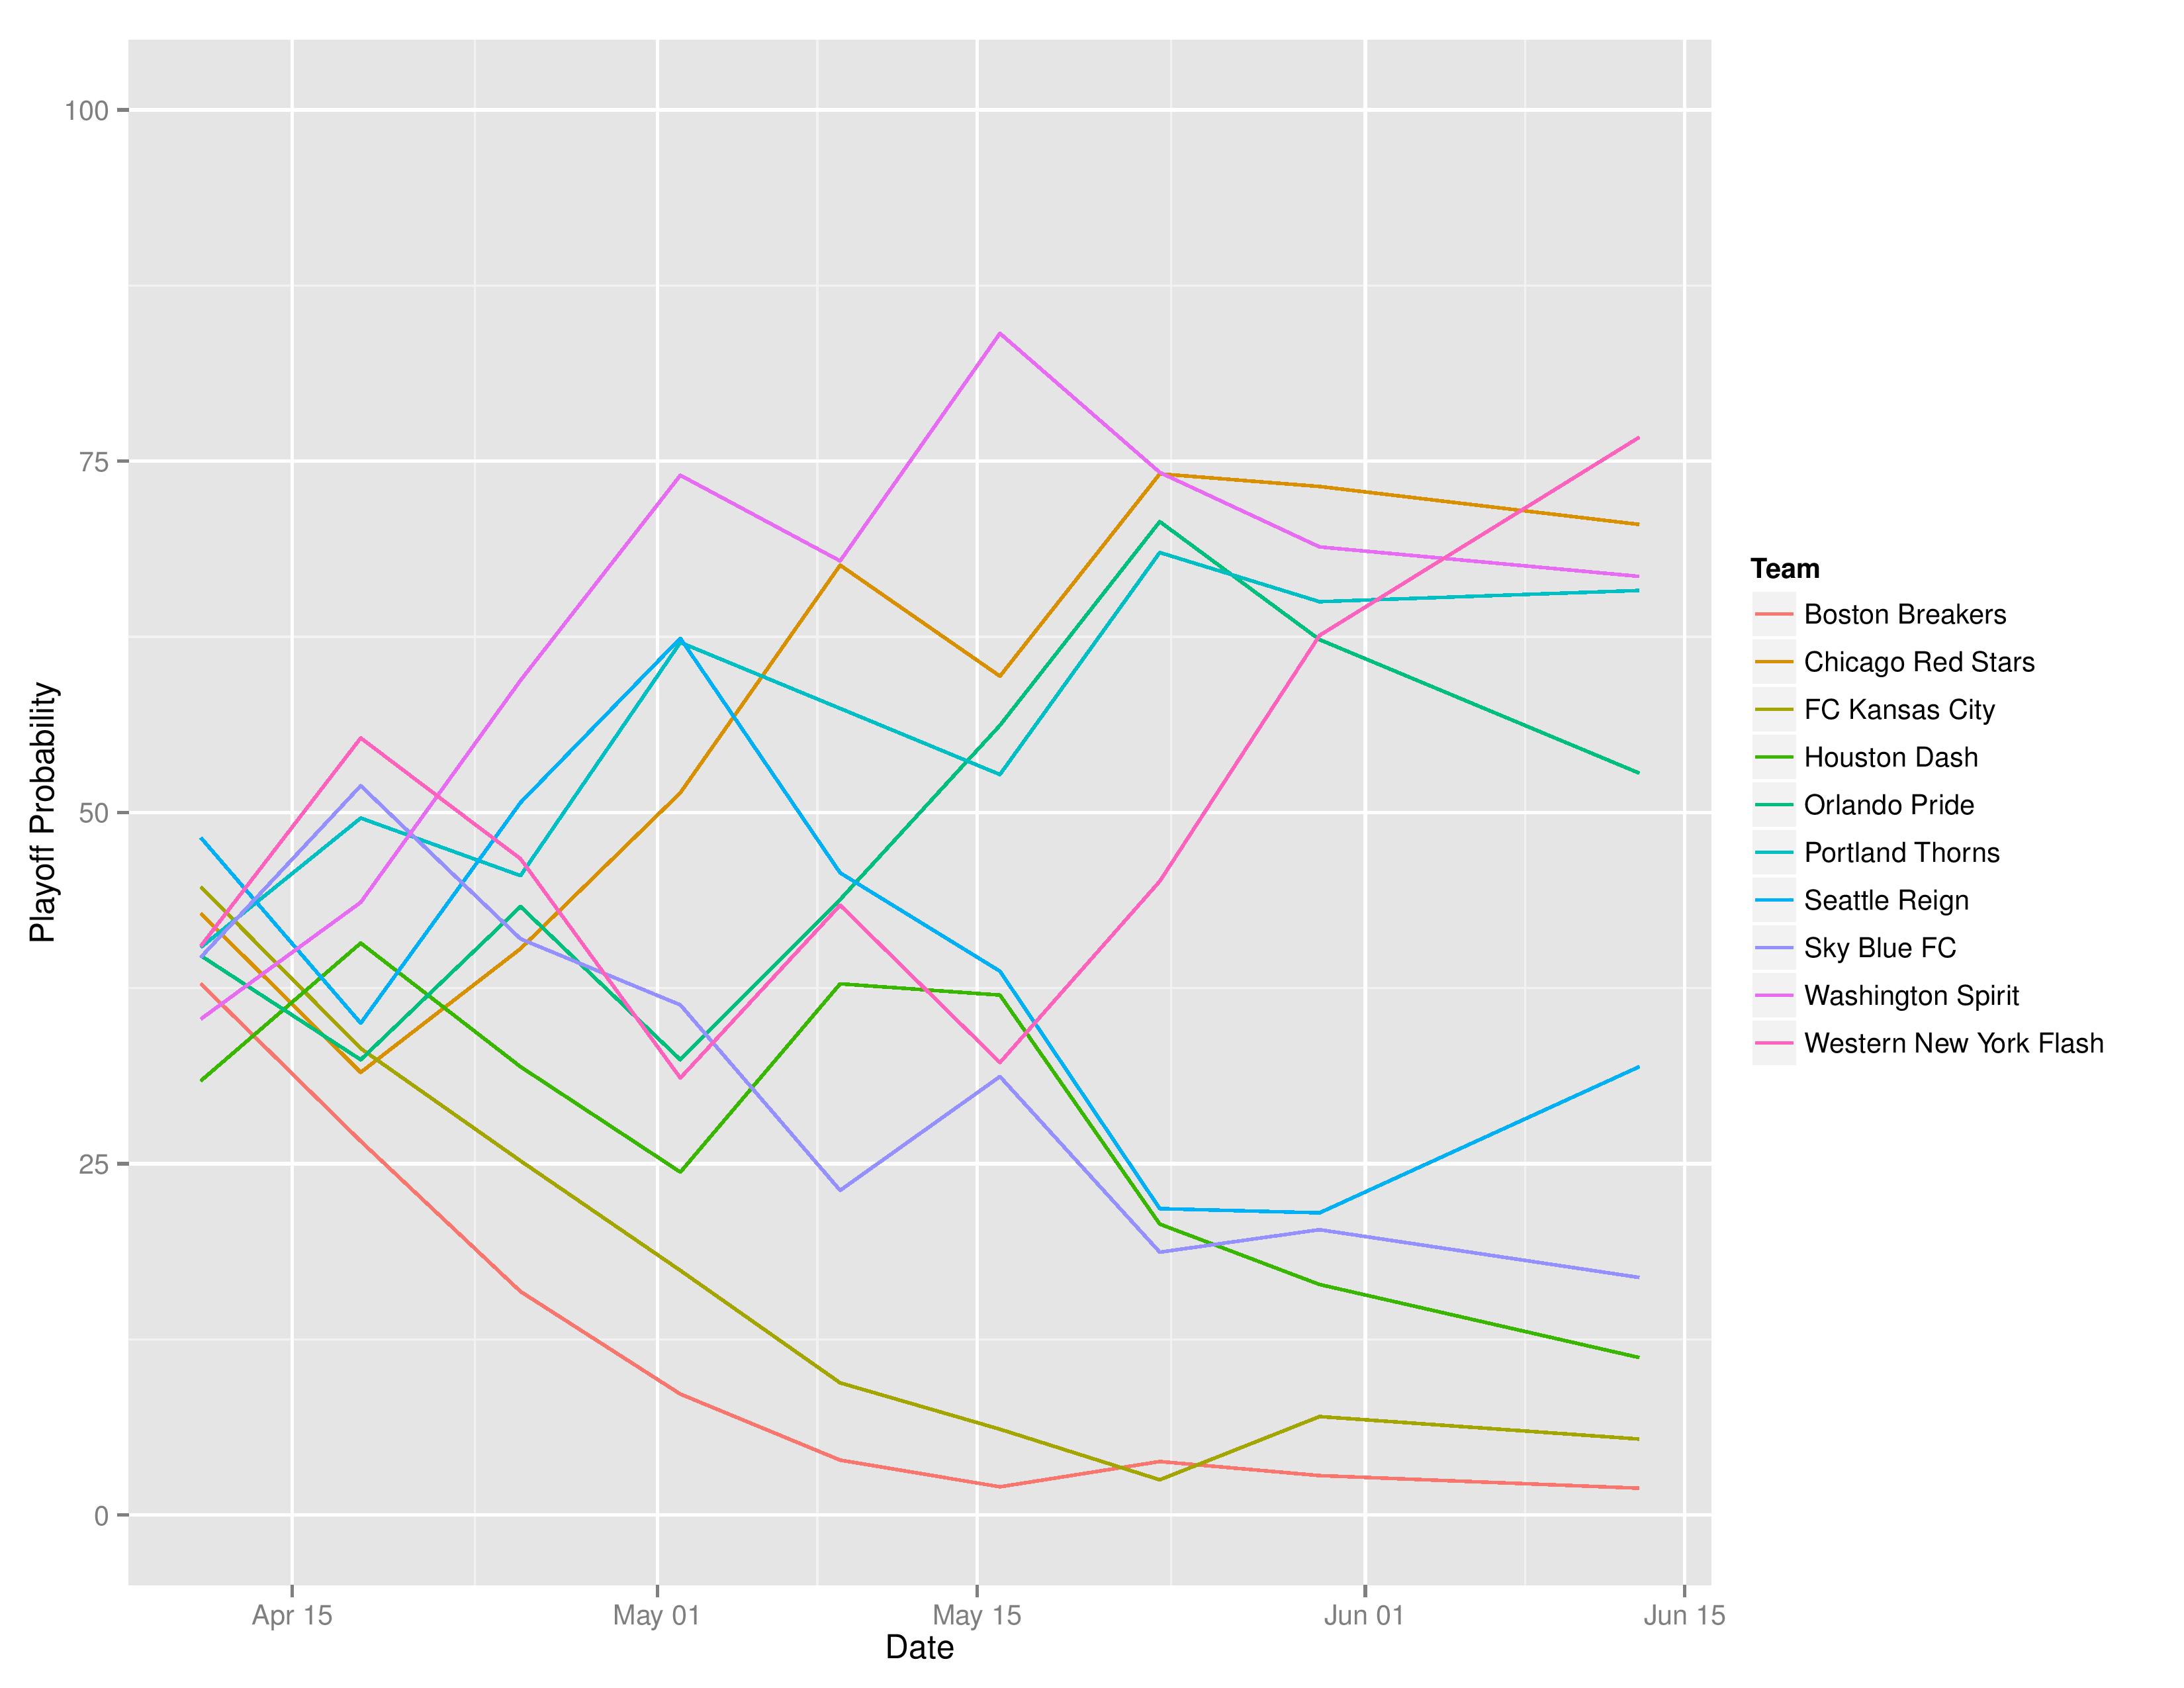
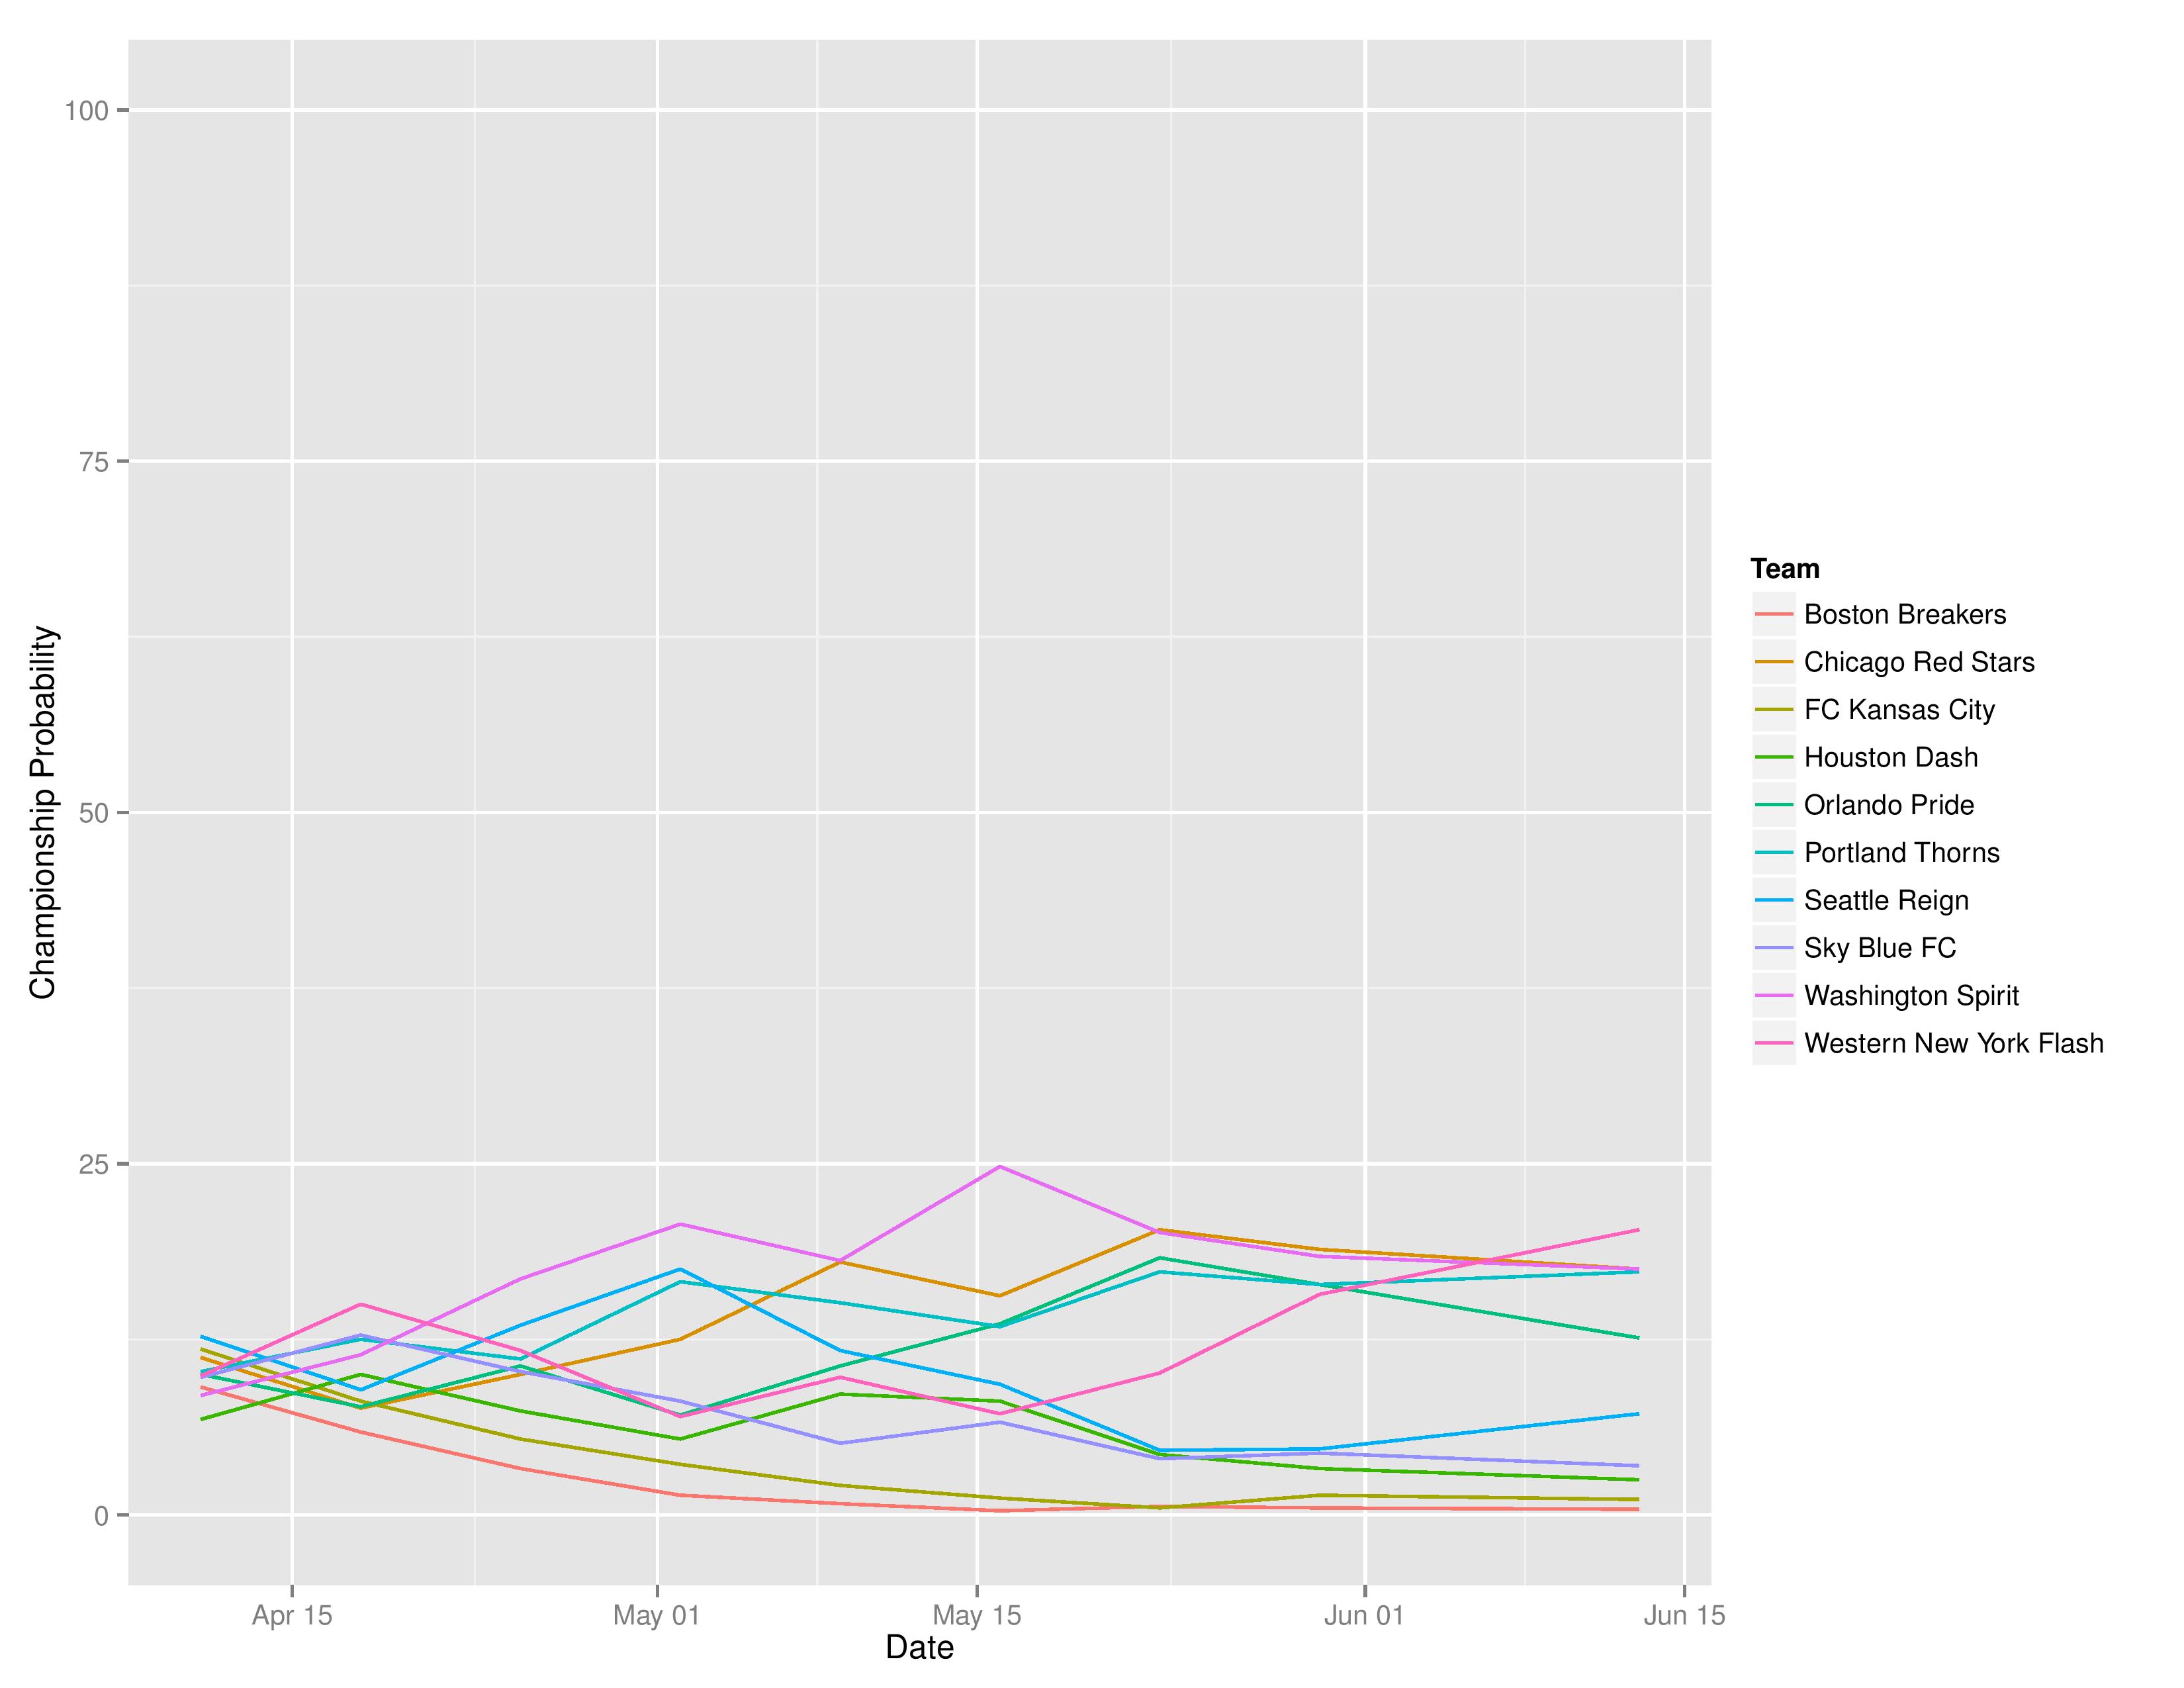
This chart shows how Philadelphia’s chances at each of the outcomes has evolved over the course of the season. These probabilities were calculated weekly, always through Sunday’s matches.
Disclosure: it is possible that I re-ran some previous simulations that I posted on, so it is possible the numbers have changed, but they should be small changes.
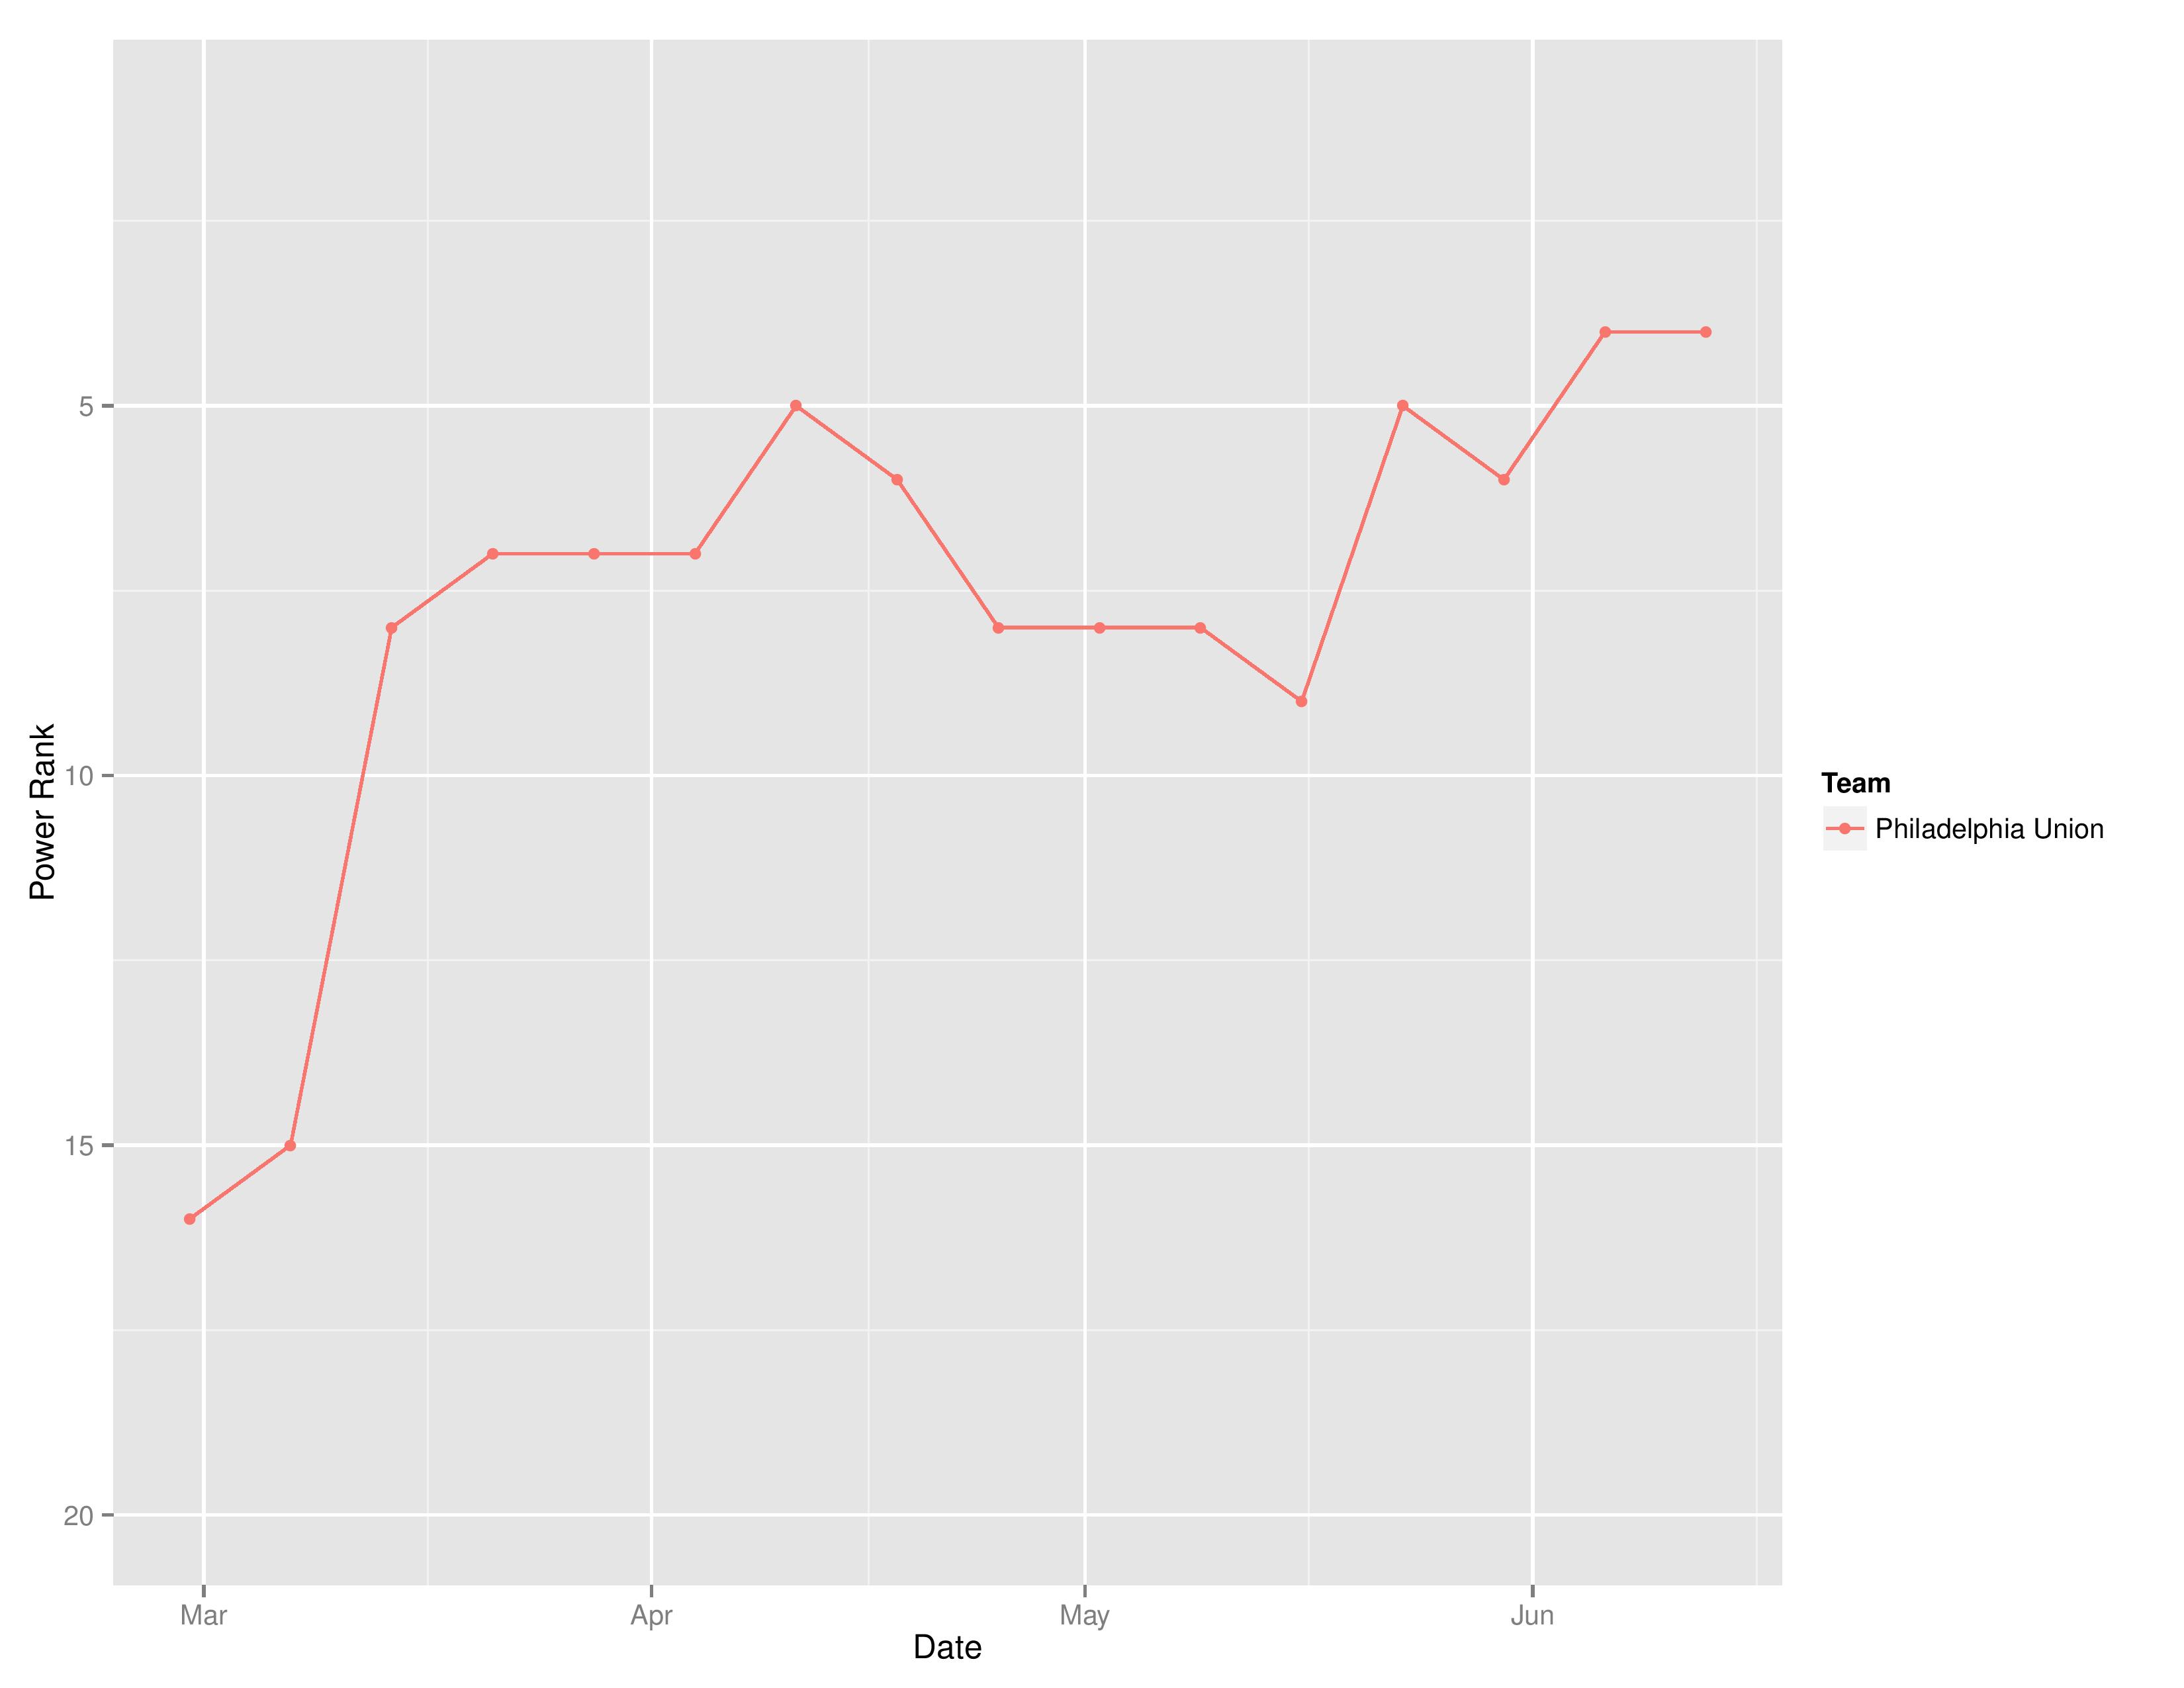
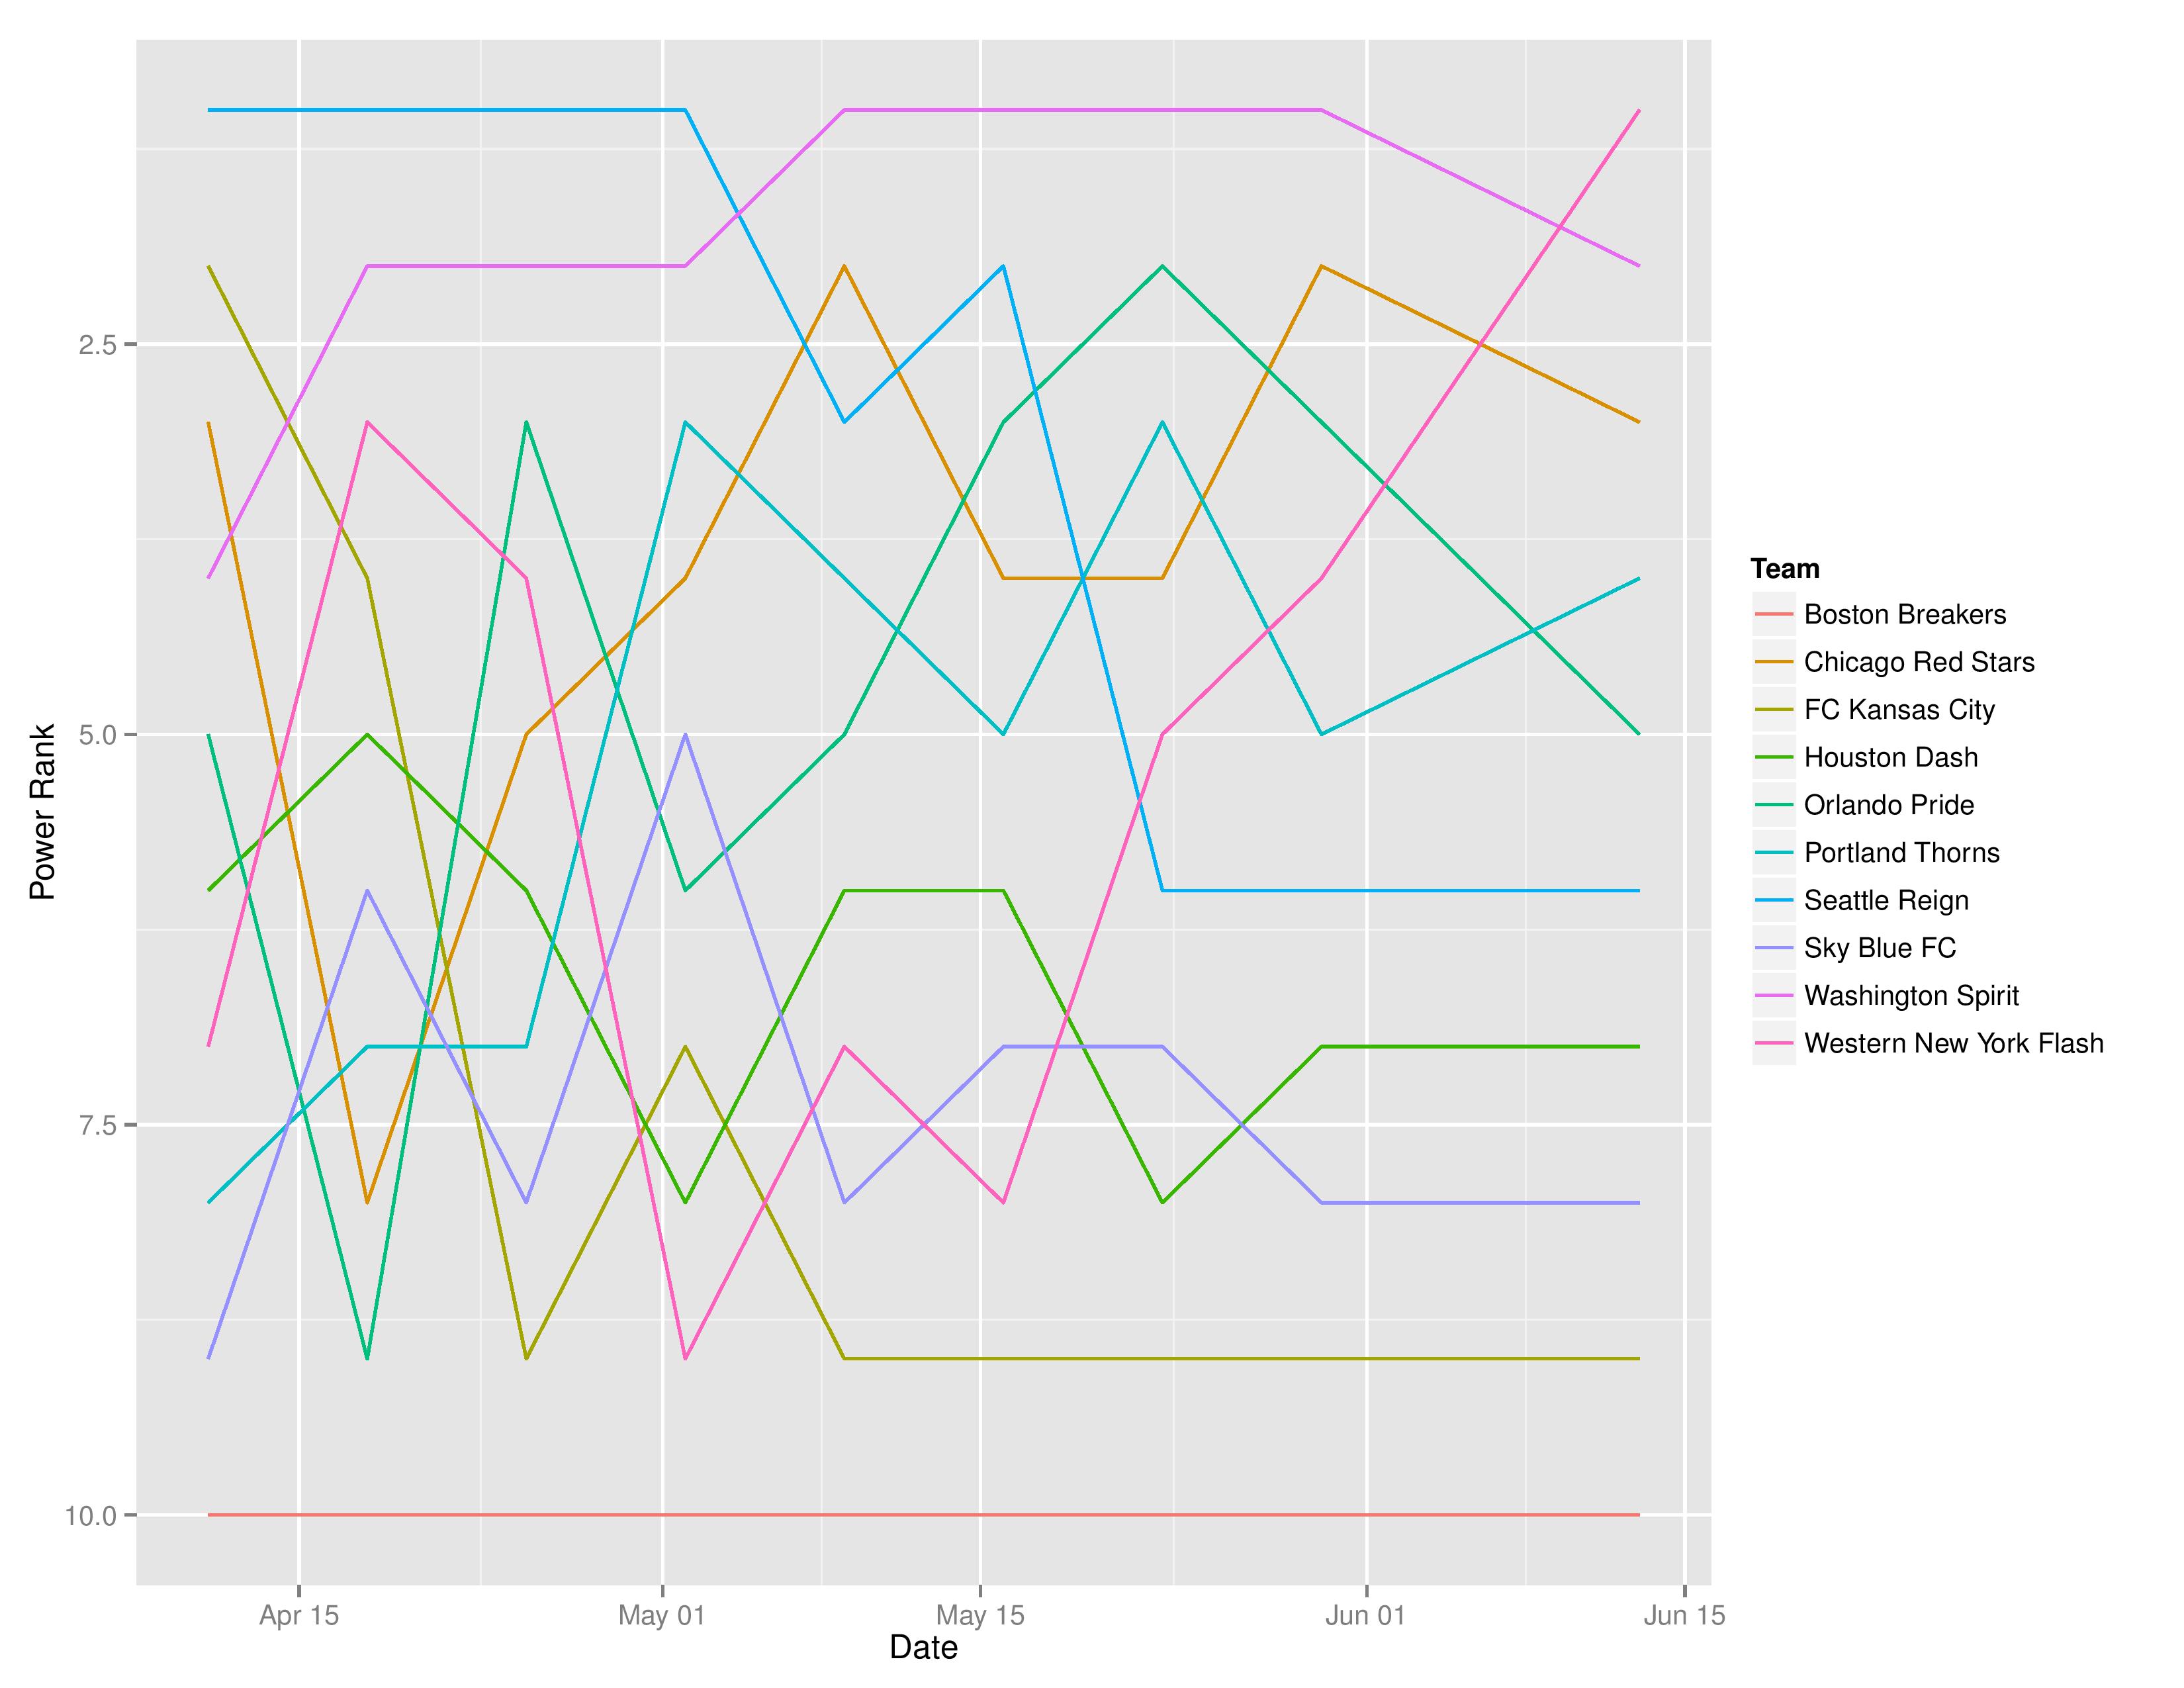
This shows the evolution of Philadelphia’s movement within SEBA’s power rankings.
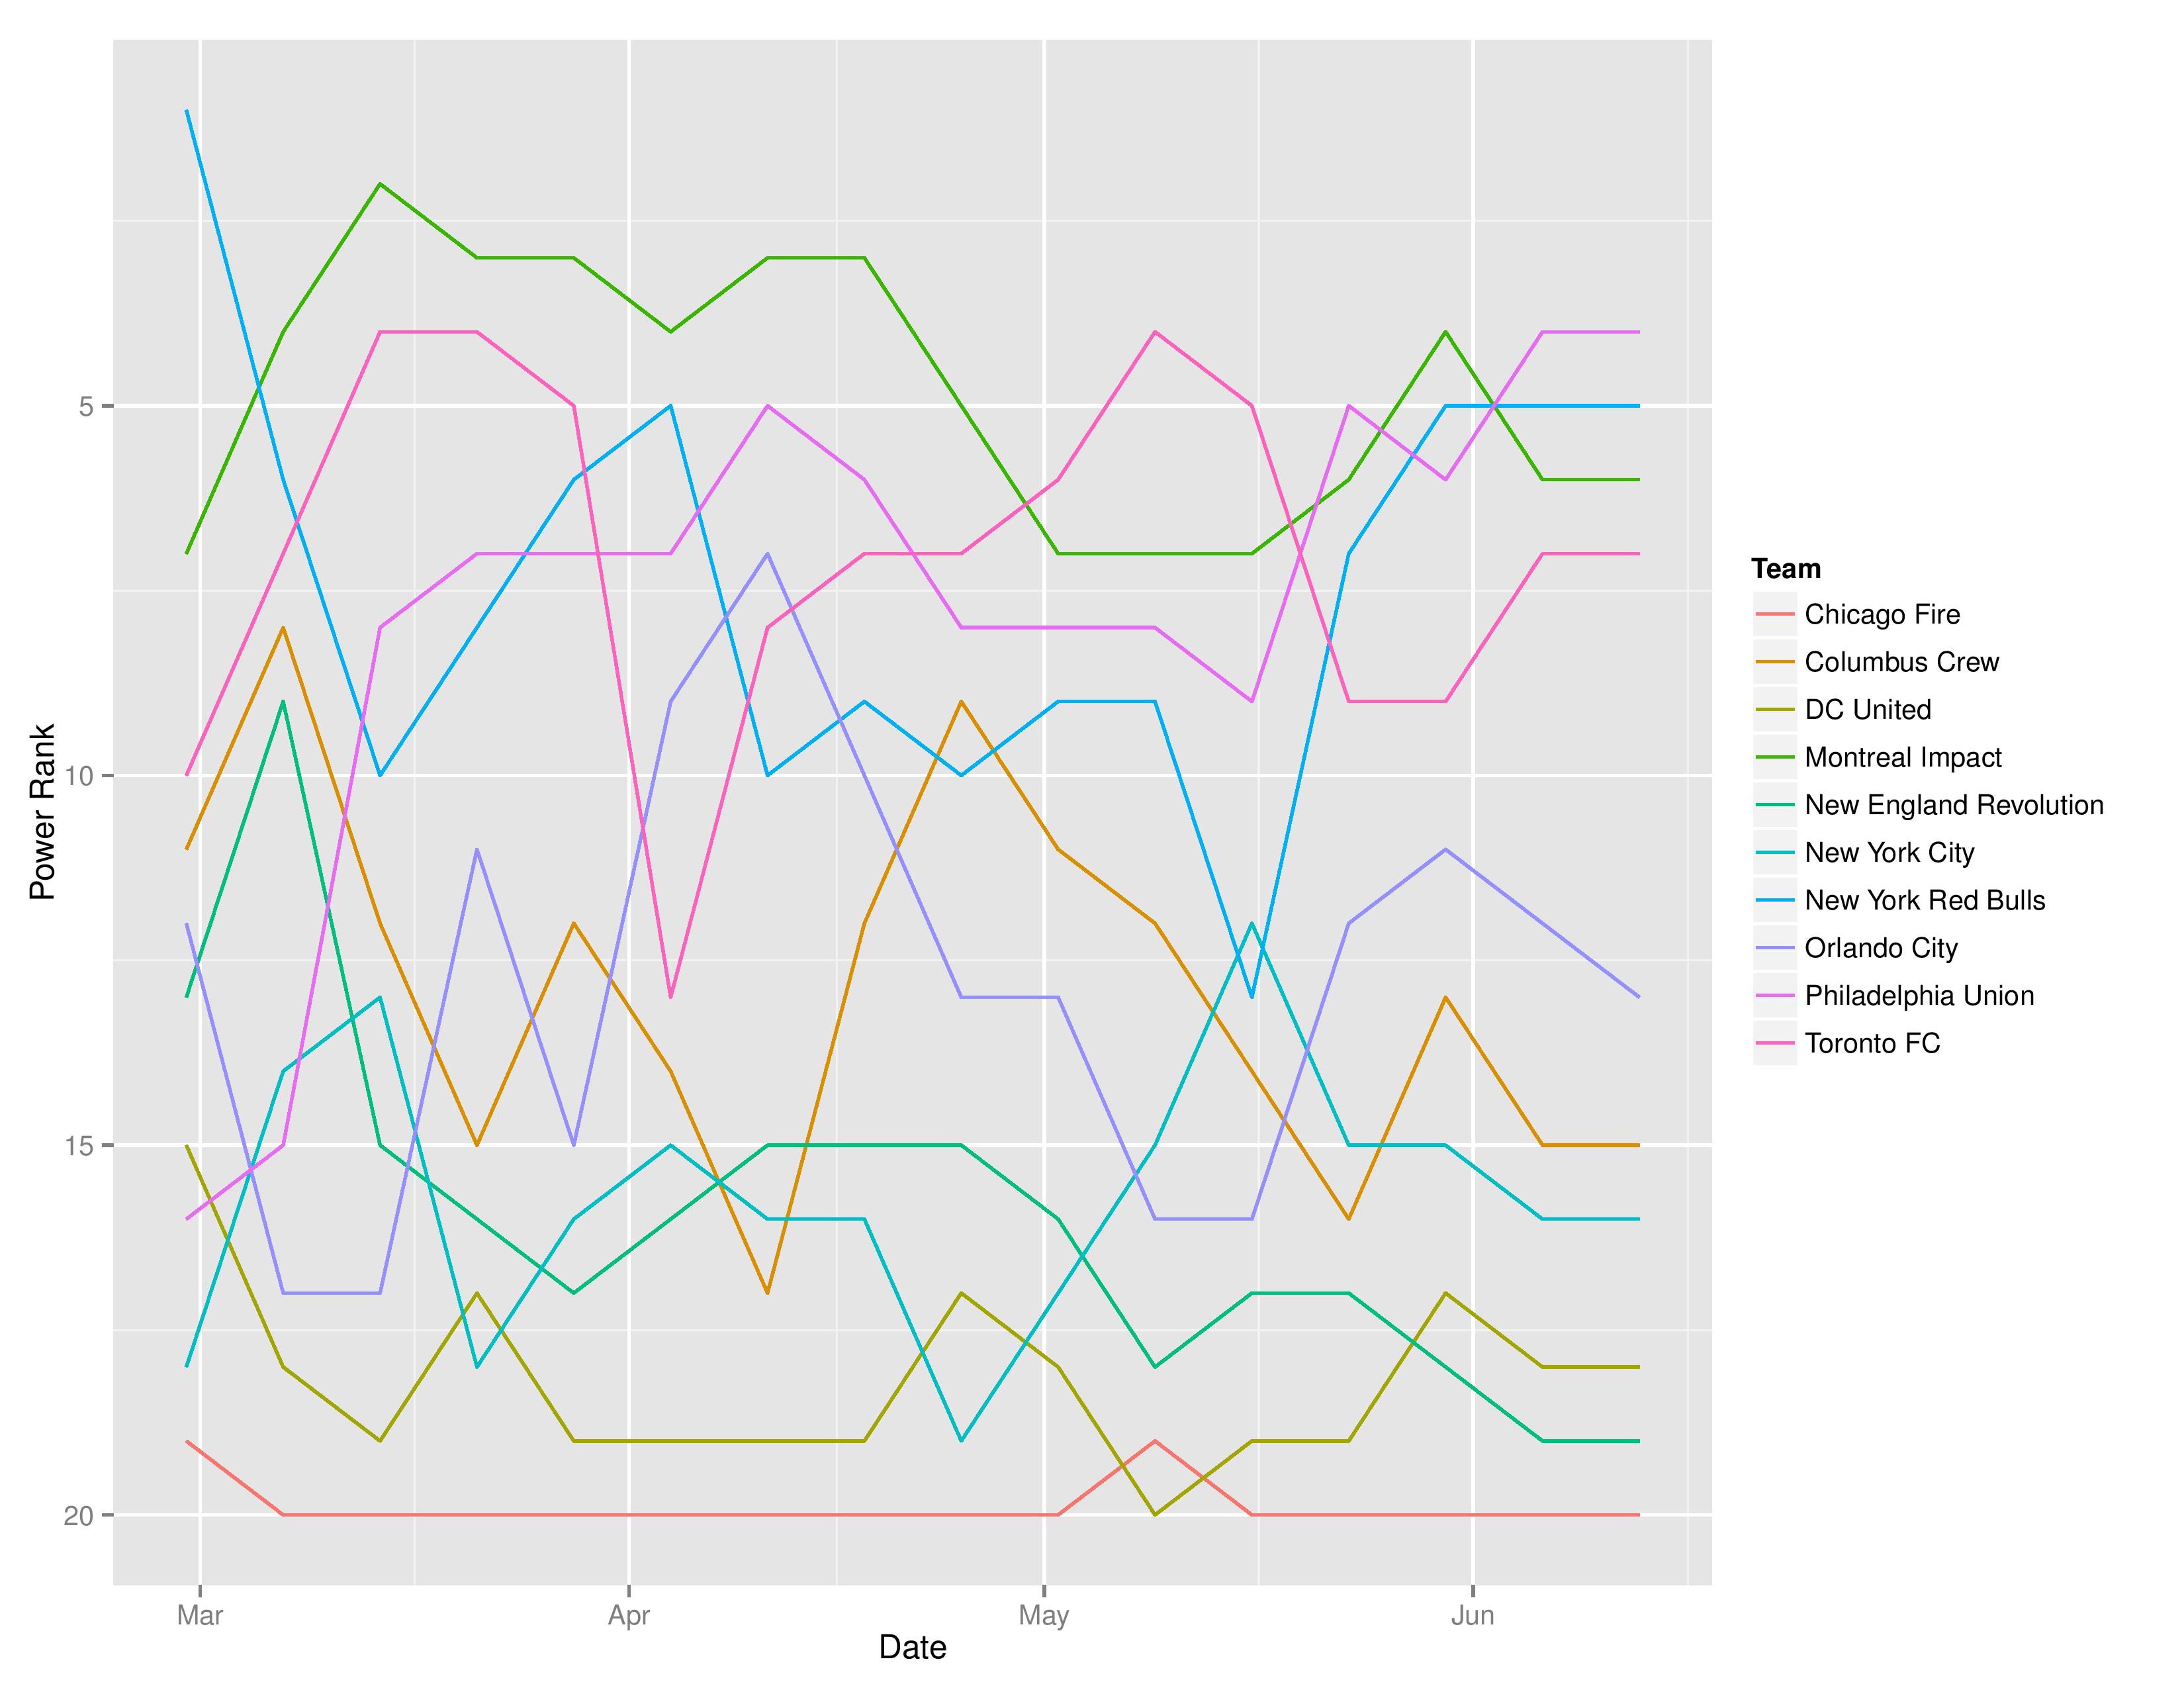
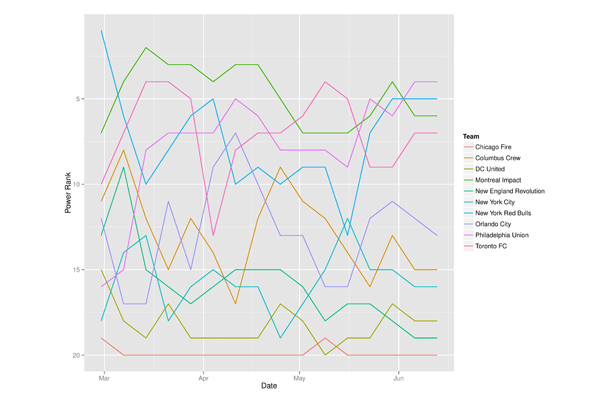
This shows the MLS Eastern Conference’s evolution of power rankings throughout the season.
Let me know in the comments how readable this is. I could cut this down to the I-95 corridor perhaps?
USL Projections
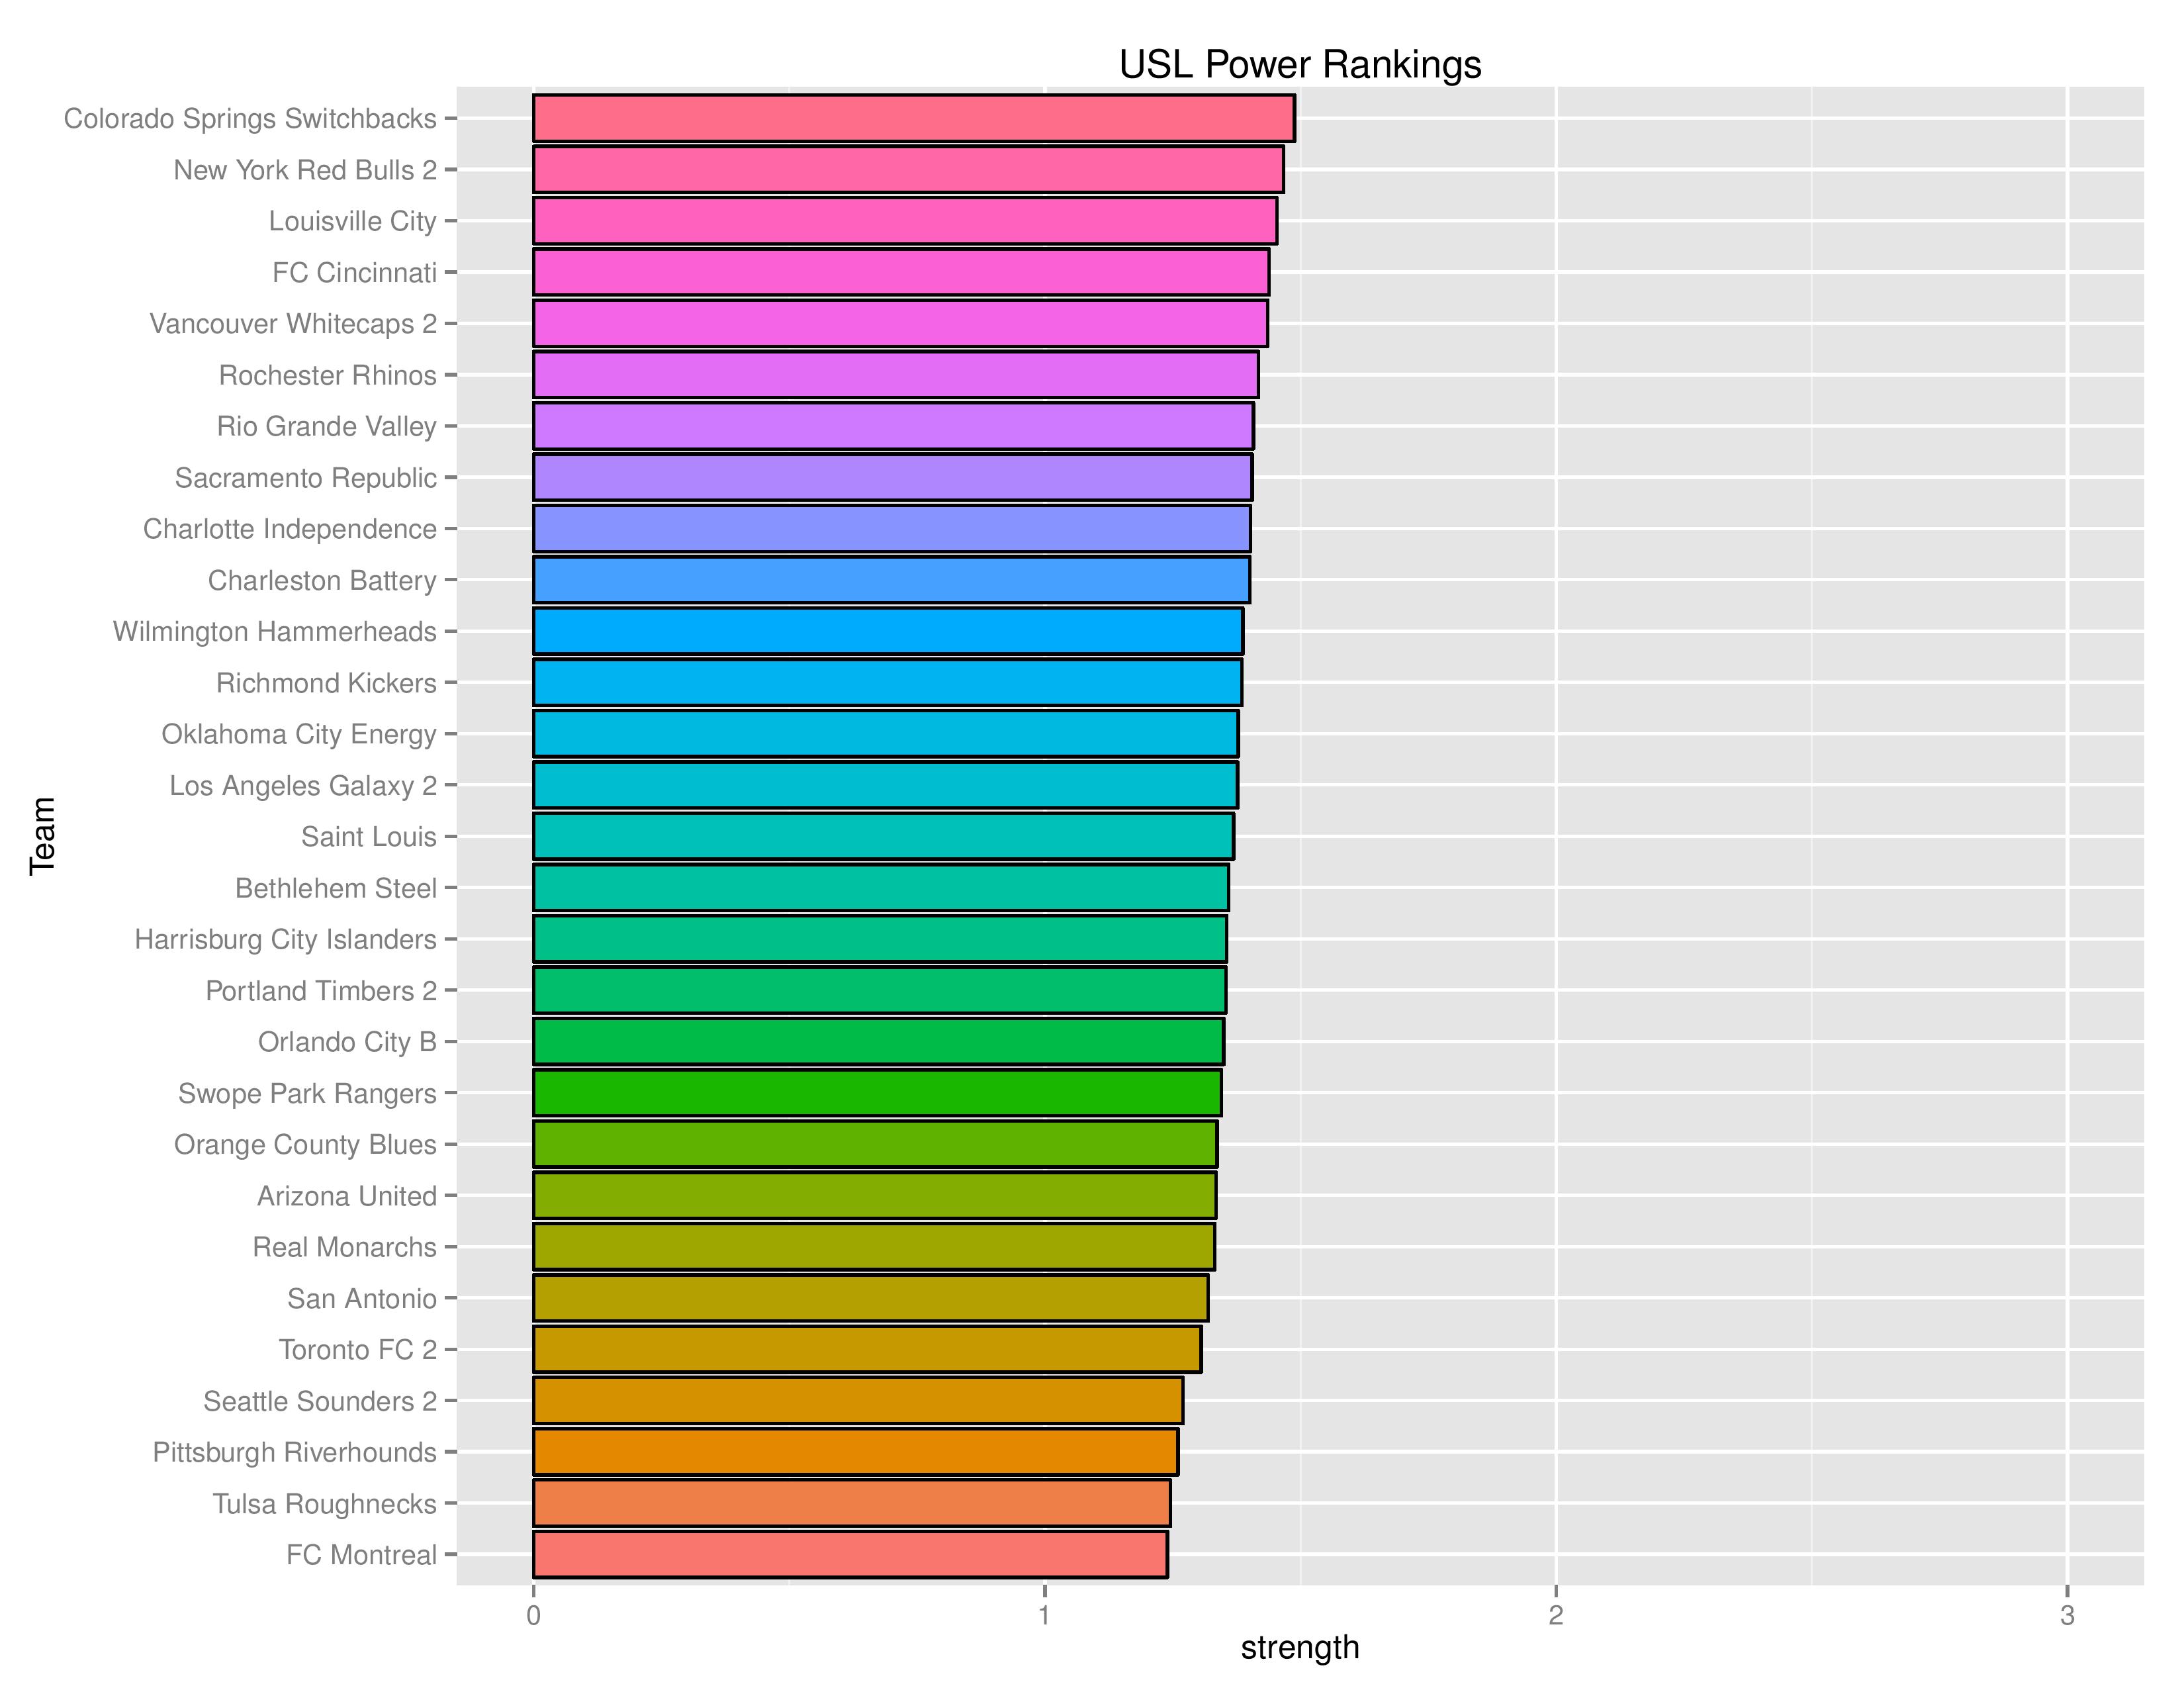
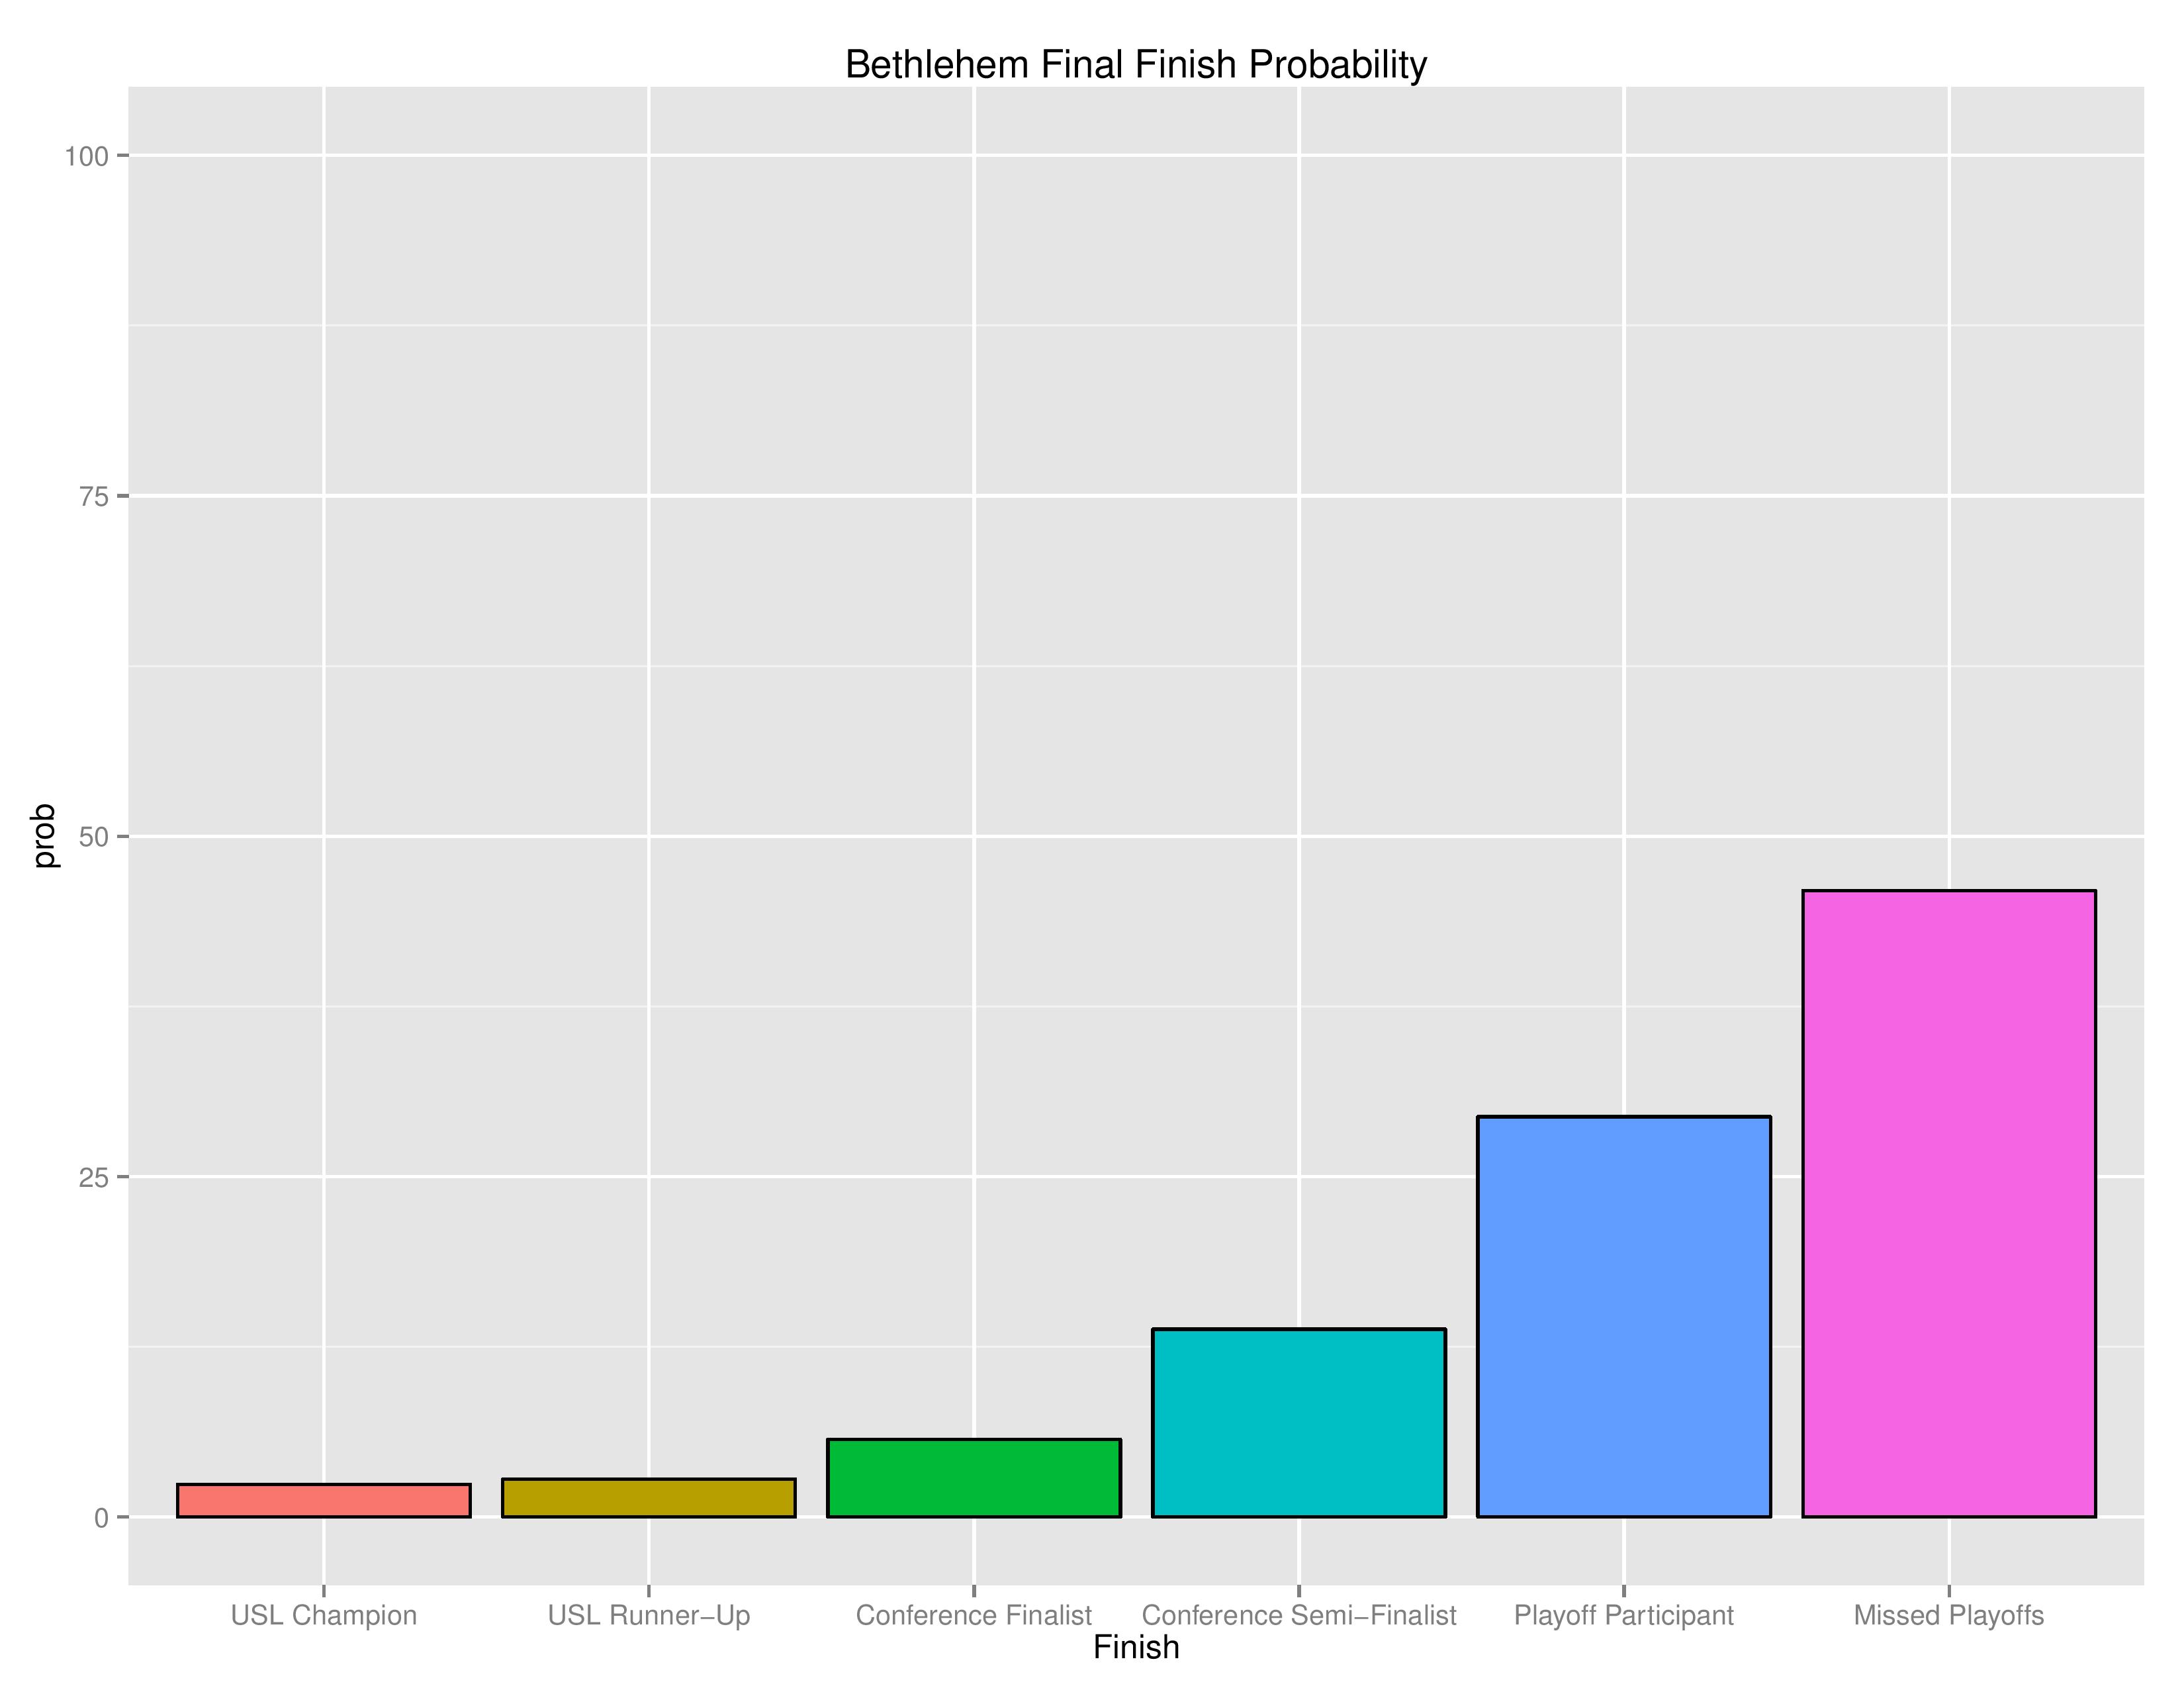
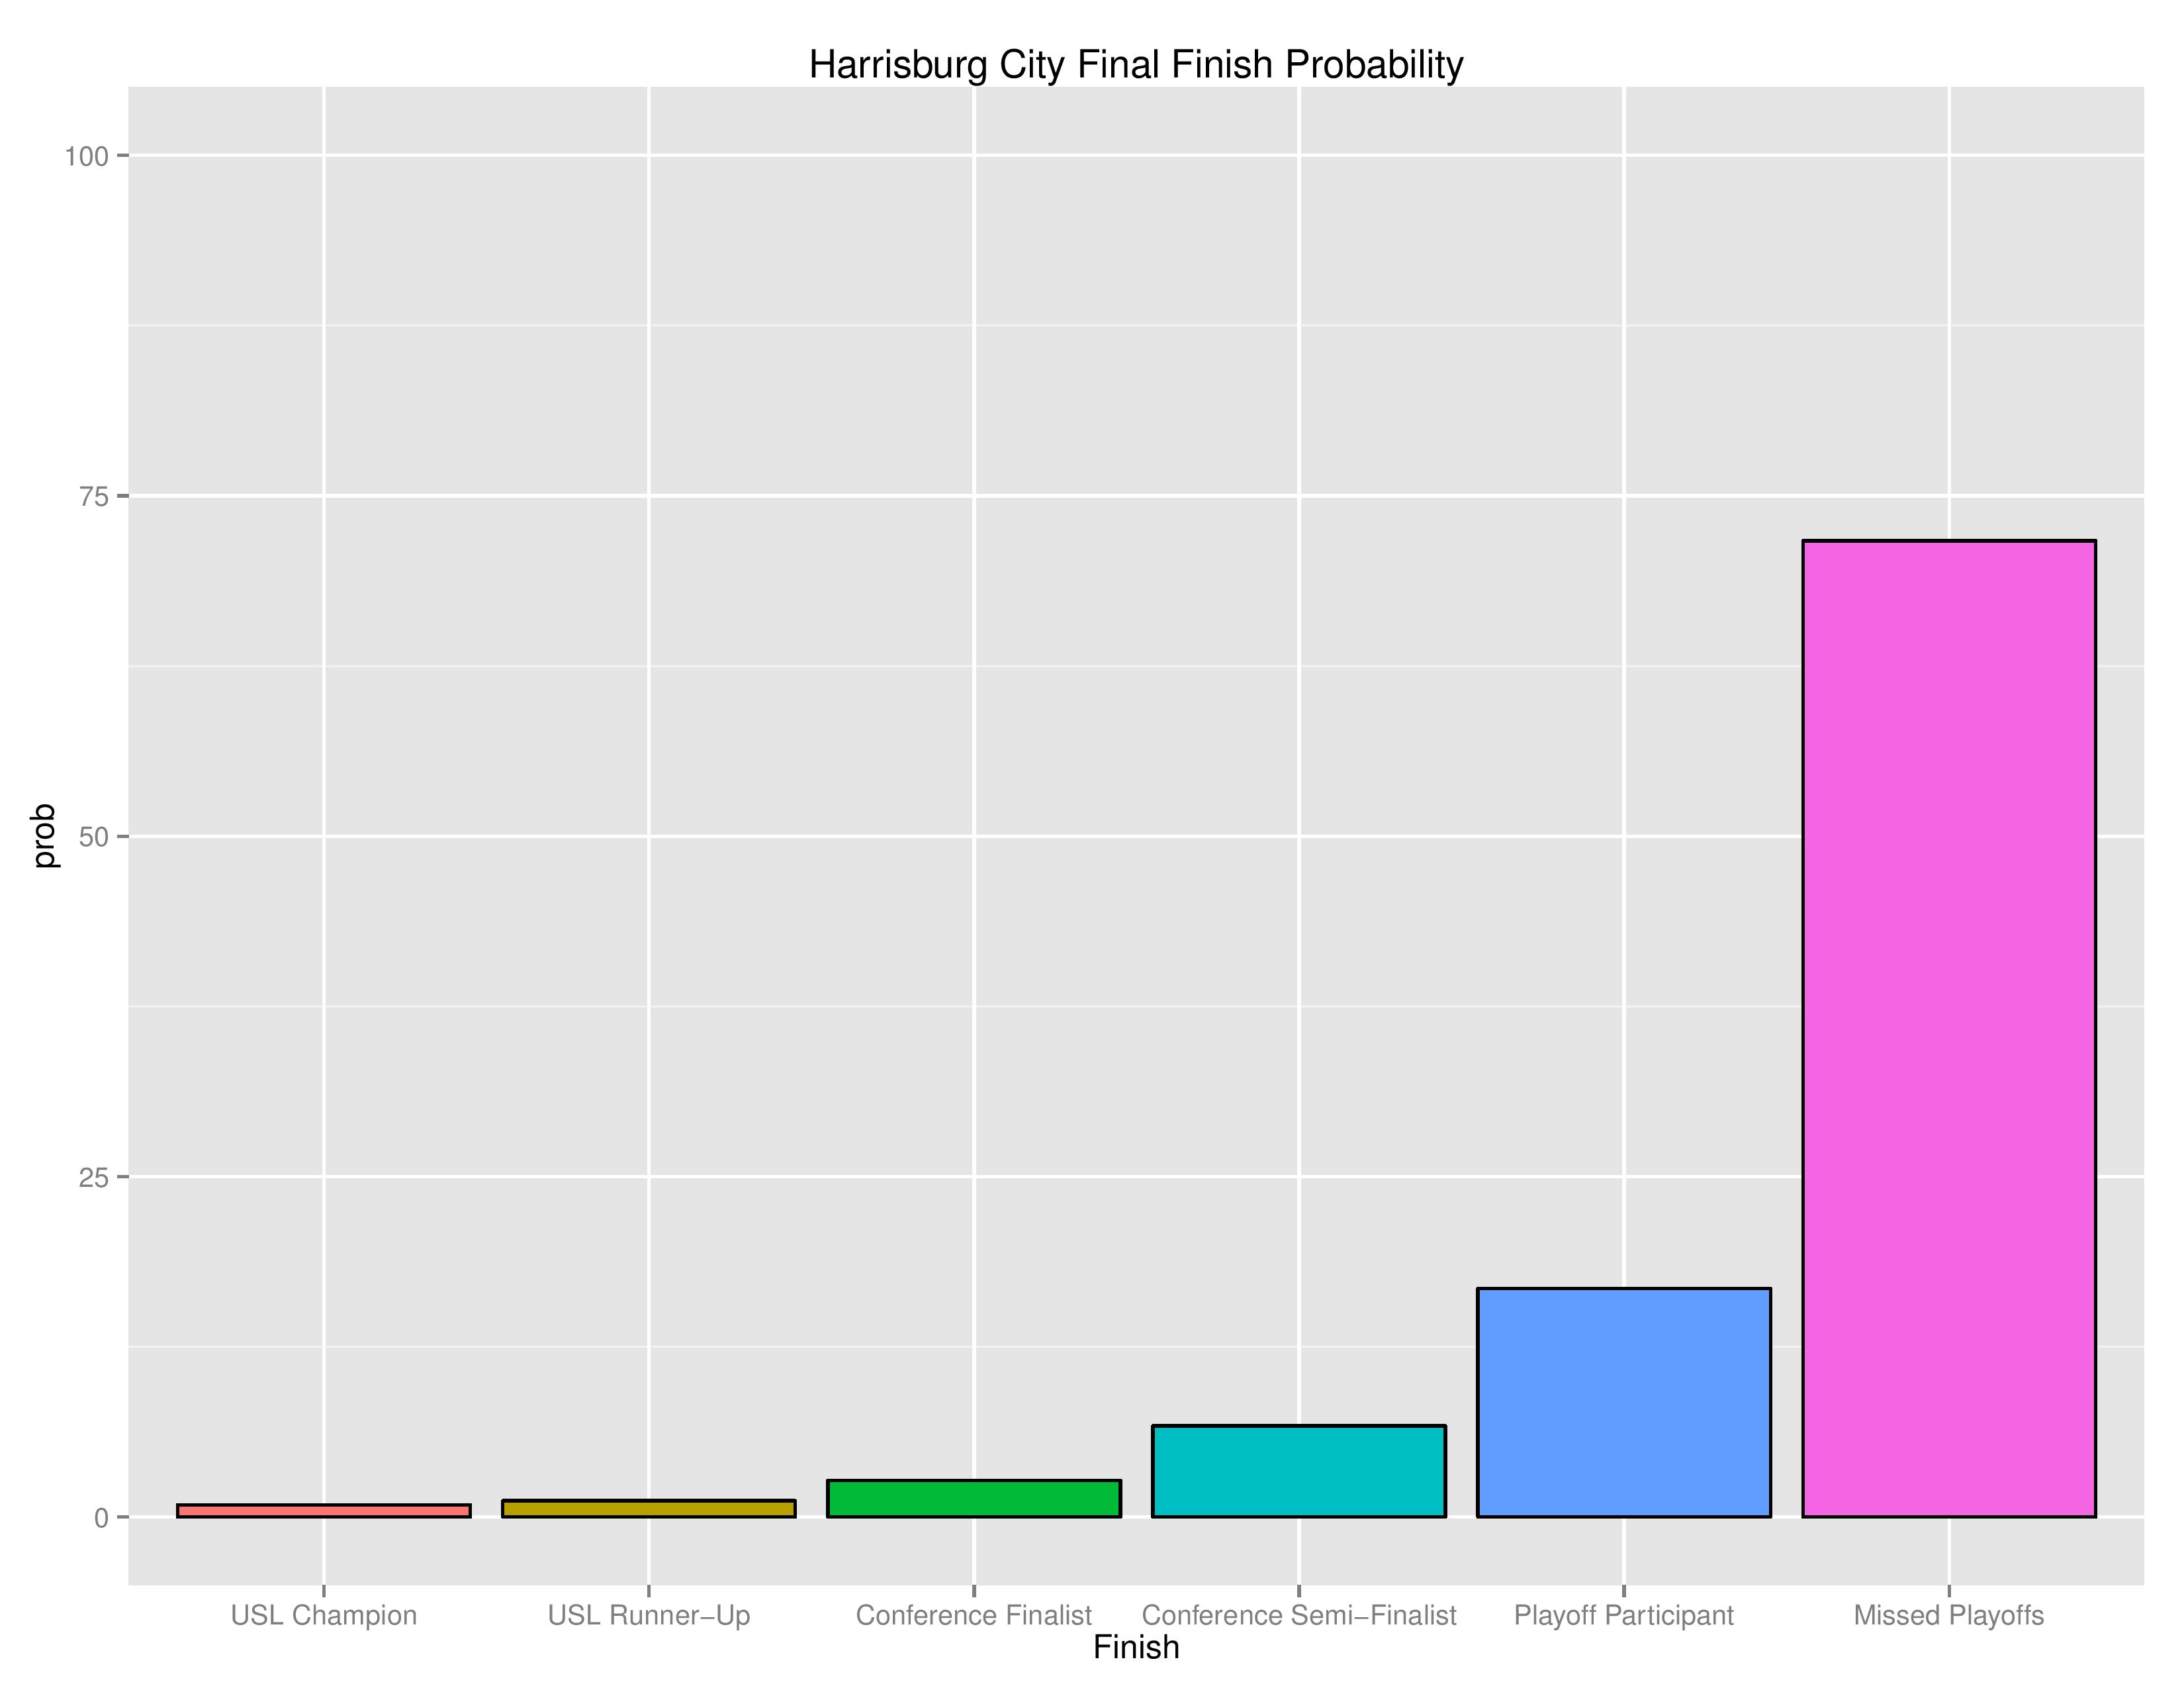
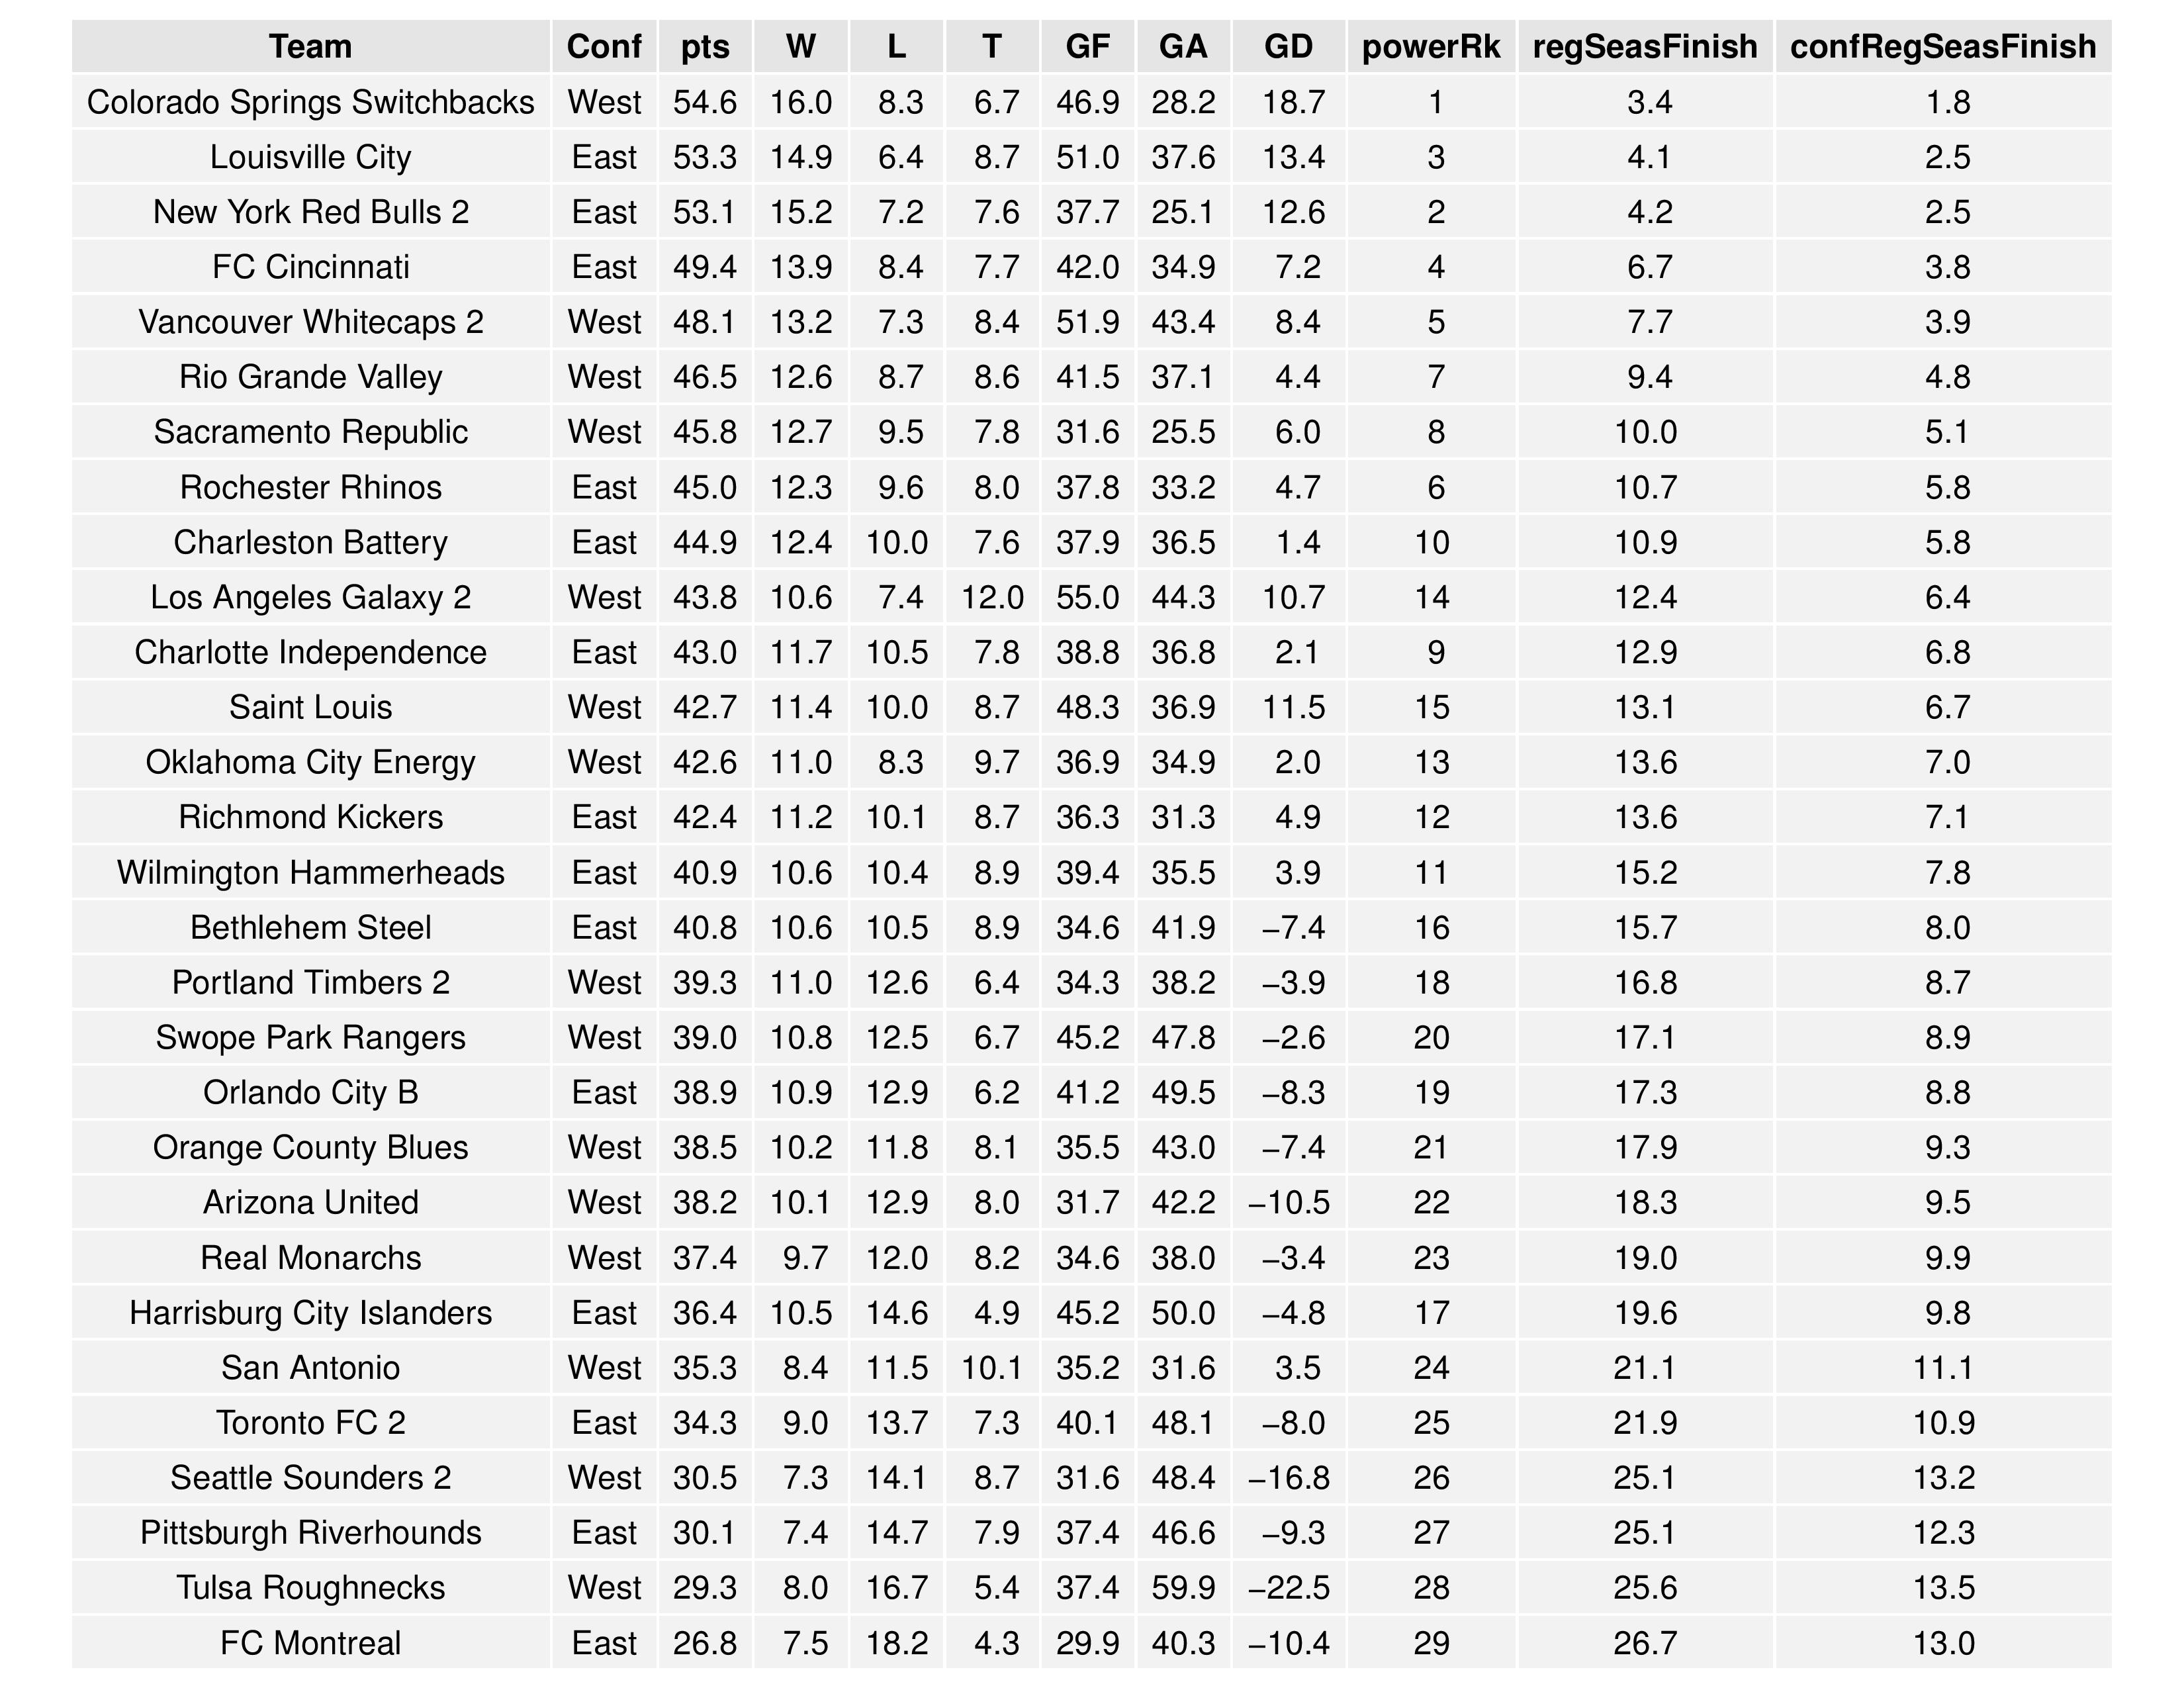
Bethlehem moves up from 20th to 16th and Harrisburg City Islanders moves down from 15th to 17th.
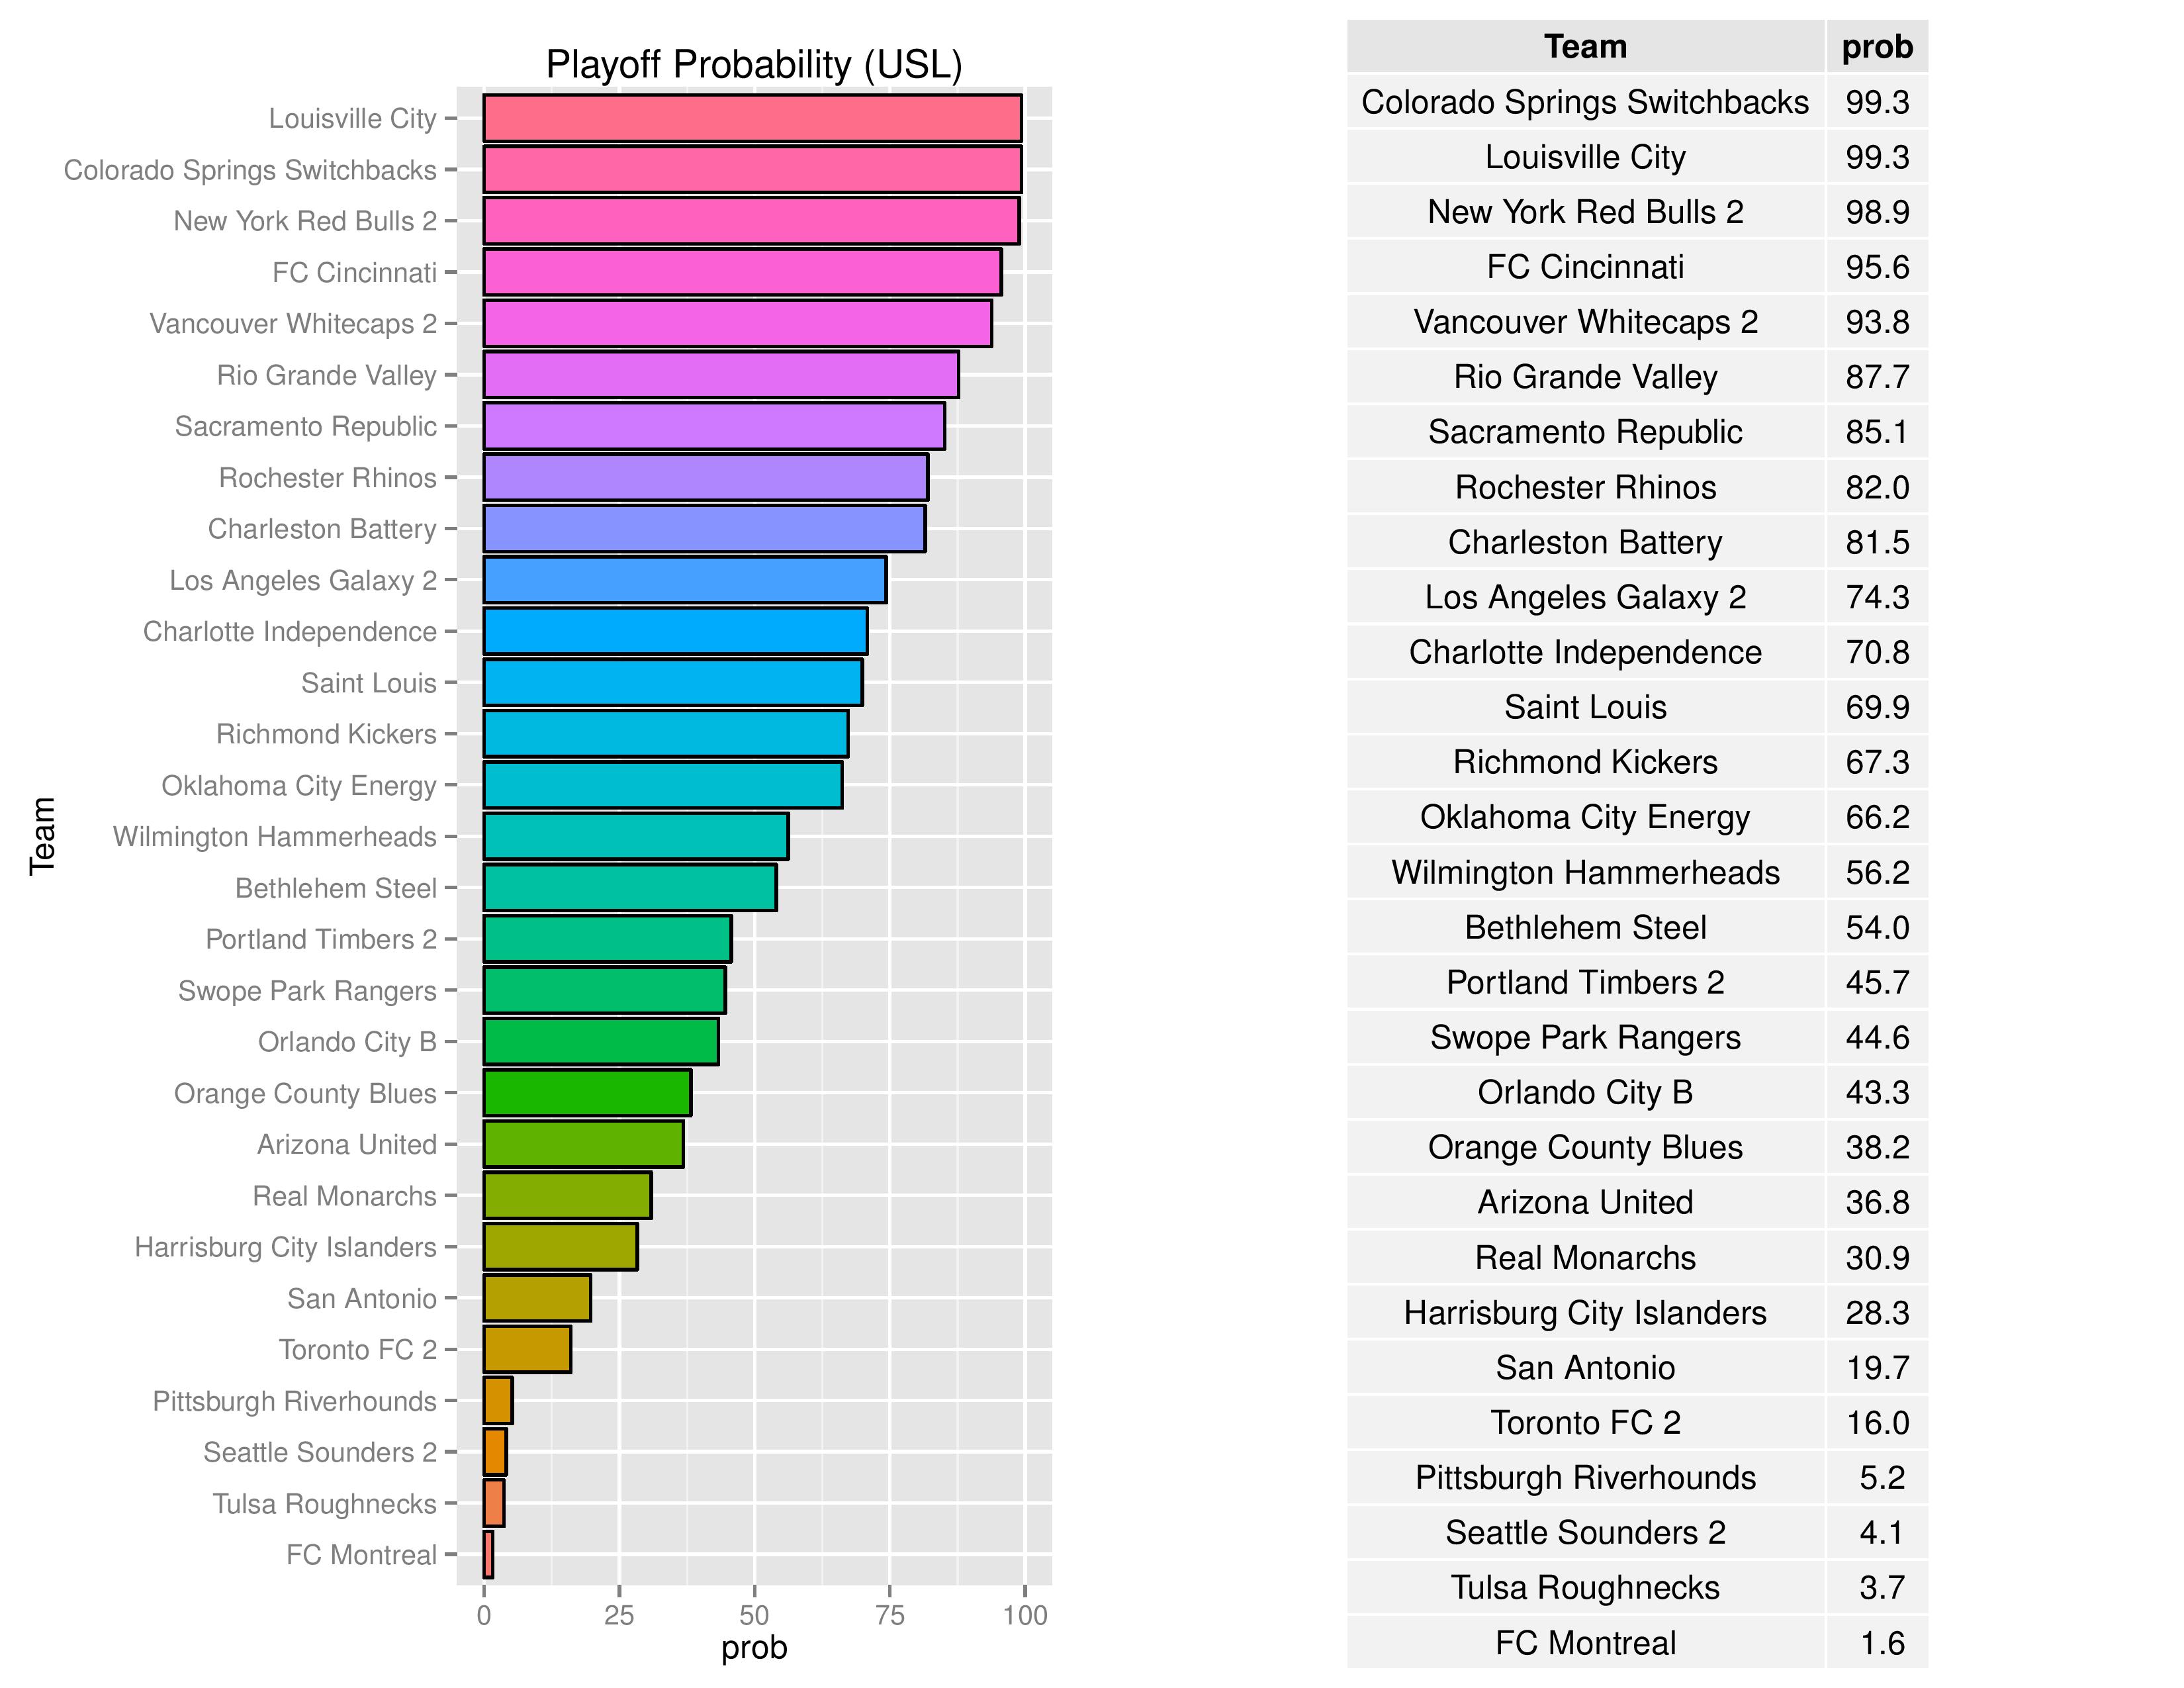
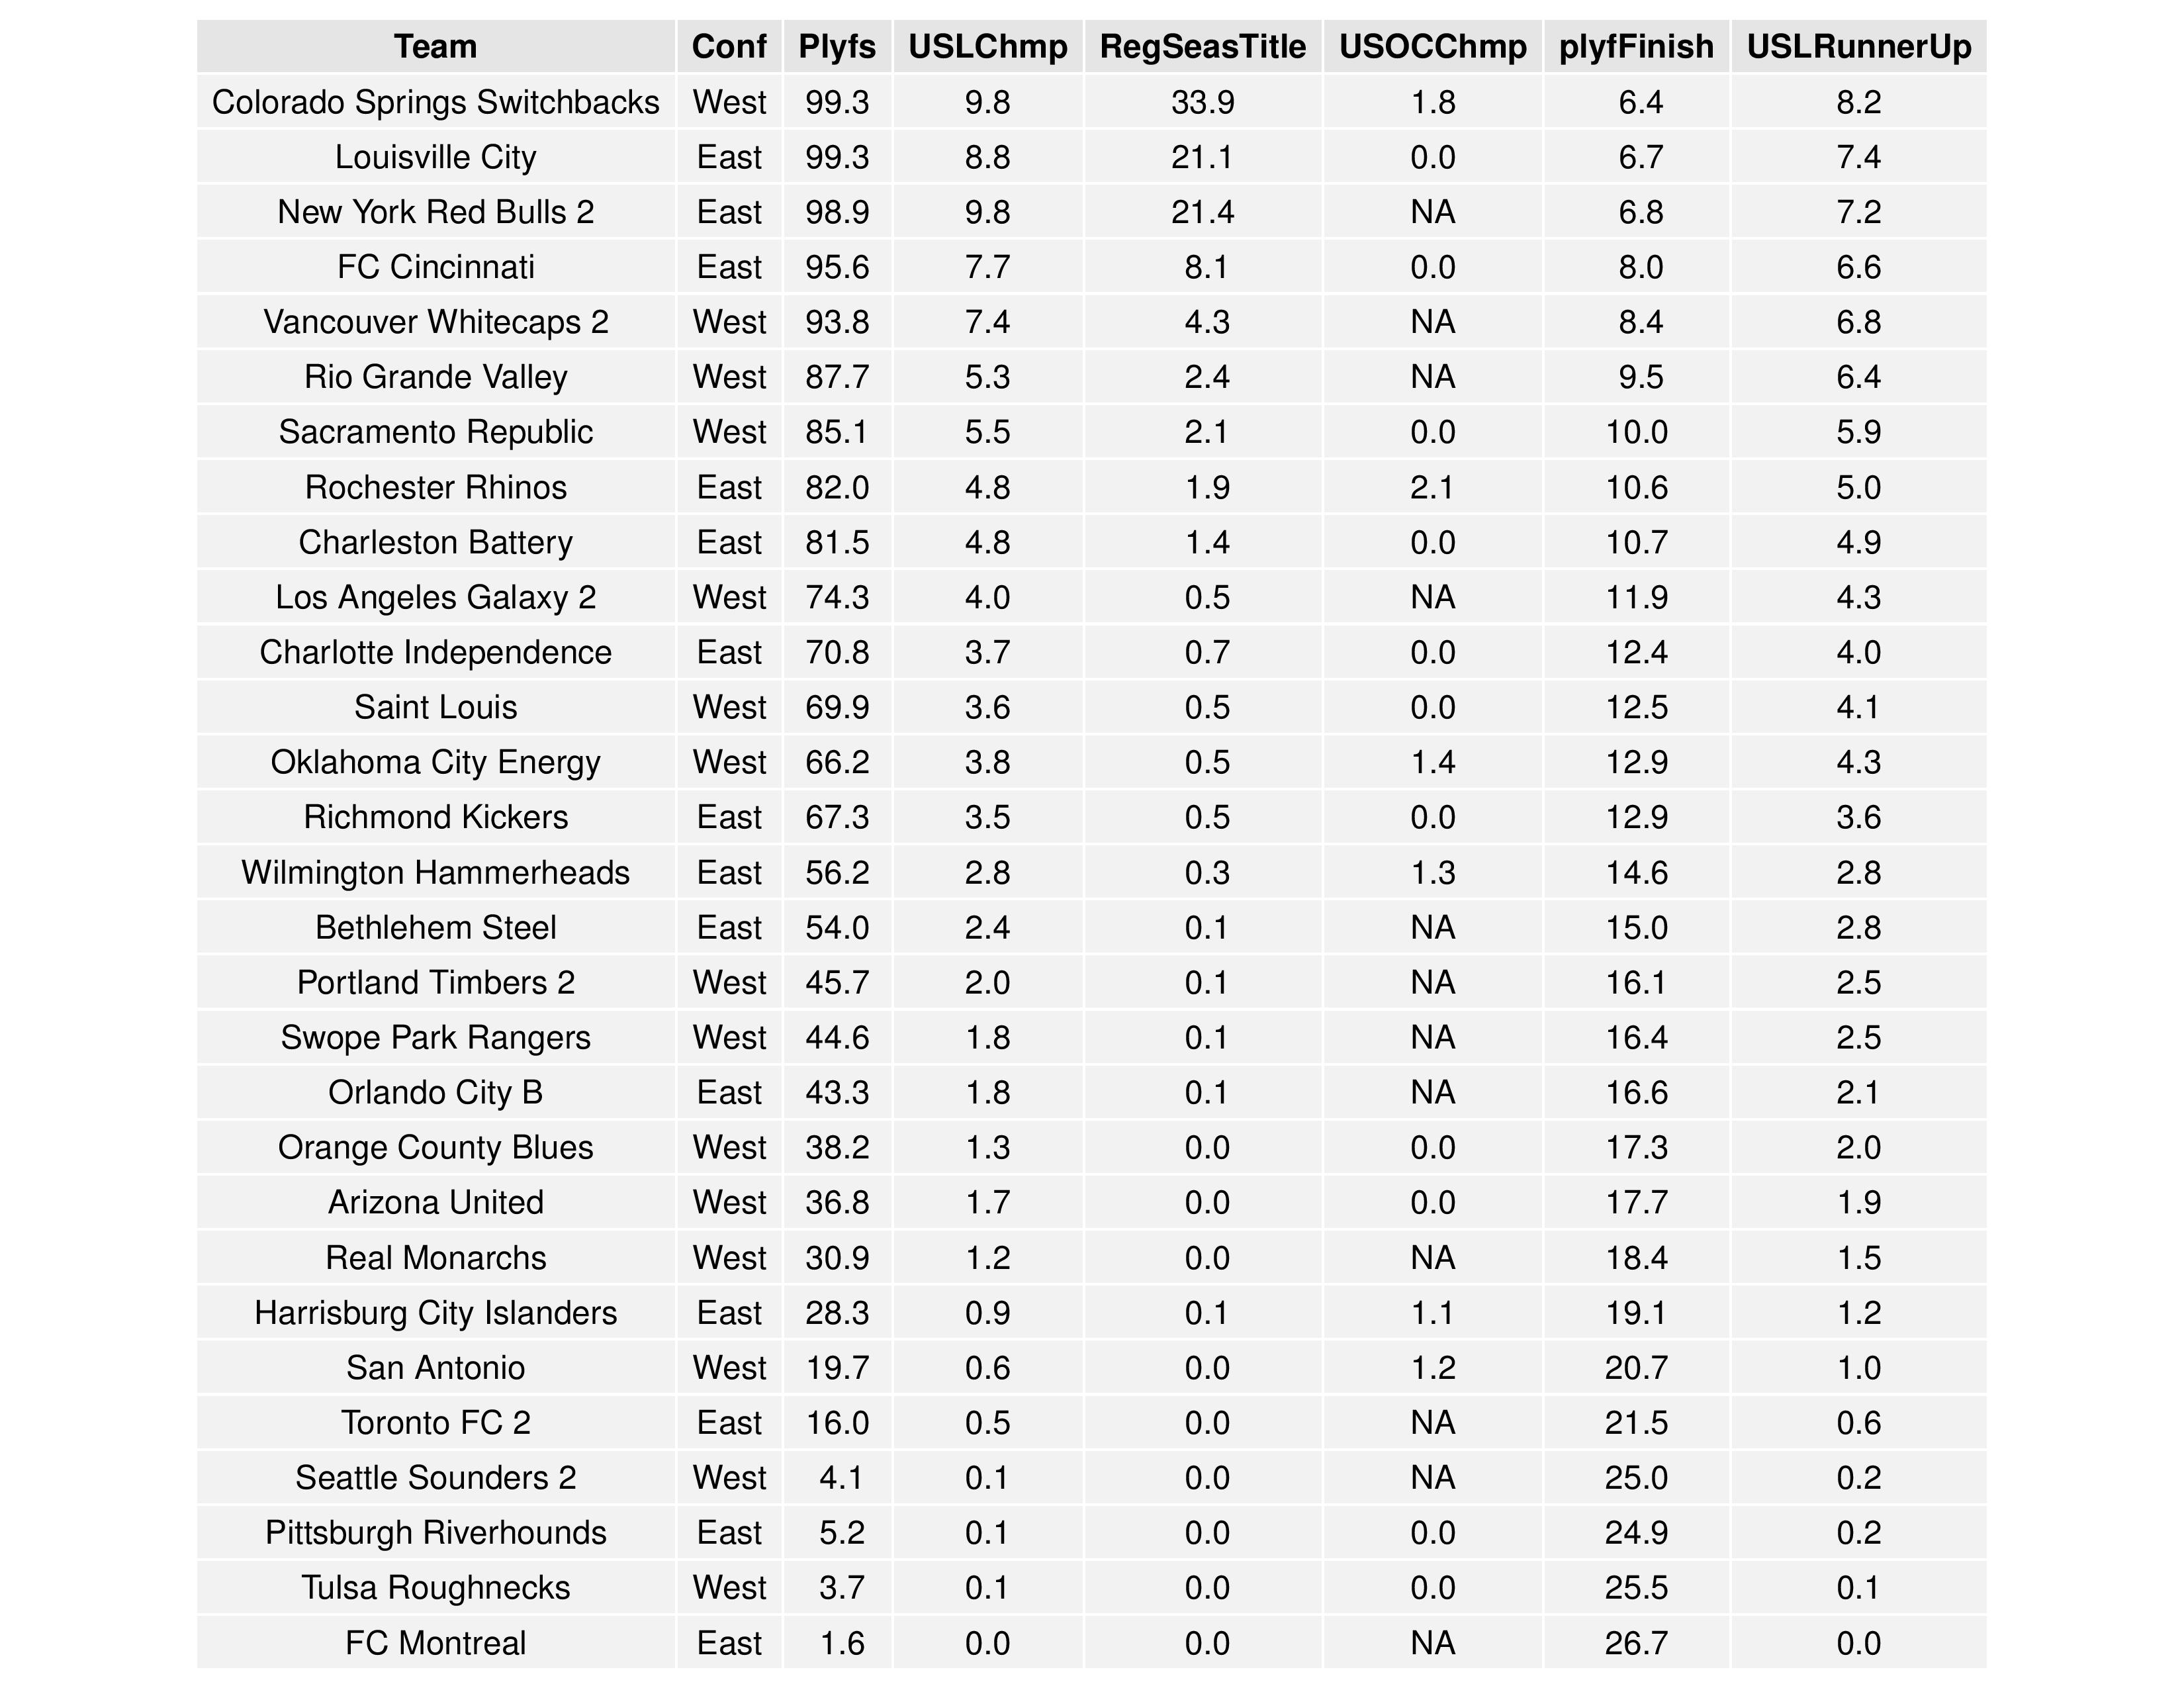
Bethlehem’s probability of making the playoffs jumped up from 40.6% to 54.0%. Harrisburg’s chances continued down from 38.4% to 28.3%.
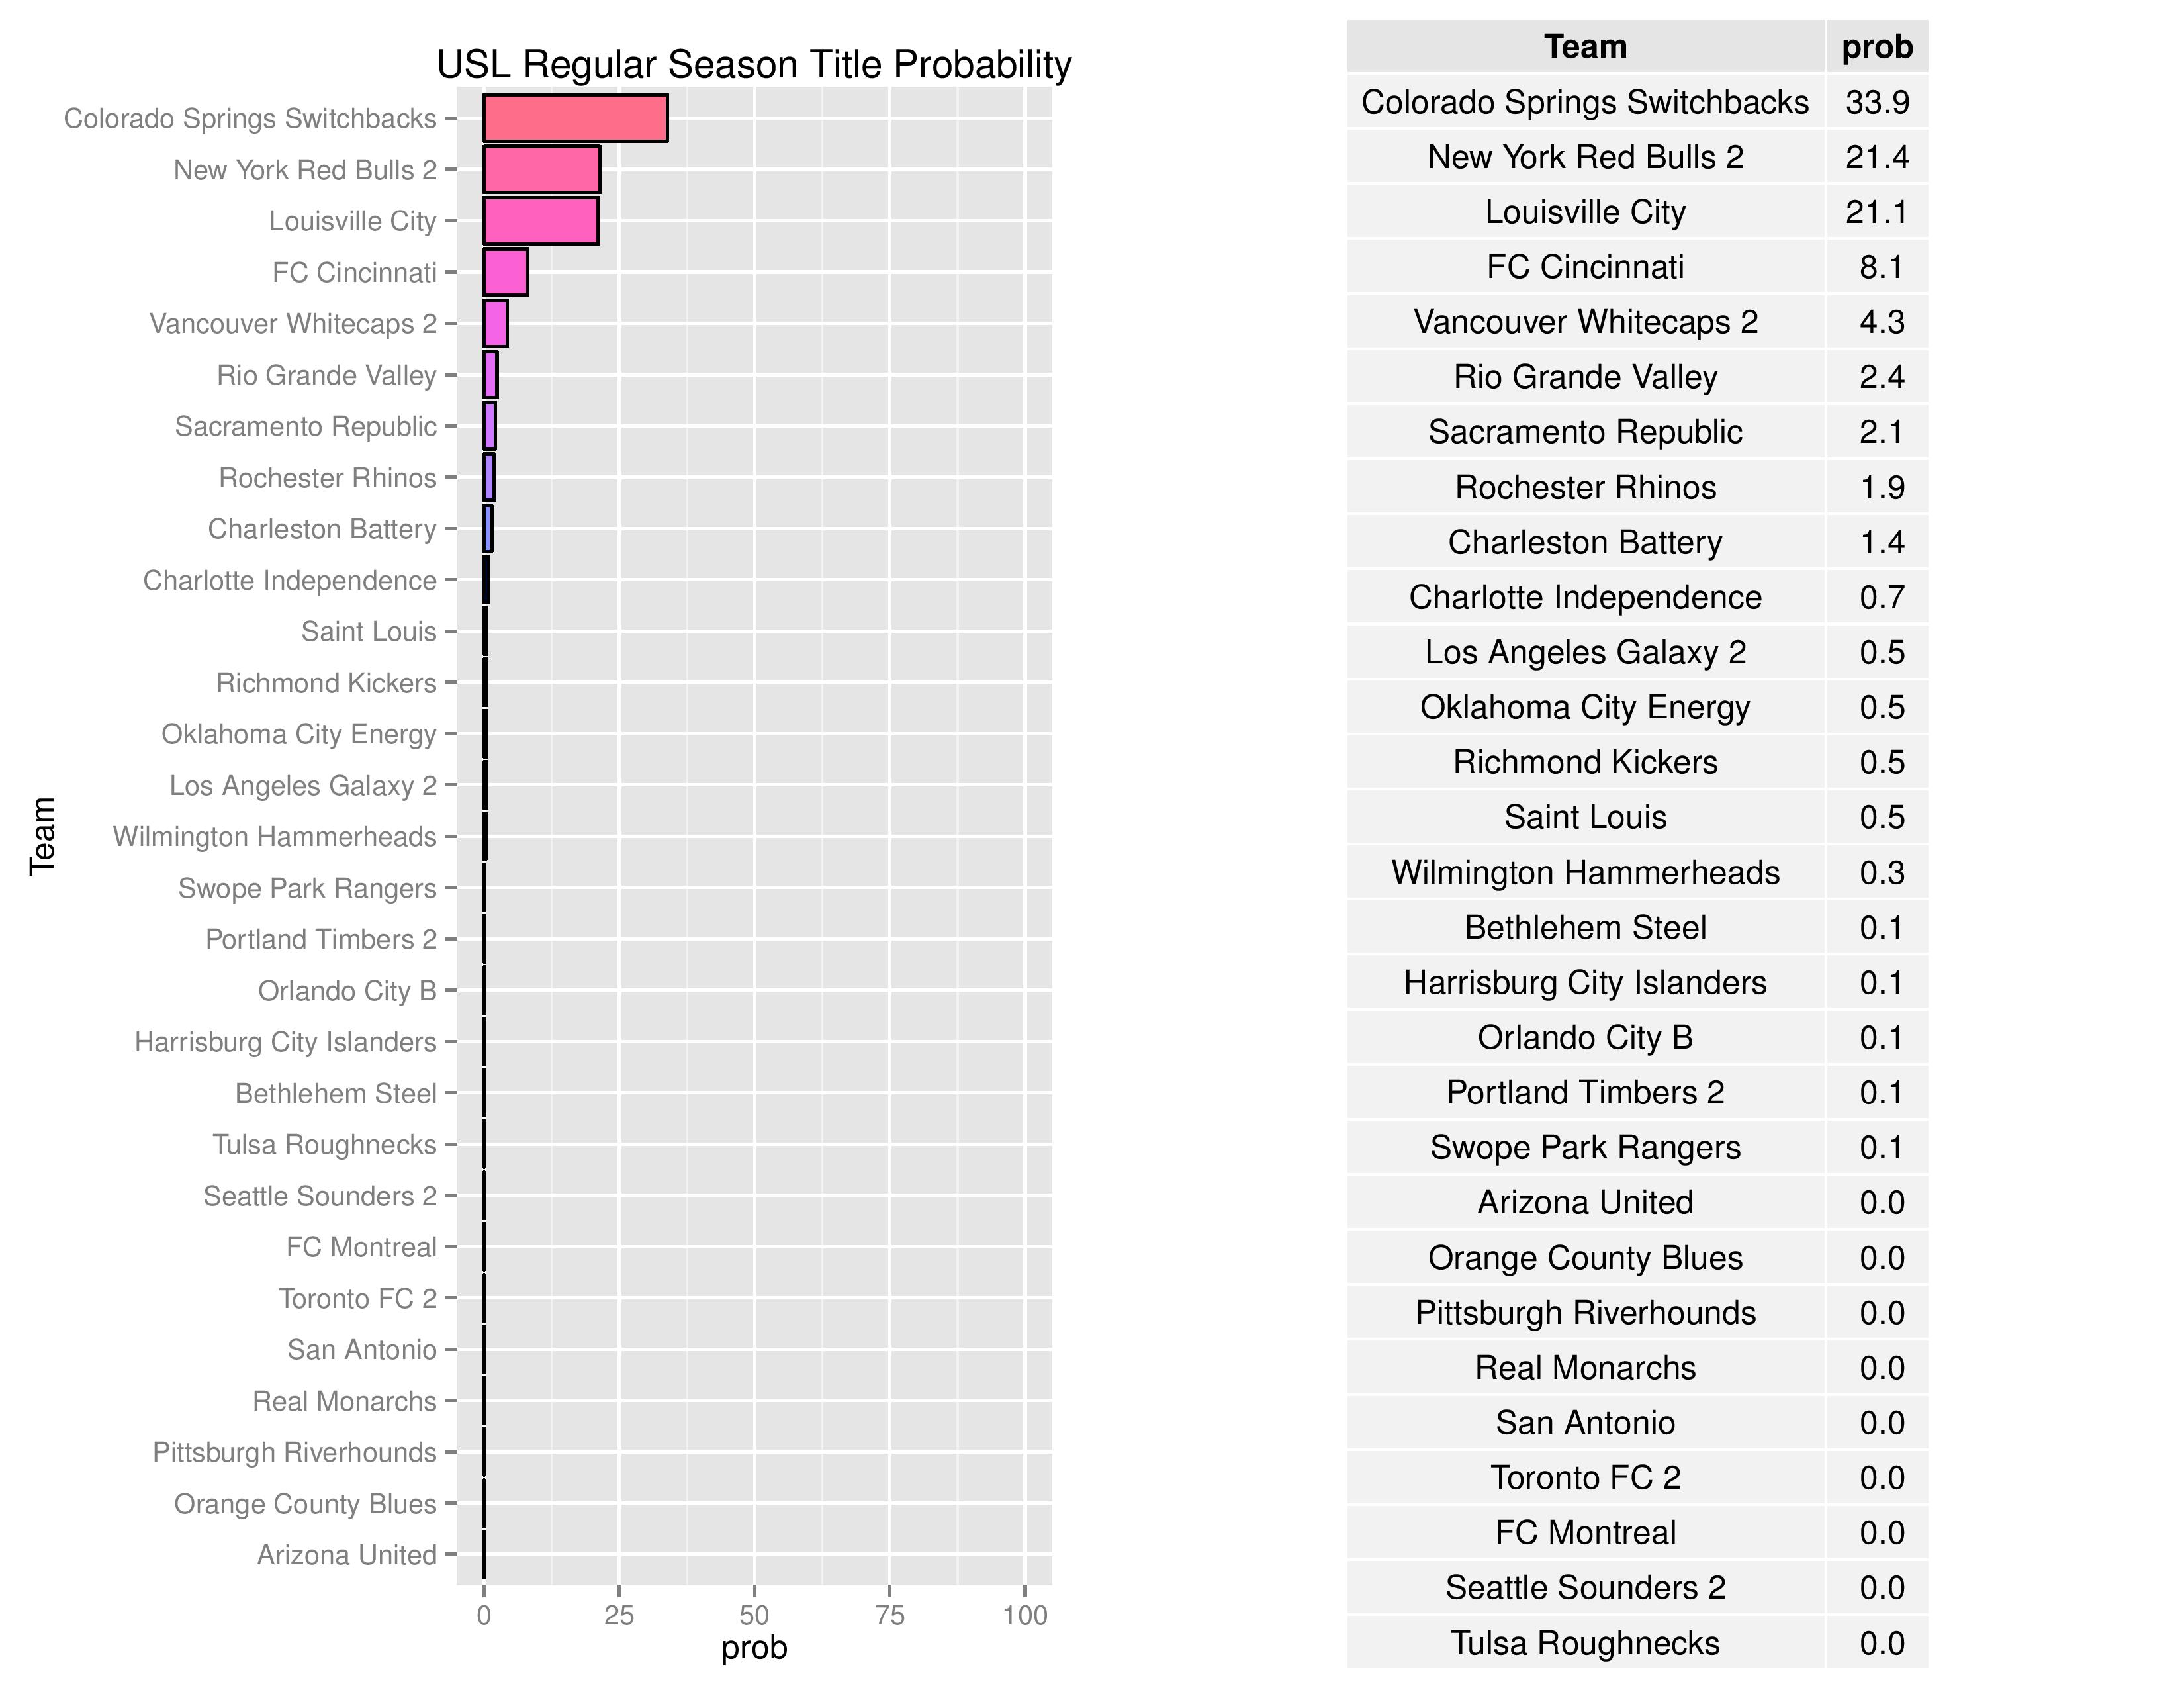
Both Bethlehem and Harrisburg City continue to have negligent chances of winning the USL Regular Season Title.
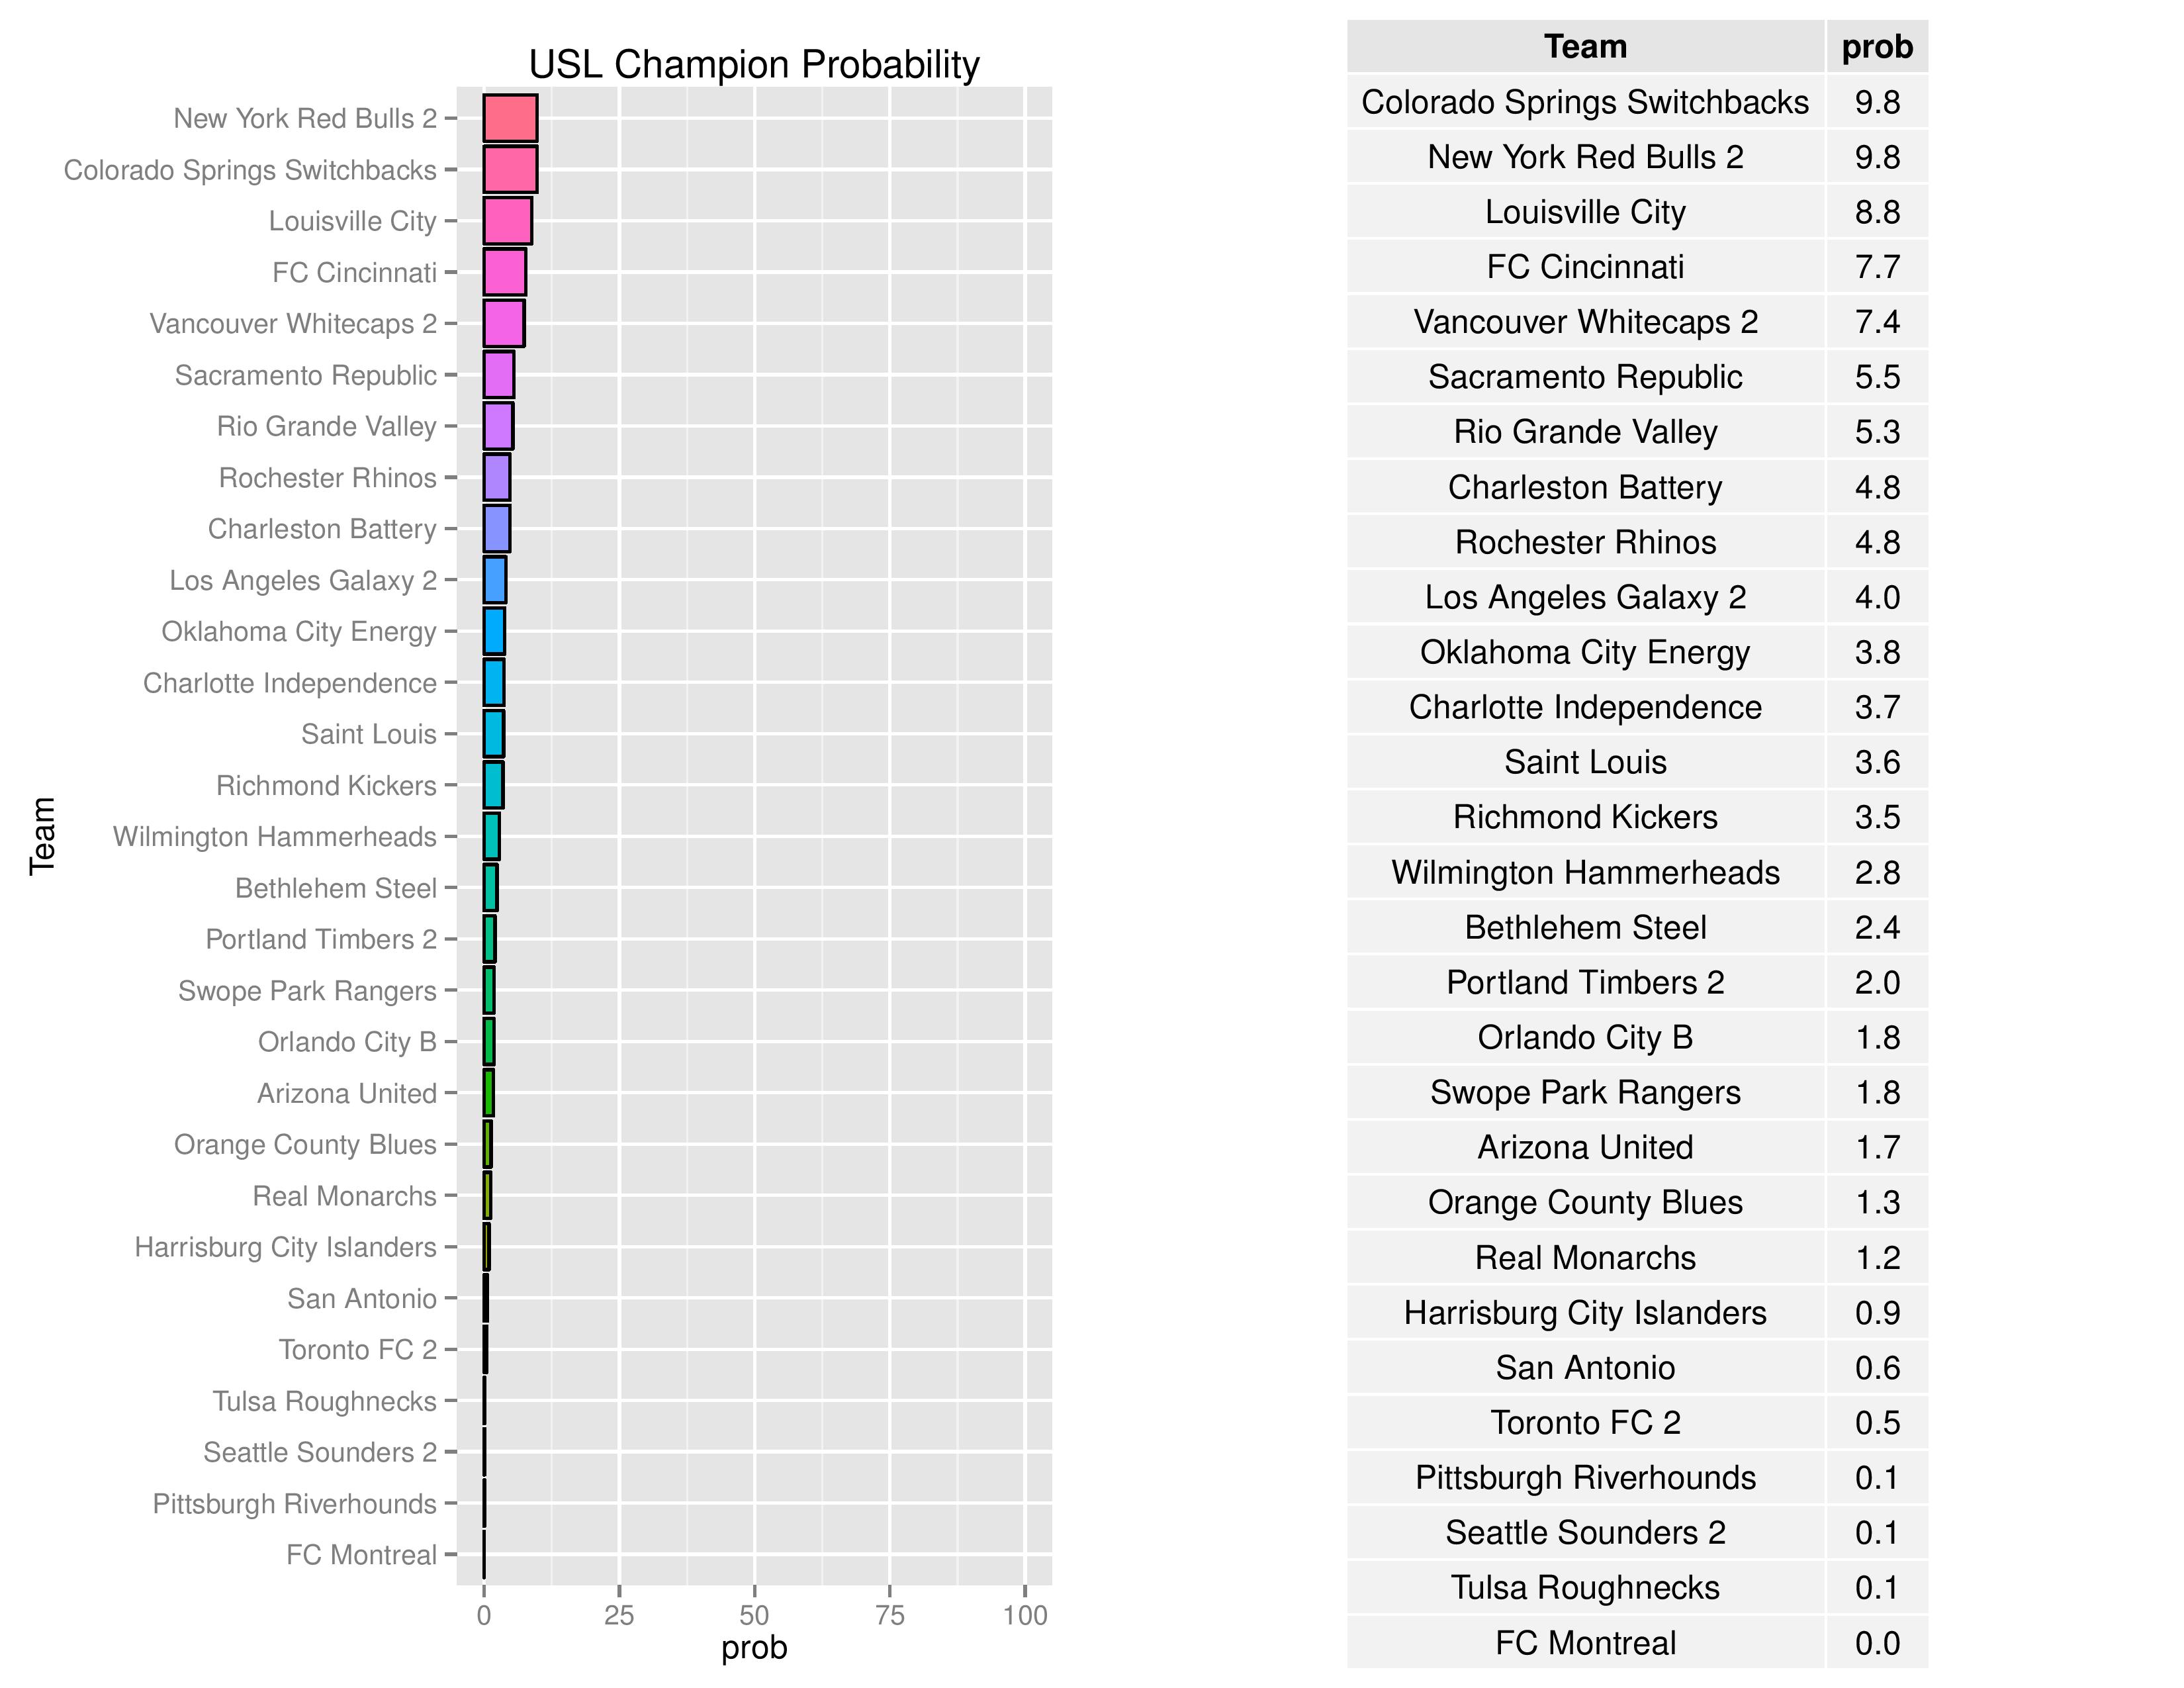
Bethlehem’s probability of winning the USL Championship increased from 1.8% to 2.4%. Harrisburg City’s chances dropped from 1.6% to 0.9%.
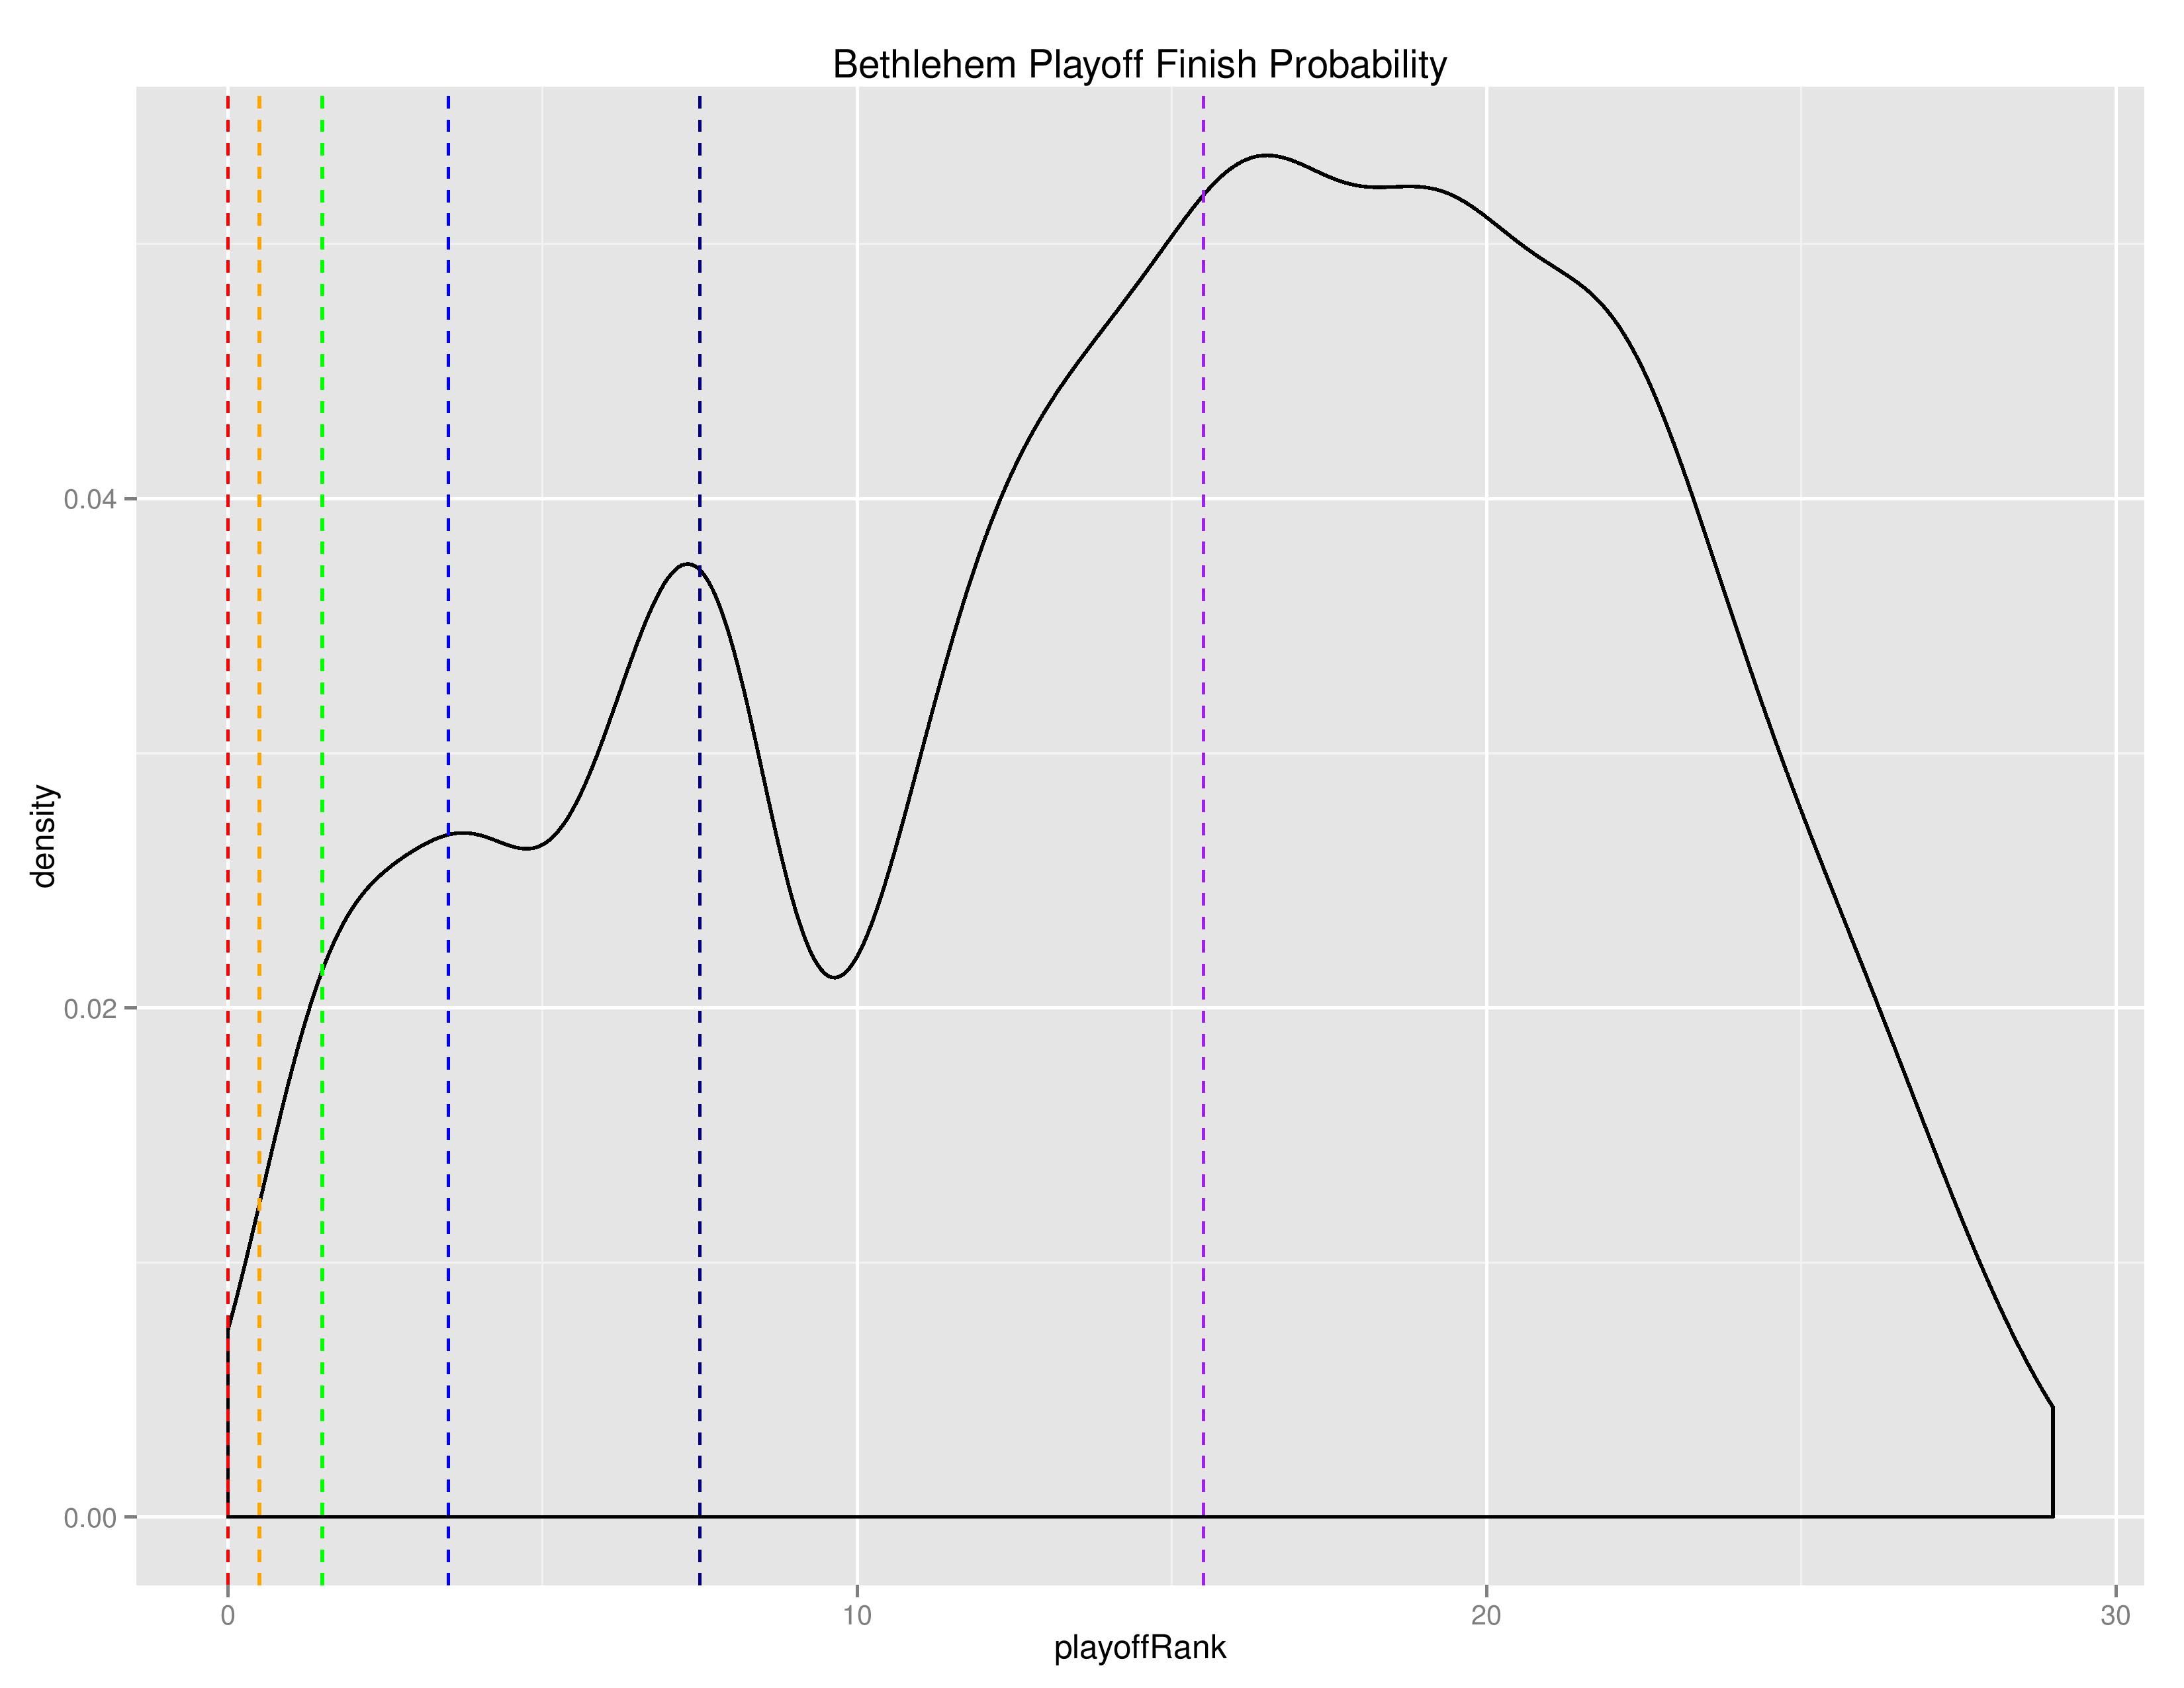
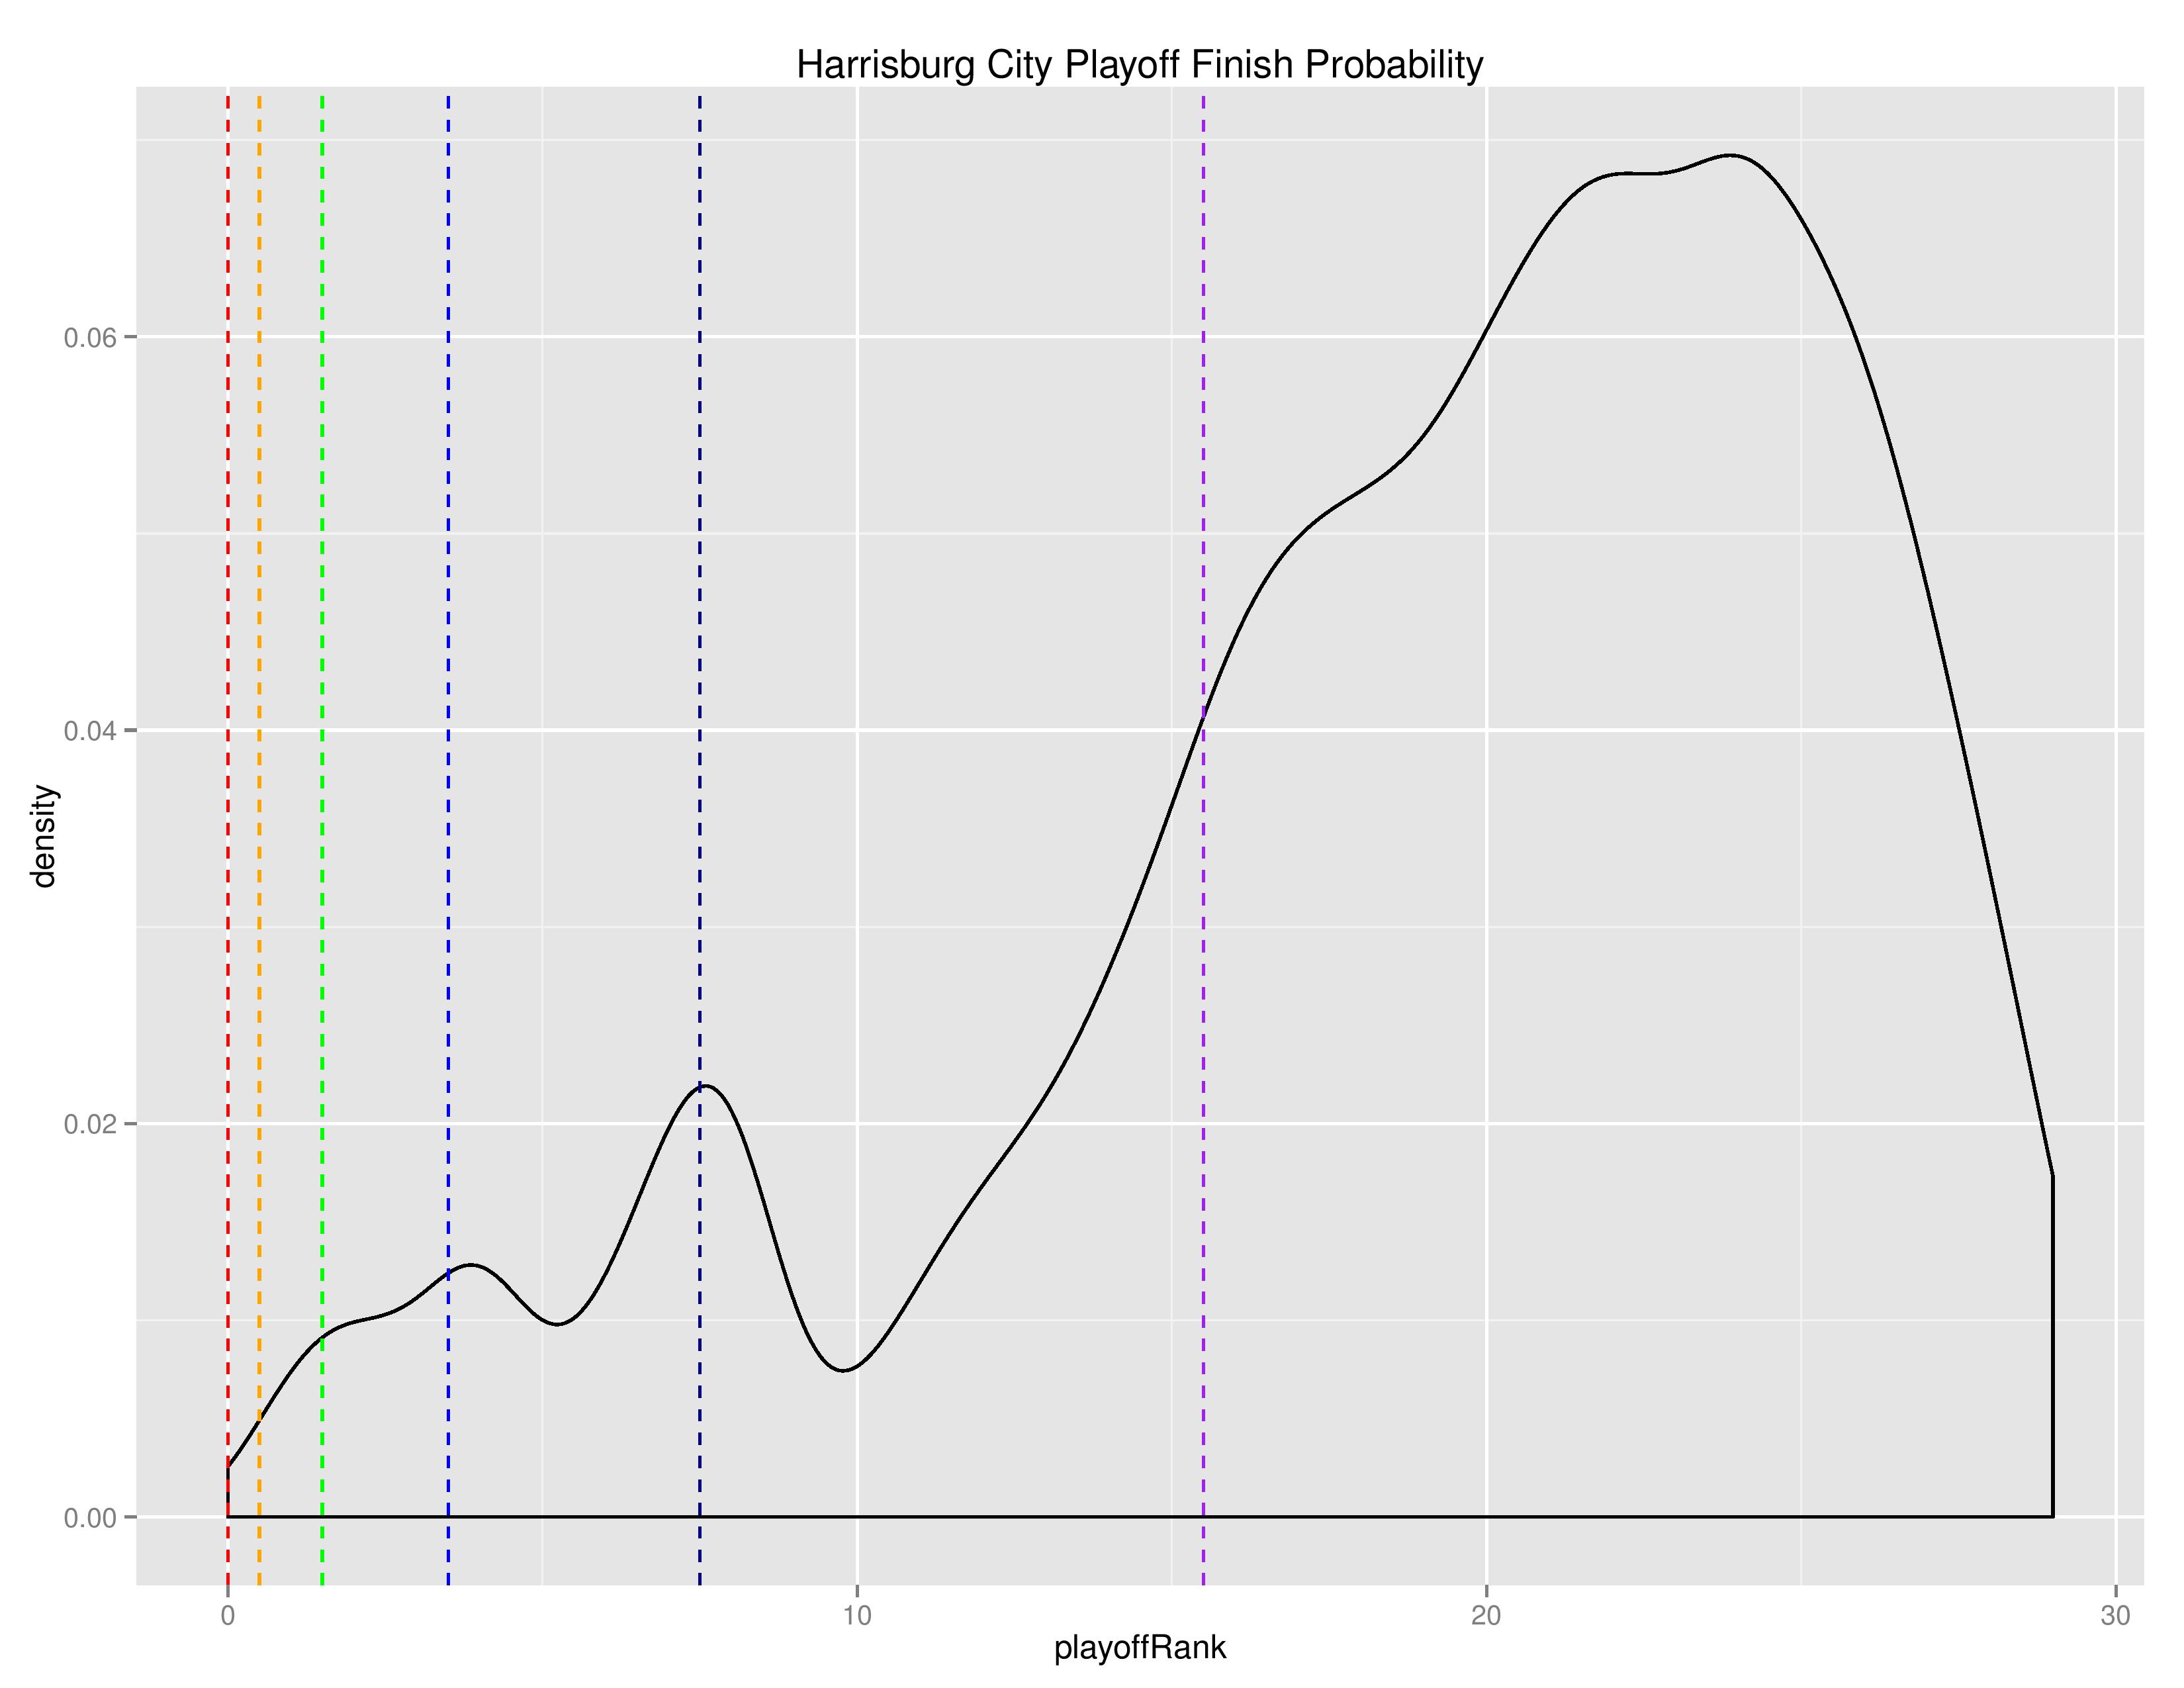
As with MLS, the below density charts show the relative probabilities of Bethlehem and Harrisburg finishing for their final playoff-rank.
The following are the upcoming matches and associated probabilities for Bethlehem and Harrisburg.
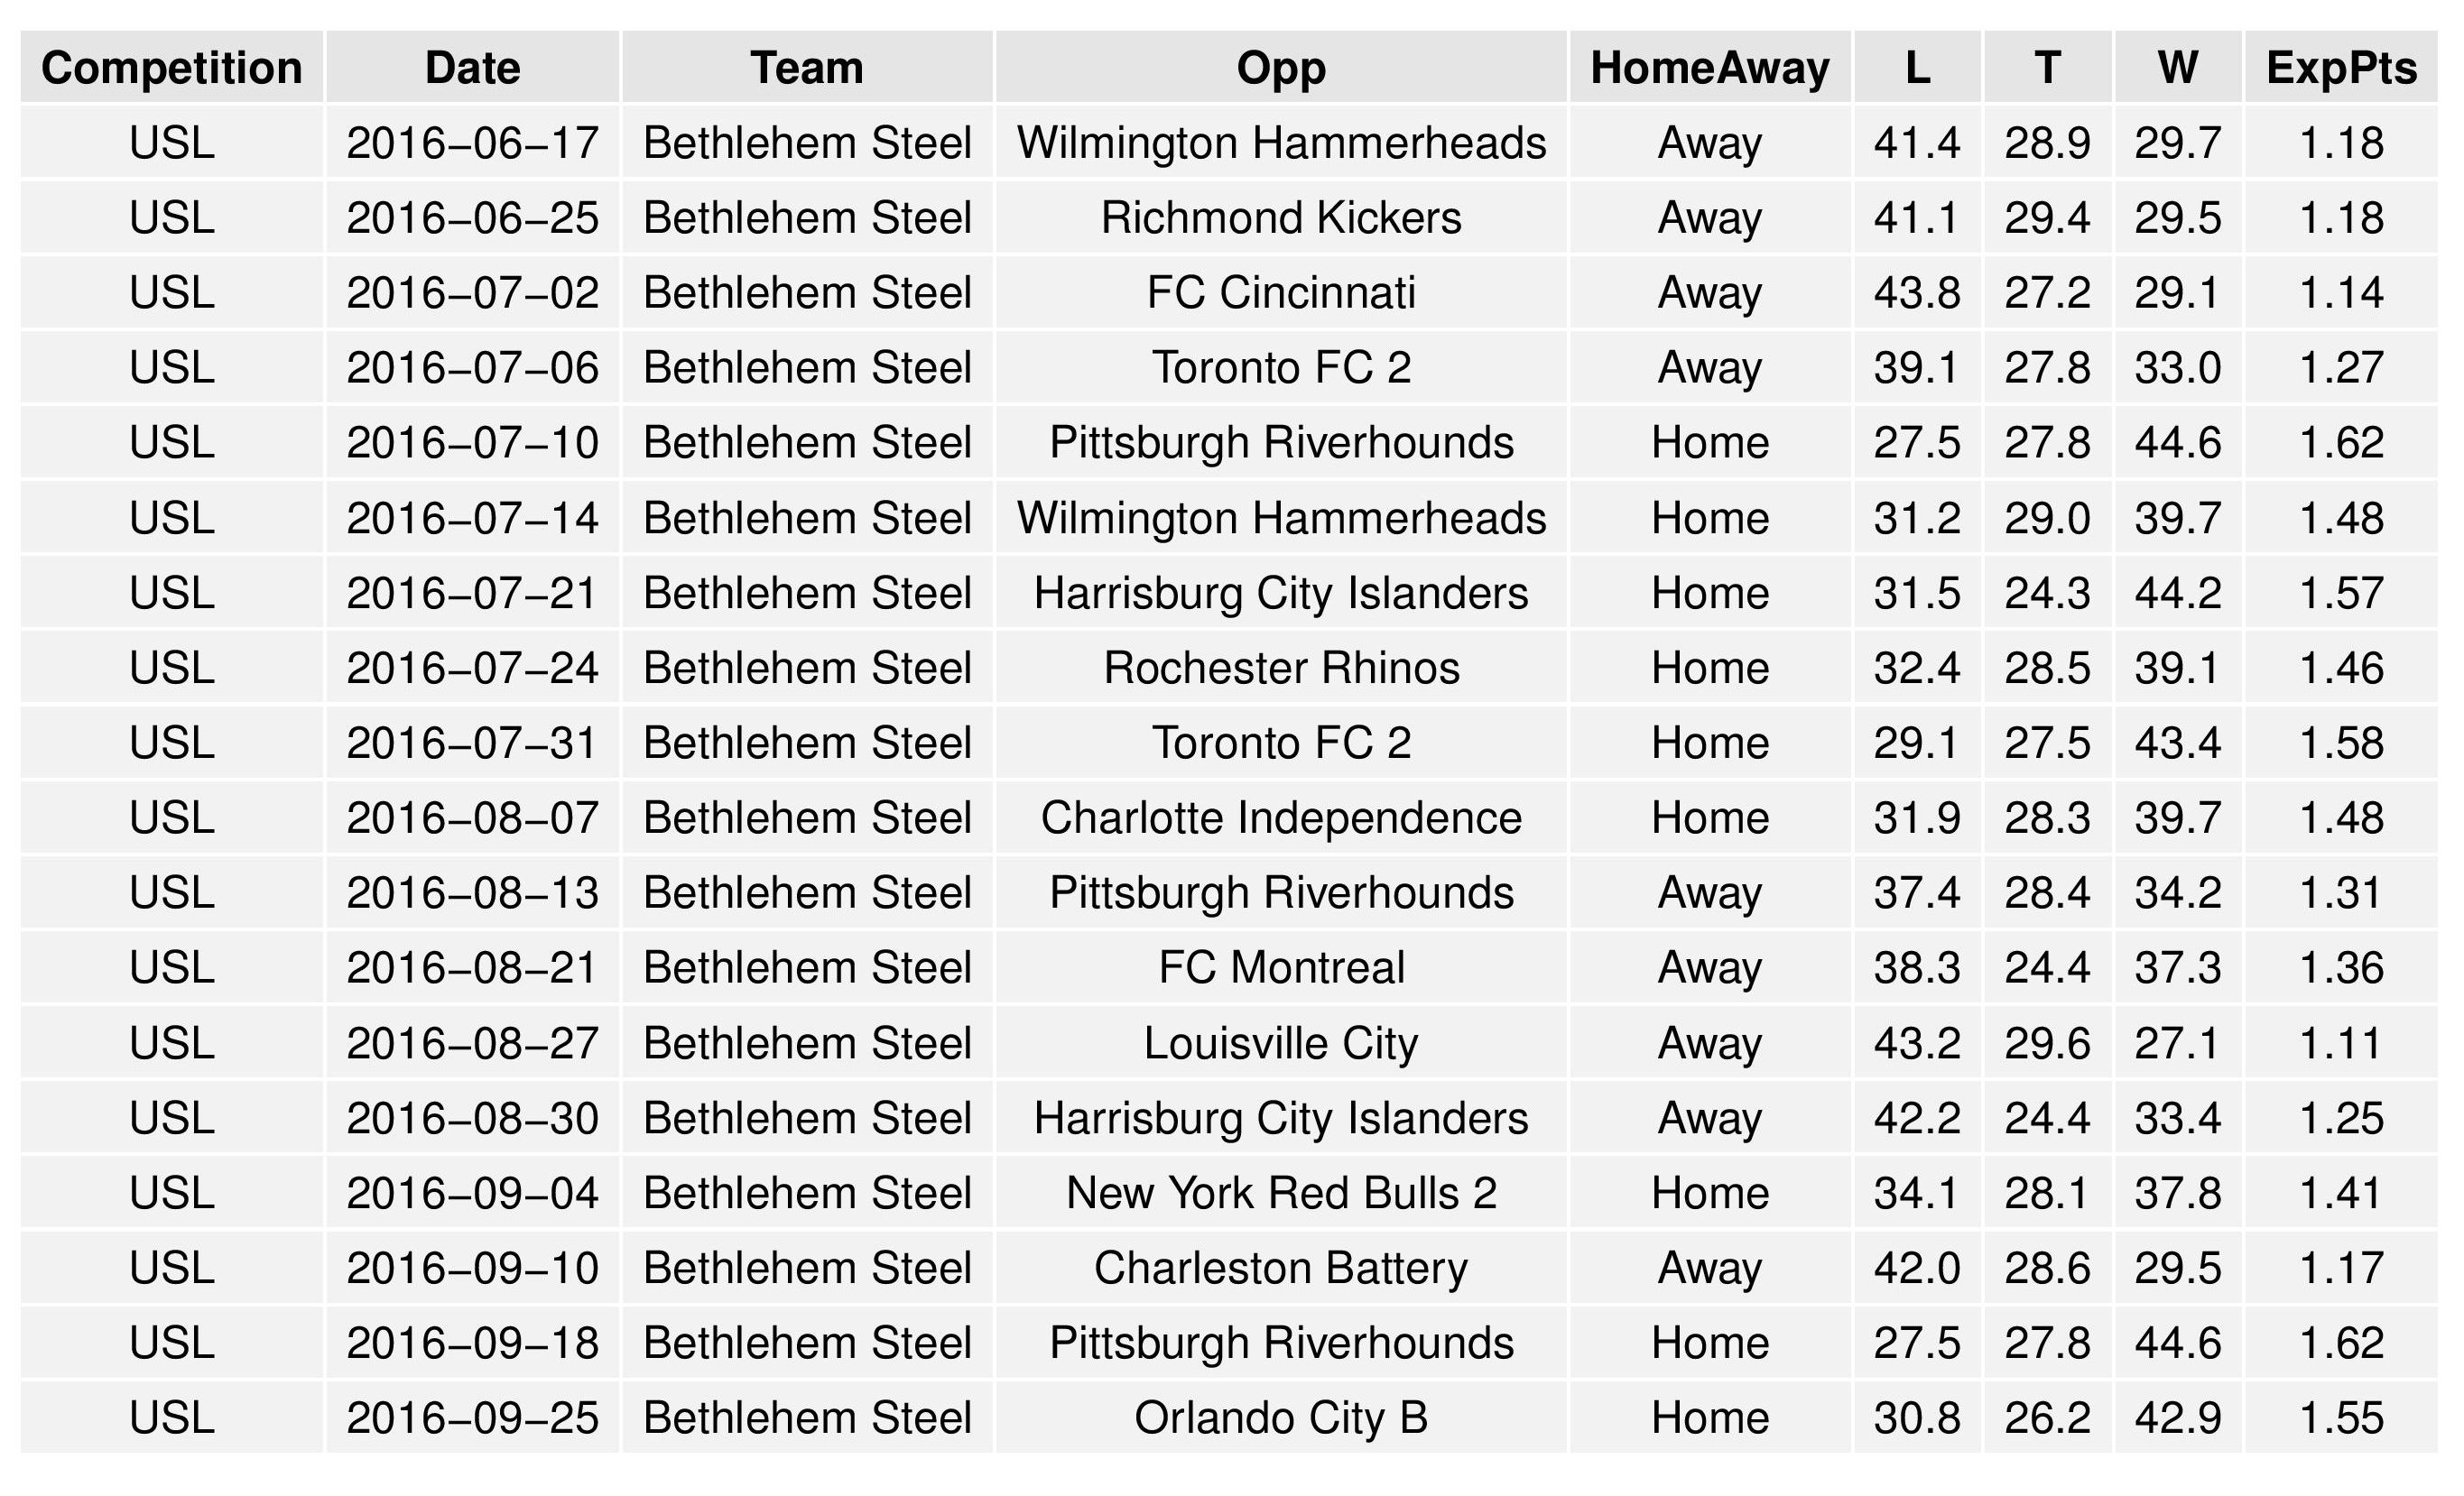
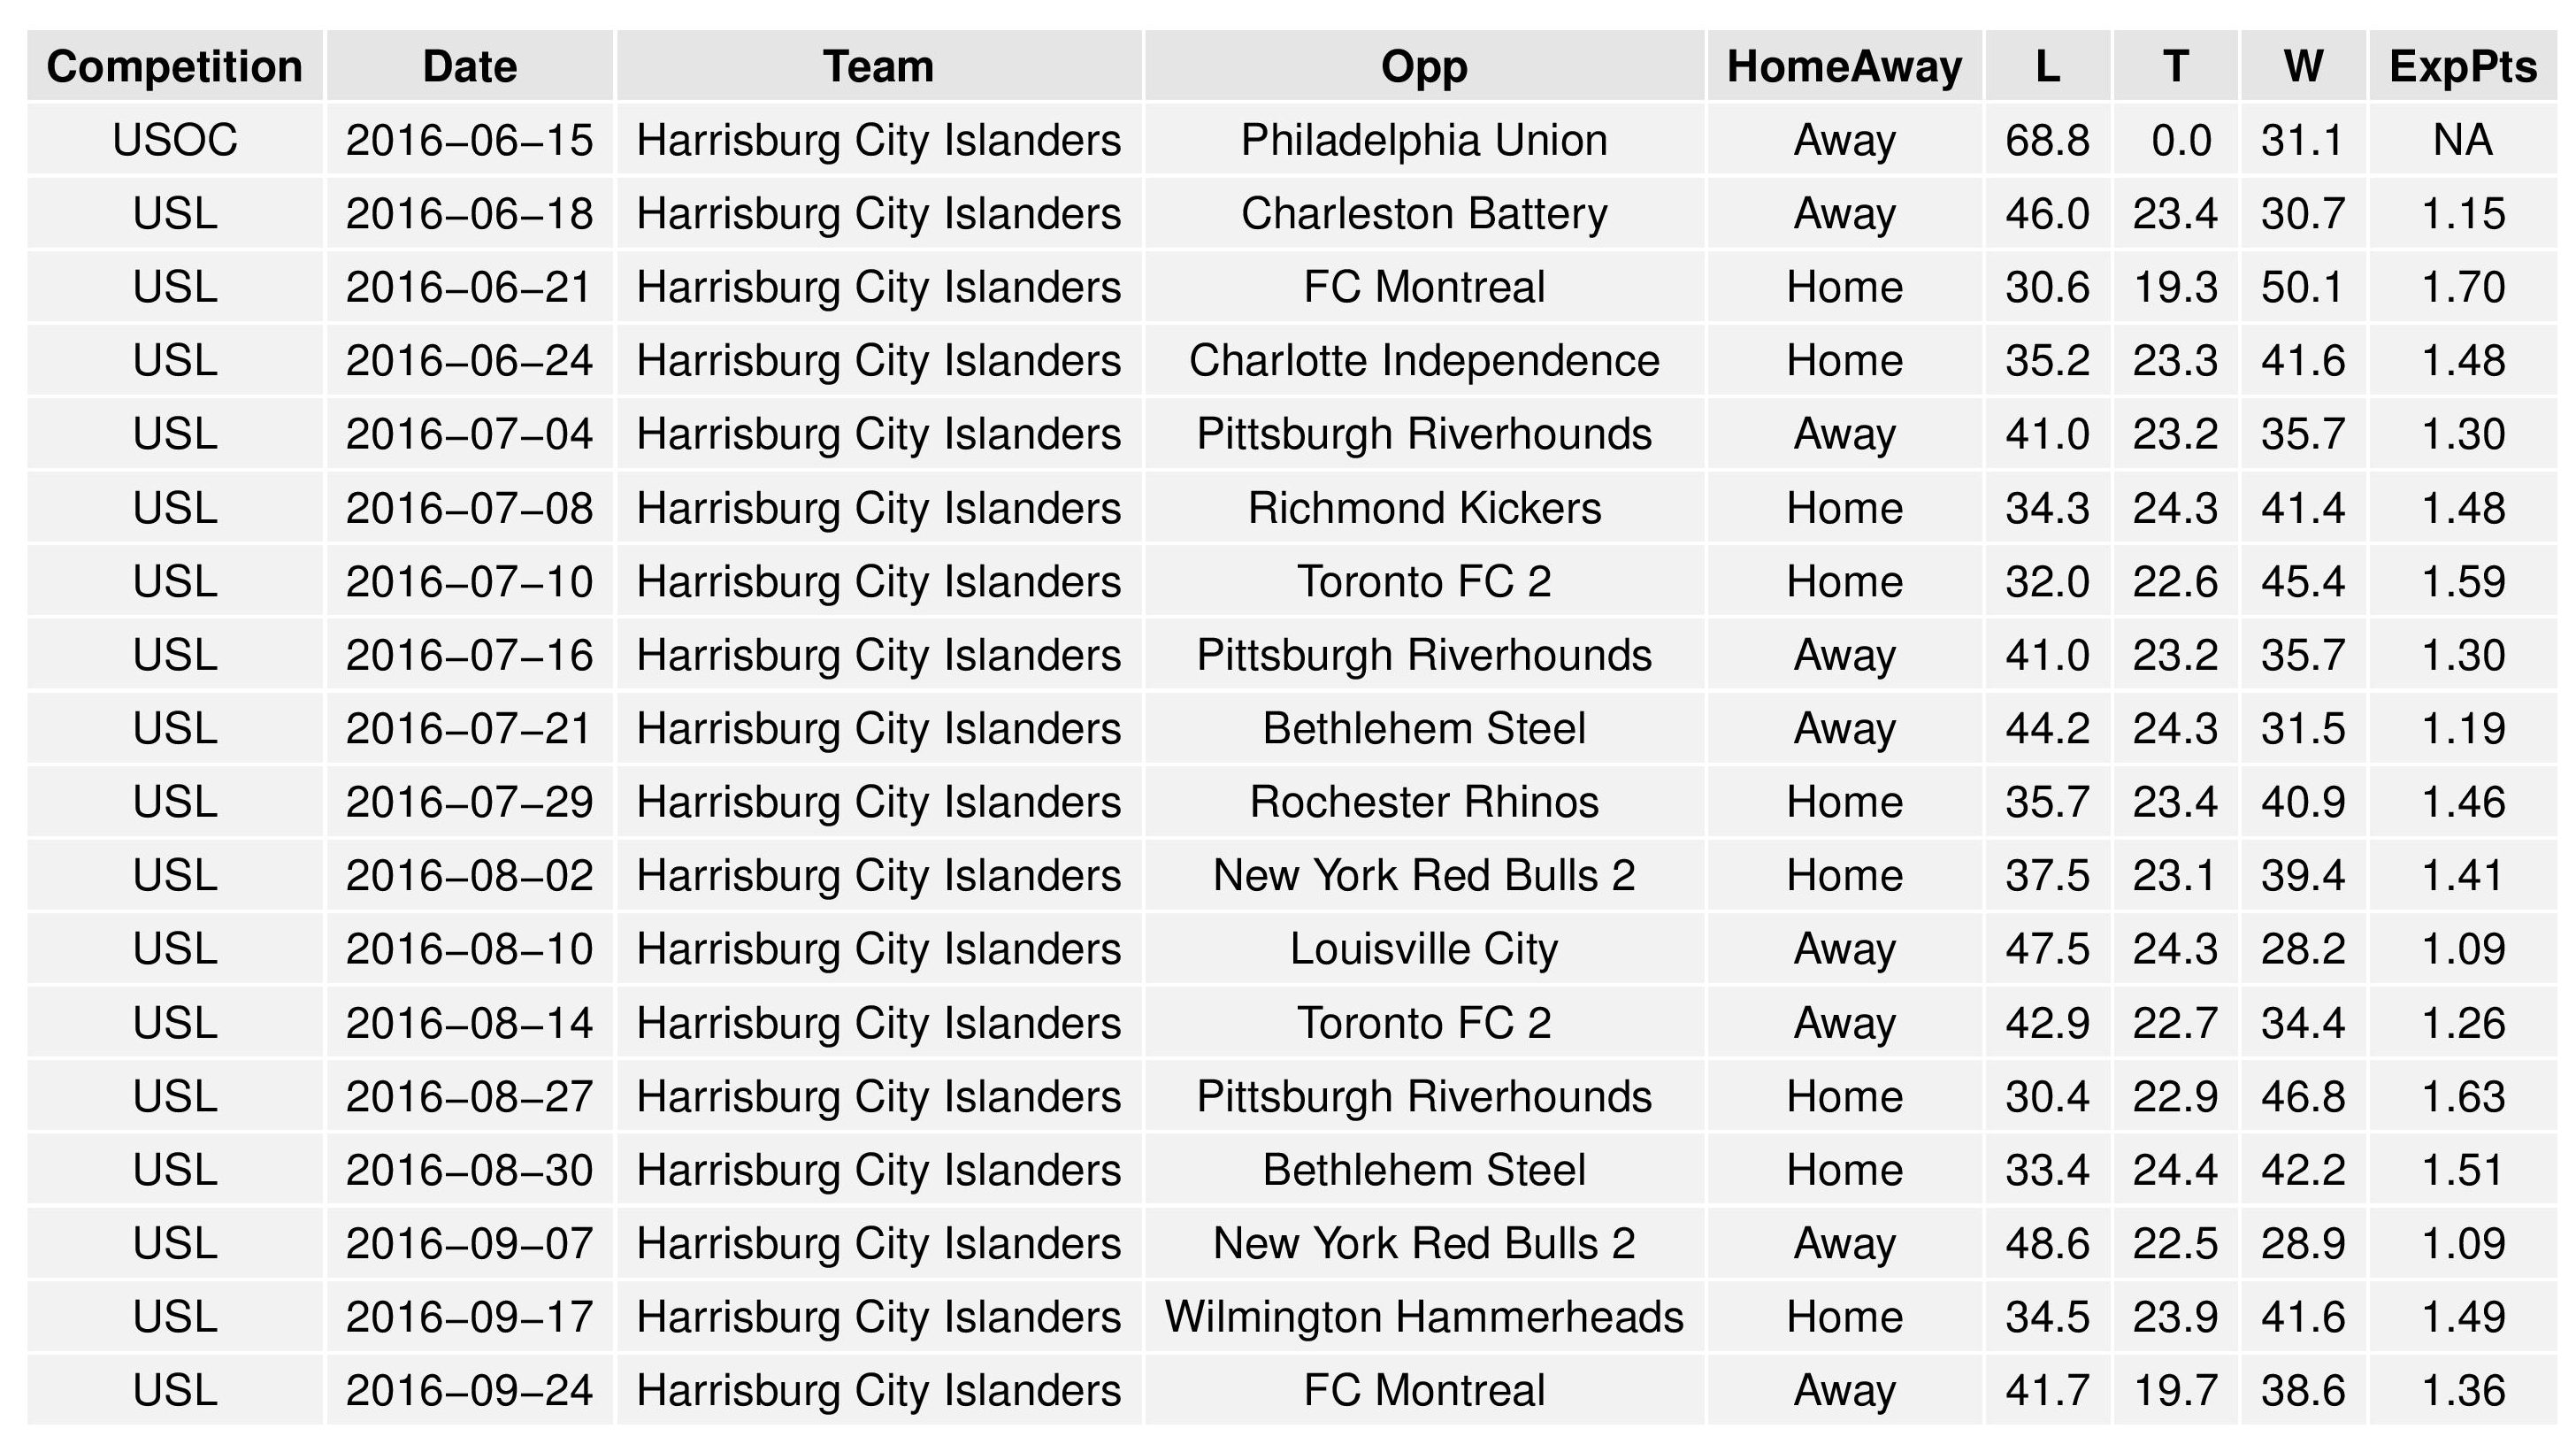
The following tables show the average simulation results. They are divided into two tables to present better to your screen.
Changes Over Time
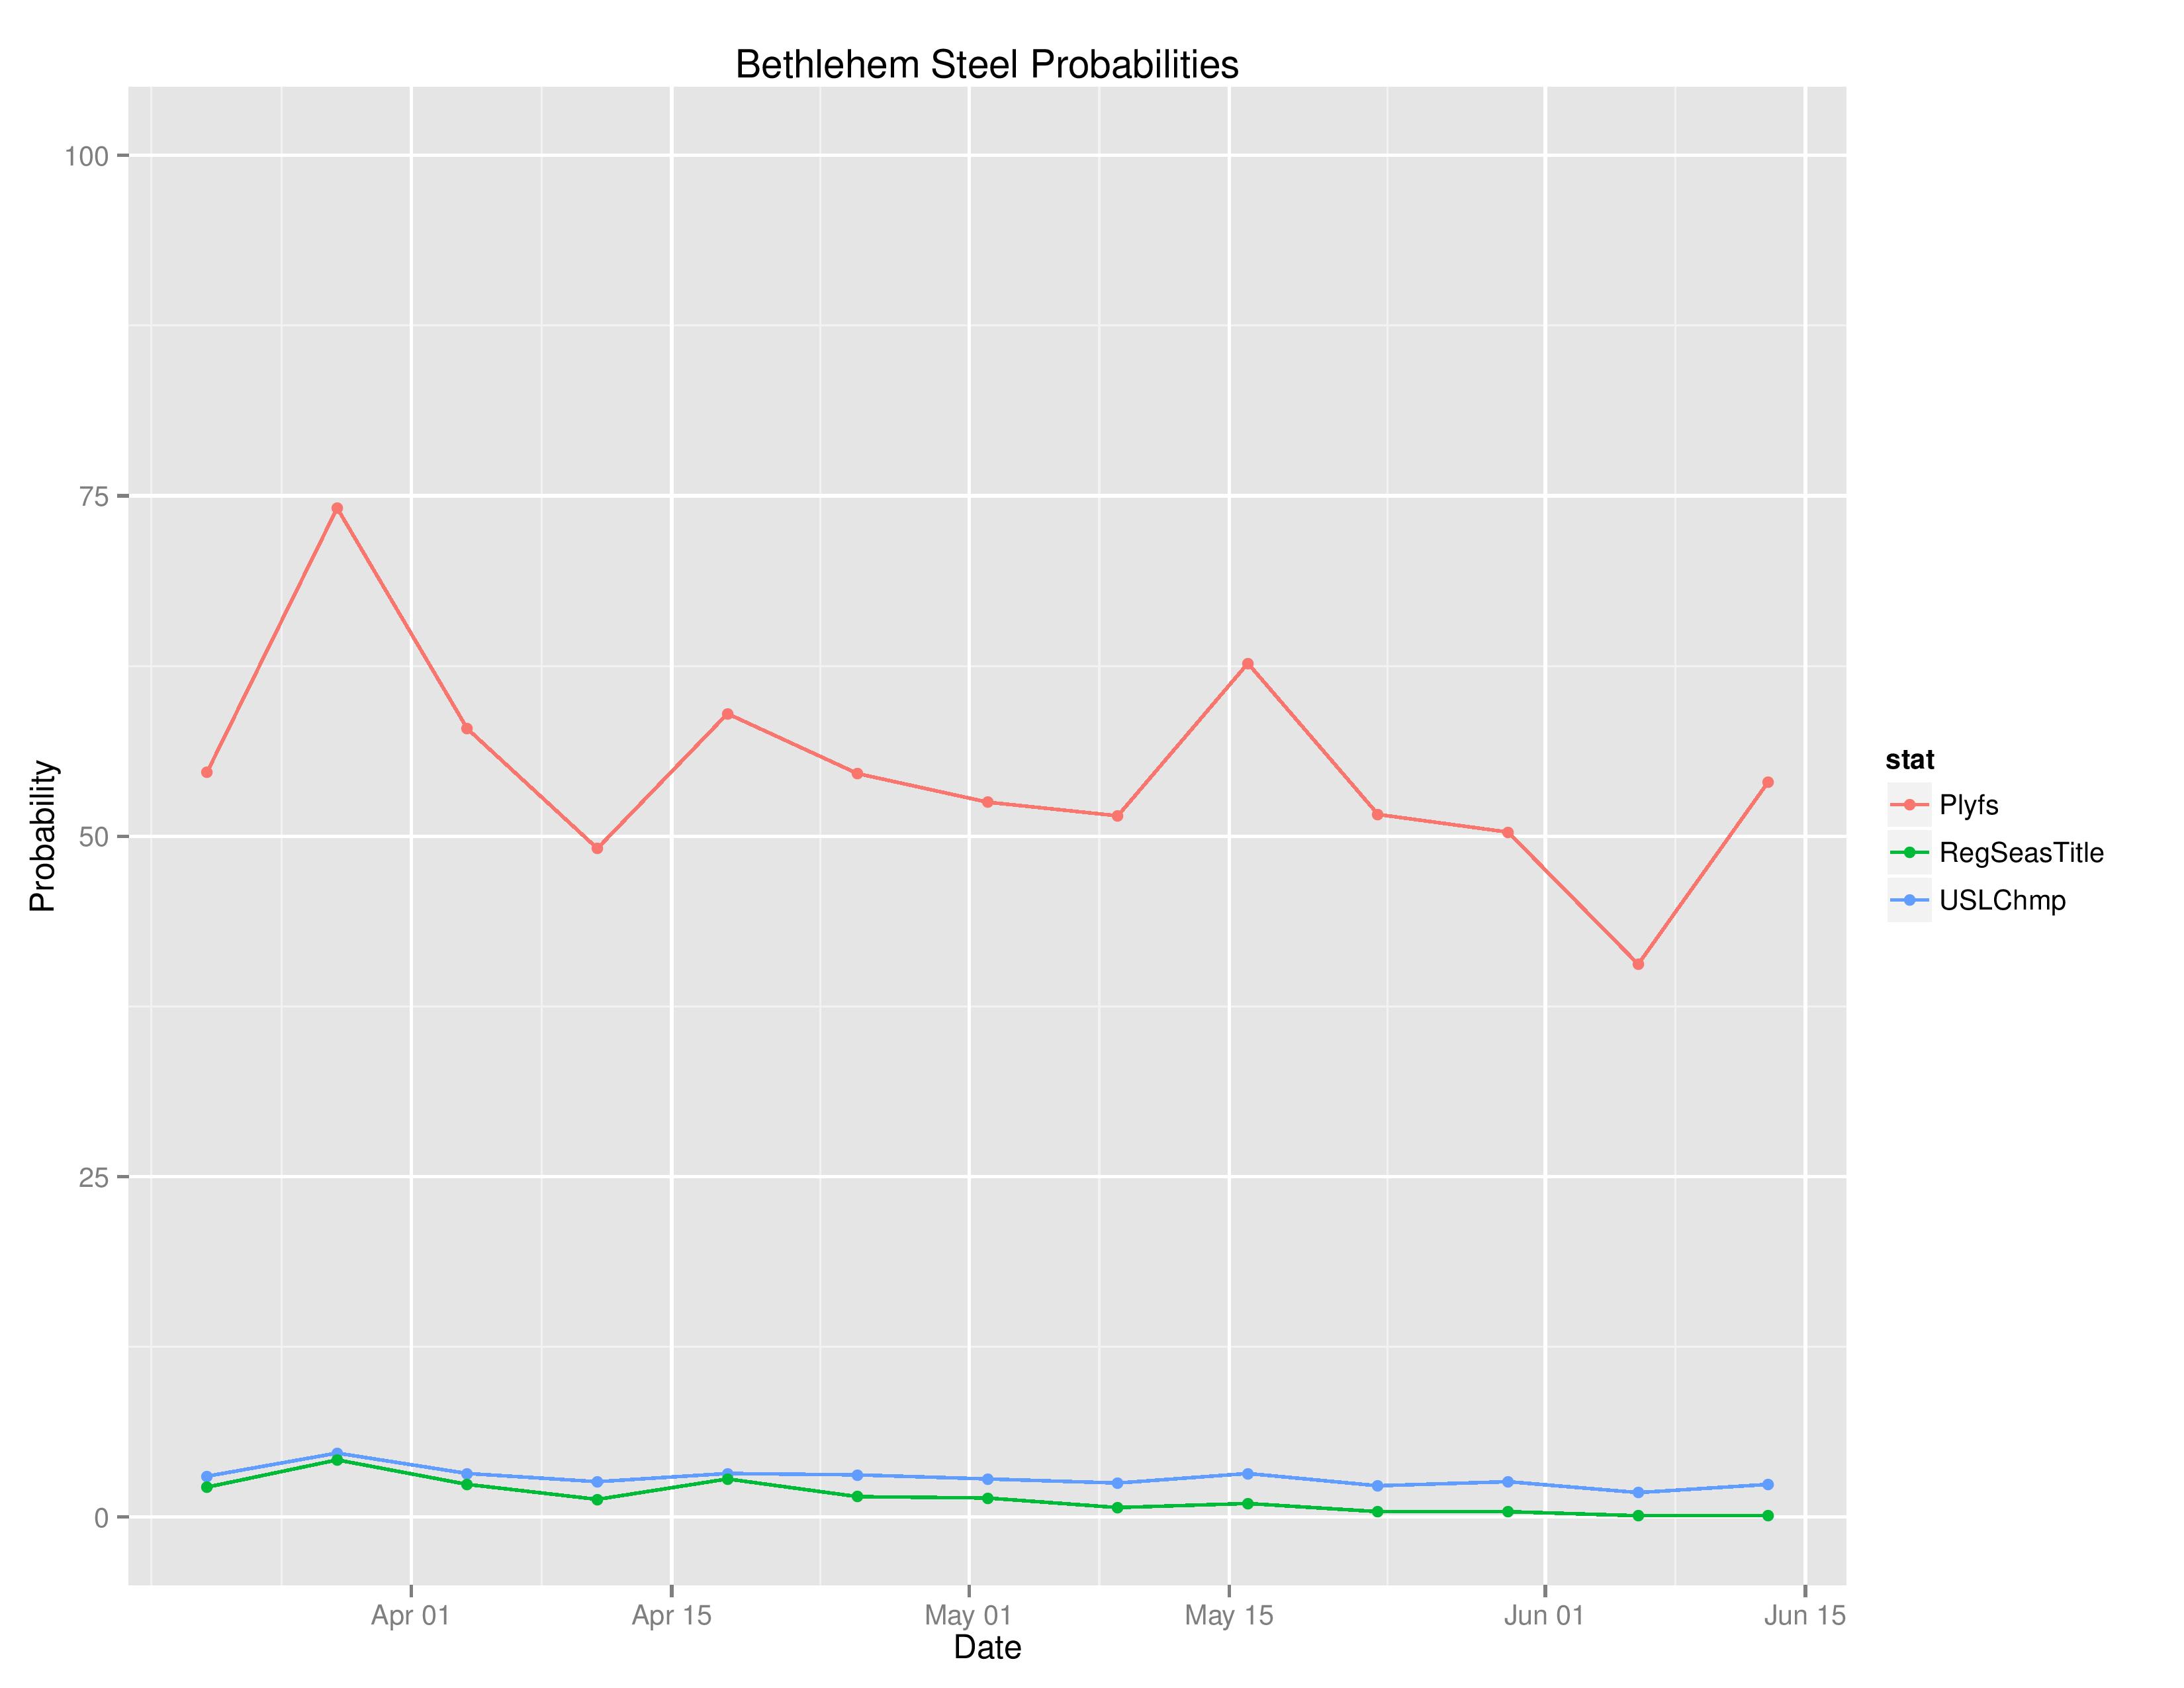
Above shows the probabilities of various outcomes for Bethlehem over the course of the season.
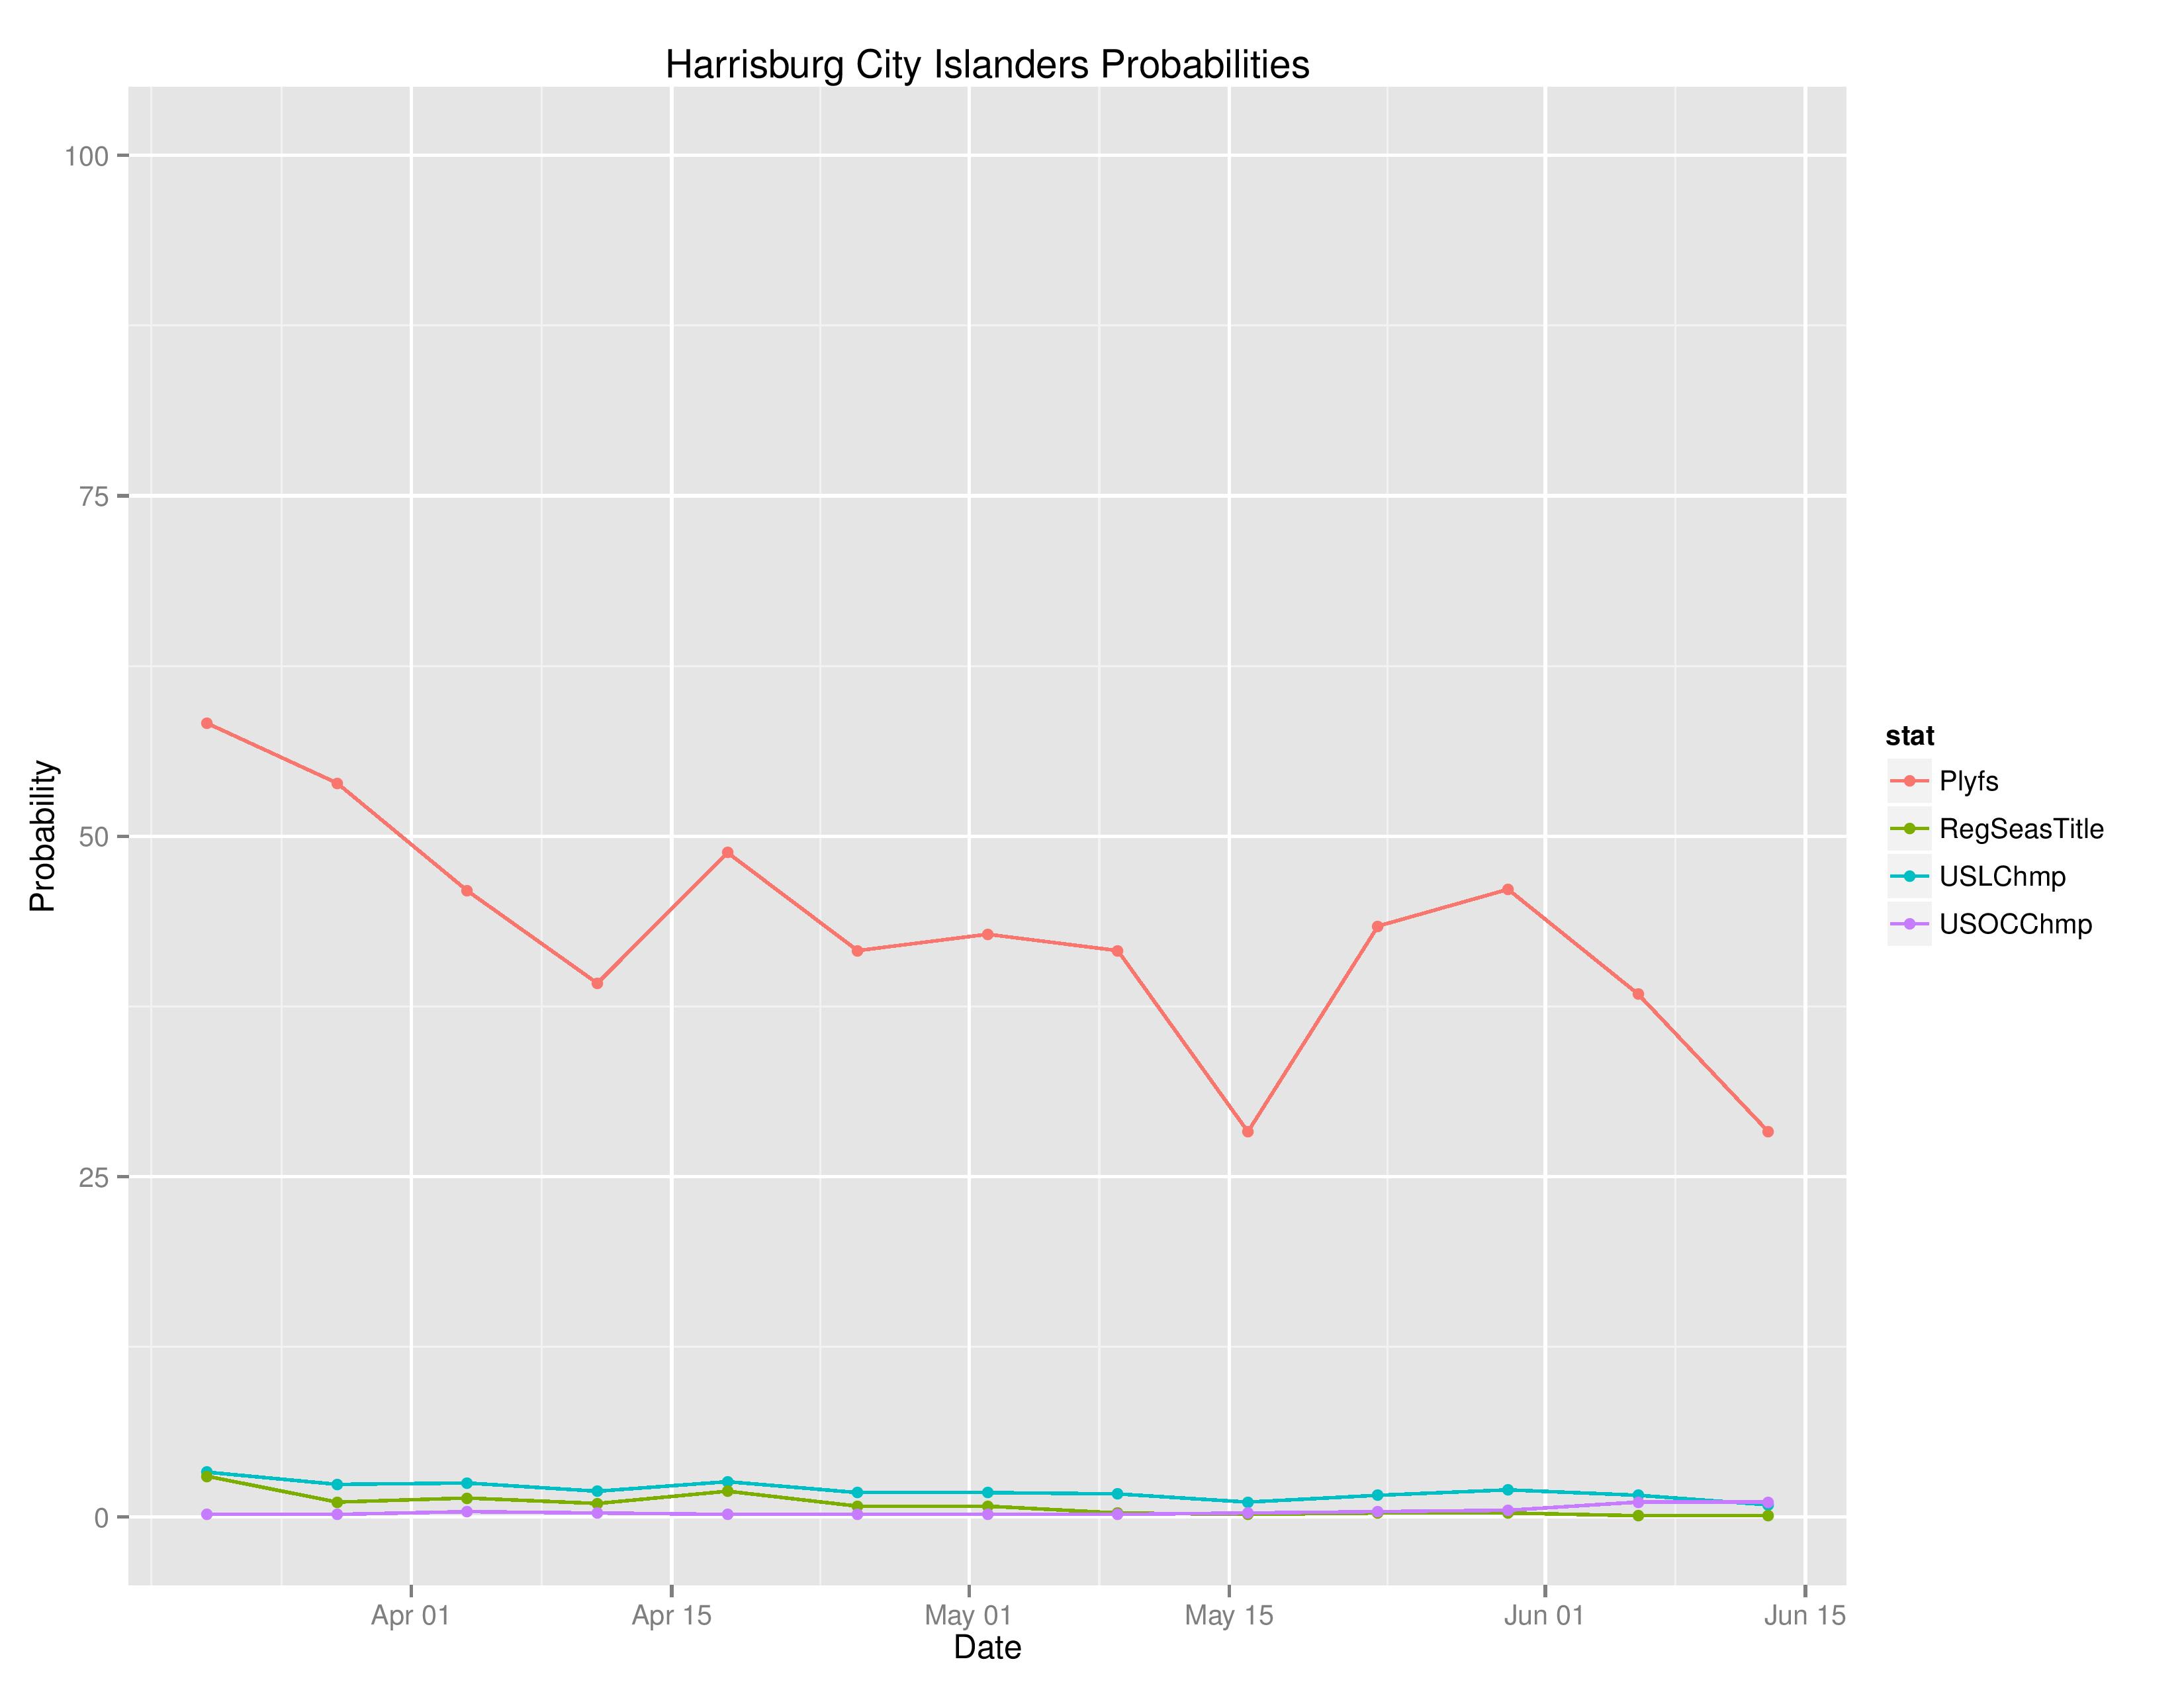
Above shows the probabilities of various outcomes for Harrisburg over the course of the season.
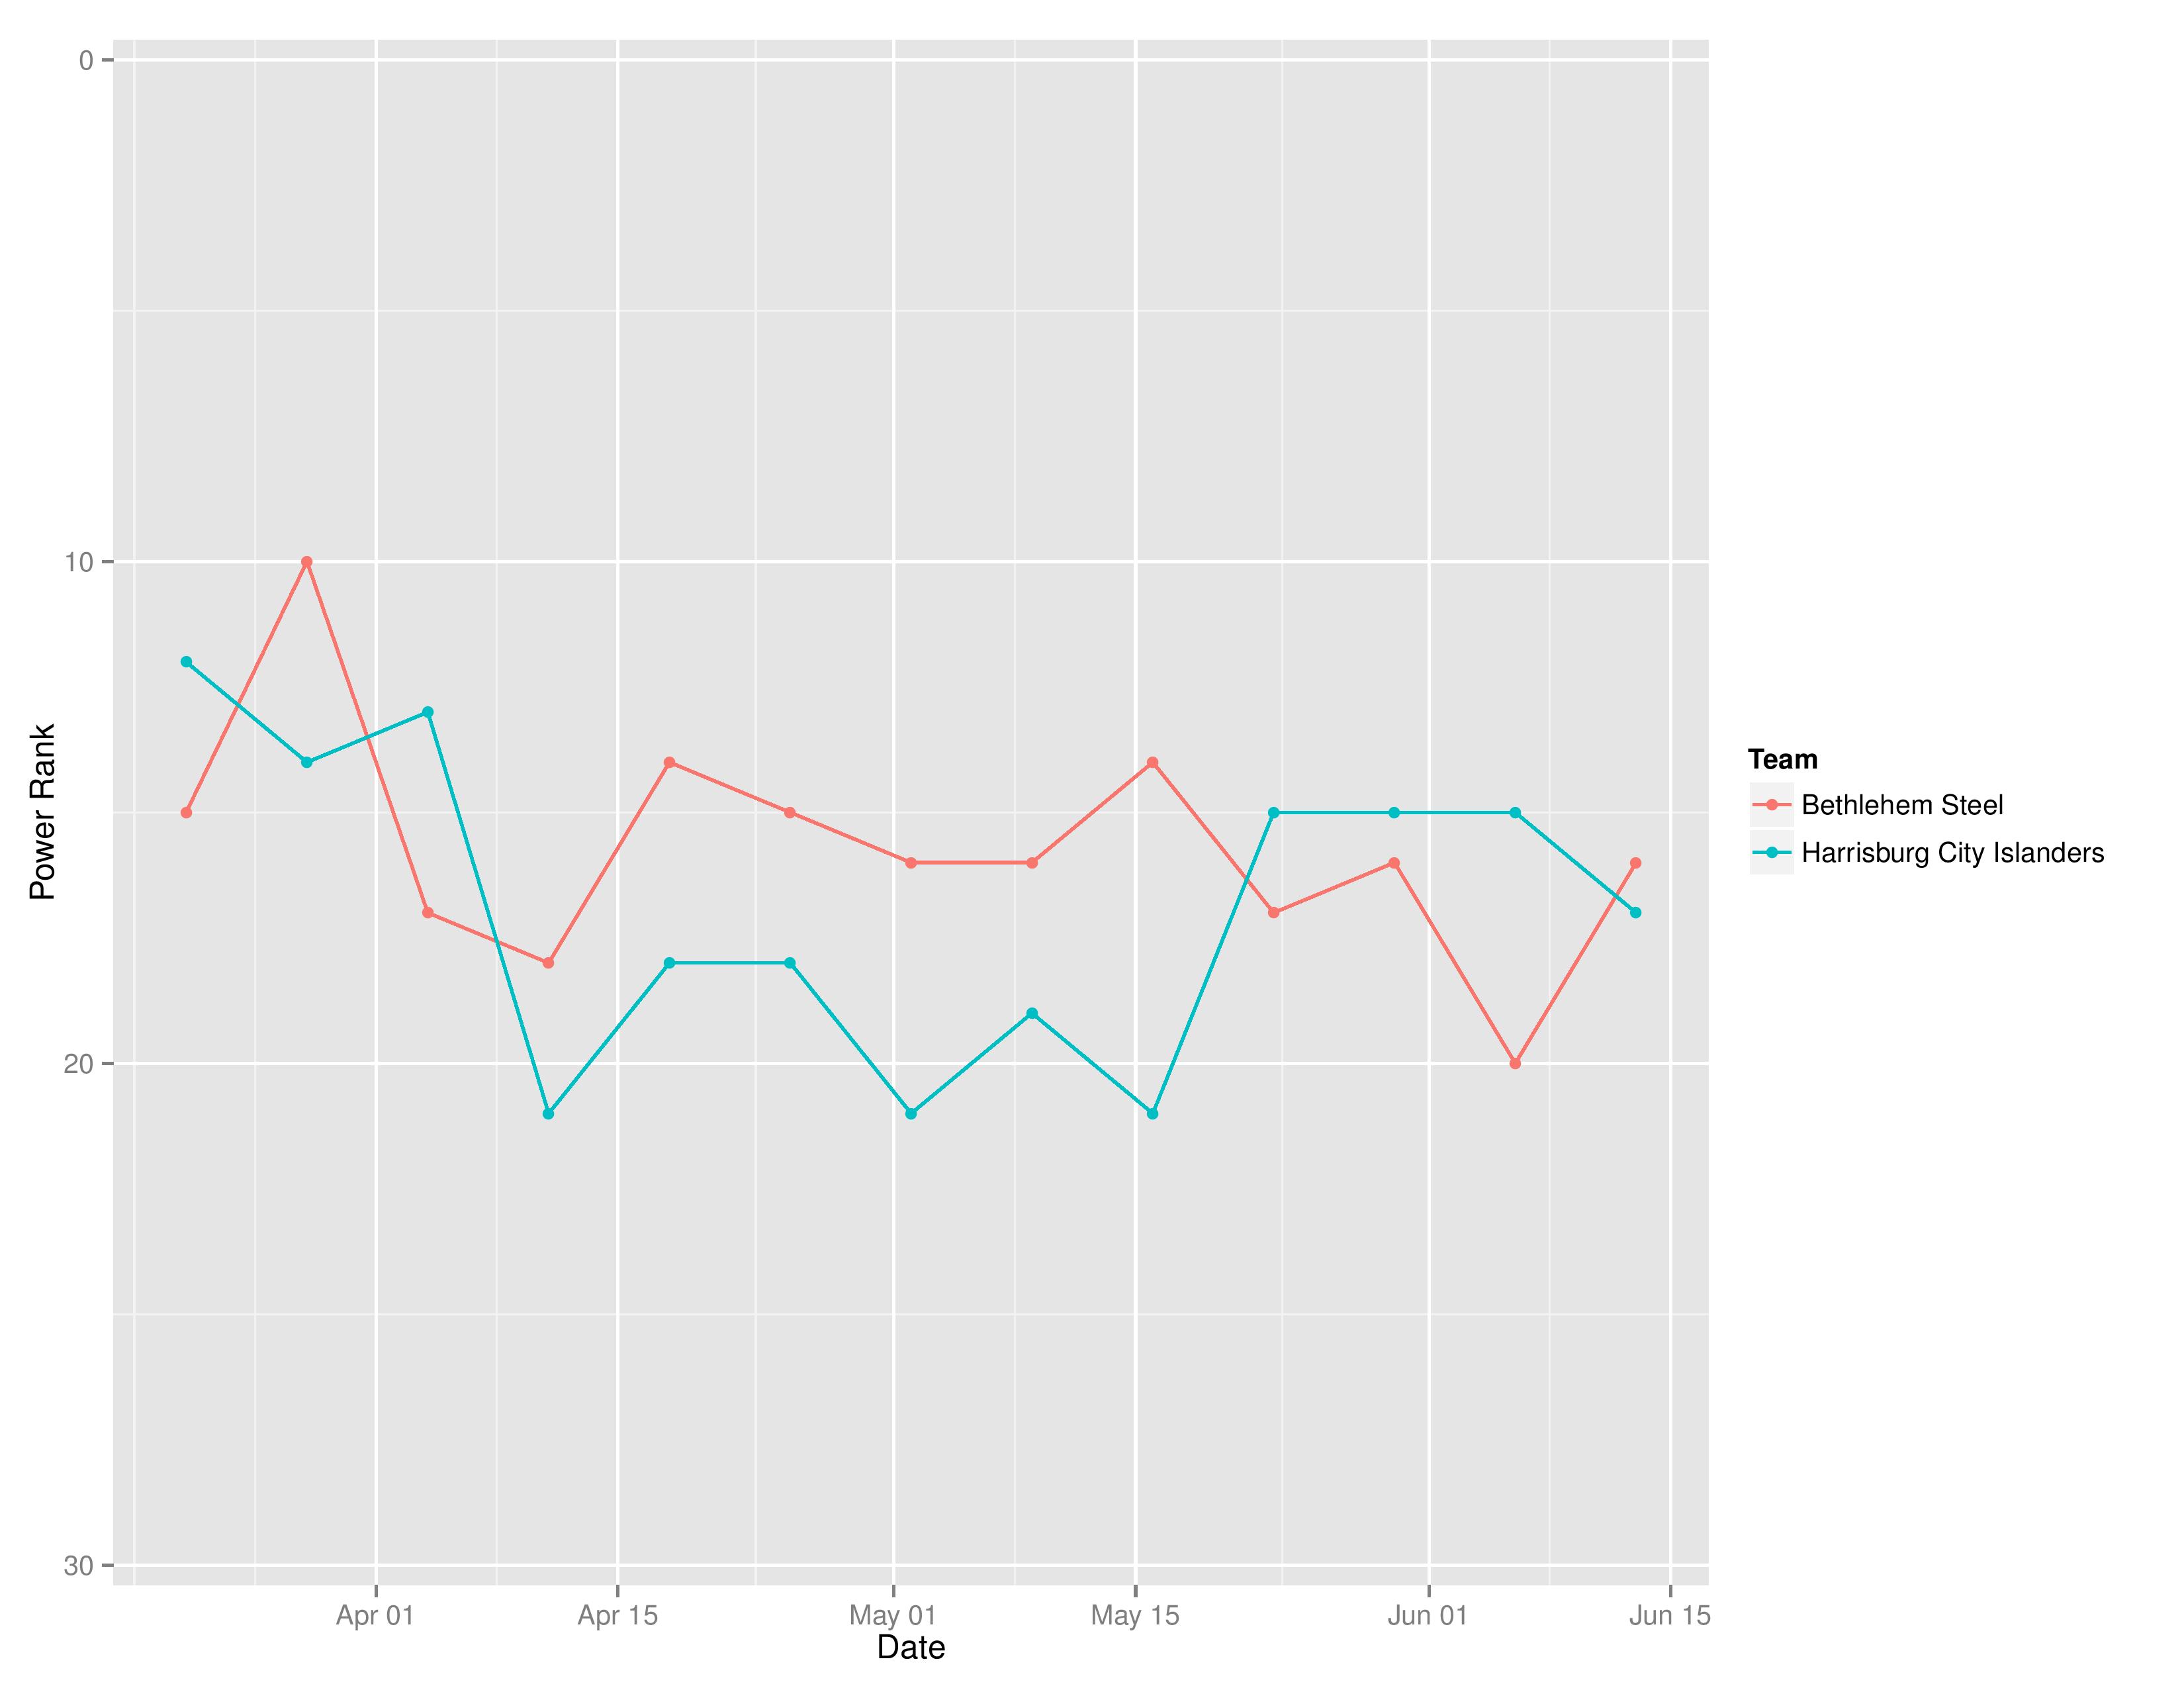
Above shows the evolution of SEBA’s power rankings for Bethlehem Steel FC and the Harrisburg City Islanders.
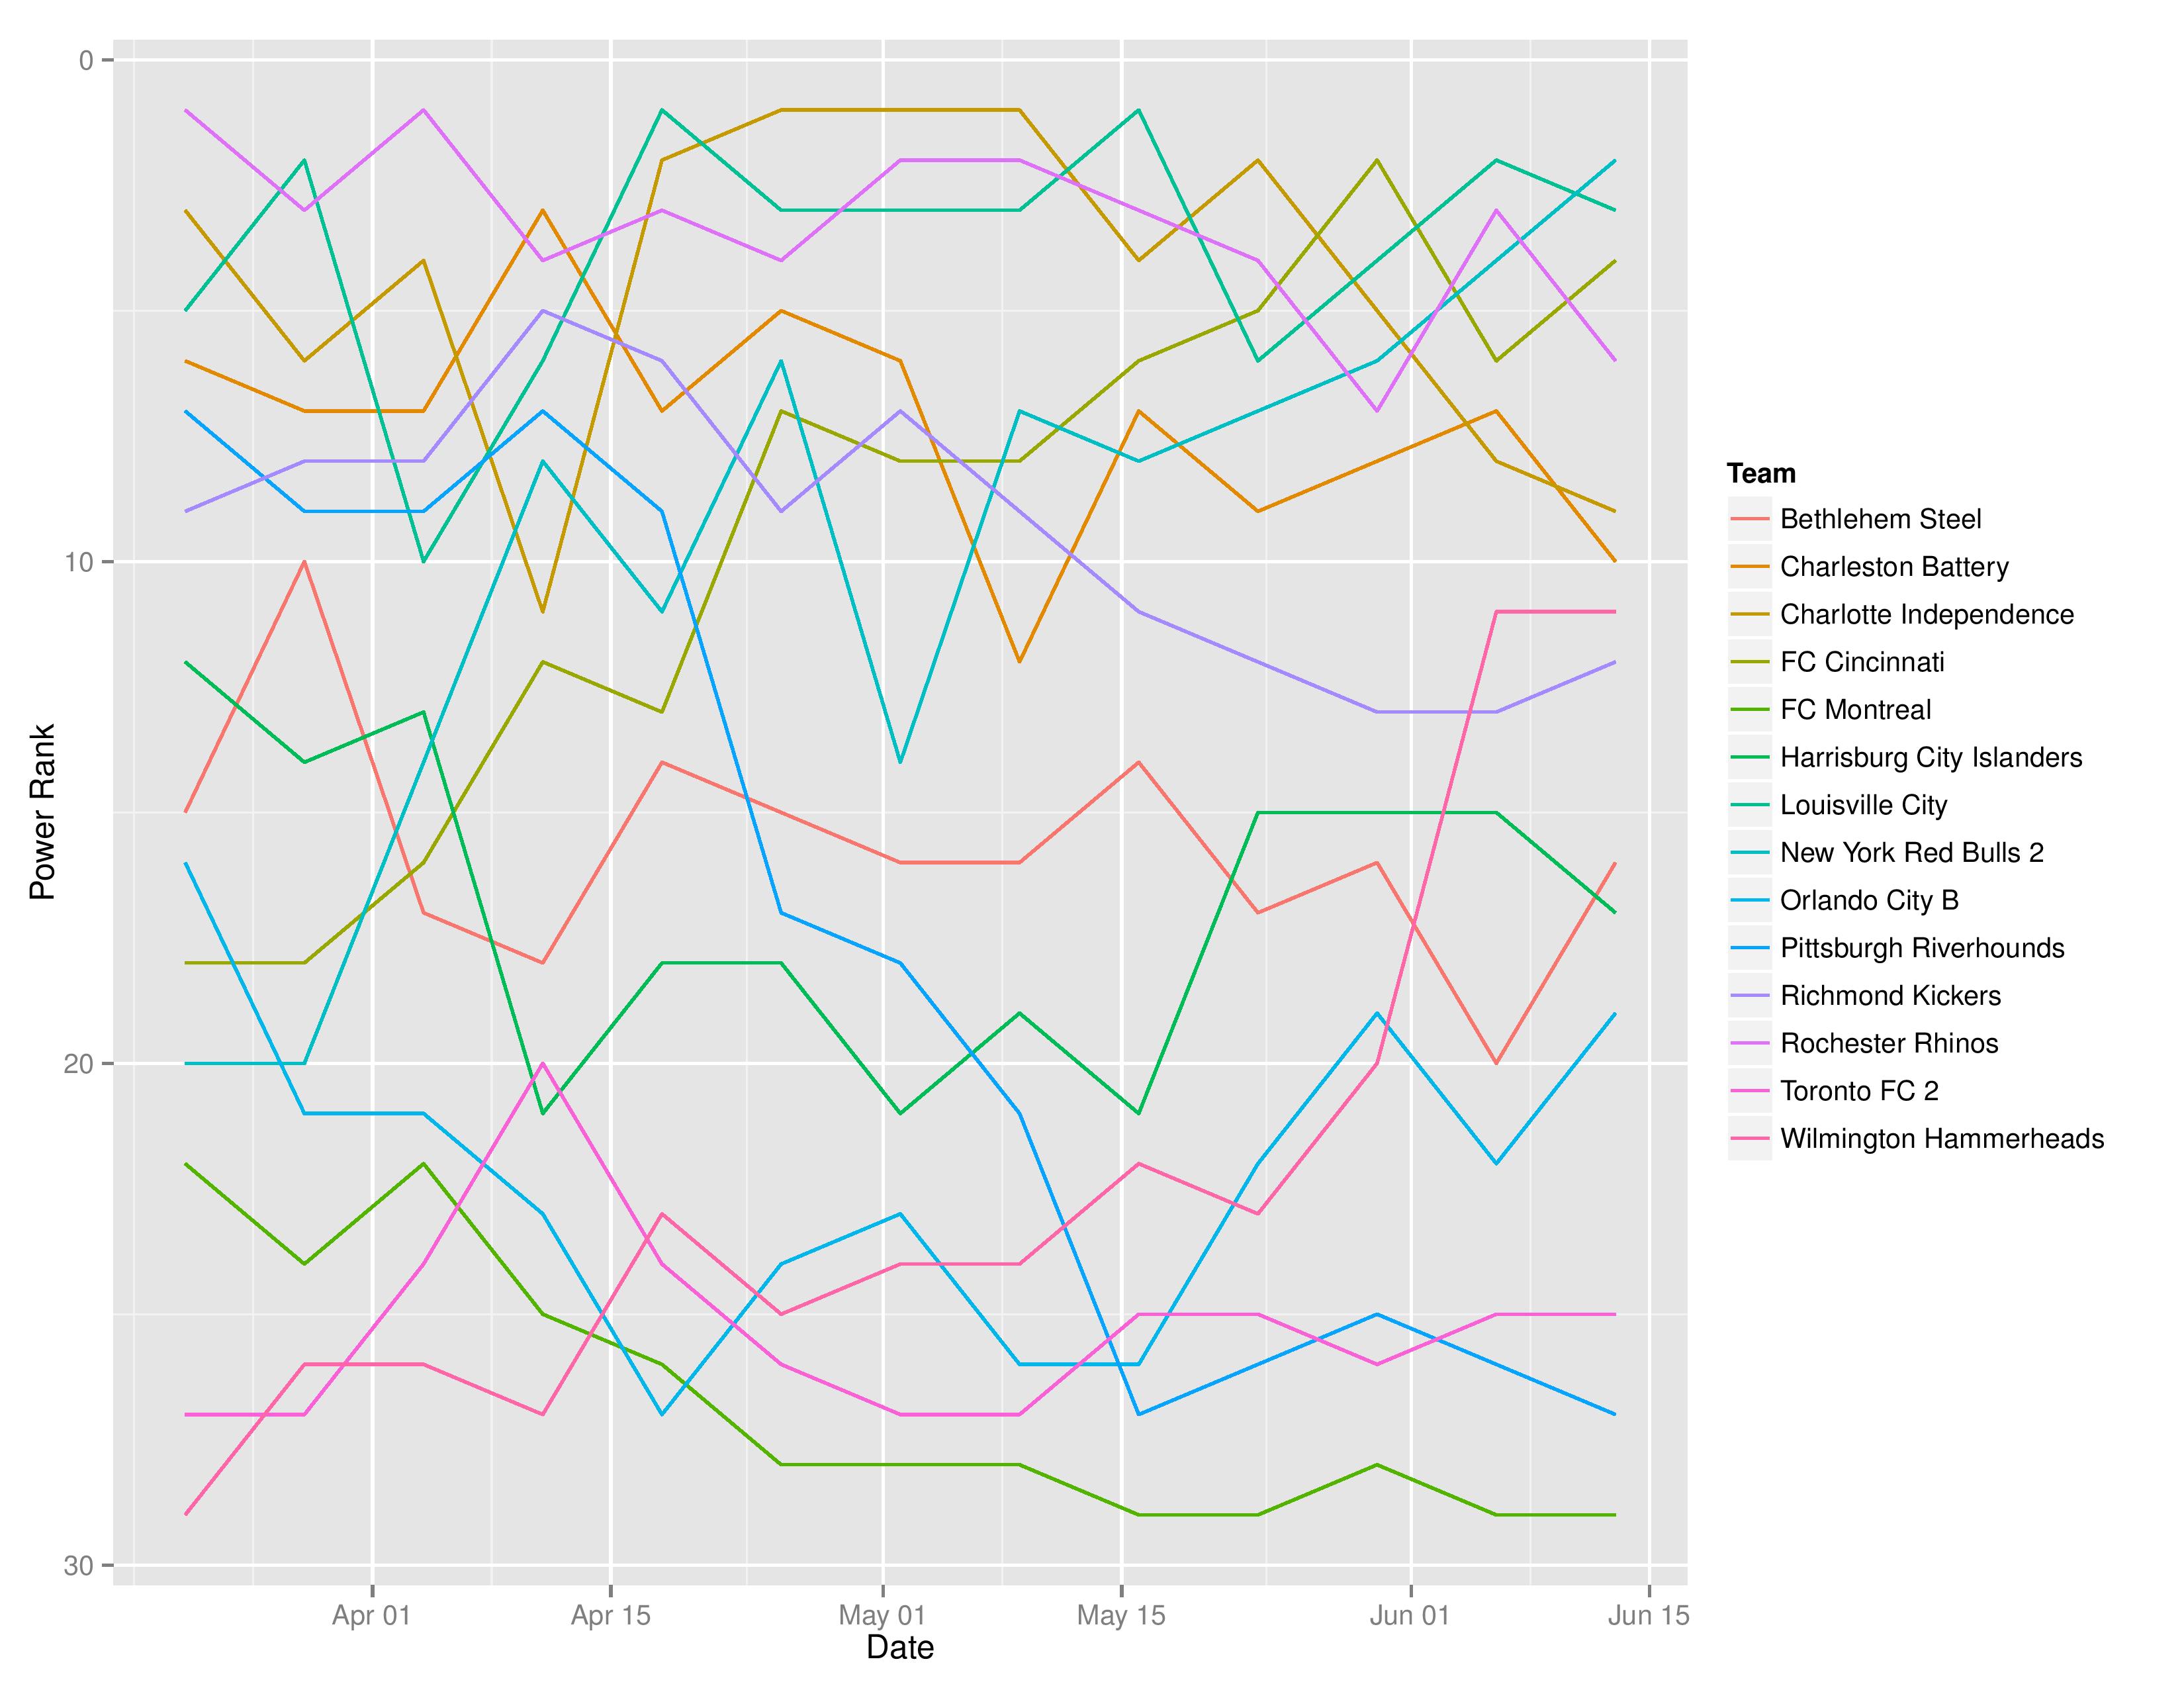
Again, let me know in the comments how readable/valuable this is to show the Eastern Conference of the USL.
NWSL Projections
While Philadelphia does not currently have a team, I do very much hope that the league expands to Philadelphia as WPS did before it fell apart. I’ve gone to some Washington Spirit games and enjoyed myself very much (except for having to root for a Washington team).
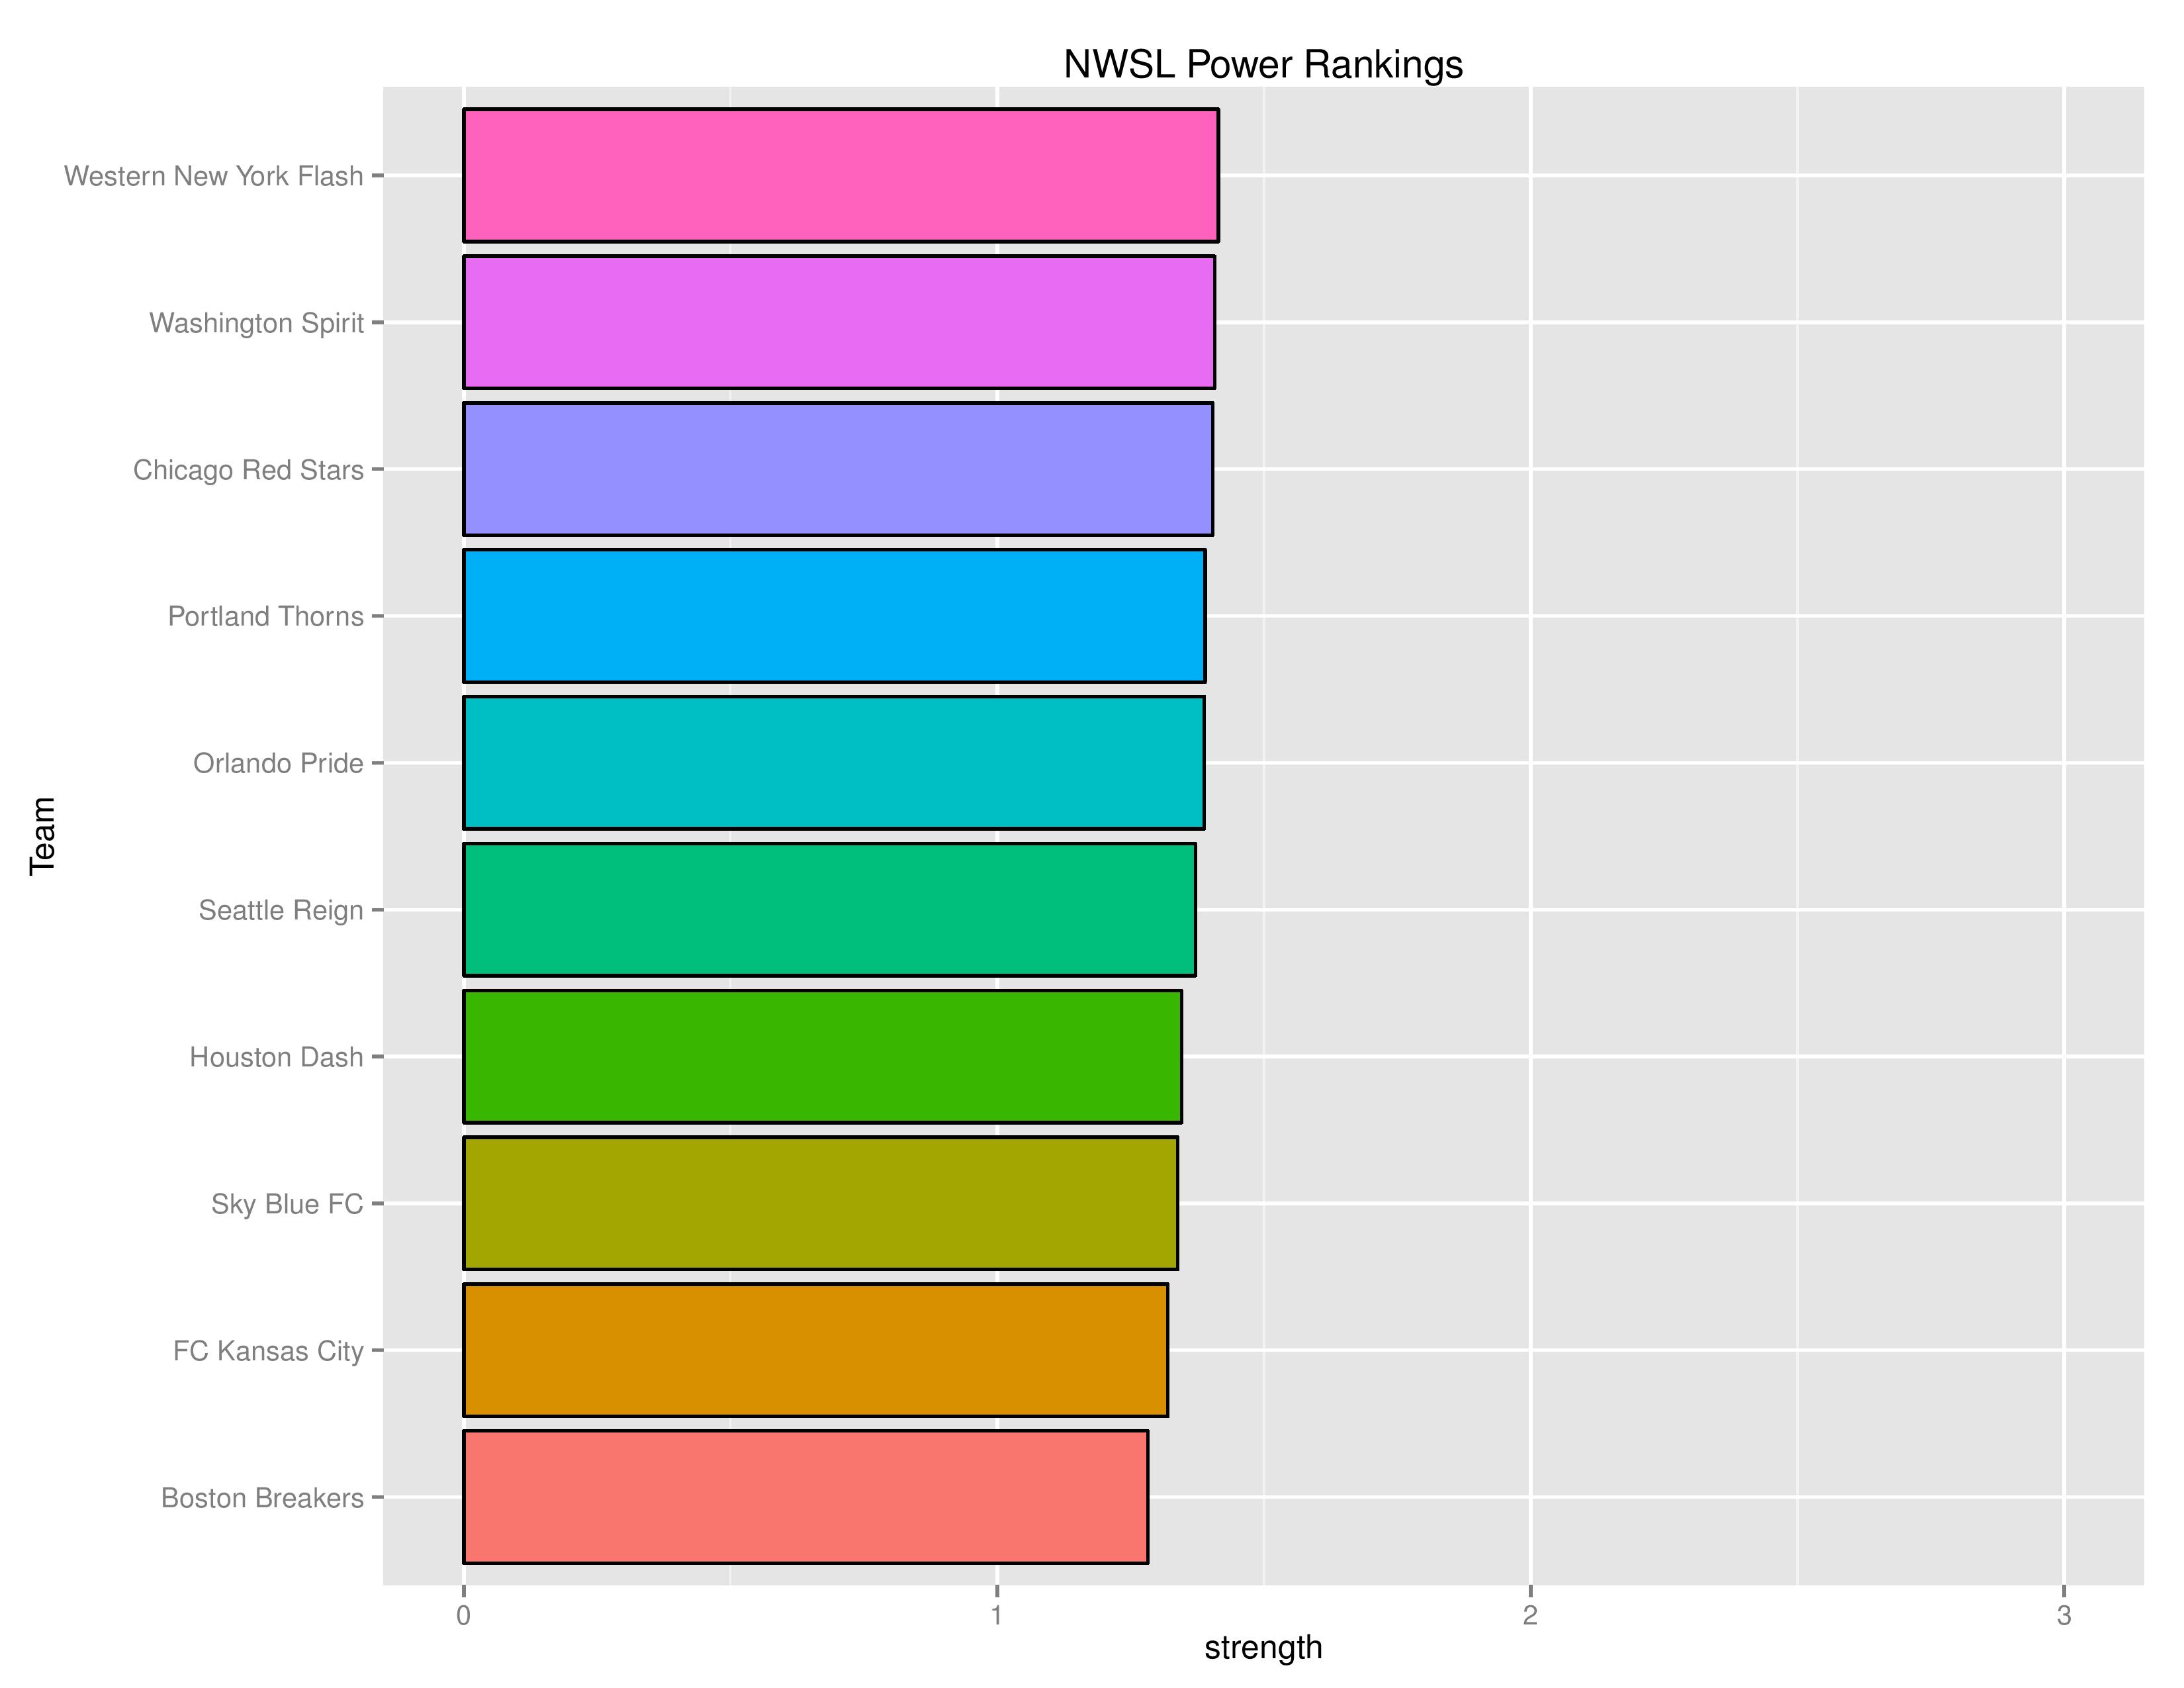
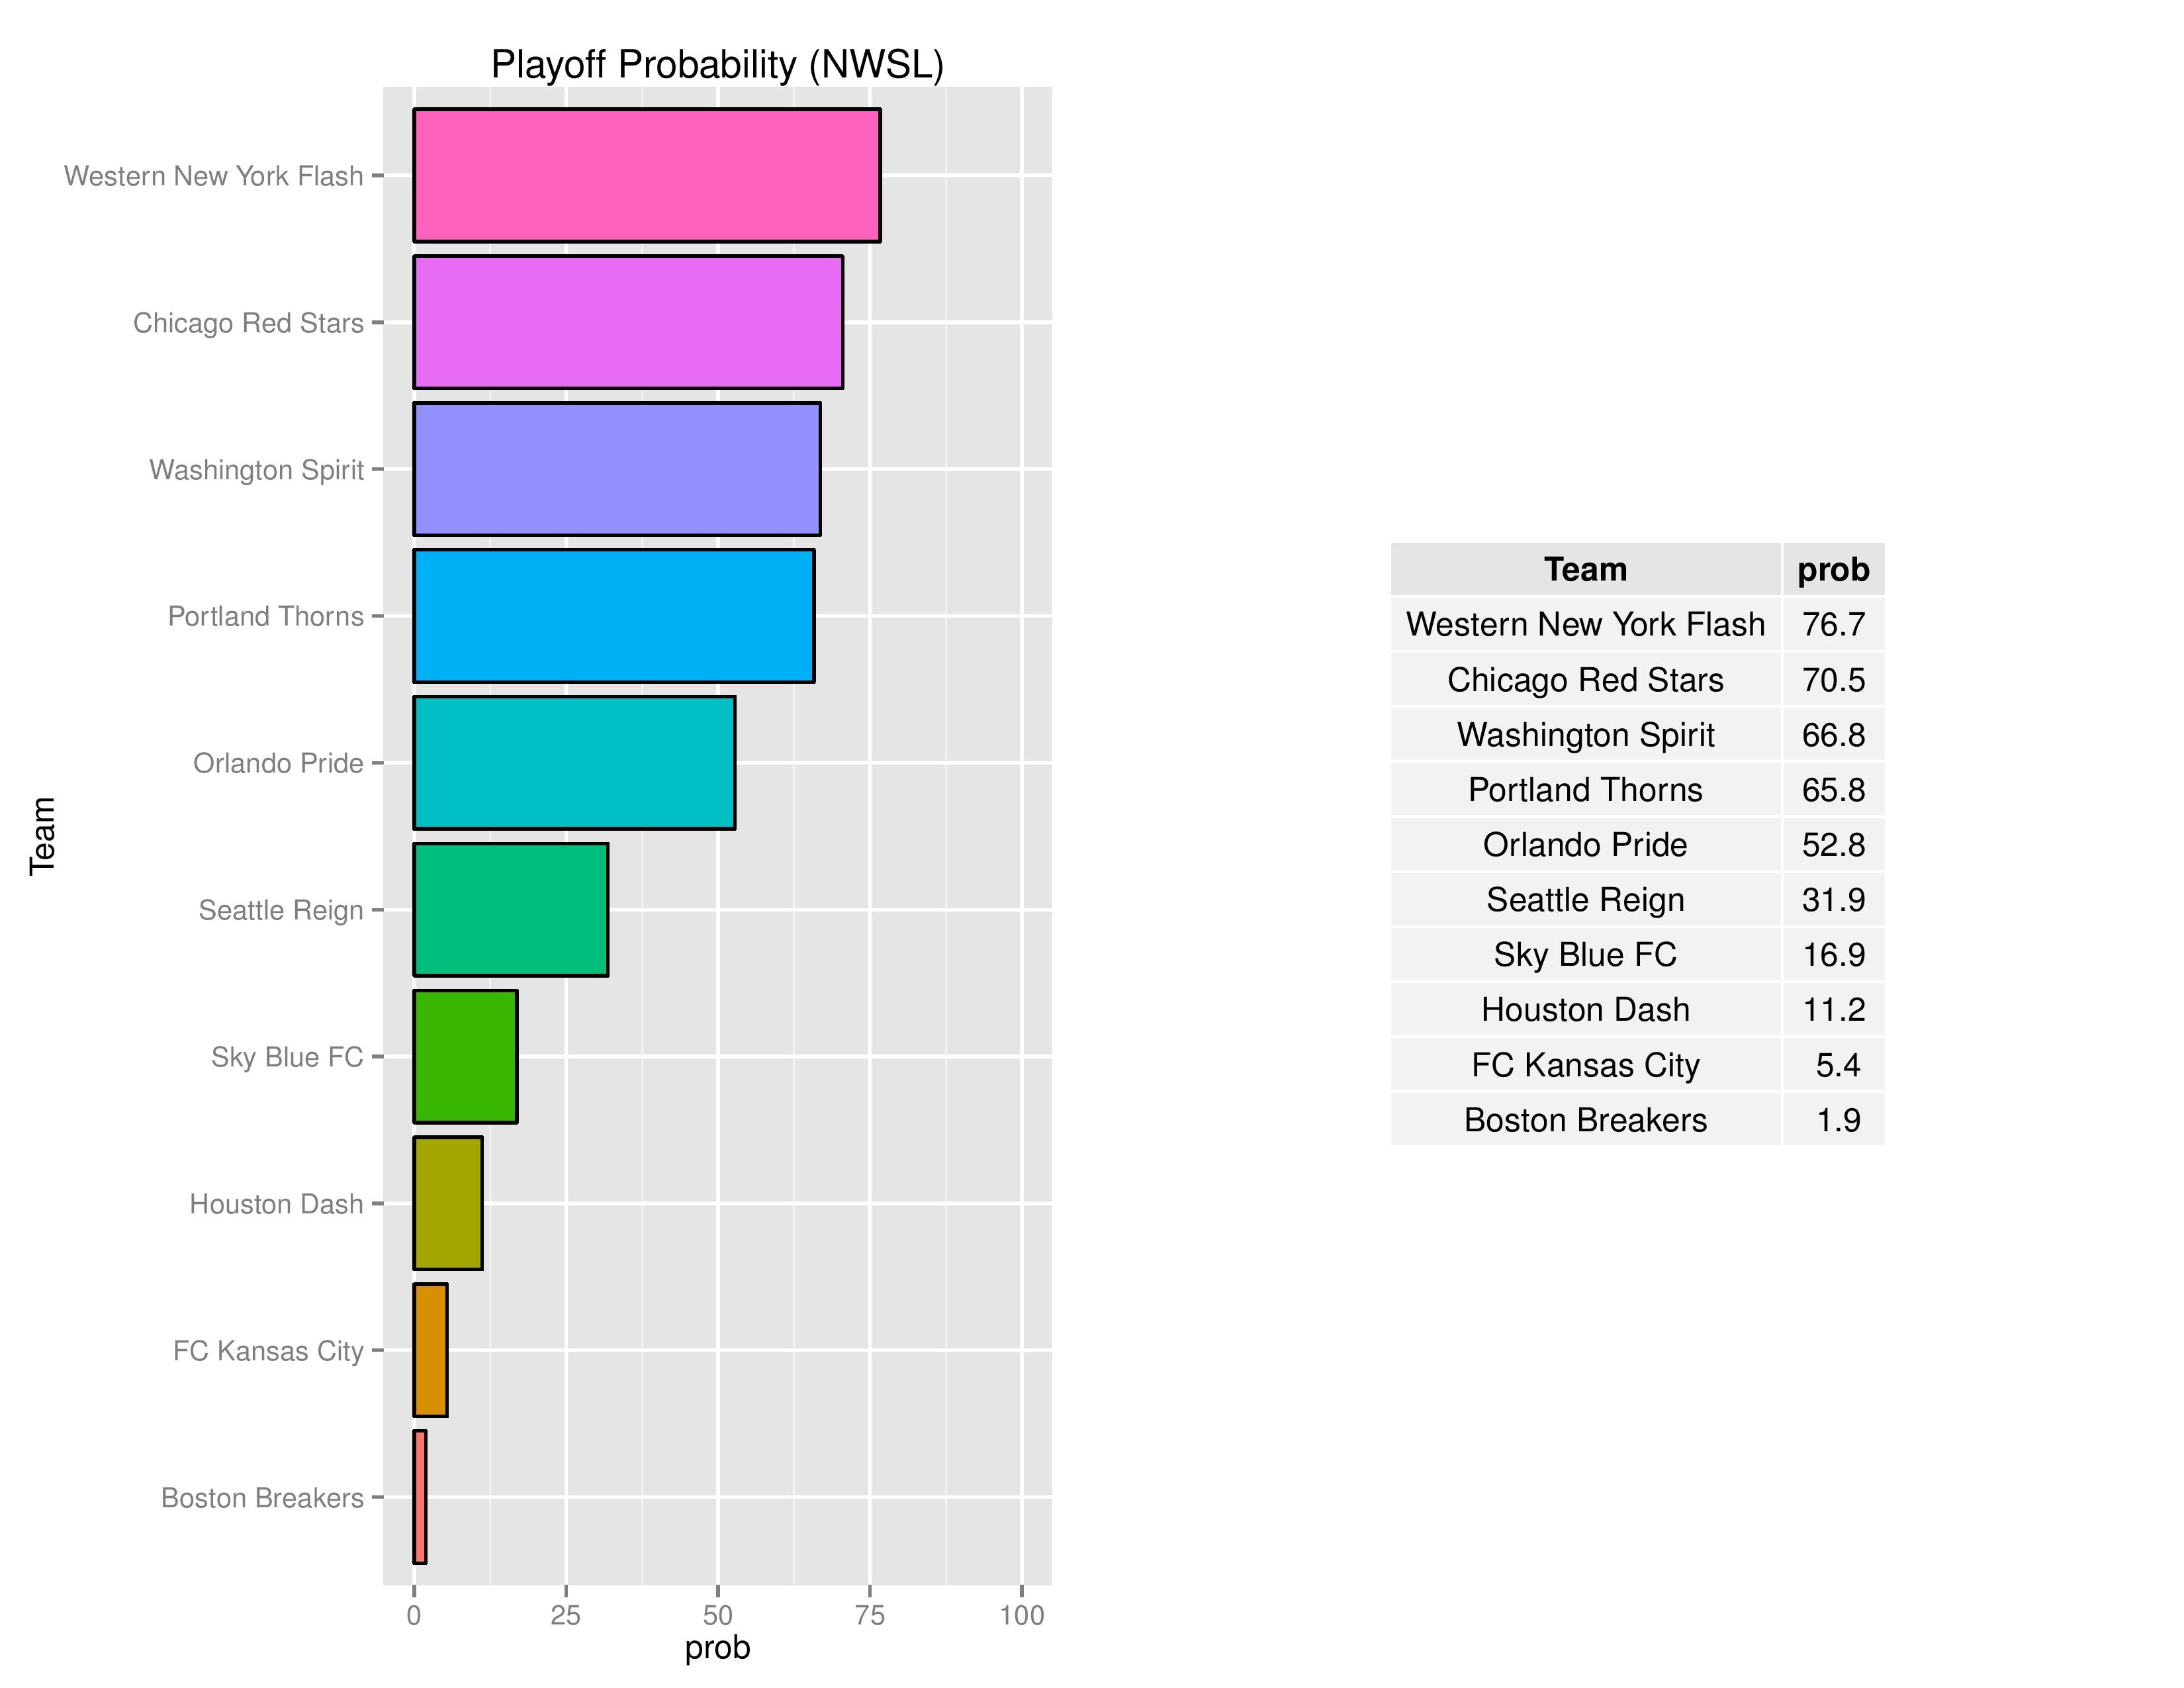
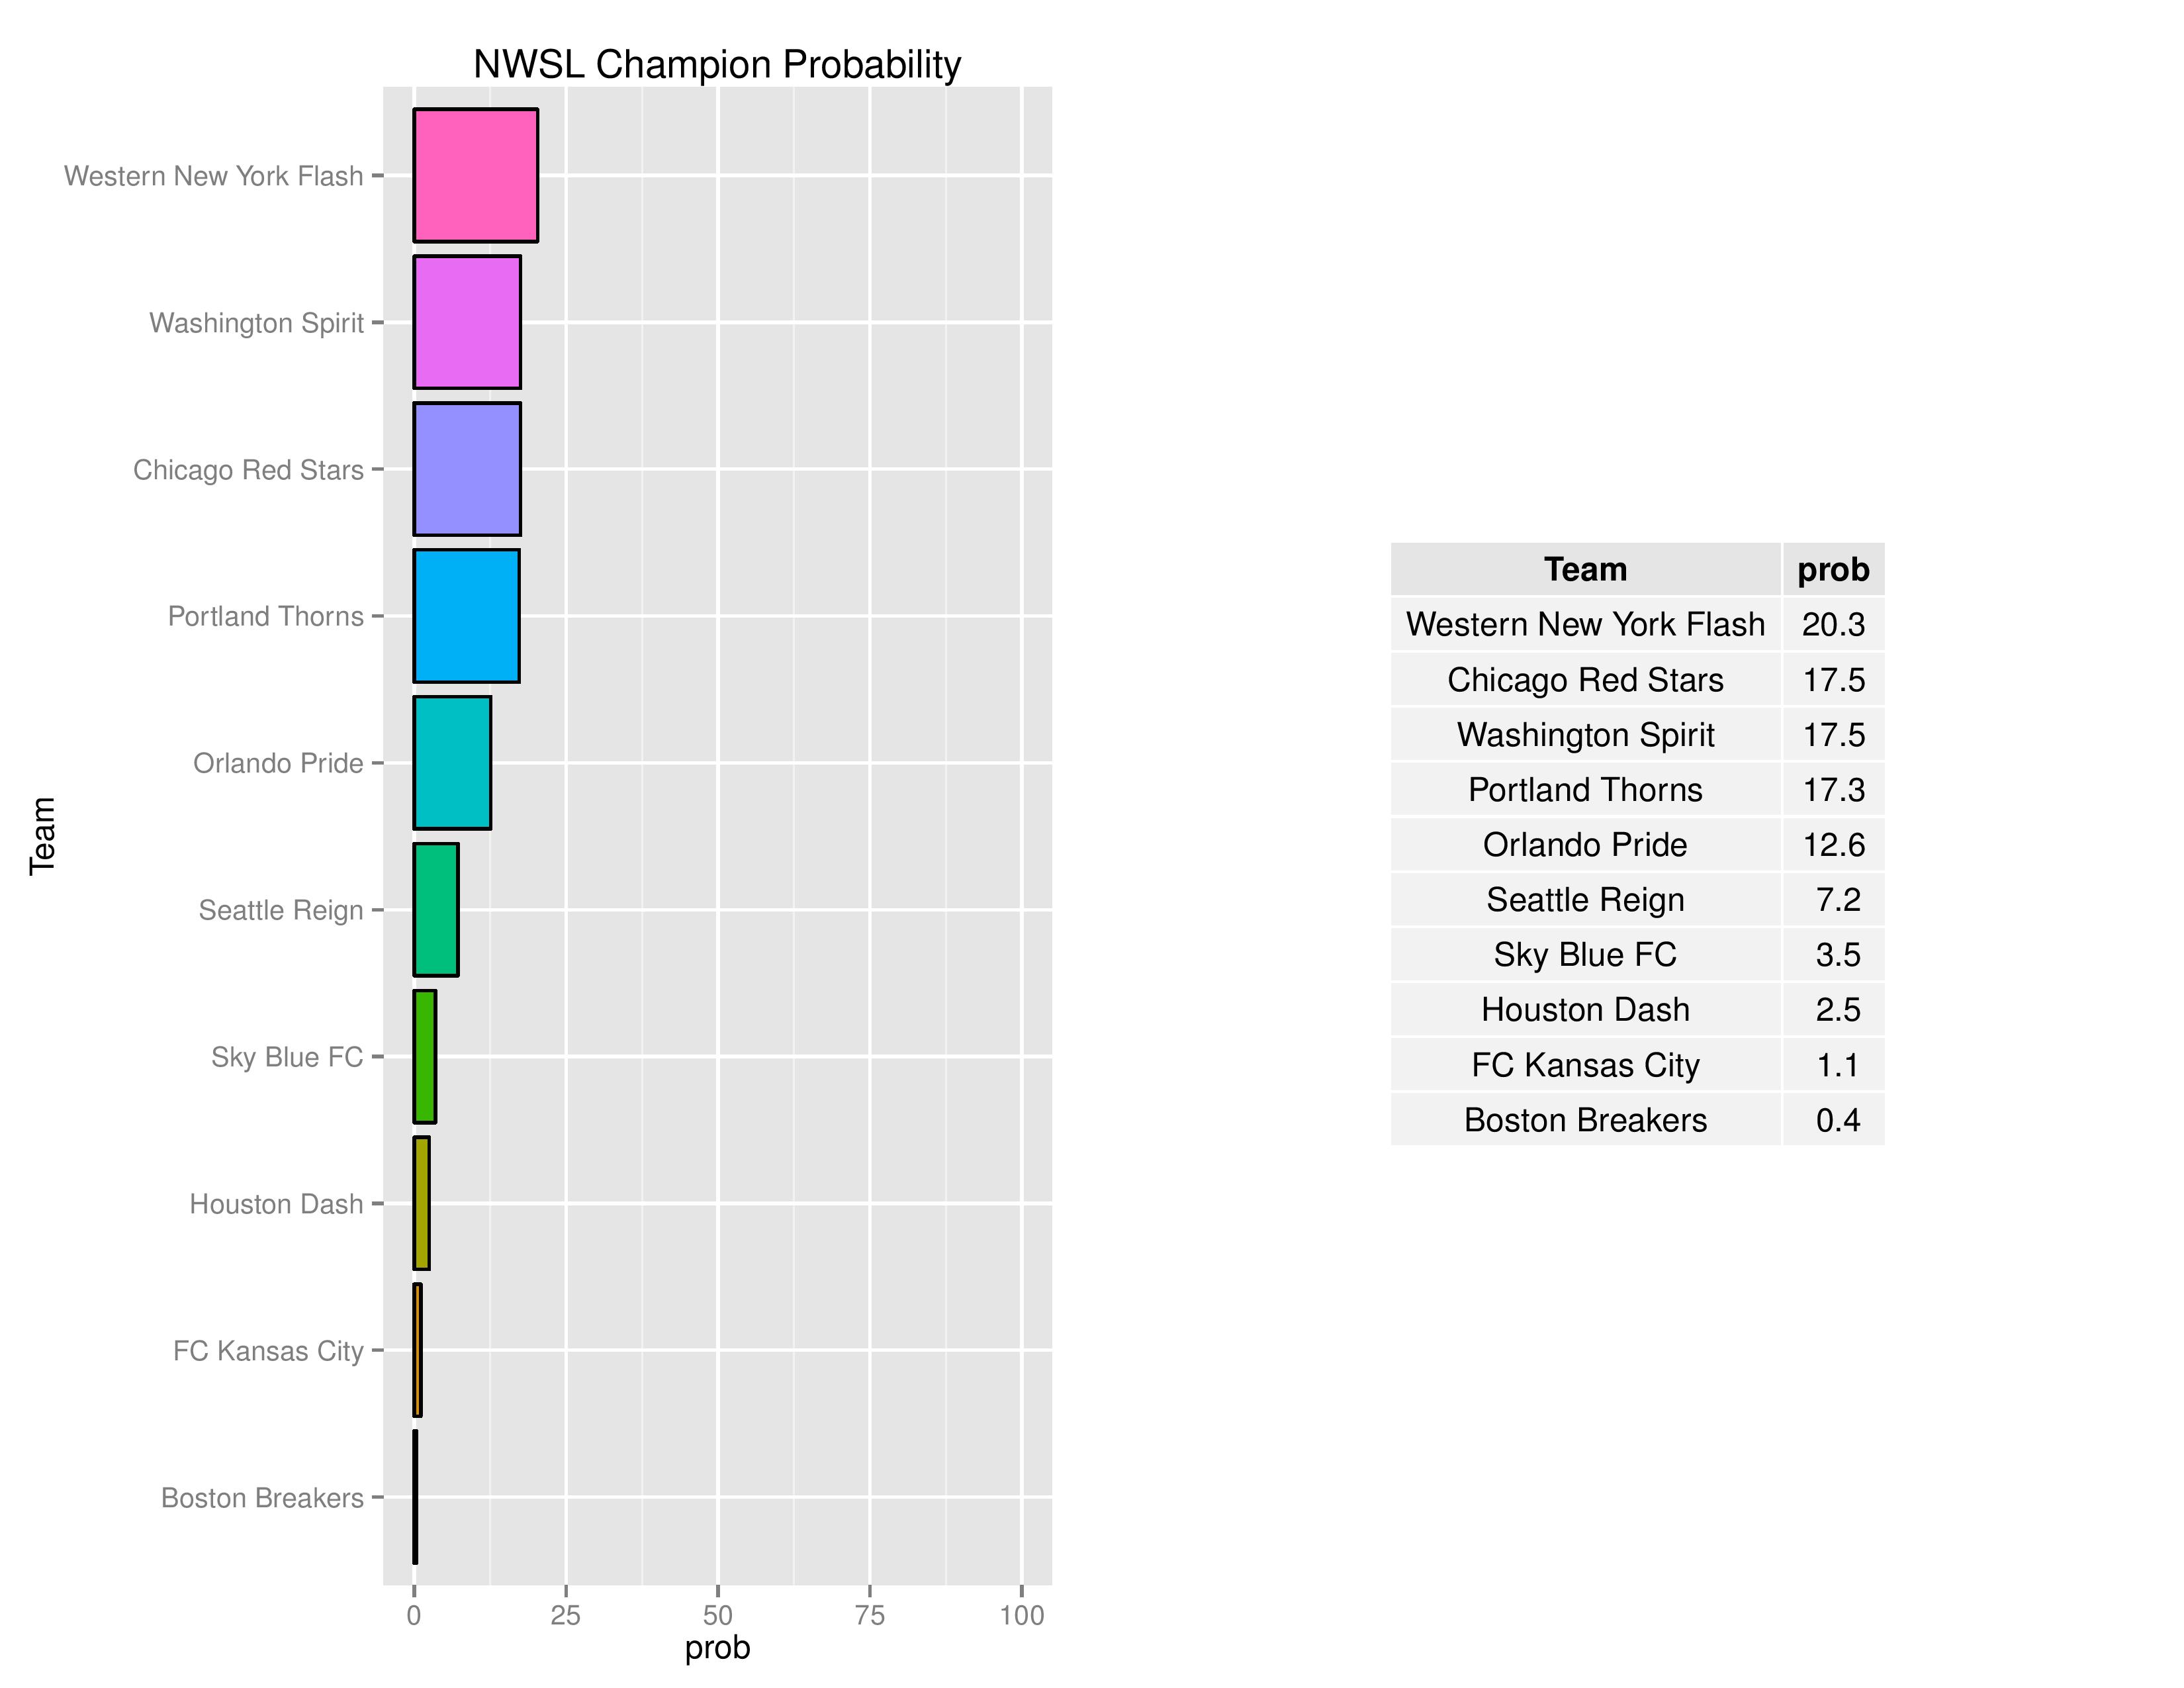
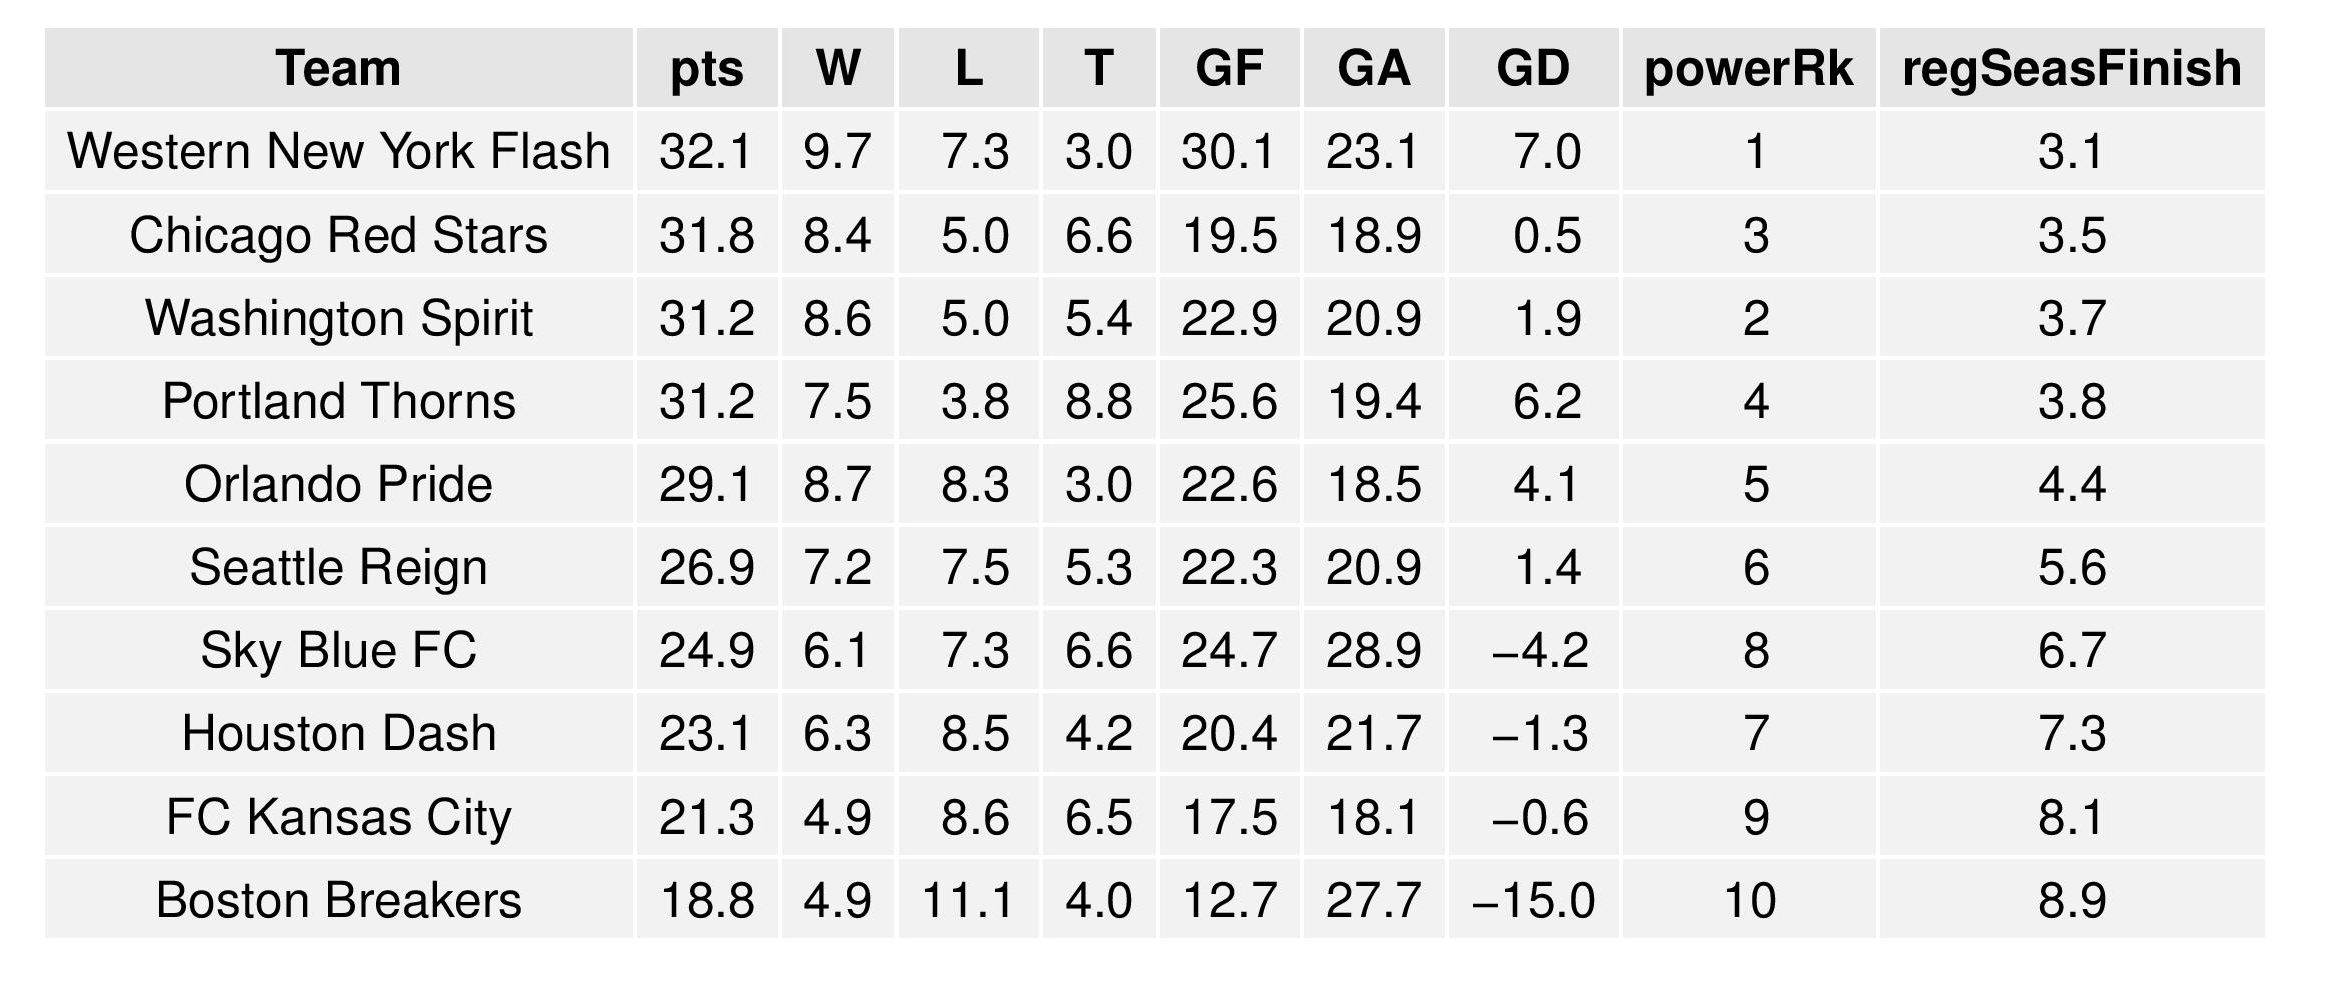
The following tables are the average simulation results produced by SEBA.

RECENT COMMENTS