Welcome to the Statistical Extrapolation Bayesian Analyzer Projection System, which is, of course, a tortured gathering of words used to form the SEBA Projection System.
The system consists of a model projecting the probabilities of game results and then a barrage of simulations which account for the remaining luck. So the probabilities you see below show, essentially, what the odds are of an outcome if the team continues to play like it has been.
Below are the current season forecasts using data from games through June 6, 2016.
Power Rankings
The “Power Rankings” we concoct are the actual “strength” of the team according to competitive expectations. They are computed showing average expected points result if every team in MLS played every team both home and away:
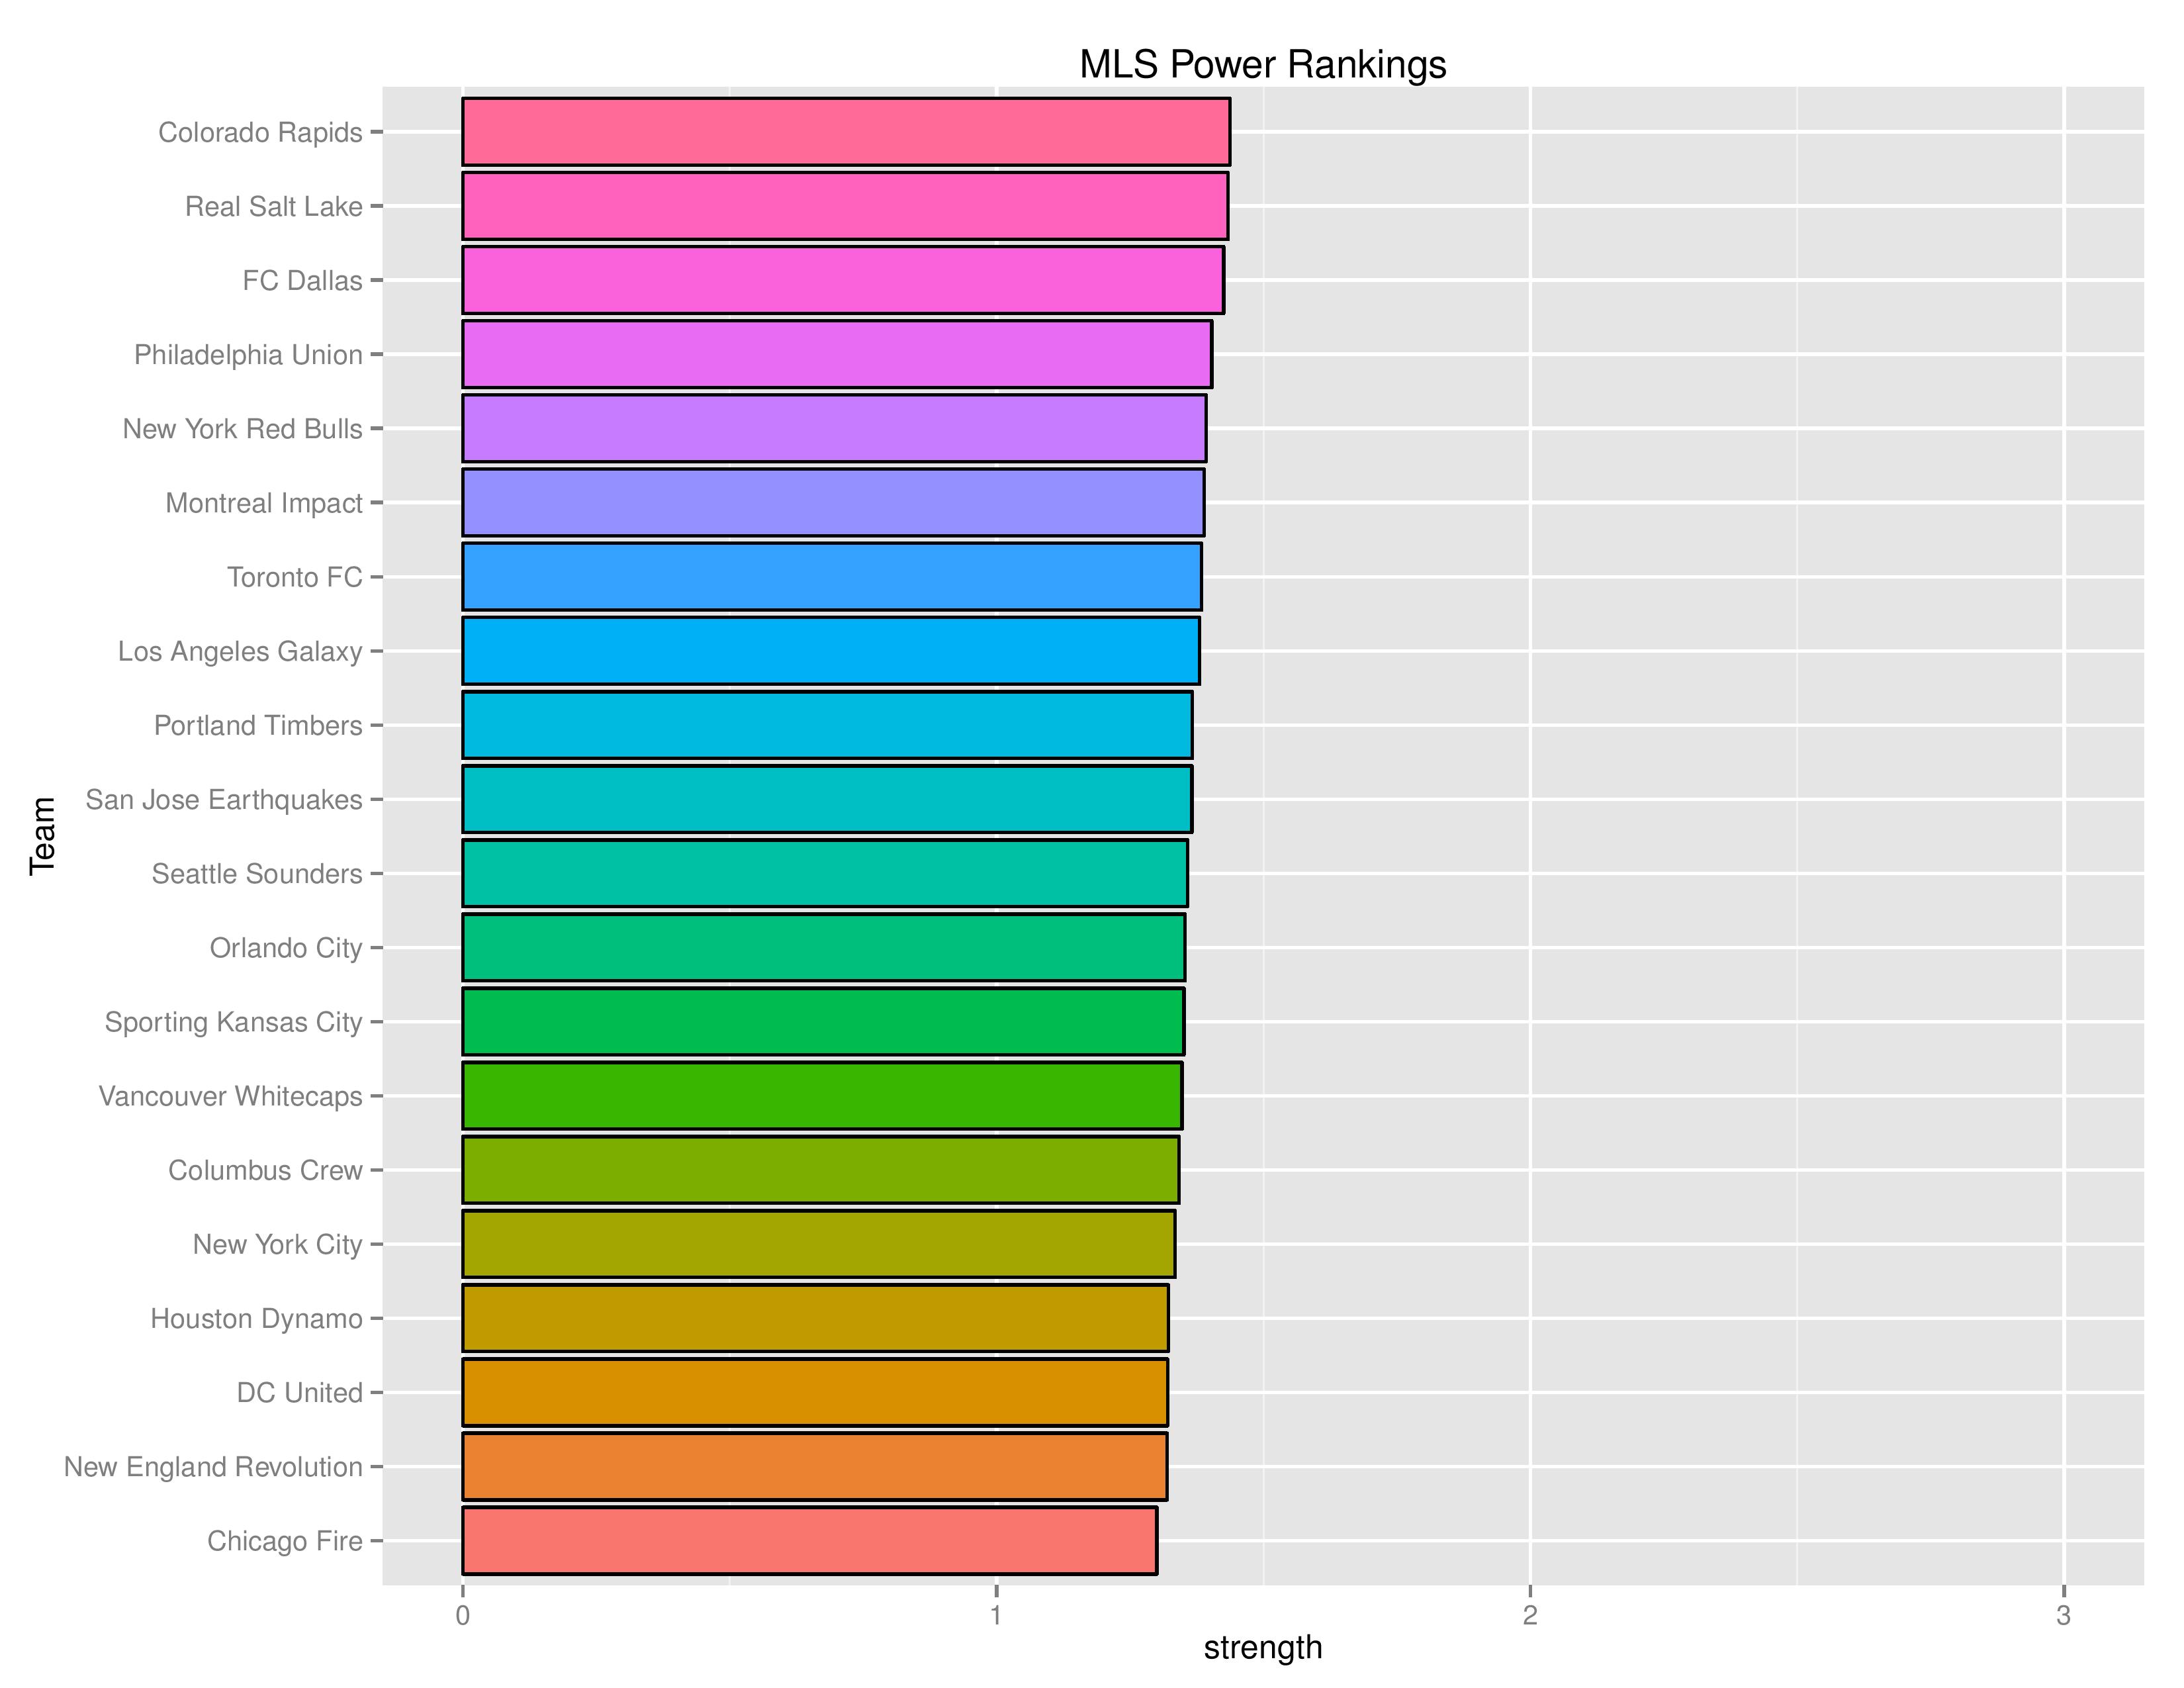
SEBA has the Union moving from No. 6 to No. 4 this week, moving back ahead of Montreal and NYRB during their break. MLSSoccer.com has the Union at No. 2.
Playoffs probability and more
The following charts show the probabilities for making the playoffs, winning the Supporters’ Shield, winning the MLS Cup, winning the USOC Cup, and qualification for CONCACAF Champions League.
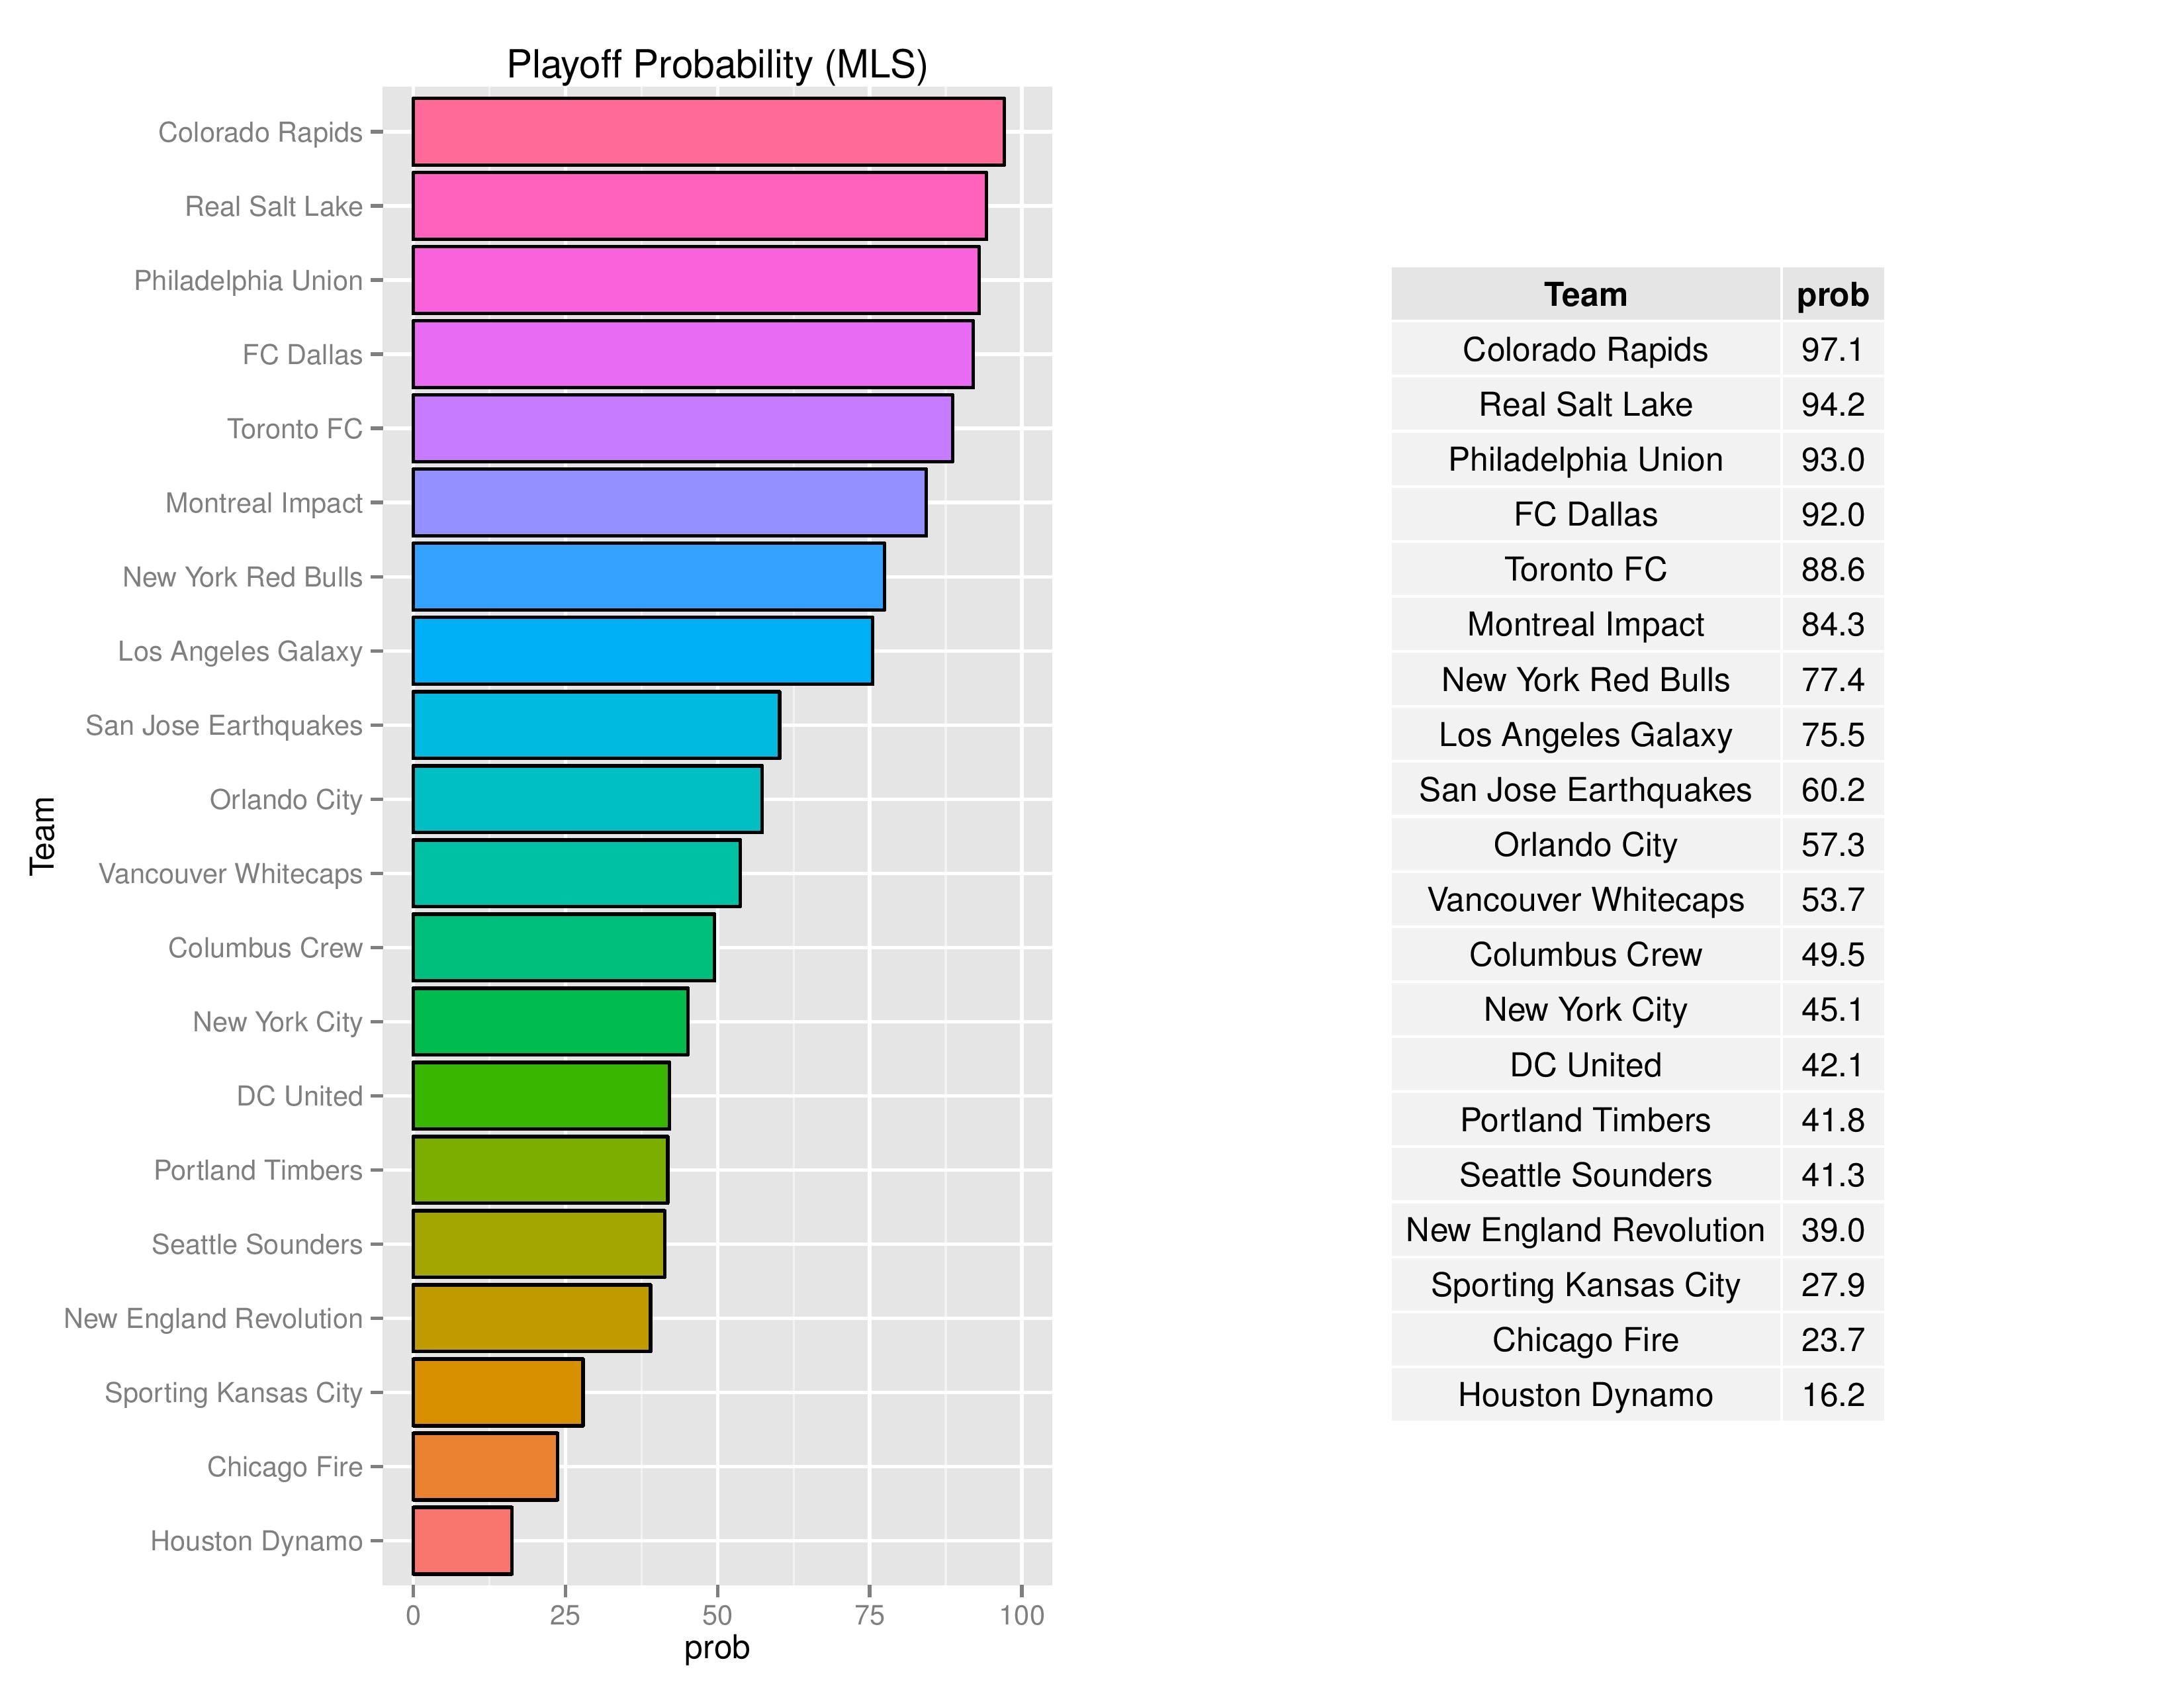
The Union moved up from 87.8% to 93.0% with the win against Columbus. While SEBA doesn’t necessarily award a lot of credit to home victories, Philadelphia’s consistent ability to win all 3 points at home boosts their modeled strength, and, especially, their playoff outlook. They have also moved ahead of FC Dallas in playoff probability due to that team’s home draw against Houston.
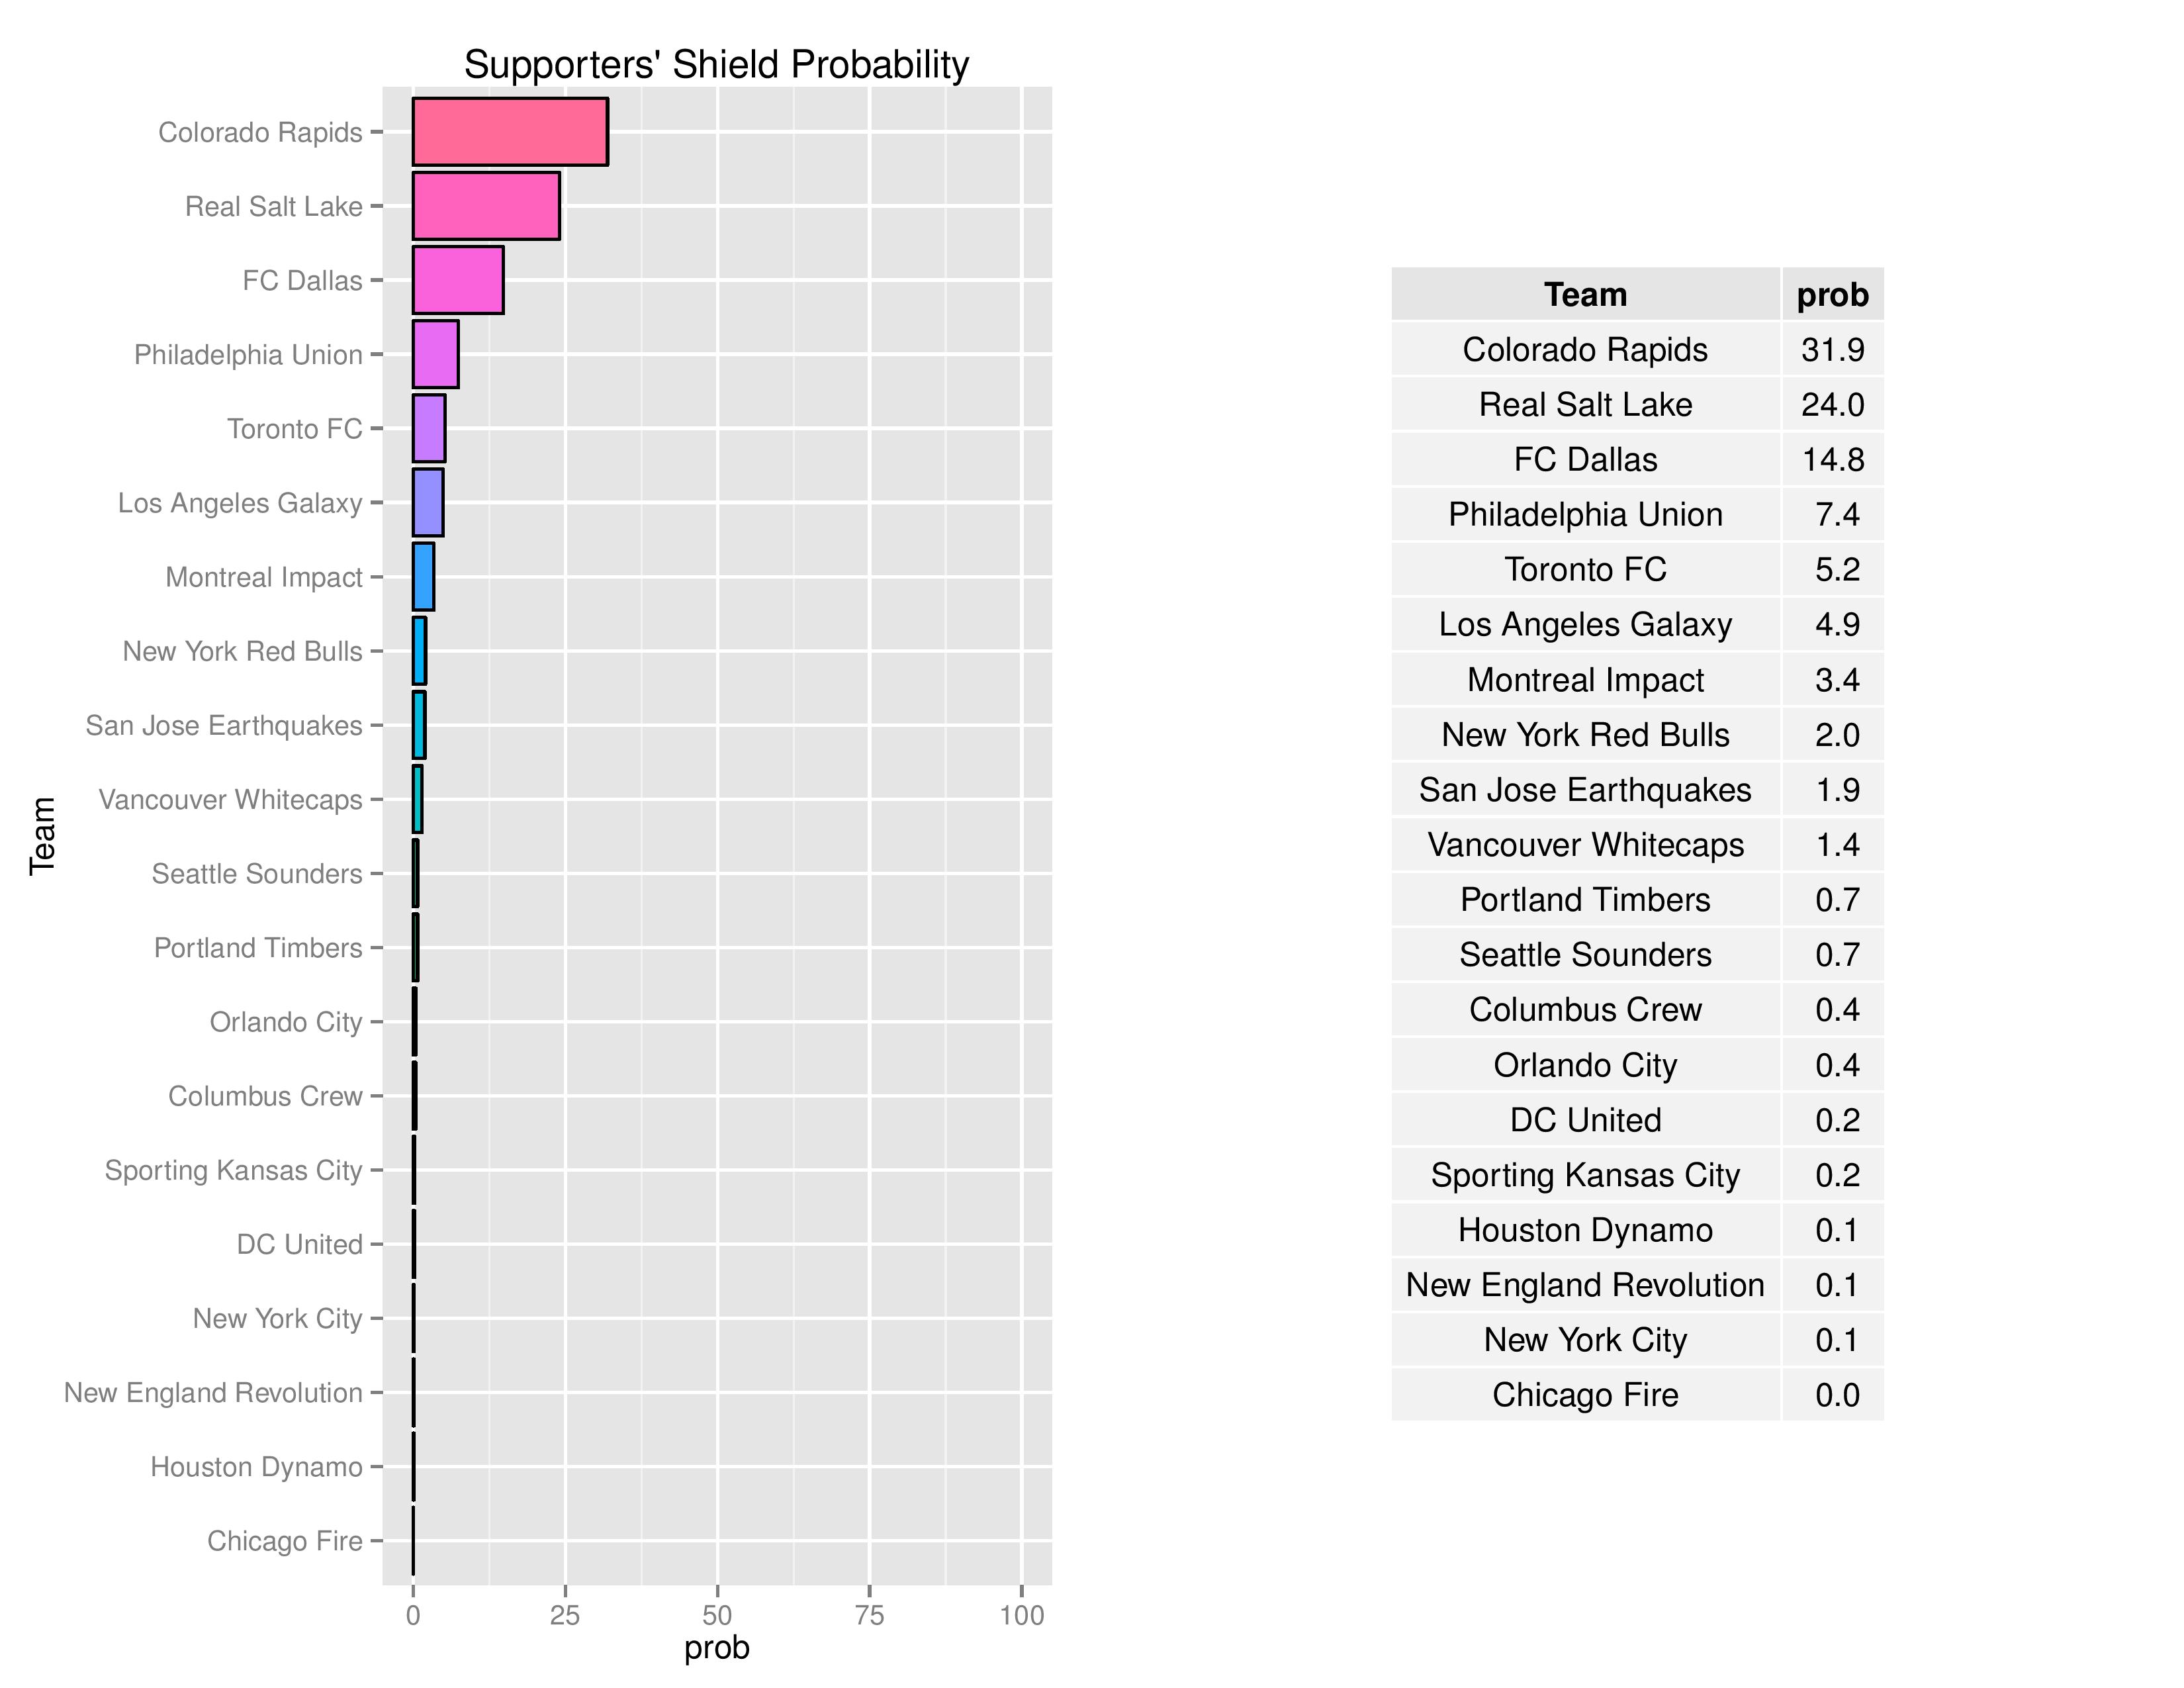
Philadelphia improved to 7.4% from 5.2% in their odds of claiming the Shield. They also moved past Los Angeles in the rank order.
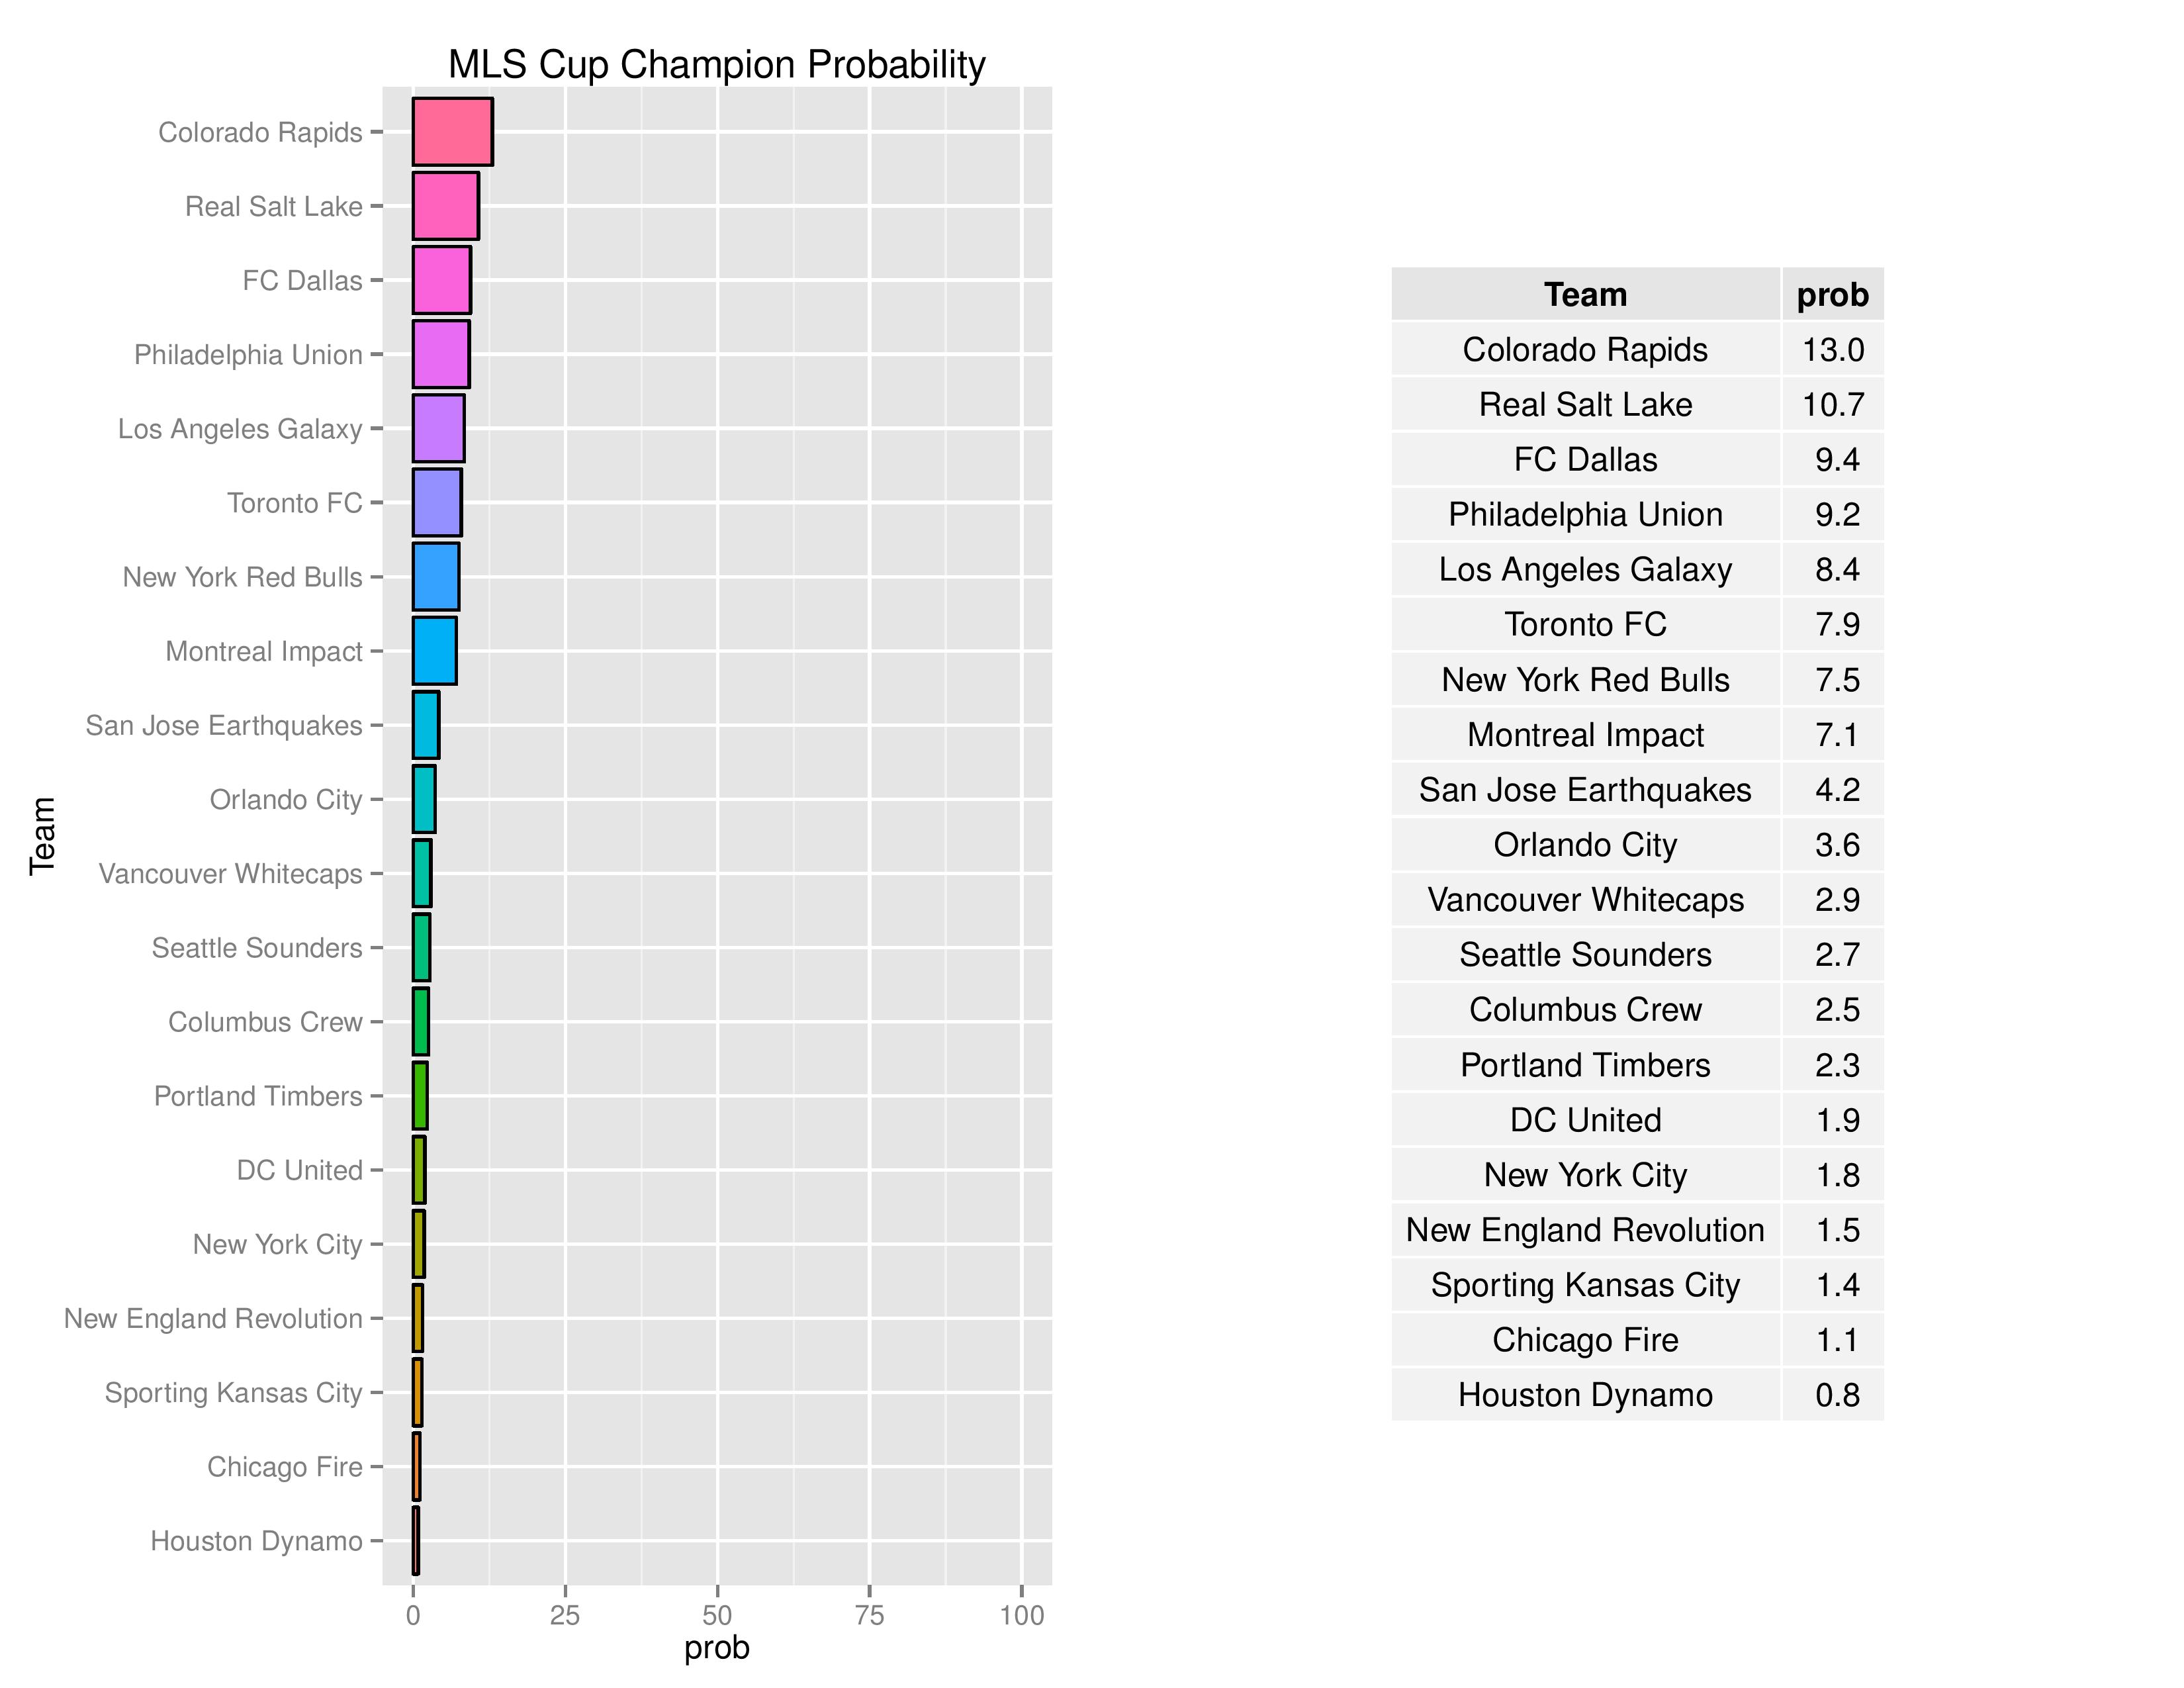
The Union increased their odds from 8.5% last week to 9.2%. As with the Supporters’ Shield, the Union also moved ahead of the Galaxy.
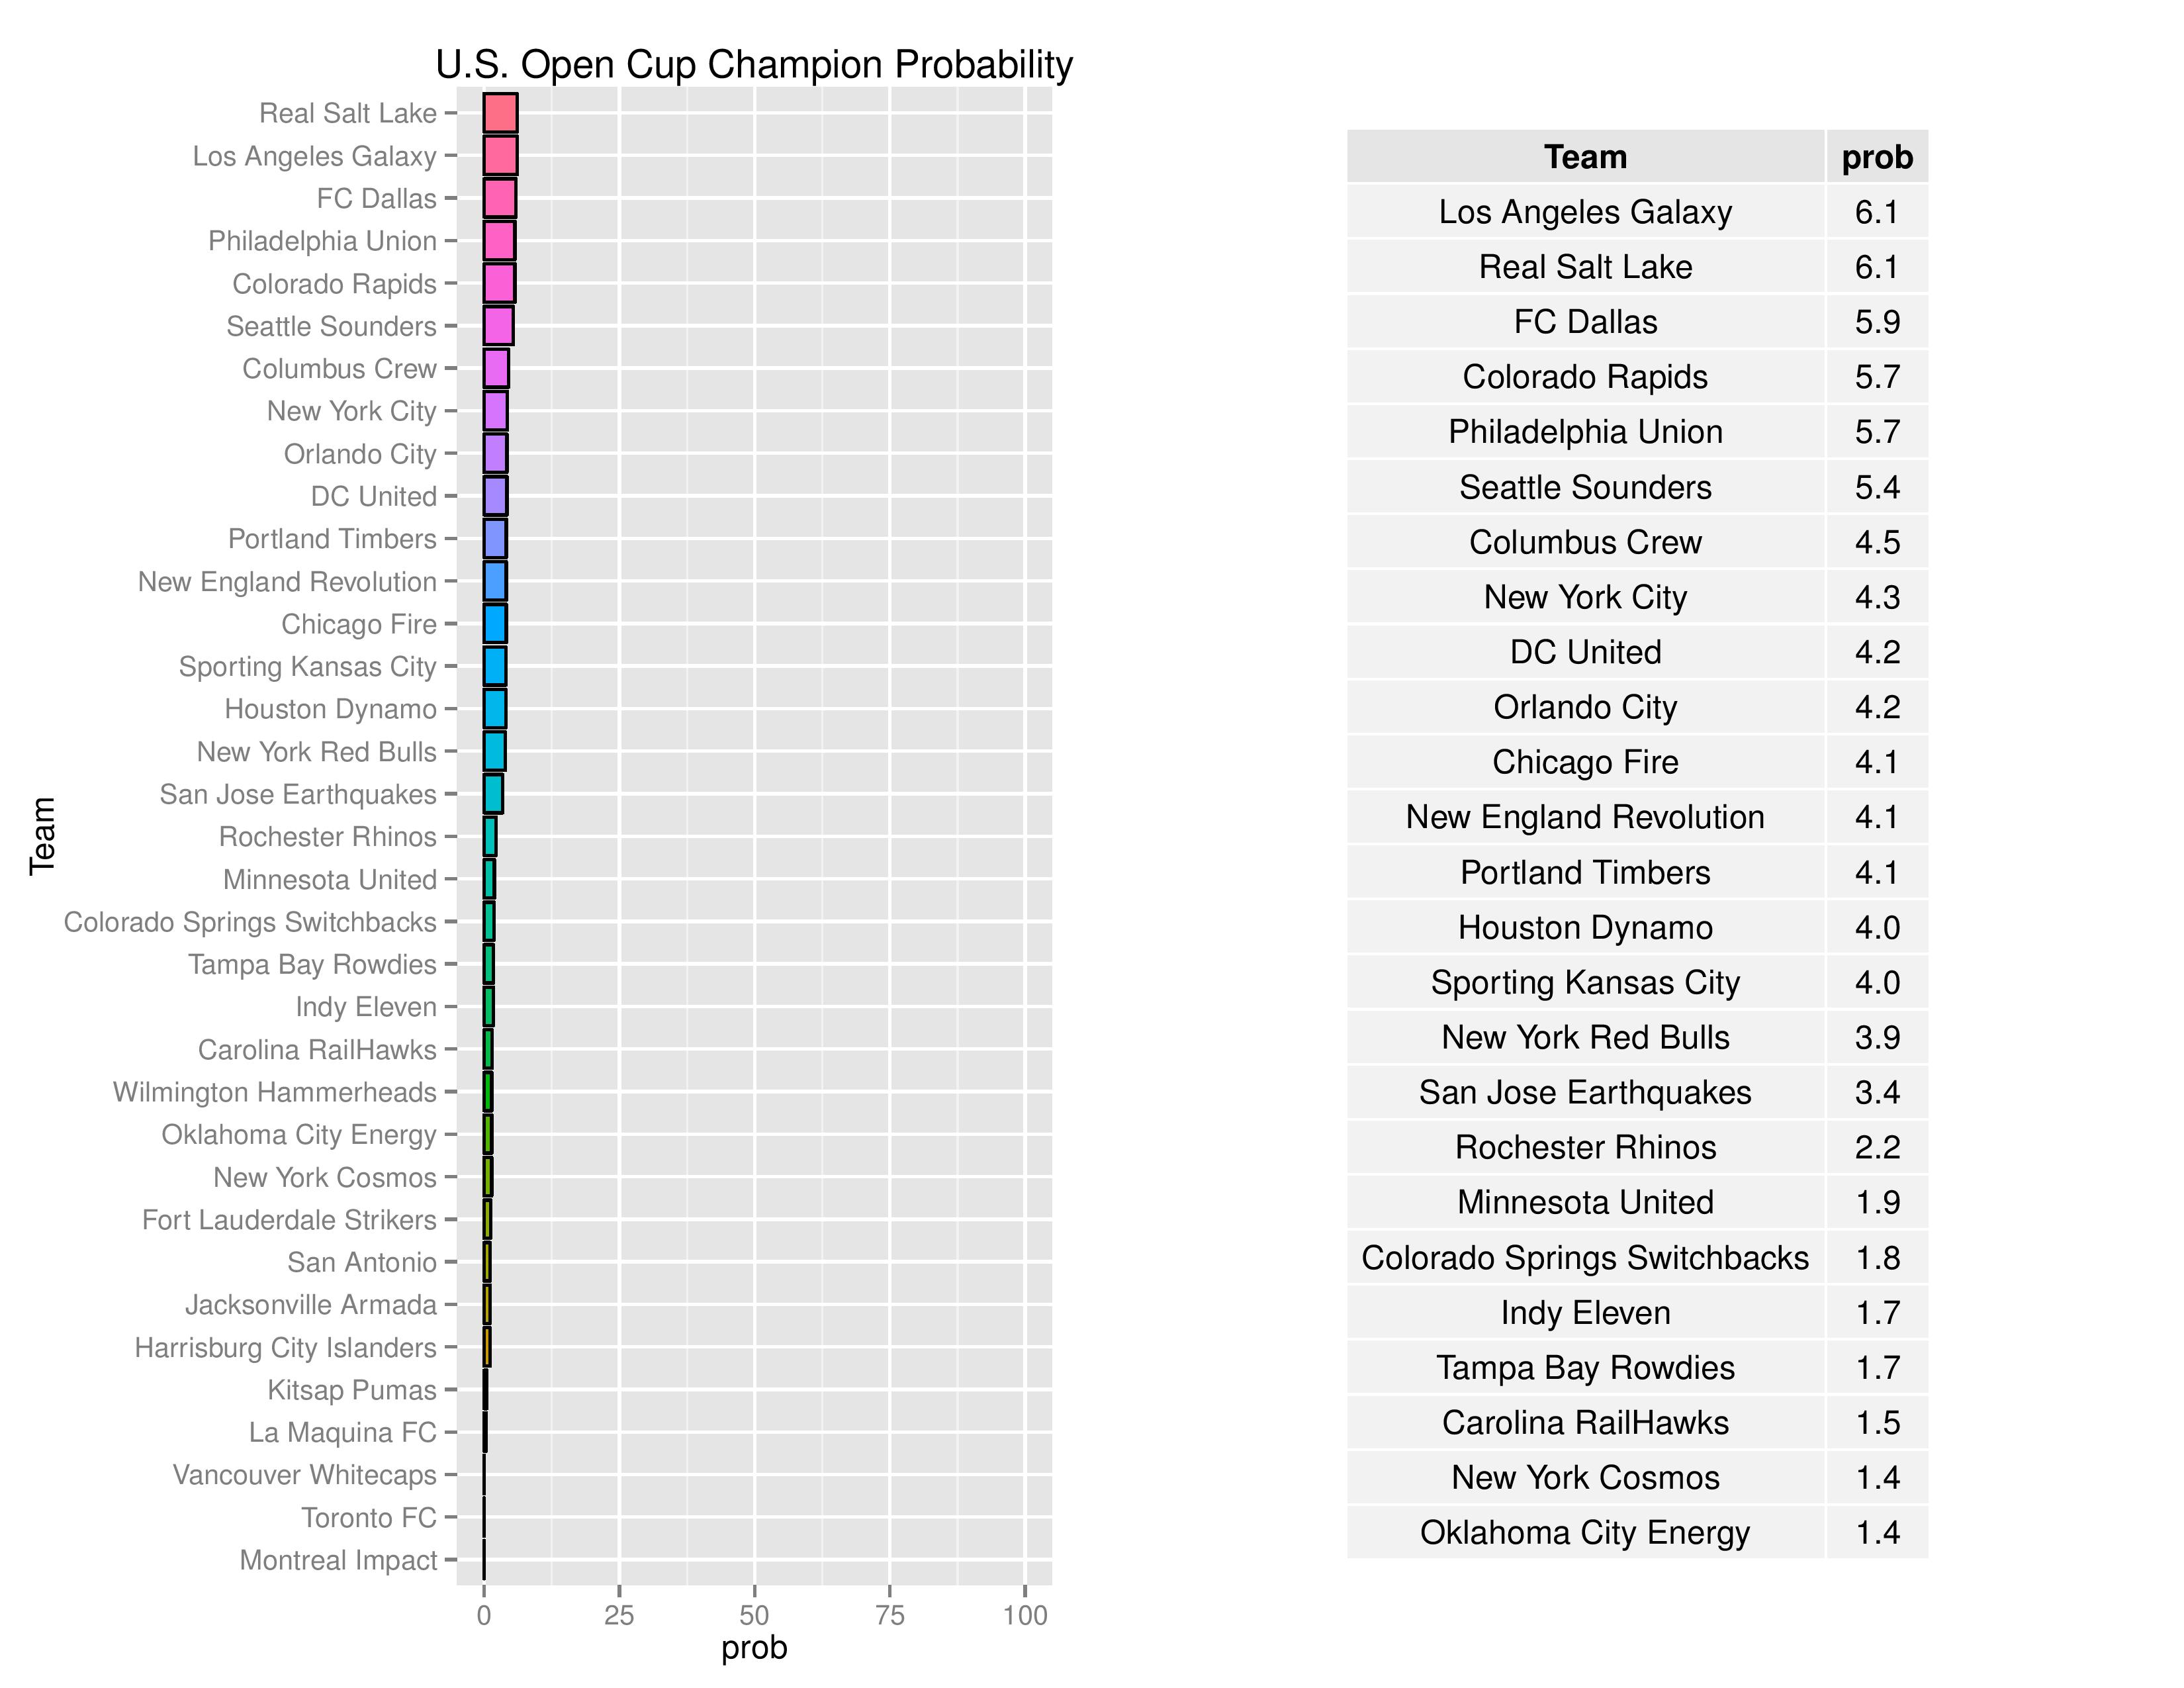
Philadelphia moved down slightly from 6.0% last week to 5.7% in the probability to win the US Open Cup. This is largely due to Harrisburg’s defeat of Chattanooga, who would have been an easier opponent when the Union begins Cup play in the fourth round on June 15.
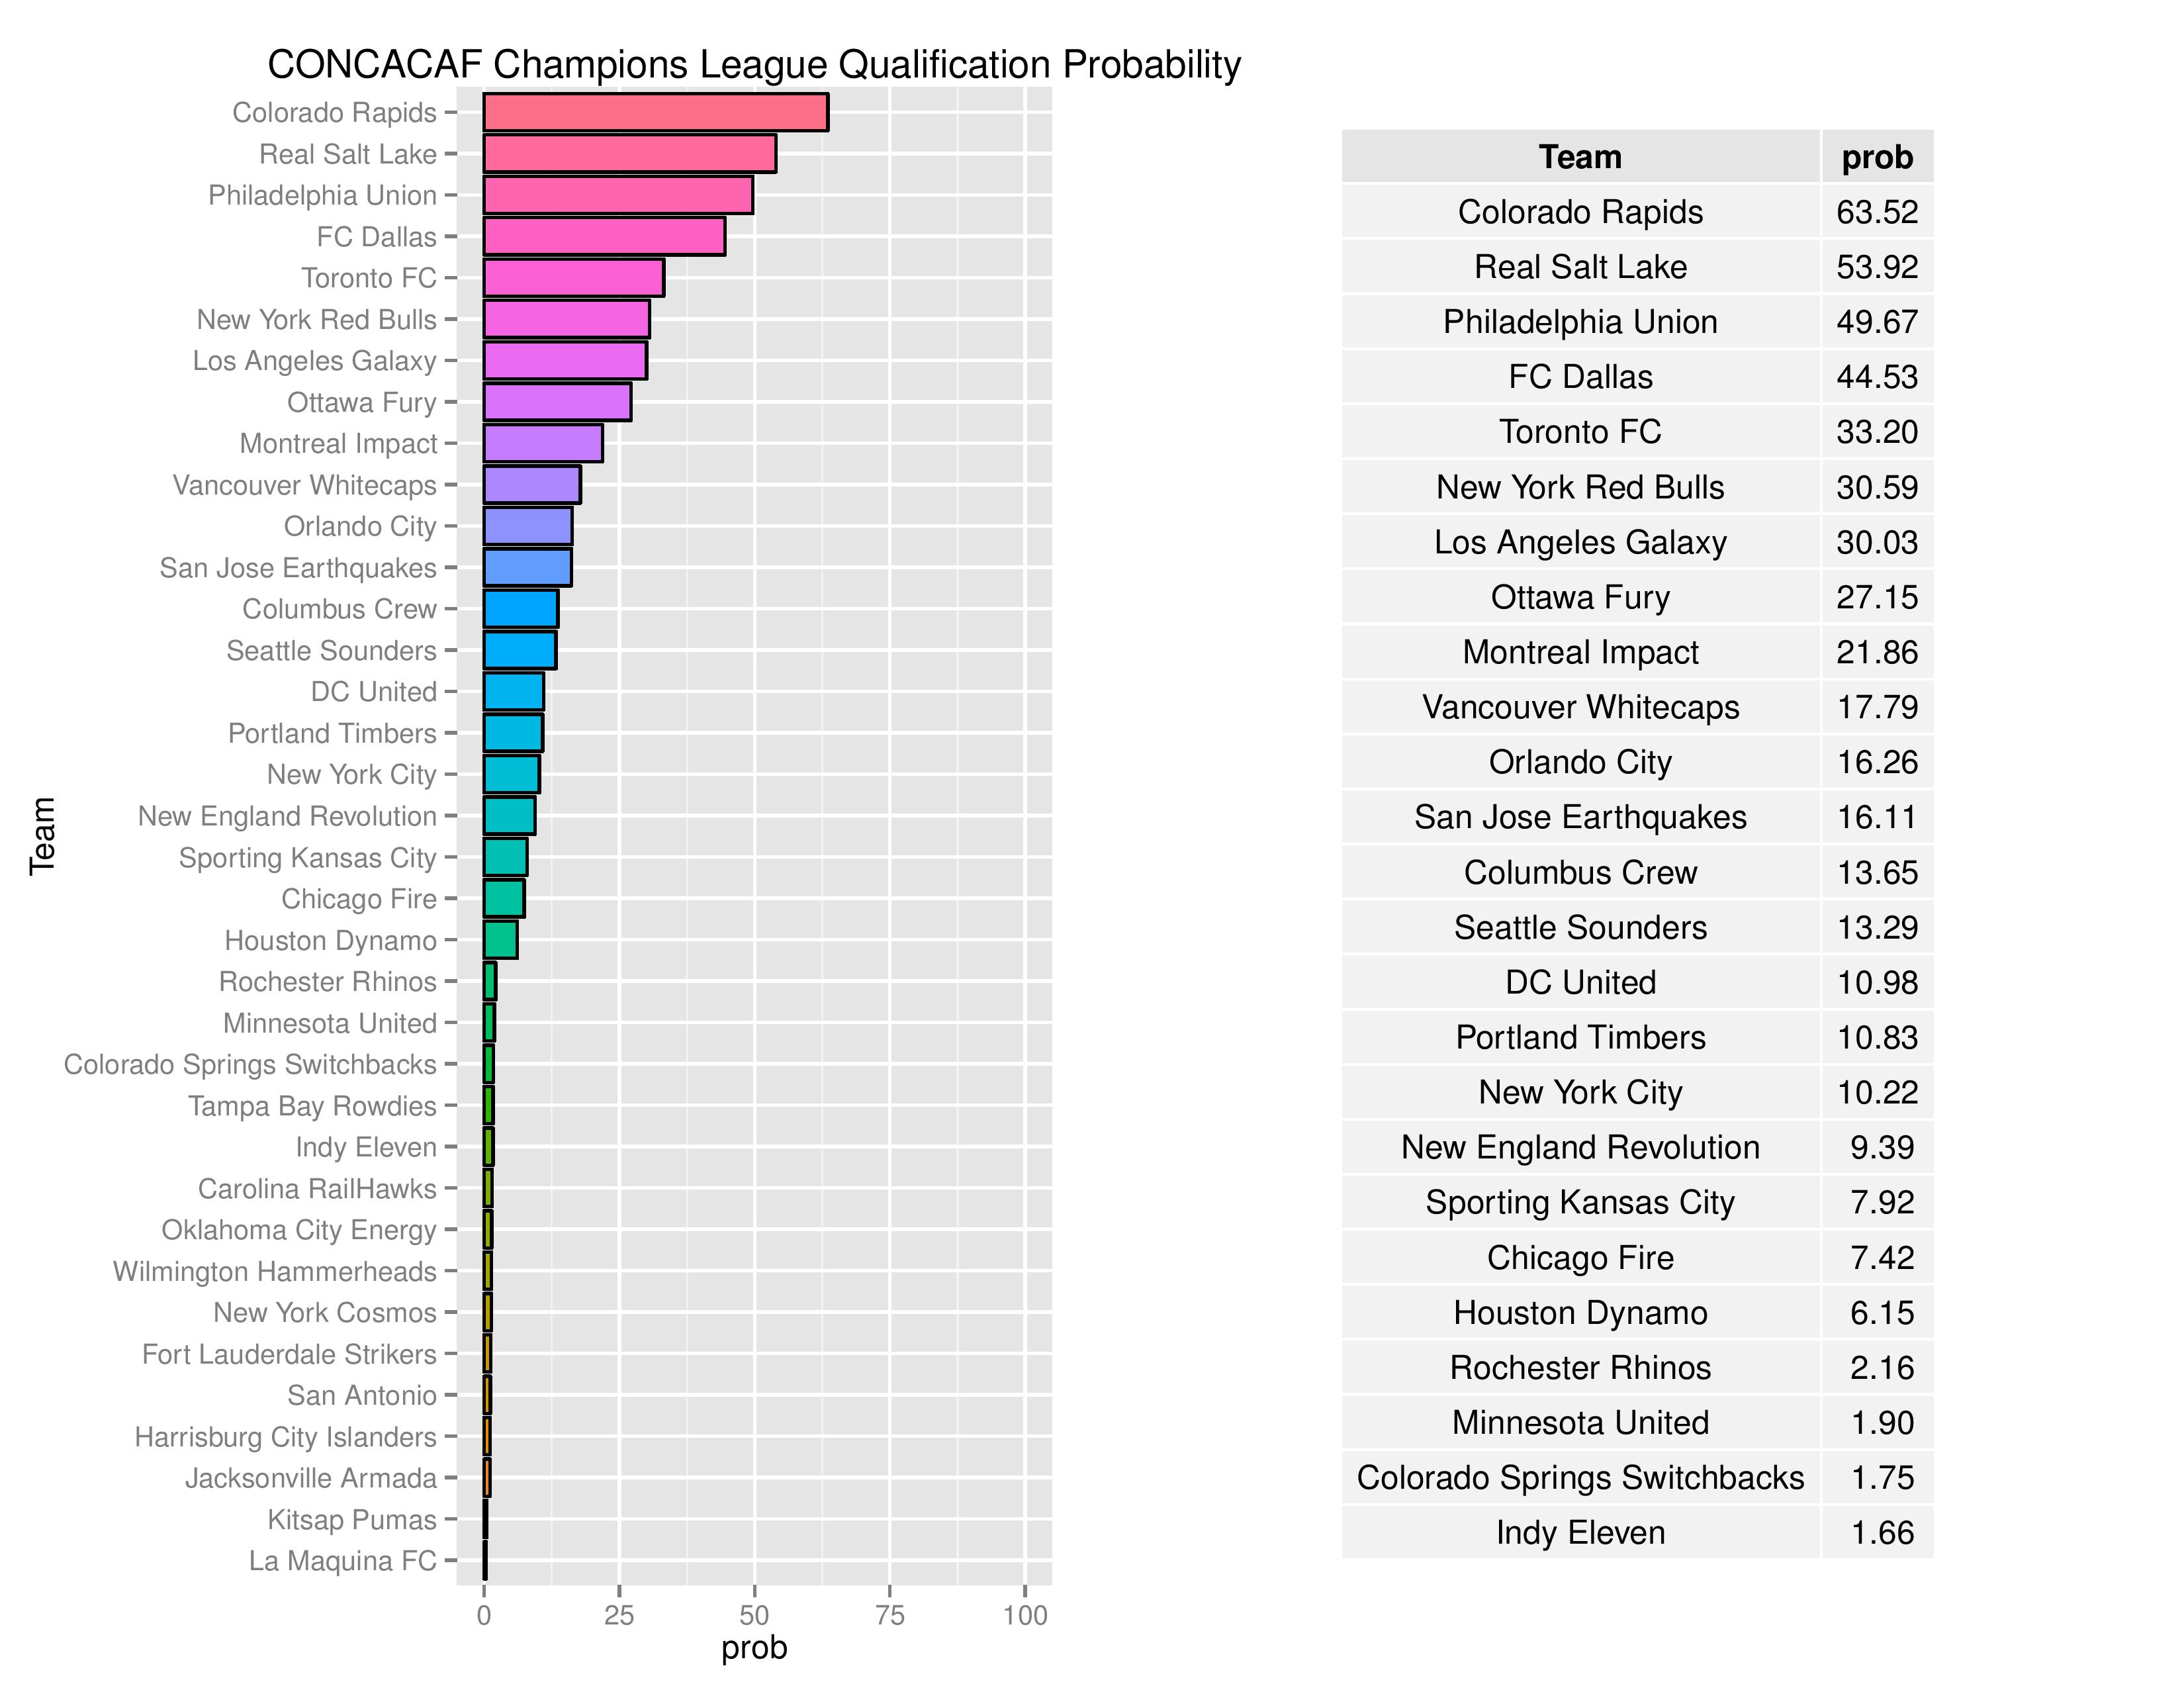
Philadelphia’s probability of qualifying for the CCL moved up from 44.15% to 49.67%. As a reminder, U.S. teams qualify for the CCL by winning the MLS Cup, winning a conference in the regular season (including Supporters’ Shield), and by winning the U.S. Open Cup (or being a top single-table-performer if the former qualifications don’t count for 4 slots). Canadian teams qualify by winning the Canadian Championship.
Philadelphia finishing
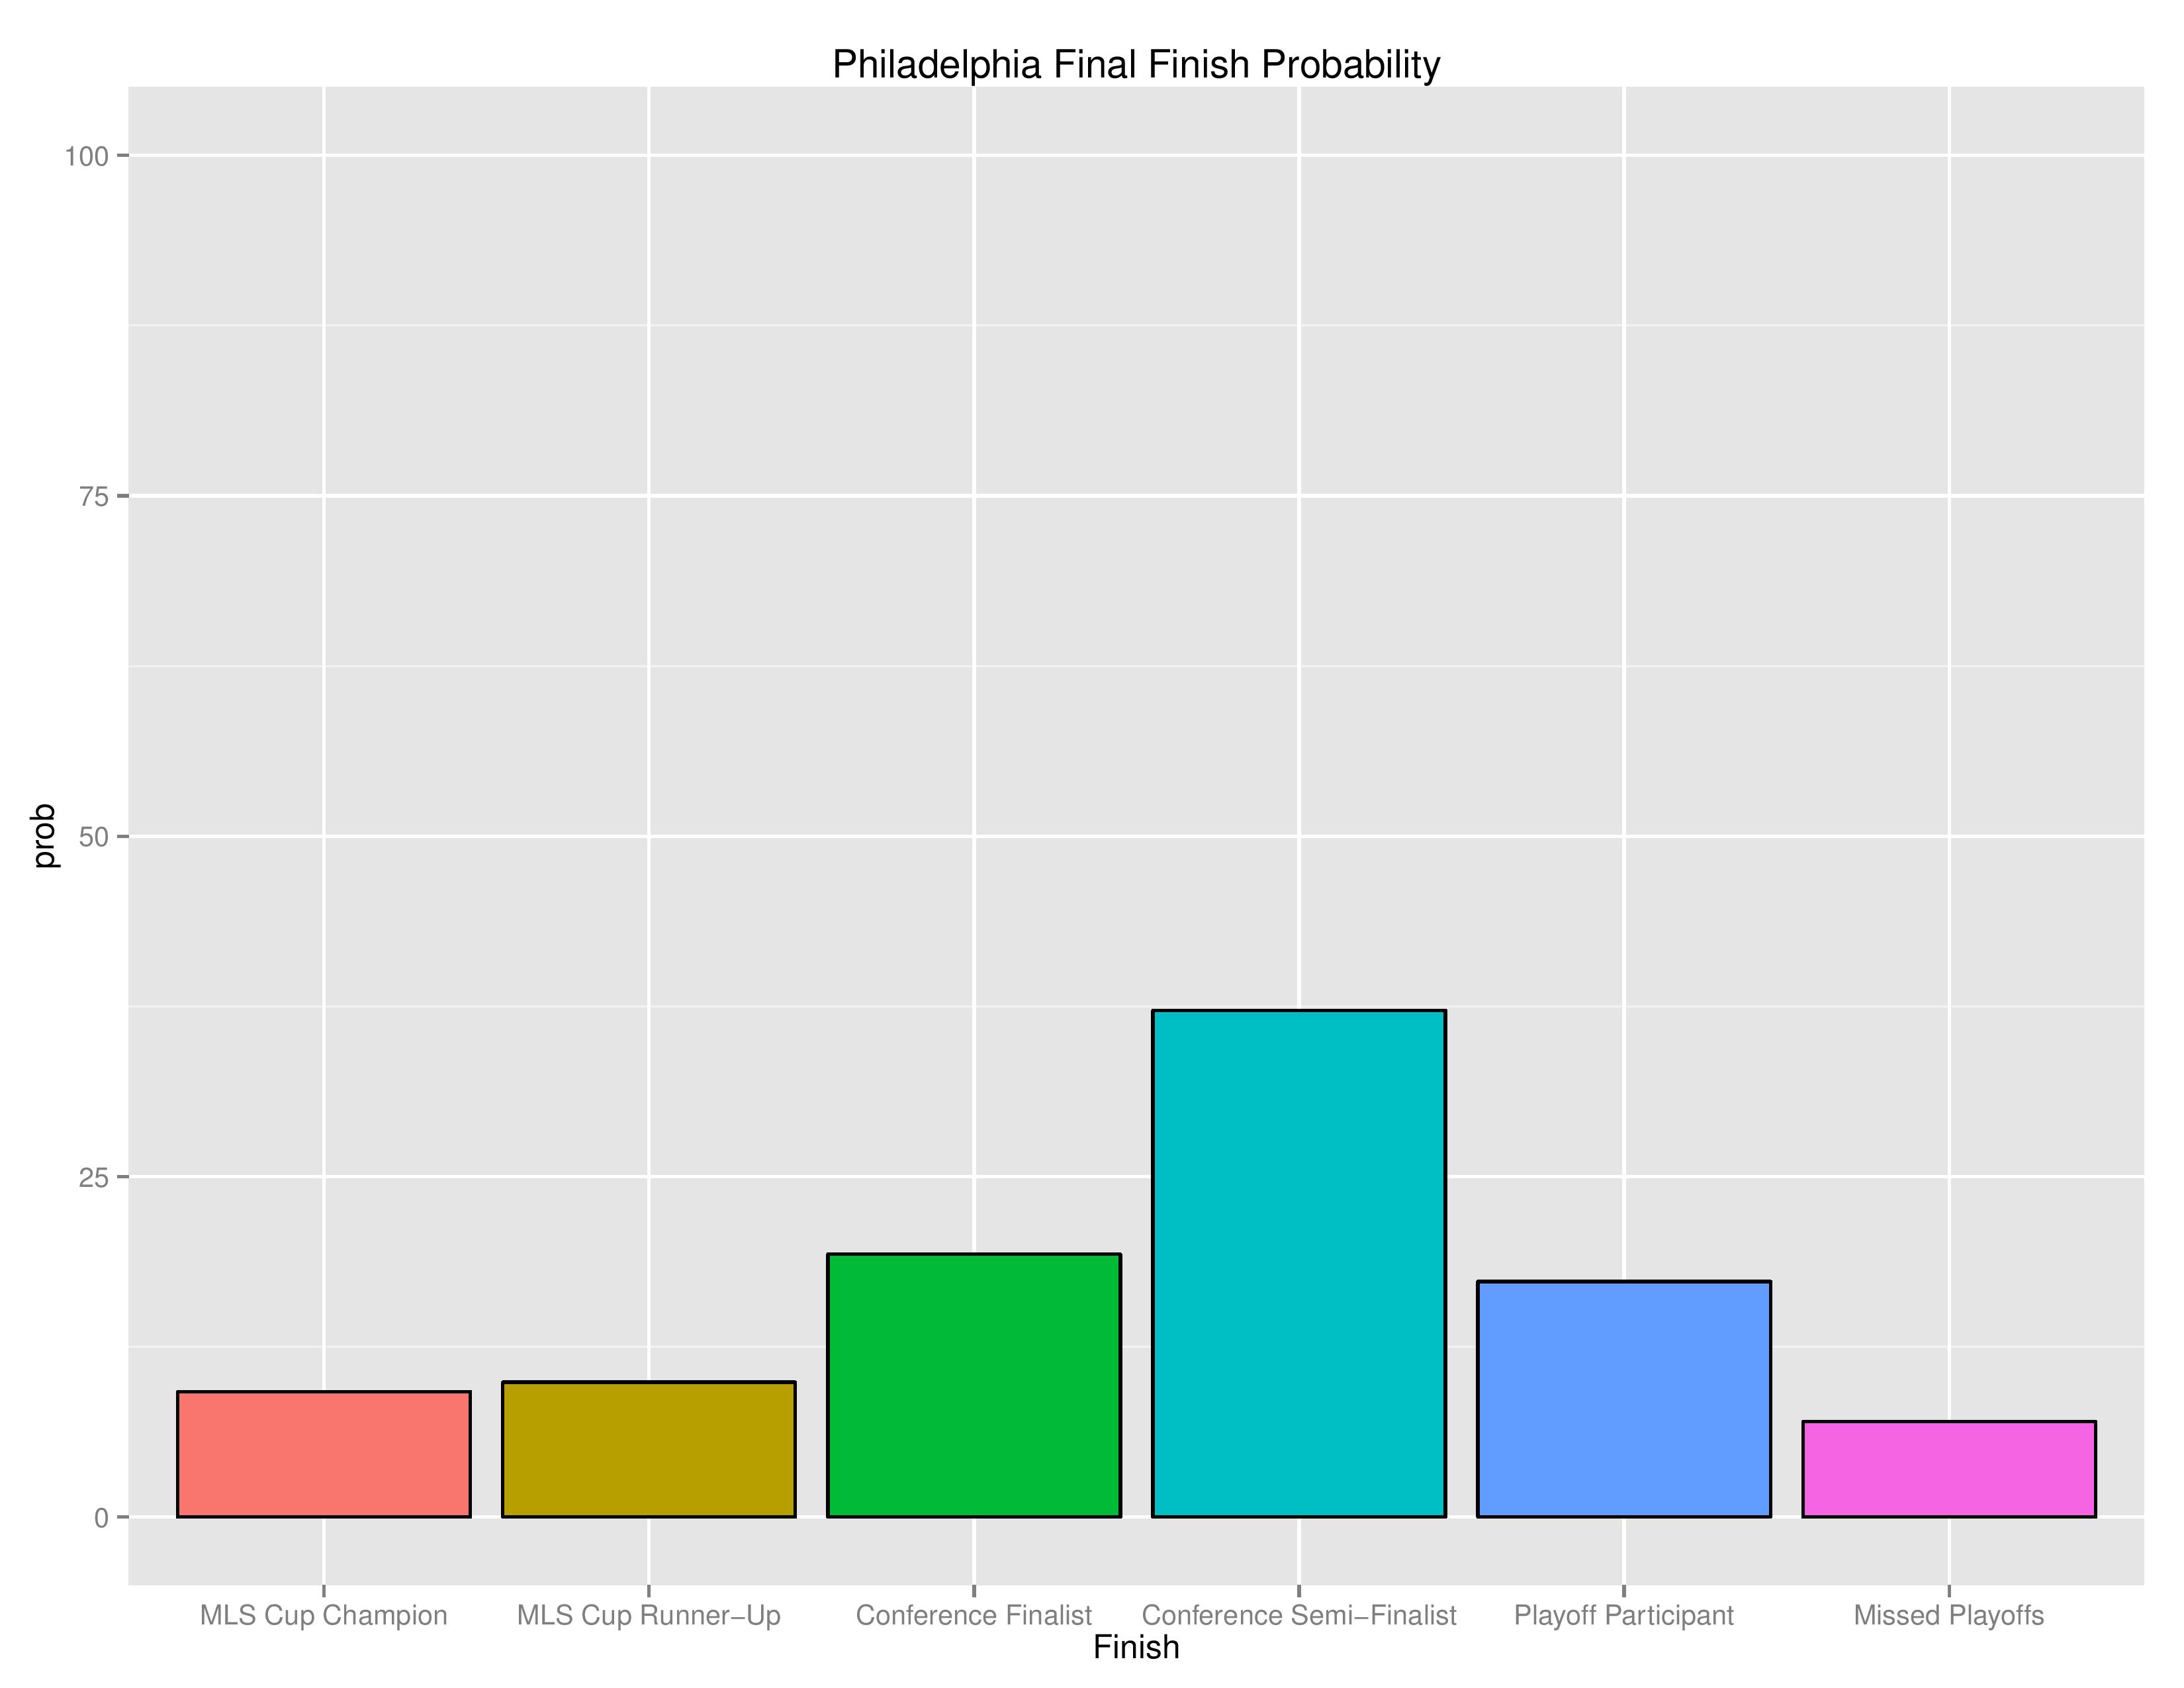
The following shows the probability of various Playoff categories and Philadelphia’s probability of each of them. This is the first week in which “MLS Champion” is a higher probability than “Missed Playoffs” despite there only being one champion but eight teams who miss the playoffs.
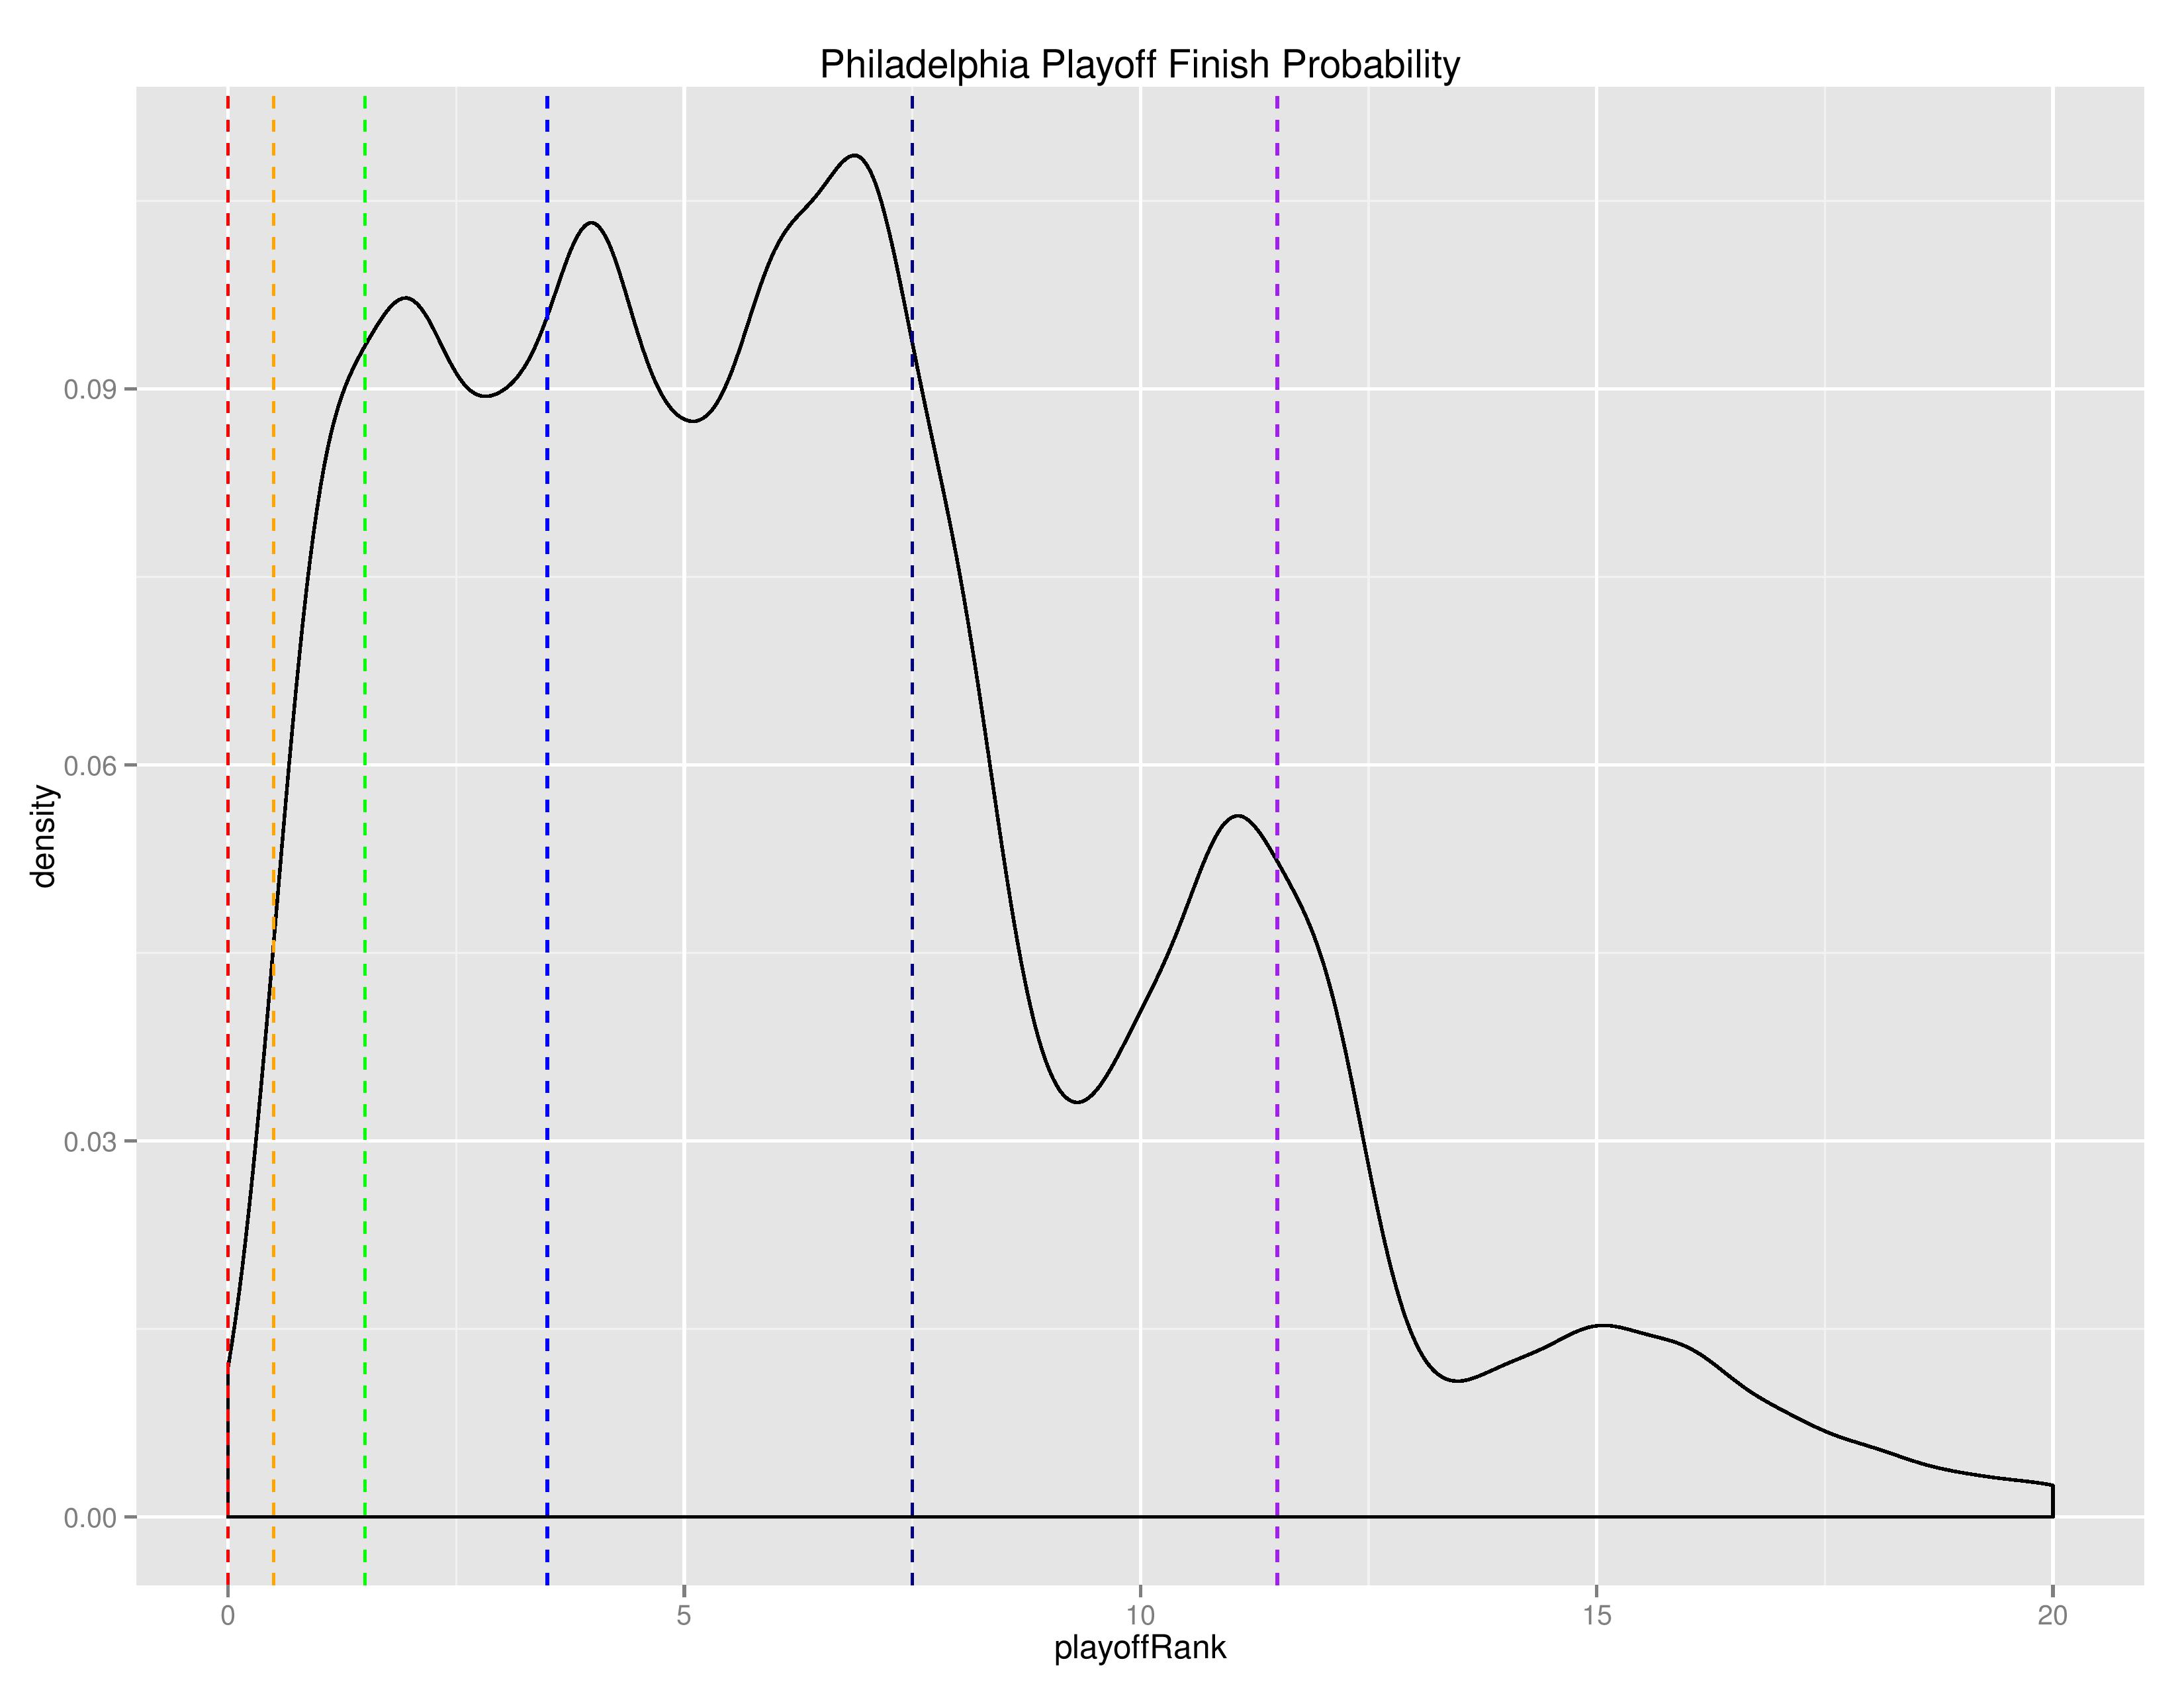
The following is a “density” chart showing the relative probability of Philadelphia finishing at the different after-playoffs rankings from 1 to 20.
To repeat myself, the loopy-ness you see in the higher ranks is likely due to the disparity in conference strength. If Philadelphia finishes in a higher round than a Western team, they are automatically ranked higher, but if they finish in the same round, Philadelphia will often be ranked lower (based on regular season single-table finishing).
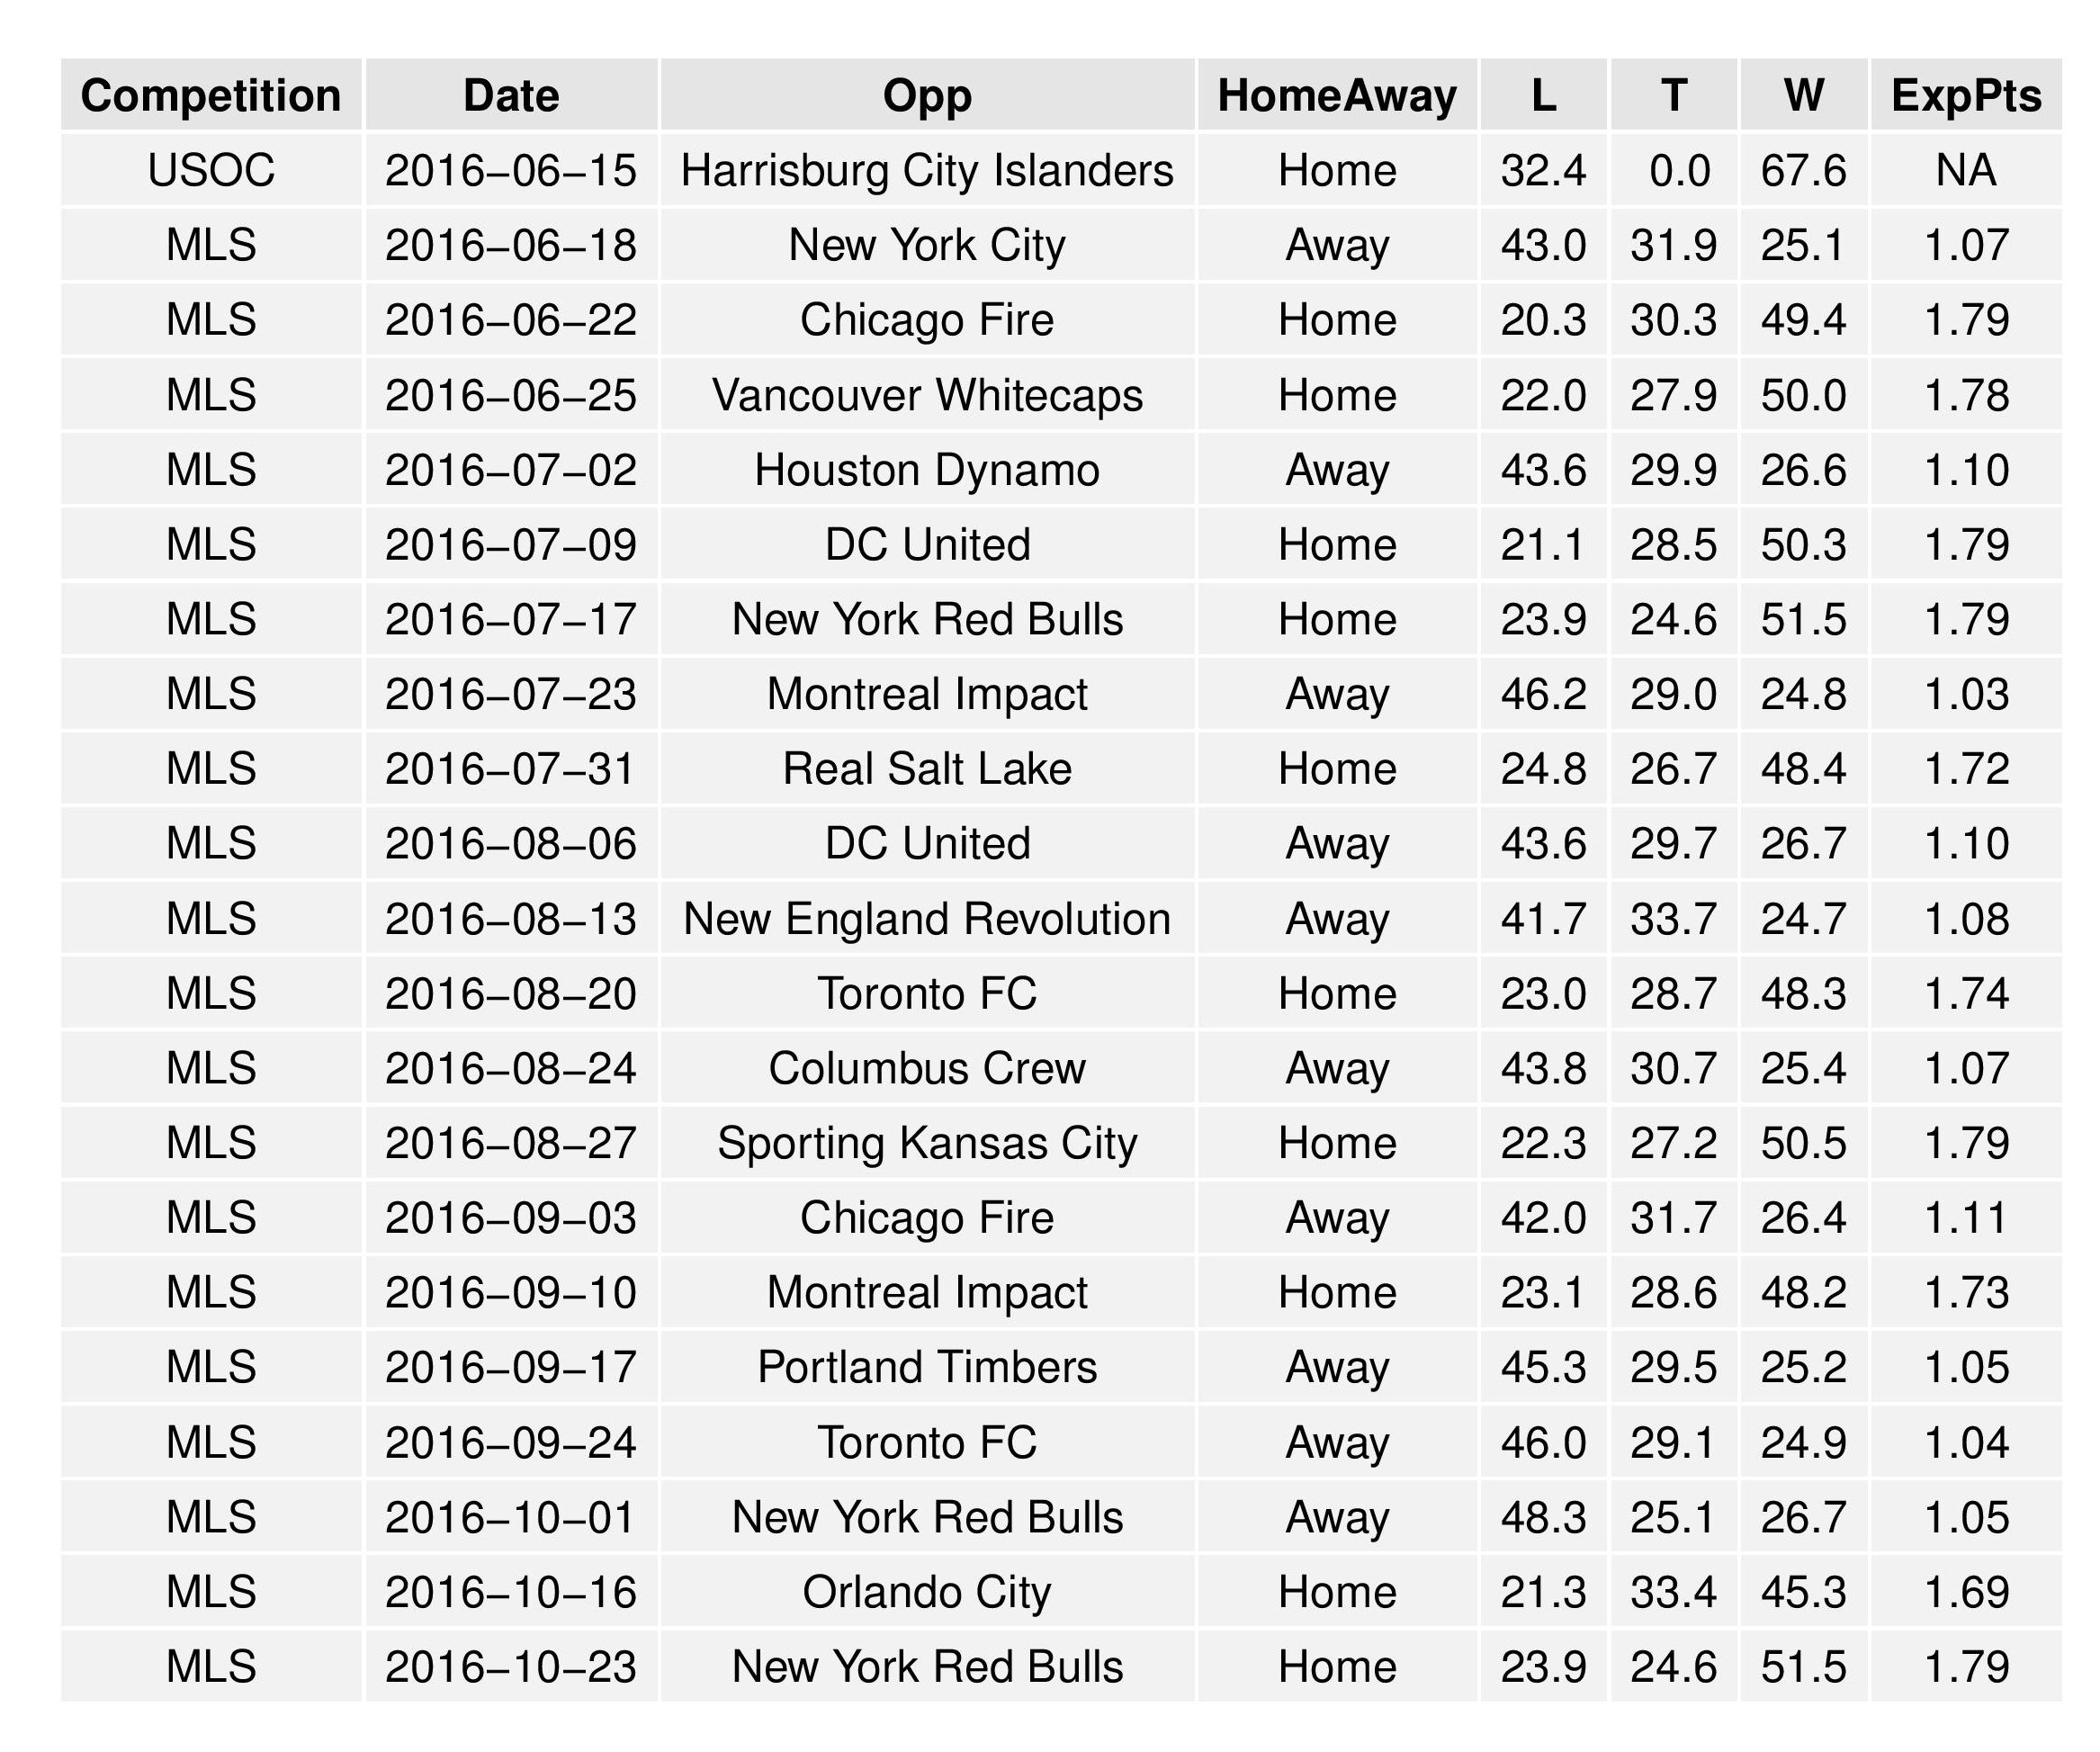
The following is the list of Philadelphia’s remaining scheduled matches accompanied by result probabilities as predicted by SEBA.
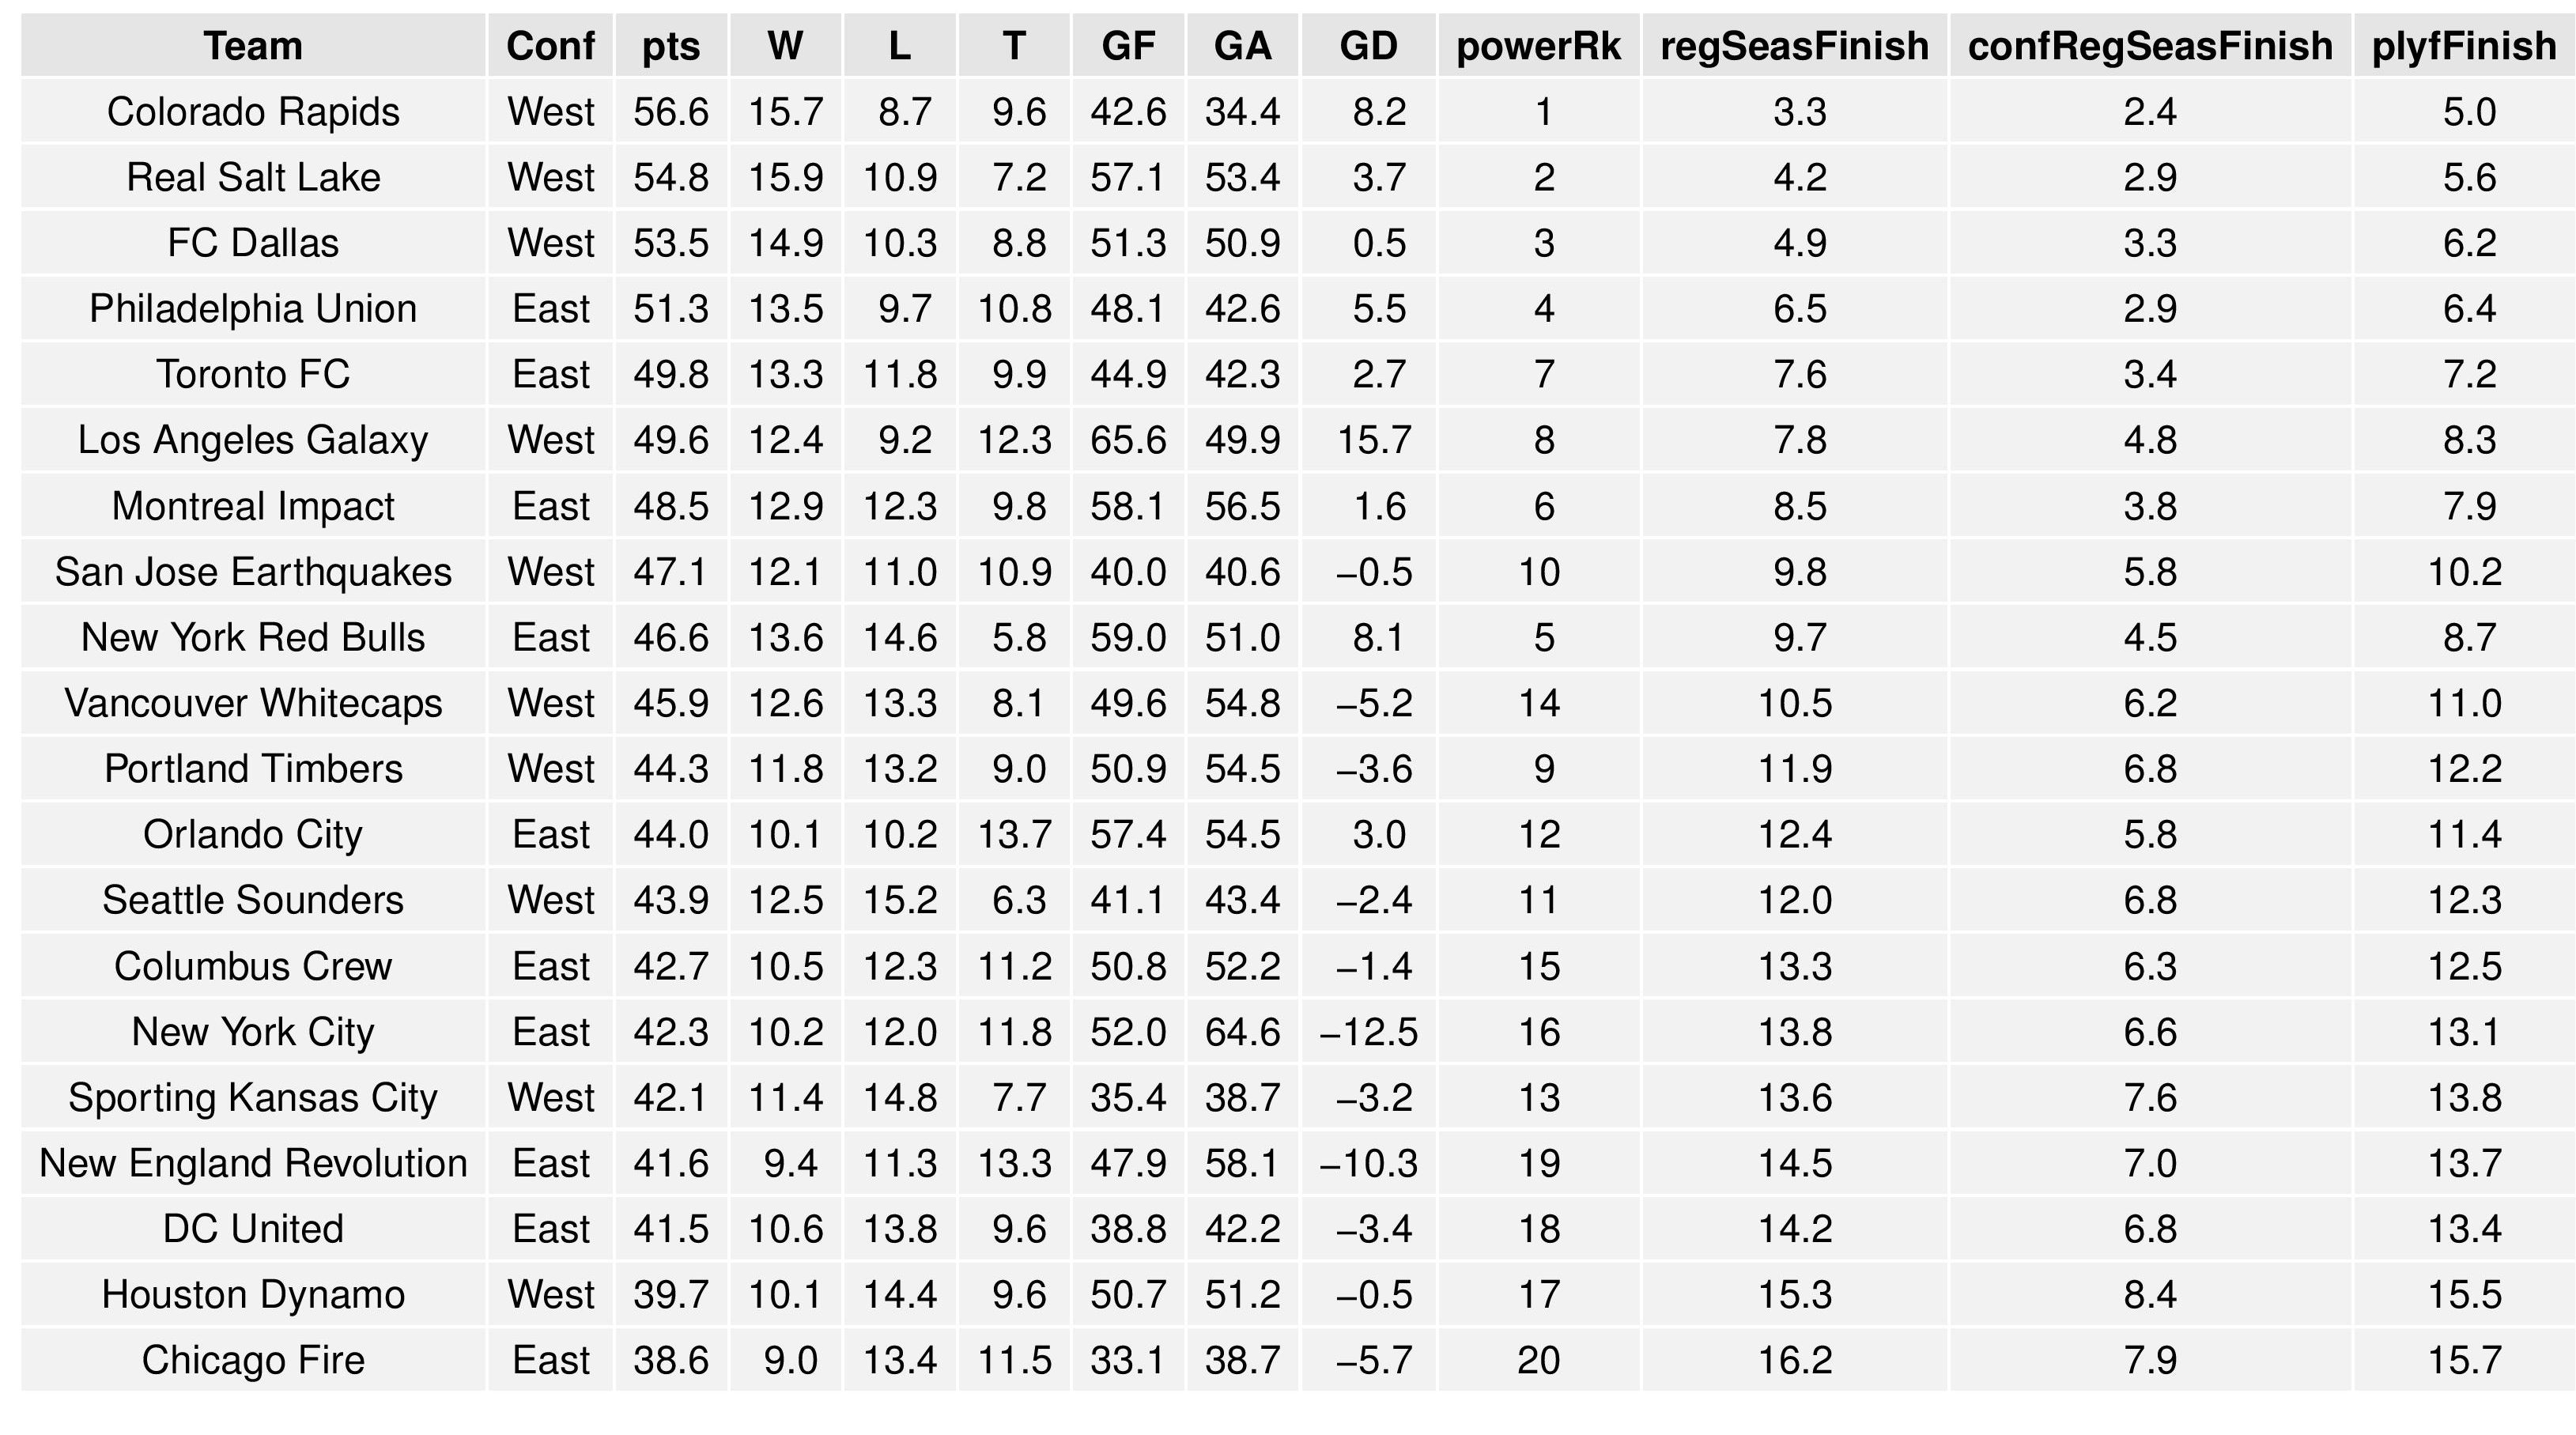
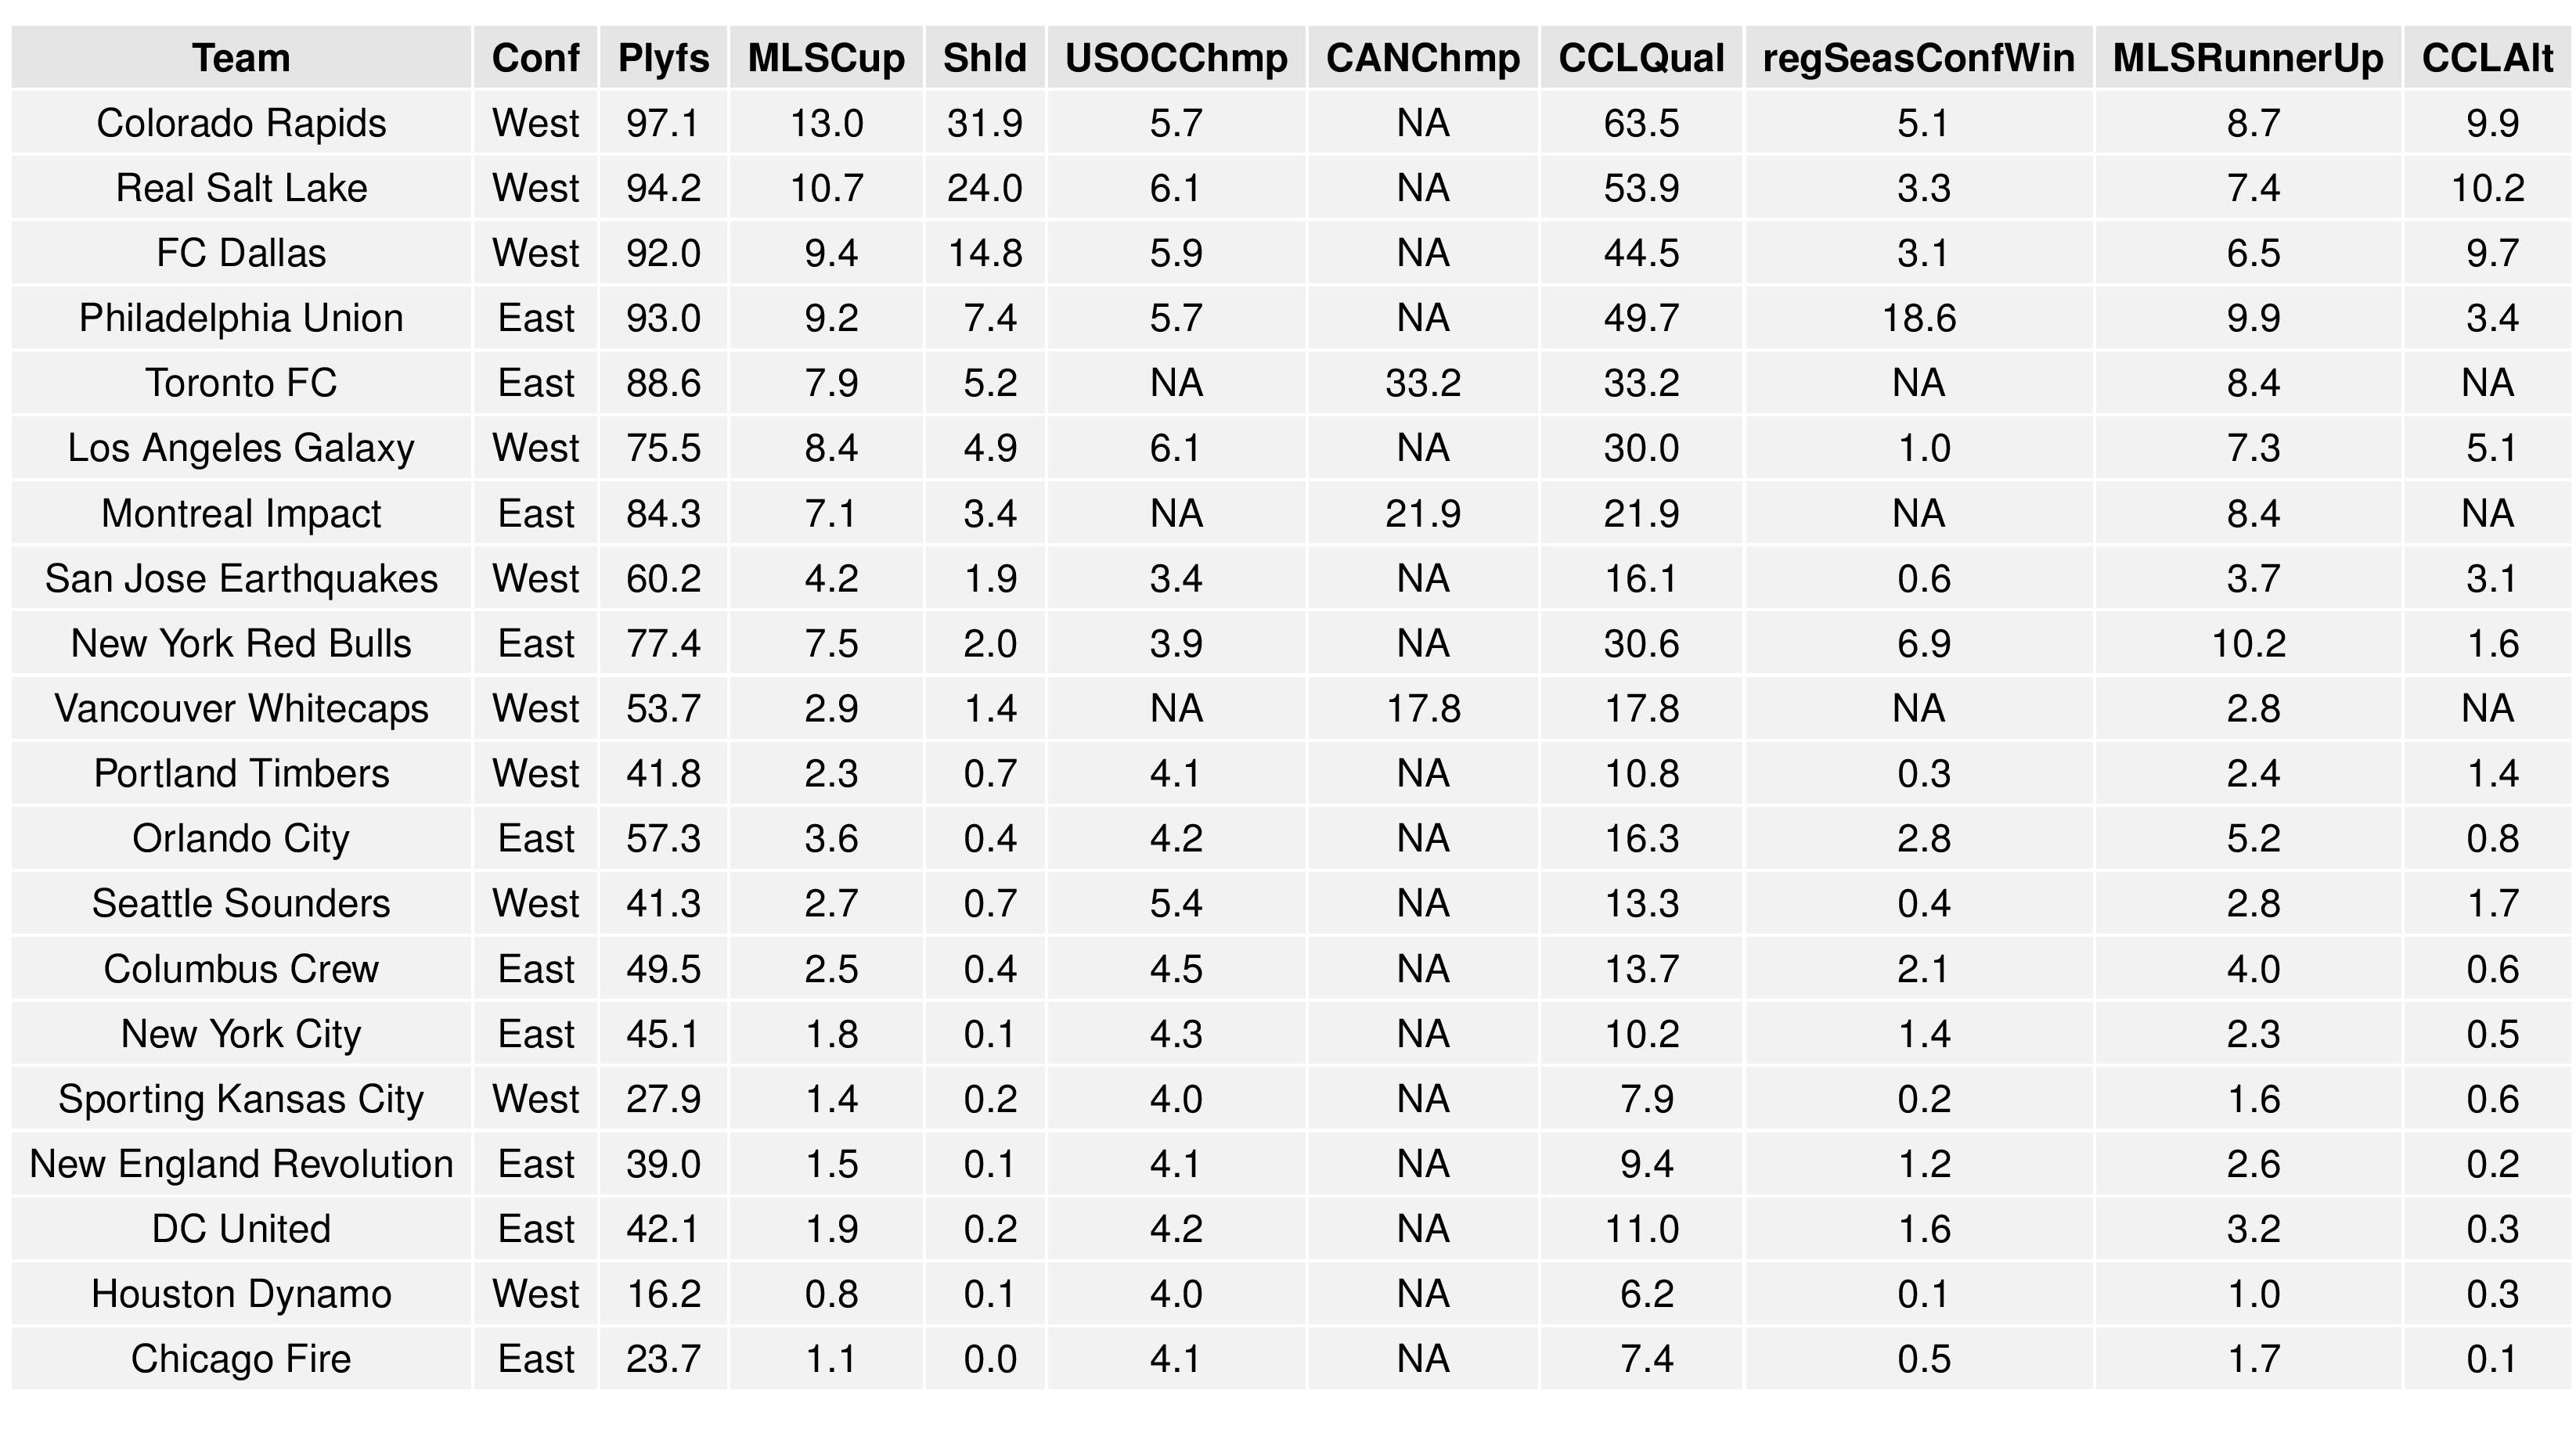
Finally, the charts below shows the average results of all the simulations and the probabilities associated with all of the above. The chart is broken up into two parts in order to better fit on your screen.
(Note: CCLAlternate refers to qualifying for CONCACAF Champions League non-traditionally. U.S. teams qualify by winning the MLS Cup, winning the Supporters’ Shield, winning the Conference in the regular season, and by winning the U.S. Open Cup. If a Canadian team wins any of these or a U.S. team wins more than one, the extra slots are filled by top regular season performers.)
USL Projections
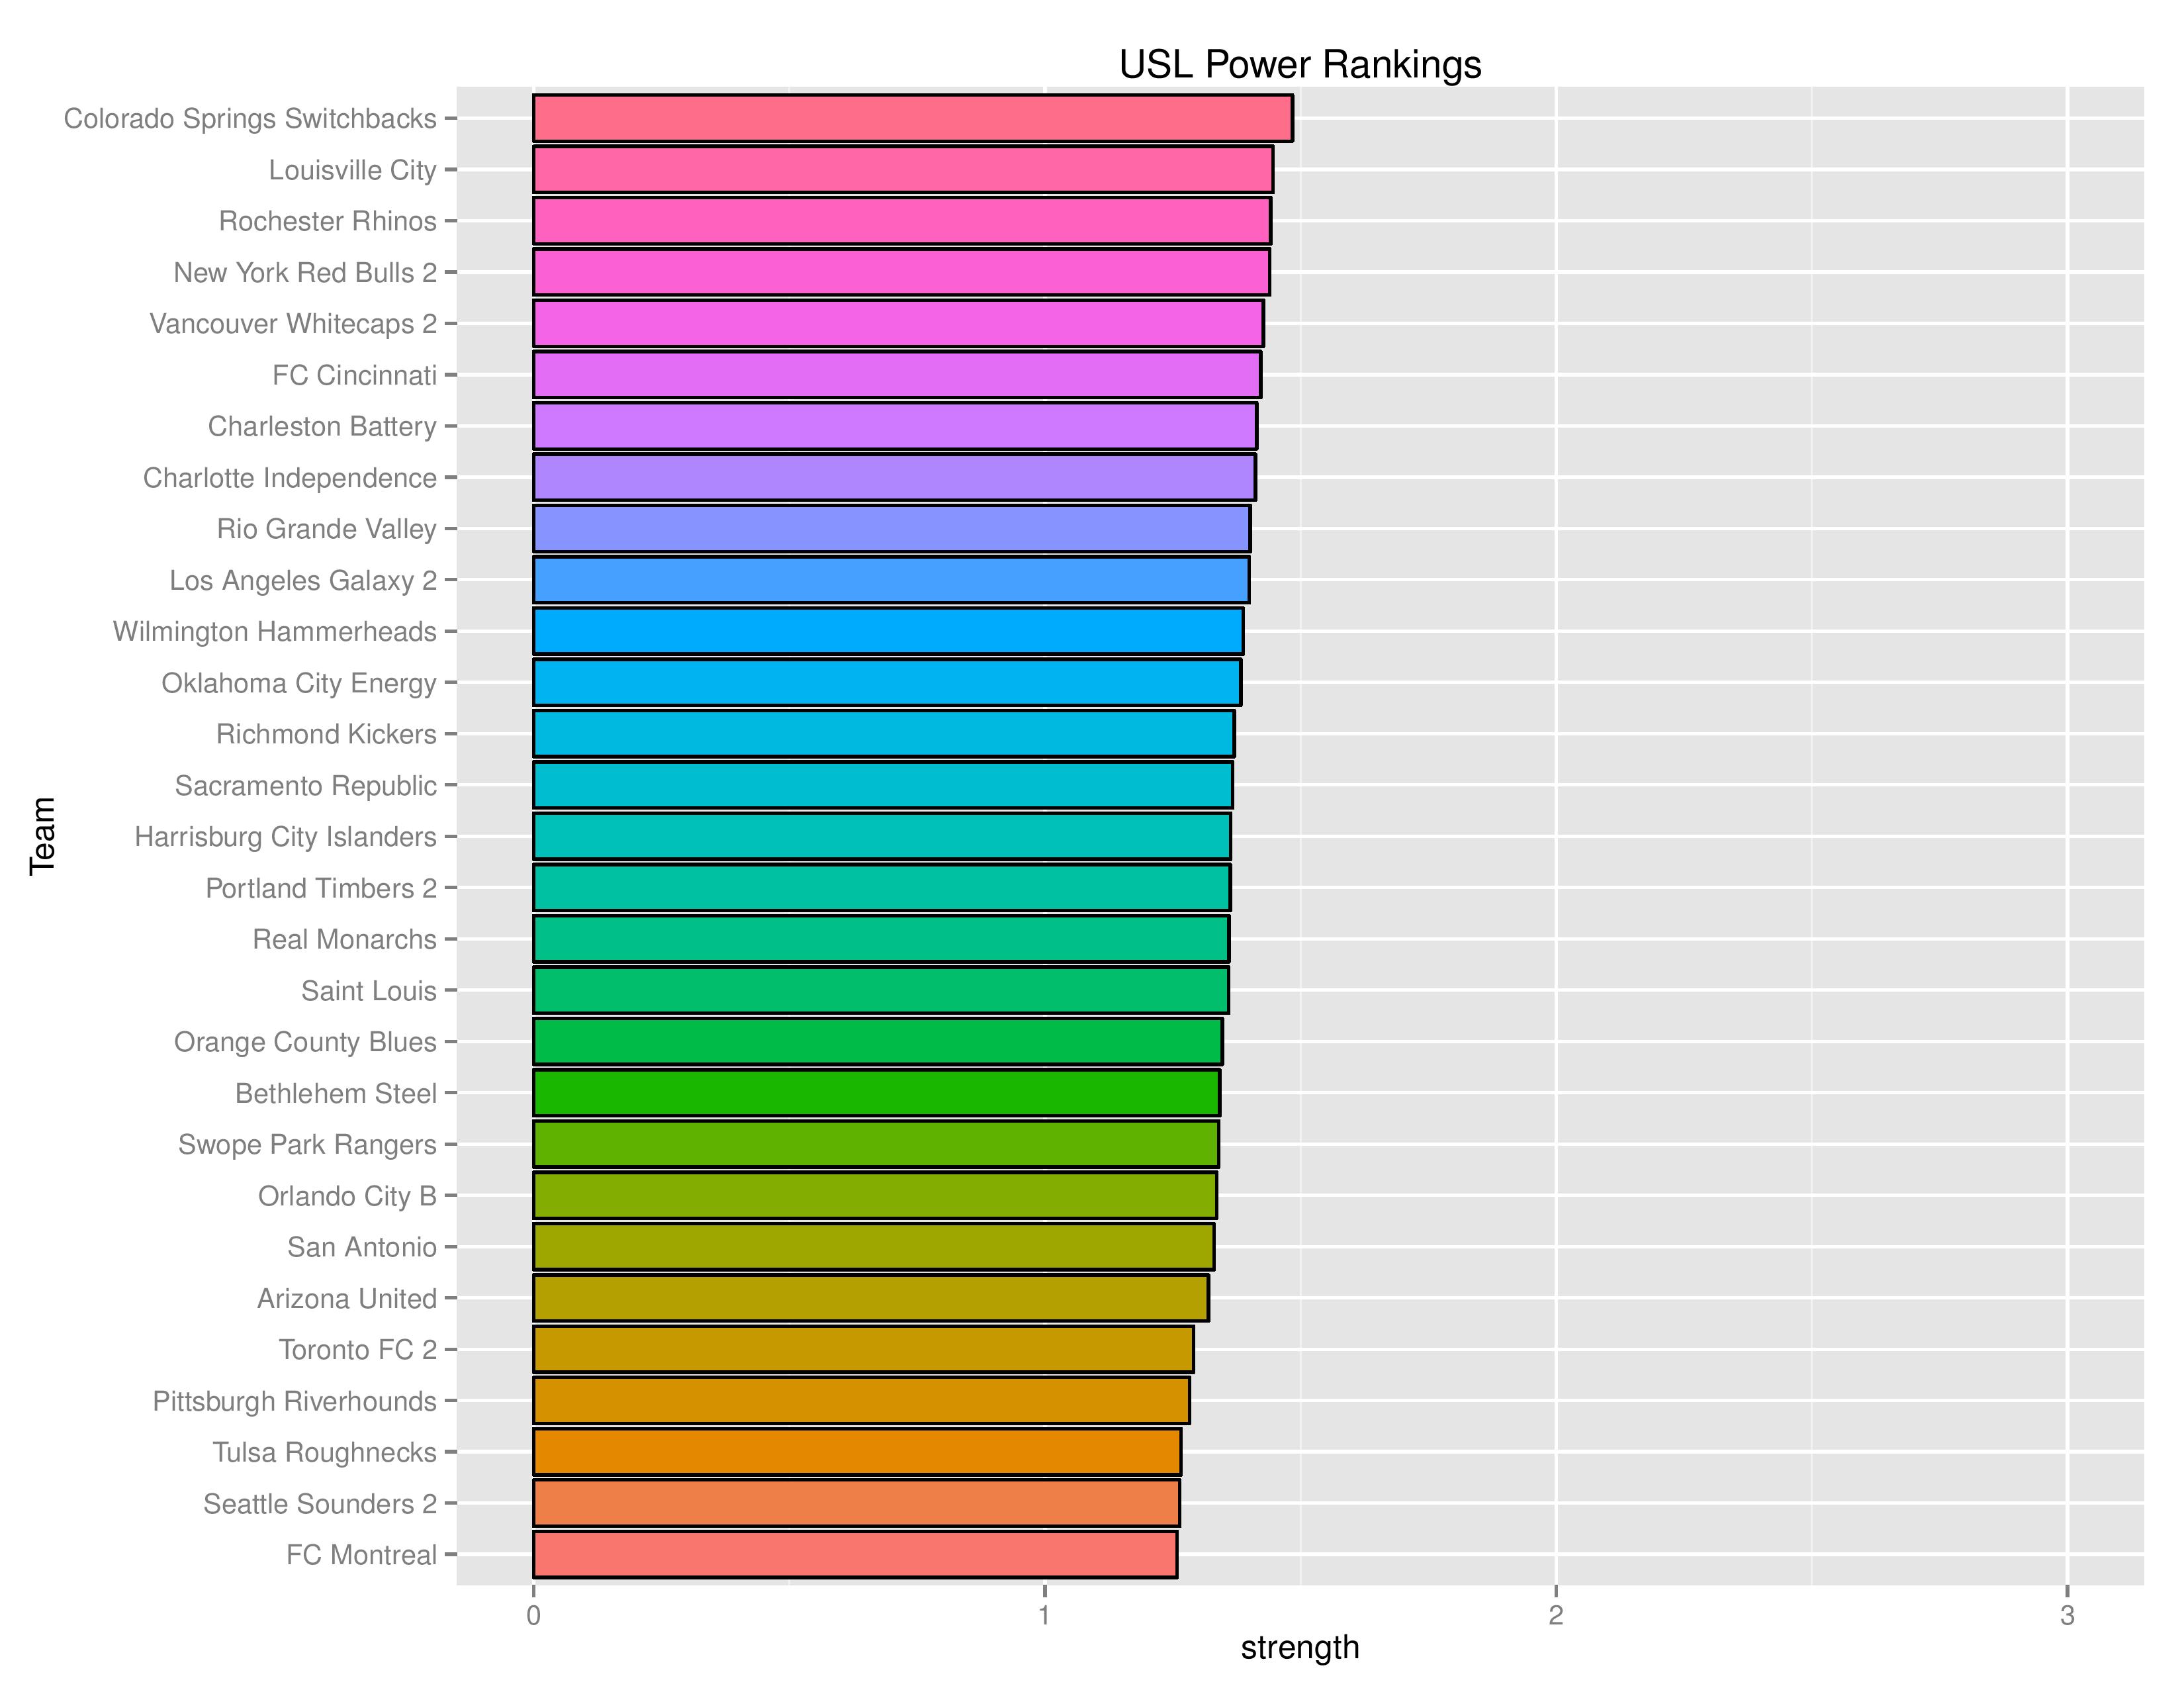
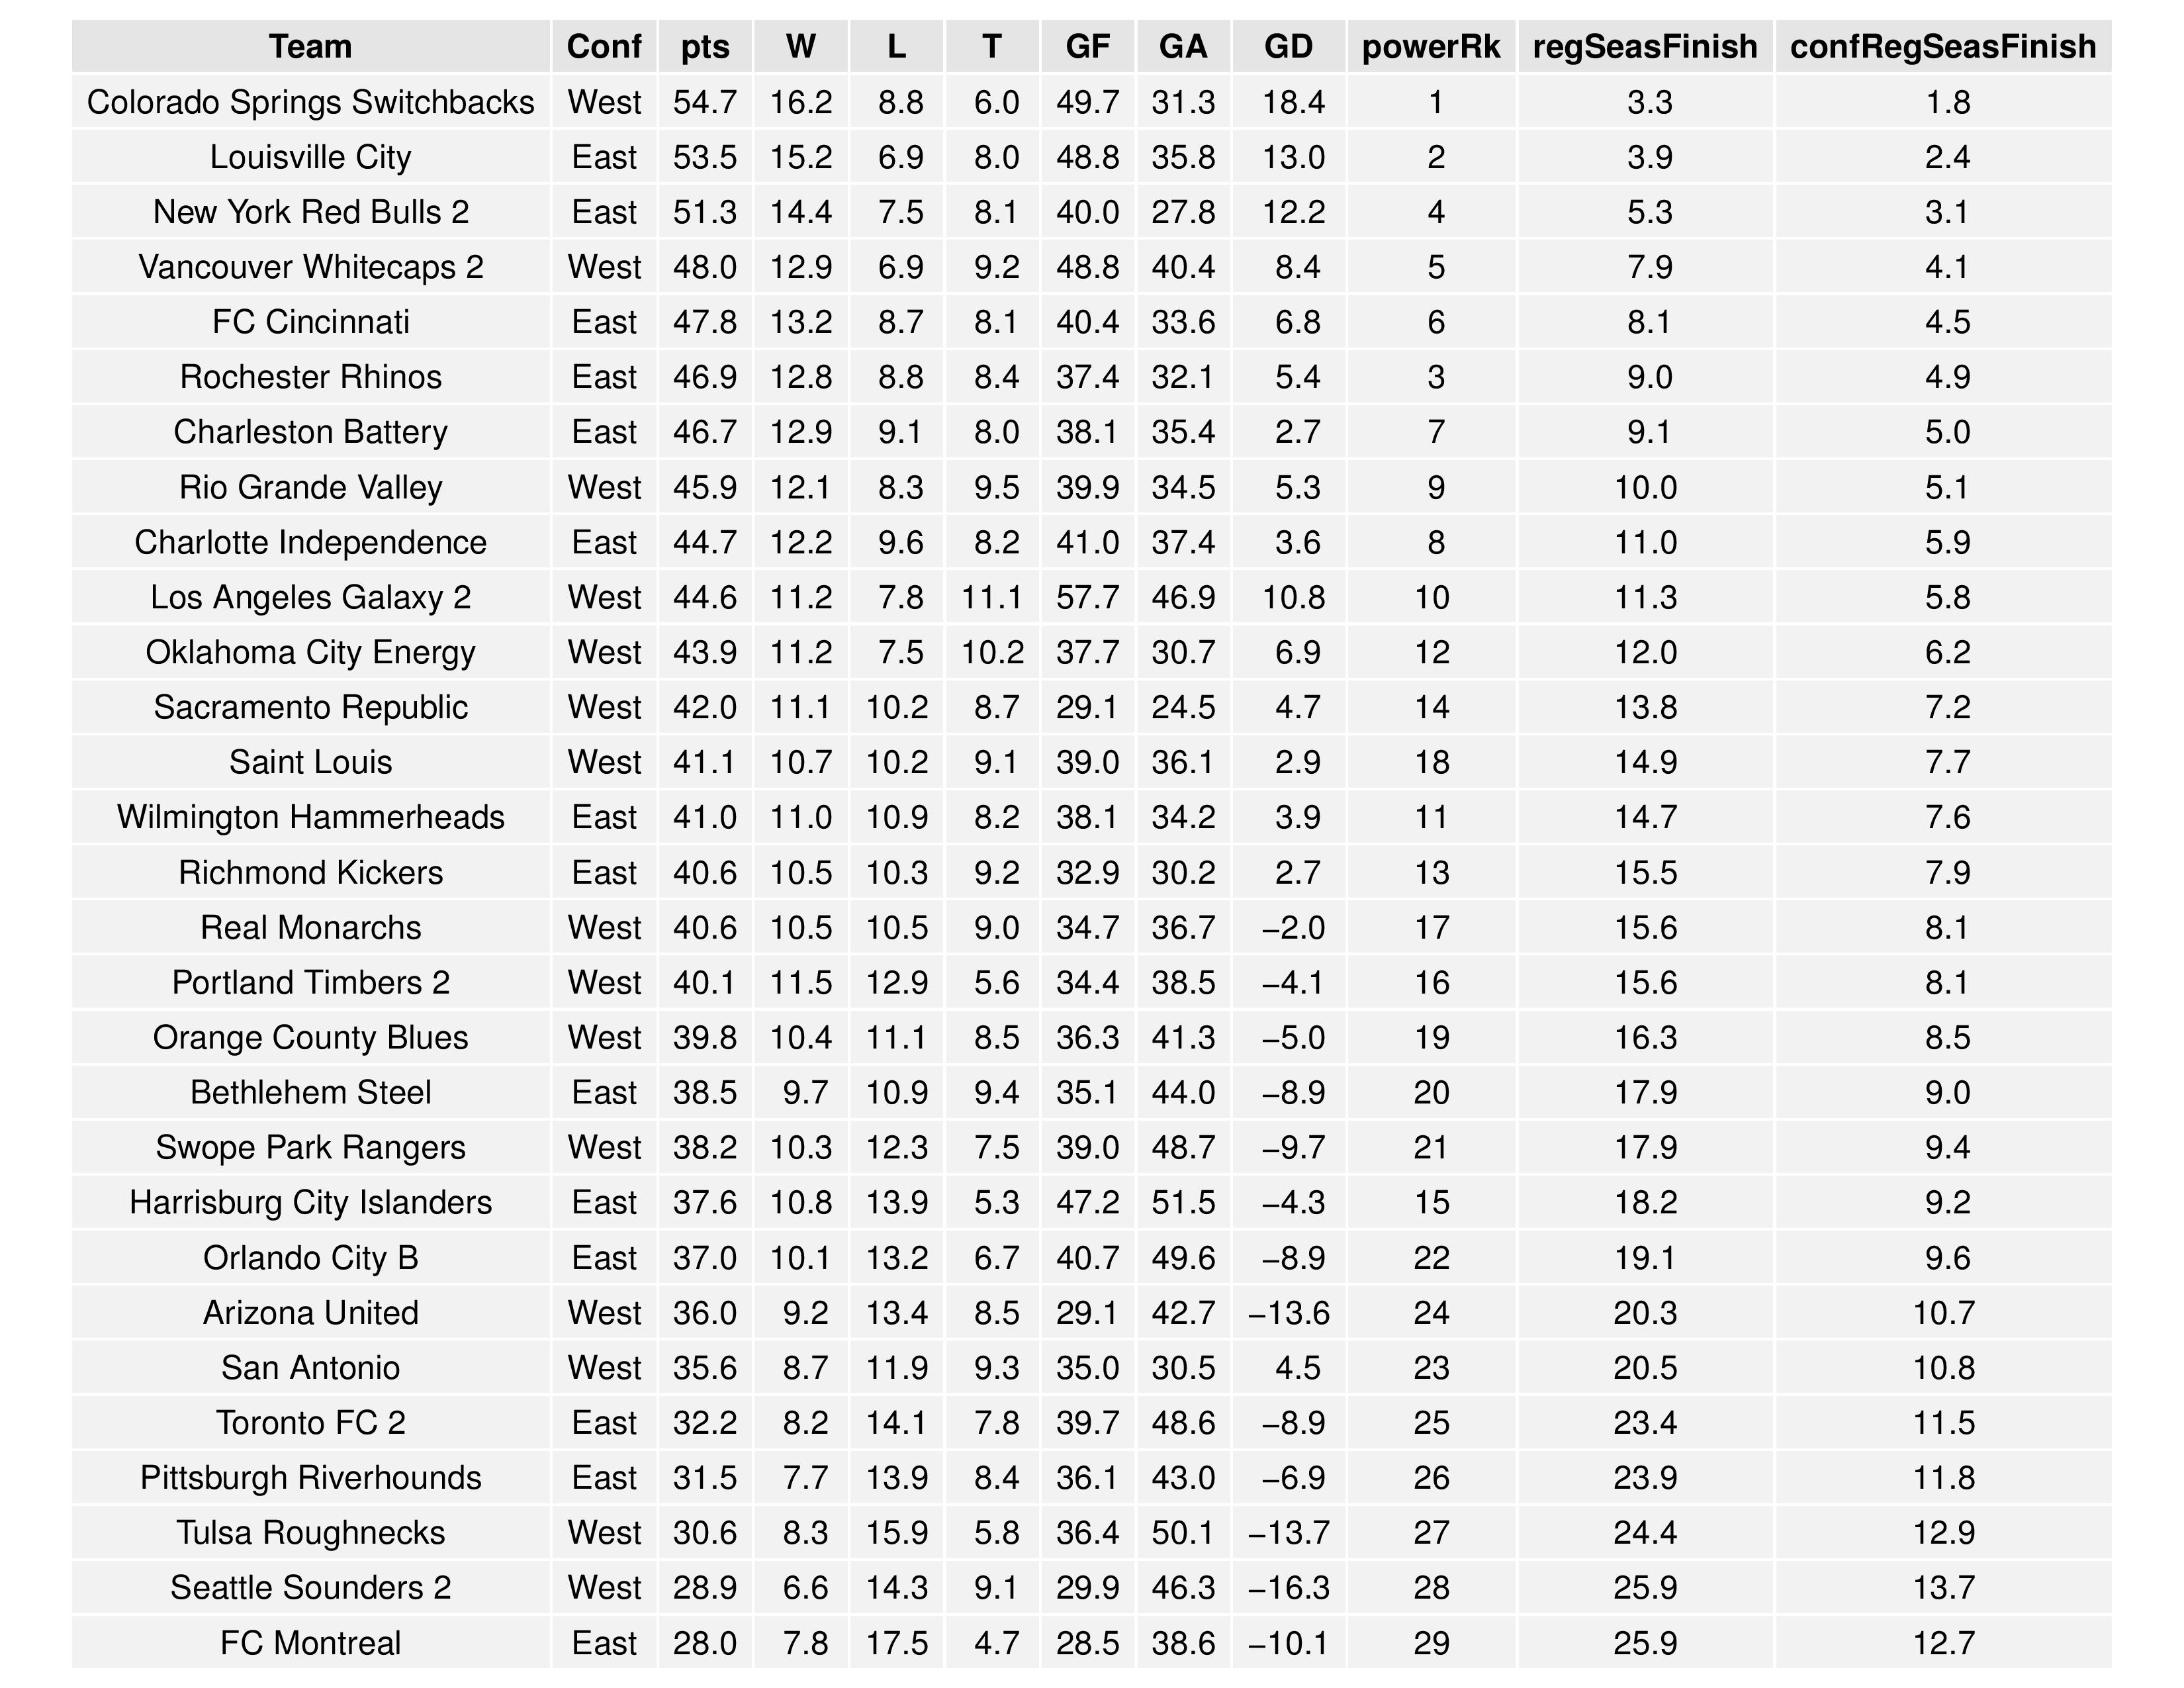
Bethlehem moves down from 16th to 20th and Harrisburg City Islanders remain at 15th.
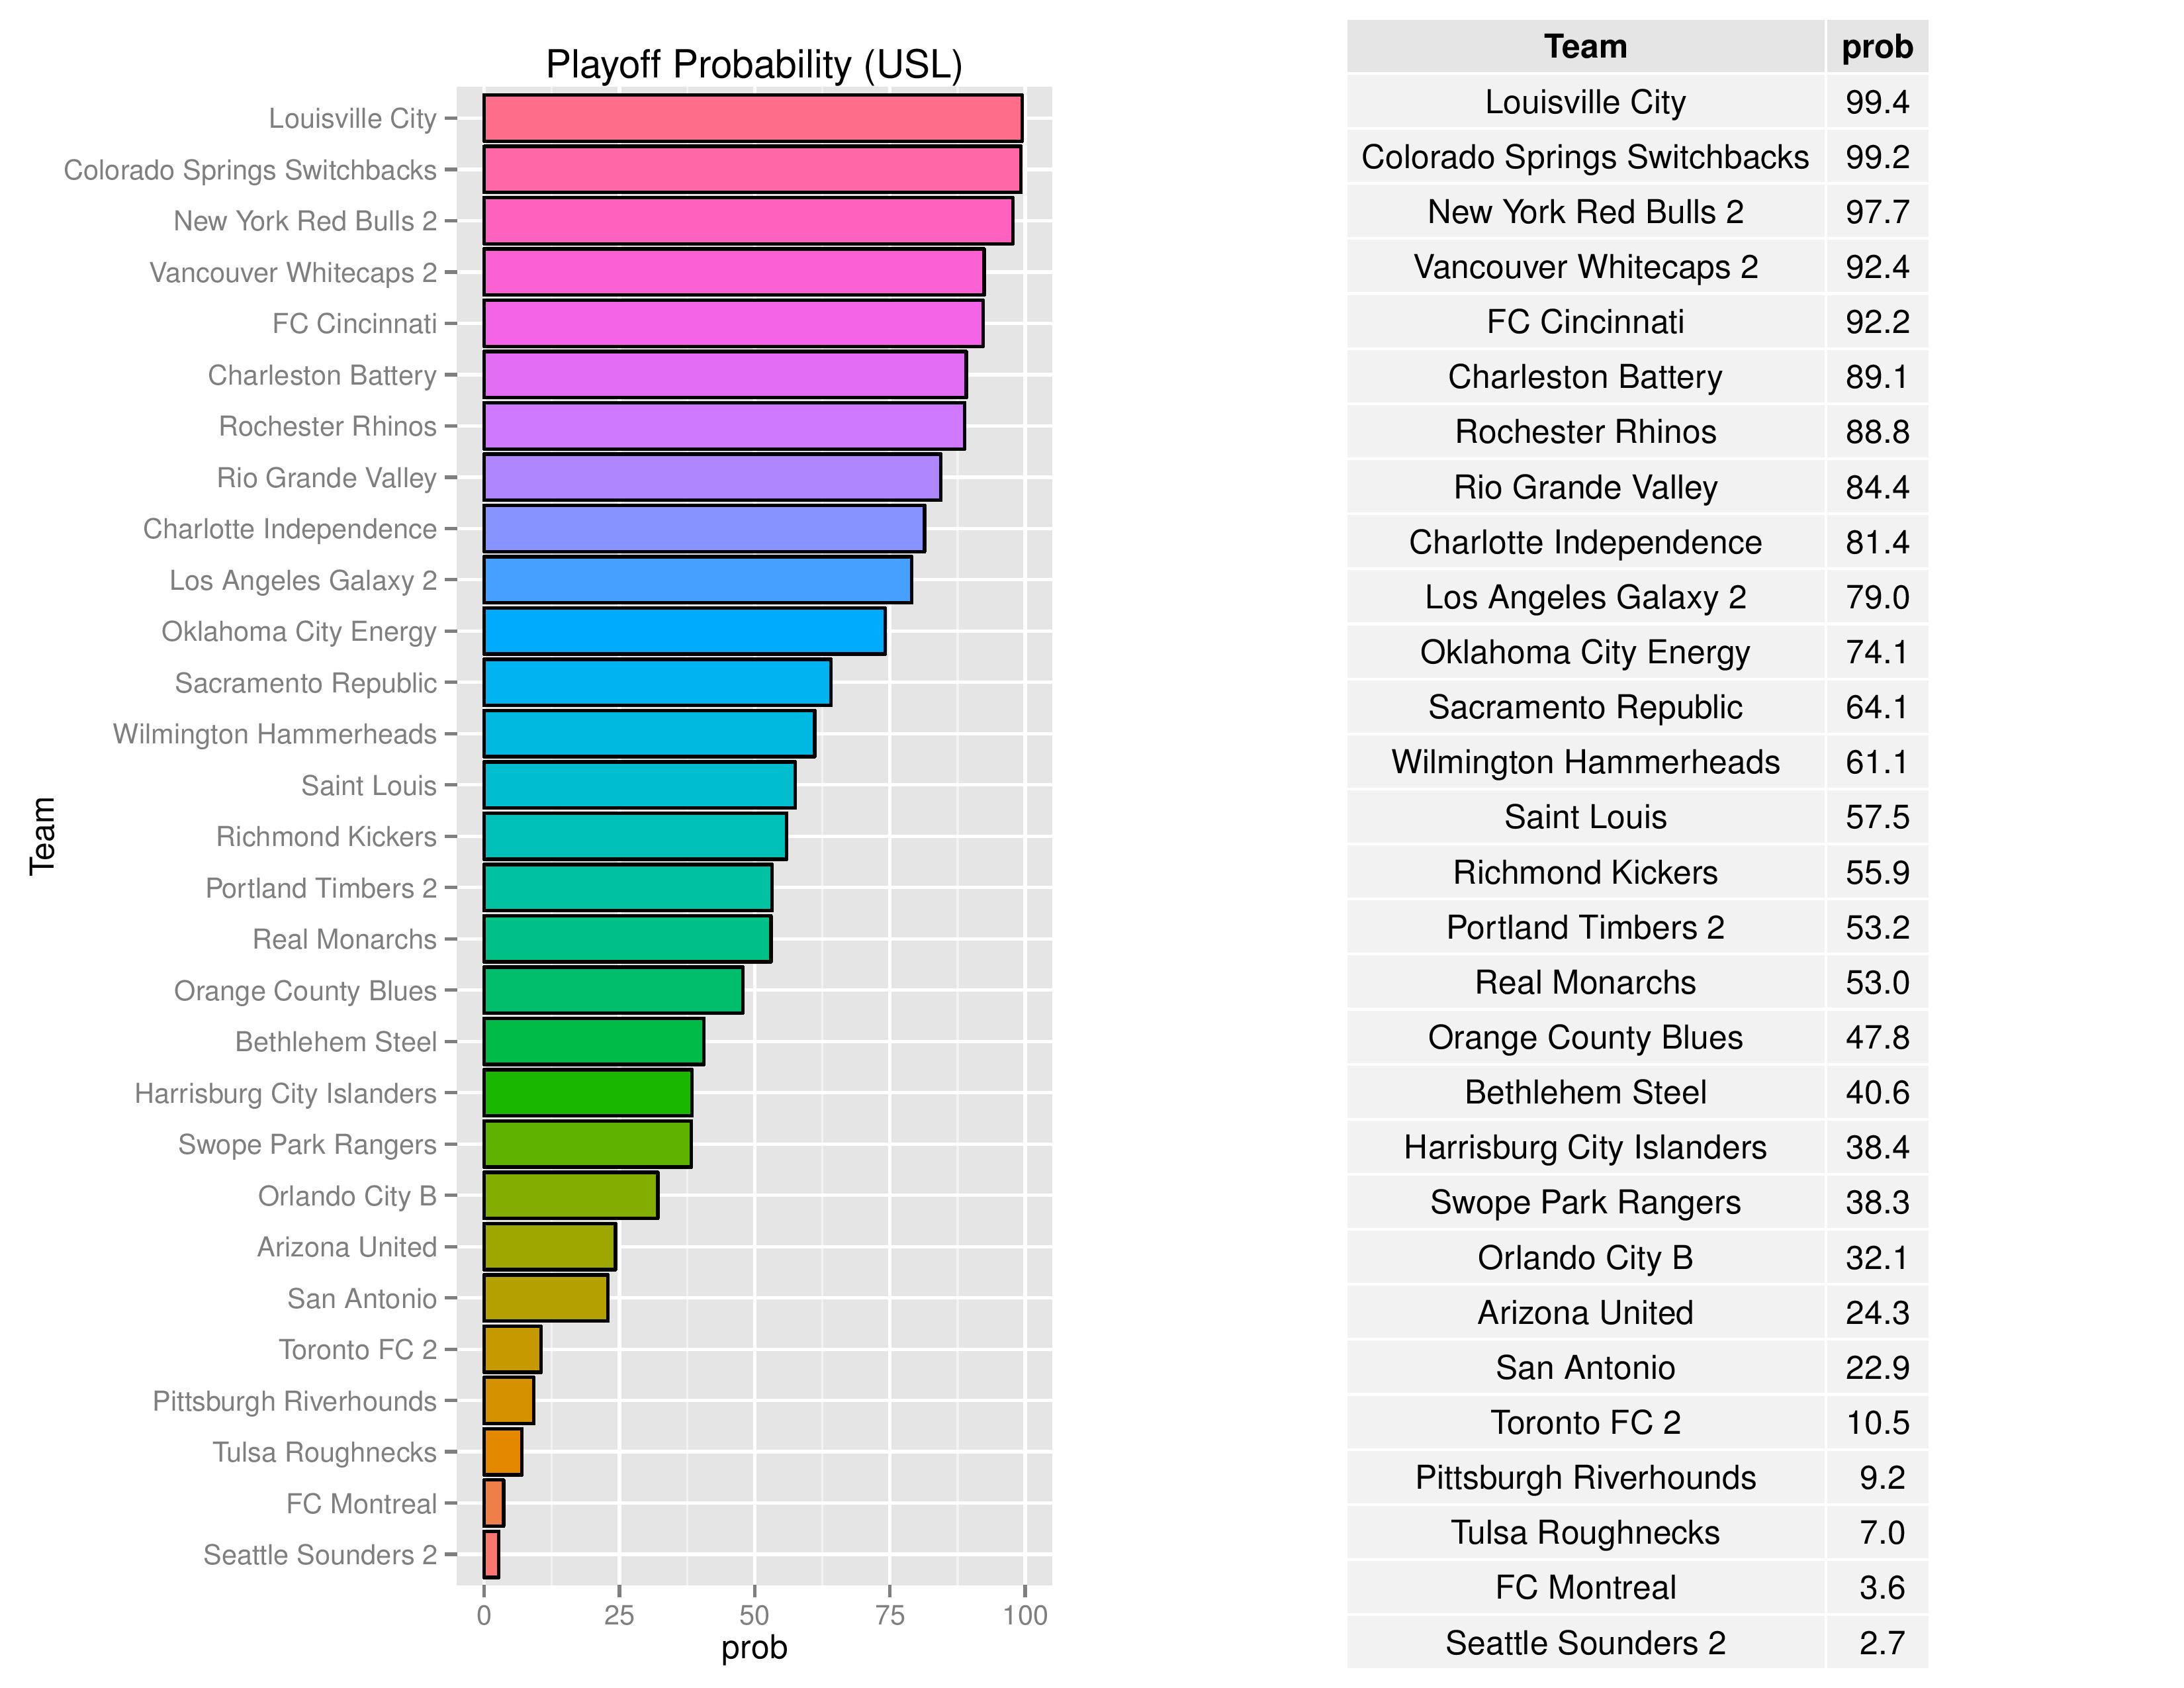
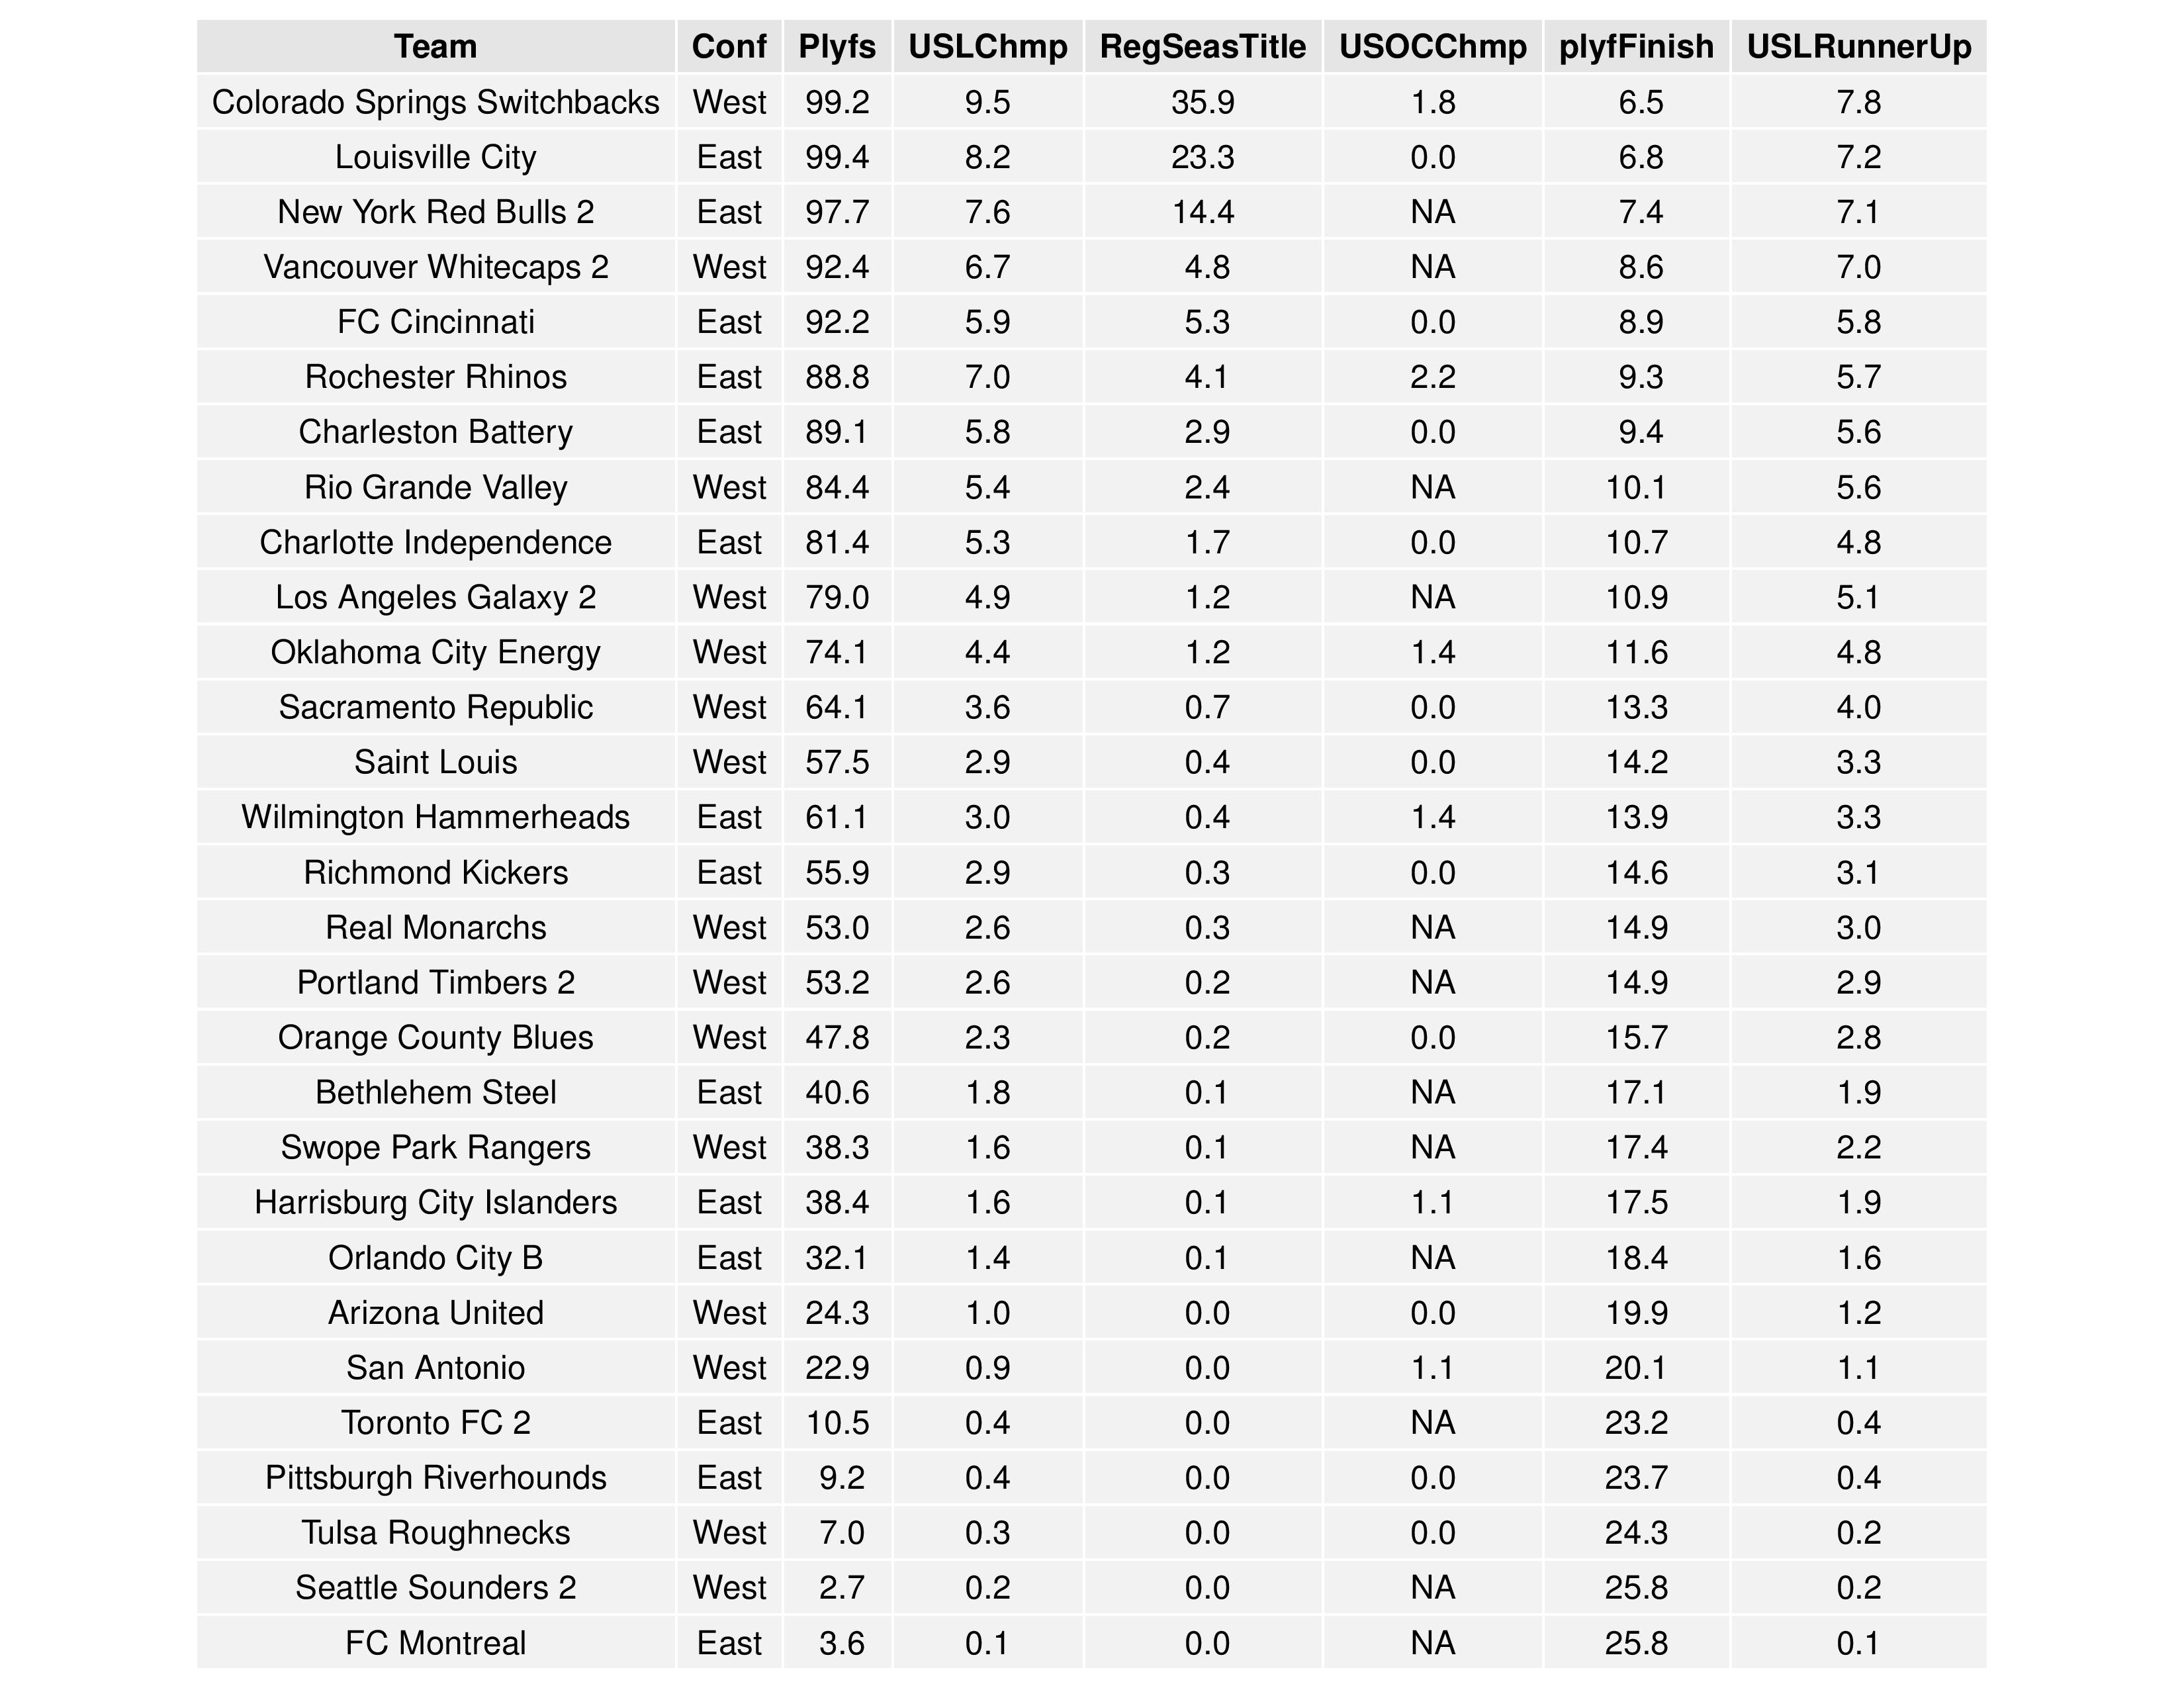
Bethlehem’s probability of making the playoffs went down significantly from 50.3% to 40.6%. Harrisburg’s chances also went down significantly from 46.1% to 38.4%.
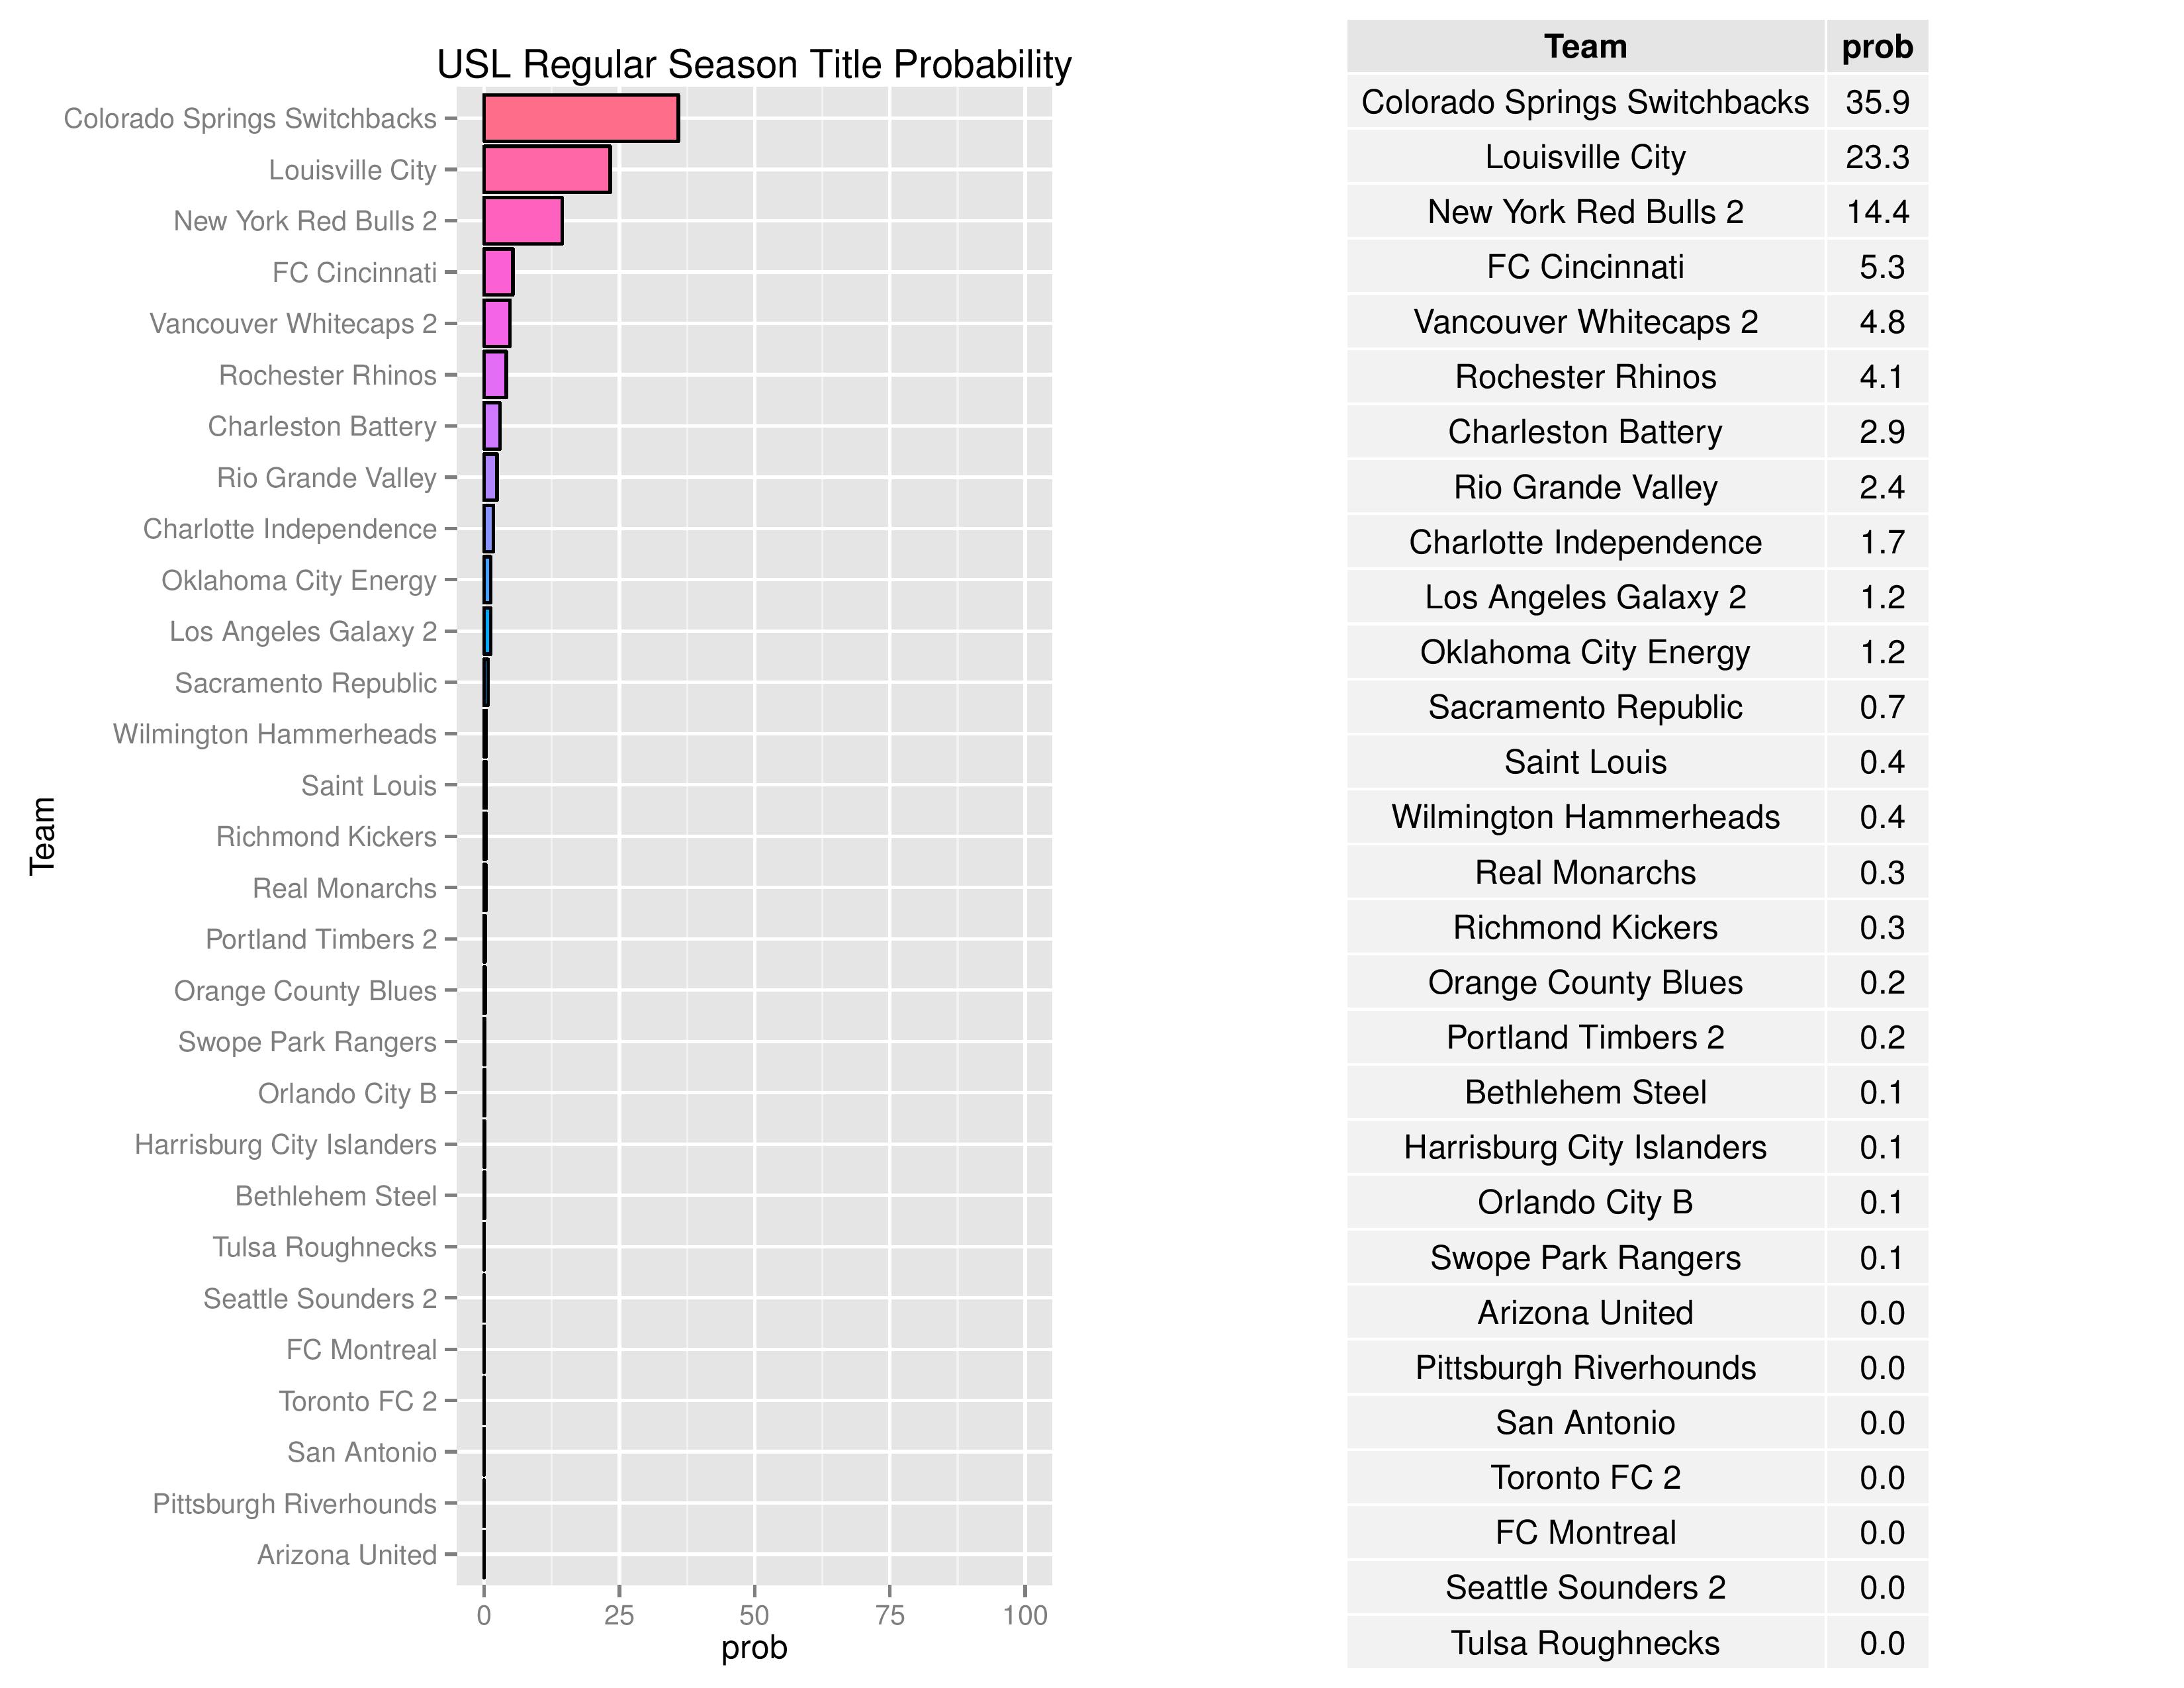
Both Bethlehem and Harrisburg City continue to have negligent chances of winning the USL Regular Season Title.
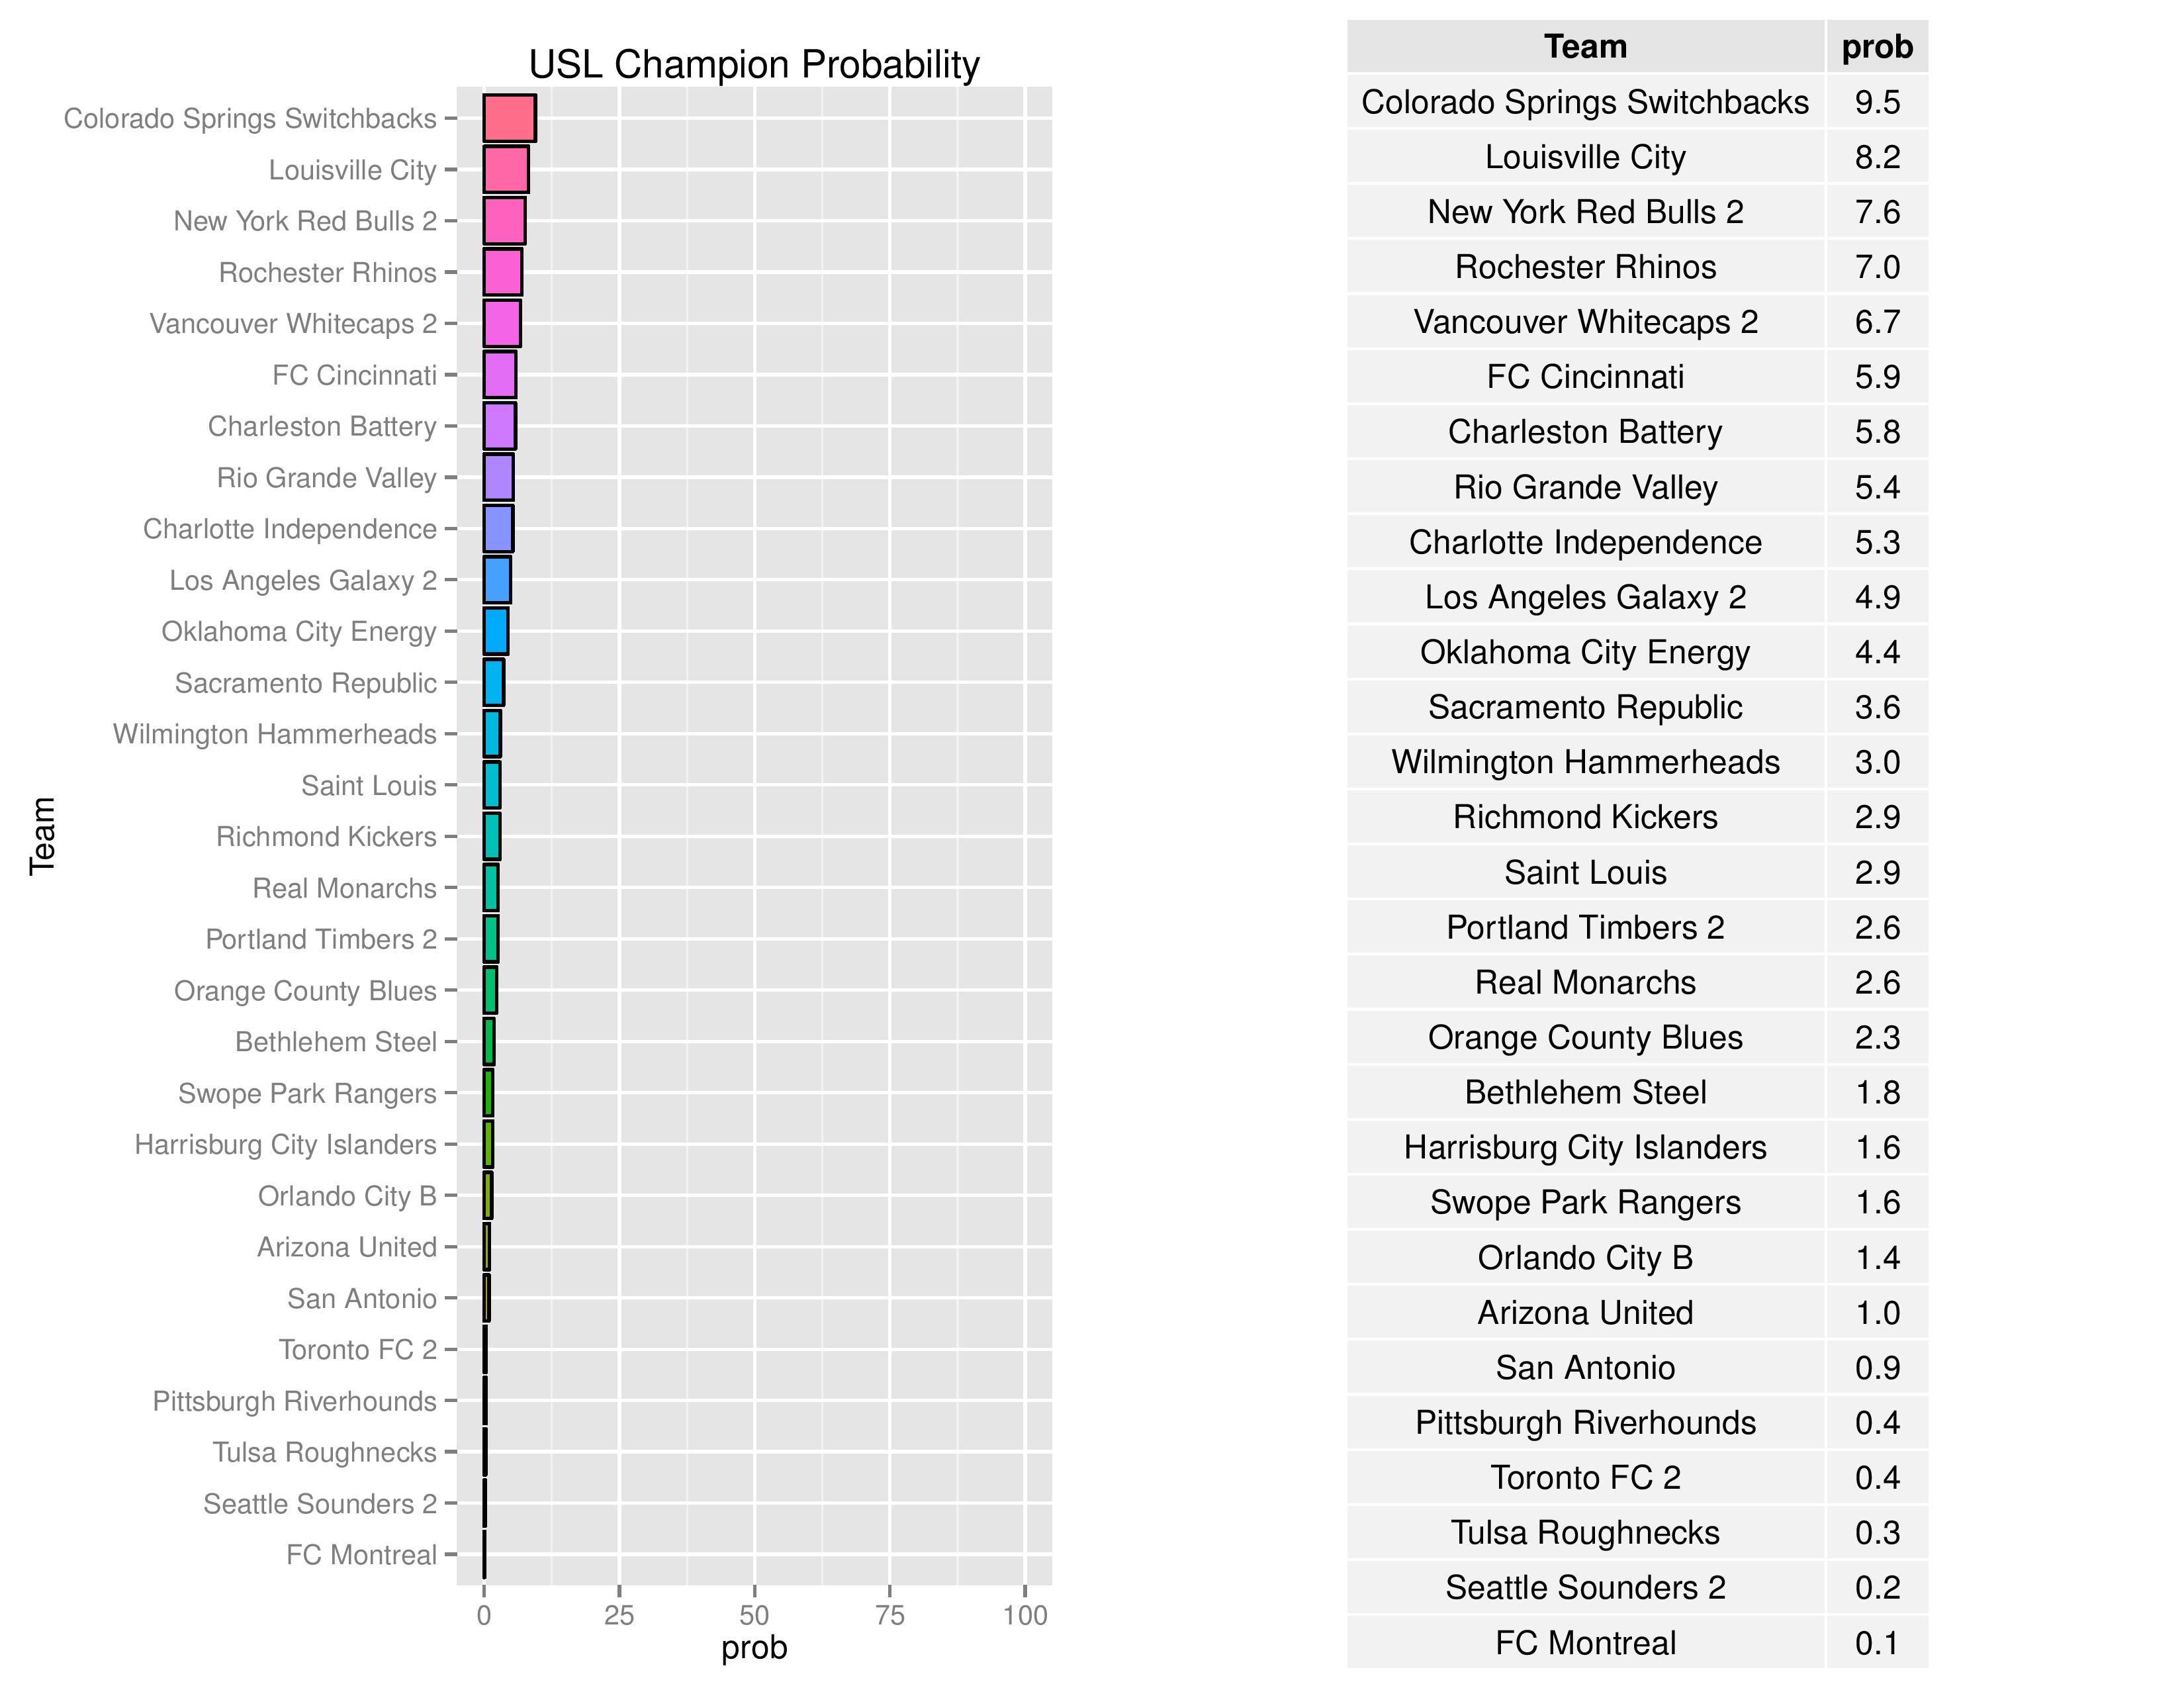
Bethlehem’s probability of winning the USL Championship dropped from 2.6% to 1.8%. Harrisburg City’s chances dropped from 2.0% to 1.6%.
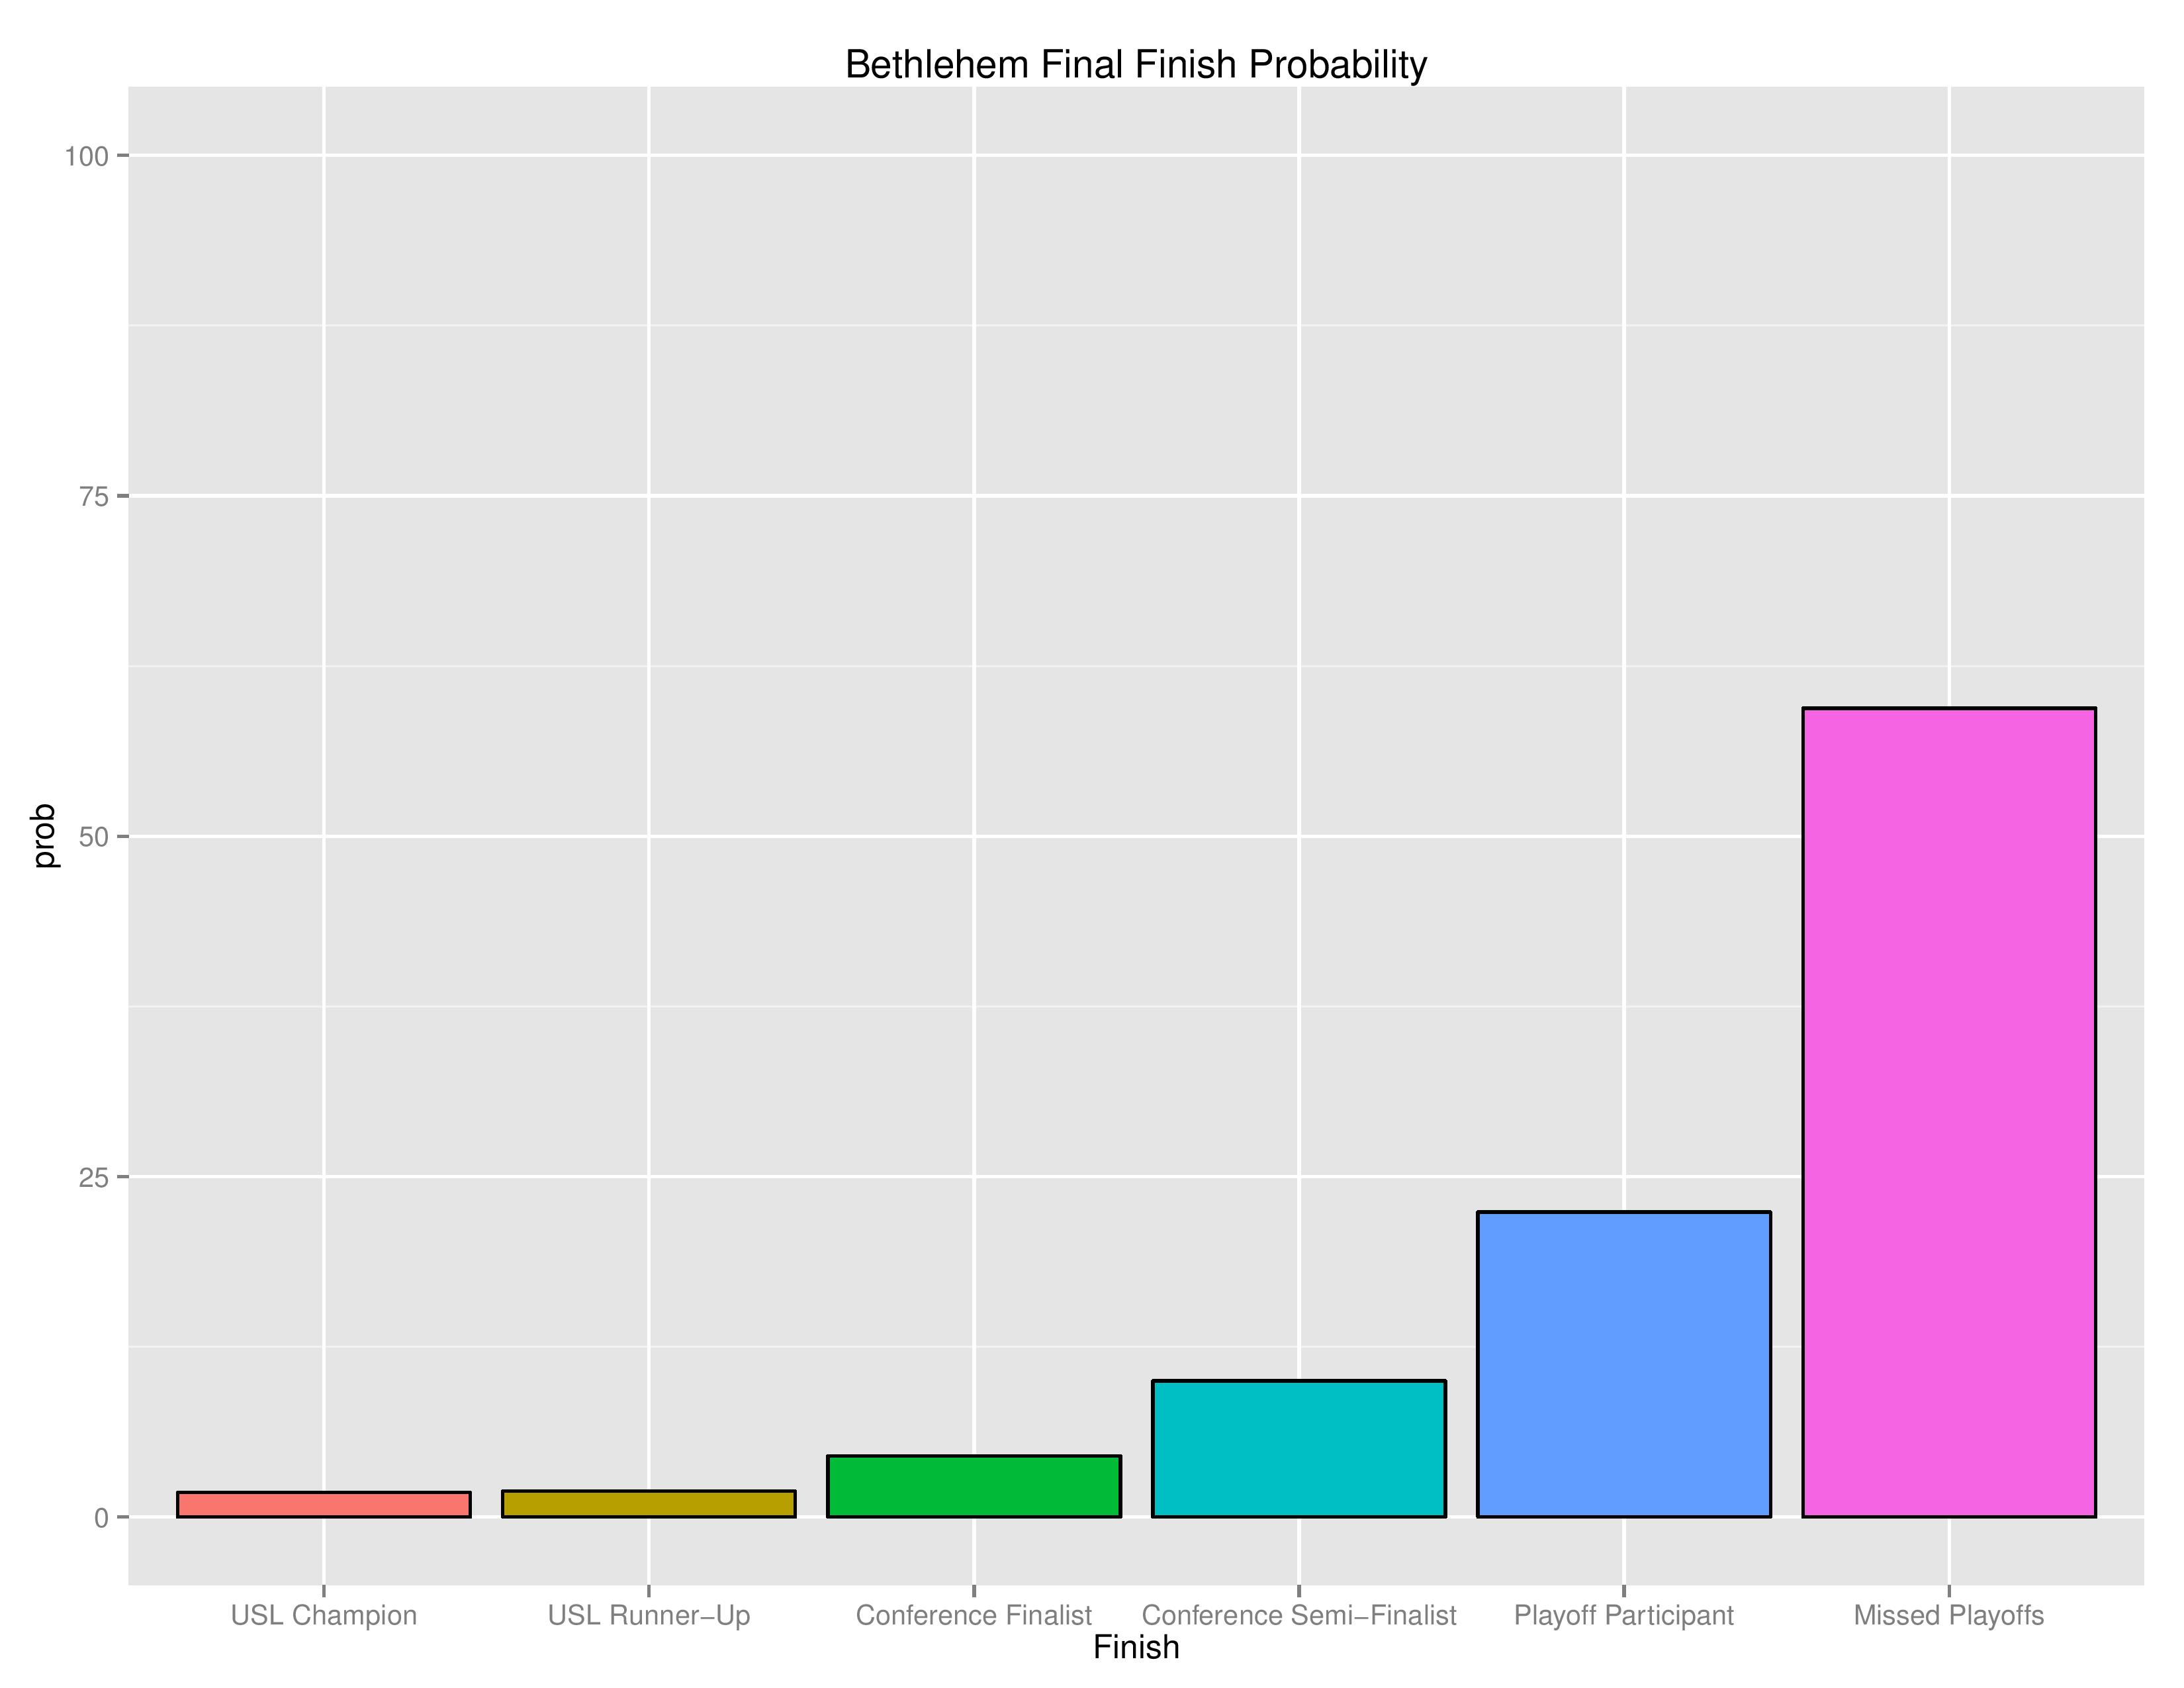
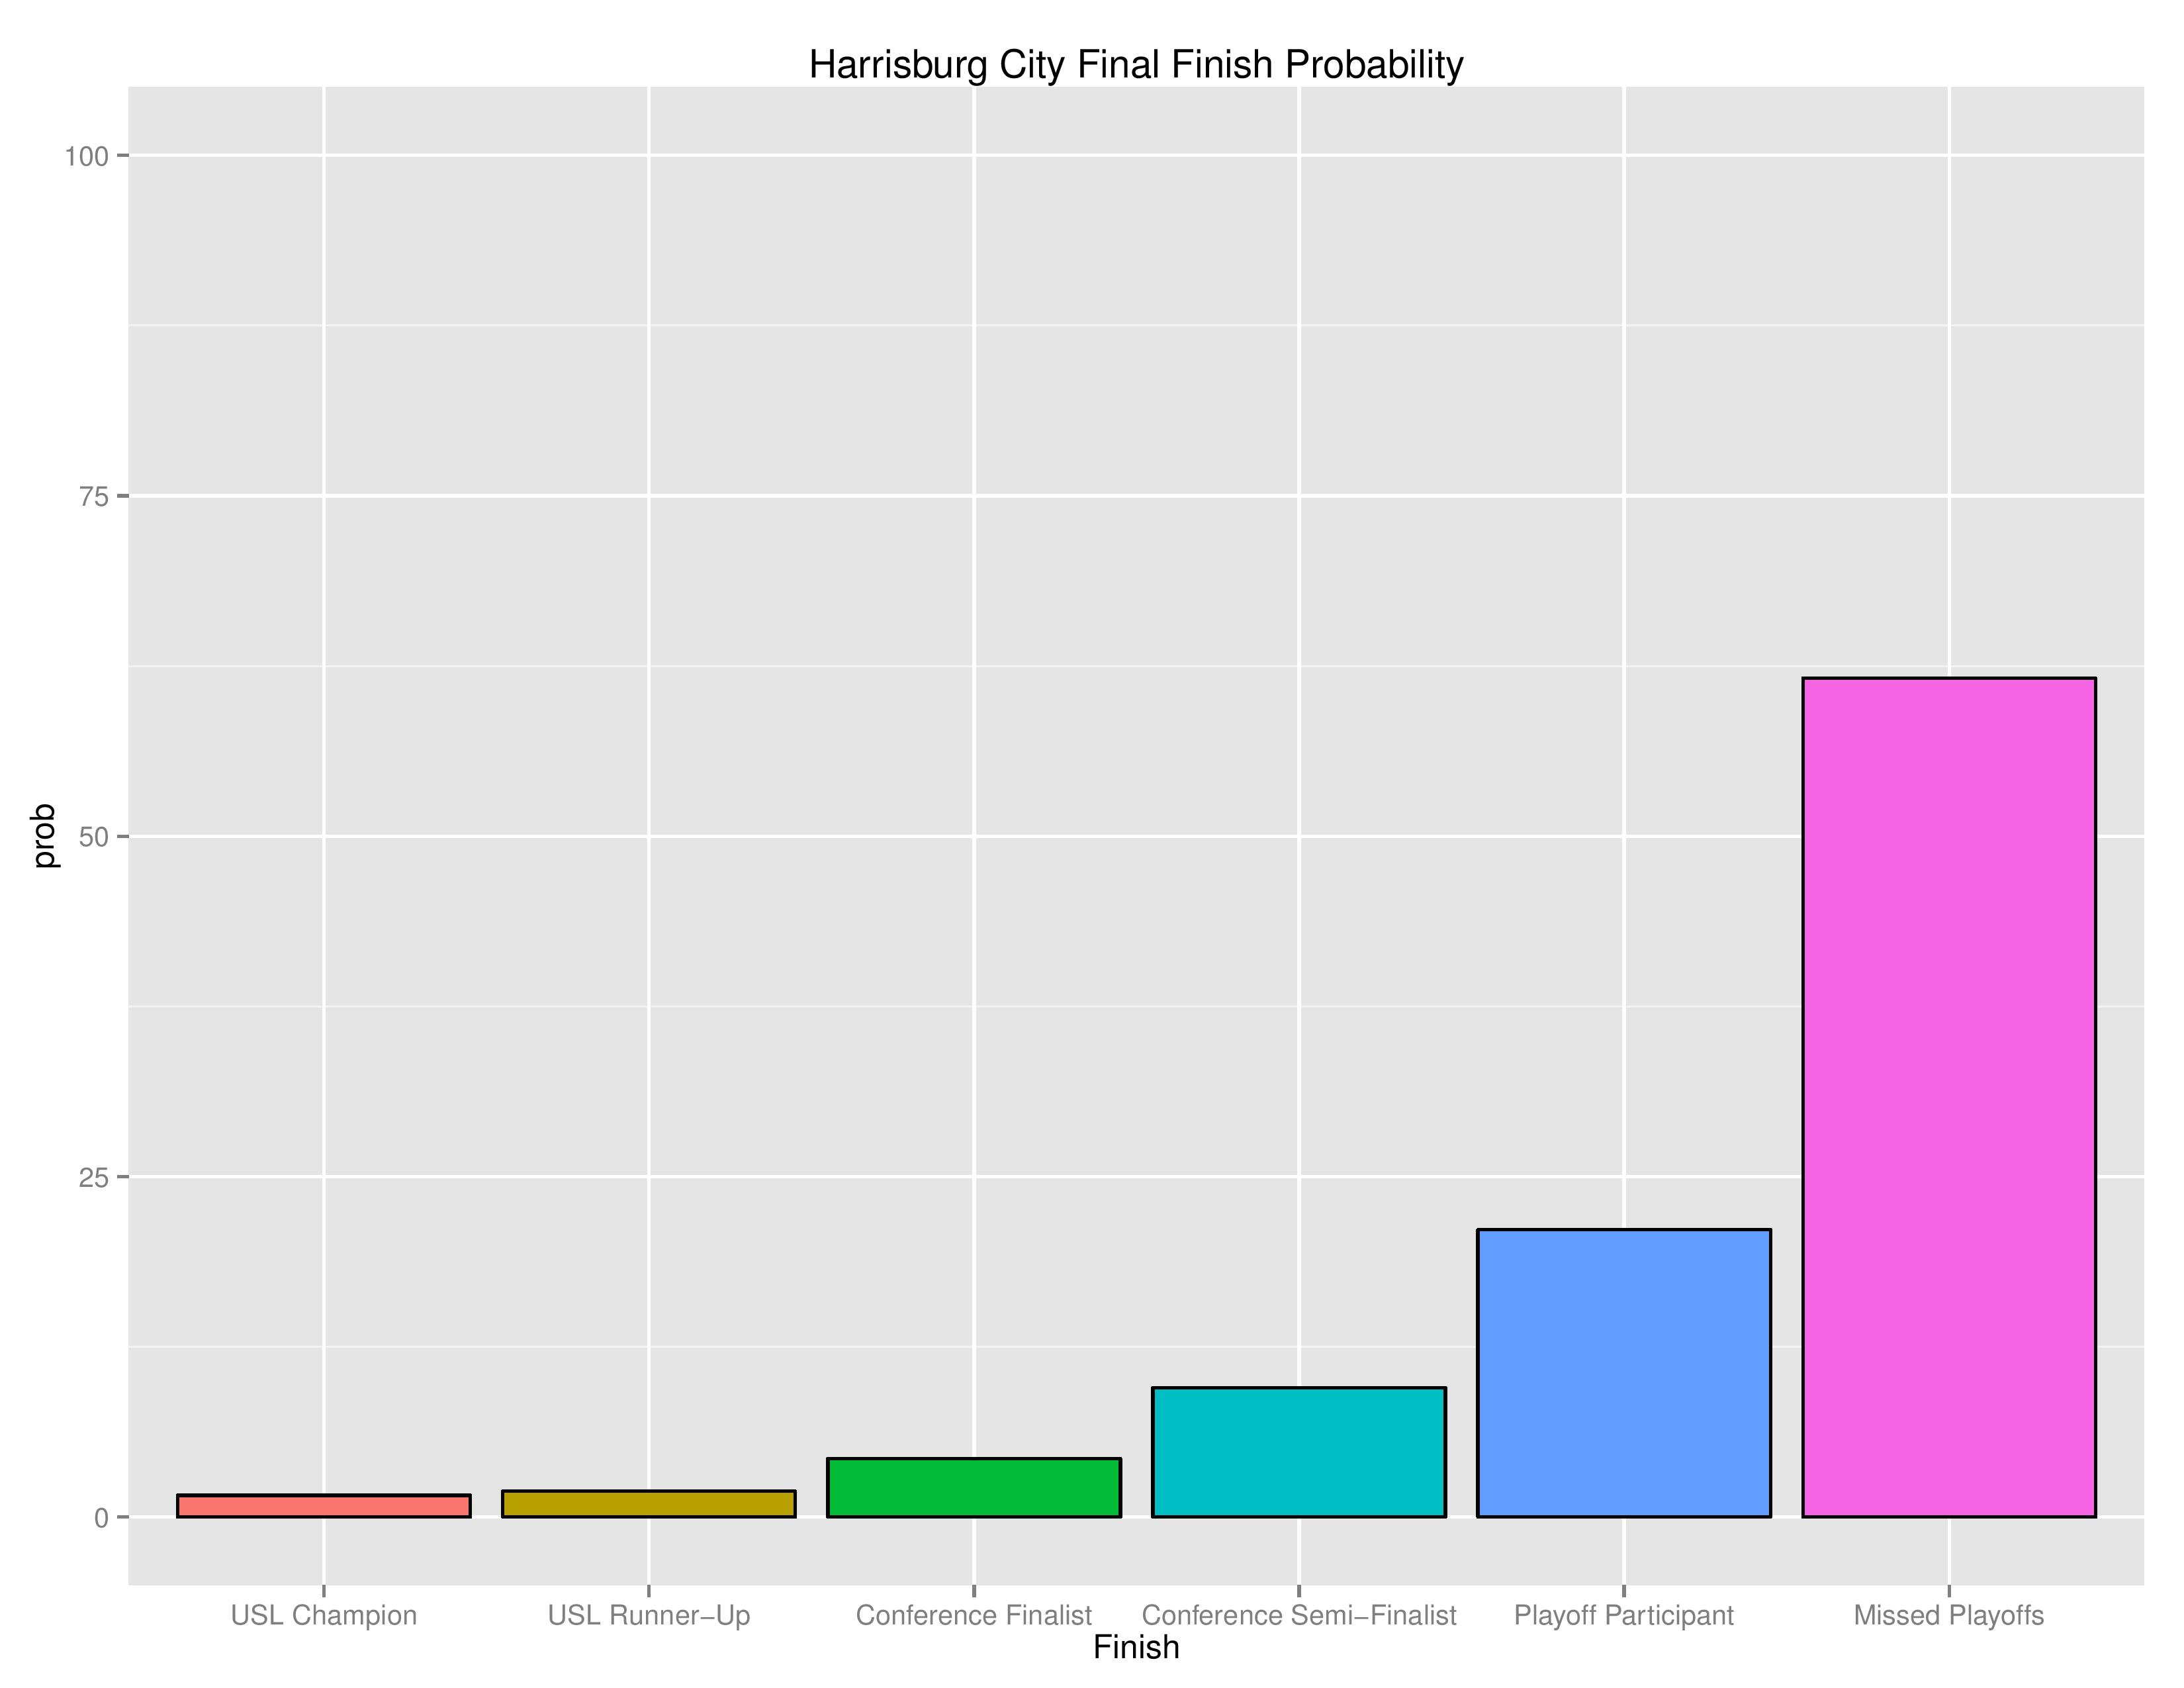
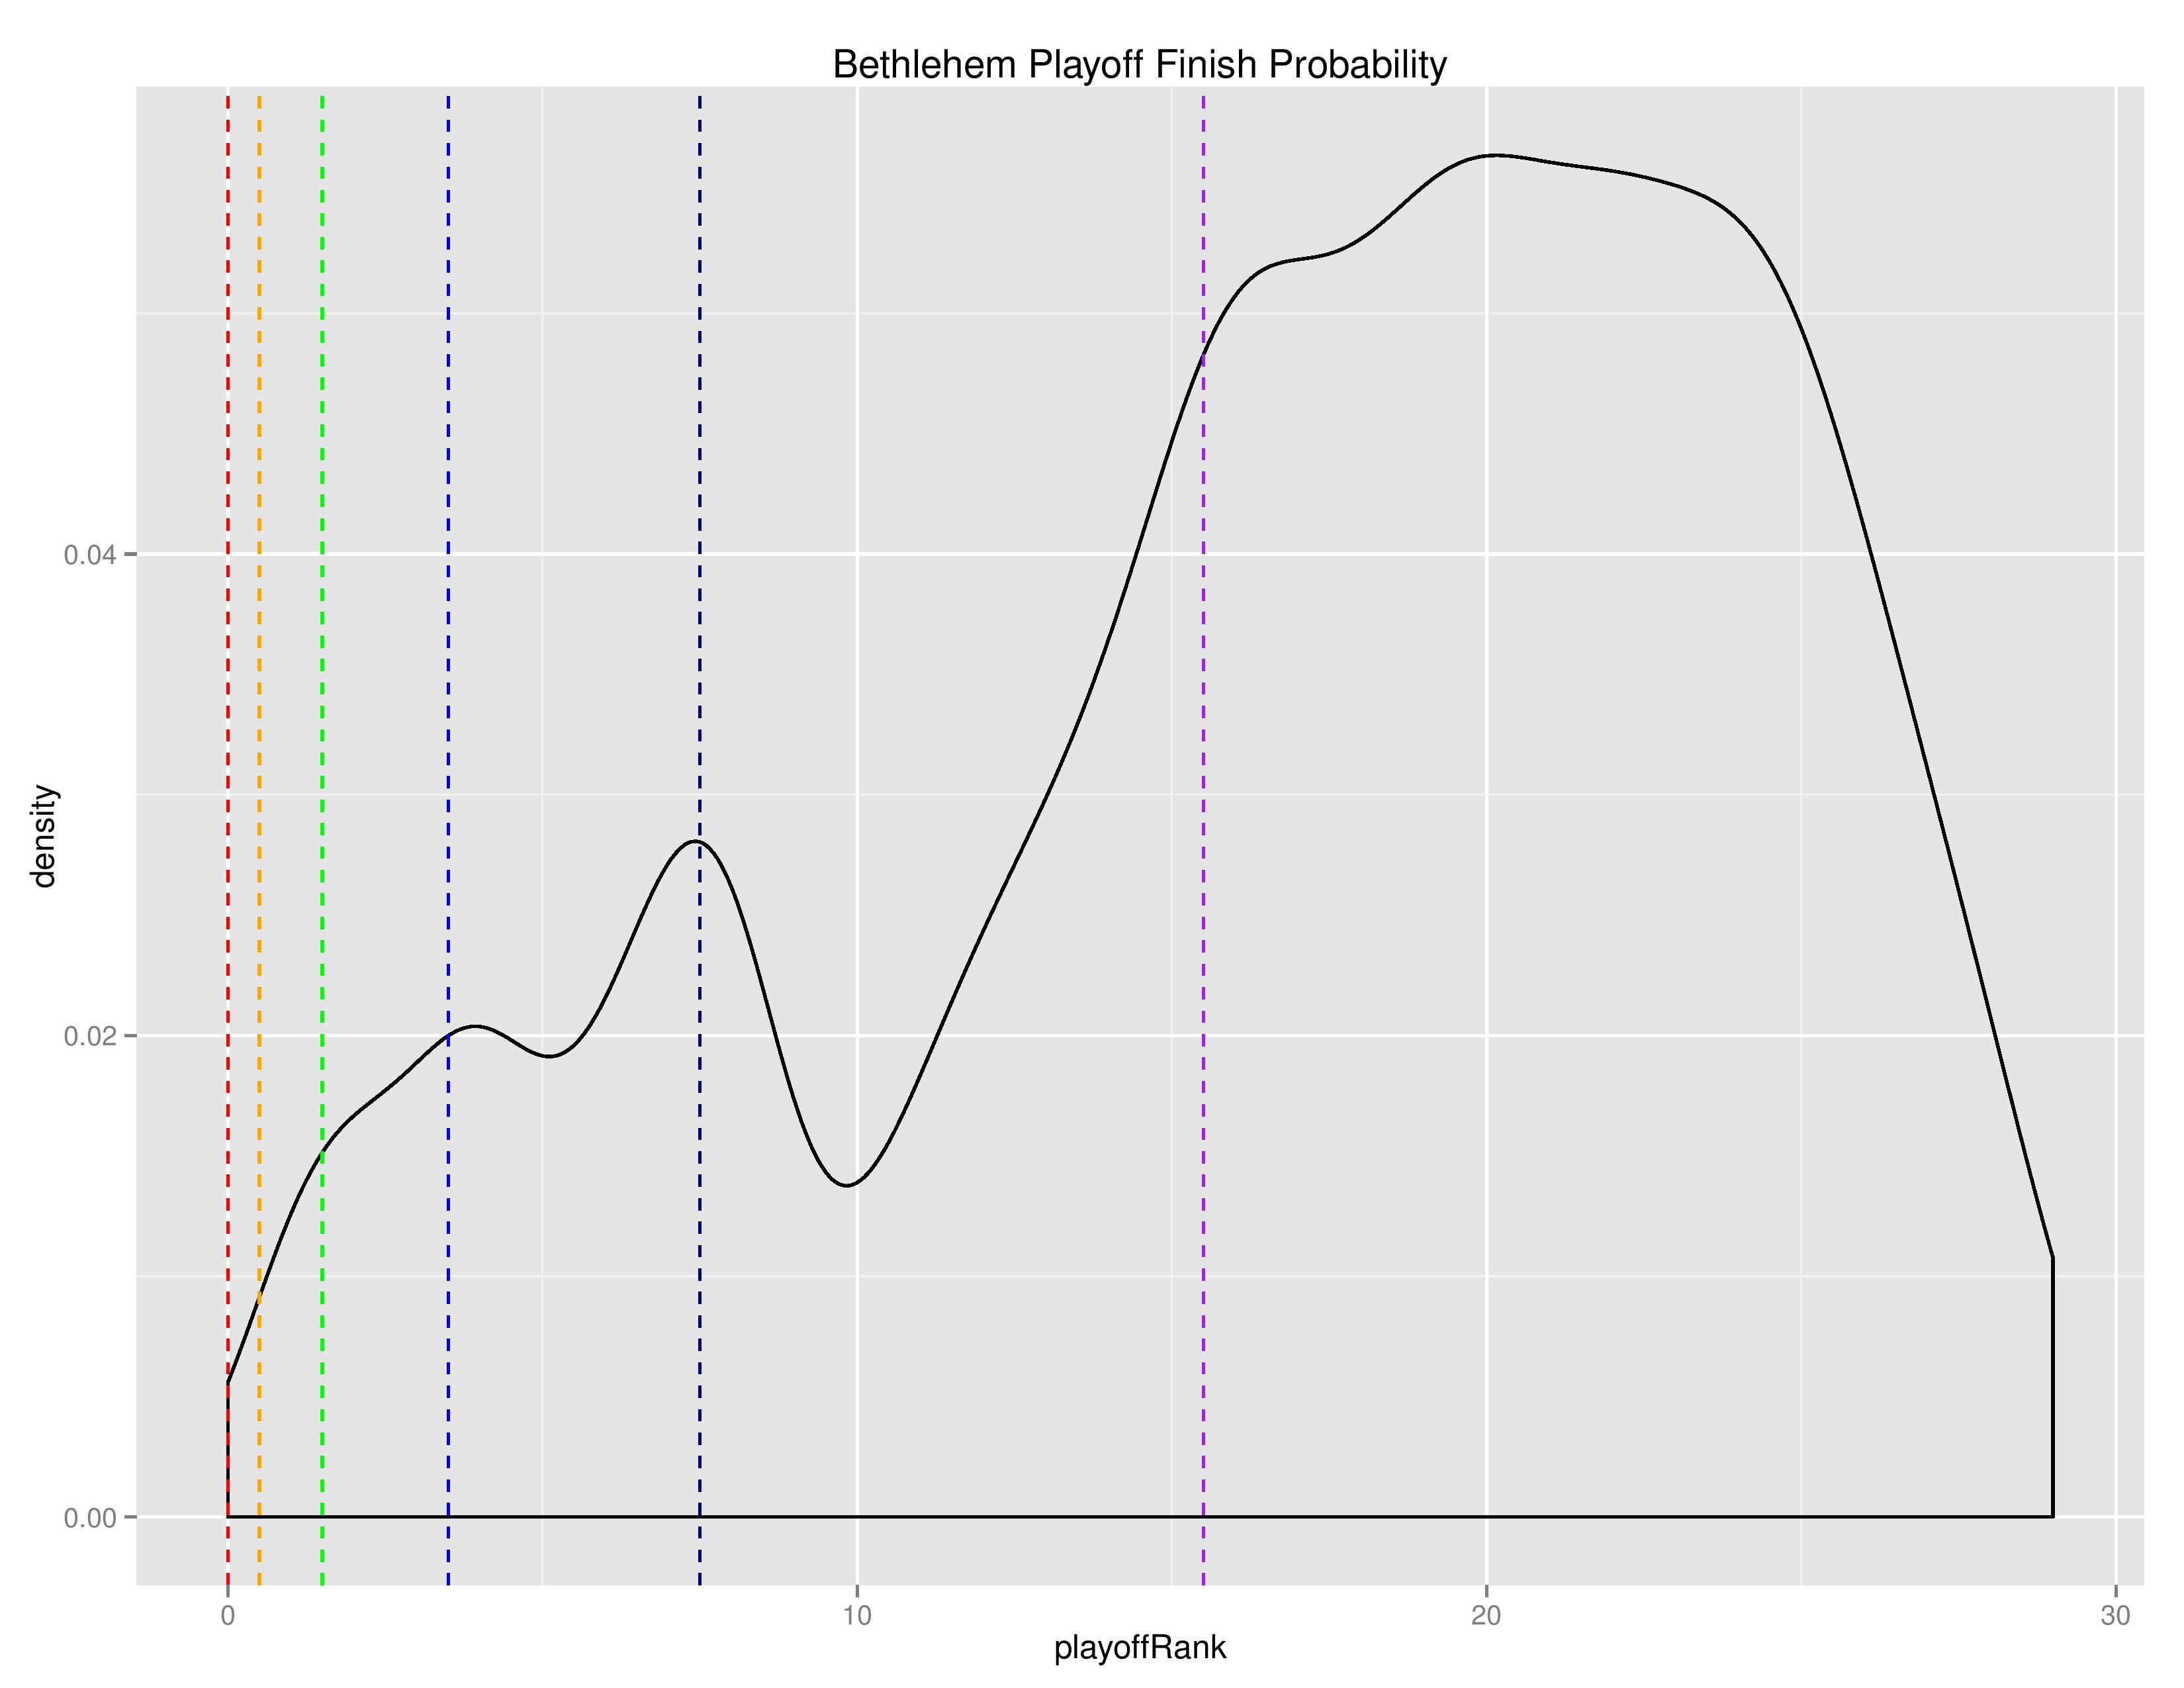
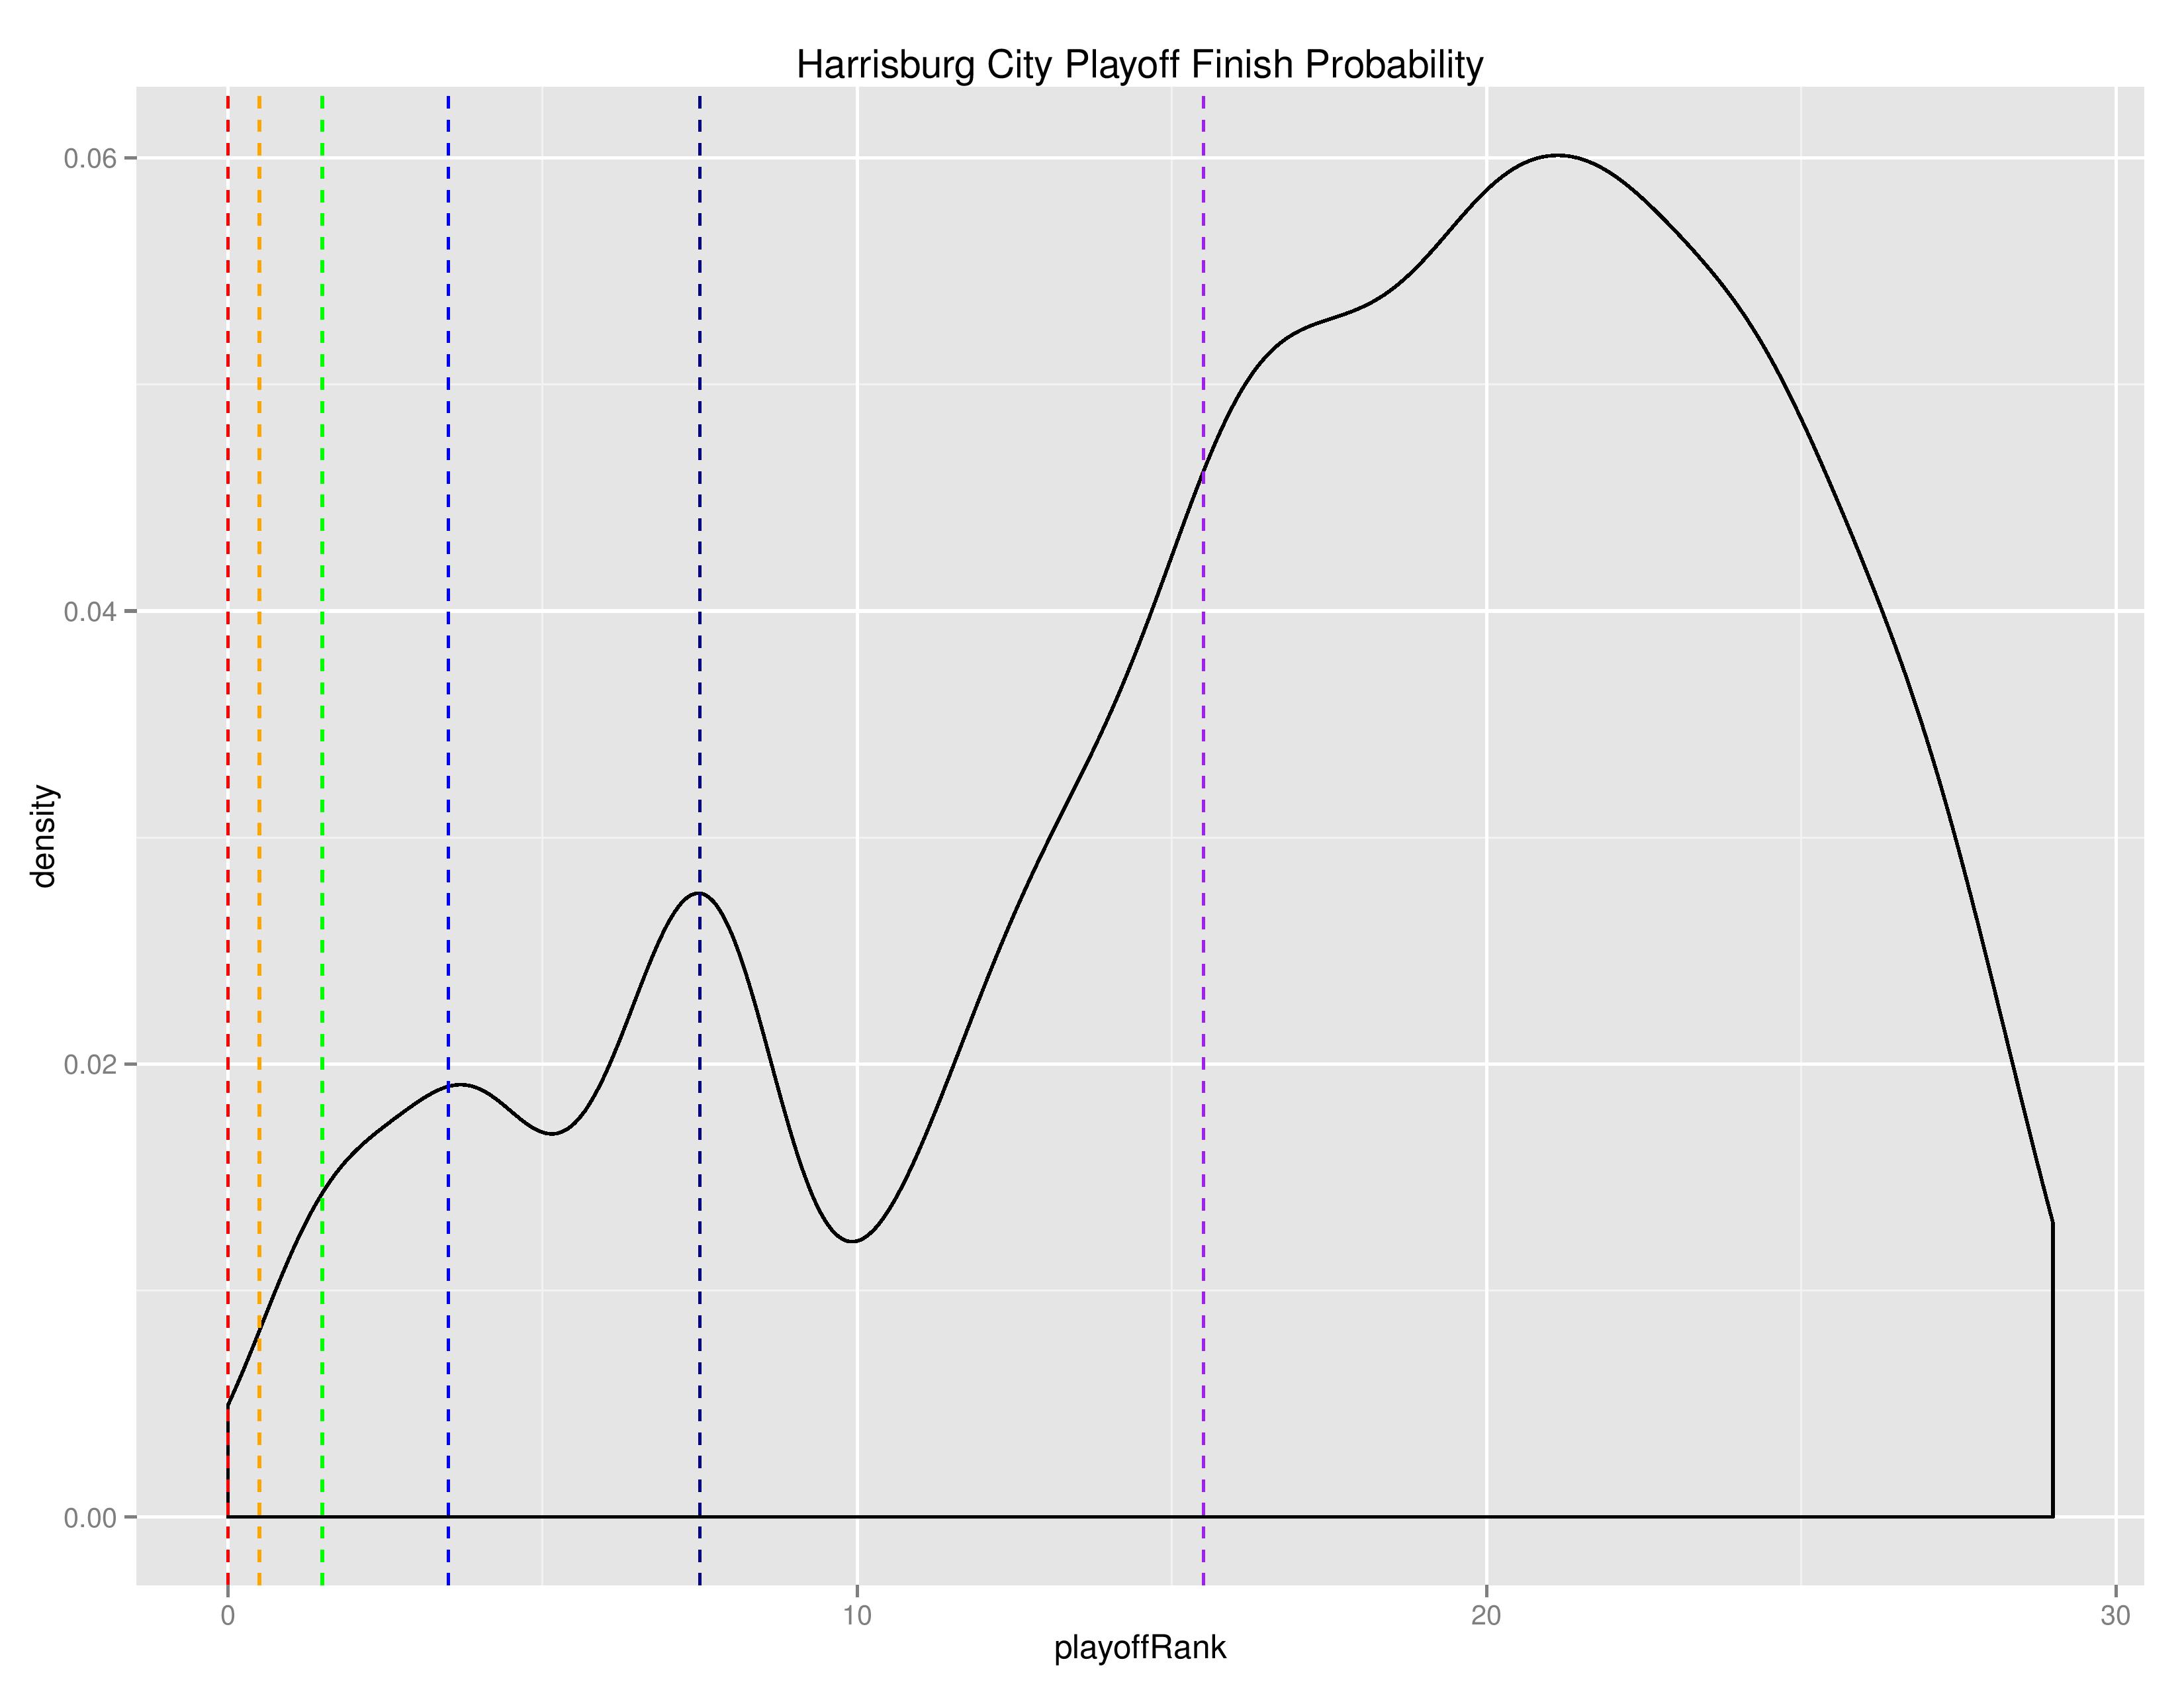
As with MLS, the below density charts show the relative probabilities of Bethlehem and Harrisburg finishing for their final playoff-rank.
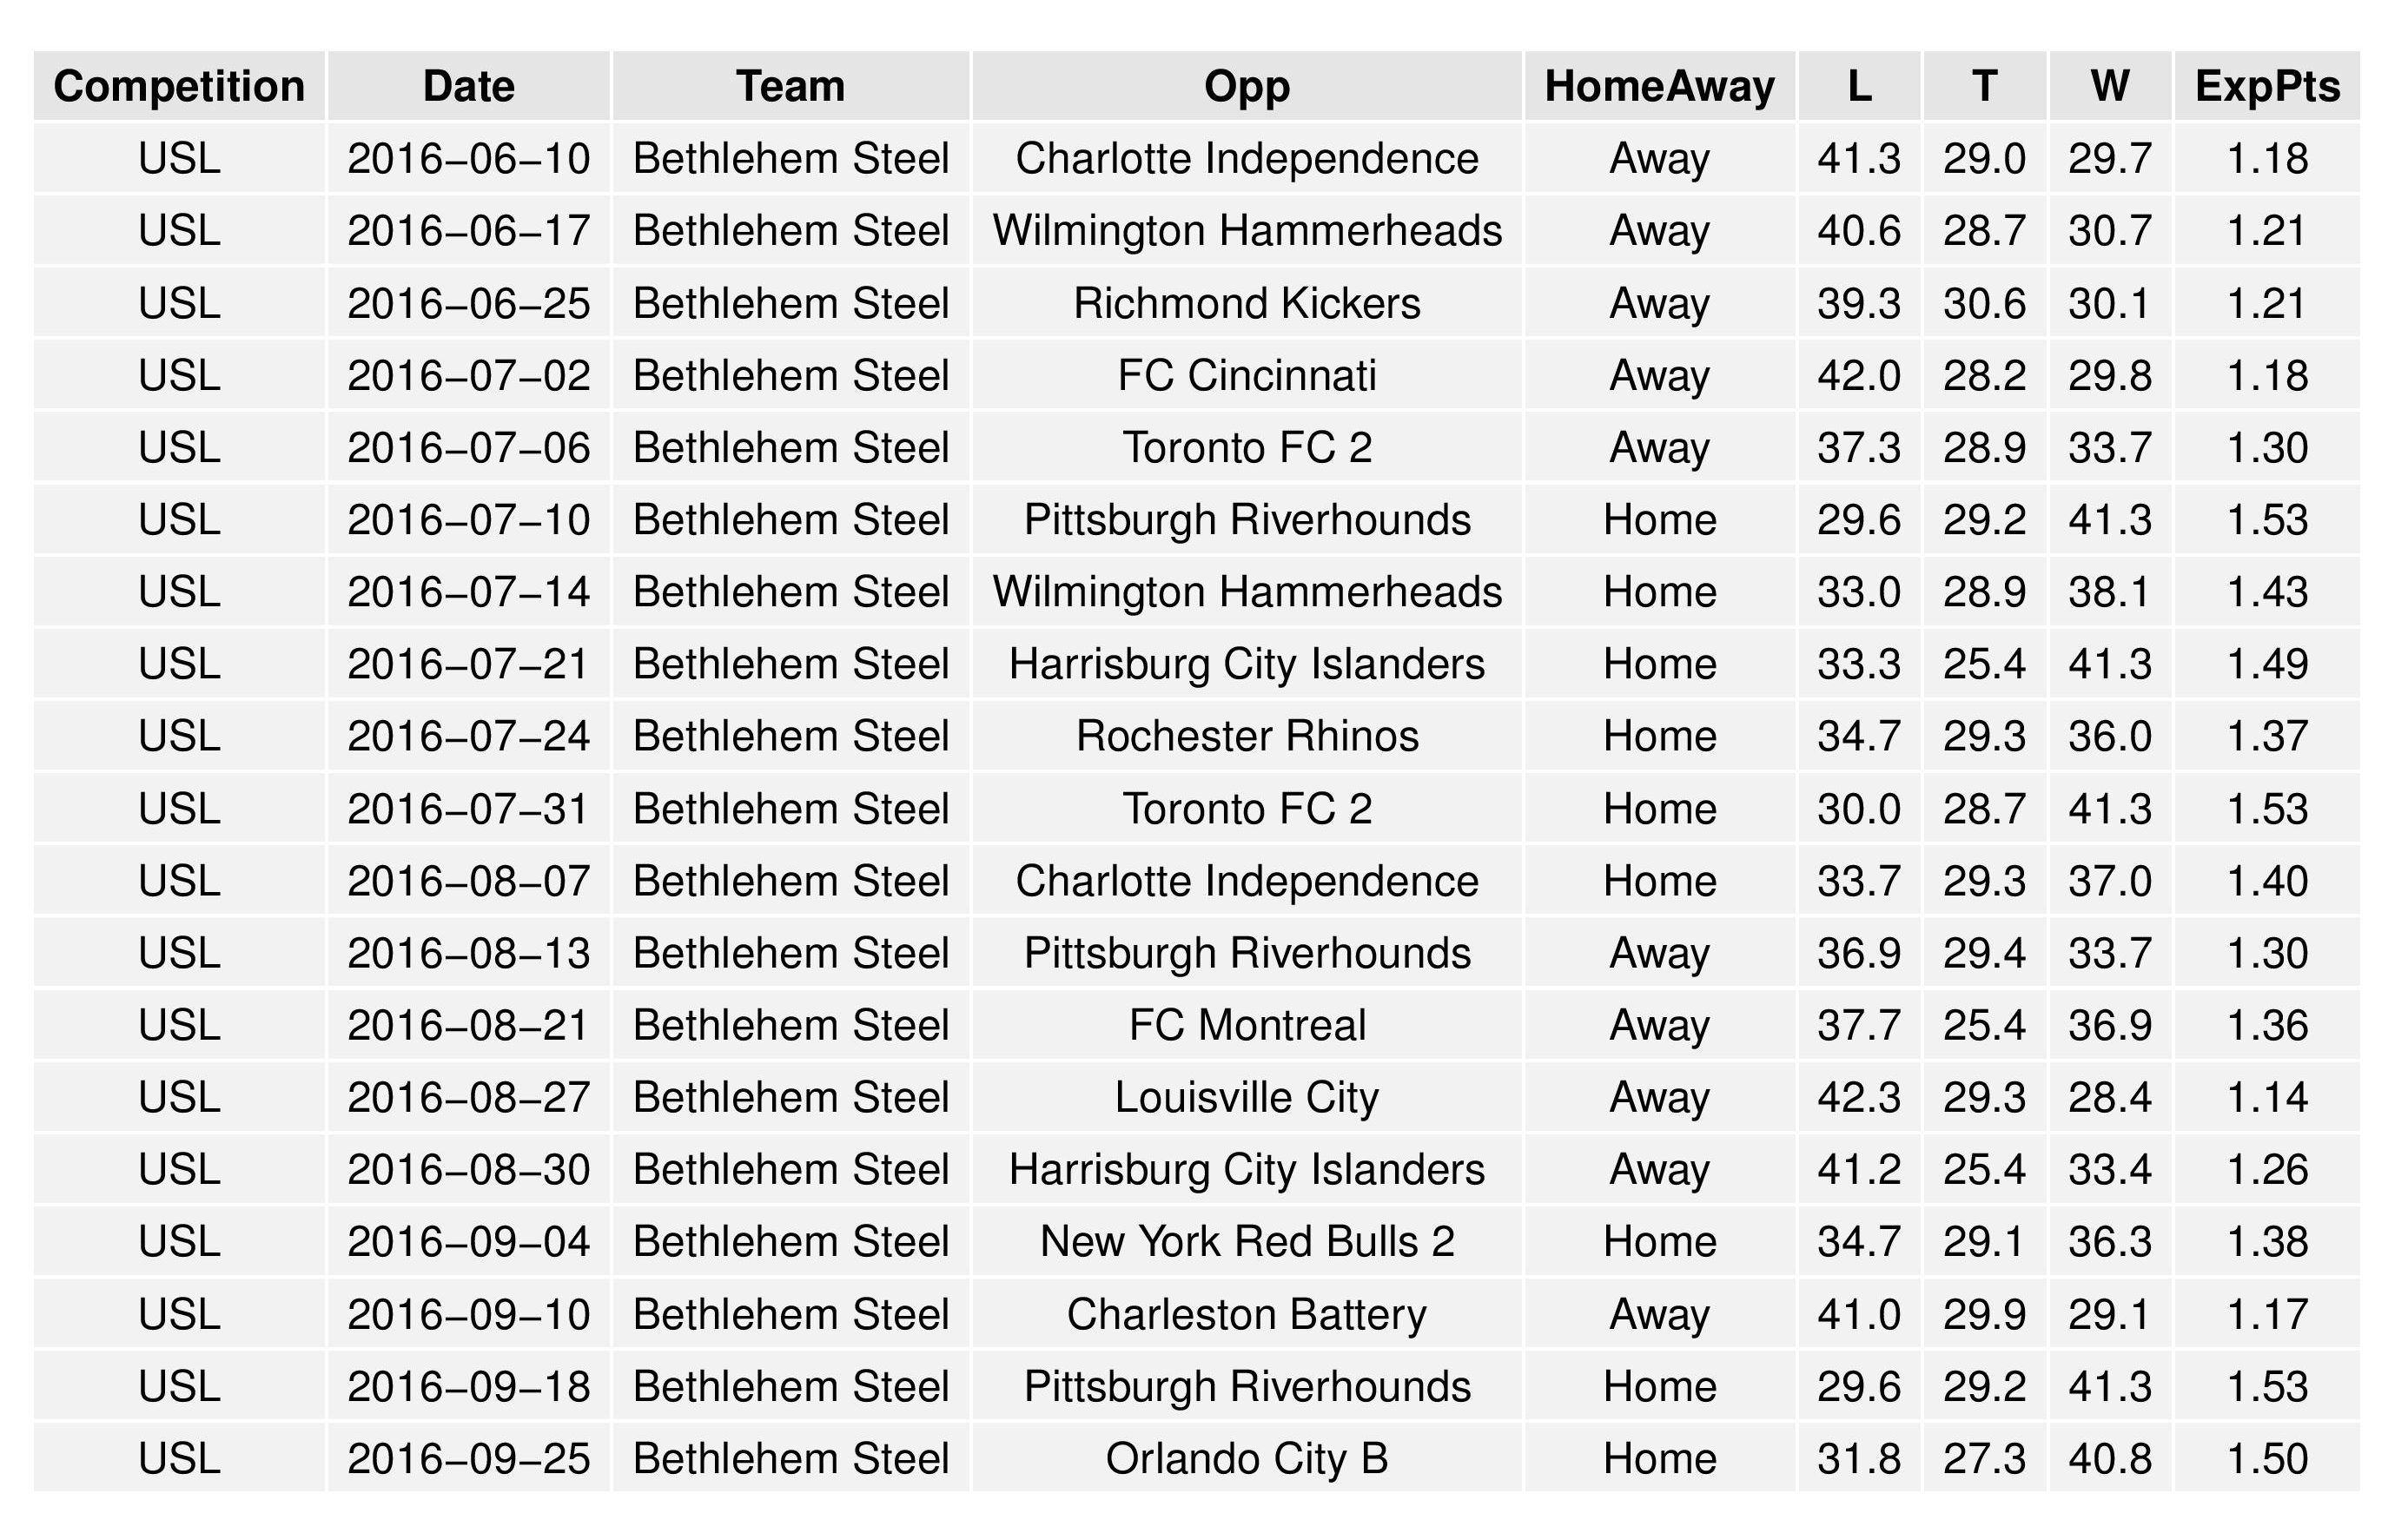
The following are the upcoming matches and associated probabilities for Bethlehem and Harrisburg.
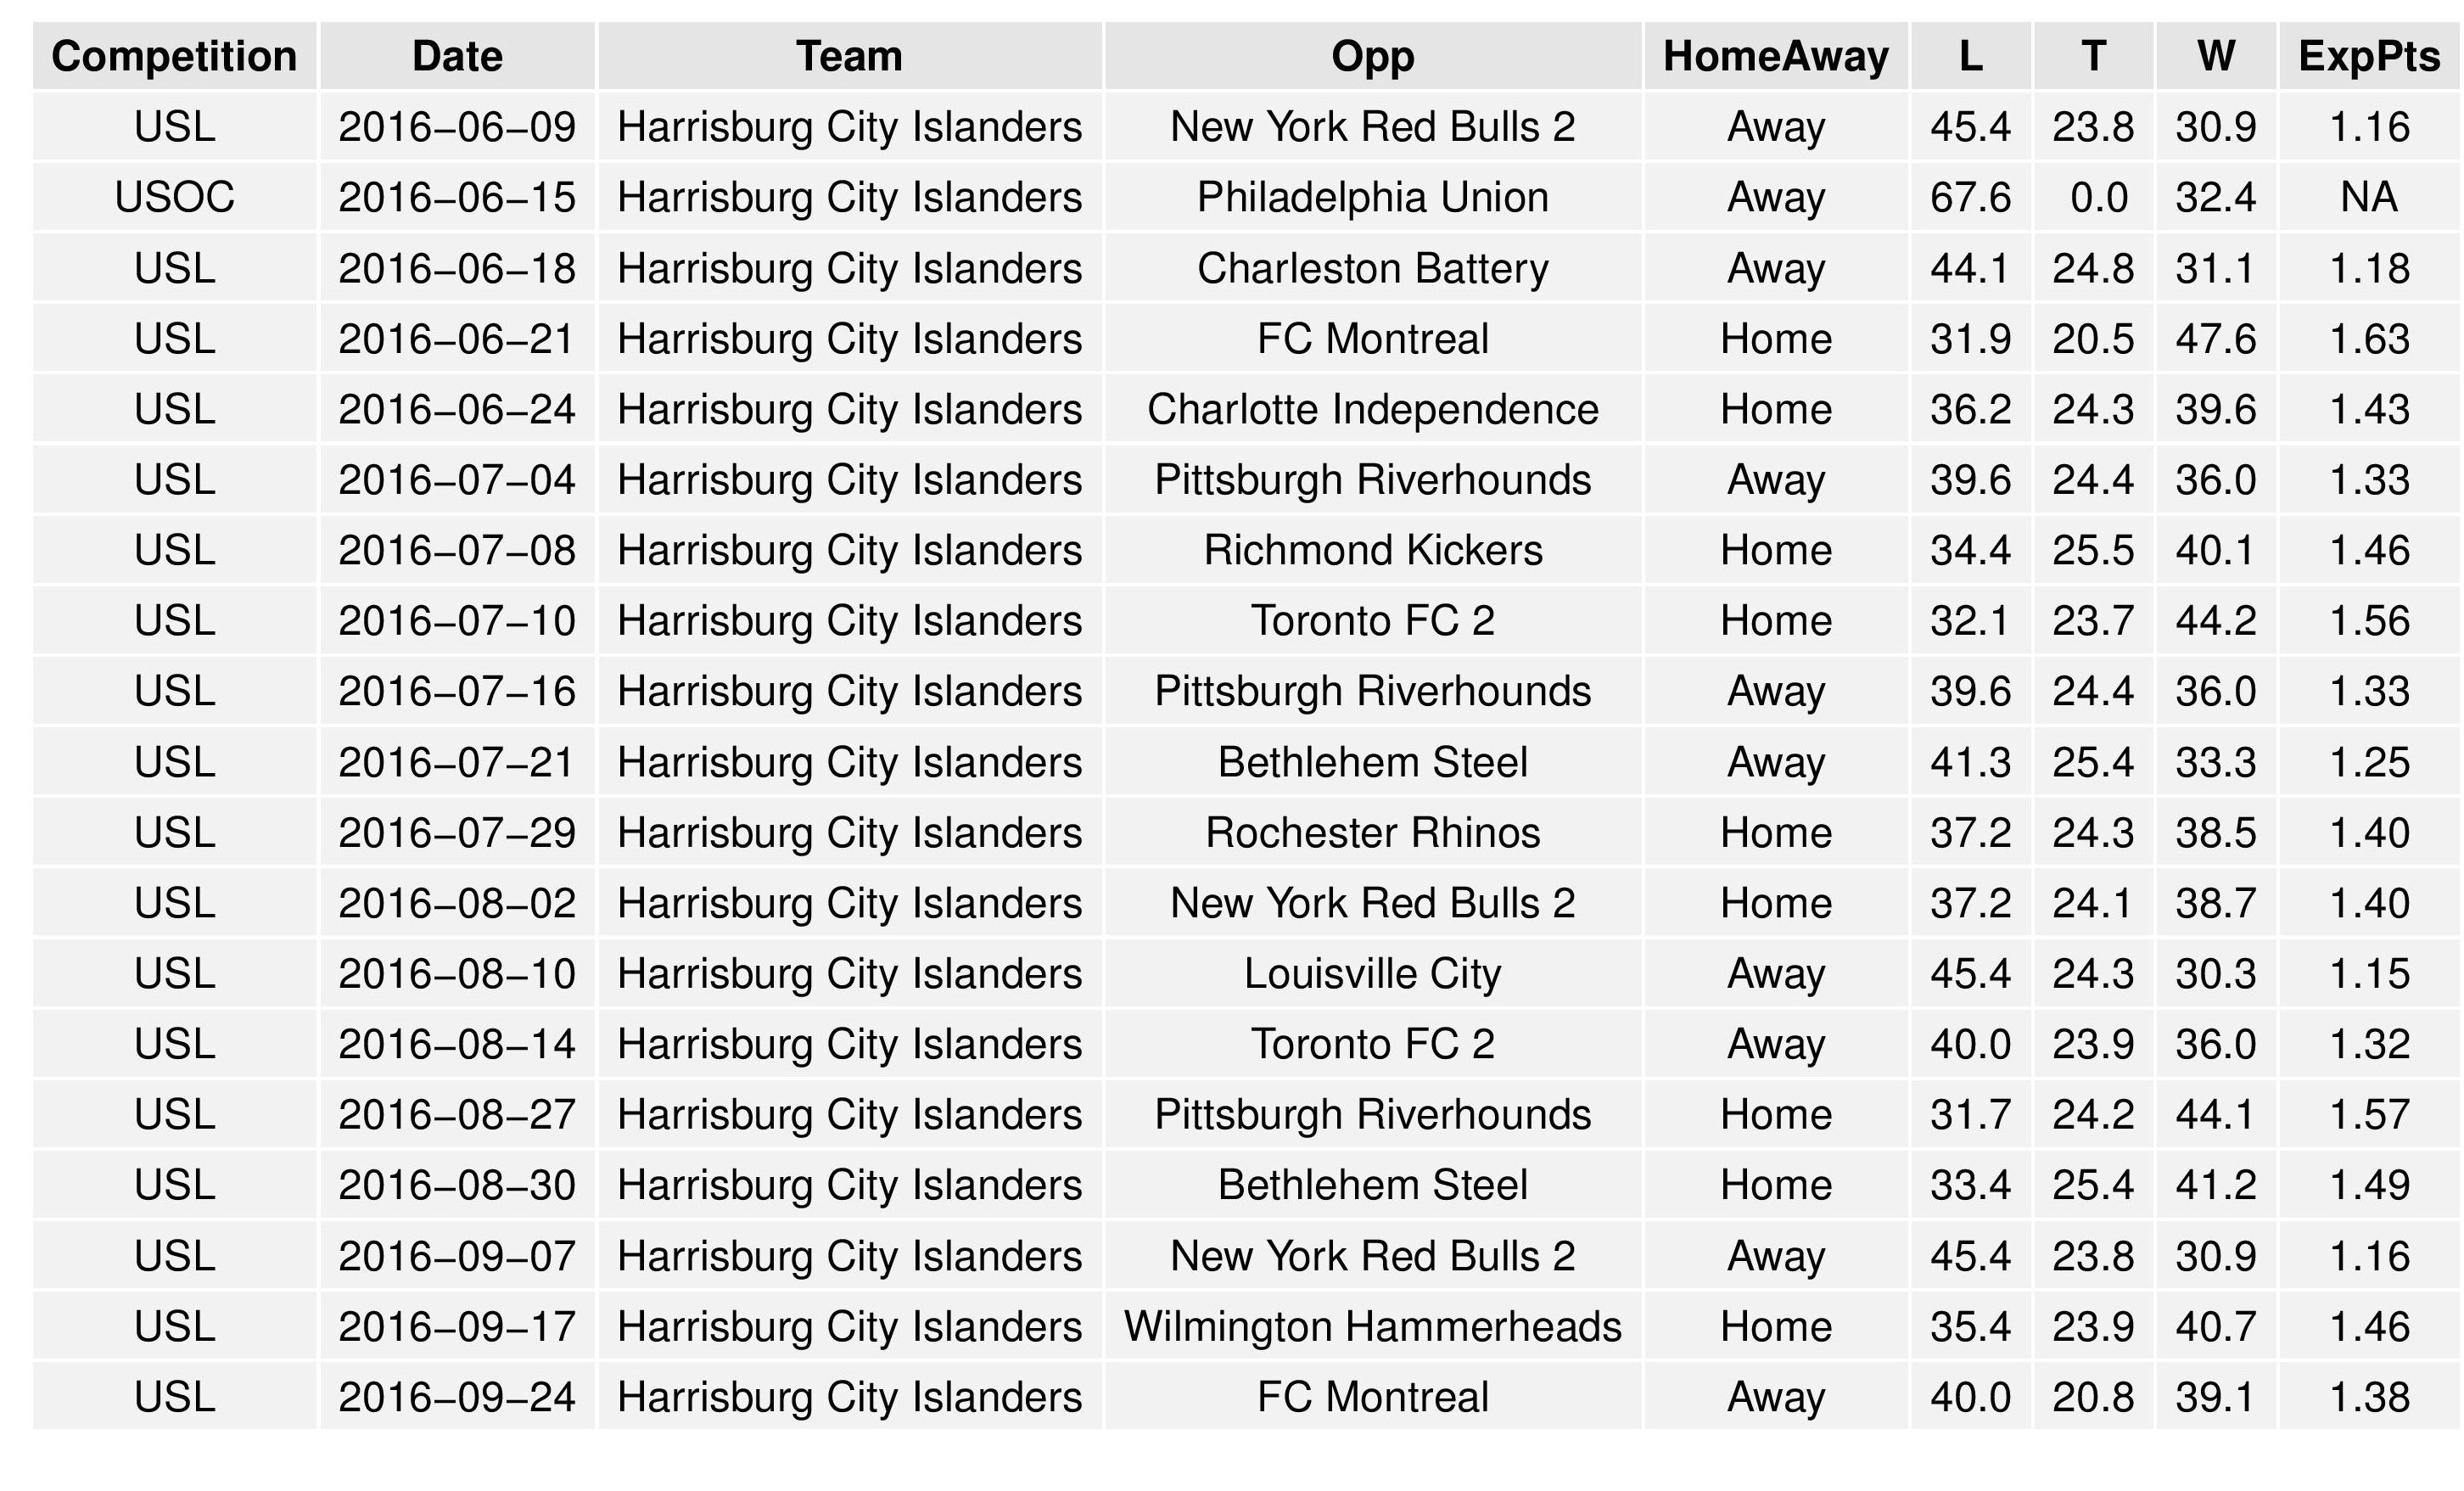
As with the MLS post above, the following tables show the average simulation results. They are divided into two tables to present better to your screen.
NWSL Projections
No updates for NWSL this week as they did not play.
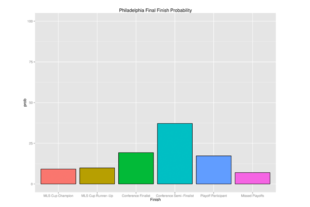

So the Union have a better chance of winning the MLS Cup than they do of missing the playoffs. Was anyone thinking that on March 7, the day after the Dallas game?
I’m not sure I understand all of it, but that is an impressive bit of work!
Thank you for putting the data set next to the graph! A great improvement!
This is great, thanks Chris!
Of all these probabilities, the one that truly boggles my mind is that the Union have a 50/50 shot at playing in the CONCACAF Champions League next year. I can hardly even wrap my head around that one.