Welcome to the International version of the Statistical Extrapolation Bayesian Analyzer Projection System, which is, of course, a tortured gathering of words used to create the SEBA Projection System.
The system consists of a model projecting the probabilities of game results and then a barrage of simulations which account for the remaining luck. So the probabilities you see below show, essentially, what the odds are of an outcome if the team continues to play like it has been.
Below are the current Copa America tournament forecasts using data from games through June 6, 2016.
Rooting Guide
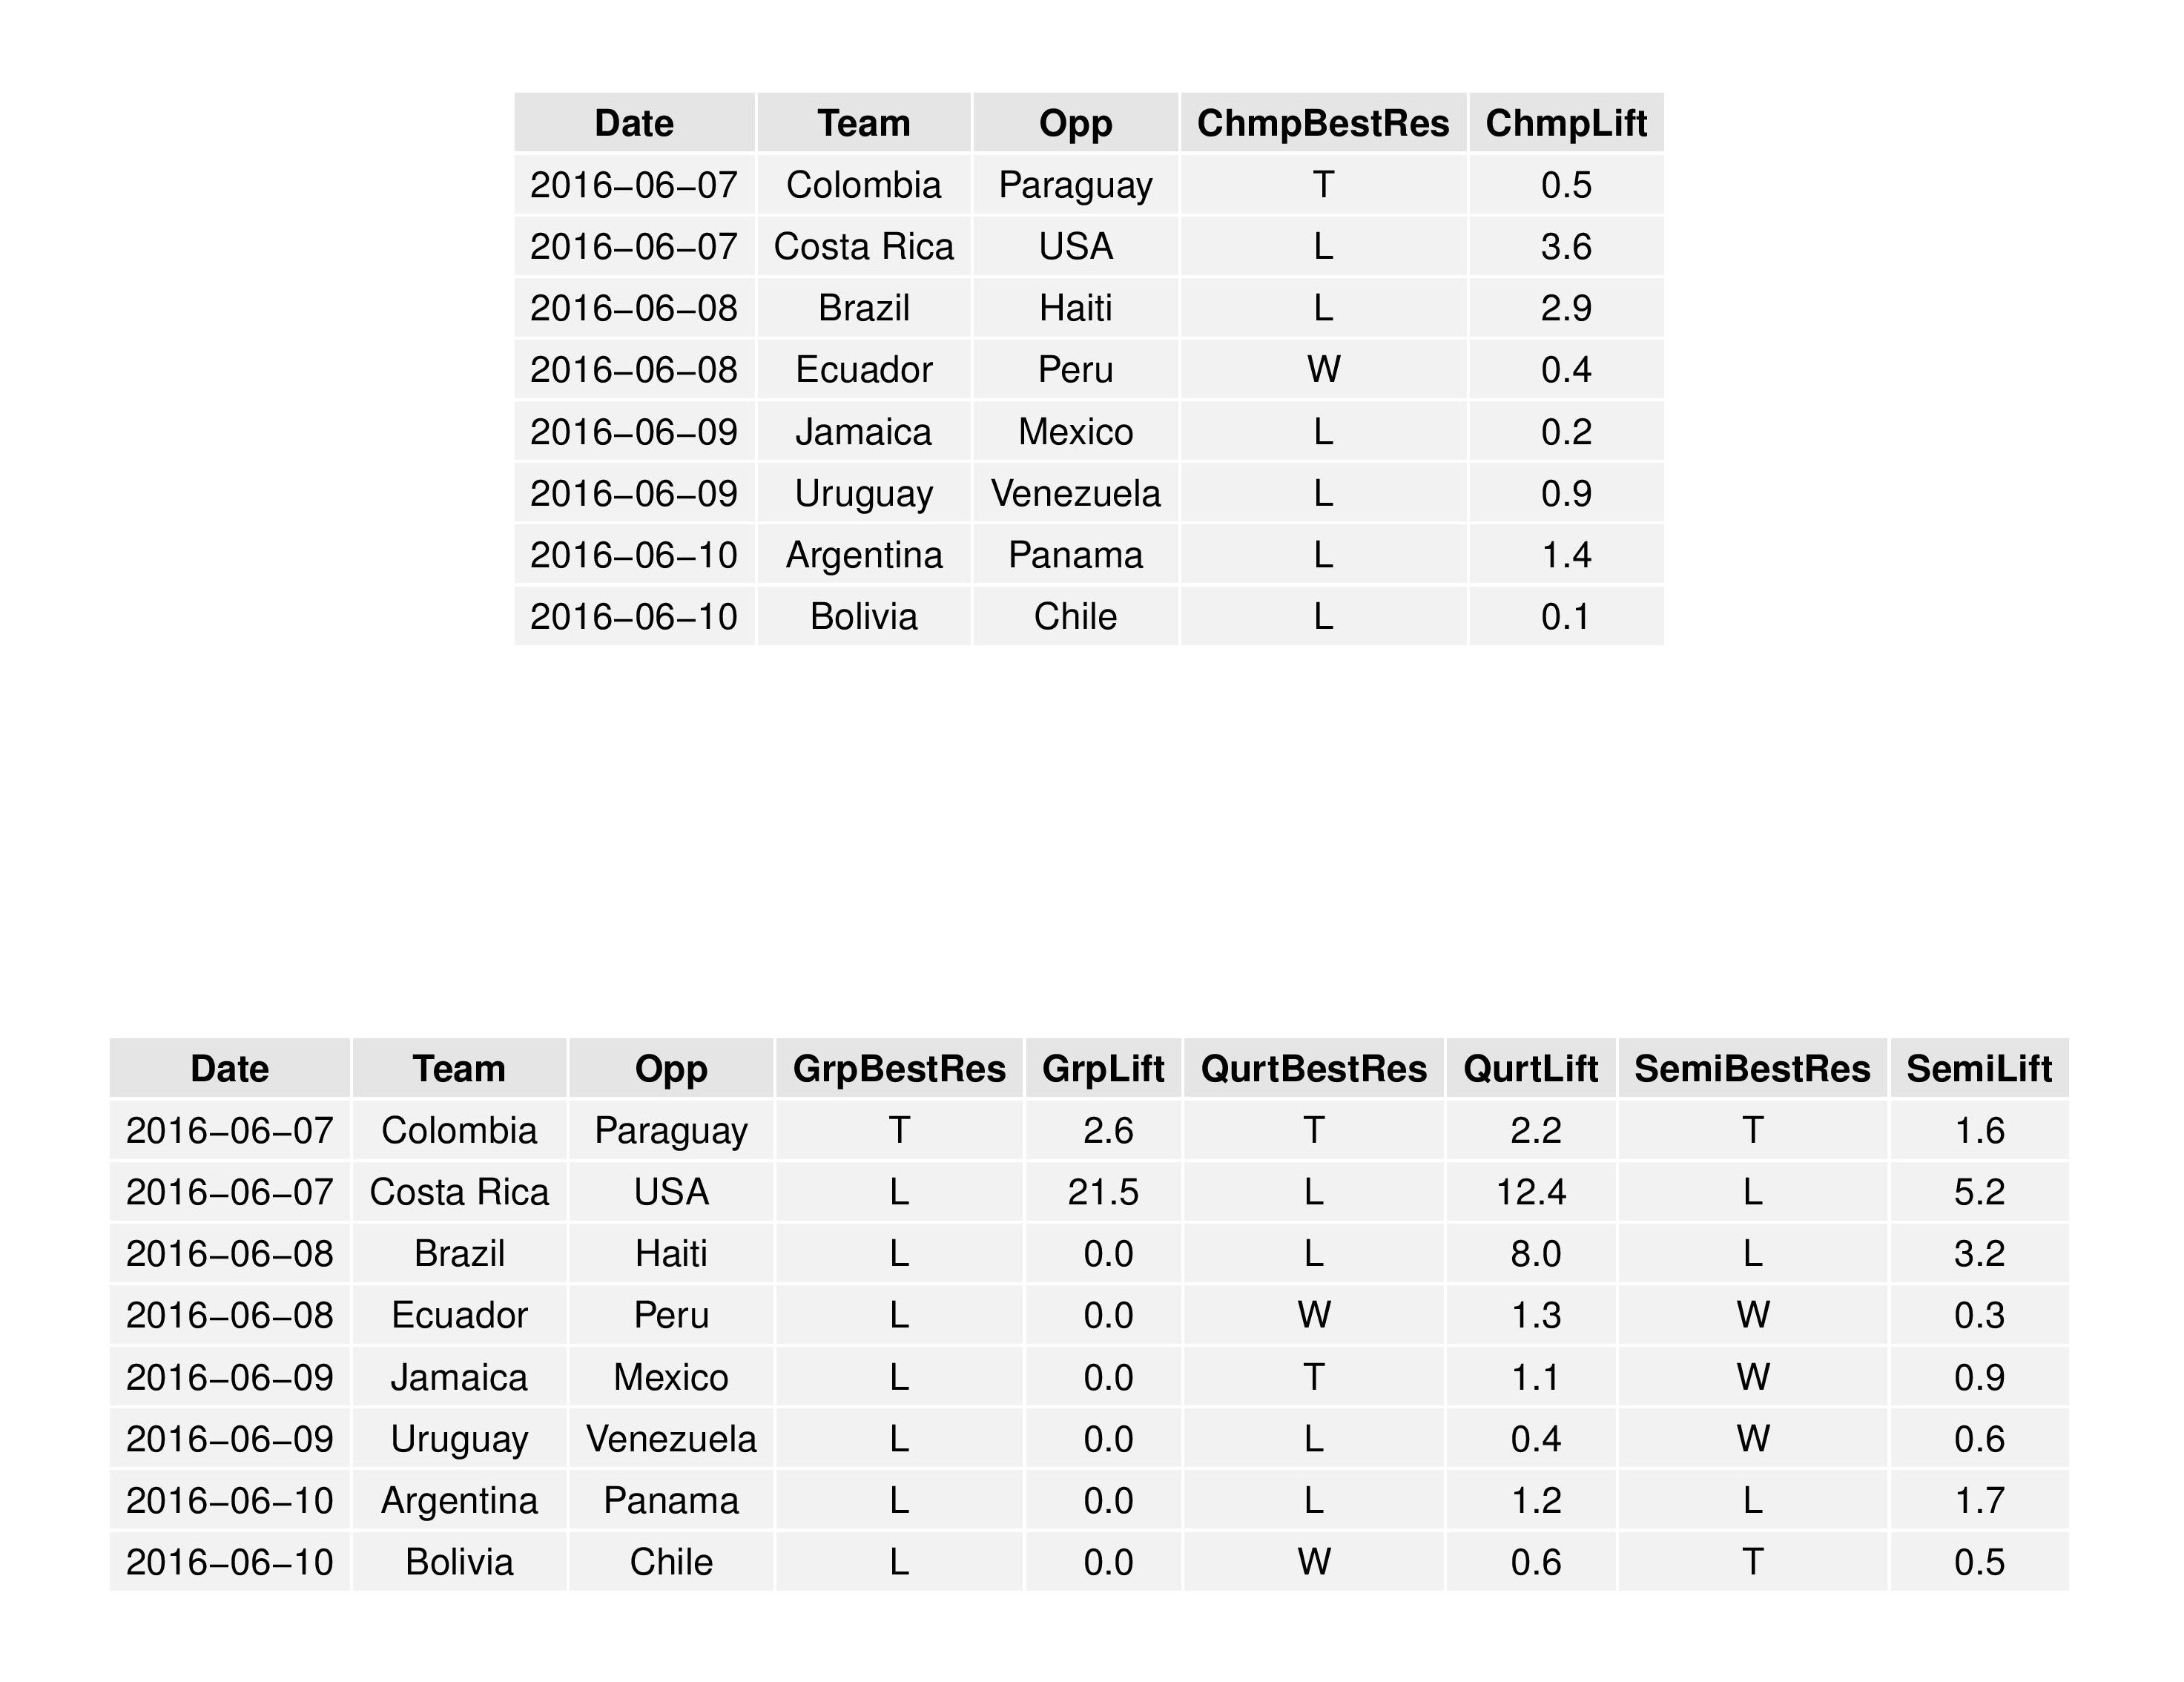
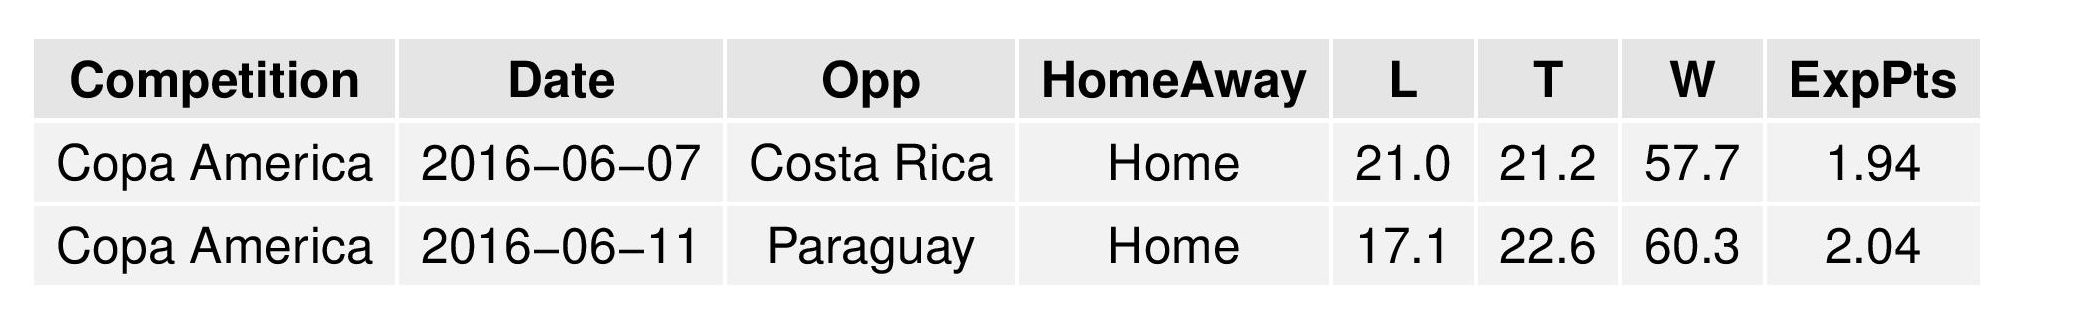
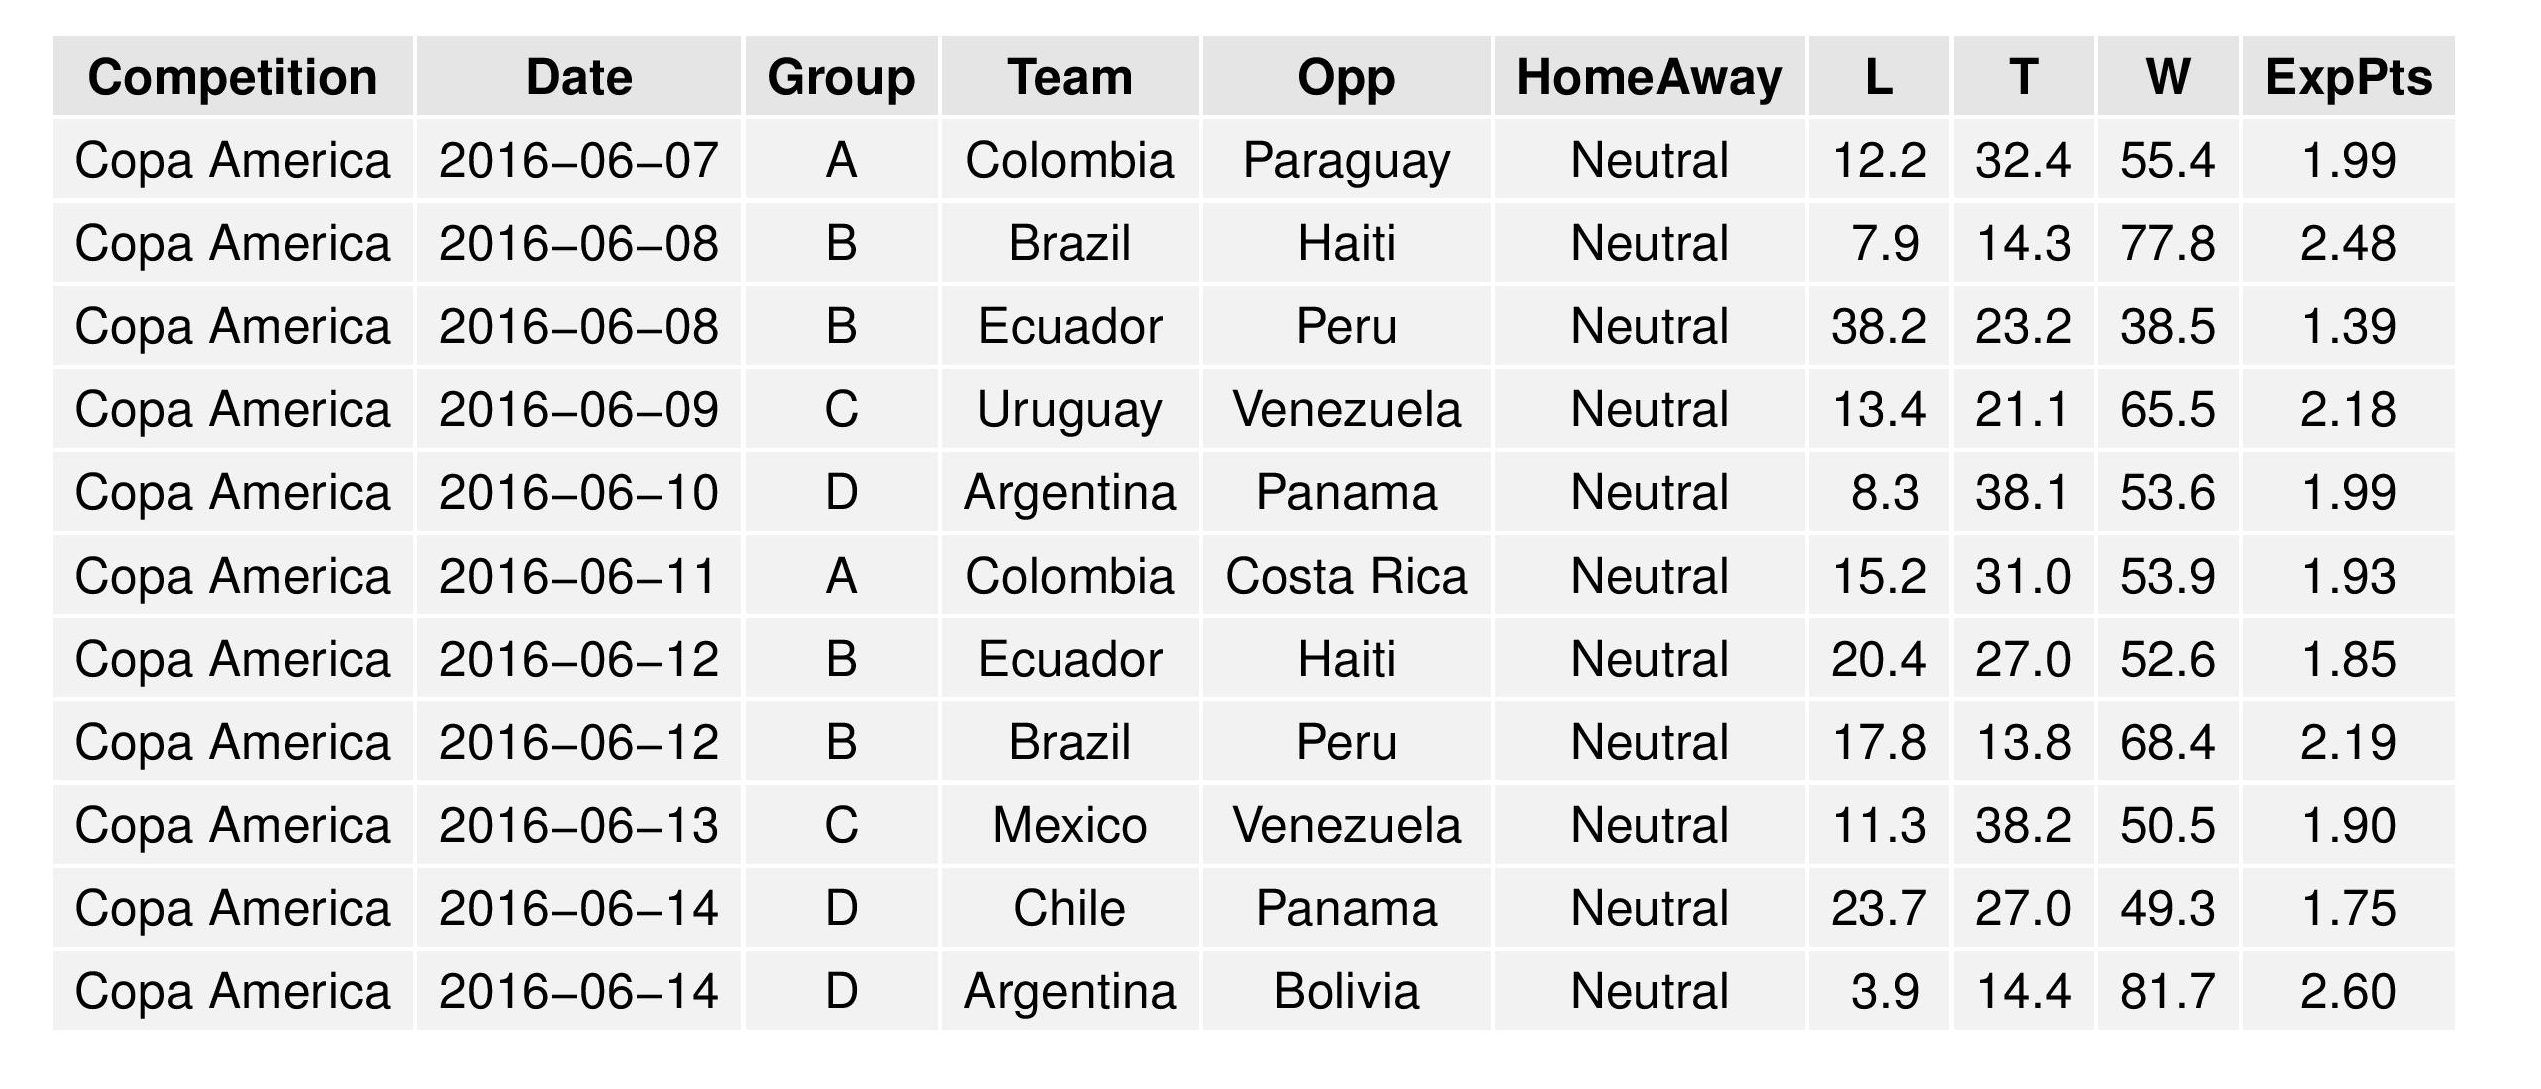
The first table below shows which result is better for the USMNT for each of the first round of games in terms of their winning the Copa America Centenario.
The second table shows how each result affects other goals (such as advancing from Group, winning the Quarterfinal, and winning the Semifinal) as these goals are not always aligned with the championship.
The BestRes column is the ideal result (for that objective) from the “Team” perspective. For example, other than USA’s match, it would most benefit the USMNT if Haiti defeats Brazil (to help avoid playing Brazil in the quarter finals). “Lift” is the probability percentage increase that would happen if this result occurred over the current projections.
Power Rankings
The “Power Rankings” we concoct are the actual “strength” of the team according to competitive expectations:
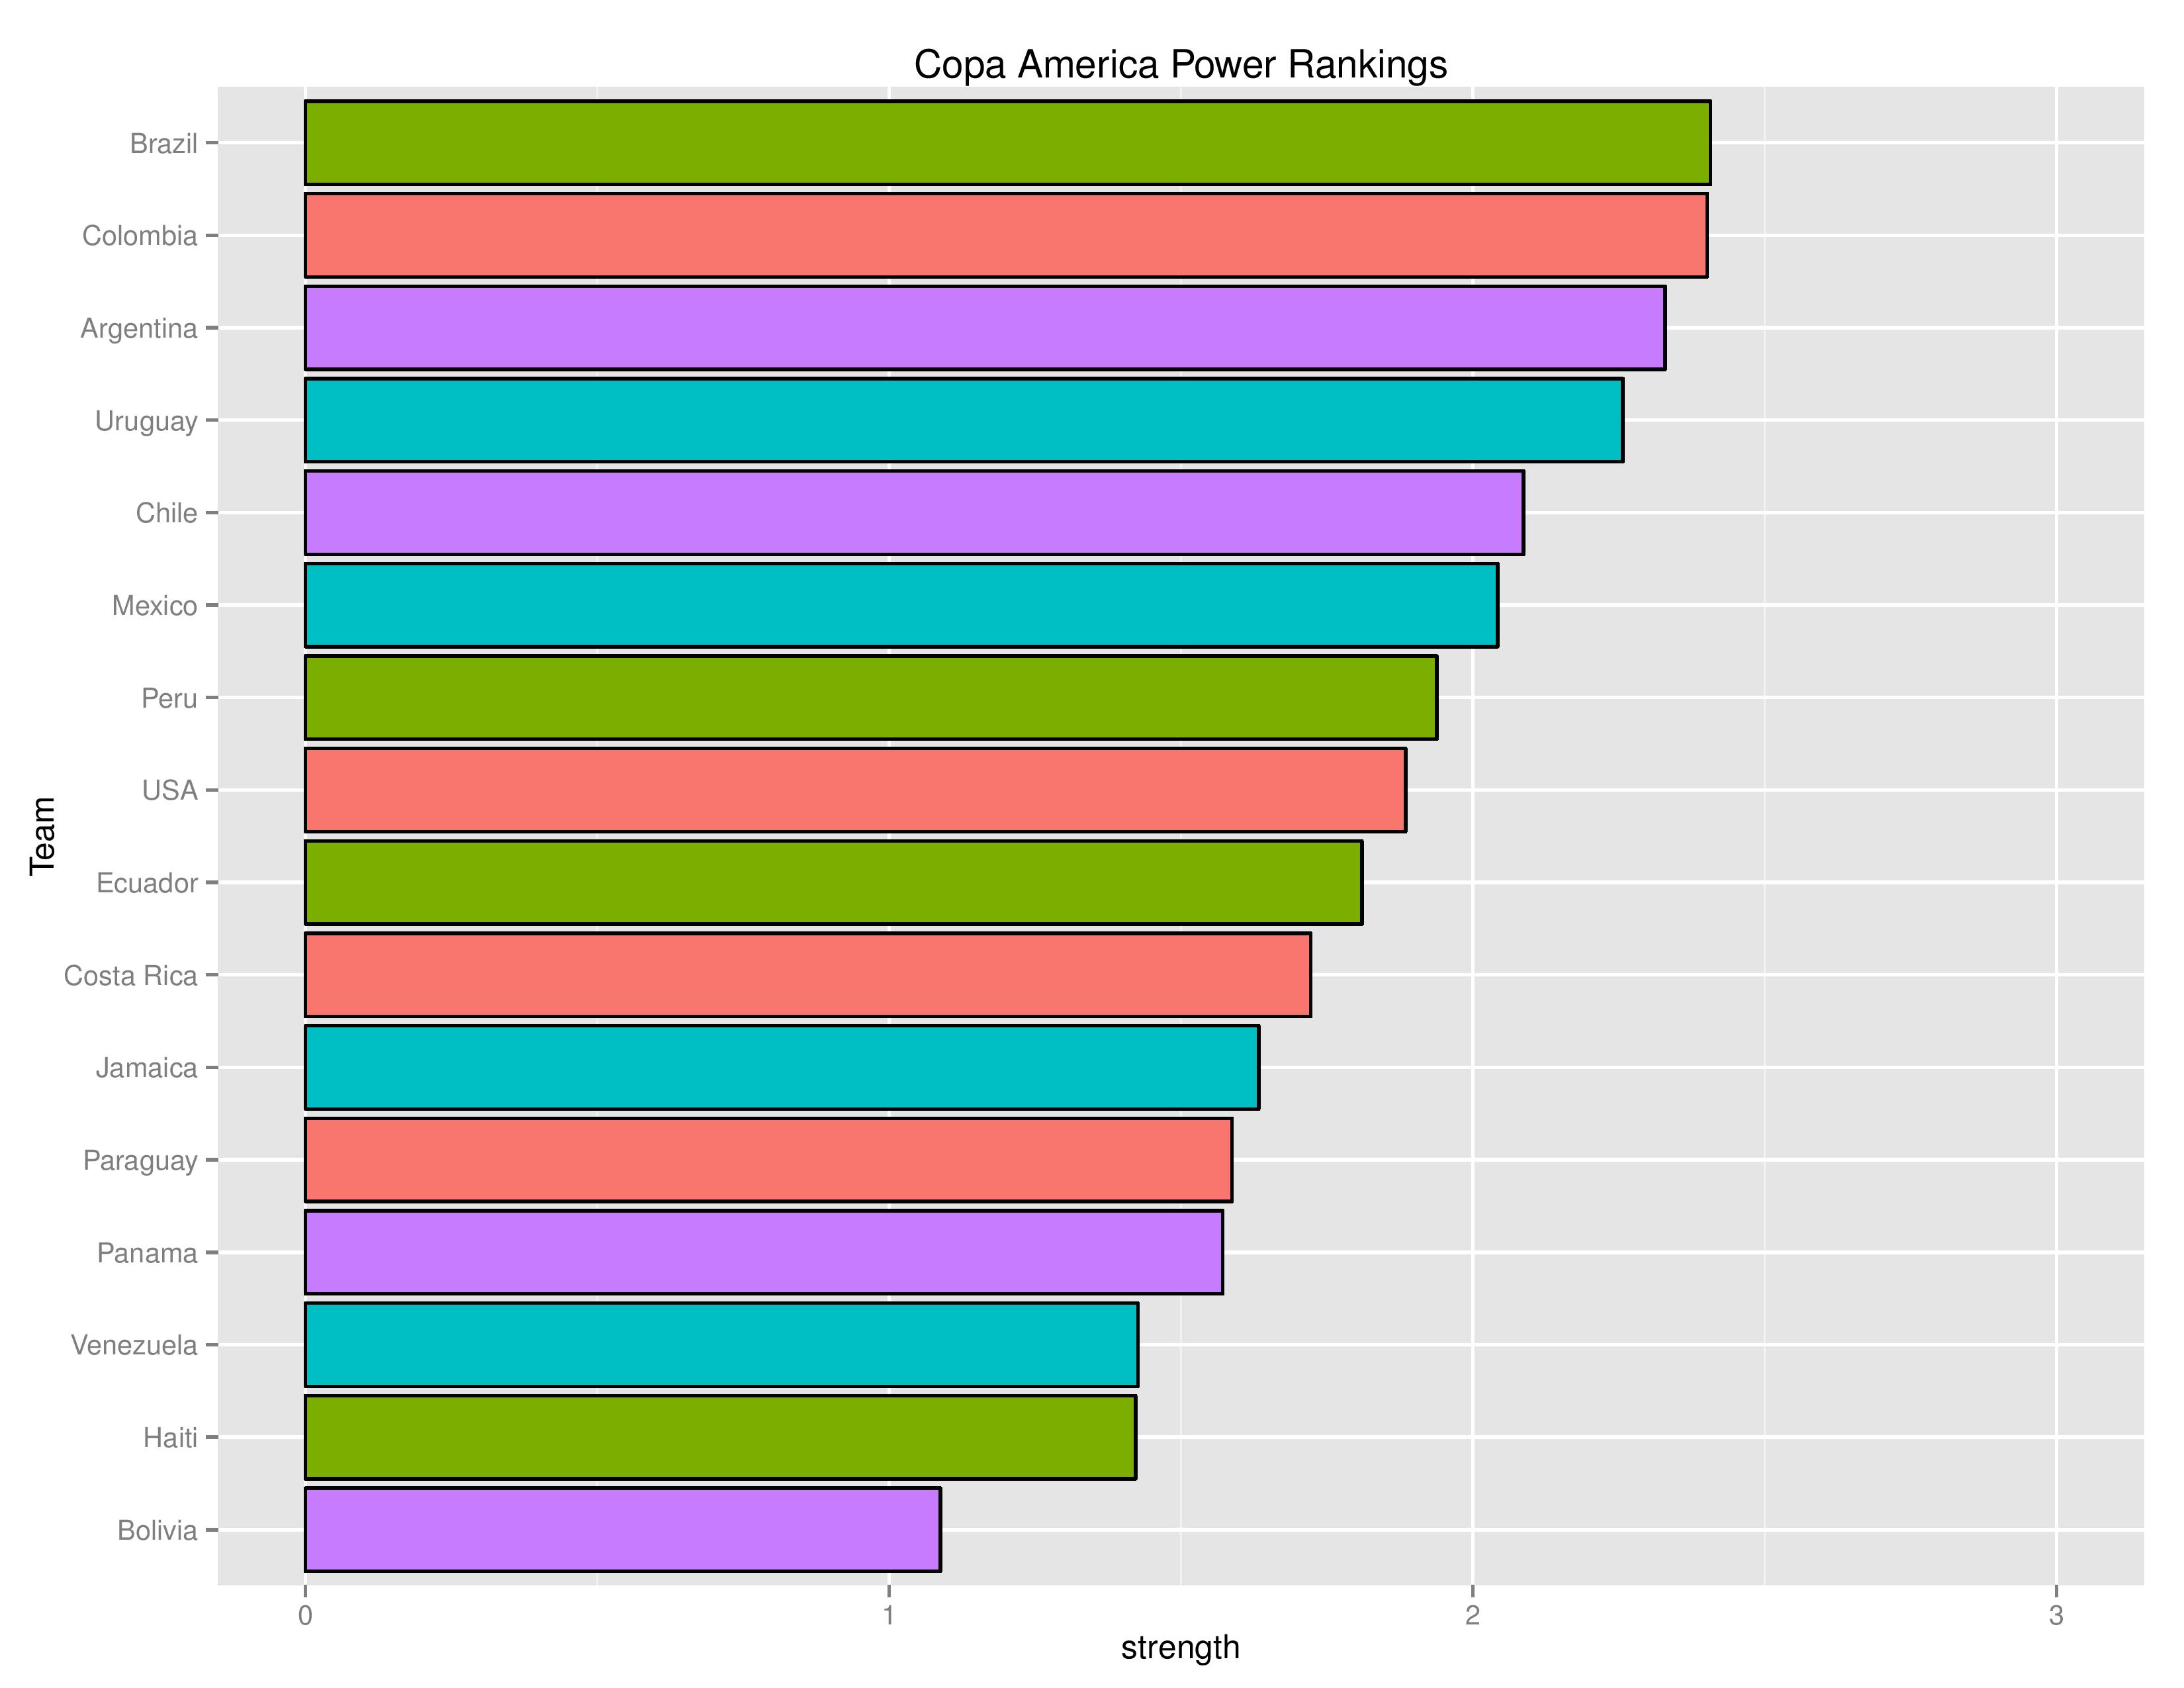
USA fell below Peru since the last set of rankings and Venezuela moved ahead of Haiti. Also noteworthy is that, while Colombia remains in second, their relative strength has now closed the gap significantly with Brazil.
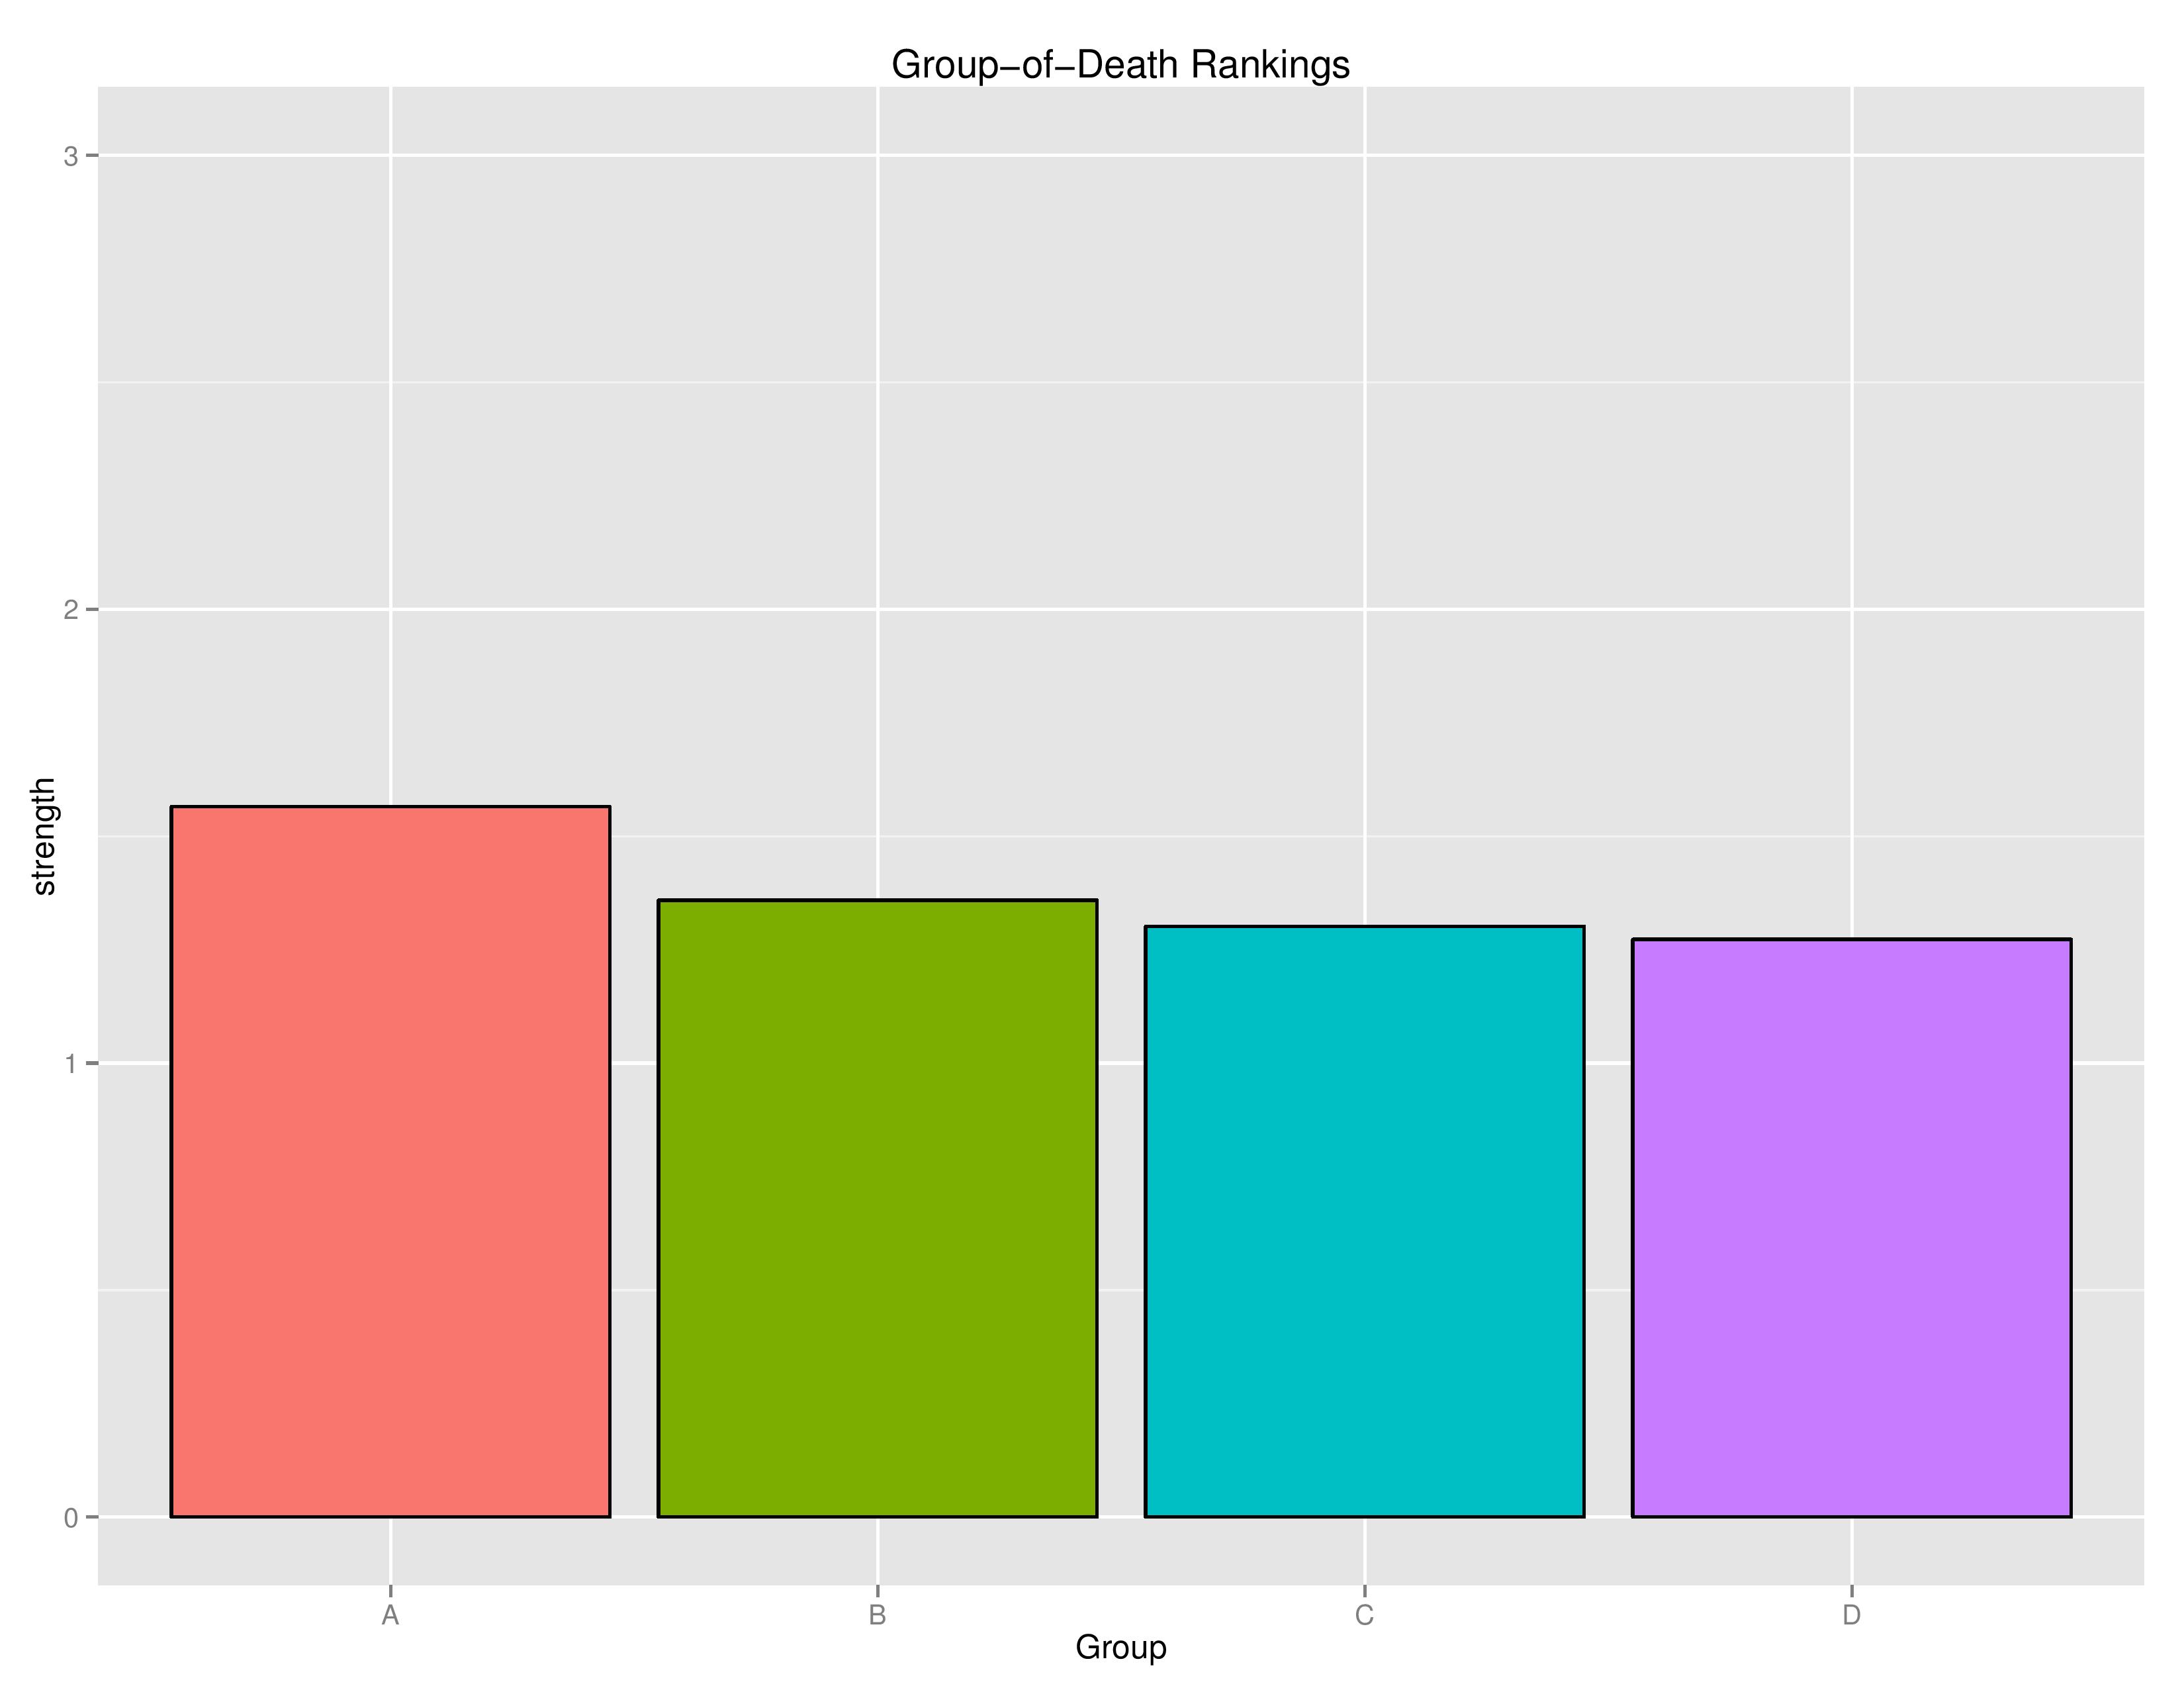
Group A is clearly still the group-of-death containing USA, Colombia, Costa Rica, and Paraguay. This is largely because it lacks a clear weak opponent such as Bolivia, but nevertheless contains one of the best teams in the World in Colombia as well as the tournament host in the USA.
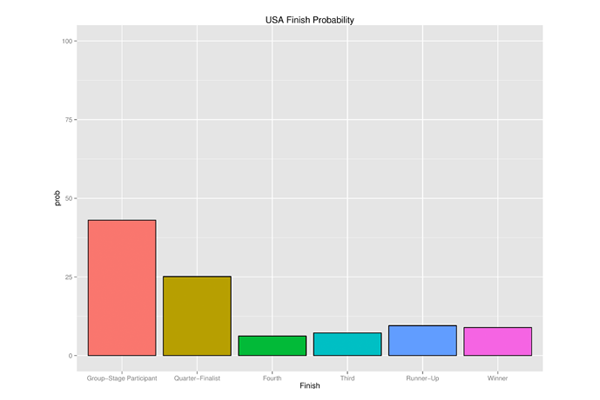
Probability Outcomes
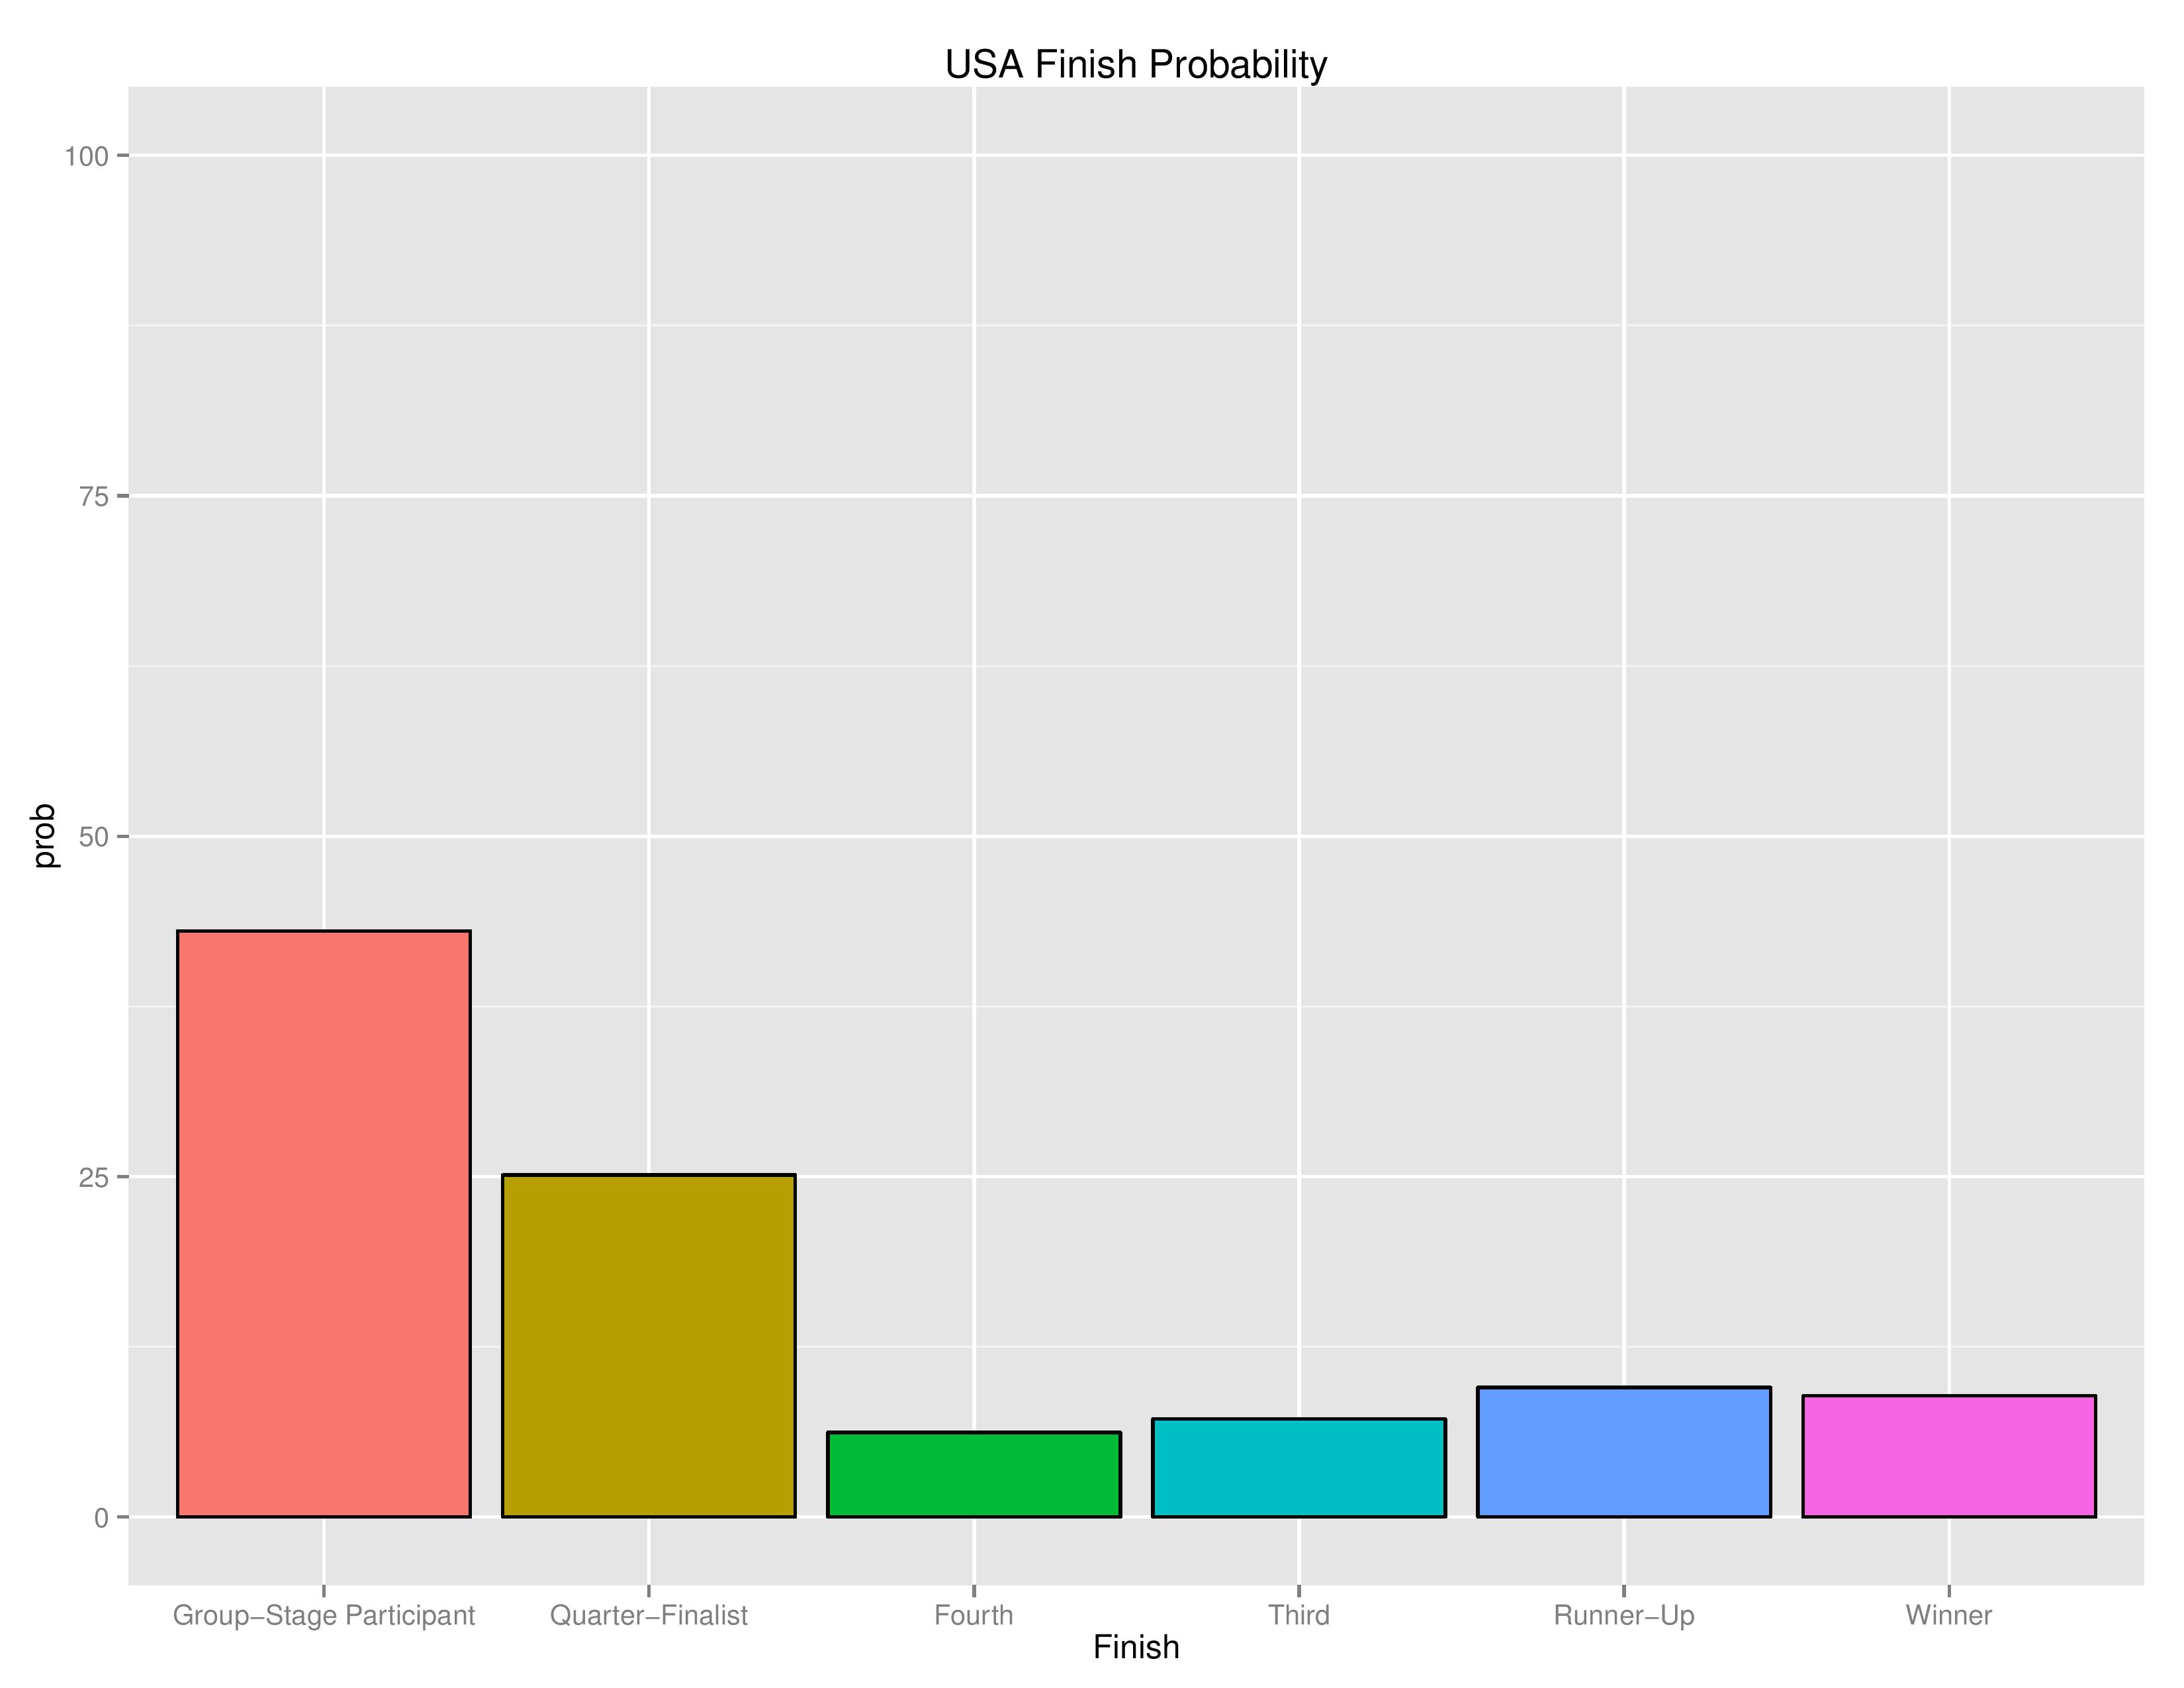
The chart above shows the probabilities of the USA team finishing in different outcomes. Remember, “Group-Stage Participant” is, by default, eight times as likely as “Winner.” Last week “Quarterfinalist” outranked “Group-Stage Participant” despite the latter containing more members. This week, as you can see, USA’s odds of advancing through the group stage have now, obviously, decreased.
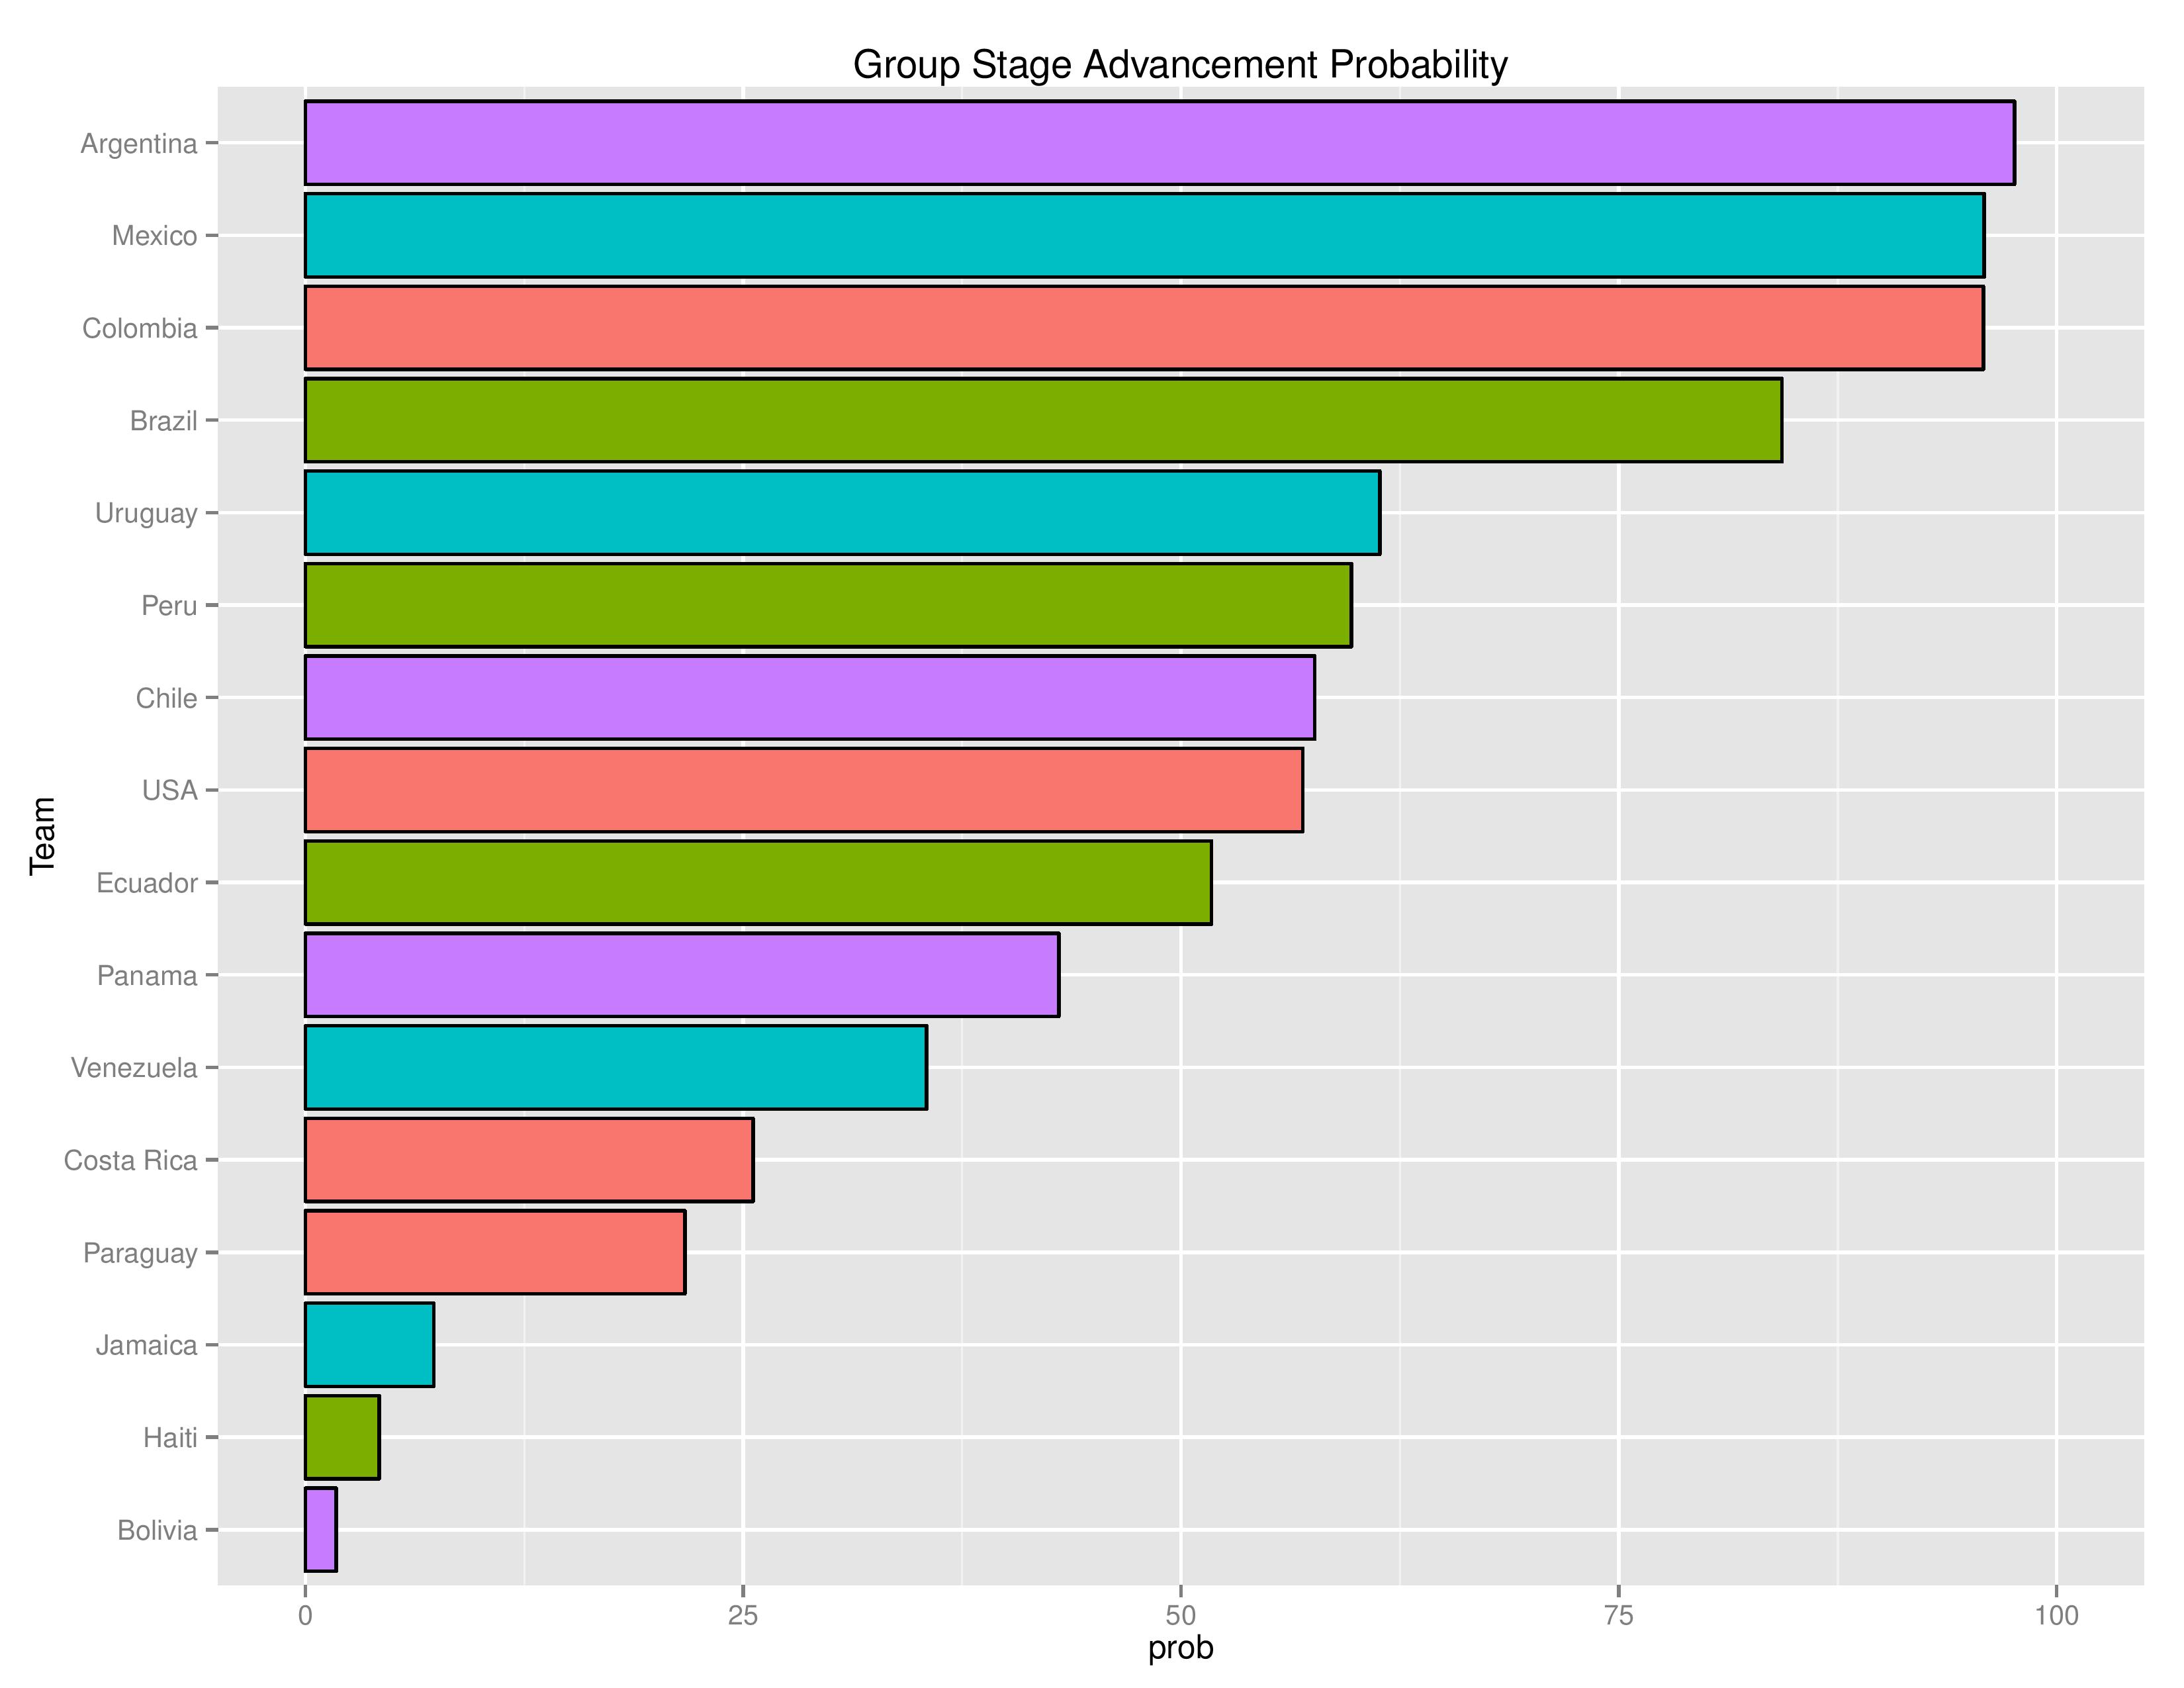
This shows the probabilities of each team advancing through the group stage with the colors designating the group the team belongs to. USA is the still second-most-likely team to advance from Group A. According to SEBA, the US has a 57.0% chance of advancing through the group, which is down from 73.3% prior to the first round of matches. With Argentina, Colombia, and Mexico all having already defeated their likely most difficult opponents (according to SEBA), they are expected to have nearly clinched group-stage-advancement.
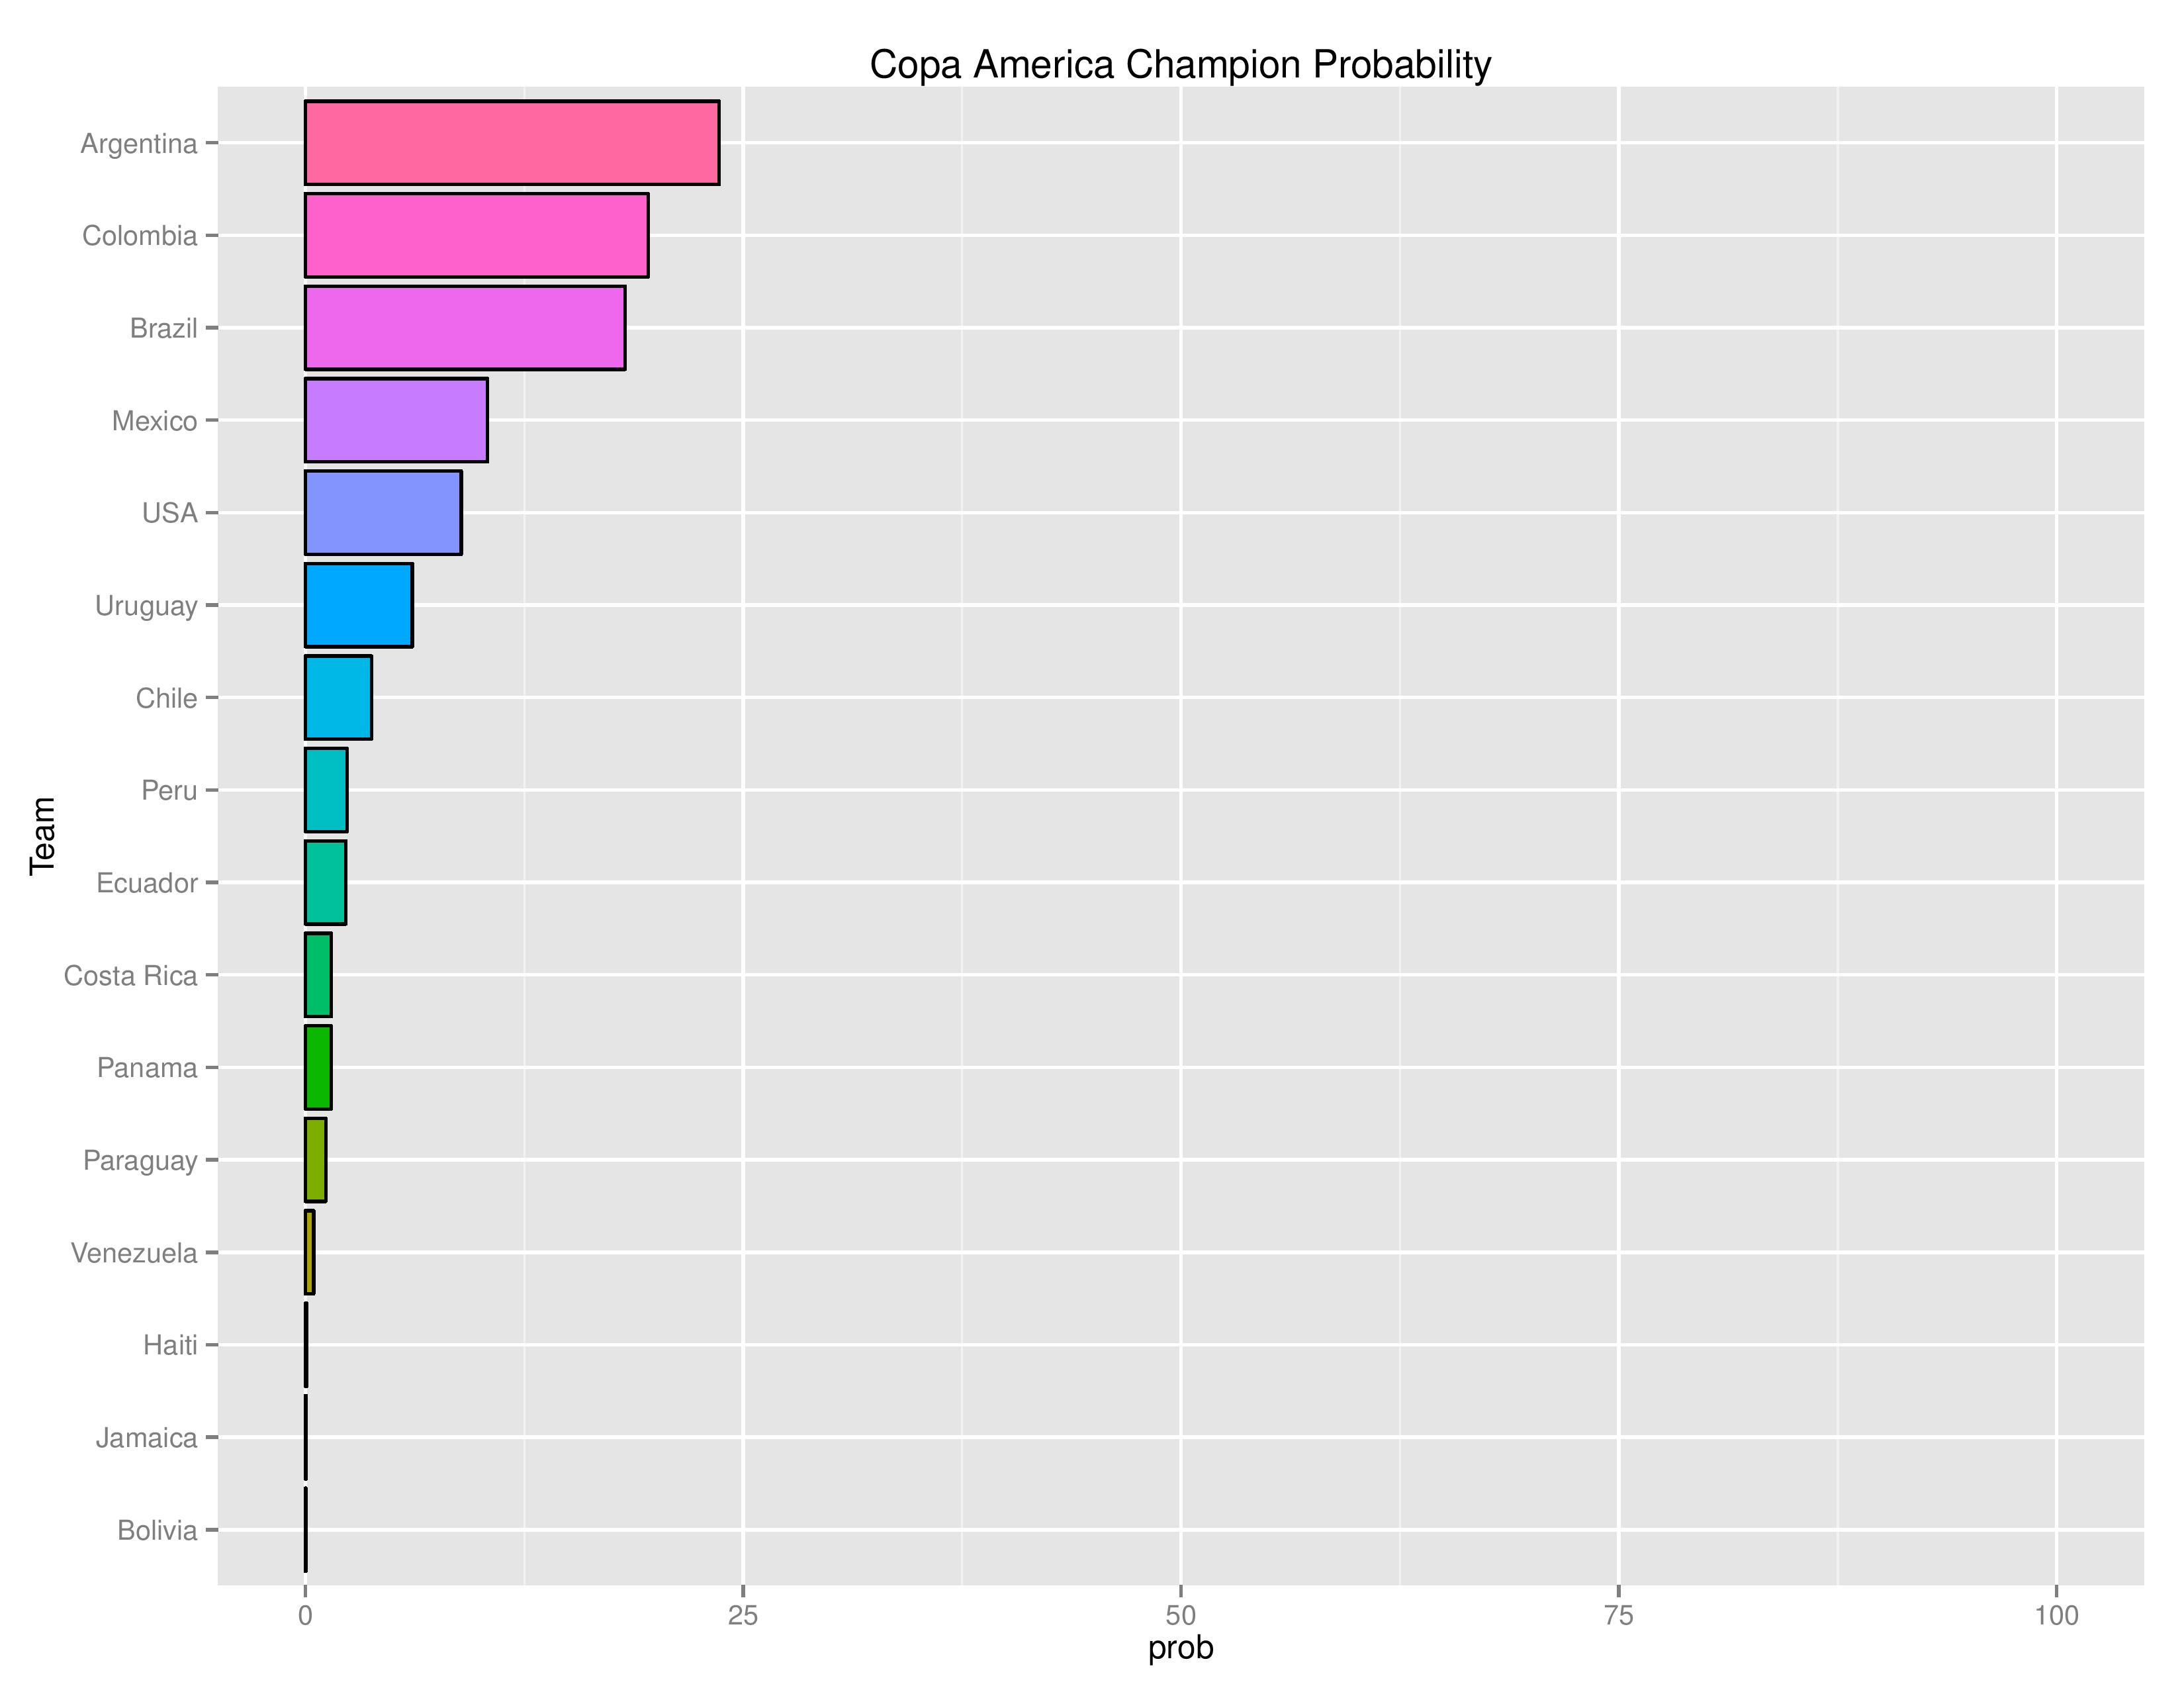
The above shows the USA having dropped from the fourth best odds of winning (12.5%) to the fifth (8.9%) with Mexico having moved from sixth to fourth with their win over Uruguay. Argentina is the favorite, despite their 3rd-place power-ranking, due to their anticipated schedule.
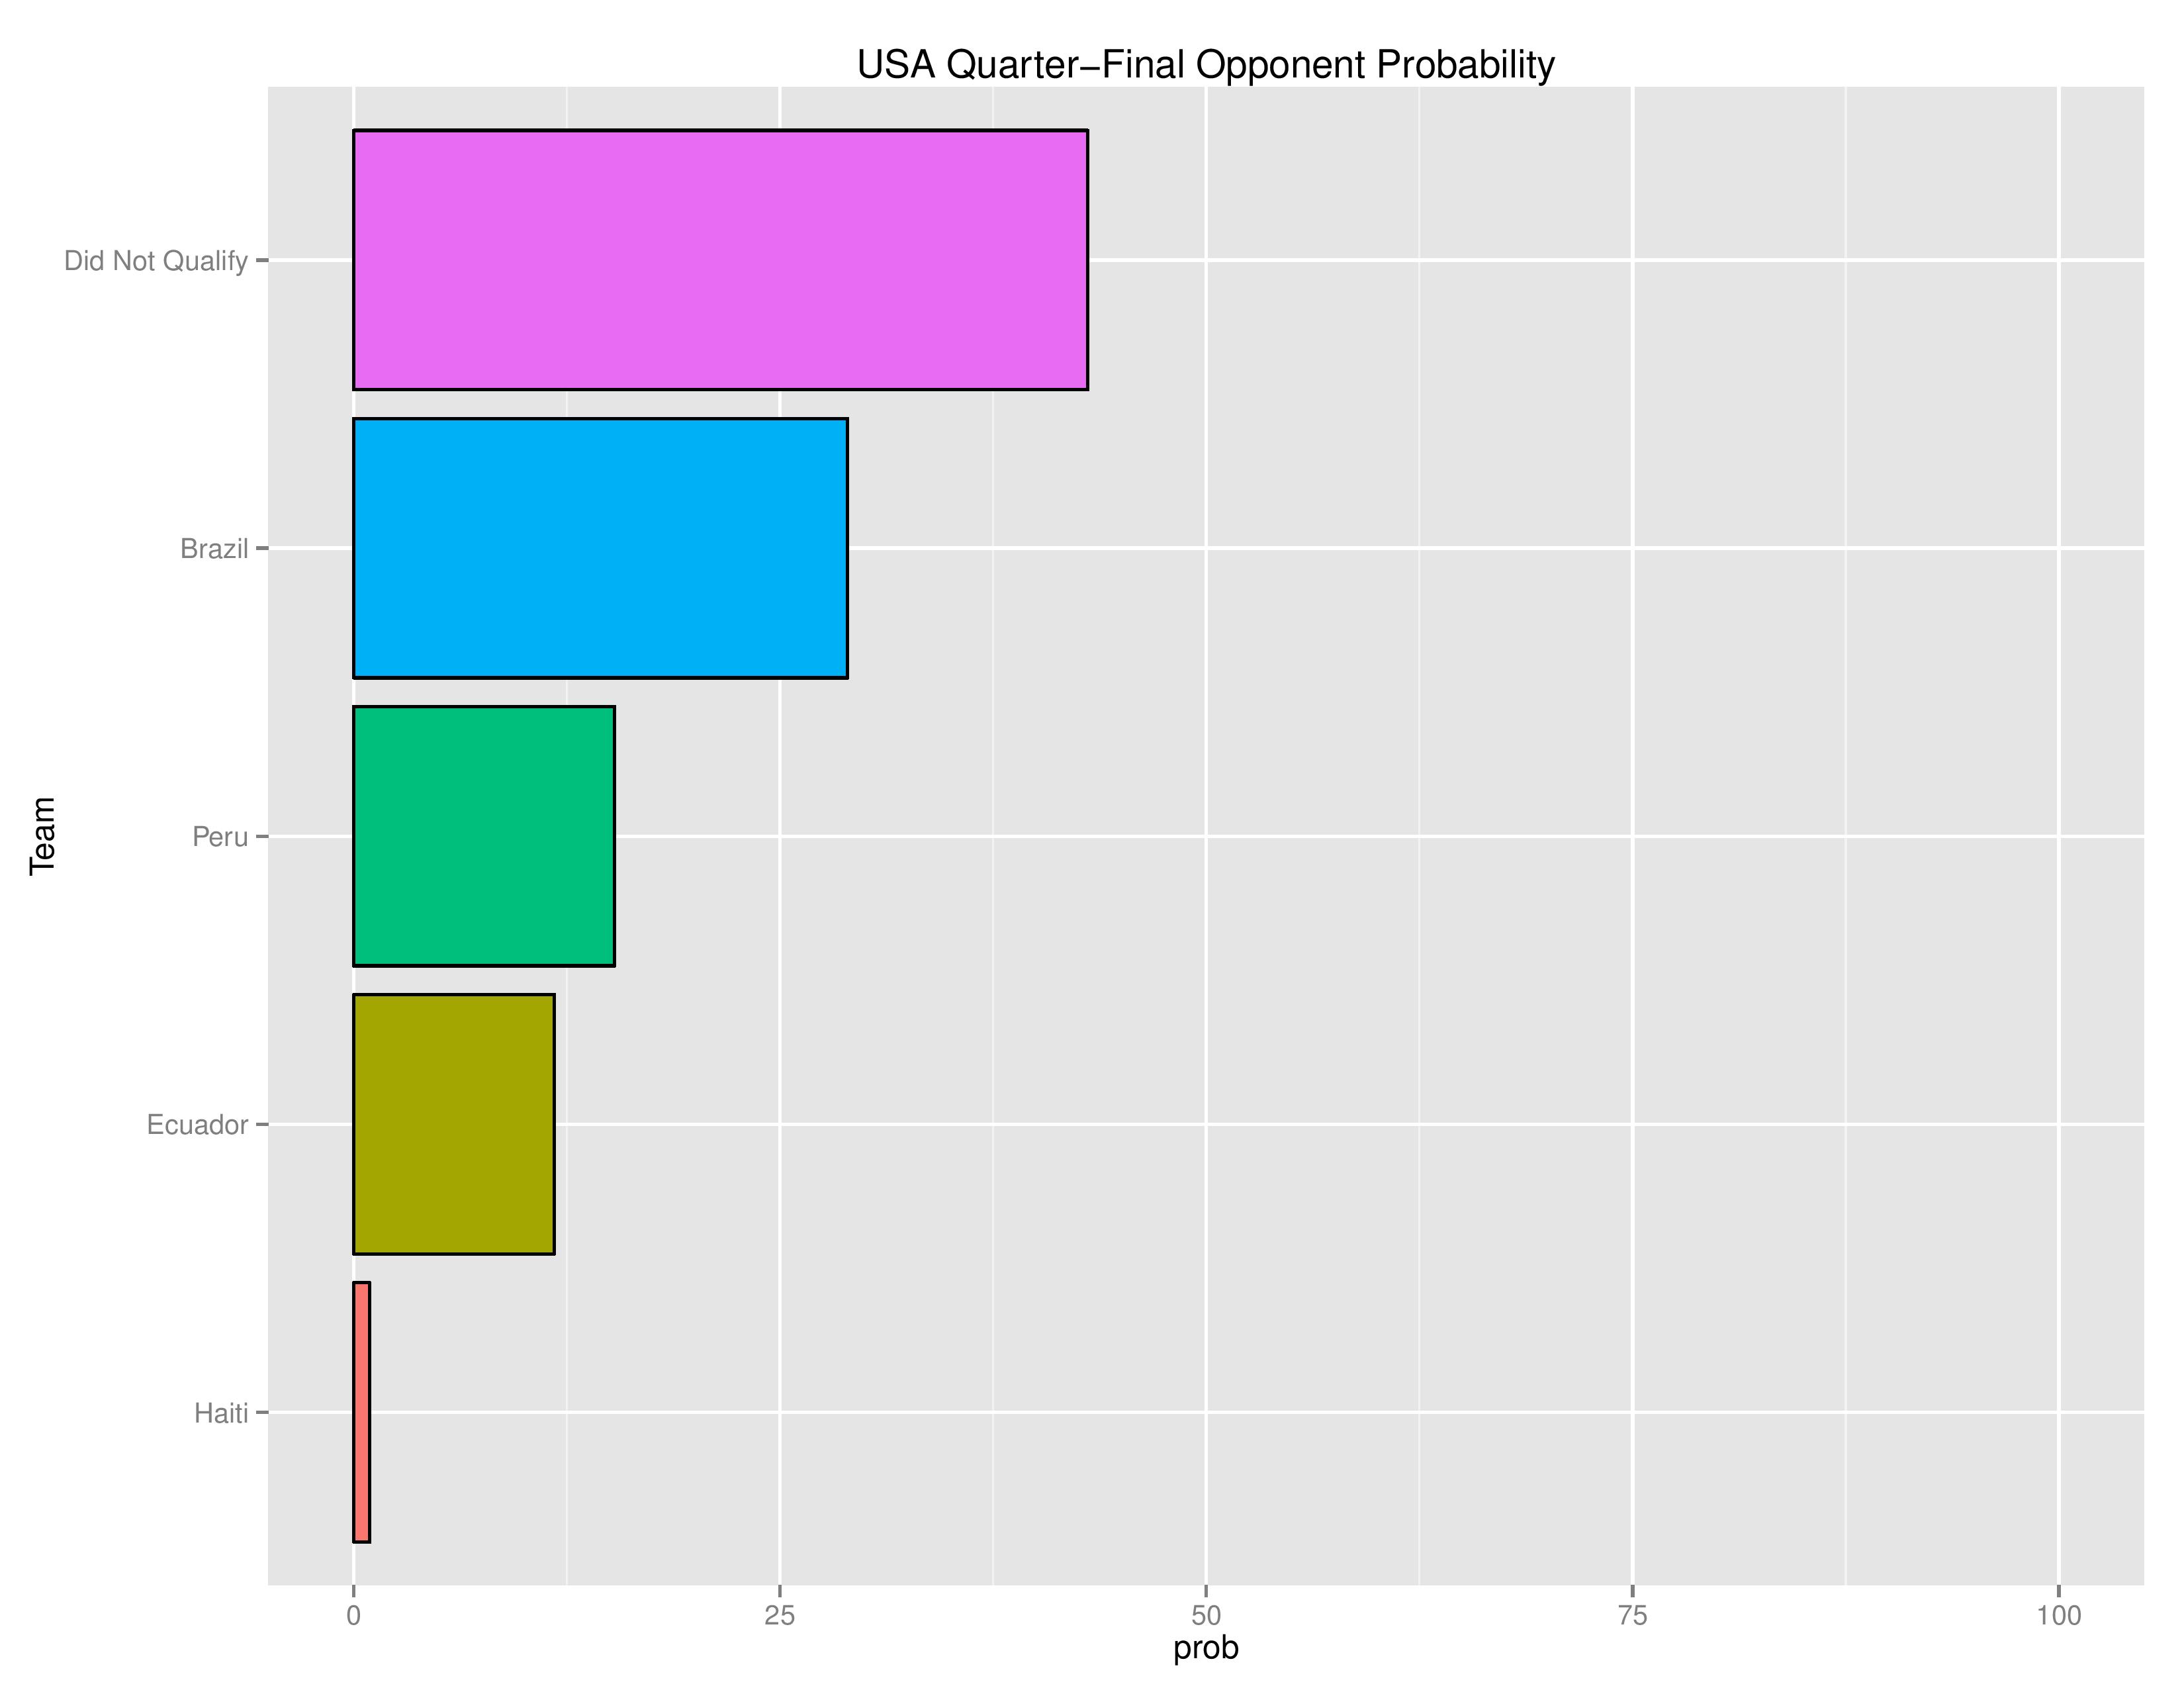
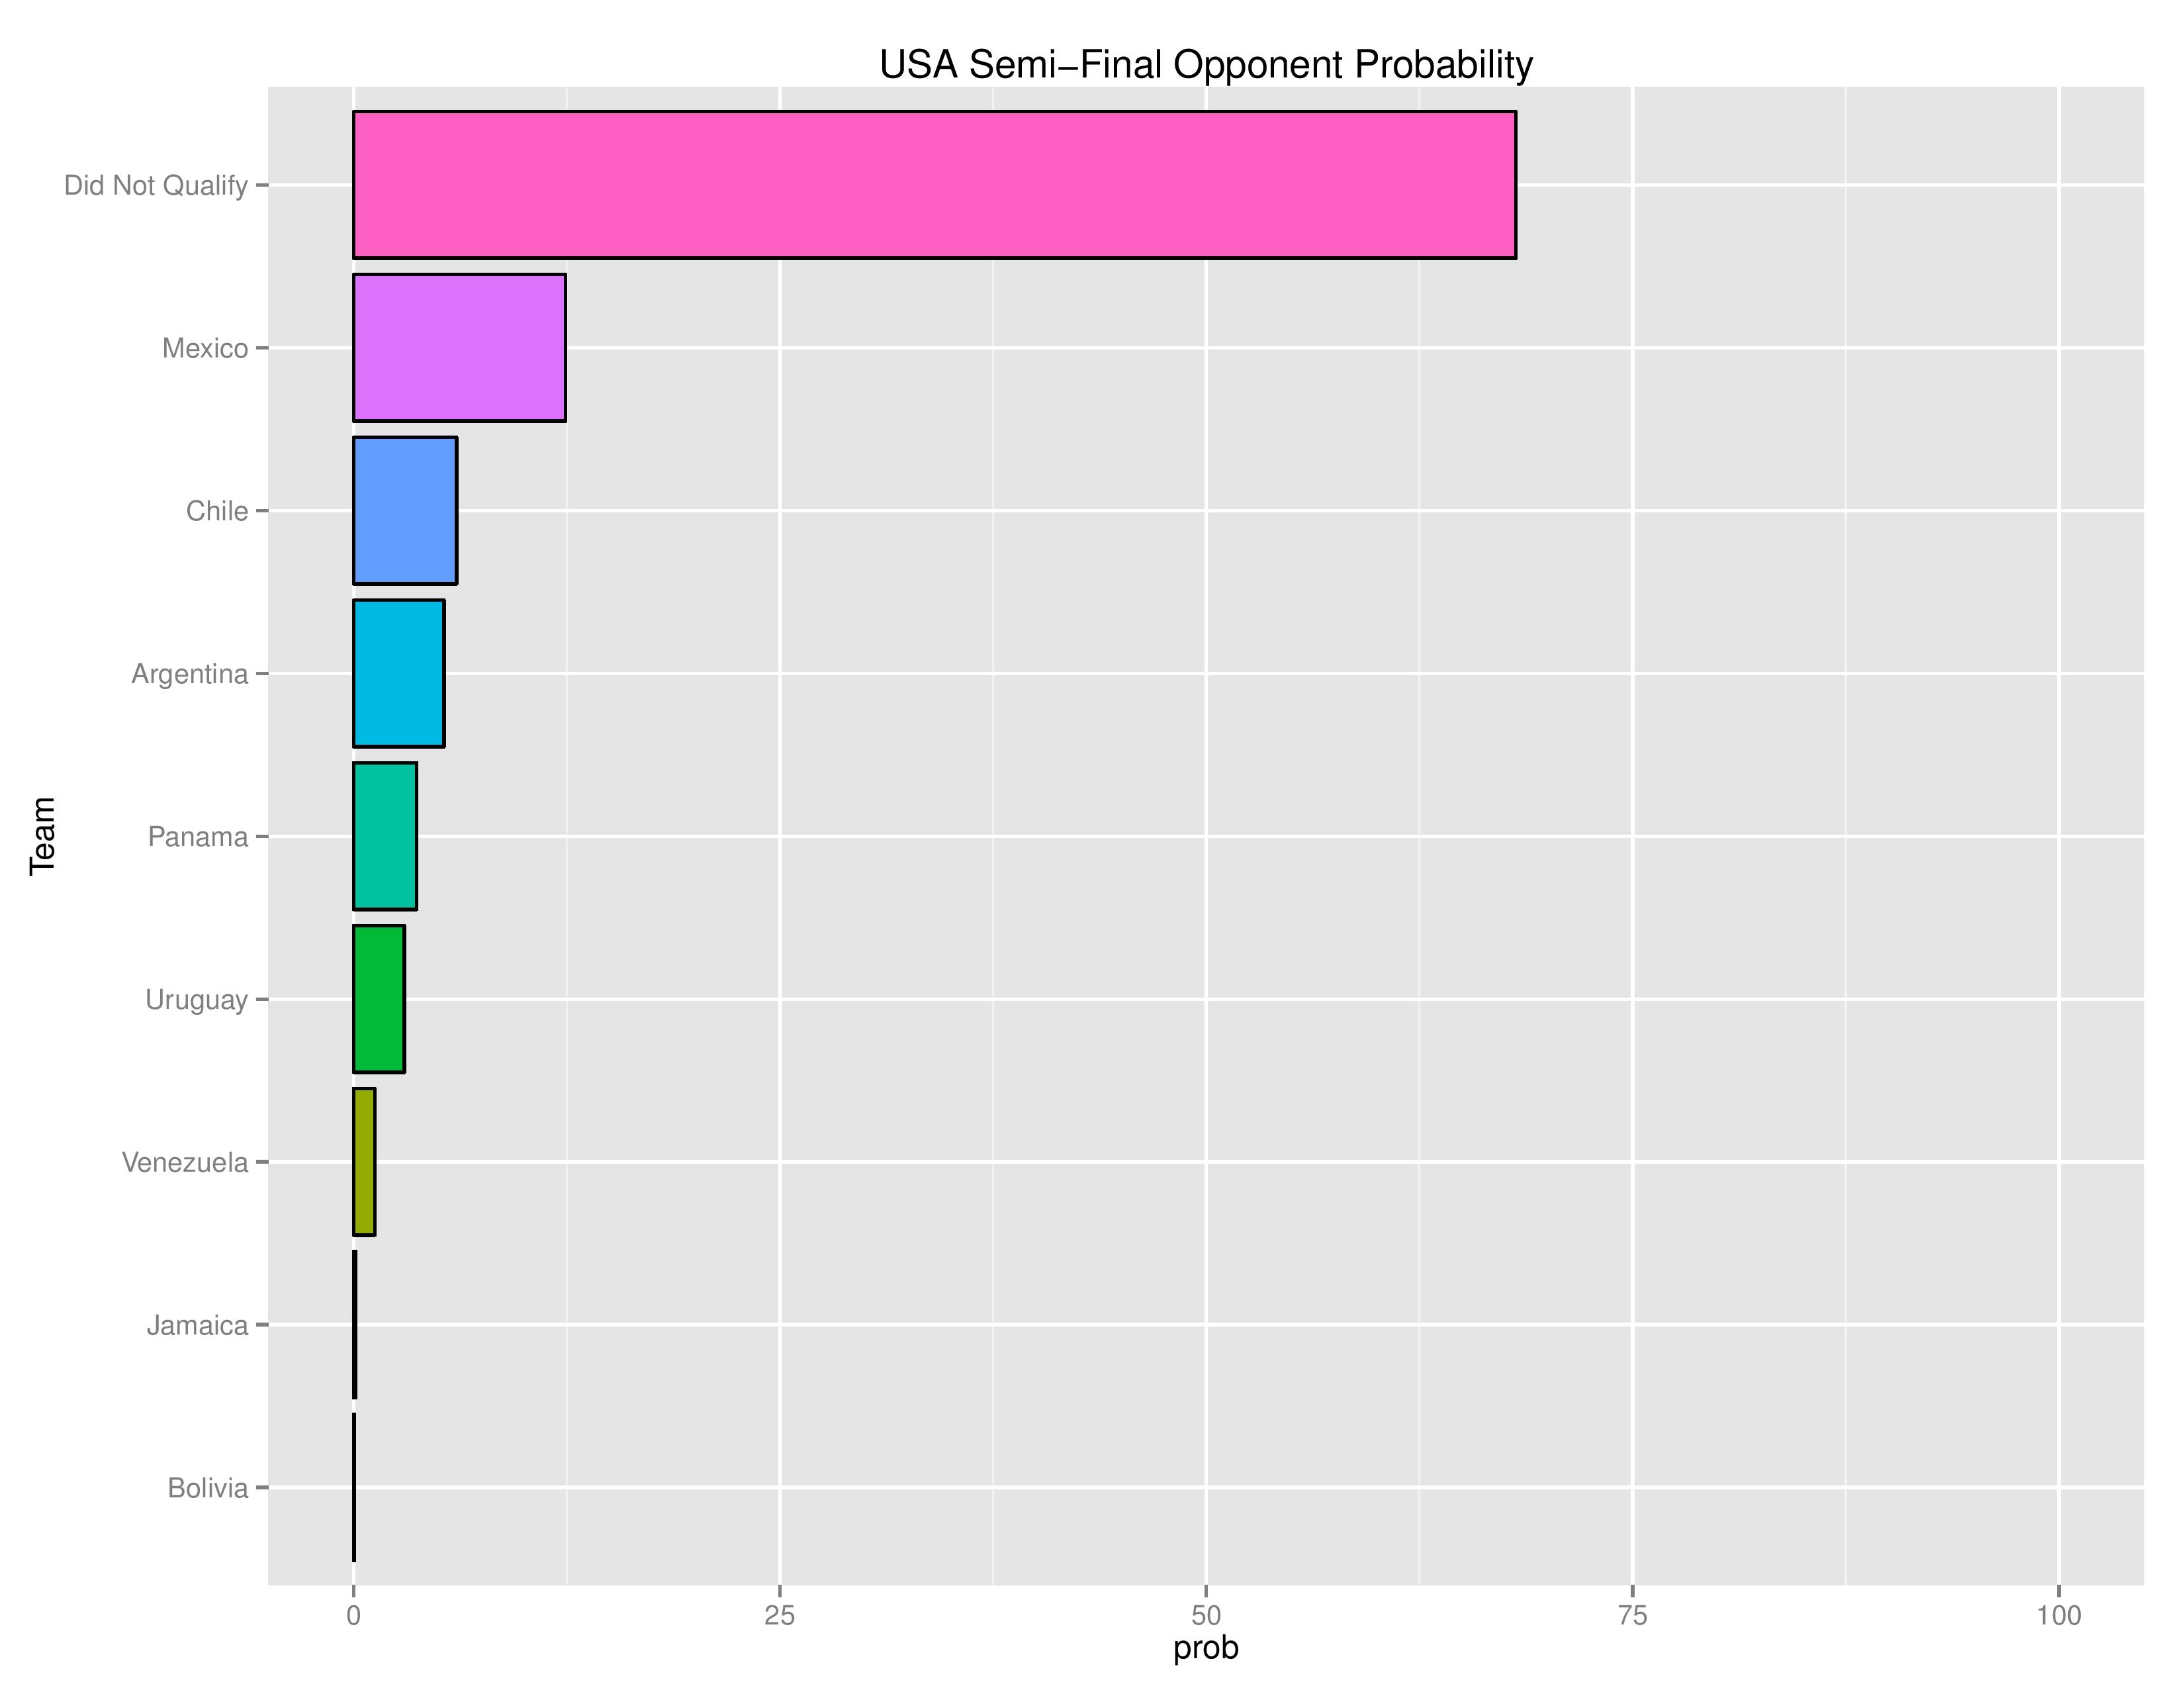
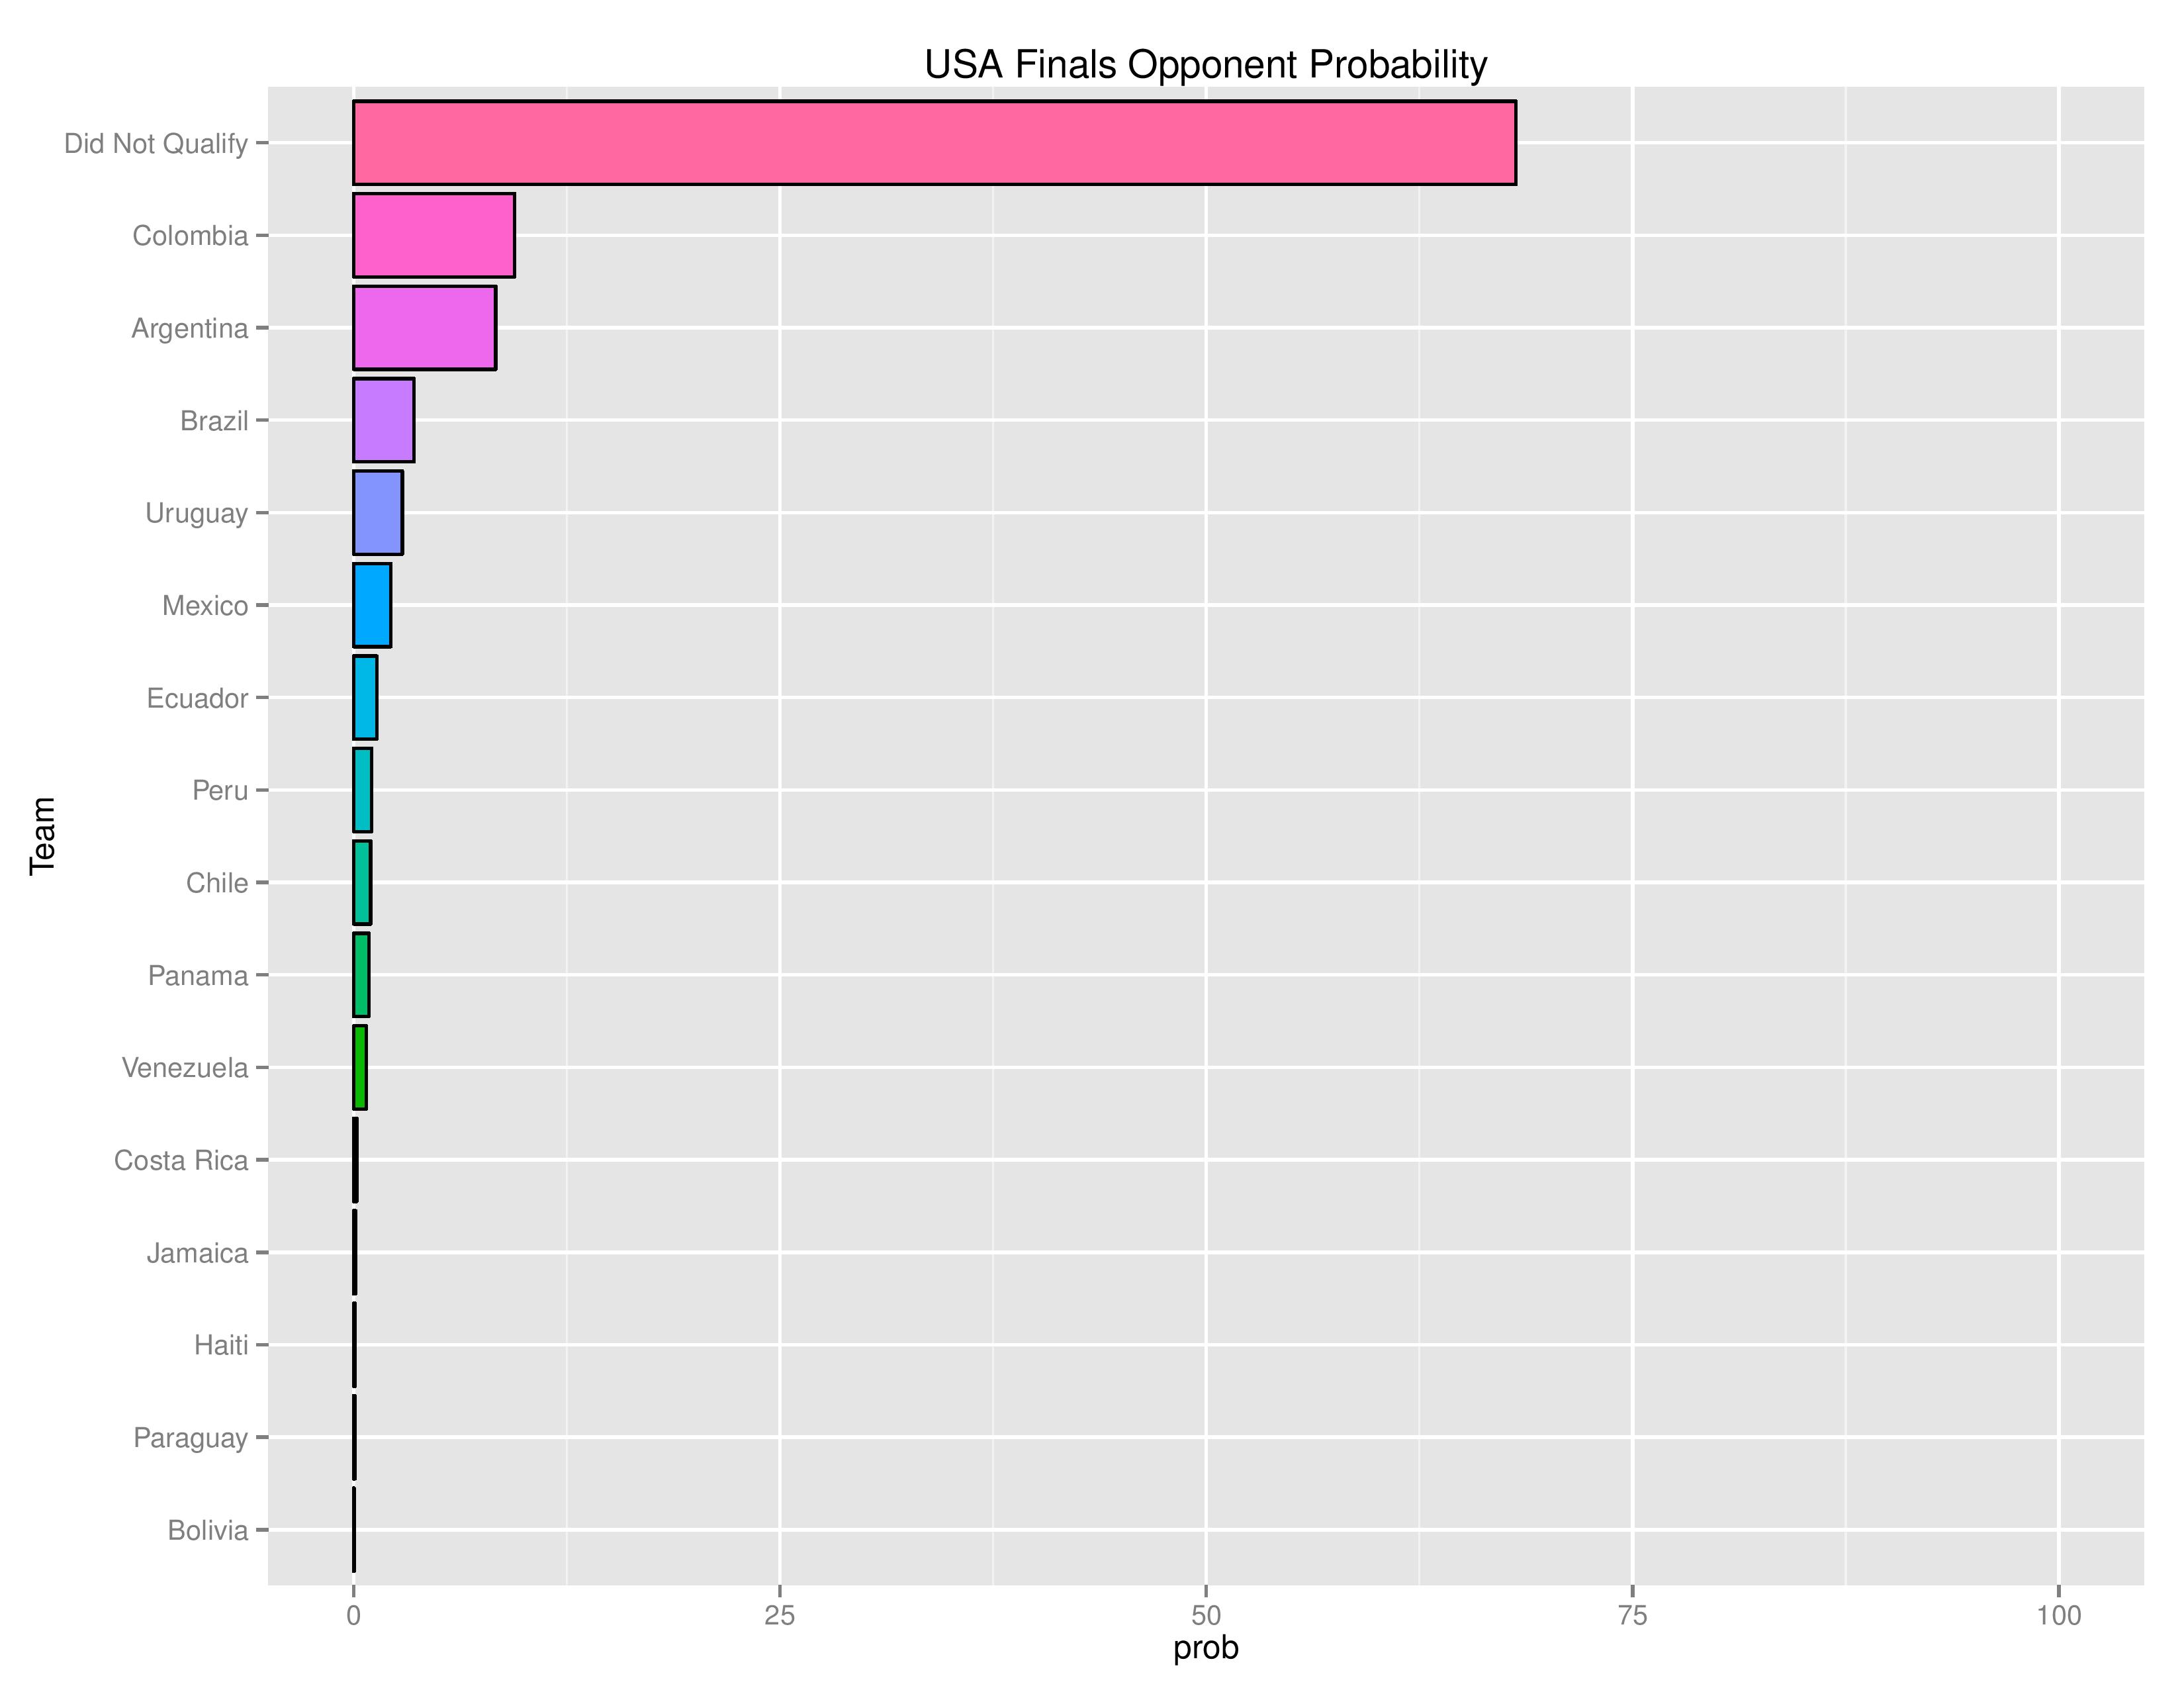
Opponent Probabilities
Below we can see, as the tournament progresses, who the USMNT will likely be playing at each stage (assuming they make it to the stage in question)
The following shows the expected probability distribution of results for each of USA’s group games.
And, finally, the following shows the rest of the probability expectations for Copa America games:

RECENT COMMENTS