We’re pleased to welcome Chris Sherman, a data scientist who will have a regular column using SEBA Projections to create power rankings and the Union’s probabilities of reaching the playoffs, winning the Supporters Shield, the MLS Cup, and more.
Being a data scientist, I dislike making uninformed decisions. I imagine most others aren’t thrilled about the idea of winging decisions, but I loathe it. Sure, I can choose a movie or take-out without an algorithm, but I wouldn’t guarantee that won’t change in the future.
I built a program to help me match home-brewing recipes to my leftover ingredients since it bothered me to slog through recipes inefficiently on my own. I built a scoring algorithm to help me rank the houses I’m considering buying (as I attempt to move back to the Philly area from DC in the next couple of months) because it got frustrating trying to keep track of all the aspects of houses that I care about. I made an entire suite of programs to help me play fantasy football because I don’t like making imperfect decisions when I have a better strategy.
Which leads me to soccer. I love the Philadelphia Union, and I watch every game, but I rarely know what to make of season and how it is progressing. I can look at the standings and see how many points ahead/behind the Union might be in the playoff race, but trying to reconcile that with home/away and remaining strength of schedule of rivals simply frustrates me.
So I built a system. I built a model, and using the inherent uncertainty/luck surrounding the predictions of every game, I run 10,000 simulations of every season (probably more once I upgrade the RAM in my computer). The results help me understand the impact of each game, and understand the future prospects for the Union, help me set expectations for games, and they help me figure out what to look forward to. So, I thought I would share the results with you.
Welcome to the Statistical Extrapolation Bayesian Analyzer Projection System, which is, of course, a tortured gathering of words used to create the SEBA Projection System.
Below are the current season forecasts using data from games through May 15, 2016.
Power Rankings
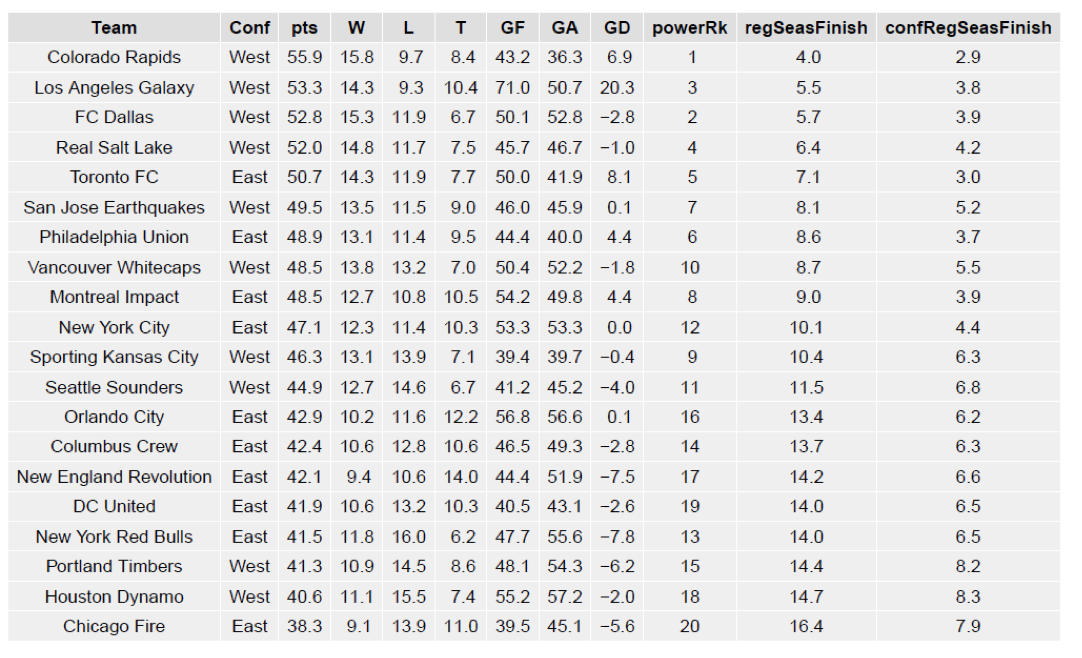
The “Power Rankings” we concoct are the actual “strength” of the team according to competitive expectations:
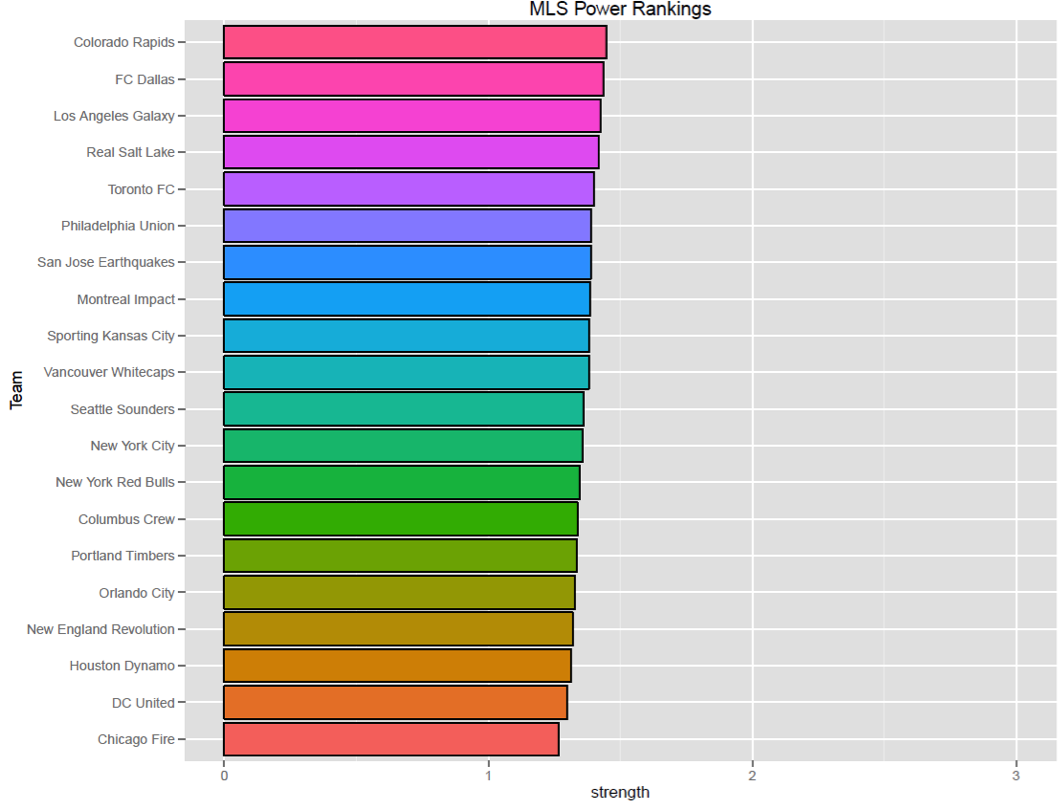
As you can see, the Union come in at No. 6 in our rankings. For comparison, ESPN and MLSsoccer.com has them at No. 3 in their latest rankings, while SI and Soccer America also have them at No. 6. Last week, SEBA had the Union at No. 8, so the two draws led to an improvement.
Playoffs probability and more
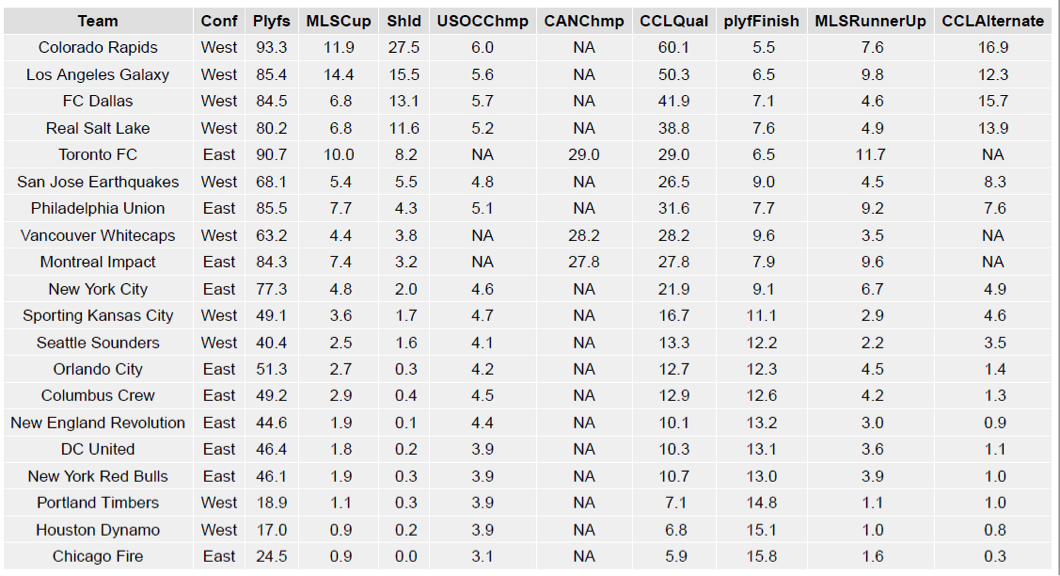
The following charts show the probabilities for making the playoffs, winning the Supporters’ Shield, winning the MLS Cup, winning the USOC Cup, and qualification for CONCACAF Champions League.
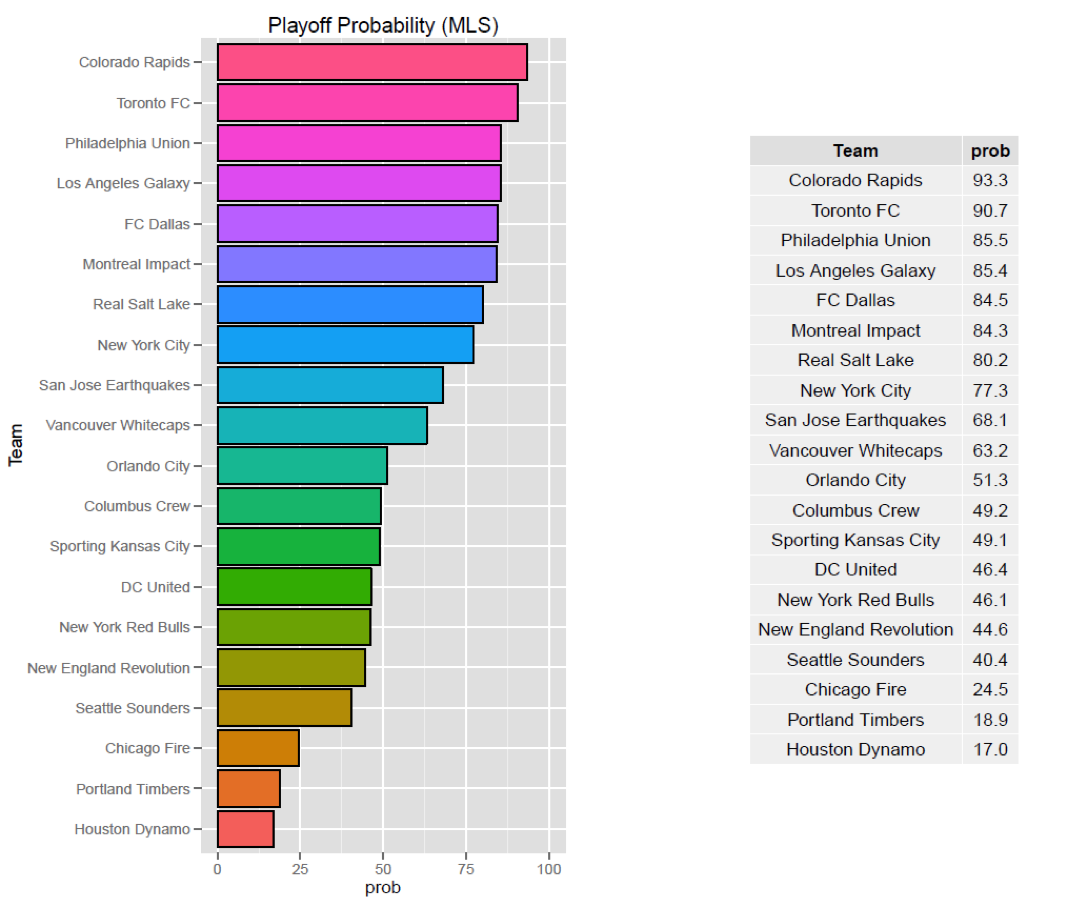
At 85.5%, the Union are in a great position to make the playoffs. If you’re wondering why it would be so high this early in the season, also keep in mind that, by default, all teams start the season at 60% if you consider them all equal in skill. Last week, Philadelphia was at 85.2% so, not much difference, but at least the direction is positive.
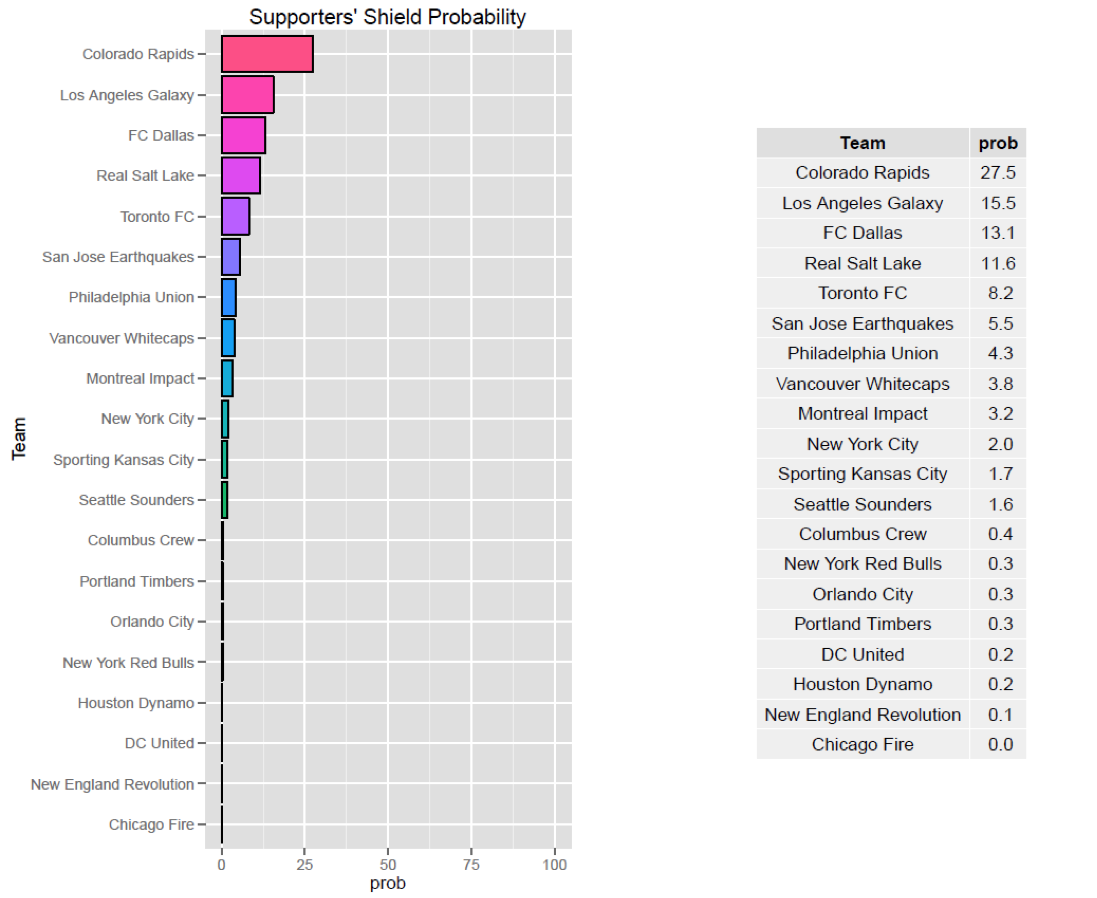
The Union are the 7th most likely team to win the Supporters’ Shield at 4.3%. Sadly, last week, the Union were at 6.2% as a Home Draw (even against Los Angeles) is not likely to keep pace with the single-table leaders of Colorado.
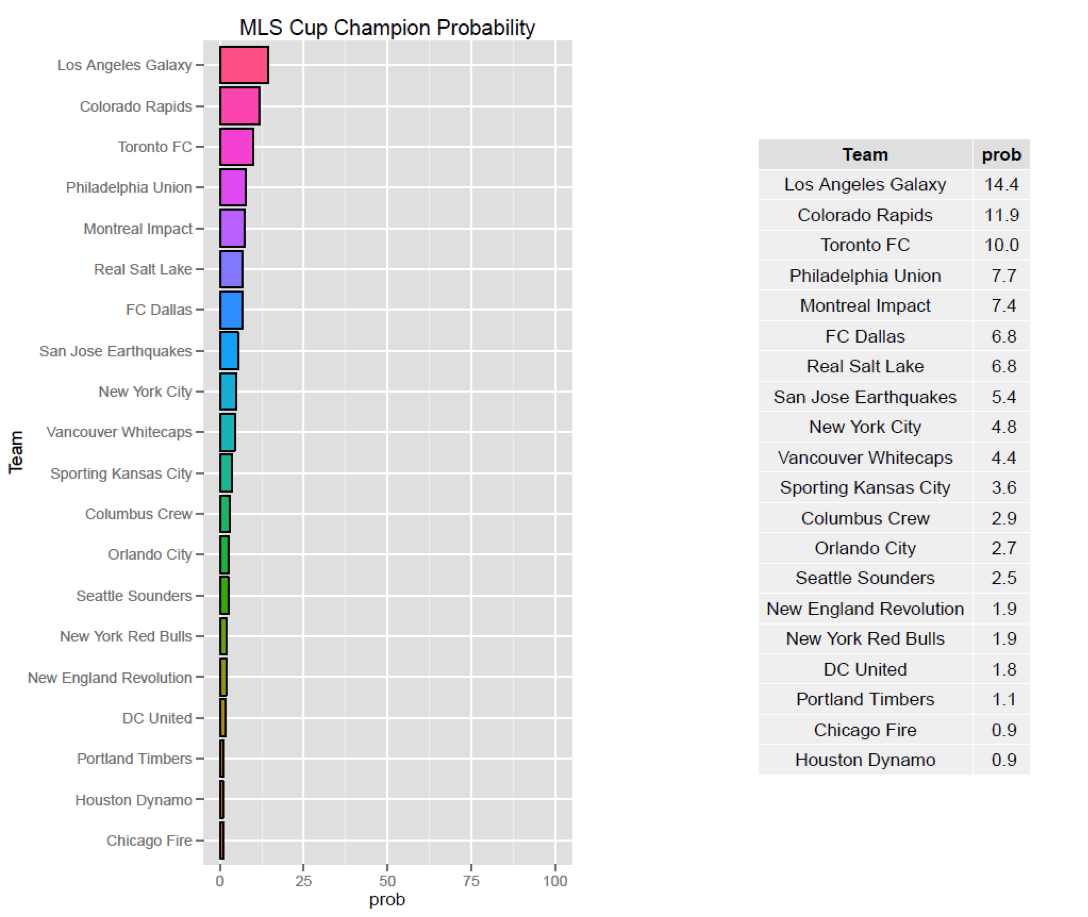
At 7.7%, the Union actually have quite healthy odds of winning it all. This may seem crazy to all of us given our fandom suffering these past few years, but with the Eastern Conference being fairly weak, and the Union’s excellent start, Philadelphia has the 4th best odds of winning the MLS Cup. Last week Philadelphia’s probability was at 6.3% so this week worked out well in the end. It helped that, in all but one cross-conference match (NYCFC defeating Portland on the road), the Eastern Conference had sub-par results (1 home loss, 2 home draws, and 3 away losses).
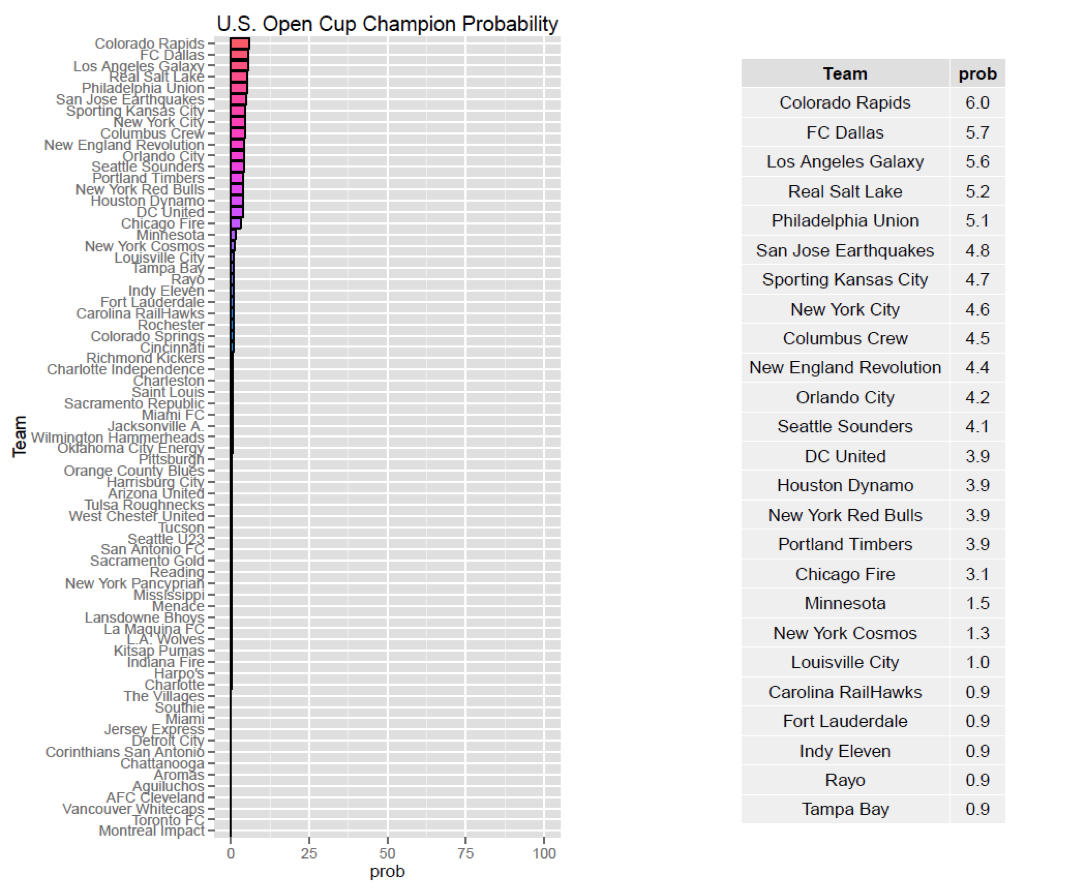
The U.S. Open Cup will always be tight in probabilities as the one-game-format leaves a lot up to chance. The Union’s 5.1% odds are among the best. These odds went down from 5.7% last week.
Edit: The following was based off of the outdated belief that MLS Runner Up qualifies for the CCL. As that slot is now taken by the regular season Conference Winner (whichever one did not win the Supporters’ Shield), these numbers will be slightly off. This will be fixed in future editions.
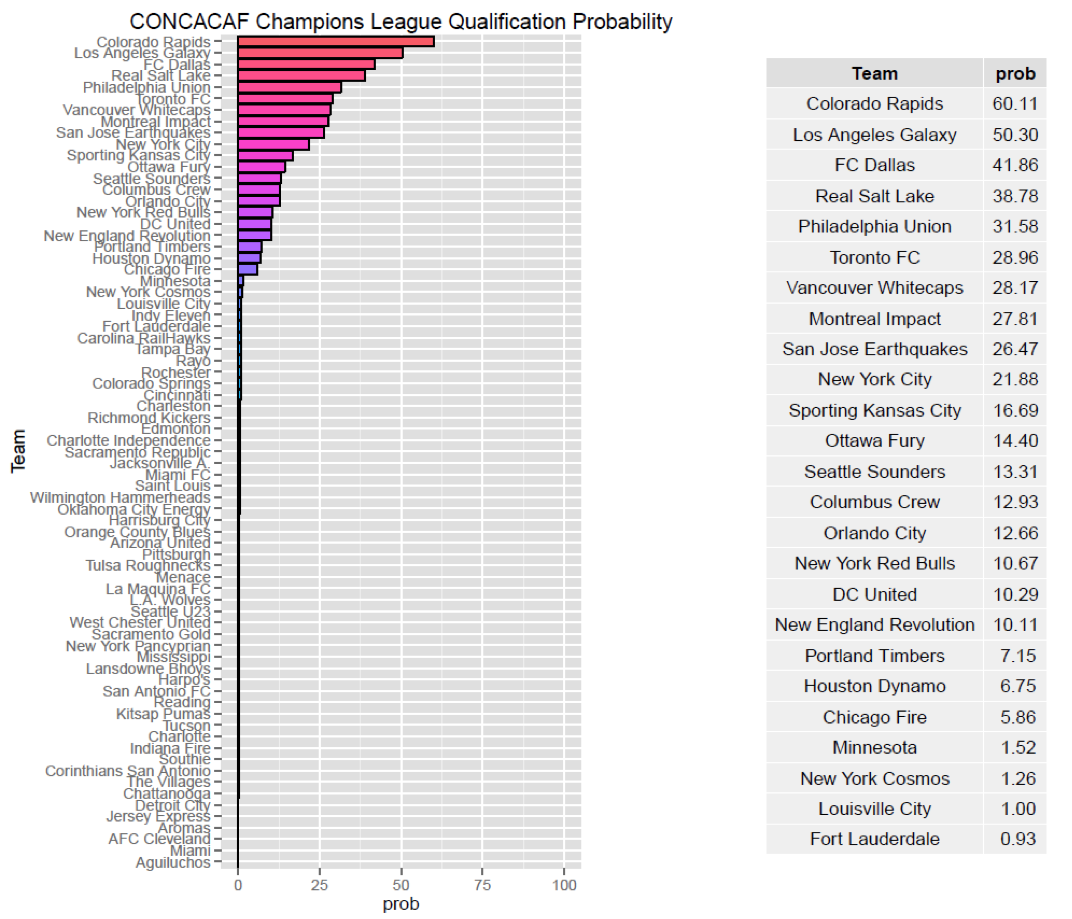
Qualifying for the CONCACAF Champions League is a feat the Union have never accomplished but could be tantalizingly within reach this season. While not a probable occurrence yet, Philadelphia’s 31.6% chance of qualifying is the 5th best in MLS (and is a scenario I would very much enjoy seeing). Last week Philadelphia had a 32.6% chance.
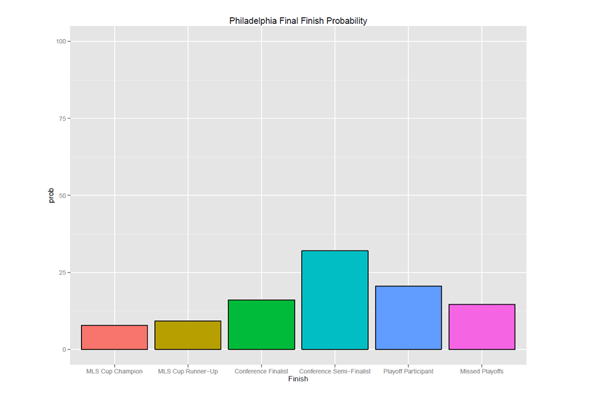
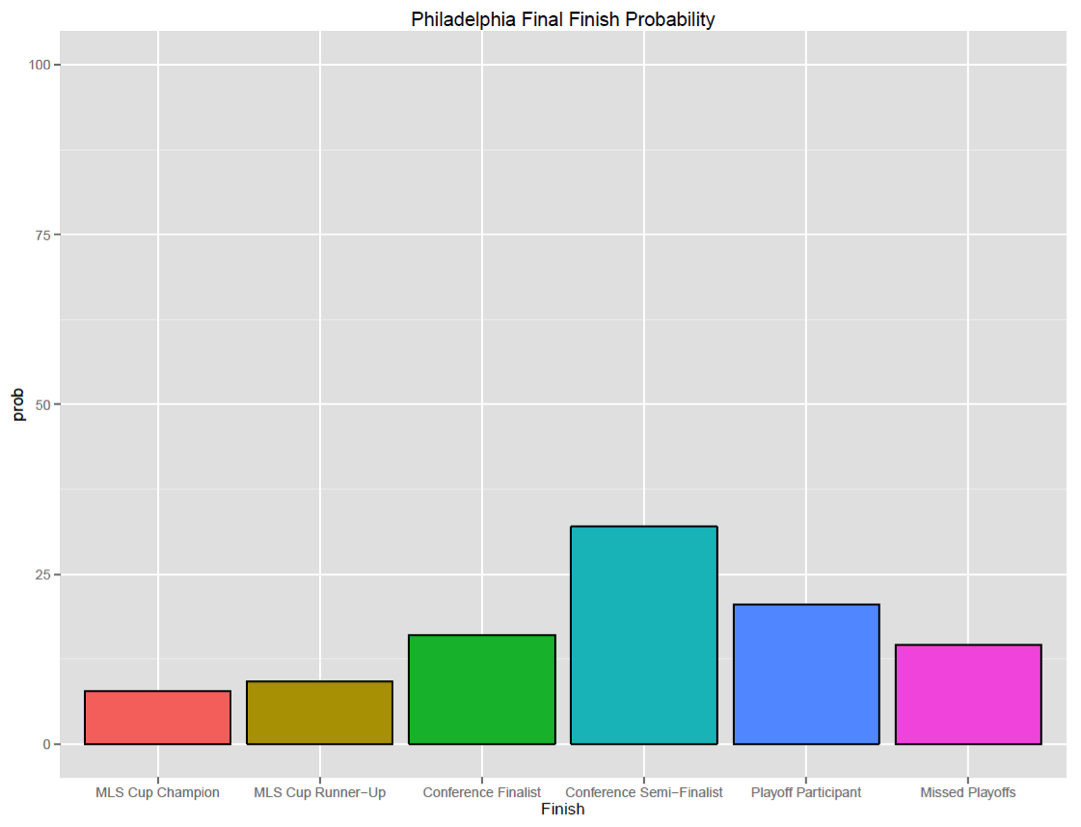
The following shows the probability of various Playoff categories and Philadelphia’s probability of each of them. Keep in mind that “Missed Playoffs” is, by default, 8 times as likely as “MLS Cup Champion.”
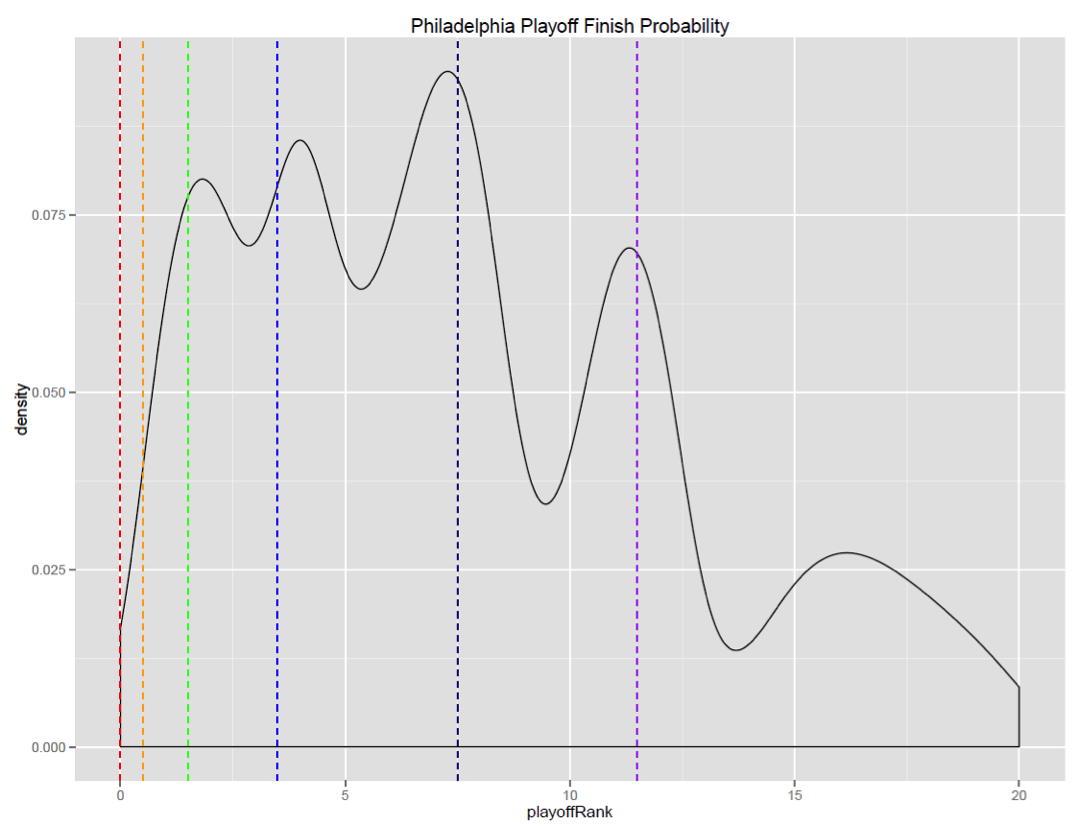
The following is a “density” chart showing the relative probability of Philadelphia finishing at the different after-playoffs rankings from 1 to 20. The loopiness you see in the higher ranks is likely due to the disparity in conference strength. If Philadelphia finishes in a higher round than a Western team, they are automatically ranked higher, but if they finish in the same round, Philadelphia will often be ranked lower (based on regular season single-table finishing).
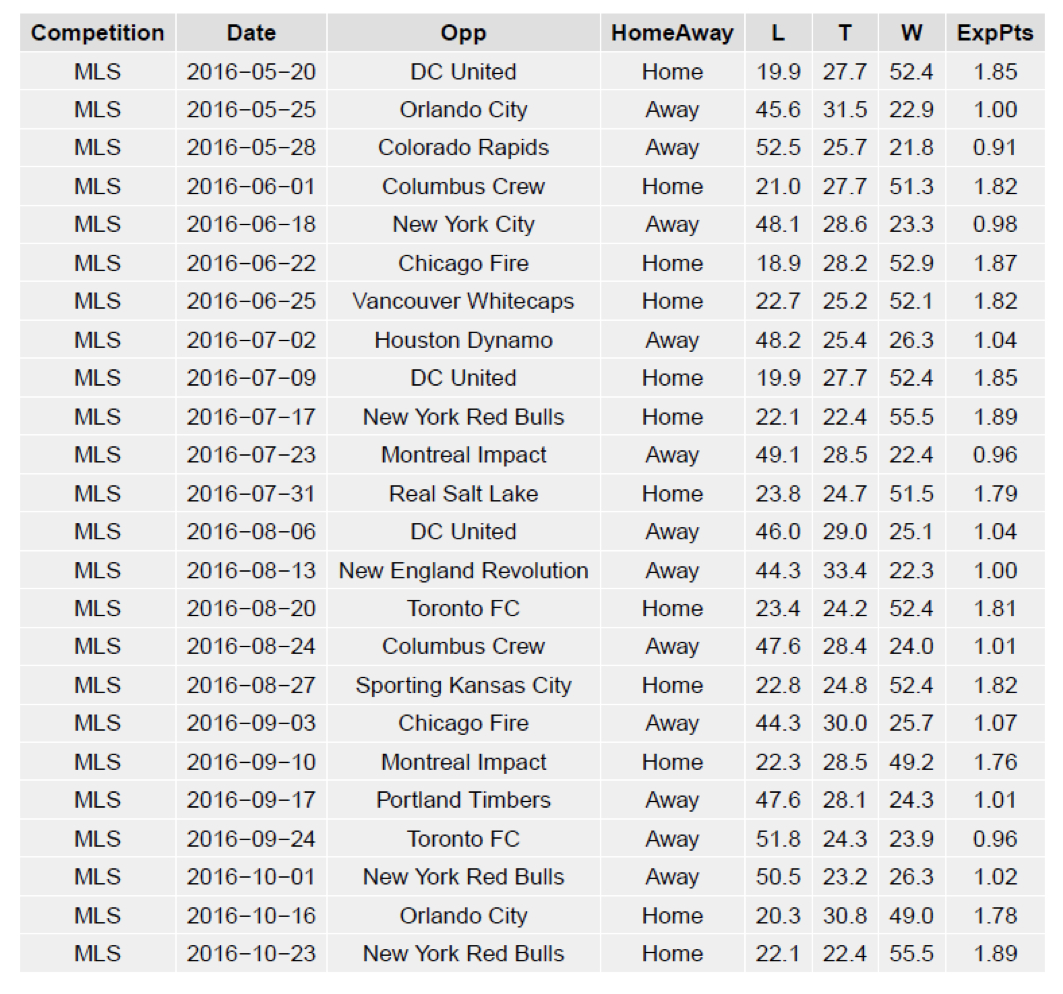
Finally, the following is the list of Philadelphia’s remaining scheduled matches accompanied by result probabilities as predicted by SEBA.
Here are some notes that also might answer some questions in advance.
- Home Field Advantage matters. A LOT. In MLS, independent of how good the teams actually are, the Home side is twice as likely to win as to lose. Therefore, the model will not give too much credit for Home wins or detract much for Away losses.
- The USOC simulation is not yet configured for future regional match-ups. It enters teams at the correct rounds and follows all current information, but it does not account for travel distance yet in determining likely future opponents. Don’t worry, I’ll get there.
- The Eastern conference is definitely weaker than the Western conference, at least when comparing the top teams of both. This explains why Chicago has a higher playoff probability than Houston despite the model considering Houston as a better team. Likewise, this is why Toronto and Philadelphia have the 2nd & 3rd best playoff odds despite being ranked as the 5th and 6th best teams. This separate conference structure also gives Eastern conference teams a better shot at the MLS Cup (and a much better shot at MLS Runner Up) since they don’t have to compete against Western teams until the final.
- LA is good at goal differential. You may have wondered, while looking through this, why L.A. has better odds at winning the MLS Cup compared to Colorado despite that they are in the same conference, that the model considers Colorado a better team, and that our simulations predict Colorado will usually be higher seeded in the playoffs. I wondered this too so I looked into it. Turns out, this is because, while Colorado is better than L.A. at winning matches, L.A. is better at winning big. During the Conference Finals & Semi-Finals, the Home/Away aggregate goals format favors L.A. as they have better odds than Colorado of banking a large-margin win to carry over.
Planned future enhancements:
- Back-testing the simulation system to show how Philadelphia’s probabilities have changed with each passing match
- USL simulations for Bethlehem Steel and Harrisburg City Islanders (the teams are already included in the model for determining their strength, I just haven’t completed their season forecasts)
- Getting the USOC simulations to account for the reality of regional future opponents instead of (relatively) random ones
- I’ll also never stop trying to tweak the model by adding complexity and whatever other data I can get into the model.
Finally, the charts below shows the average results of all the simulations and the probabilities associated with all of the above. The chart is broken up into two parts in order to better fit on your screen. (Note: CCLAlternate refers to qualifying for CONCACAF Champions League non-traditionally. U.S. teams qualify by winning the MLS Cup, winning the Supporters’ Shield, winning the Conference in the regular season, and by winning the U.S. Open Cup. If a Canadian team wins any of these or a U.S. team wins more than one, the extra slots are filled by top regular season performers.)
I look forward to your comments.

Love this kind of thing.
I do have a question about how the CCL percentage is quantified, does it take into account that the Canadian teams have a separate path of entry and cannot qualify via MLS standings?
Good Question. Yes, I also simulate the Canadian Championship (which you can see the MLS teams’ probabilities in the last table) which accounts for their CCL probabilities. You can also see in the CCL-graphic-table that the Ottawa Fury is relatively high due to their 3-0 thumping of Edmonton in the first of their two-game-series.
It’s finally happened. Robots have taken over.
.
Robot or not, love the info. I’m still in disbelief that the Union are a playoff favorite.
Need fuel, please tell me where you keep your meds.
So now we have Adam for the “eye test” analytics and chris to handle our numerical data. Dare I say, we are well covered from all angles.
I would love to see us return to this at the end of the season, or throughout the season, to see how well the model predictions are going. It would be interesting to see not only how accurate this predictive model ends up being, but also how early in the season this model reaches a high level of predictive power? Also, what teams end up exceeding or disappointing the expectations set by the model?
I agree. I’m currently back-testing the simulation so that I can publish how these different probabilities change over the course of the season, and the impacts that various games have.
So SEBA is not named after LeToux?
–
All all seriousness, this is great stuff, Chris. I love looking at data, I just wish that I was smart and skilled enough to slice and dice it. Thanks for doing this.
–
If you assumed a three tier pyramid with MLS, NASL and USL as the three divisions in that order and with two promotion/relegation spots, I would be interested to see what each division looked like at the end of the season. Obviously, only if you have the time, but it would be interesting to see. Thanks again.
Yeah, that would certainly be interesting. I’ll consider that for an extra feature.
For my 2 cents, I wouldn’t spend too much time on the USL stuff. I doubt most of us care about results for Steel or other developmental teams. It would be more interesting to see some stats on impacts of individual players; +/- ratings, or other numbers that might support of refute our subjective feelings.
.
Great stuff Chris. As a science nerd, I’m always drawn to the data. I look forward to seeing more. Good luck house hunting!
Thanks! I’ll definitely look to grow the analysis on player-specific contributions, but I imagine it will be a while before I am ready to present anything meaningful on them.
Fabulous quote, thanks. You Philly people expect us in the Lehigh Valley to care about your damn parent club down there in the land that likes to throw snowballs at Santa Claus? Ha ha … Philadelphia Union II belong in Chester – save yourselves the money on bus fare and whatever you are paying Lehigh University to rent their stadium.
Hate to ruin your model, but I noticed a faulty assumption for CCL qualification. Currently, the four qualification methods for US teams are USOC Champ, MLS Cup Champ, and the regular season points leader from the eastern & western conferences (one of which will be the SS winner by default). Losing the MLS Cup final no longer qualifies you for the CCL (this changed 1-2 years ago).
Wow, my mistake. I’ll edit that as soon as I get home. Thanks for correcting this!
FYI, check out the ‘Qualification – North American Zone’ section of the Wikipedia entry for the CCL. It gives a good summary of the various qualification scenarios for US teams, (e.g. what happens if a Canadian team wins the MLS cup or is their conference’s points leader, or if a US team wins both the USOC and the MLS Cup).
Thanks, and btw, this didn’t hurt the model, just the results summation. I’m glad to get it right though.
As a computer programmer who is just starting to scratch at the surface of “big data” / data science stuff, I always find this sort of thing fascinating…
Wow – the math teacher in me is swooning…
Chris, this looks lovely and sophisticated, but have you validated your model at all?? Without that, frankly, we have no way of knowing how accurate any of this is.
—
I would envision “simulating” prior MLS seasons at various points in time. In other words, go back for each of the last 5 years, and at certain points — say, 10 weeks in, 15 weeks, 20 weeks, etc, run your algorithm and see what the projections are. Then you can see how it actually turned out, and whether the percentage estimates you got mirrored the real-life outcomes.
Thanks for your question
————
Yes, the model is validated. The model is game-level. The model attempts to determine the probability distribution of match-results. Any uncertainty due to low sample-size or trend-breaking results regresses a team’s skill-assessment back to the mean. This early in the season, this is why most of the game projections you can see in the upcoming match table for Philadelphia show that most of the variation in probabilities come from Home/Away status with limited probability adjustments made from opponent quality.
————-
The seasonal simulations are meant to demonstrate the influence of luck. Given the results already completed, the simulations show what can happen next. Given a probability distribution for a game, the likely outcomes for an entire season when ‘luck’ (or unaccounted-for-variables) is controlled for can give us perspective on where our team stands.
————–
Actual results can significantly impact seasonal probabilities, more-so than changes in team-skill-assessments, since current game probability distributions estimate ‘expected’ points for home matches around 1.8 points and 1 point for away matches. If any of these are 3 or 0, in reality, this could be the point-total-difference needed to make the playoffs.
————–
That said, the Multi-Class Mean Squared Error: mean((W-p(W))^2 + (T-p(t))^2 + (L-p(L))^2) for this model was 0.6101. This is calculated using 10-fold-cross-validation repeated 3 times using different sampling seeds.
If Caddyshack were to be remade today…I envision a scene with Ty Webb sucking on a lime straddling Lace Underall, musing something along the lines of,
.
“what if this ignorance of mine is a gambit misplayed,
and clots off the eddy of blood within the atria-
enroute to the brain,
—
will the algorithm forsake me,
will the paramedics know what to do.” (The Art of Disconnecting)
.
I’m not a numbers guy, live in the world of words, either way… it’s all algorithms now and I respect this work and get a kick out of looking it over for the 45 seconds I am able to concentrate on numbers in general.
.
I surmise, the probability of all these data points would change immediately upon a 3 game losing streak, just as the tone in the choice of words would change as well.
.
…either way… both interpretations ultimately tell us the same thing I guess… all this is its own kind of poetry.
.
Yes, actual future results will affect the simulation expectations, often significantly. The model predicts game-level events. The simulations account for the randomness in the probability estimations. If all 10,000+ simulations are aware of 3-consecutive-losses, even if it attributed that to bad luck (which it wouldn’t), season probabilities will accordingly reflect that unfortunate impact.
amazing stuff….if it wasn’t for all this we wouldn’t have all that and likely- no reentry coordinates either.
.
come to think of it there is nothing probable about reentry coordinates- sounded fun though.
Much technical, such numbers.