
Photo: Barb Colligon
Before I write this fourth entry in my look at the Union’s defensive statistics, I want to offer an explanation of what I’ve been doing over the last few games.
I have collected these statistics myself, using match replays in which I watch the game in one loop, often replaying particular actions and using slow motion on those replays, if need be. So, there will be differences between my numbers and those released by OPTA, for example. This speaks to the fundamental subjectivity inherent in the collection of soccer statistics.
Secondly, I’d like to address the criticism over my “bad marks” statistic. I recently began looking at some of the work of Bill James, the driving force behind the use of analytics in baseball. whose work was made famous in the movie Moneyball. His analysis is now publicly available in his book, The New Bill James Historical Baseball Abstract. Now I hardly know a thing about baseball, but I find the use of data analytics in sport quite intriguing, so I really love his book.
In his player evaluation commentary, James stated that for an evaluation system to be useful, it must pass nine measures of fairness.
- It must deal fairly with pitchers and position players.
- It must be fair to hitters, and to glove men.
- It must be fair to starters, and to relievers.
- It must be fair to players who play in big hitting eras, and to players who play in pitching dominated eras.
- It must be fair, specifically, to PITCHERS in big hitting eras, and to HITTERS in pitching dominated eras.
- It must be fair to players who play on good teams, and players who play on bad teams.
- It must be fair to infielders and outfielders, to catchers and to shortstops and to designated hitters.
- It must be fair to part-time players who play well, but it must also be fair to ordinary players who play well enough to keep their jobs.
- For careers, it must be fair to players who have 4,000 career at bats, and it must be fair to players who have 10,000 at bats.
Obviously, many of these measures don’t readily translate to soccer, but there are definitely a few that we can work with.
- It must be fair to players on both the offensive and defensive side.
- It must be fair to starters, and substitutes.
- It must be fair to players who play in both offensive and defensive dominated seasons/eras.
- It must be fair to players who play on good teams, and players who play on bad teams.
- It must be fair to forwards and fullbacks, to goalkeepers and to attacking midfielders, and to wingers, etc.
- It must be fair to players with 34 career games and to players with 340 career games.
Ultimately, soccer players are evaluated on their ability to either create goals, take the oppositions goals away, or ideally, both.
And unfortunately, a complete system that analyzes a players ability to do such things doesn’t exist, nor will it exist in the near future. There are simply far too many variables in place that have no form of measurement.
For example, there is no statistic to show that Andrew Wenger struggles without the ball on offense. There is no statistic to show that Ray Gaddis is over-reliant on his recovery speed with his one-on-one defending, not is there is a statistic that shows how much Fabinho struggles in his zonal and man marking.
In including the bad marks in my statistics, I attempted to offer a more accurate means of evaluating a player’s defensive influence on the game. Having used the stat in reviewing three games, I’ve concluded it isn’t a viable solution to soccer’s statistical problem. As a stat, it is far too subjective for one individual to justly assign, and it is unfairly harsh on certain players, particularly fullbacks and wingers in, for example, the Philadelphia Union’s 4-2-3-1 system. Thus, I will no longer be tracking bad marks. I will however, include my interpretations of the team’s marking and defensive shape in the limited analysis that I provide.
From this point on, I will be using a combination of the statistics that OPTA provides along with my own. The stats that I will provide are as follows:
- Scoring Chances: A scoring chance doesn’t necessarily have to result in a shot, but it must yield a clear threat at goal from a dangerous scoring area.
- Successful and Unsuccessful Clearances: OPTA does not measure unsuccessful clearances at all, and I feel that they don’t properly differentiate clearances from long passes.
- Penalty Entries, Dribbled Past: To my knowledge, OPTA doesn’t track these statistics individually
- Crosses (Successful), Shots (SOG): Crossing Percentage- OPTA’s numbers for these statistics are often interpreted in a drastically different manner than what I find
- All Goalkeeping Statistics: OPTA doesn’t show Catches, Parries, or Interceptions. It’s much easier for me to track all of them myself.
As always, you can view stats provided by OPTA at the Match Center on the league website.
If you’d like me to collect additional statistics, or elaborate on the ones that I already use, please let me know in the comments section. Your feedback is essential.
All of that aside, let’s get to the 1-0 loss to Chicago.
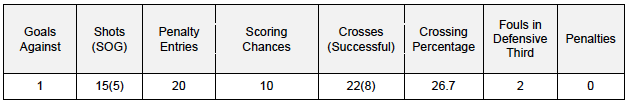
The Philadelphia Union defense struggled against Chicago largely because of three reasons: poorly organized pressure, turnovers in the middle and defensive third, and poor marking in the box.
Pressure
Defensively, the Union’s 4-2-3-1 took the shape of a 4-4-2, with Fernando Aristeguieta and Vincent Nogueira occupying the two top spots. This look led to some limited pressure on the ball but really cost the Philadelphia in terms of their shape.
With Nogueira so high up the field, and the Union back line playing so deep, Michael Lahoud and Maurice Edu were forced to cover far too much ground in the center of the field. And when in doubt, they dropped deep to protect their back line. In doing so, they only served to widen the gap between themselves and the attackers, which offered the Chicago midfielders a great deal of space to play balls over the top, which were particularly effective when sent in Ethan White’s direction.
When they were playing at their best, the Union were sitting deep with a lone striker playing centrally above the half-field line and an attacking midfielder who played beneath him. It wasn’t particularly entertaining to see the pair play so centrally in defense, but it worked because it shrunk the field that the holding midfielders and wingers were forced to occupy. If Jim Curtin wants to have his team pressing farther up the field, his back-line must set a higher line.
Turnovers
Because of the Union’s poor offensive performance, Chicago had a great deal of possession over the course of the game. But frankly, they did very little with it. Outside of the simple minded balls over the top (which were much more effective than they should have been), Chicago did little in the way of creating chances. Fortunately for them, the Union defense and midfield gifted them a number of poor turnovers in their own third. They really seemed to miss out on the checking runs and passing ability of Vincent Nogueira, who was deployed higher up due to the lack of available No. 10’s on the roster. With Edu forced to play higher up, and an offensively limited Lahoud filling in, such giveaways were abundant. These turnovers provided Chicago with the majority of their scoring chances, and Philadelphia was lucky to scrape through without conceding additional goals.
Marking
It’s been four games, and the Union have already conceded two goals from indirectly taken set pieces. Chicago’s goal came from inexplicably poor marking from Andrew Wenger, who stood rooted to the spot while his man headed past a helpless Mbolhi. Basic man marking should not be difficult for a professional soccer player in any position, so it’s a wonder that the Union have been so poor in their set piece defense across their brief history.
Against Chicago, White continued to provide evidence to those who doubt he deserves an automatic starting spot. He struggled yet again with his clearances, often sending them to the center of the field in dangerous attacking positions. He’ll also be remembered for the completely unnecessary foul that lead to Chicago’s opener.
It also needs to be said that Eric Ayuk, Raymon Gaddis, and Steven Vitoria should be absolutely ashamed of how they were torched by Harry Shipp in the dying minutes of the game. Both Ayuk and Gaddis lunged badly multiple times in the box, and Vitoria closed him down at an uncharacteristically poor angle, leading to his cross to a wide open Michael Stephens at the top of the 6 yard box. Fortunately, a combination of poor finishing and good goalkeeping kept Stephens off the scoresheet.
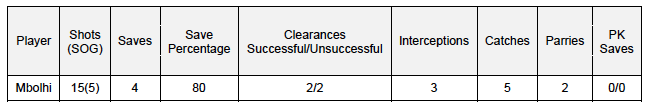
For his part, Mbolhi had an up and down game. He made two good saves at close quarters, and can’t be blamed for the goal he let by. However, he continued to struggle with the ball at his feet, shanking two clearances into dangerous positions. He’s had to deal with his fair share of criticism over his play this year, but he really hasn’t done anything notably good or bad. The real issue with him is the fact that he’s rumored to be one of the highest paid goalkeepers in MLS, and boy could the Union use his salary at other positions right about now.

Can’t be measured empirically, but Mbohli has done nothing visible or audible to organize the defense in front of him. and defensive leadership is the only logical reason to have him on the roster at his pay grade.
I appreciate the attempt at the “bad marks” stat. As I said after the first week, it was probably too subjective – the conclusion you reached – but I’m glad you gave it a bit of time to play out before deciding.
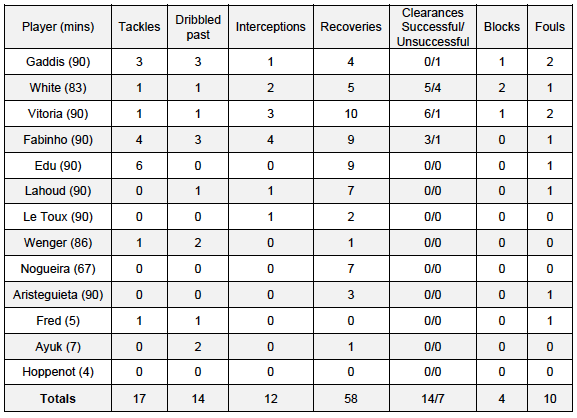
Nice article. Question: what is a “recovery”? I’d assume it was related to being dribbled past, but the stats indicate no correlation.
Pulled this off of OPTA’s website
.
Recovery
.
This is where a player wins back the ball when it has gone loose or where the ball has been played directly to him.
Thanks!