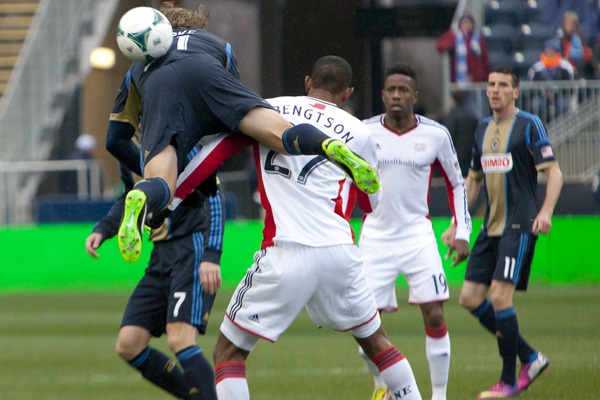
Photo: Daniel Gajdamowicz
At times late Saturday afternoon, the match that took place at PPL Park resembled more of a wrestling bout than a soccer match. The Twittersphere was abuzz with a slew of comments that seemed to echo a common sentiment about 2013’s version of Major League Soccer: The game between the Philadelphia Union and Toronto F.C. was ugly.
There were a number of question marks heading into the 2013 campaign for Major League Soccer. Obviously the departure of David Beckham was on the minds of many, but there has been a general sentiment that MLS has been moving forward. Last season, teams like Sporting Kansas City and the Colorado Rapids had pushed a narrative of positivity, using that vaunted label of “4-3-3” to connote a move to the wondrously fluid Total Football. This season, Caleb Porter took his talents (and reputation for attacking soccer from coaching the Akron Zips) to Portlandia. Goalfests are just around the corner, right?
Wrong. After six weeks of play, it’s safe to say we’re not seeing anything close to pretty football in Major League Soccer. Saturday’s match was probably an extreme example of this: a mixture of tactical fouling, turnovers galore, and time-wasting to try and see out a result. Certain dictators have tried to acquire video of the first half in order to torture dissenters. It was only after Toronto caught the Philadelphia defense asleep for a goal that the Union came alive, when they had little choice but to press for an equalizer.
Quantifying the ugliness?
This led me to start wondering if there are any metrics that could be developed to quantify the way teams play. I started looking at shots per game which, it turns out, are down in 2013. Compared to the entire 2012 season, the first six weeks of 2013 see the average for each team being off by nearly a shot per game (-0.99). Shots on target per game are also down 0.2 per team. But shots account for only the going forward and don’t incorporate anything for negativity in the defensive phase.
I thought it would be worth seeing if using foul numbers in comparison to shots could elicit a statistic that would represent positivity or negativity. I soon realized that the number of fouls and number of shots in a game could be correlated quite nicely. I decided it might be an interesting comparison to make a simple ratio out of shots taken and fouls conceded. So let’s take a look at this chart based on cumulative 2012 season totals.

I have added some color annotations to this, but they are only to demonstrate the trending of these numbers. I’ve colored Shot-To-Foul Ratios (S/F Ratio) that fall between 0.95-1.05 in yellow, and 0.94 and below as red. In 2012, you can see that 10 of the 19 teams were above the 1.05 S/F Ratio mark.
For the sake of this article, I’m not going to try and equate the S/F Ratio to goal output or results. You can see in 2012 that Vancouver and RSL both made the playoffs while finishing below 0.94. New England finished well out of the playoff race, but finished with the second highest S/F Ratio. It is interesting that 6 of the top 7 teams in S/F Ratio finished in a playoff spot.
Comparing 2012 and 2013
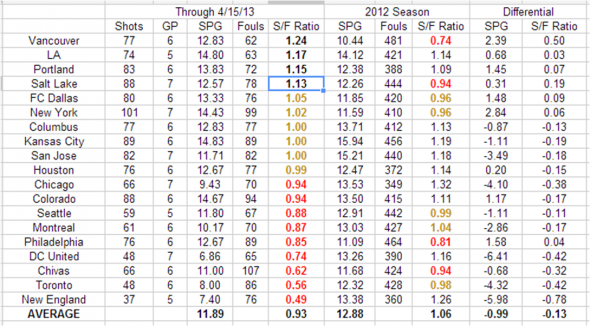
If you check out S/F Ratios for 2013 compared to 2012, you can see there has been quite a dip. Now only 4 teams in Major League Soccer stand above a 1.05 S/F Ratio, down from 10 teams in 2012. Over twice as many teams are below 0.95. New England has registered twice as many fouls as shots in their matches. The record and point total of individual teams fail to correlate well with S/F Ratio, but a team’s ability to be clinical in front of goal could mask low shot totals.
Calling out individual teams isn’t really the point of this analysis. It is just an attempt to quantify the perception that play in MLS has been uglier to start this season. If you take the numbers above in a holistic sense, it corroborates the sentiments expressed in various forums through the opening month and a half of the season.
Let’s take one last look: fouls and yellow cards.
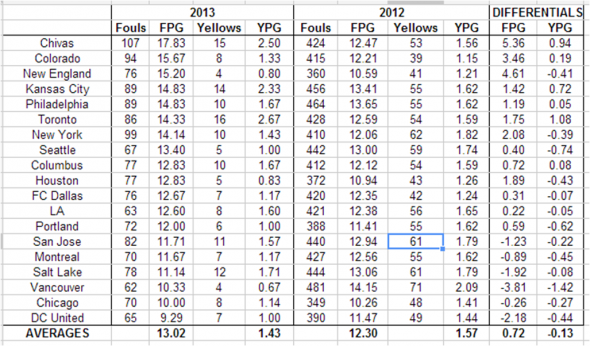
Yes, these tables have a lot of data.
The take-home from this comes in the averages: fouls are up by over two-thirds a foul per game in 2013, while yellow cards are down slightly (-0.13).
Not only are we seeing more obstruction and tactical fouling, but we’re also seeing referees being more tolerant to the additional fouls. Cards are the one way a referee can control the way the game is played on the pitch. Start handing out yellows for illegally (and perpetually) stifling attacks, and players will have to adapt. Space should open up for players to create, and play should improve.
Are there reasons?
All this analysis displays the negativity, but the question begging to be asked is…why?
First, teams are likely realizing how little the Supporter’s Shield means in the grand scheme of the league. Major League Soccer and those who follow the league cherish the finality of MLS Cup, the culmination of the traditional American style playoff system. In this extremely inclusive setup, 10 out of 19 teams end up with a chance to hoist the coveted trophy. Last season, Los Angeles (No. 4 in the West) and Houston (No. 5 in the East) were the combatants in the Final. Supporter’s Shield winner San Jose and Eastern Conference Champion Sporting Kansas City lost in the Conference Semifinals to the previously mentioned teams, respectively. Getting into the playoffs probably means more than where you finish once you get there.
Another reason could be a fundamental pragmatism that’s necessary to be successful under the MLS economic system. While it would be in the league’s best interest to have the top players displaying their skill on the pitch, not every team has these marquee names. If your team can’t afford a Thierry Henry or Landon Donovan, your tactics tend to bend towards the pragmatic side. How can you be positive if you can’t string passes or dipsy-doodle your way around defenders? It becomes a balancing act between a team’s desired results, and a community that wants to see the sport attract new fans with expressiveness and flair.
It’s easy to understand why managers of teams not named Los Angeles or New York would approach a game with the mindset, “We’re starting level, and if we can hold onto that point, we’re happy. If we can sneak a 1-0 victory, even better.” Conservative mindsets could prevail, especially in the early season, when it’s difficult to gauge how your squad stacks up against their competition. As teams coalesce, their managers may be willing to take more chances and look to dominate the opposition.
One could also blame the weather. The 2013 season has been marked by a relatively cold spring and that could have an effect on player fitness, condition of the pitch, and even some inclement factors such as high wind. When conditions get rough, it makes even more sense to battle and scrape for a crucial point while hoping the ground thaws before May.
So I’ll leave it open to you, the reader.
Do you believe that MLS play has become more negative in 2013? What do you feel is the reason? If so, is there anything that can be done to influence teams to be less pragmatic in their approach? And does the S/F Ratio provide a suitable approach to discussing attitude in on-the-pitch play?
Let us know in the comments below.

Just a clarification: the ratio is shots-to-fouls-committed, correct? Not fouls suffered. “Fouls conceded” (and the thrust of your point) makes me think the former, but I wanted to check.
That is correct. Fouls that a team commits against the other team. Not fouls suffered.
Cool. It seems a useful metric. Basically, is a team trying to be positive or not? We need more stats like this.
I think its just a result of being early in the season. The Cental Winger article linked below using possesion trends explains it better than I could.
http://www.mlssoccer.com/news/article/2013/03/12/central-winger-possession-trends-and-what-they-say-about-major-league-soccer
The refs have to take some responsibility. If you watch the cleanest leagues you see refs who call v. light contact. Of course, those leagues are more technical, so there are far fewer fifty fifties.
Although Toronto have to count their cards, equal to 2 starters worth of suspension, and figure out if this tactic worked- one point, and you lose a starter, and five others got a yellow (five yellows equals a game suspension).
I don’t think having “star players” makes a difference. The Union have played the same way against NY and Colorado who don’t have any star players. It’s more in the tactics employed by coaches the issue comes up. The Union is a great example – we are set up to frustrate other teams and hit on the break. We have creative players but we don’t use them at all. Marfan and Torres can be just as creative as a Donovan or Henry – but they haven’t really been given the chance. Until the “Ideal” of hard working, big, strong, a lot of running needed is removed from the “US Plan” this won’t change.
I agree with a lot of what you said. You nailed our tactics, to a T. That said, Marfan and Torres are lightyears away from being anywhere near Donovan and Henry.
If MLS is going to keep growing( it already is a qualified success) Games like Toronto/Philadelphia can not be accepted. The skill set of the teams was appalling as was the officiating. It was painful to watch. As a Union fan I question John Hackworth’s consistent starting of Cruz. He is not a pro manager and will stunt the growth of professional soccer in this region. The Union almost lost the game vs Toronto. Hackworth will tell you how frustrated he was, however he is a major part of the problem. He has no game plan and relies on the miscues of opponents in order to eak out a result. He uses the same boring cliches and talking points and does not address glaring weaknesses game in and game out. He needs to go.
I think there are a few factors:
– The season started earlier than usual. Teams aren’t as fluid yet.
|
– Refs could call tighter games. There needs to be a few “message games,” where they hand out cards for repeated time-wasting, persistent fouling, etc.
|
– The Union matches look uglier than usual because they’ve played largely against teams that are also in that lower tier.
|
– I think this is a good metric. Great first post, Earl.
And they will continue to be light years away if they keep riding the bench.
Law 12: A player can be cautione for persistant infringement of the laws of the game. The menatality in our country is to “let them play”…. which unfortunately results in a poor game. The players/managers do what the refs allow them to do, especially when their jobs are on the line. If individuals are committing 4 or 5 fouls in a half, they should not be escaping the half without a yellow….
I agree. Back when I was refereeing years, I ran a line for the best referee I ever worked with. he was a Jamaican international referee and he had a simple philosophy. Call a tight game for the first 5 minutes of each half and the players won’t give you any problems. Imagine if Sorin Stoica had done that against Toronto. There would have been a brief flurry of whistles and then the players would have backed off, comfortable in the knowledge of what was and wasn’t a foul. Instead we got 70 minutes of garbage followed by 20 minutes of yellow cards.
should have said “years ago”
Very Cool. very well done. I think that as the season goes on and the sample size increases, the Fouls per match will lower as teams gel. I don’t expect the year-end data in November to be much different than 2012. Excellent article. +1.
I’m sorry to ruin everyone’s Wednesday, but http://www.philadelphiaunion.com/news/2013/04/sundays-showdown-against-dc-united-has-union-midfielder-cruz-amped-unlike-any-other
.
Does this mean everyone’s favorite running back starts again this weekend?
I think Cruz gets the brunt of the bile from fans, and maybe a bit undeserving. I mean, tactically speaking, I think you can have a guy who works his jewels off down the right but doesn’t have as much technical skill. But if you have guys in the central midfield who are also not particularly adept at distributing and lack the vision to create, it exposes the other weaknesses as well.
With that being said, I think Michael Farfan fits better on the right in the current tactical setup that Hackworth employs. But if Hackworth makes a switch from Lahoud or Daniel to Kleberson or Torres, the deficiencies on the right may be less apparent.
Got my goat a bit here regarding playoff qualification.
Entirely too many teams qualify for the playoffs. Seeing as hockey and NBA work this way, with more than half (half!!) the teams qualifying, I doubt this aspect will change, but I can’t justify the fact that MOST teams qualify for a potential championship after six to eight months of competitive play in the top leagues of three different sports.
I have my criticisms of the NFL but they do this better–12/32 teams qualify. But still, that’s almost a 40% chance of qualifying each season.
If I ran the MLS–and let’s just write-in the MetroStars as the next expansion team to make things balanced–I would have a four-division competition with 28 games per-season (three matches within division, once each out of division, home/away factor switched each year much like it is presently). That means an Eastern Division we can sink our teeth into–with Union, NYRB, MetroStars, Revs, DCU all in the same division, all that’s missing are the Cowboys. American divisional emphasis in a European, long-ish season.
Only the four winners of the divisions qualify, and to keep it feeling like soccer, you throw them in a Round Robin, six-game, home-and-away “playoff.” The top two face off in a final at a pre-determined, neutral stadium–none of this top-team-gets-a-home-final bullshit.