You know the old line, “It was a game of two halves.” And so it was on Saturday.
In the first half the Union managed five shots, only one of which was on goal.
Keon Daniel’s placement at left fullback seemed to offer a steady assuredness from the back that resulted in fewer long balls over the top and, consequently, over the midfield. The result was more possession. The result of that possession was a near doubling of the shots on goal to nine, four of which were on target, three of which resulted in goals.
Peter Nowak said after the game, “It looks like we found a team.” Presumably he means one that has Danny Mwanga starting on it. Mwanga continues to get more out of less time than anyone on the Union, with five goals in 791 minutes played, which works out to a goal every 158 minutes. In comparison, Ruiz’ four goals in 981 minutes works out to a goal every 245 minutes. To put it another way, Mwanga’s five goals in 14 appearances equals a goal every 2.8 appearances, while Ruiz’ four goals in 12 appearances equals a goal every three appearances. The next highest goal scorer is Justin Mapp with two goals over 836 minutes.
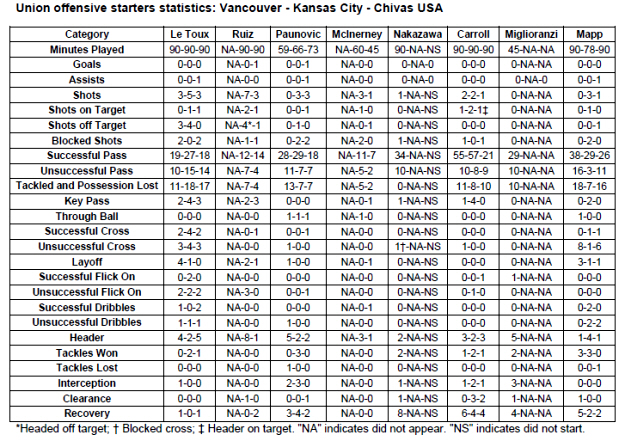
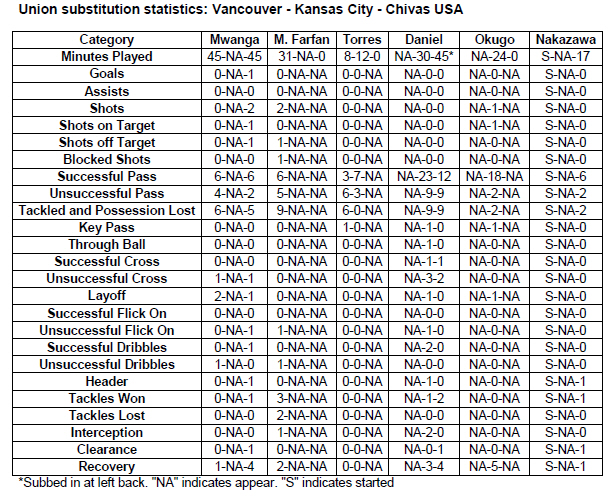
 Starters and Subs over the past three games
The greater depth of match statistics now available via the Chalkboard link for each game at the MatchCenter on MLSsoccer.com is truly illuminating. It is also a bit overwhelming.
Successful pass, unsuccessful pass, crosses, dribbles, layoffs, flick ons, tackles, interceptions—all of that and more are recorded. Top that off with filters that allow you to see where and when each instance of a statistical category occurred for each player and throw in heat charts that show where a player is spending his time on the pitch and the result is a plethora of detail that is truly impressive. What I find truly interesting is all of this detail helps to substantiate the often sometimes vague and undefined impressions one takes away from watching a game in real time. Much of what is revealed you already know if you are paying attention, it’s just that you didn’t have the details to truly know it.
Some things that standout:
- McInerney has struggled with his new starting role, recording four shots over two starts with only one shot on goal. We’ve all screamed it: Mac needs to pull the trigger more often.
- Le Toux and Mapp have been turning the ball over quite a bit. Highlighting just where they are losing the ball on the Chalkboard in MatchCenter reveals they are primarily doing so in the final third of the field of play.
- In match reports and rants on the PSP, a reoccurring theme is Mapp’s propensity for trying to dribble his way out of trouble. The match stats over the past three games show Mapp’s successful dribbles to be surpassed by his unsuccessful dribbles. The only successful dribbles were two recorded against Kansas City. He recorded a total of four unsuccessful dribbles over the past three games, two each against Kansas City and Chivas USA.
- Brian Carroll appears to be the most successful passer on the club, recording 55 and 57 successful passes against Vancouver and Kansas City before dropping to 21 against Chivas USA.
- Among starters over the past three games, only Paunovic has consistently had success with the through ball.
- It is not that Le Toux doesn’t head the ball, it is just that he doesn’t do so around the goal.
- Using the distribution filter to look at where the successful passes are going is very interesting. For example, against Vancouver, Justin Mapp had 38 successful passes, 19 of which were backwards. Against Kansas City, ten of his 29 successful passes were backwards and against Chivas 12 of his 26 successful passes were backwards. Compare that with Mapp’s unsuccessful passes. Against Vancouver, two of his 16 unsuccessful passes were backwards. Against Kansas City, none of his three unsuccessful passes were backwards and against Chivas USA, only one of his 11 unsuccessful passes was backwards.
- The first five of Miglioranzi’s 29 successful passes against Vancouver were sideways or backwards. In his 45 minutes of play, 17 of the 29 were sideways or backwards. Of his ten unsuccessful passes, nine were forward passes.
The chart below displays some of the statistical categories available through the Chalkboard tab. Believe me, there are more than a few other categories to look at there.
 Looking at the Union substitutions over the past three games, Daniel continues to impress. Playing 48 less minutes than Mapp against Kansas City, Daniel recorded only six fewer successful passes and had the same number of successful dribbles. He did, however, record more unsuccessful passes than Mapp in that game. Replacing Jordan Harvey at left back against Chivas USA, Daniel registered nearly identical numbers of successful and unsuccessful passes, 12 and nine, respectively, compared to Harvey’s 12 and eight. One gets the feeling Daniel could be stuck in goal and he’d perform with cool efficiency.
Even though he hadn’t played in four games, Okugo’s return against Kansas City yielded 18 successful passes and one shot in only 24 minutes of play. There are plenty of reason’s both Daniel and Okugo are favorites of the PSP.
Roger Torres is a fan favorite. In eight minutes against Vancouver, Torres’ six unsuccessful passes doubled his three successful passes. Five of those unsuccessful passes were chips. In twelve minutes of play against Kansas City, Torres had seven successful passes, four of which were backwards. Of his three unsuccessful passes, one was from a corner kick, another from a free kick. Of both successful and unsuccessful passes, the only chipped ball against Kansas City was the free kick.
 How’s Seba doing?
In the Stat Chat for the Vancouver game, I suggested that Le Toux was showing improvement over the previous nine games with a shots on goal percentage of 29% (five shots on goal from 17 shots) compared to a shots on goal percentage of 20% (two shots on goal from ten shots) for the first five games. Adding Le Toux’s numbers from the Kansas City and Chivas USA game to the previous nine results in a shots on goal percentage of 28% (seven shots on goal from 25 shots). Over the past three games, Le Toux’s shots on goal percentage is 18% (two shots on goal from 11 shots). His shots on goal percentage for the season thus far is 26% (nine shots on goal from 35 shots)
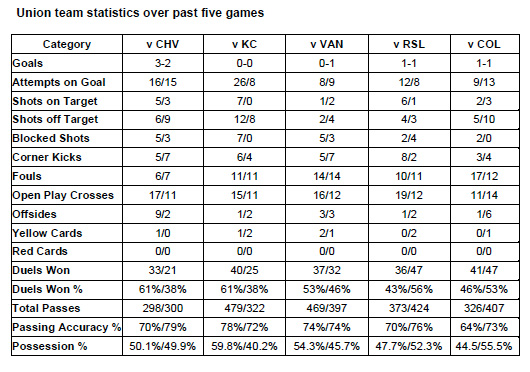
Team offensive statistics
While the attempts on goal and possession percentage for the Union and Chivas USA were both close, the Union recorded more shots on target. They did so with a significant drop in total passes compared to the previous four games, the 298 passes recorded being the lowest total since the 285 recorded against Toronto. Interestingly, the two times the Union have recorded fewer than 300 passes since detailed statistics became available with the San Jose game have been wins. During that time period, in the five games the Union were out-passed by their opponent their record is 3–0–2. In the six games they out-passed their opponent over that time period, the Union’s record is 1–3–2.

