Below are the current forecasts using data from matches through June 13, 2017.
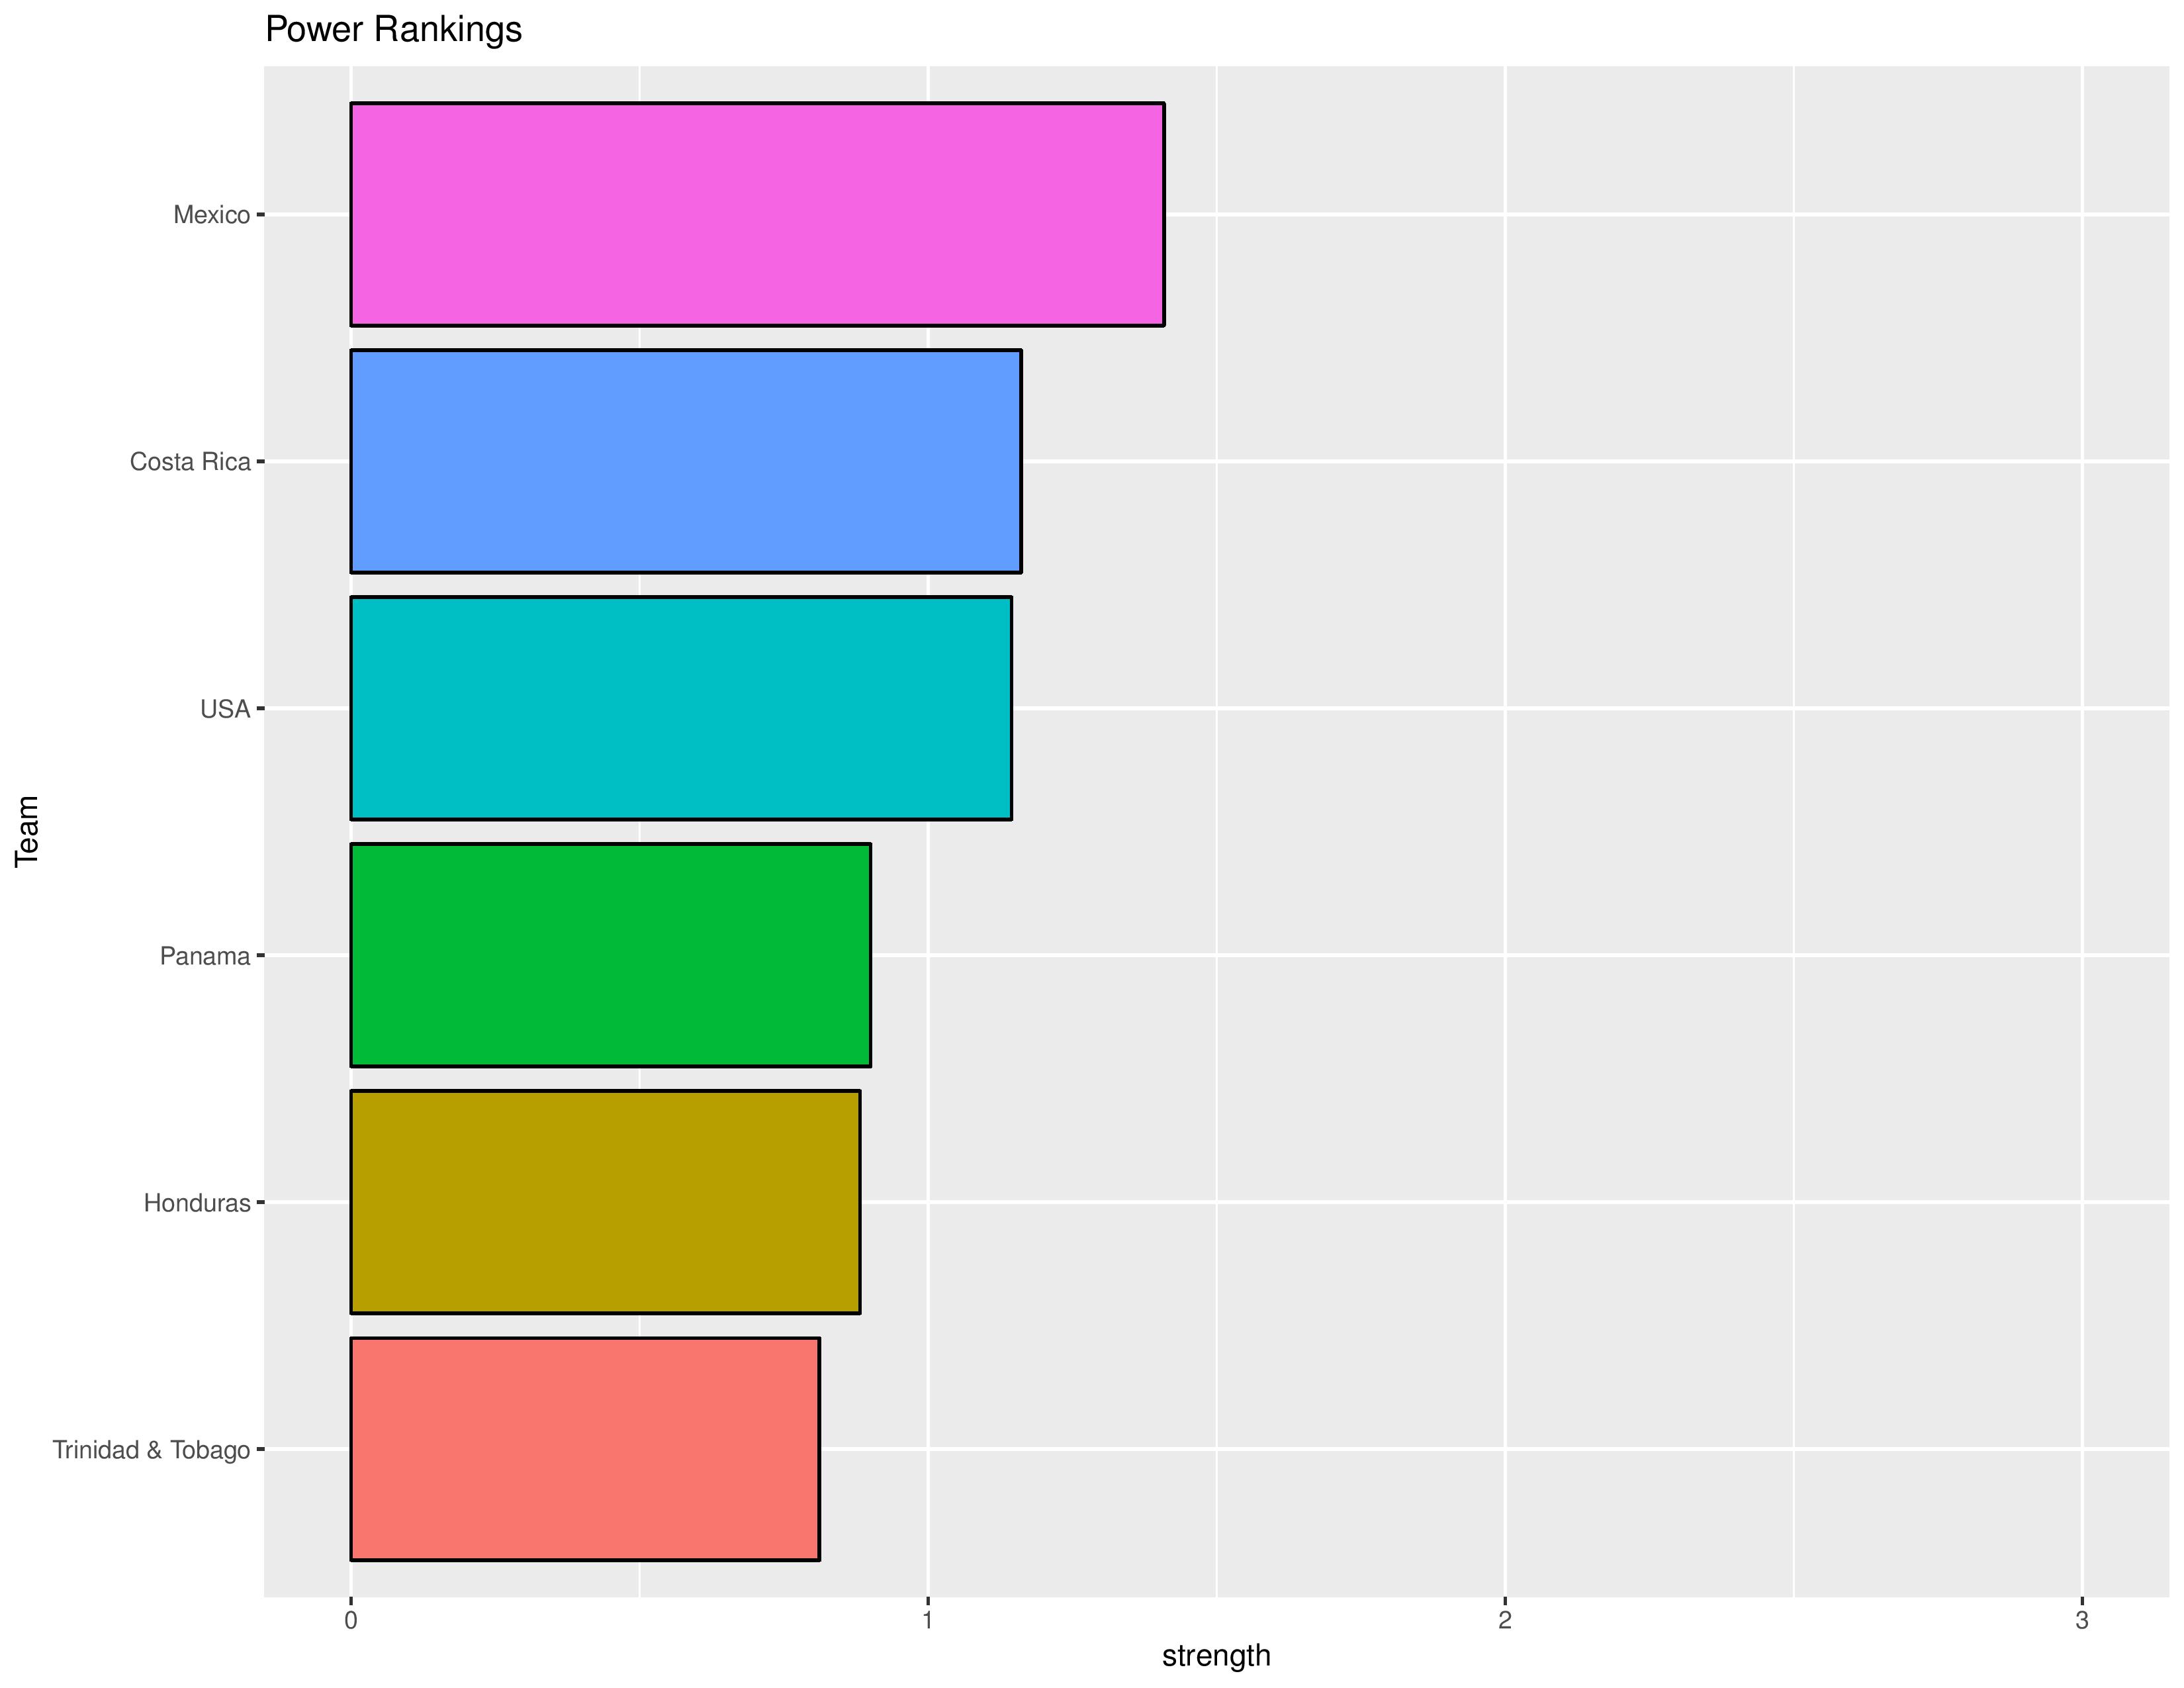
Hexagonal Power Rankings
The “Power Rankings” we concoct are the actual “strength” of the team according to competitive expectations. The value represented on the X-Axis is the average amount of points we expect that team to receive when playing against every national team that participated in the previous World Cup on neutral territory:

The following chart shows the average points bonus for a particular nation’s home field advantage. This is important in explaining why teams may seem to have favorable odds to qualify even when ranked lower.

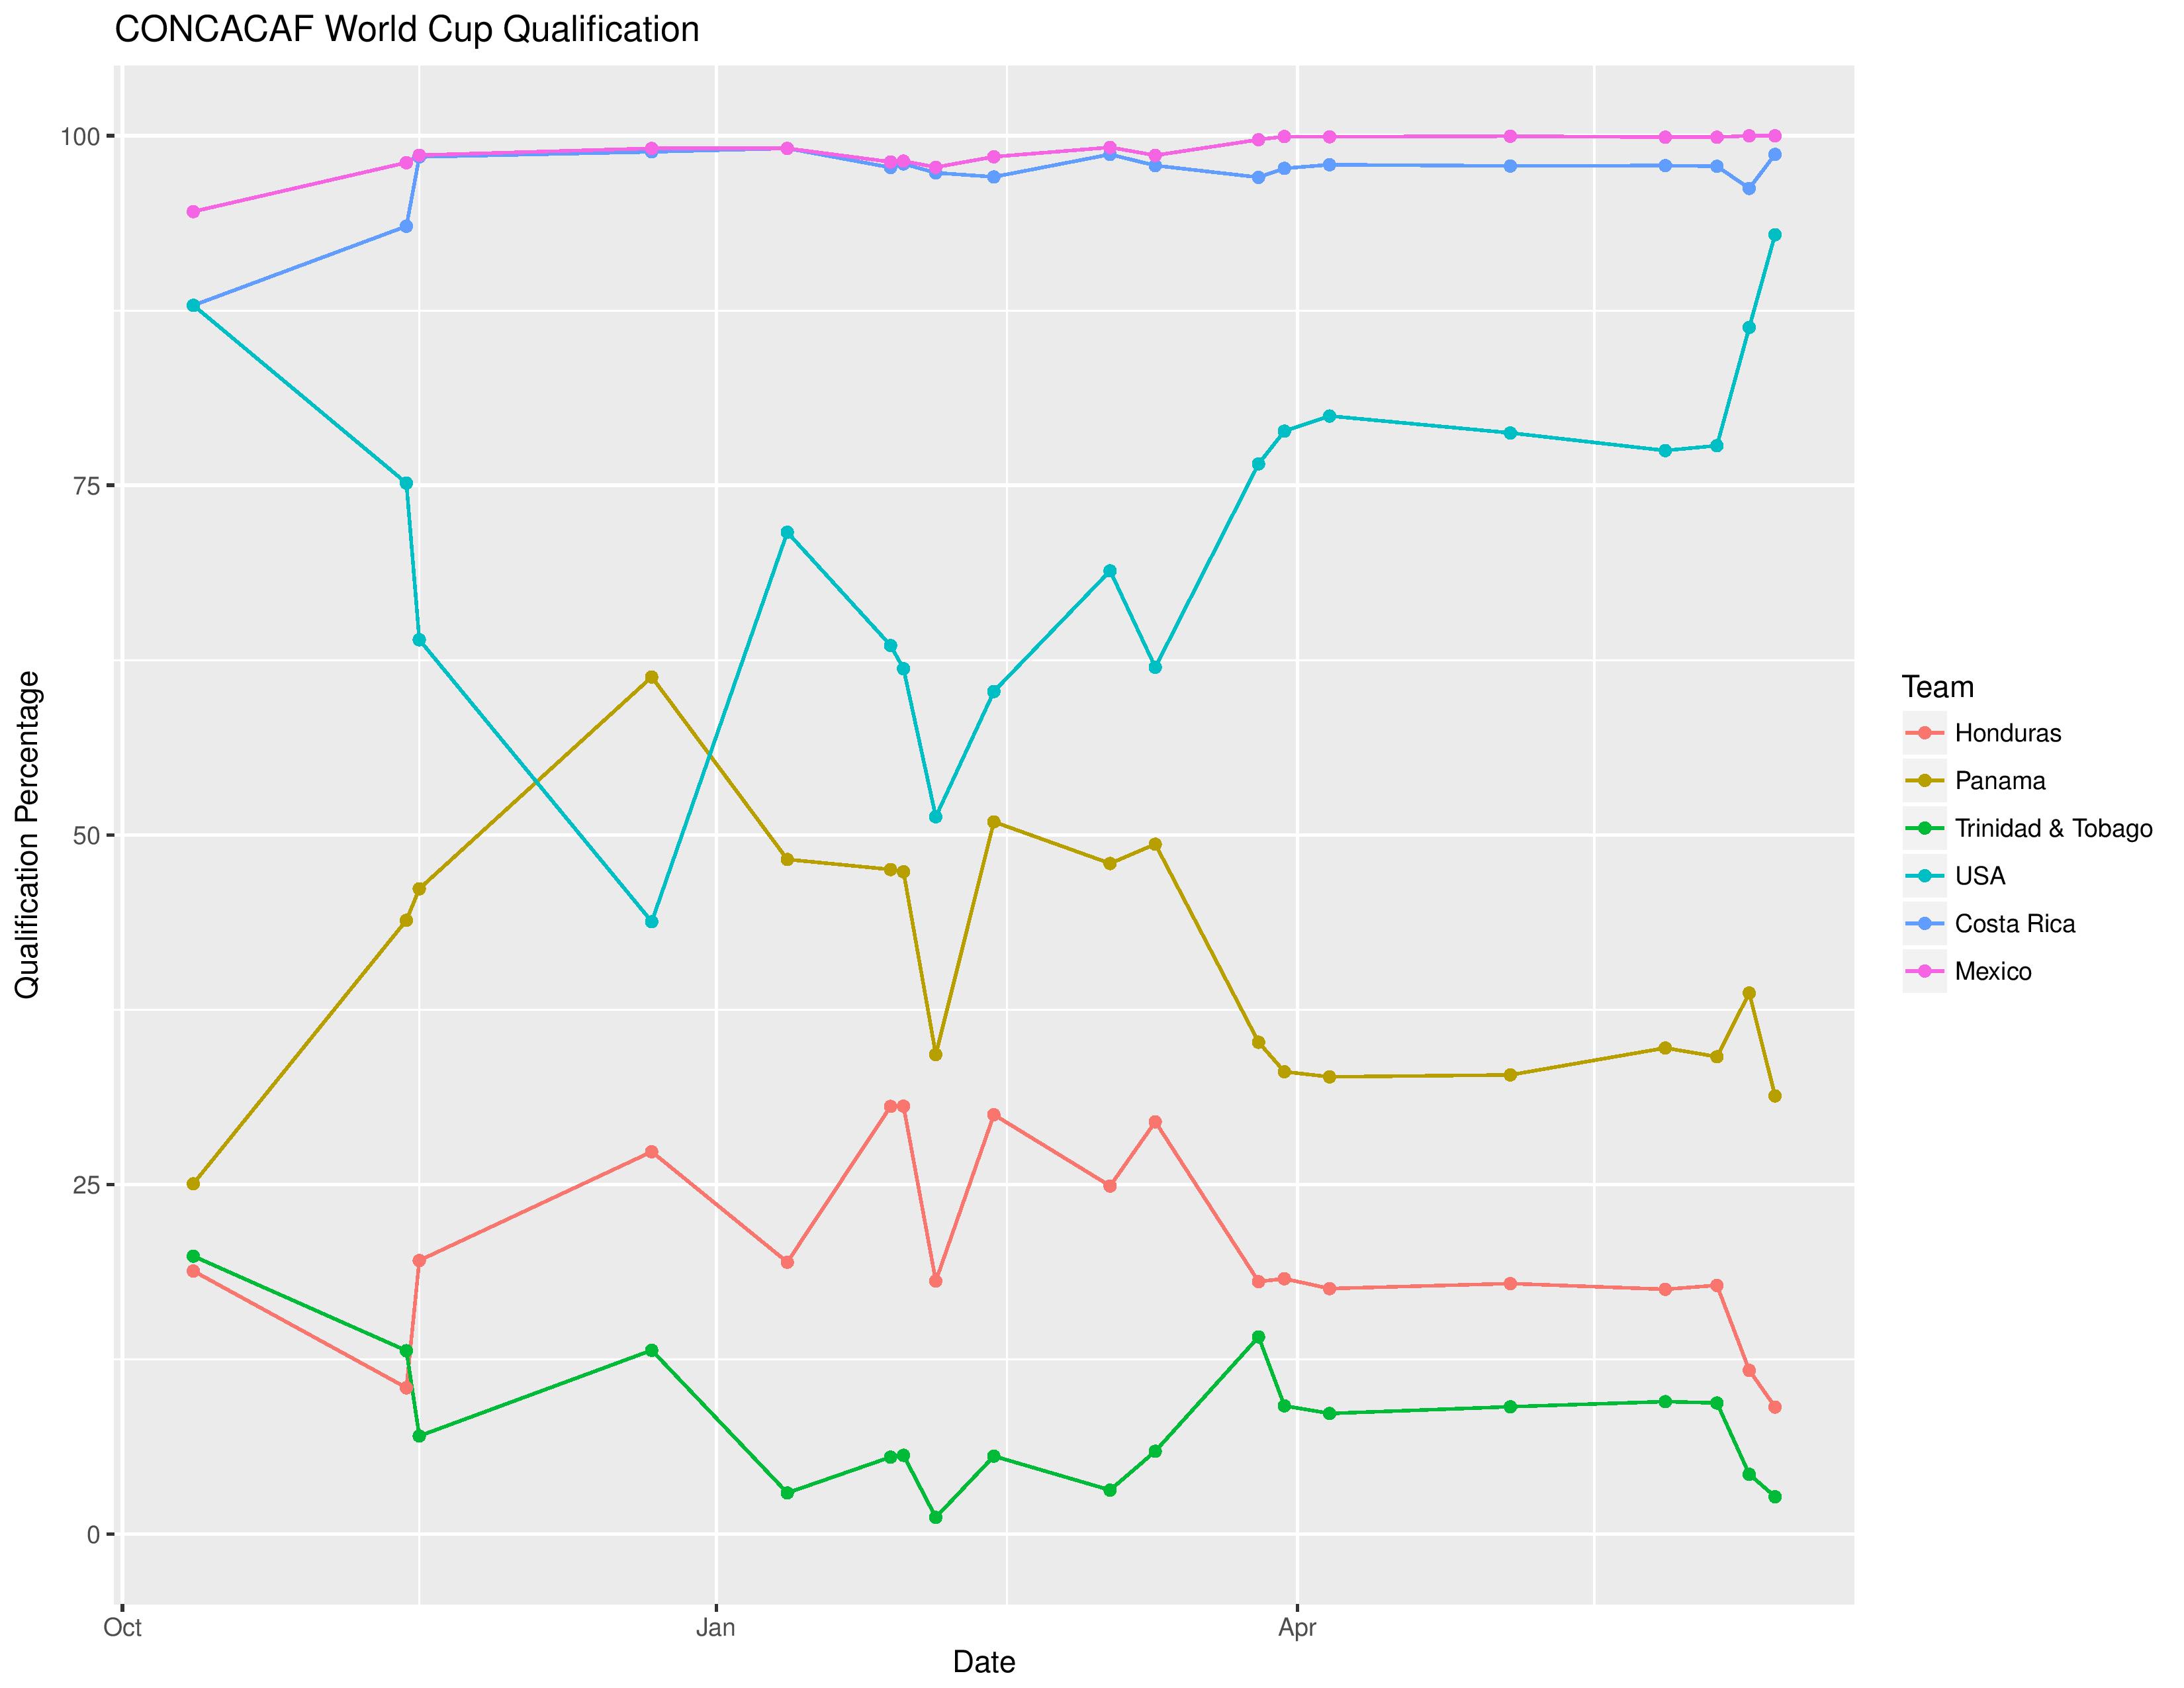
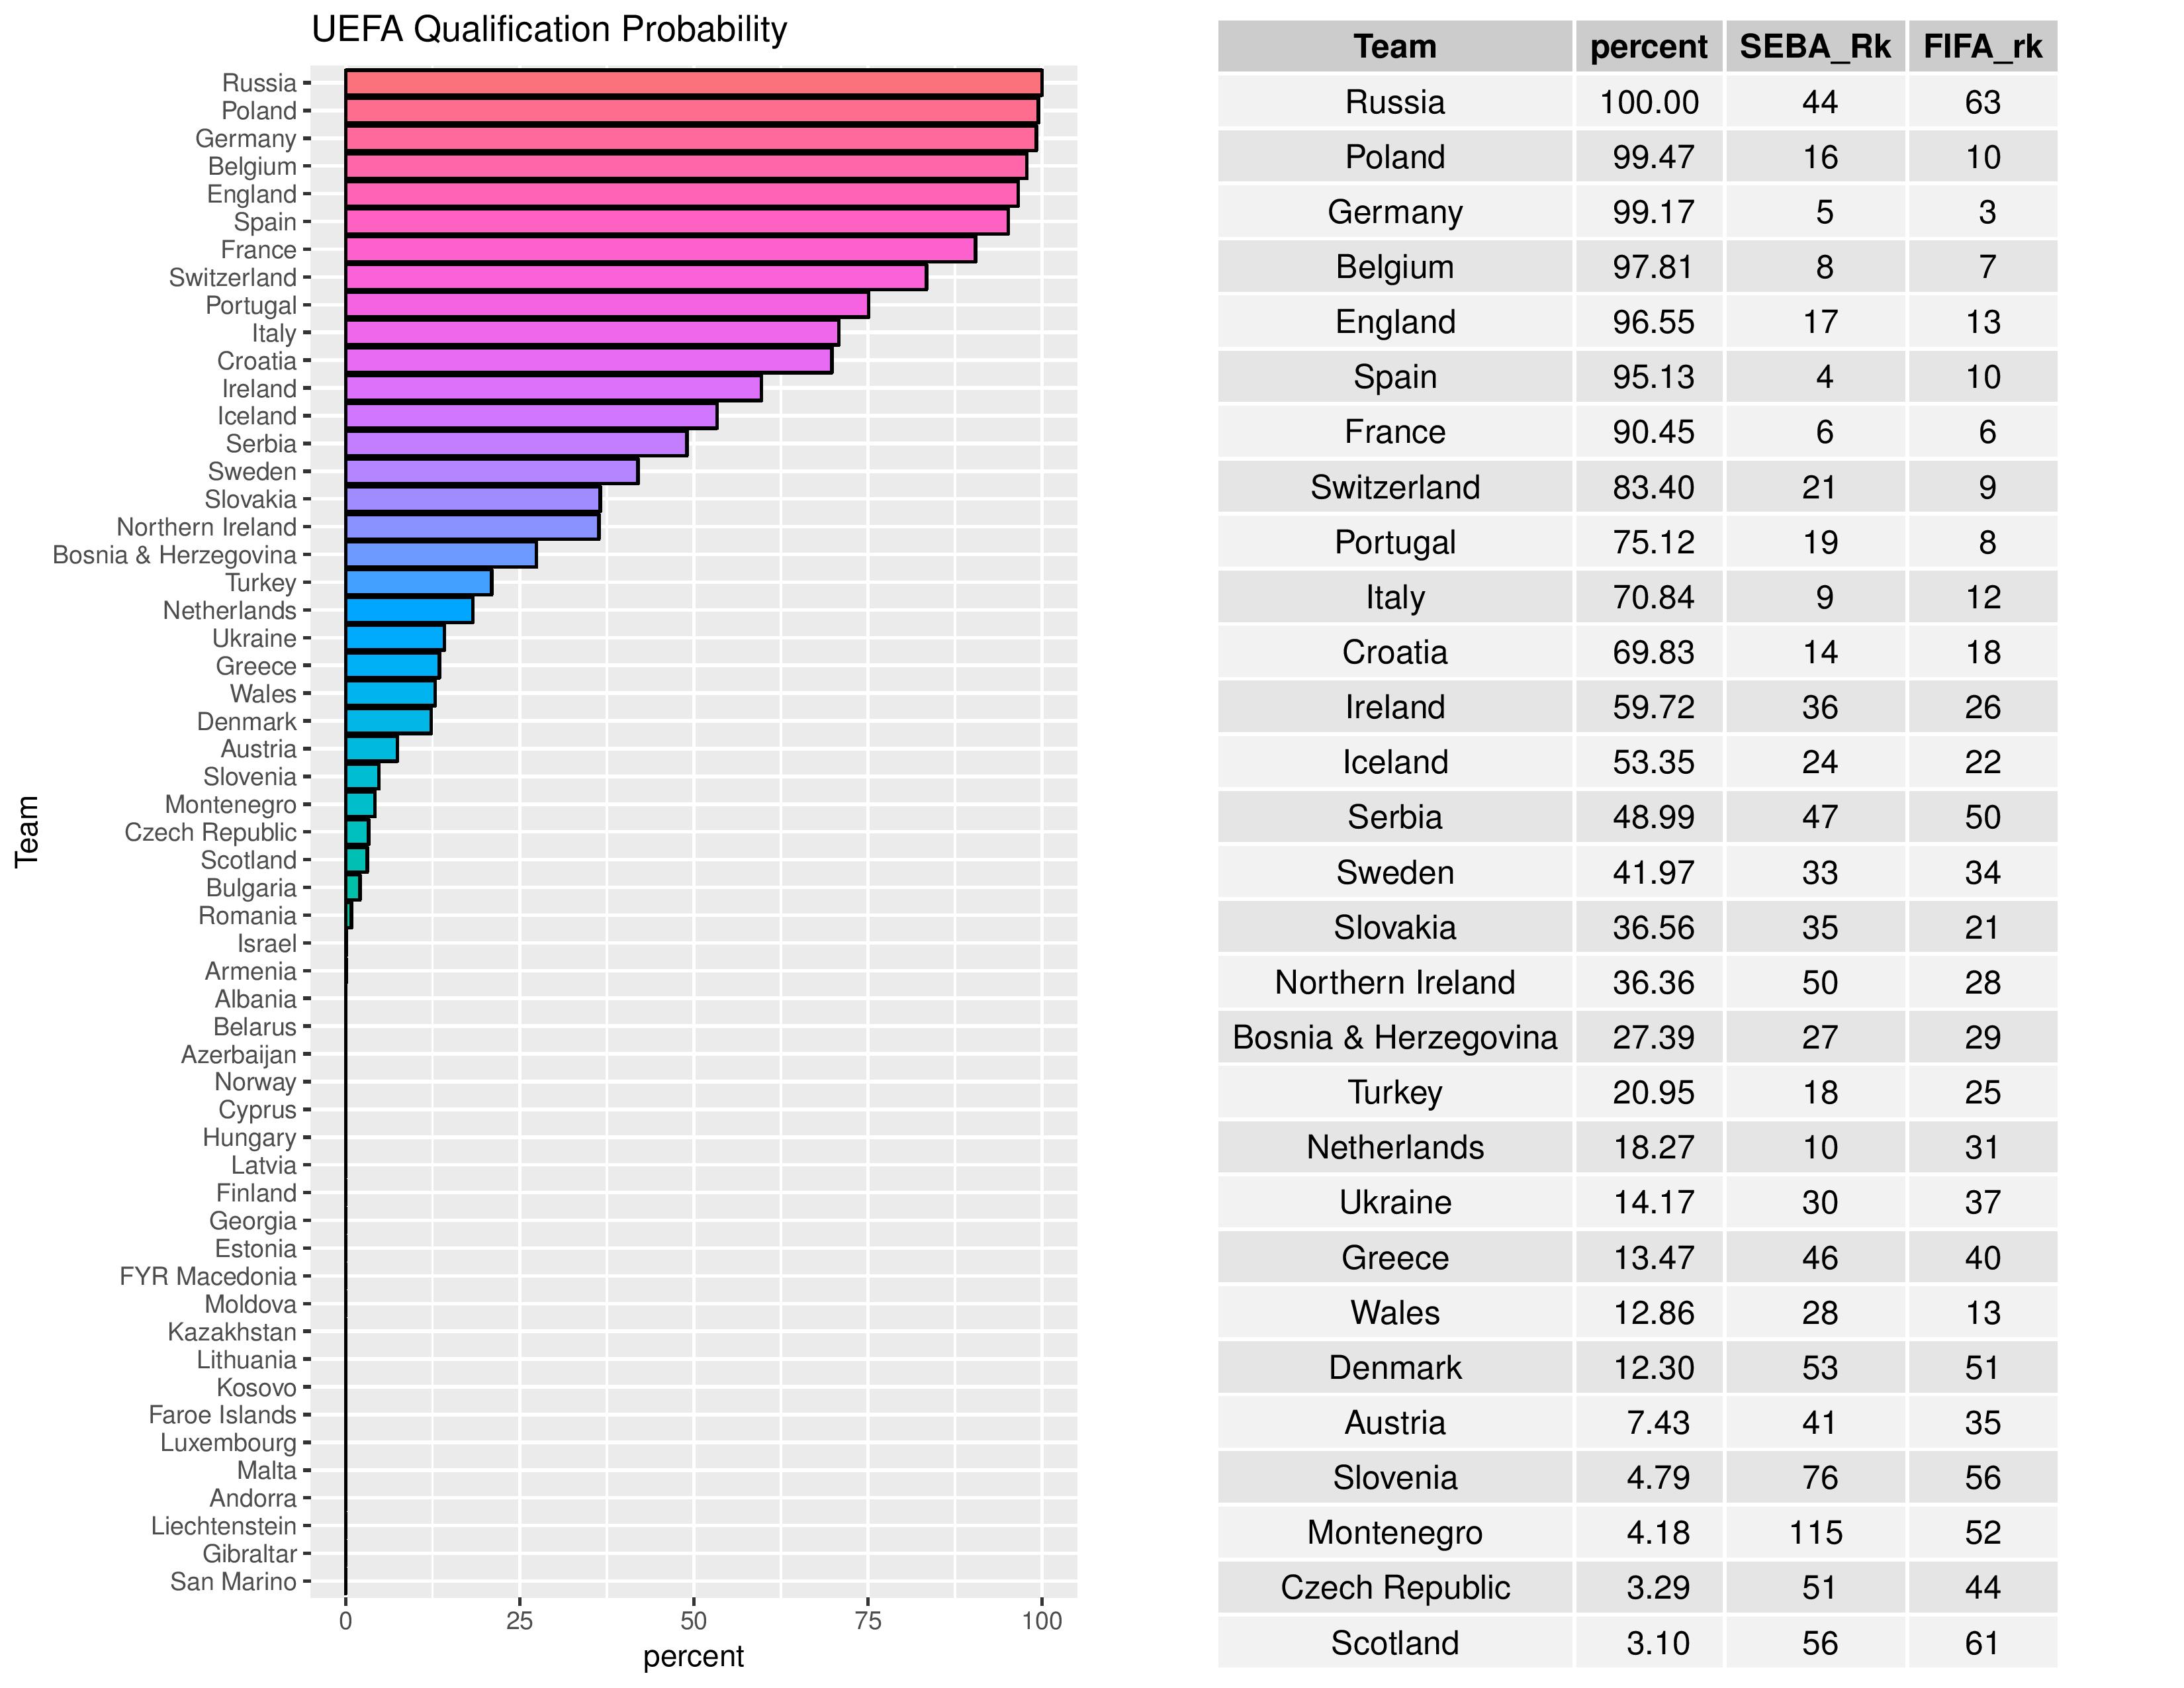
World Cup Qualification
The US’s chances of qualifying for the World Cup have increased from 86.30% to 92.93% from the last published forecast.

The next chart shows the probabilities of each of the USA’s potential Hex finishing spots.

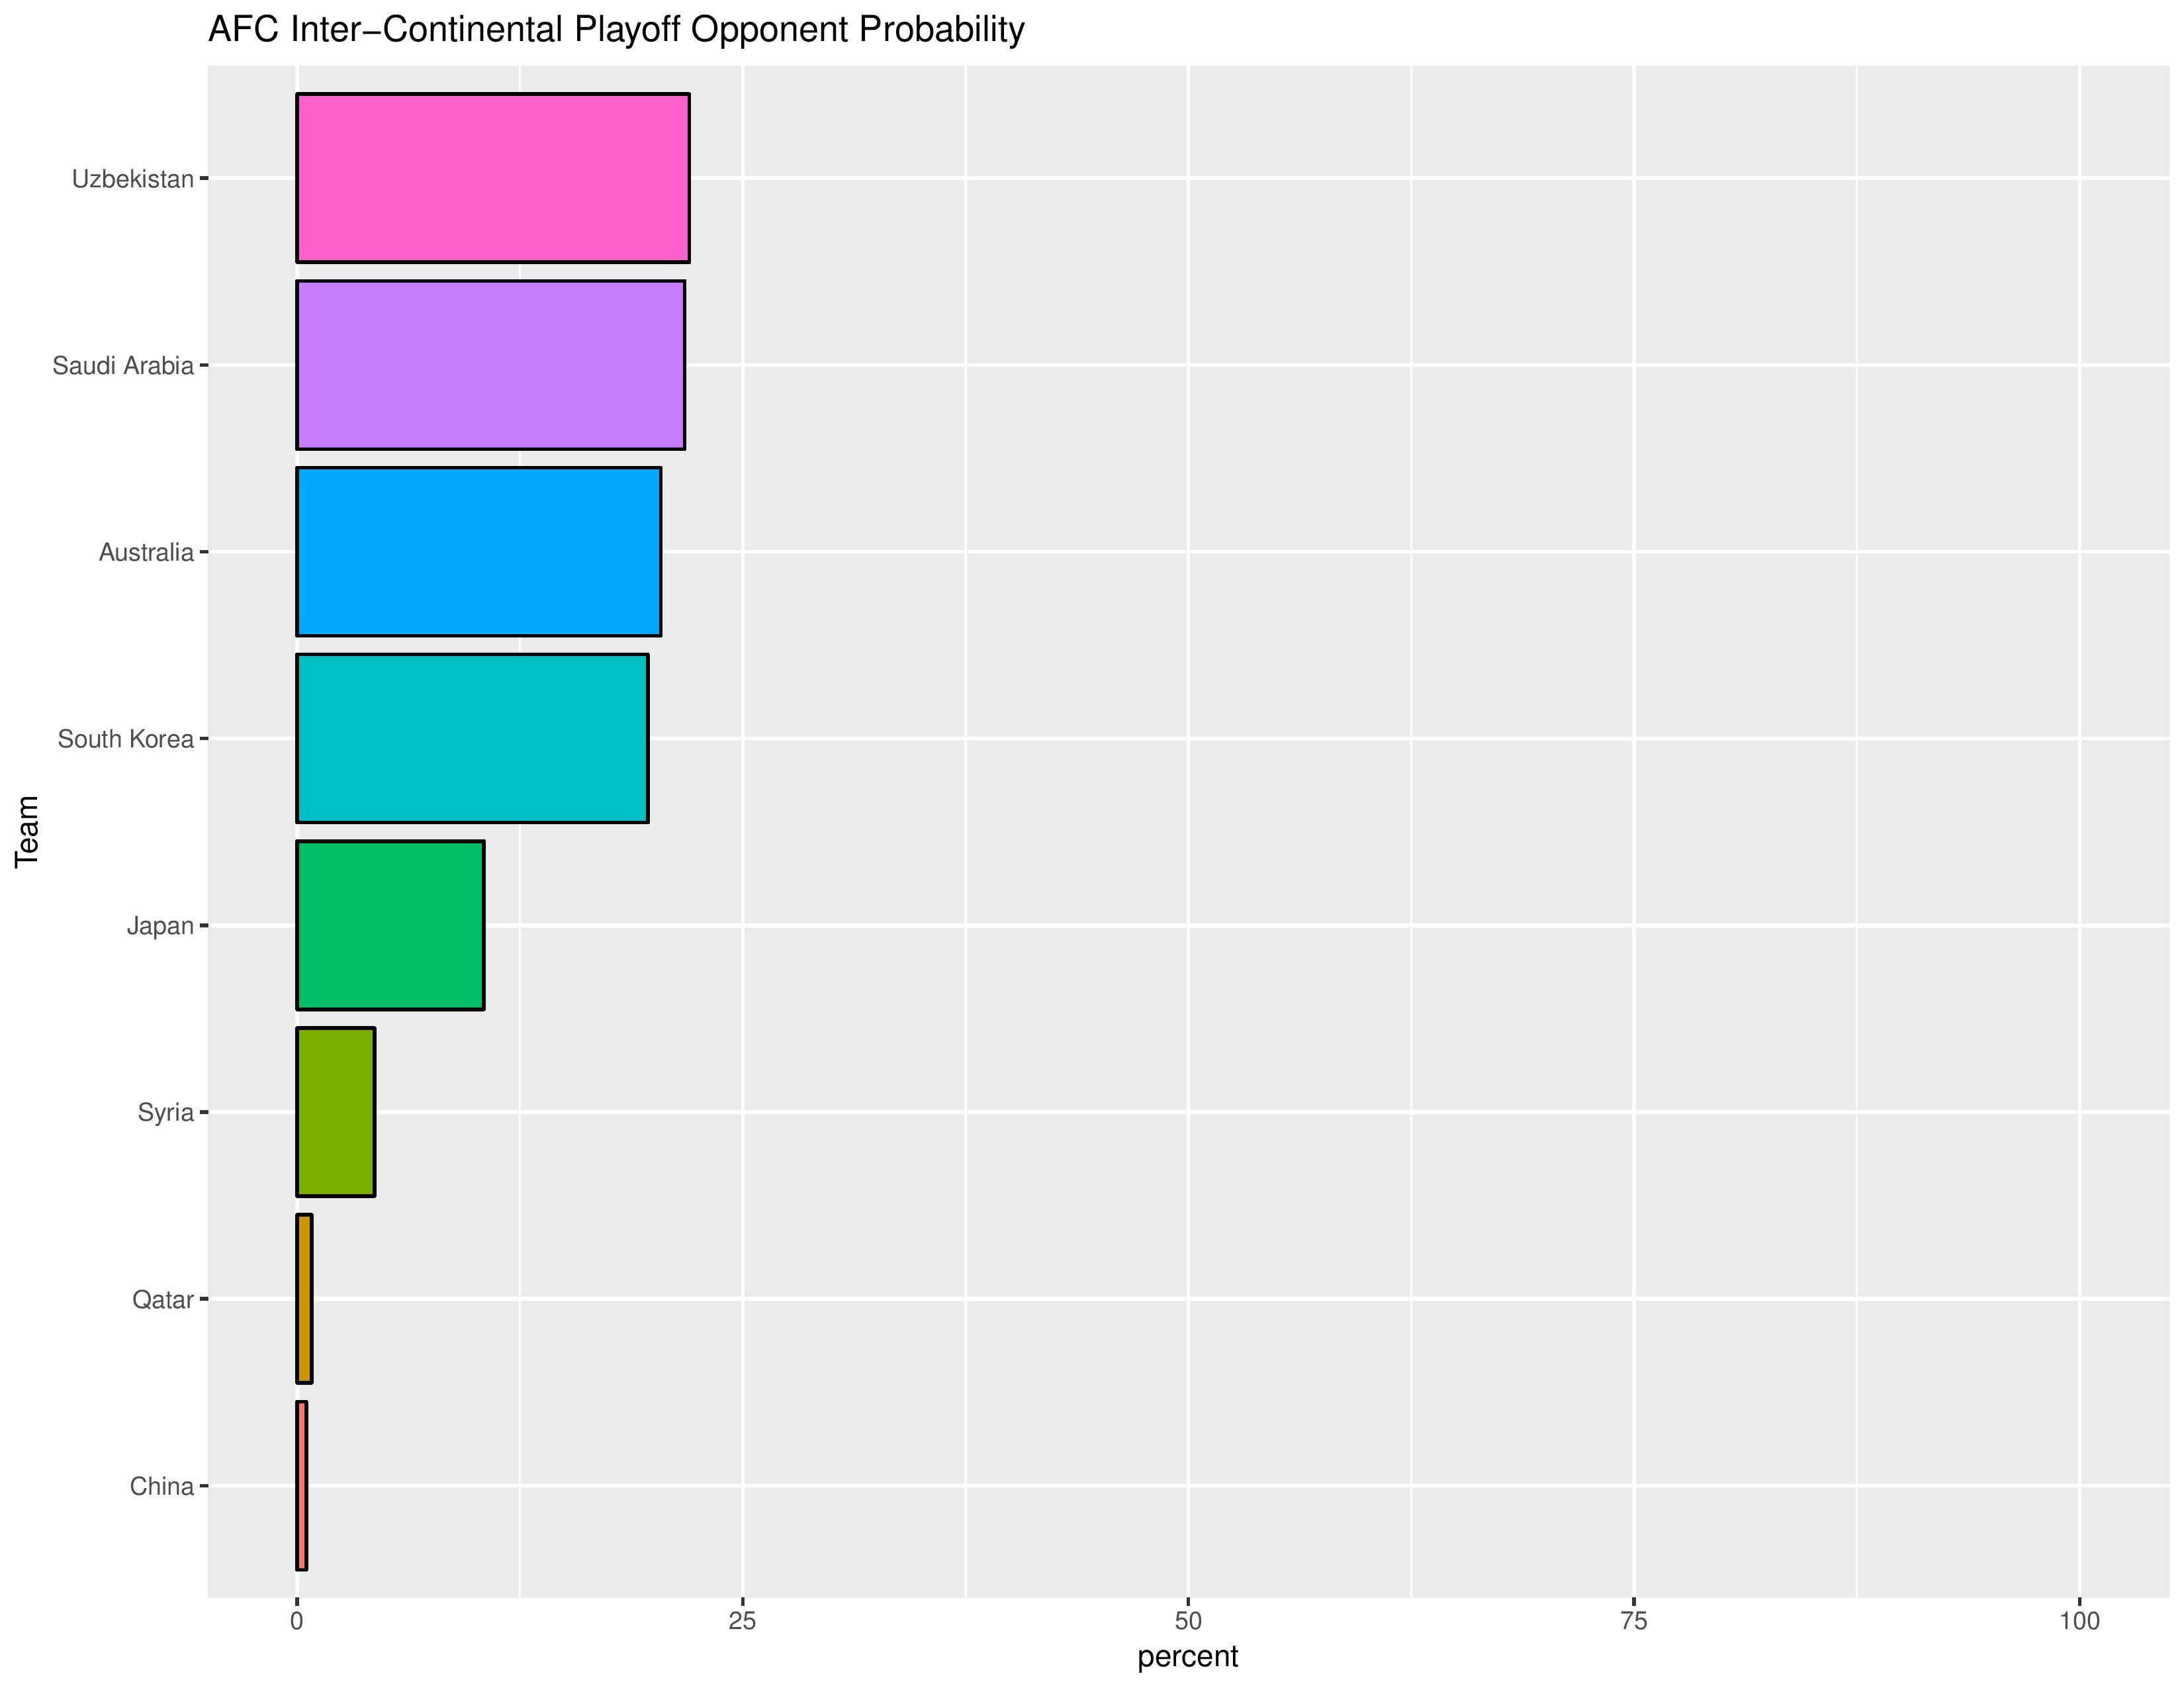
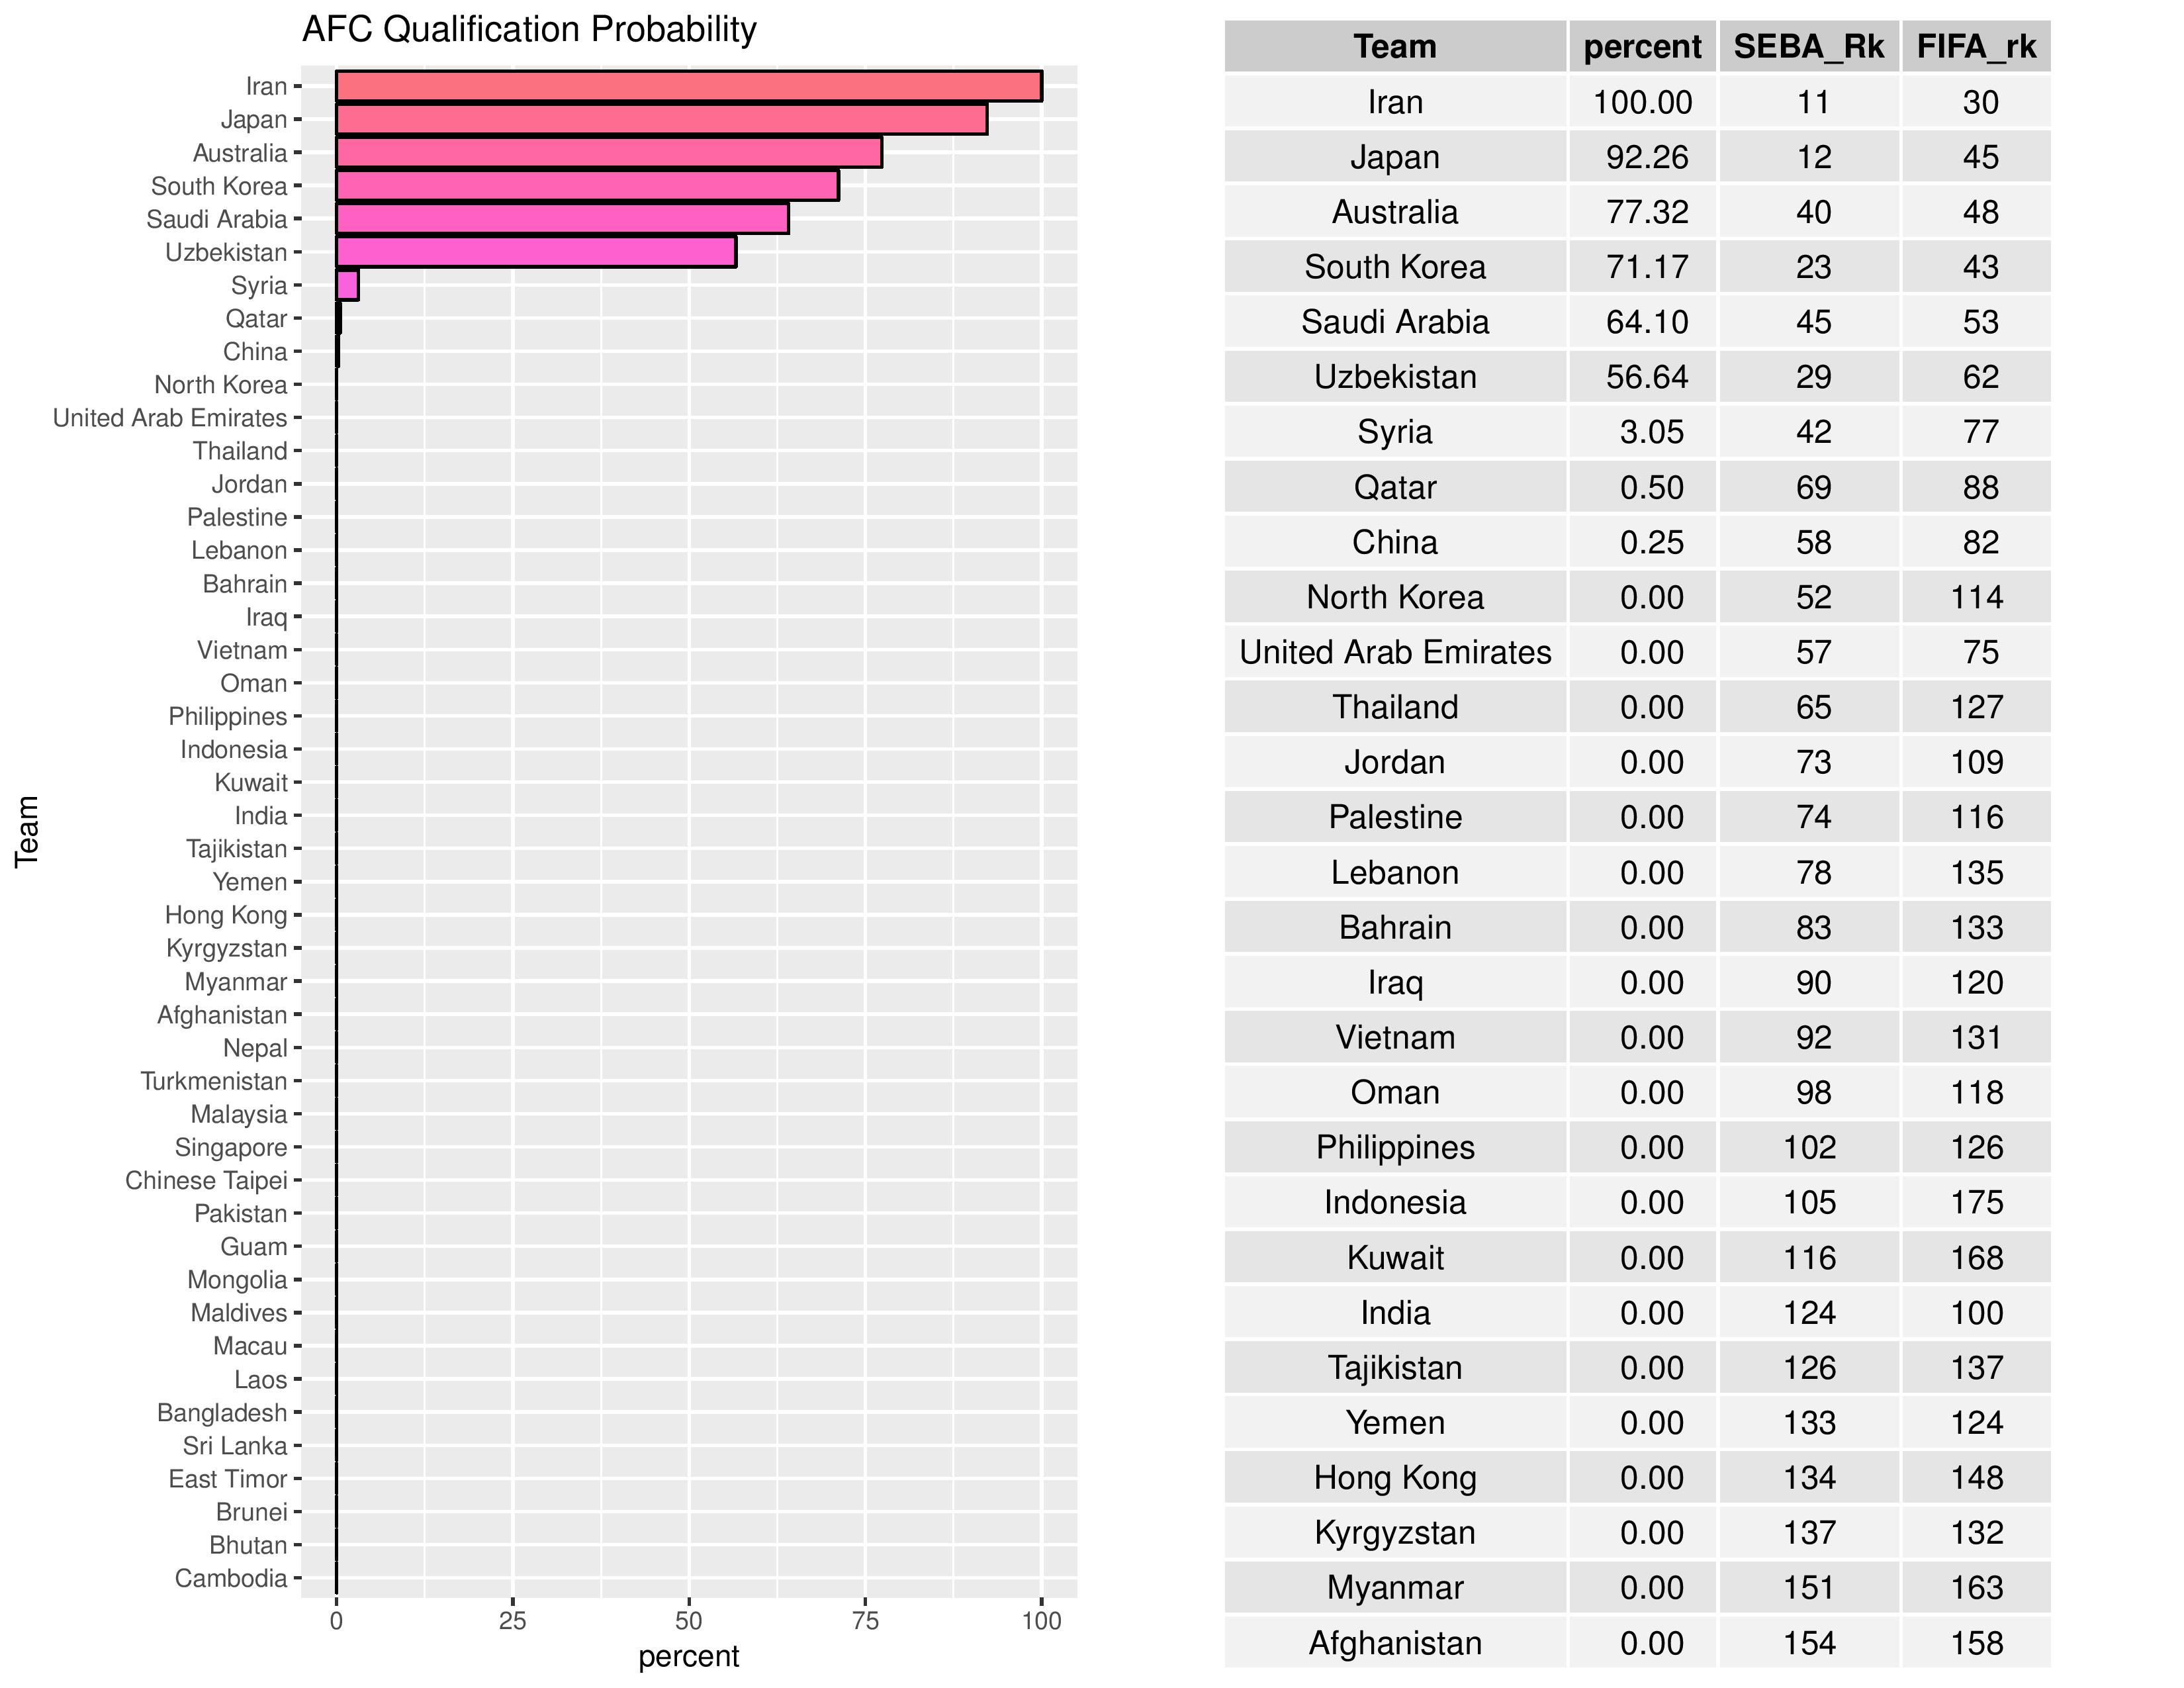
The following chart shows the likelihood of the AFC team for the inter-confederation match-up (4th place CONCACAF vs. 5th place AFC).
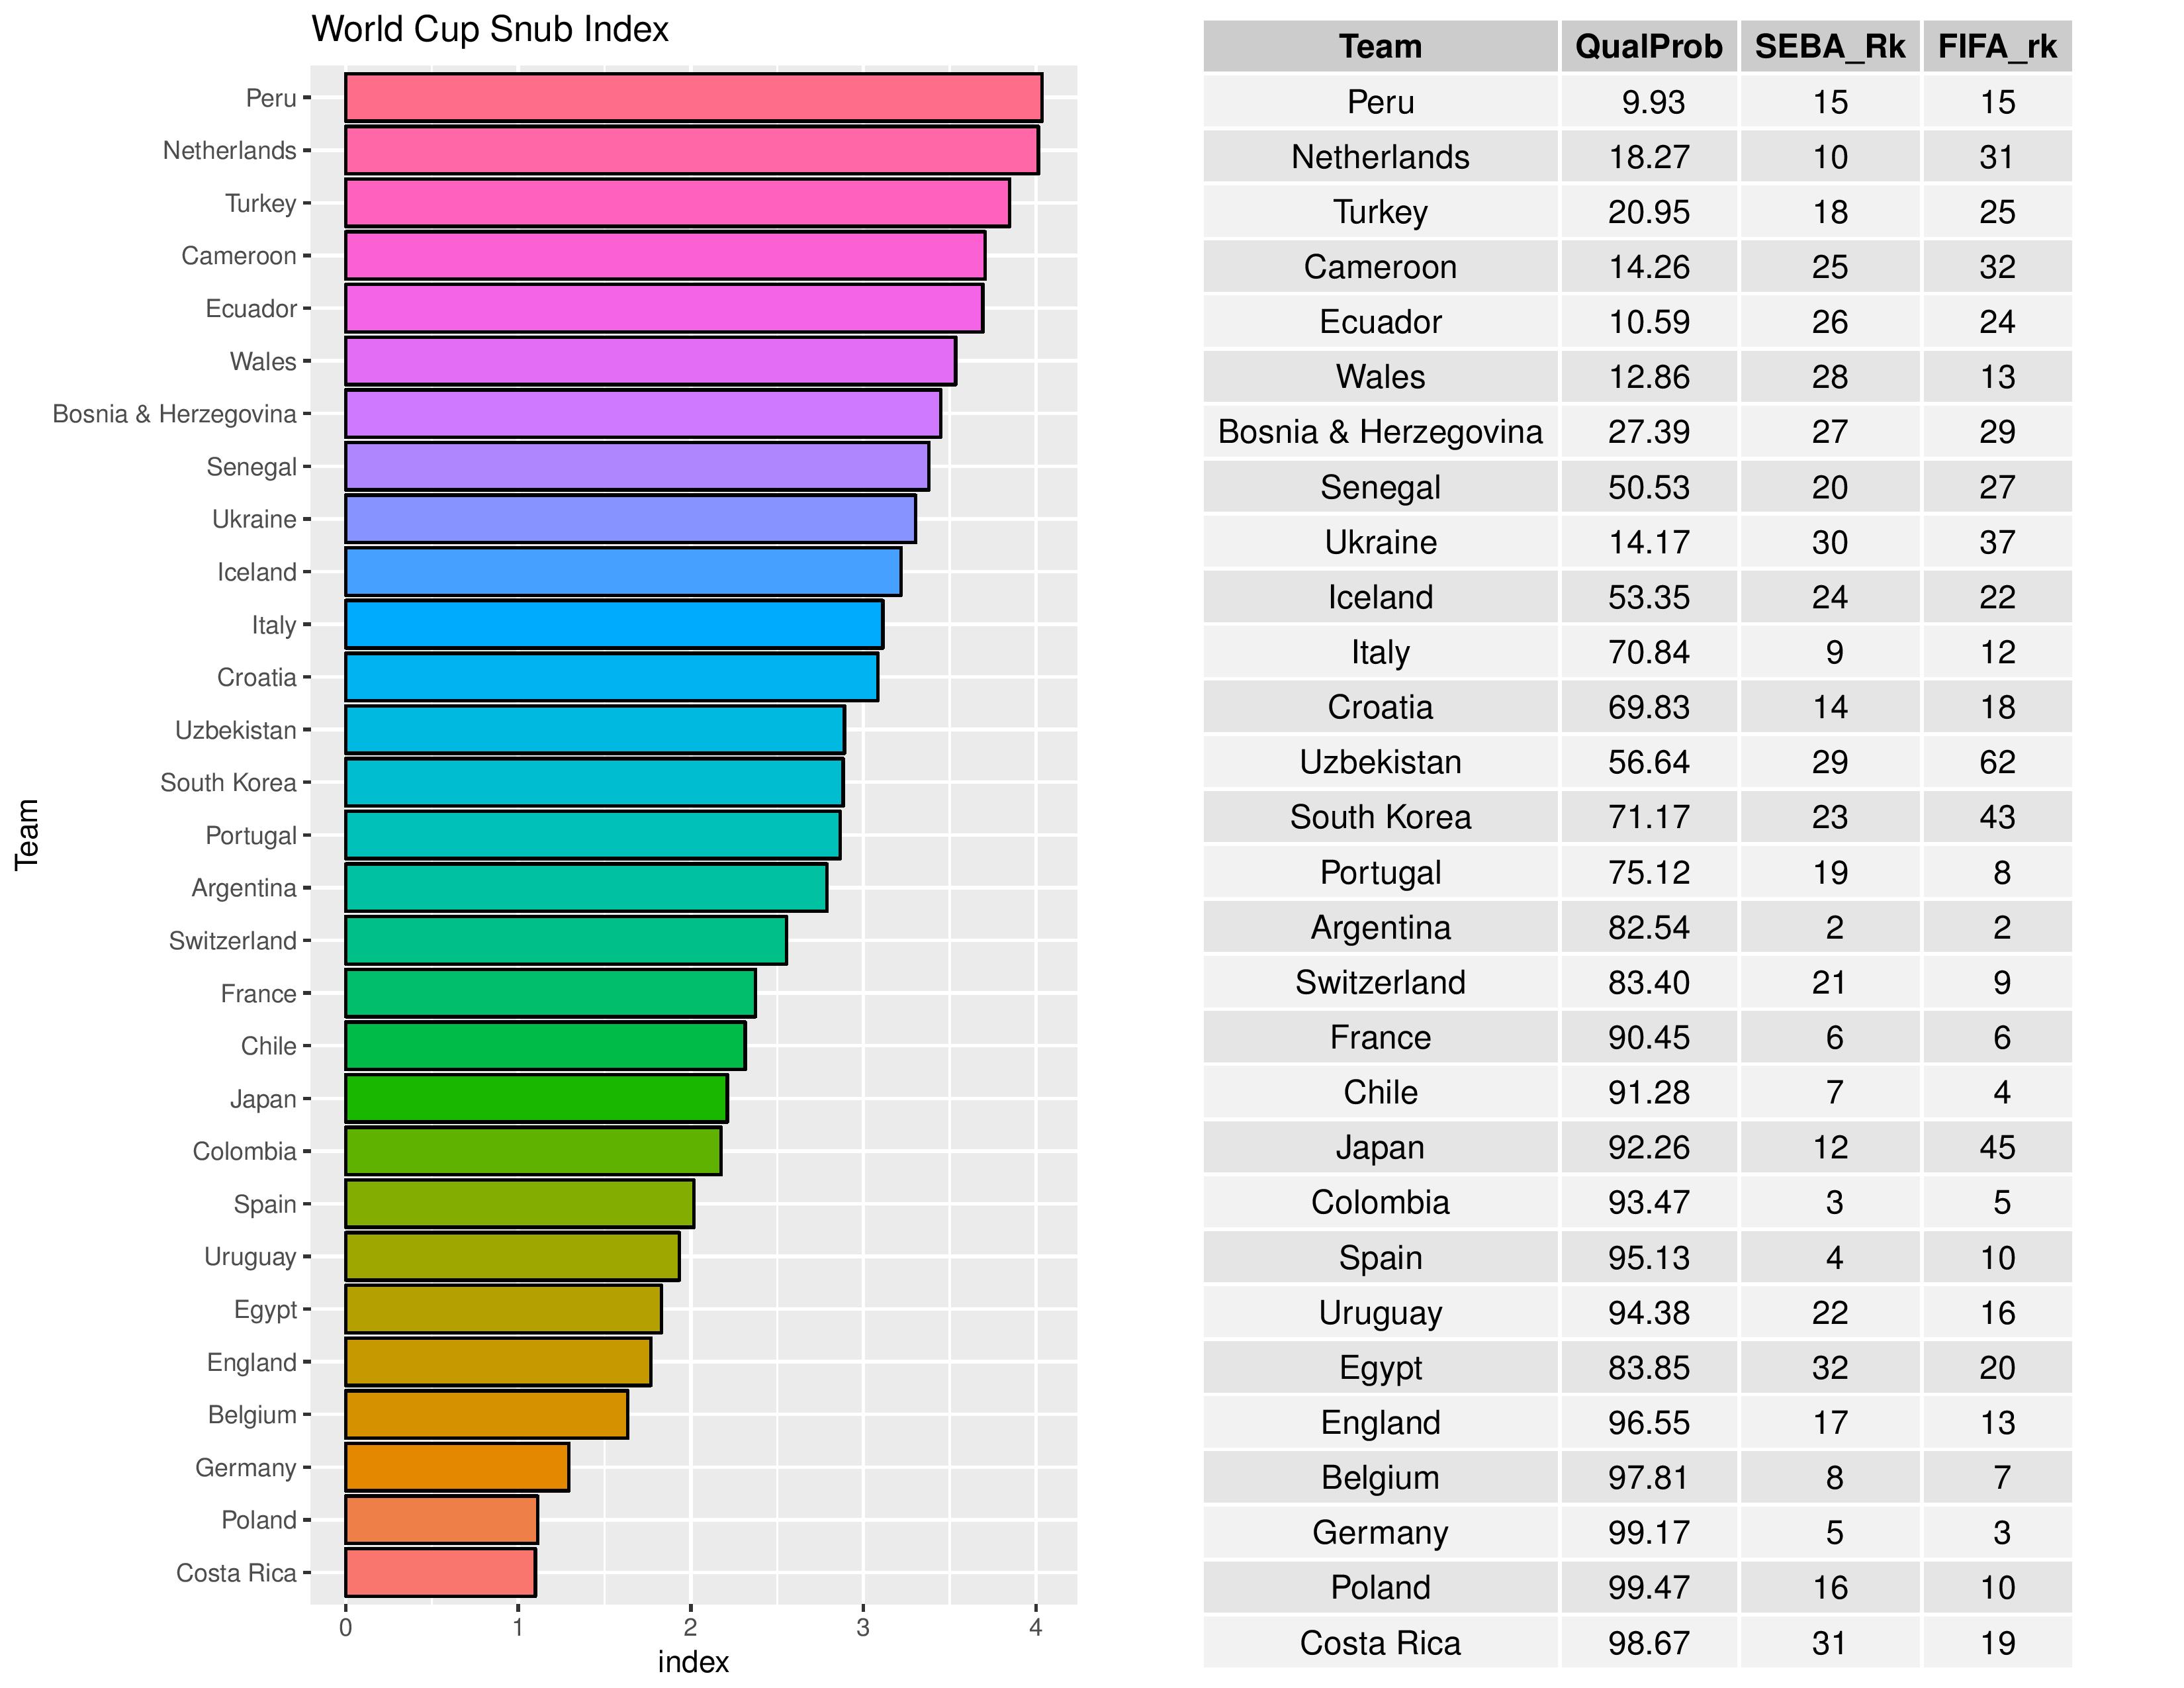
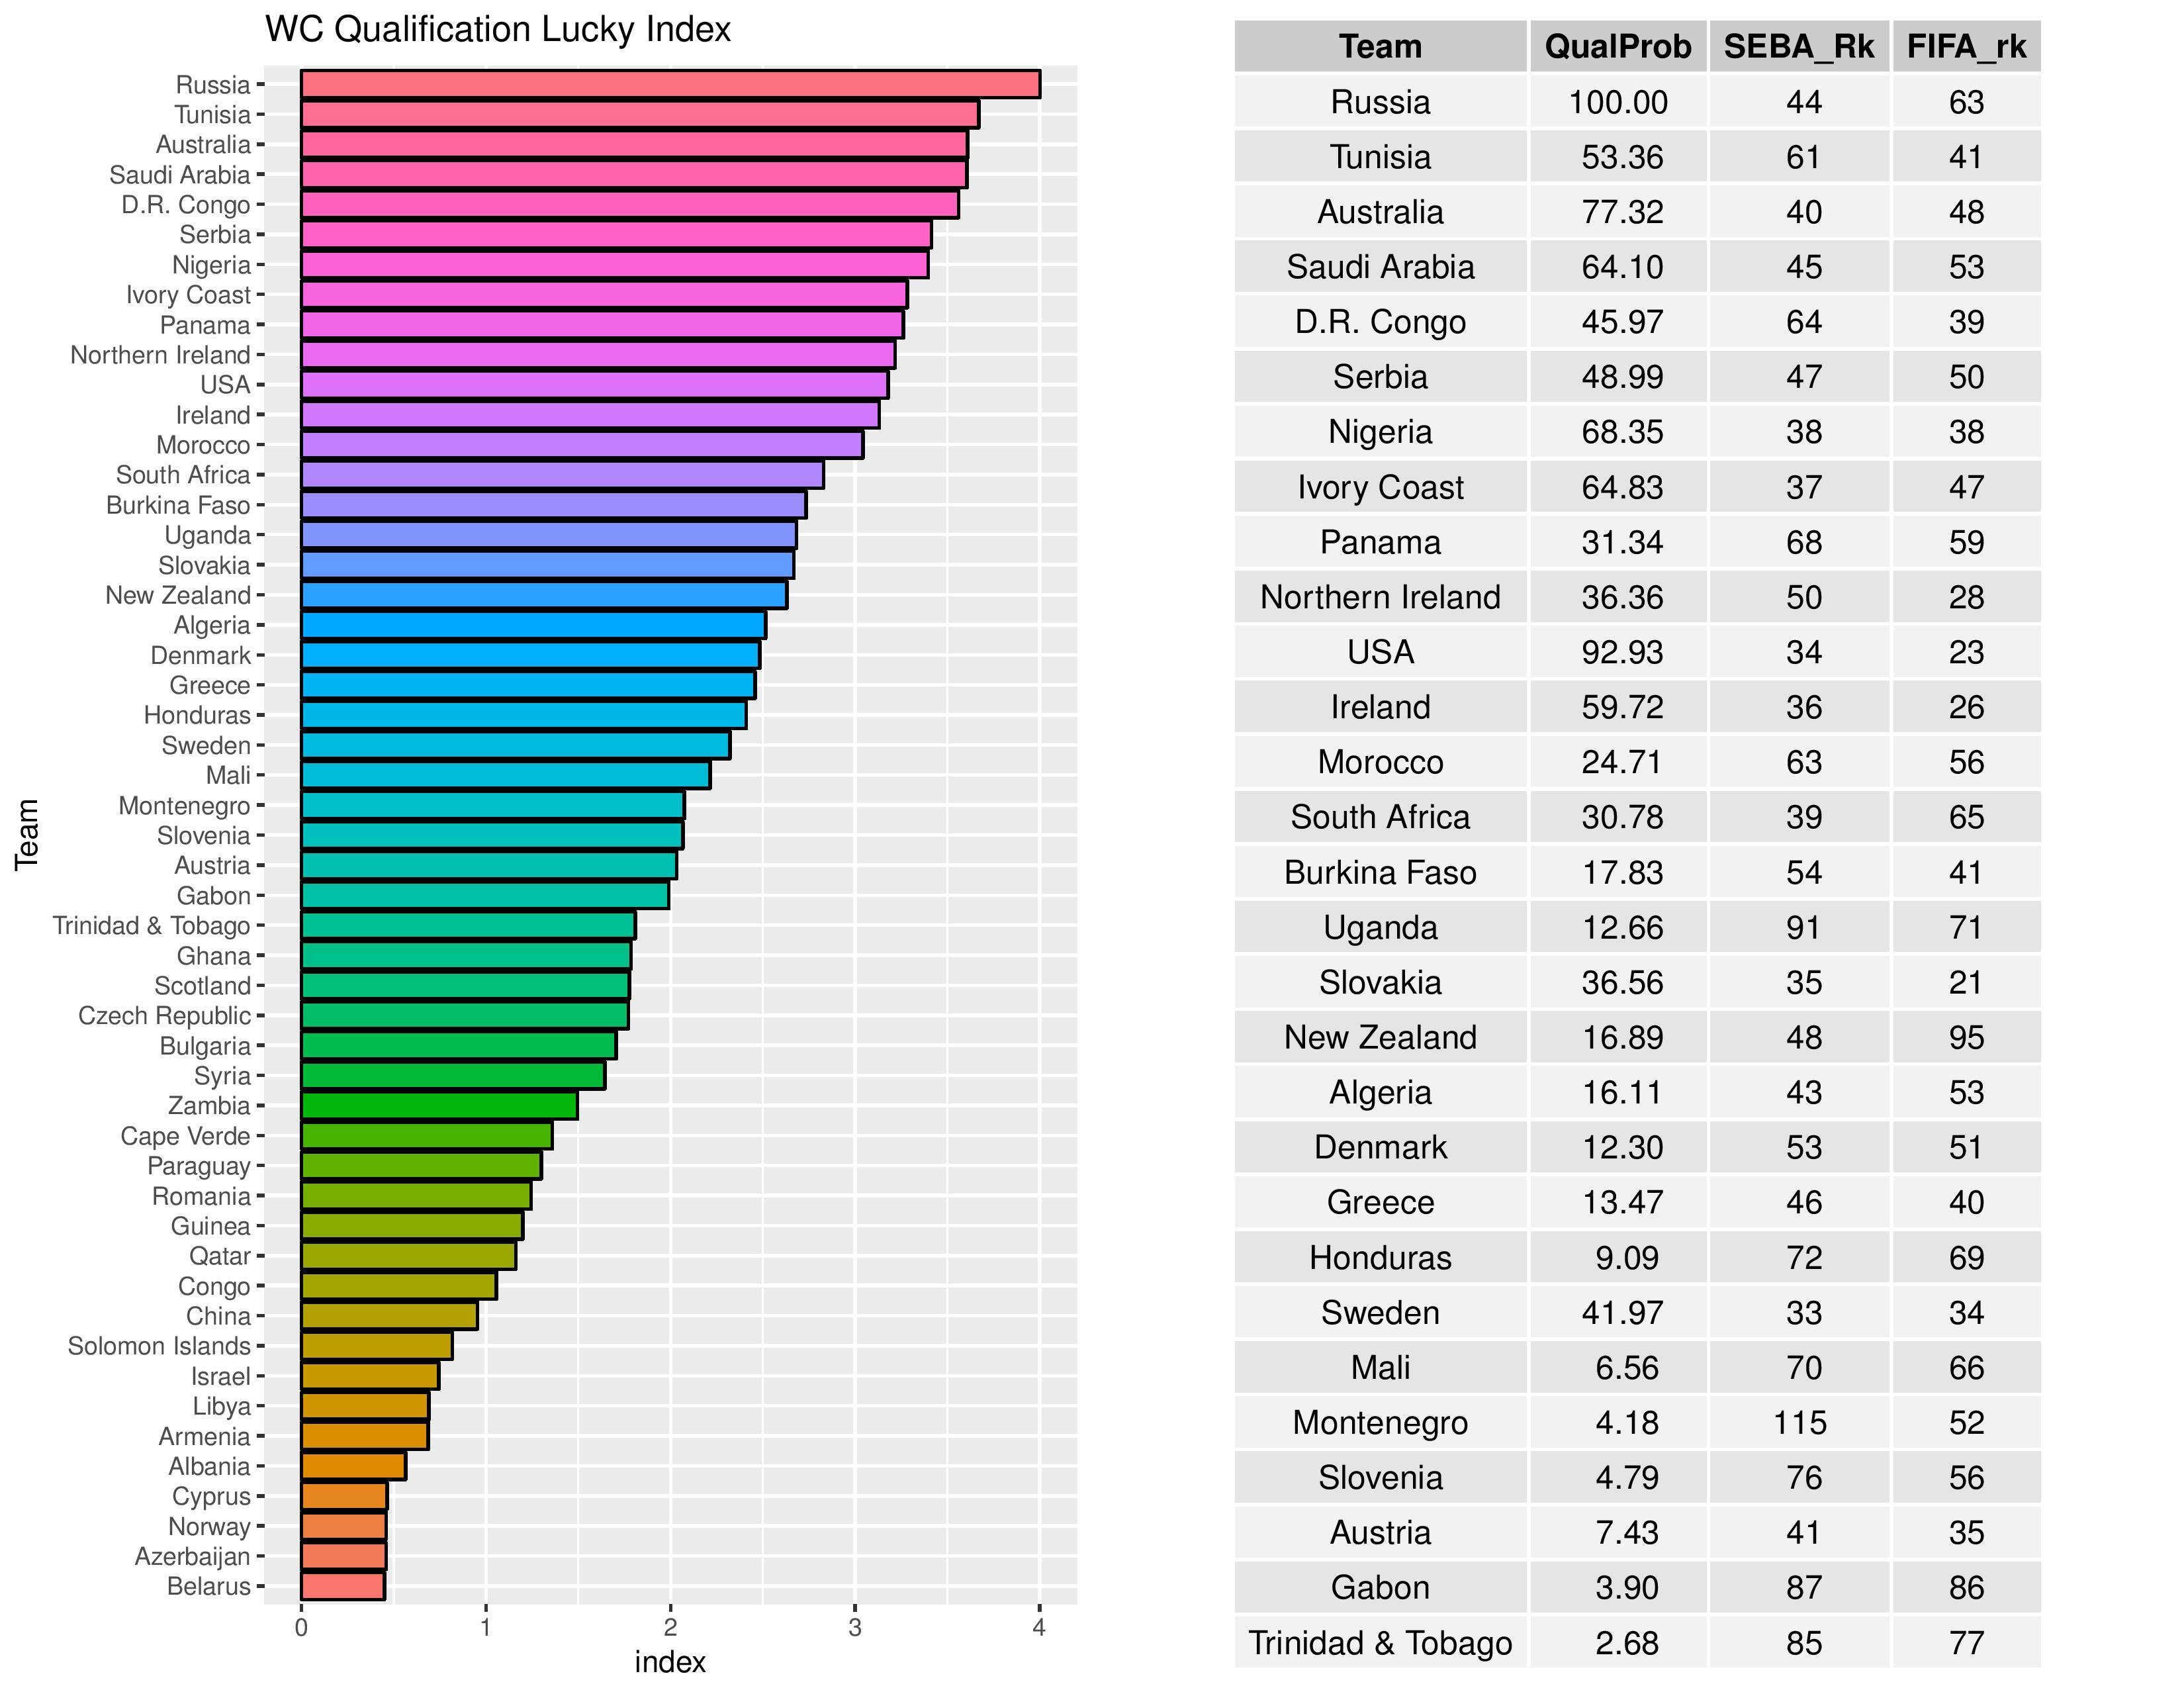
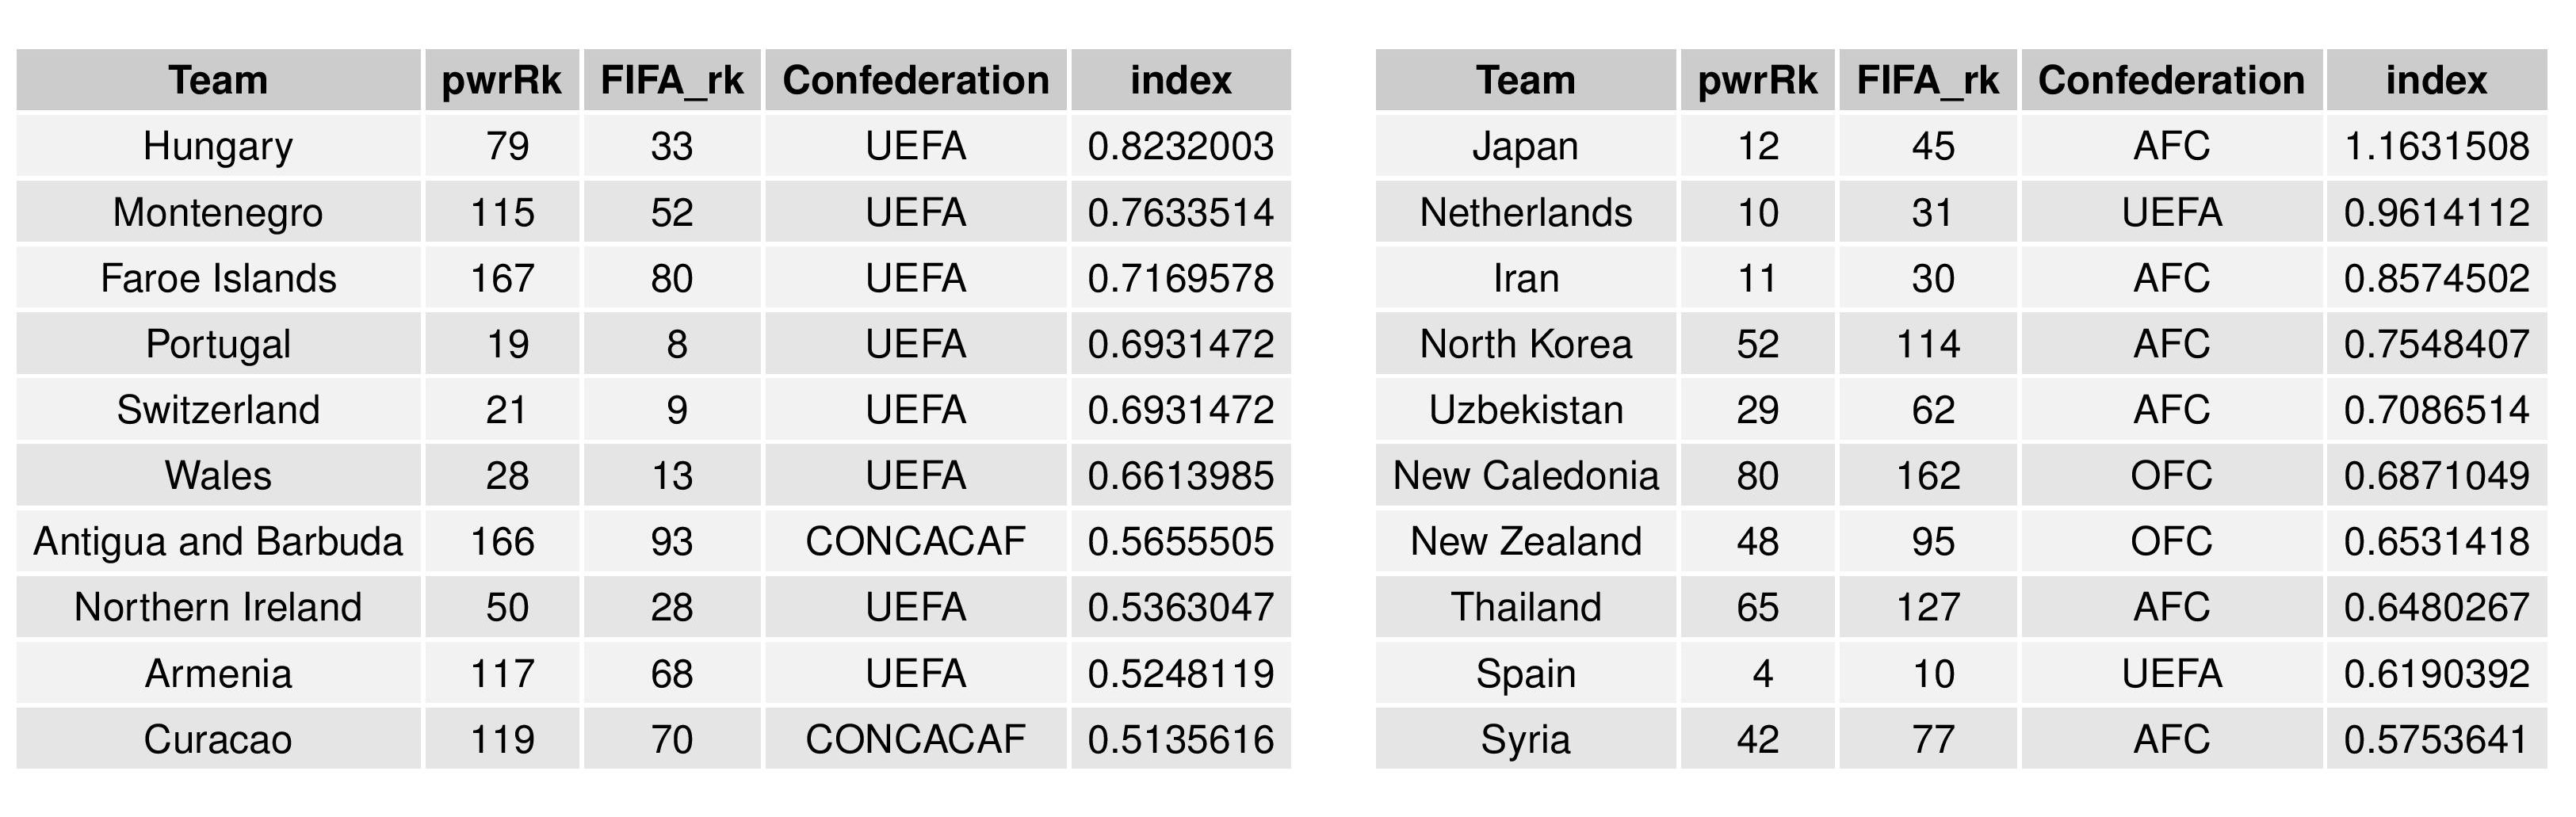
The following chart shows the “Snub Index.” If the World Cup were to be a tournament for the 32 truly-top teams in the world (at least according to SEBA), then this chart is sorted by how damaged the top 32 teams’ chances are in qualifying for the World Cup. If they have already qualified then they disappear from this chart.
The USA is not in this chart because they are not currently quite among the top 32 teams according to SEBA.
On the other side, this chart shows the nations outside of the top 32 who, perhaps unfairly, benefit from an imperfect qualification system and are ranked by their benefit.
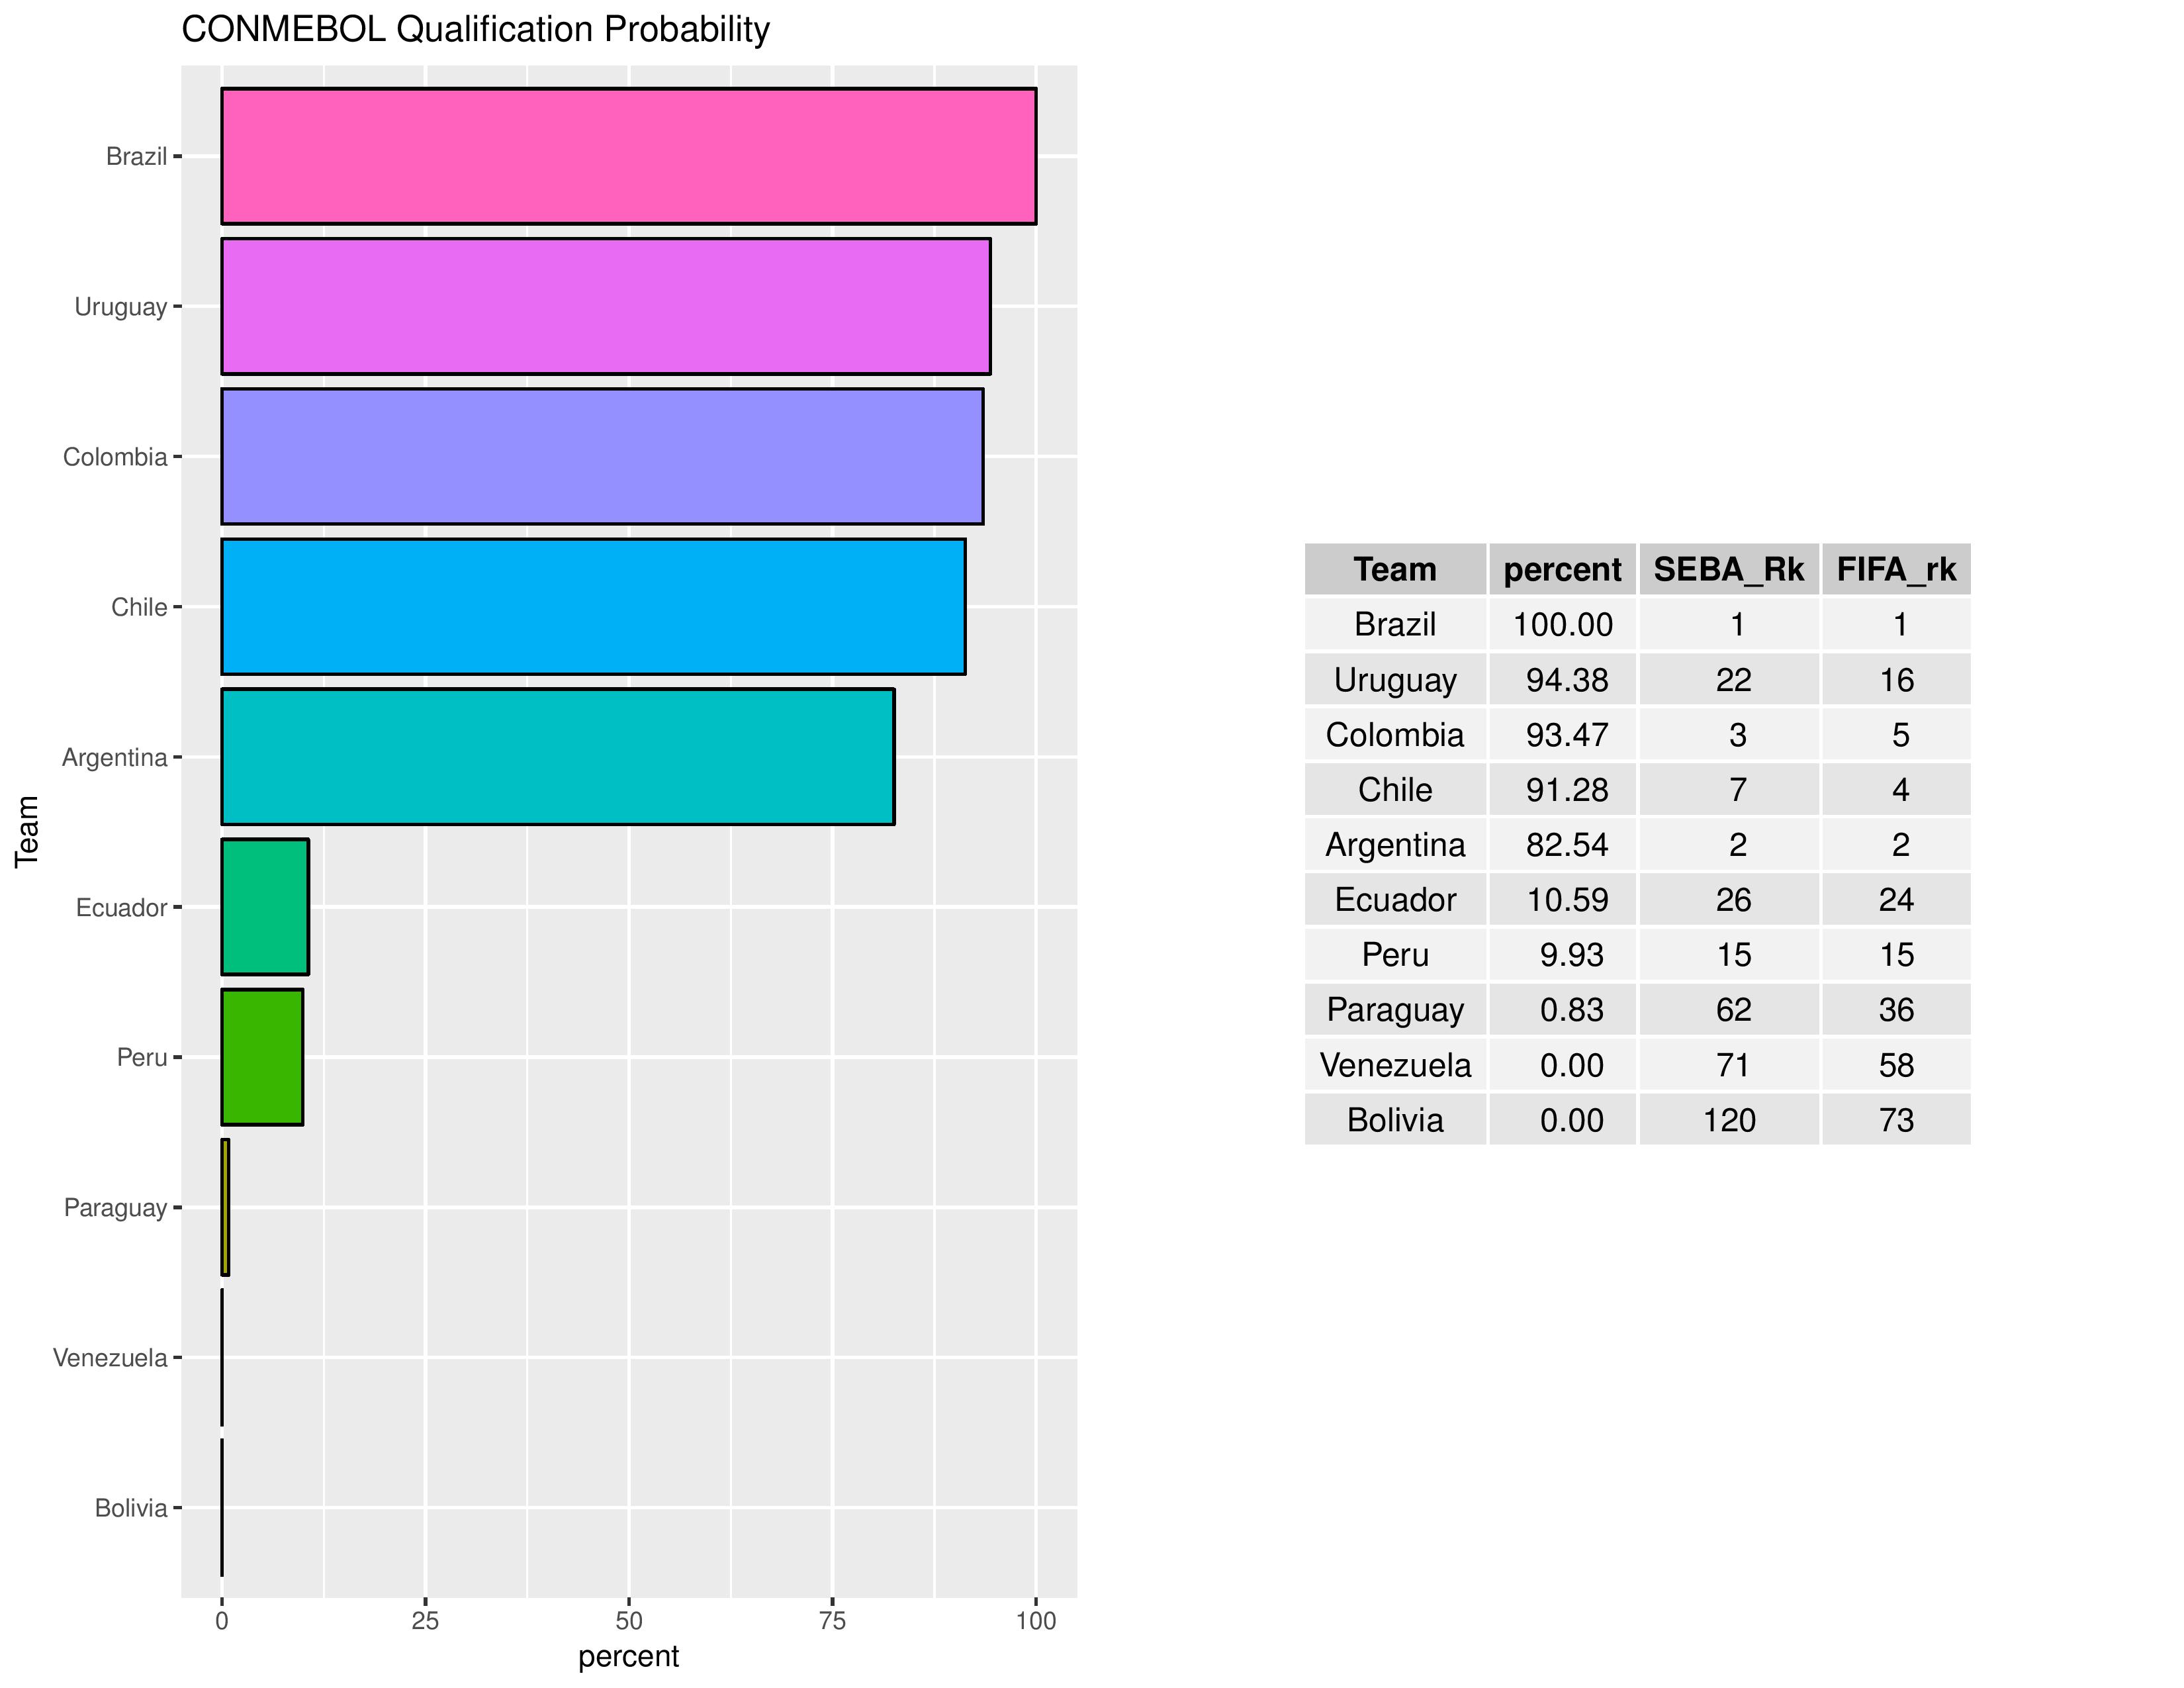
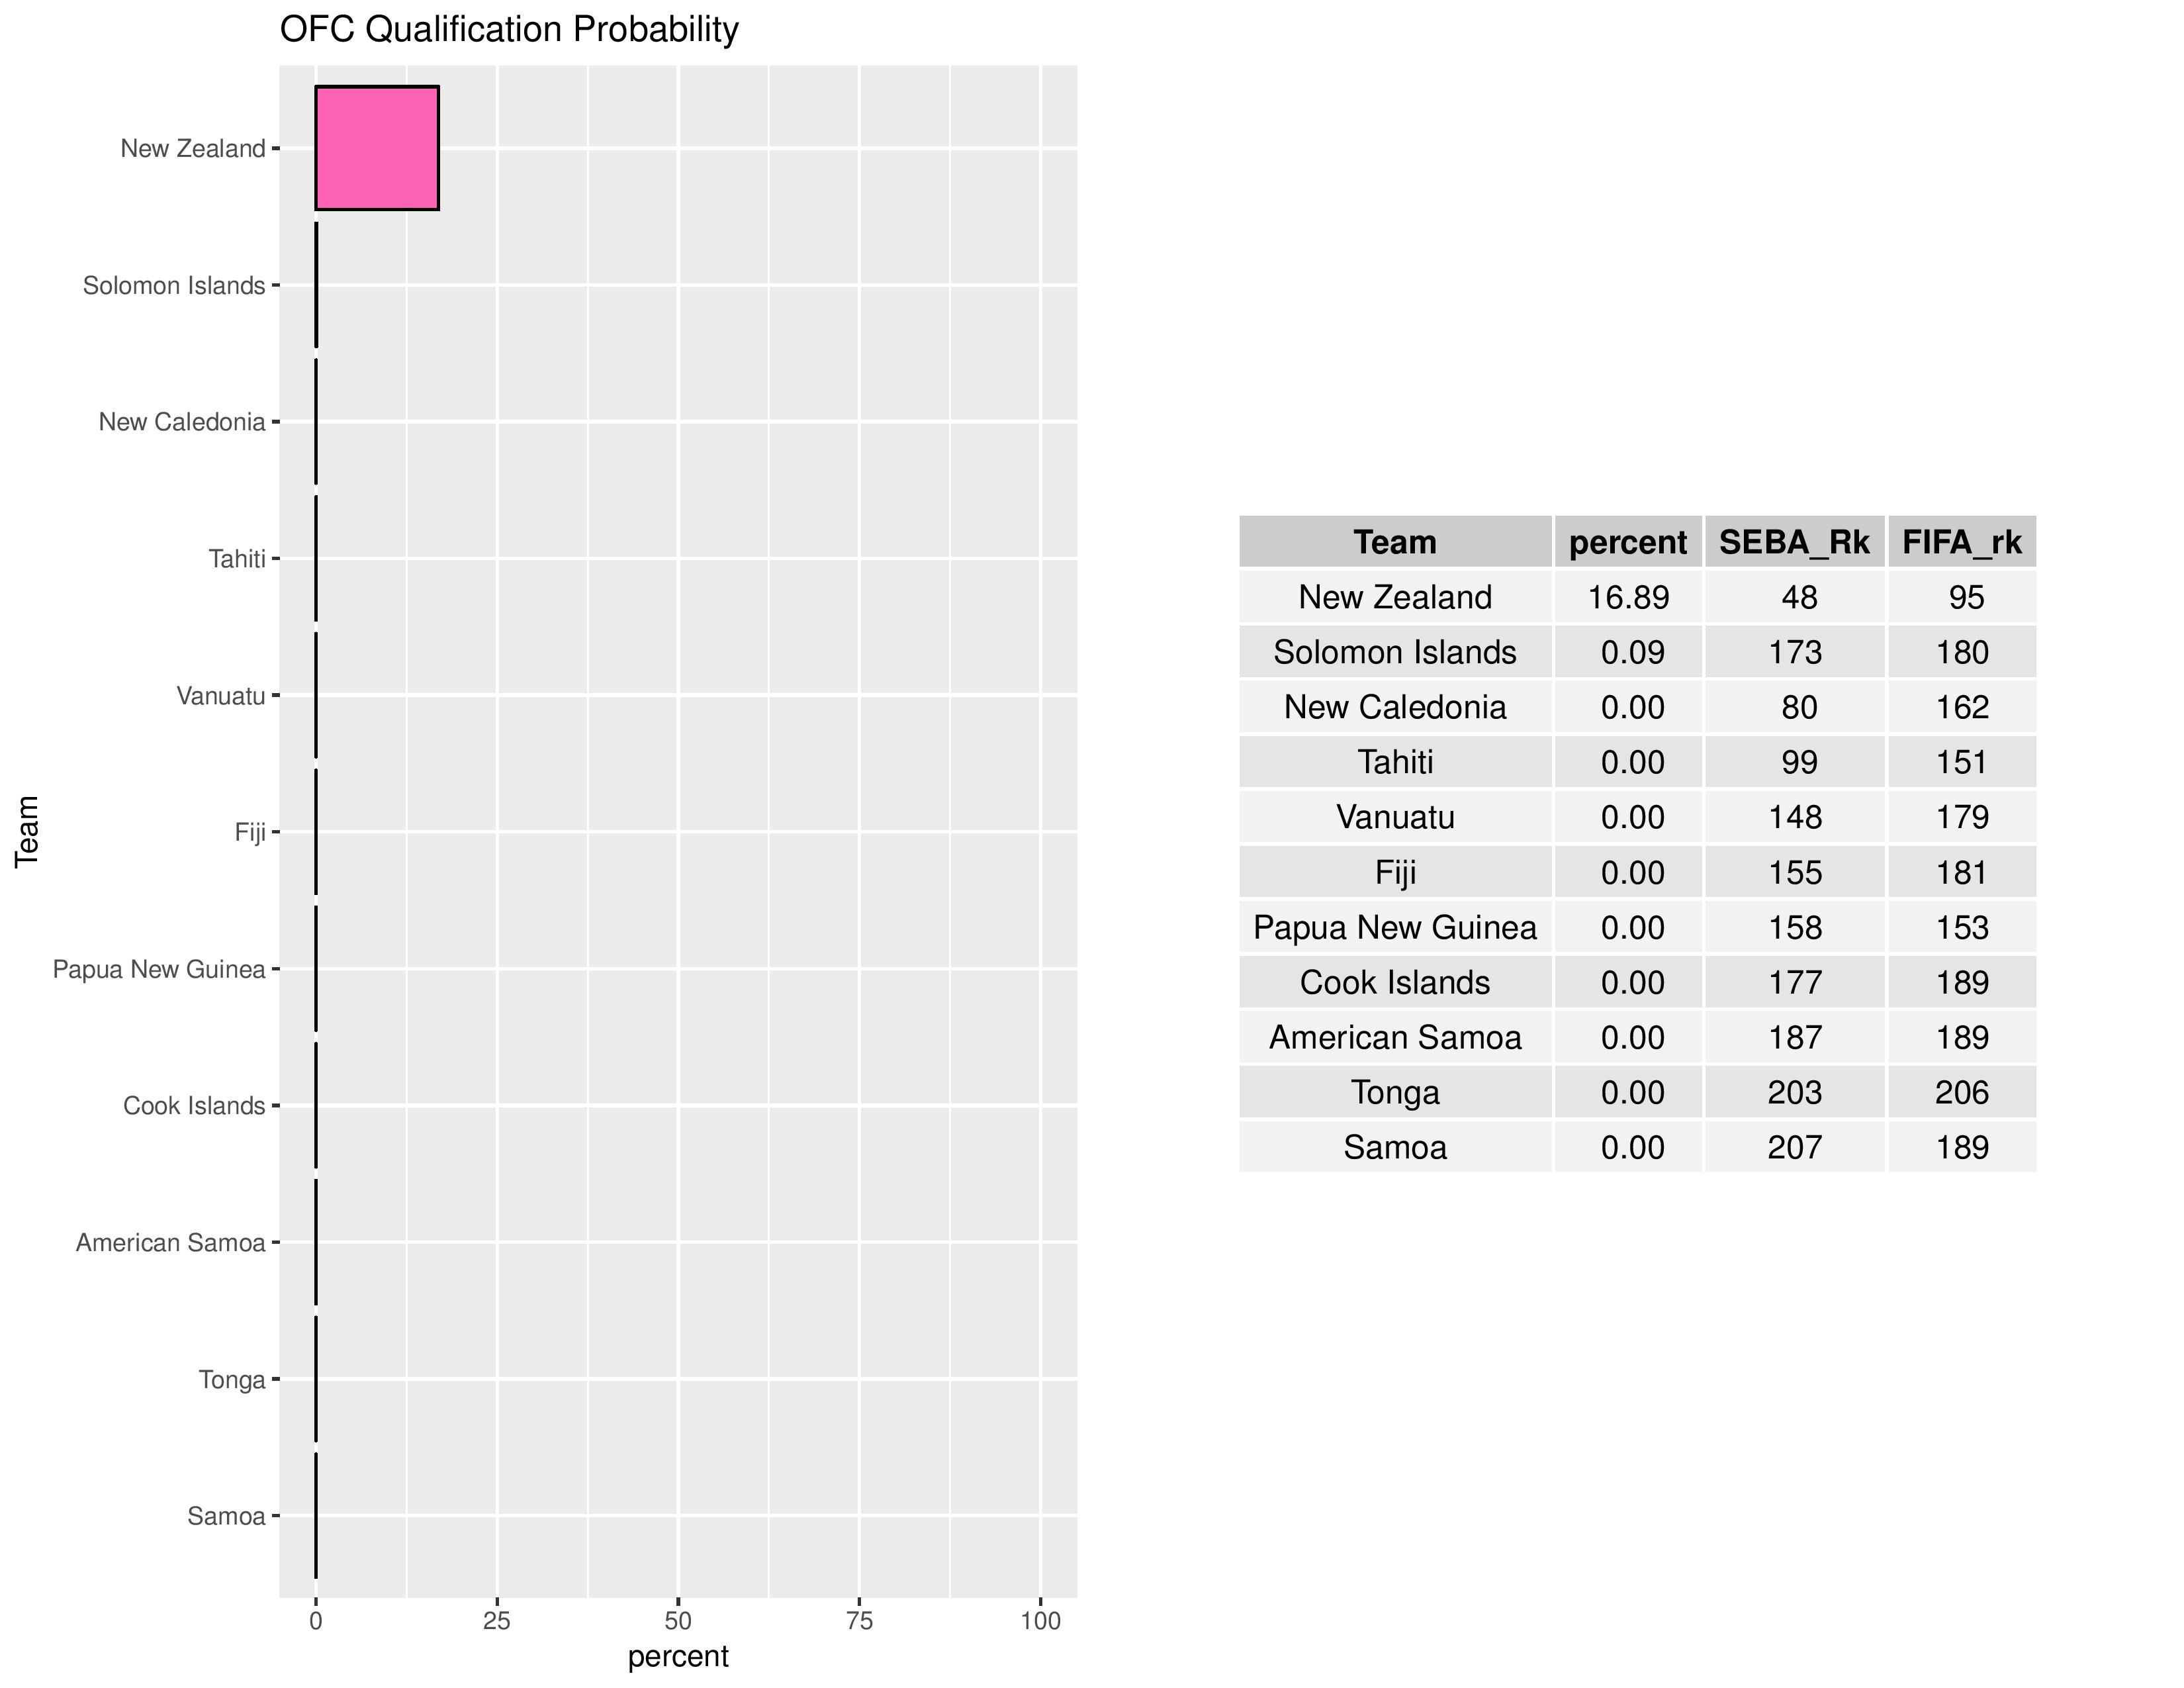
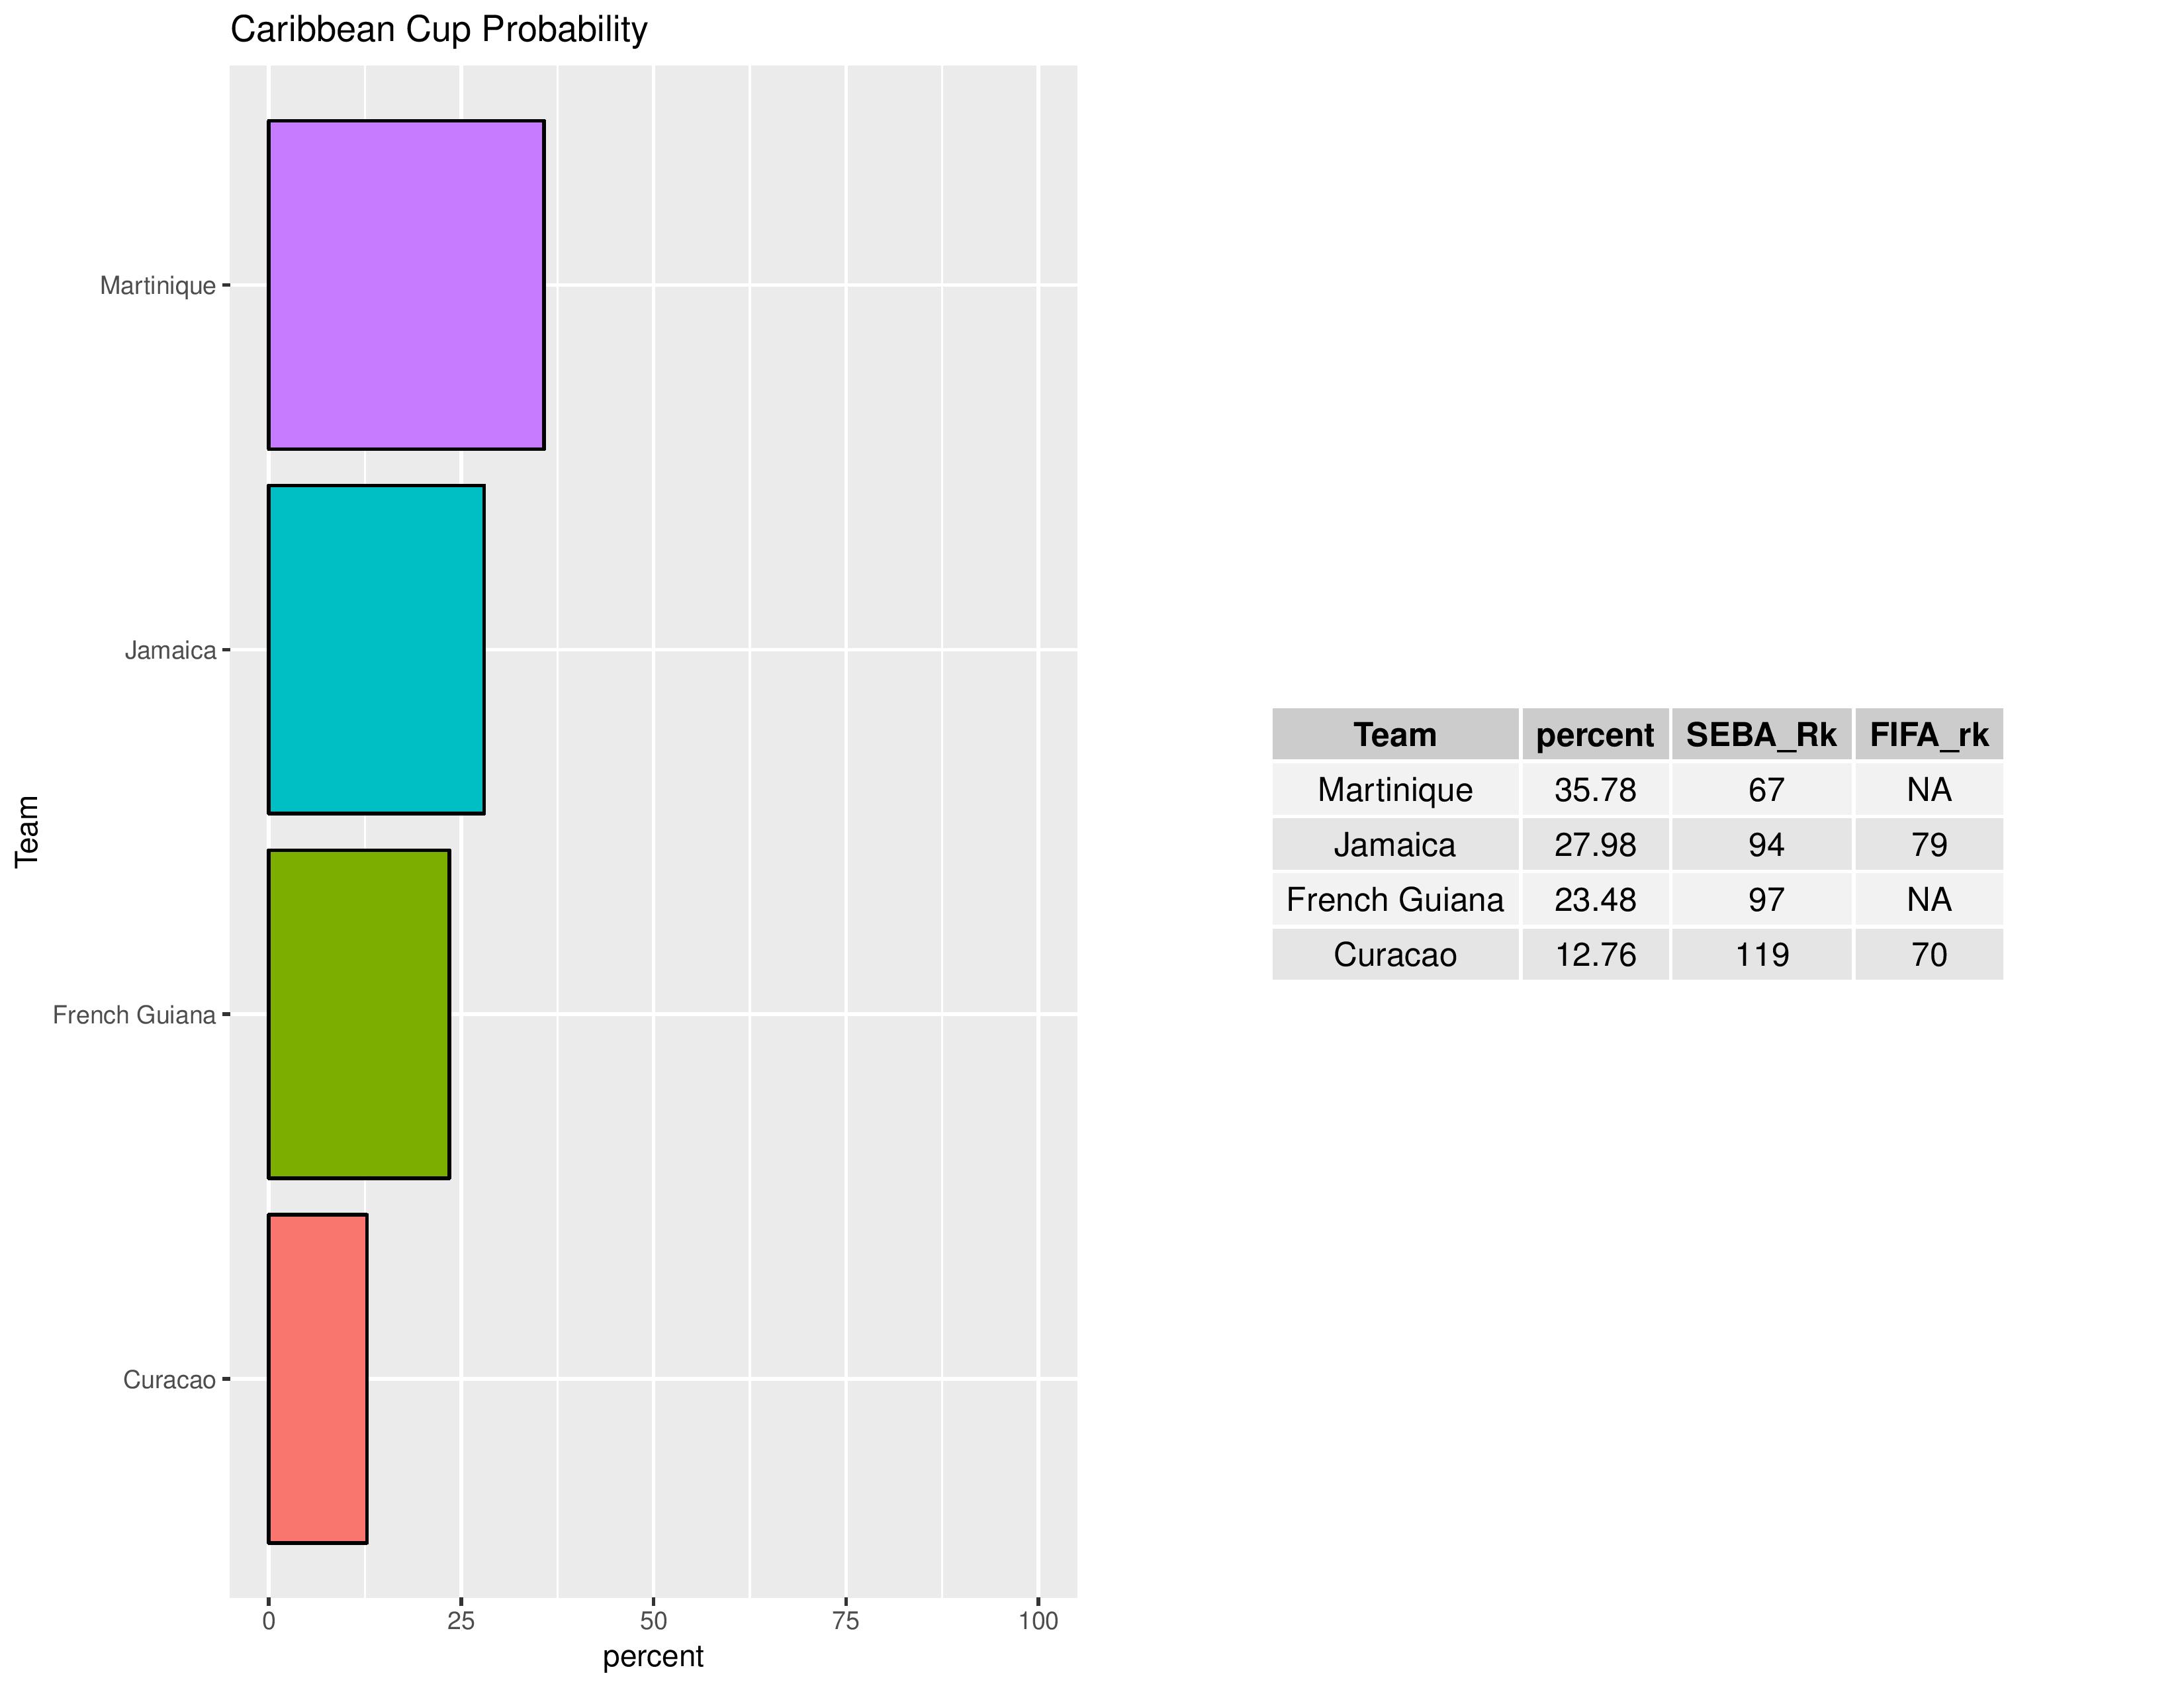
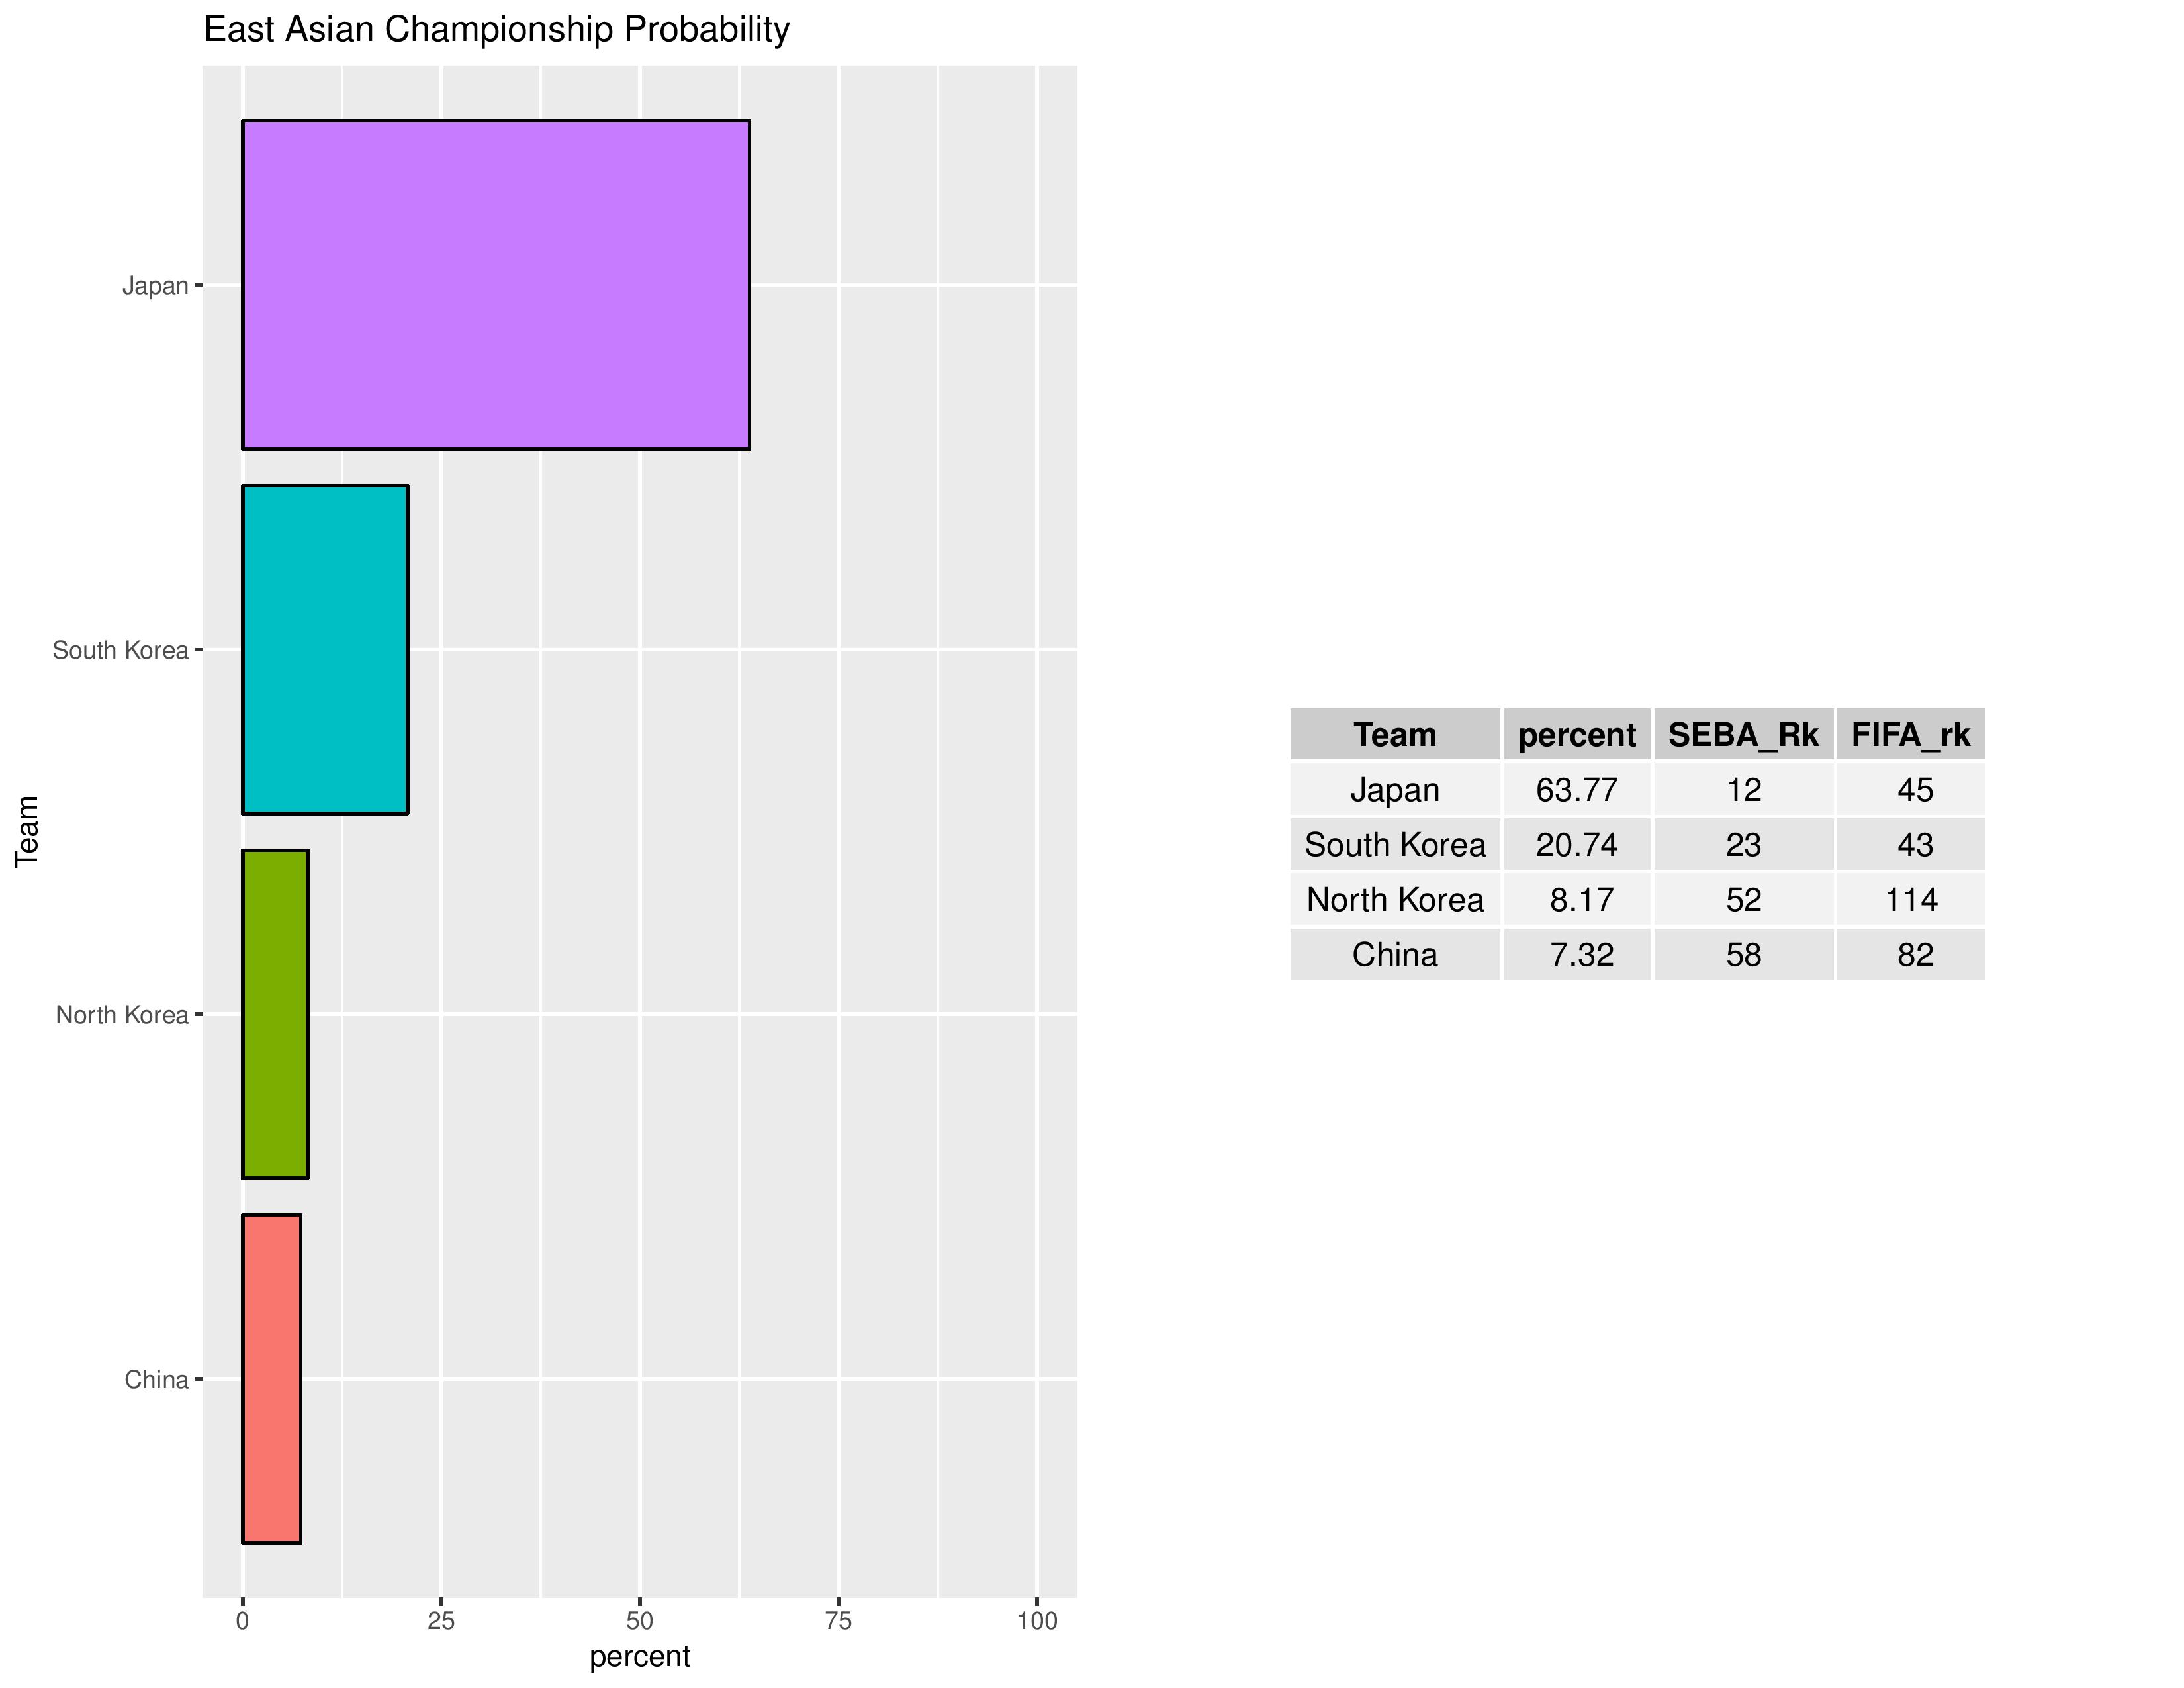
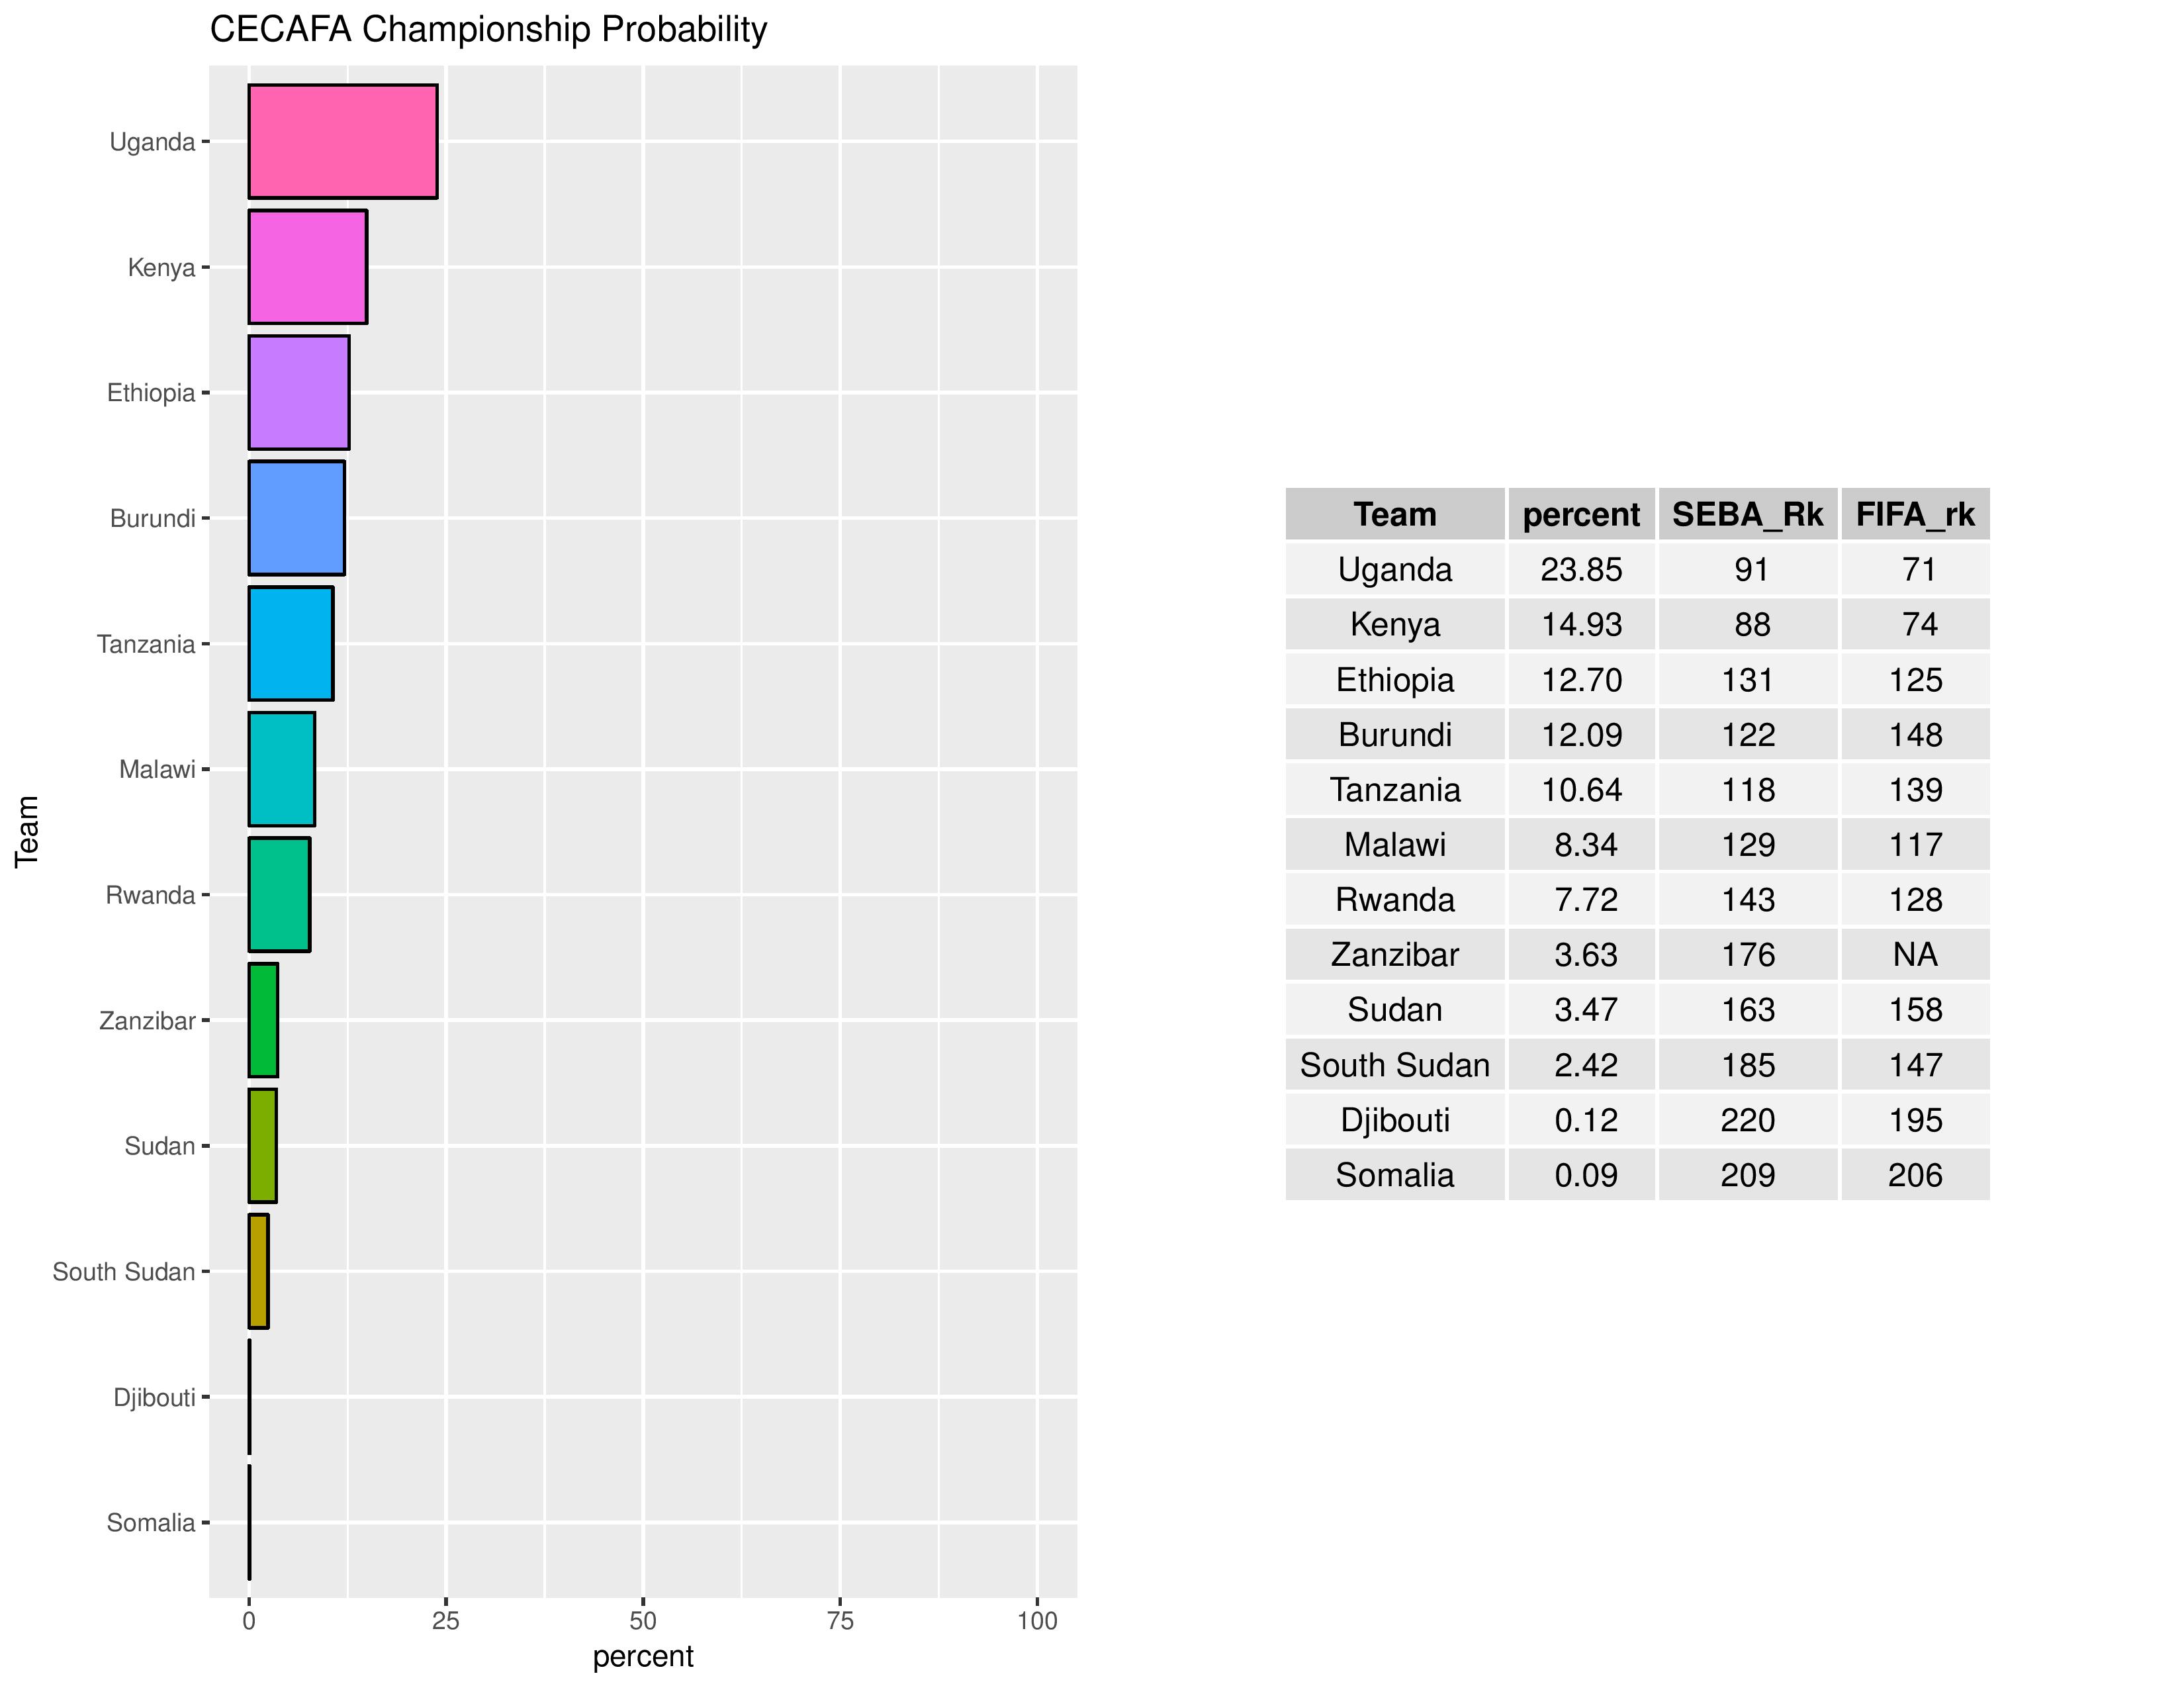
The next charts show the probabilities of other confederations qualifying for the World Cup.

World Cup 2018
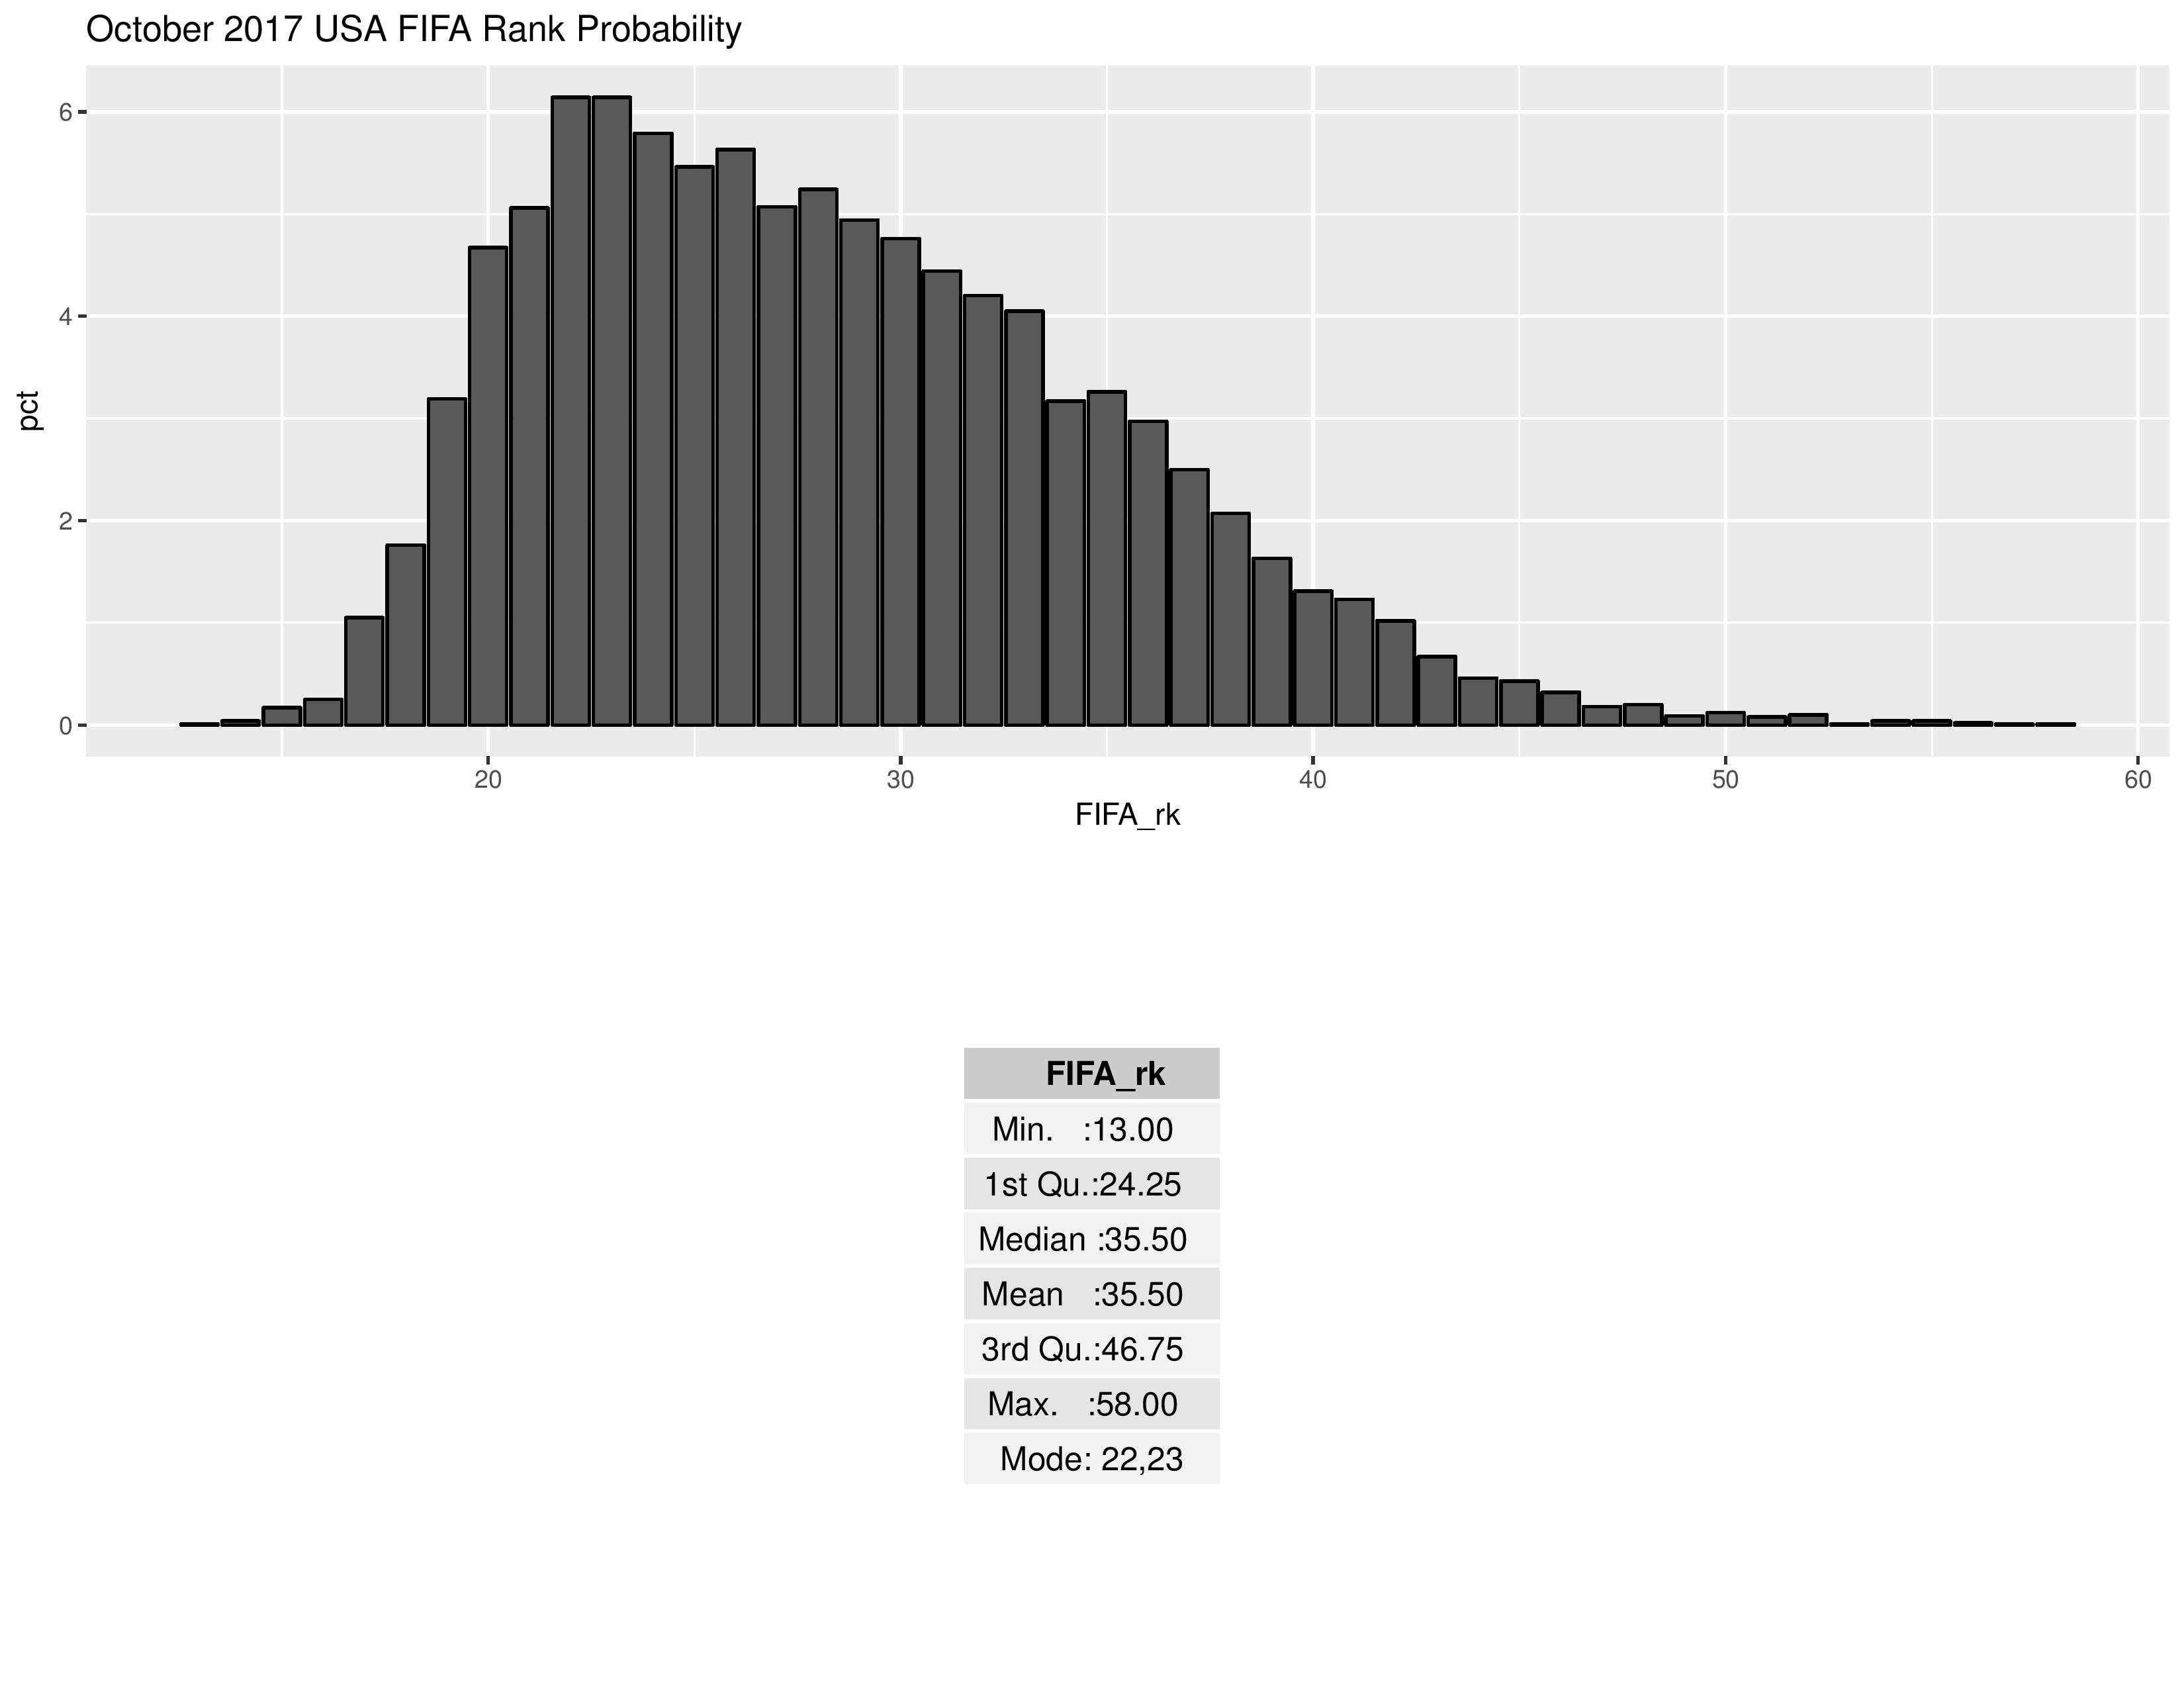
For the last World Cup, the October 2013 rankings were deemed ‘final’ before the World Cup draw, so I’m now assuming October 2017 are the ones to shoot for. I also don’t have the forecast system perfectly aligned with reality, although it is quite similar. I have not built in the different point outcomes for PK-wins/losses in my FIFA ranking projections, and I obviously do not have a mechanism for forecasting currently-unscheduled friendlies. However, I have forecasted every scheduled tournament between now and October.
Below shows the simulated ranks for the USA. Summary statistics are below the chart. USA’s most common forecasted ranks are 22 & 23, but could go as low as 13 and as high as 58. USA’s current rank is 23.
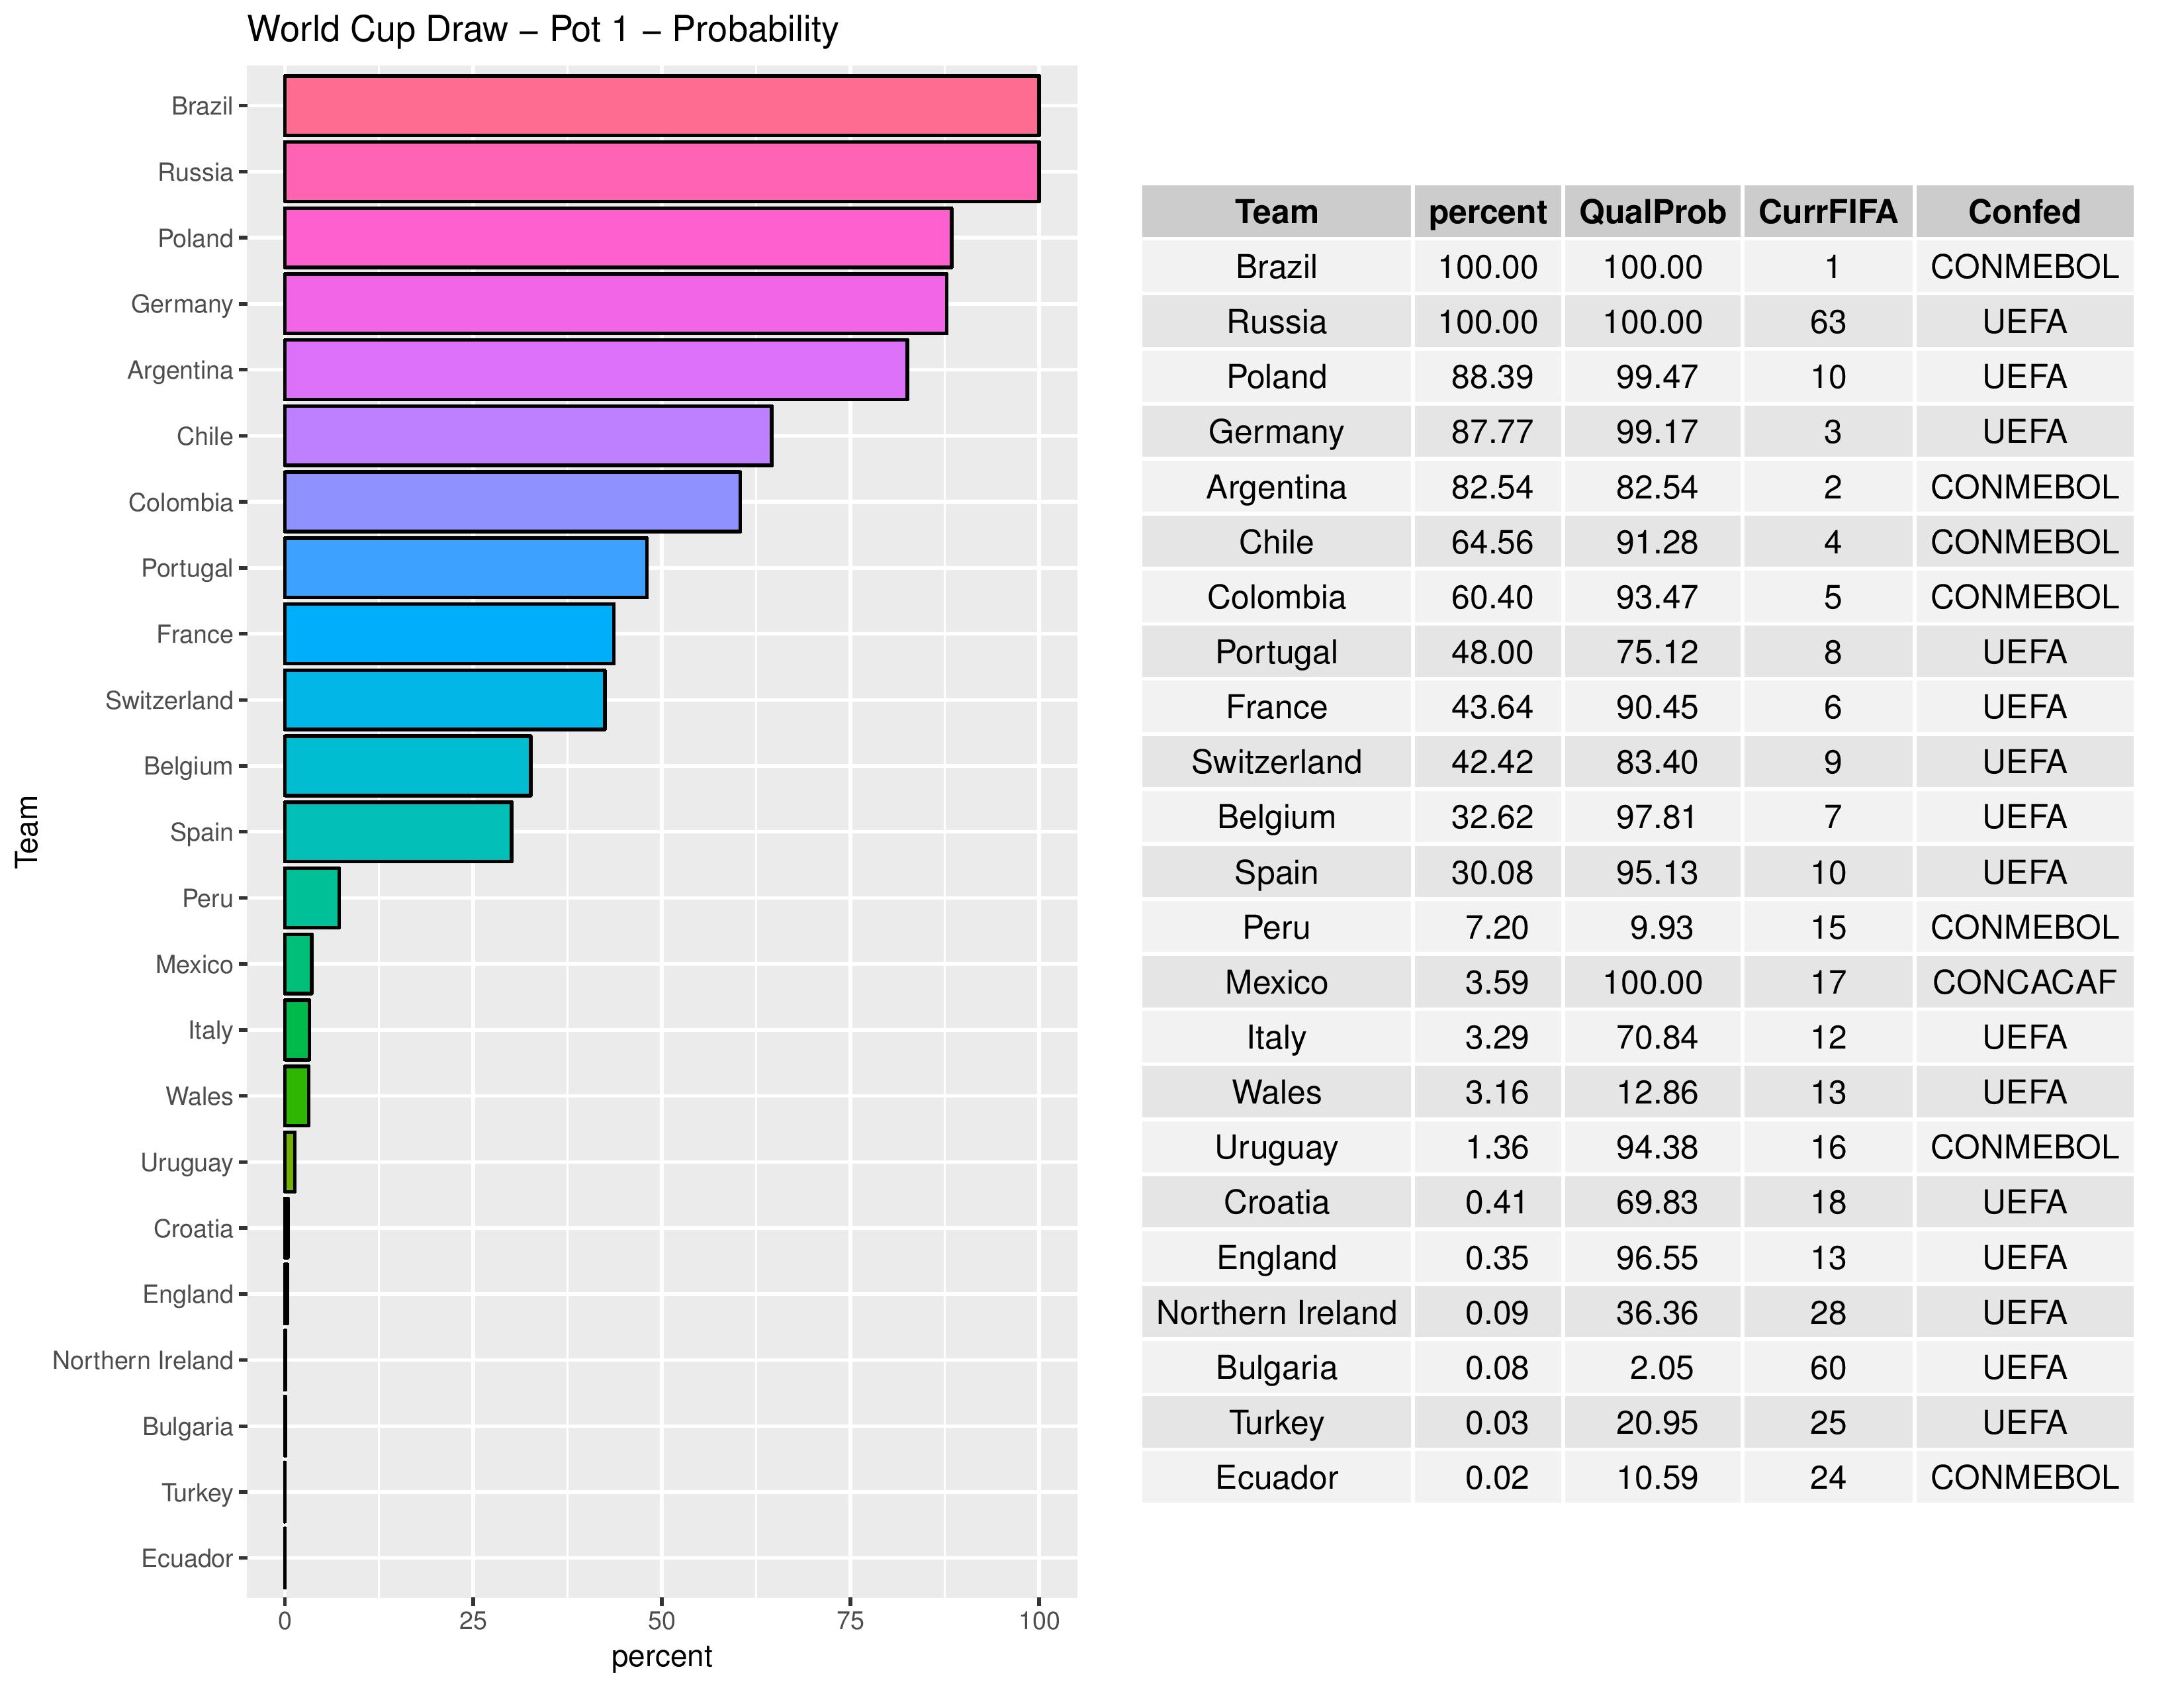
Below is the probability of obtaining Pot 1 status. In the table, we also include the team’s qualification probability (if they don’t qualify, they can’t be in Pot 1), their current FIFA rank, and their confederation for helpful information.
USA did not not make Pot 1 in any of the 10,000 simulations. A lot of this is due to not having enough opportunities to ascend further in FIFA rankings. Mexico has a better chance in part due to currently being ranked higher, but also due to their qualification for the Confederations Cup, which gives a large importance multiplier in addition to top-ranking competition.
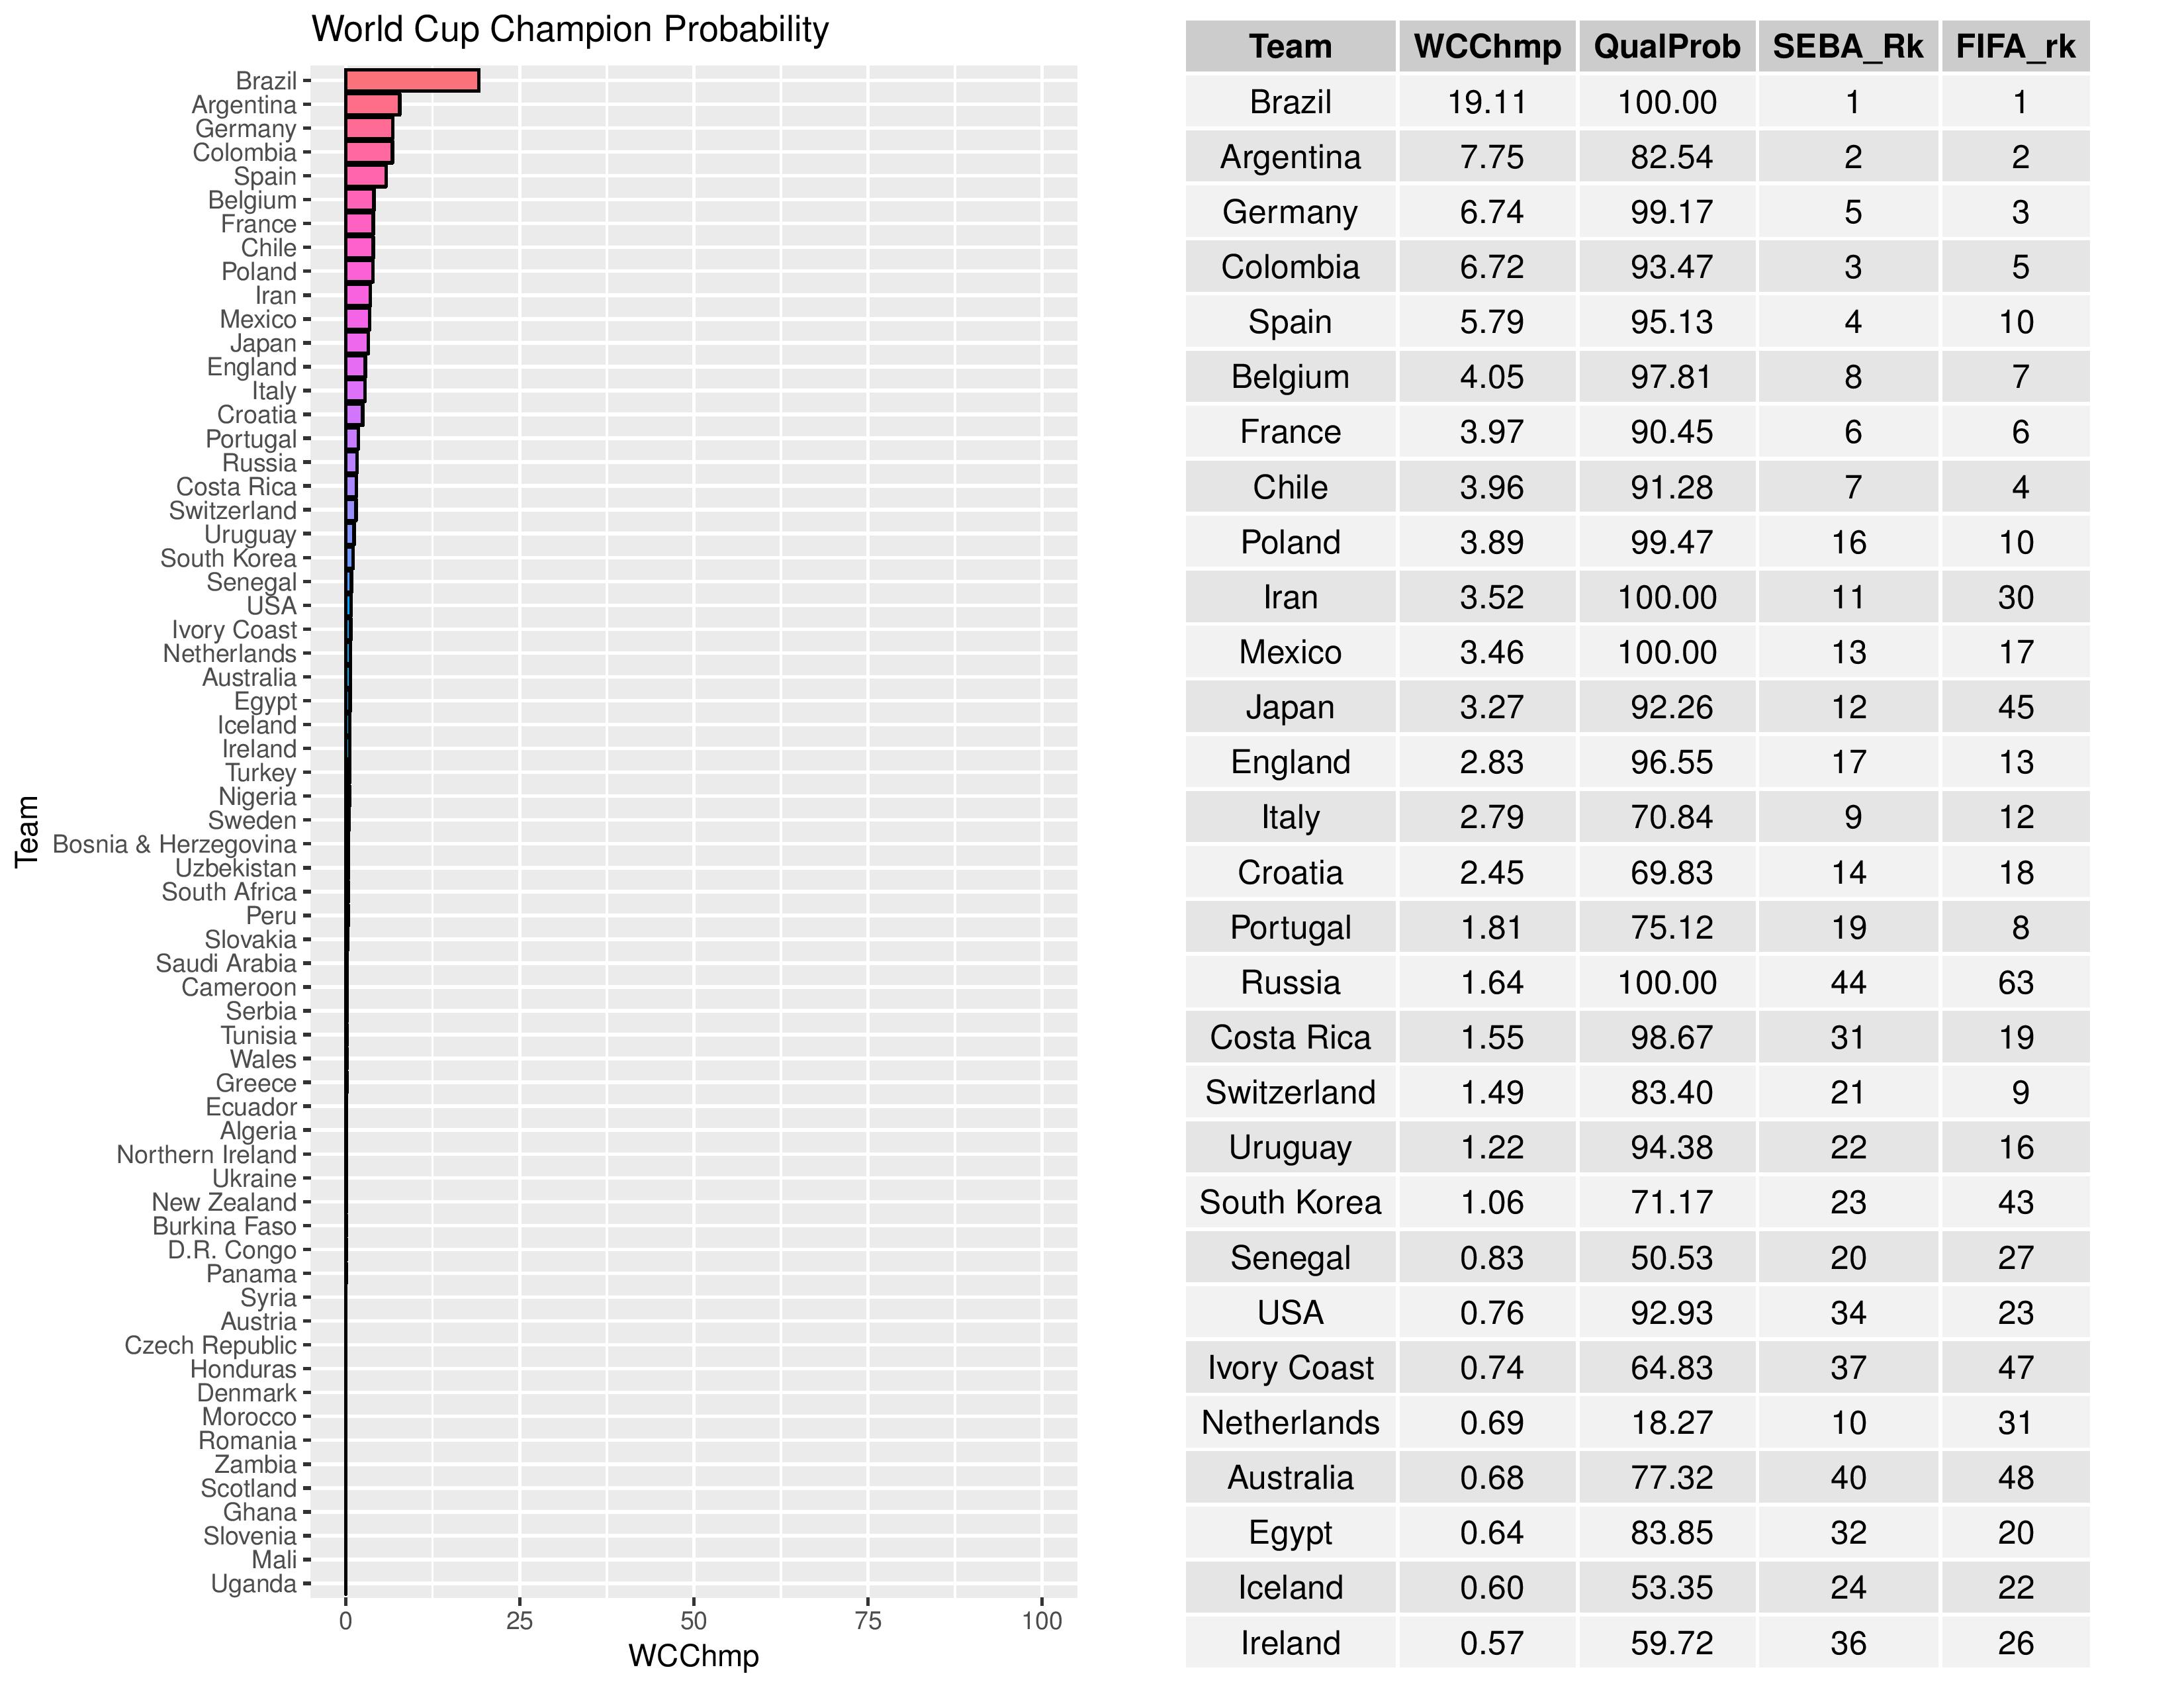
The following then manages to forecast the 2018 World Cup. Again, we accompany the odds of victory with qualification probability to help understand why some teams may be lower than expected. The USMNT have a 0.76% chance of winning the World Cup.
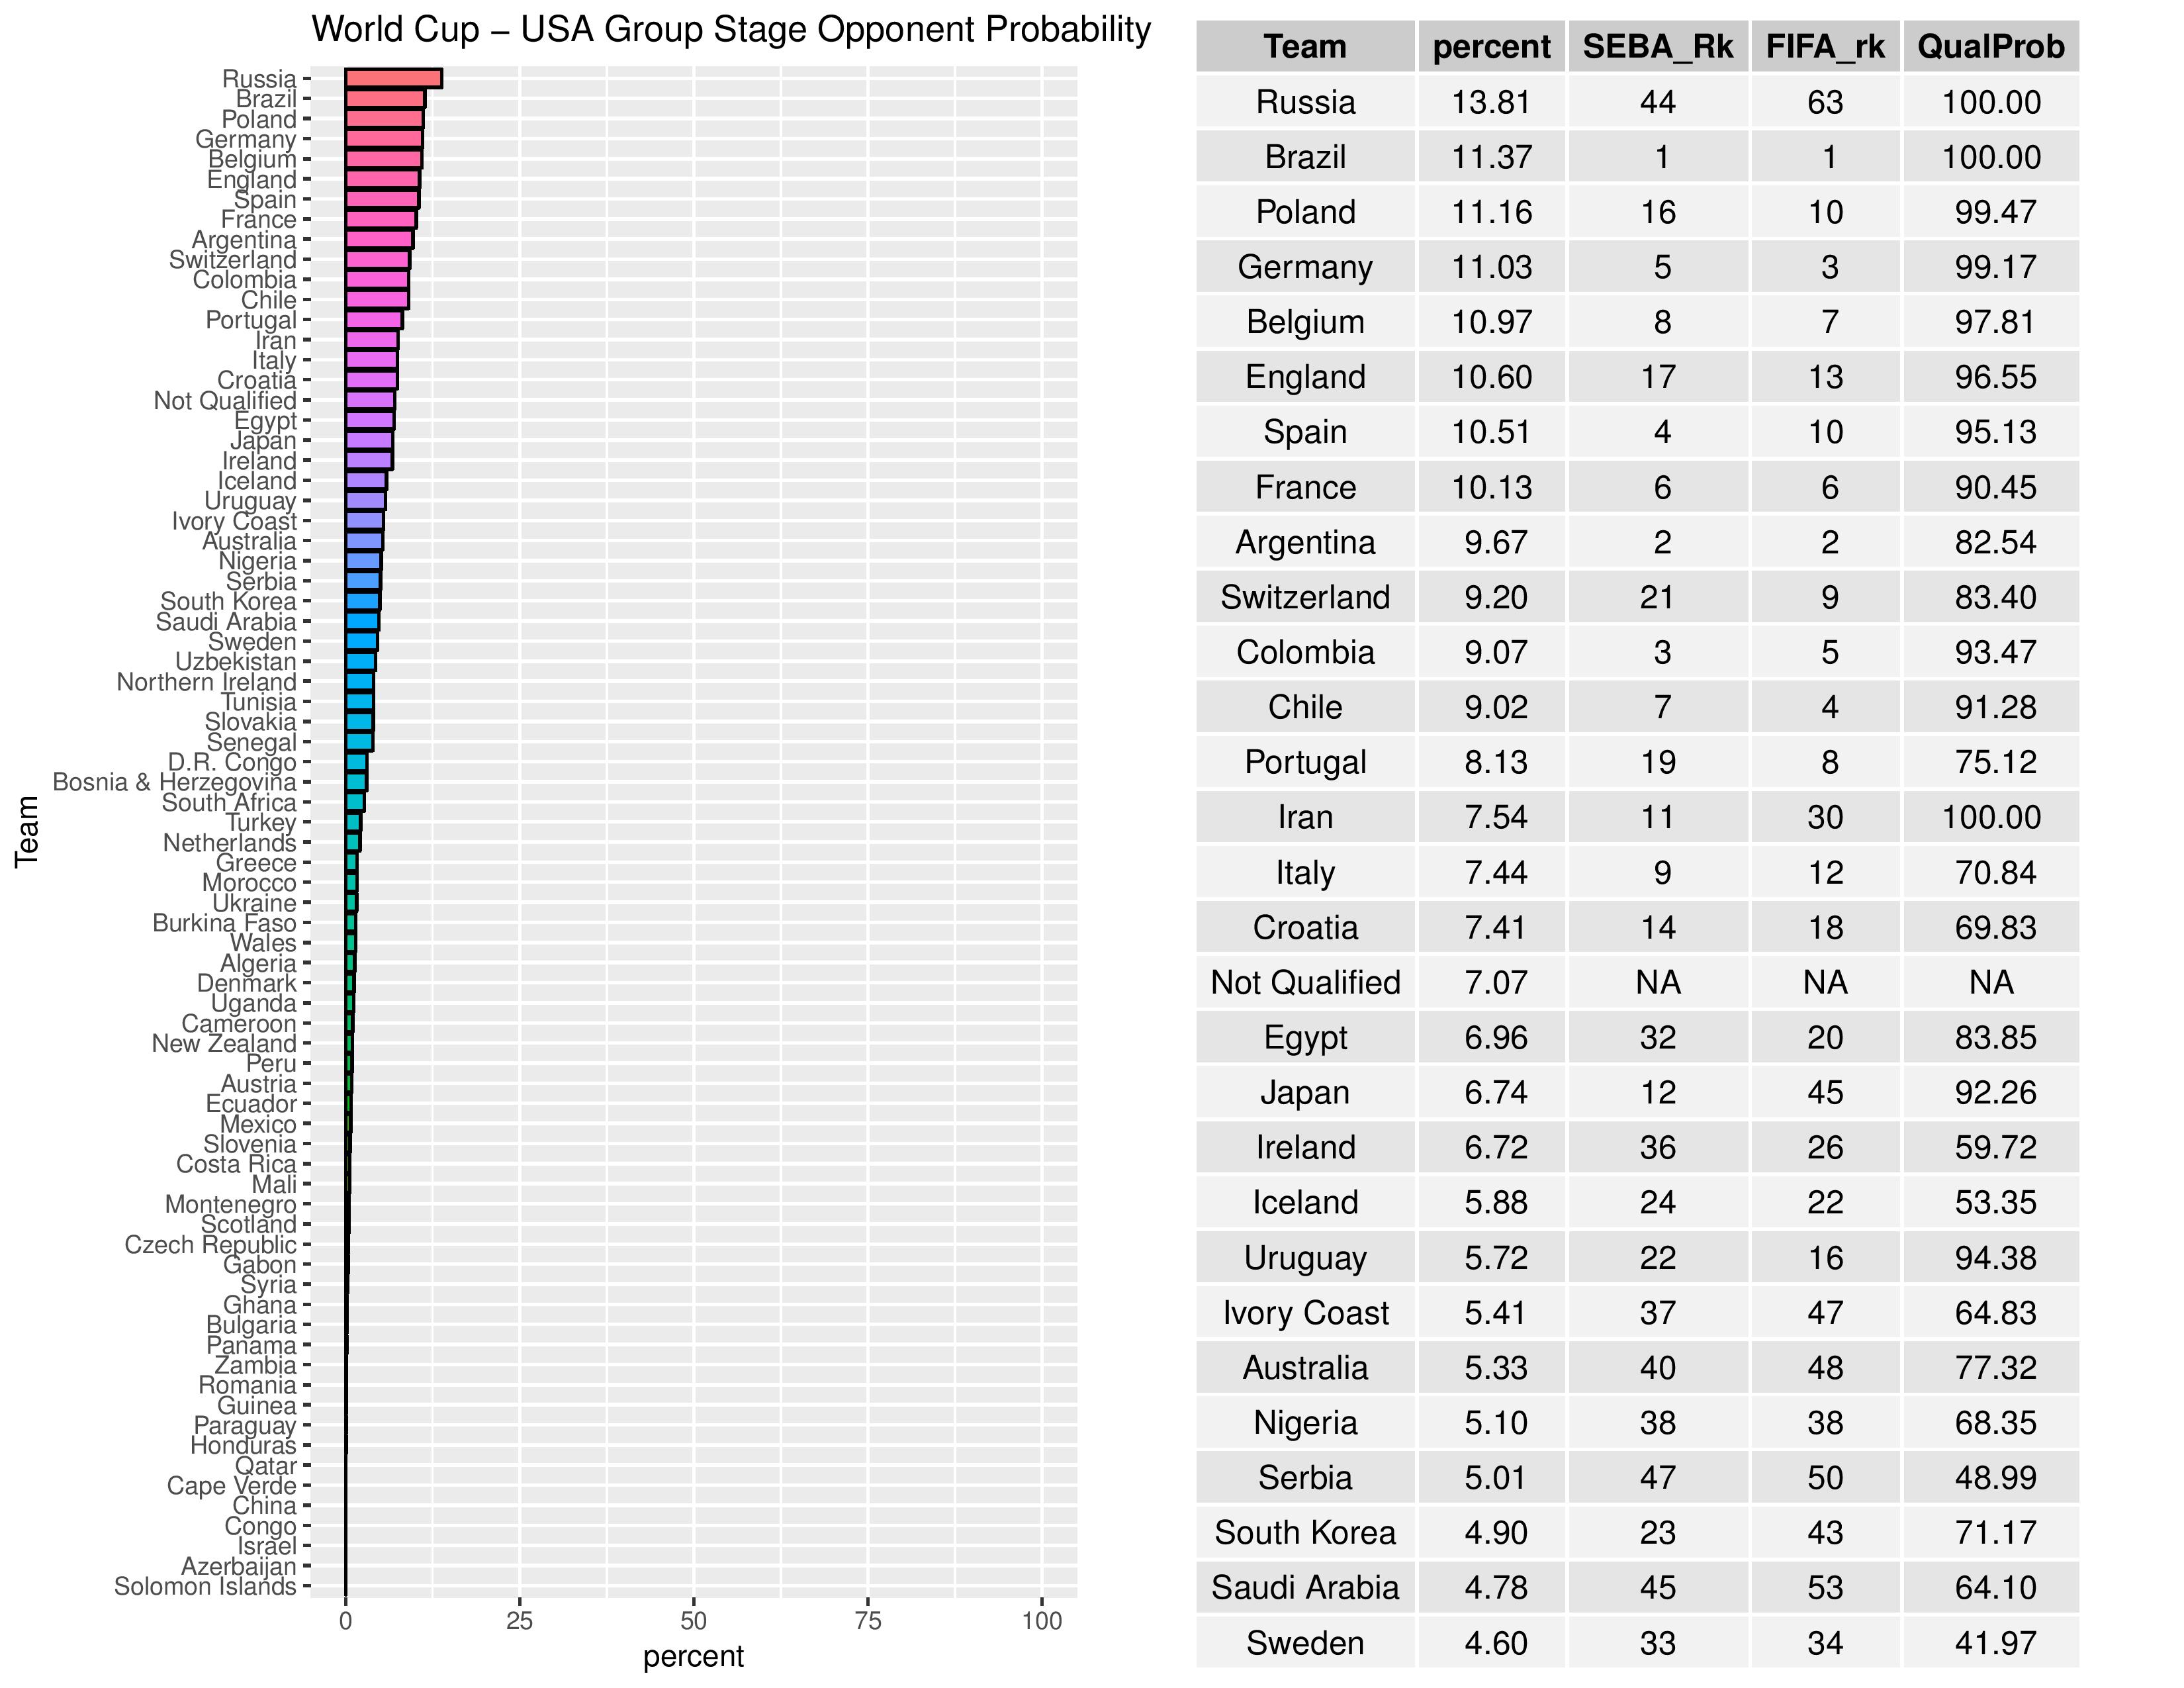
The following shows the USA’s most probable group stage Opponents.
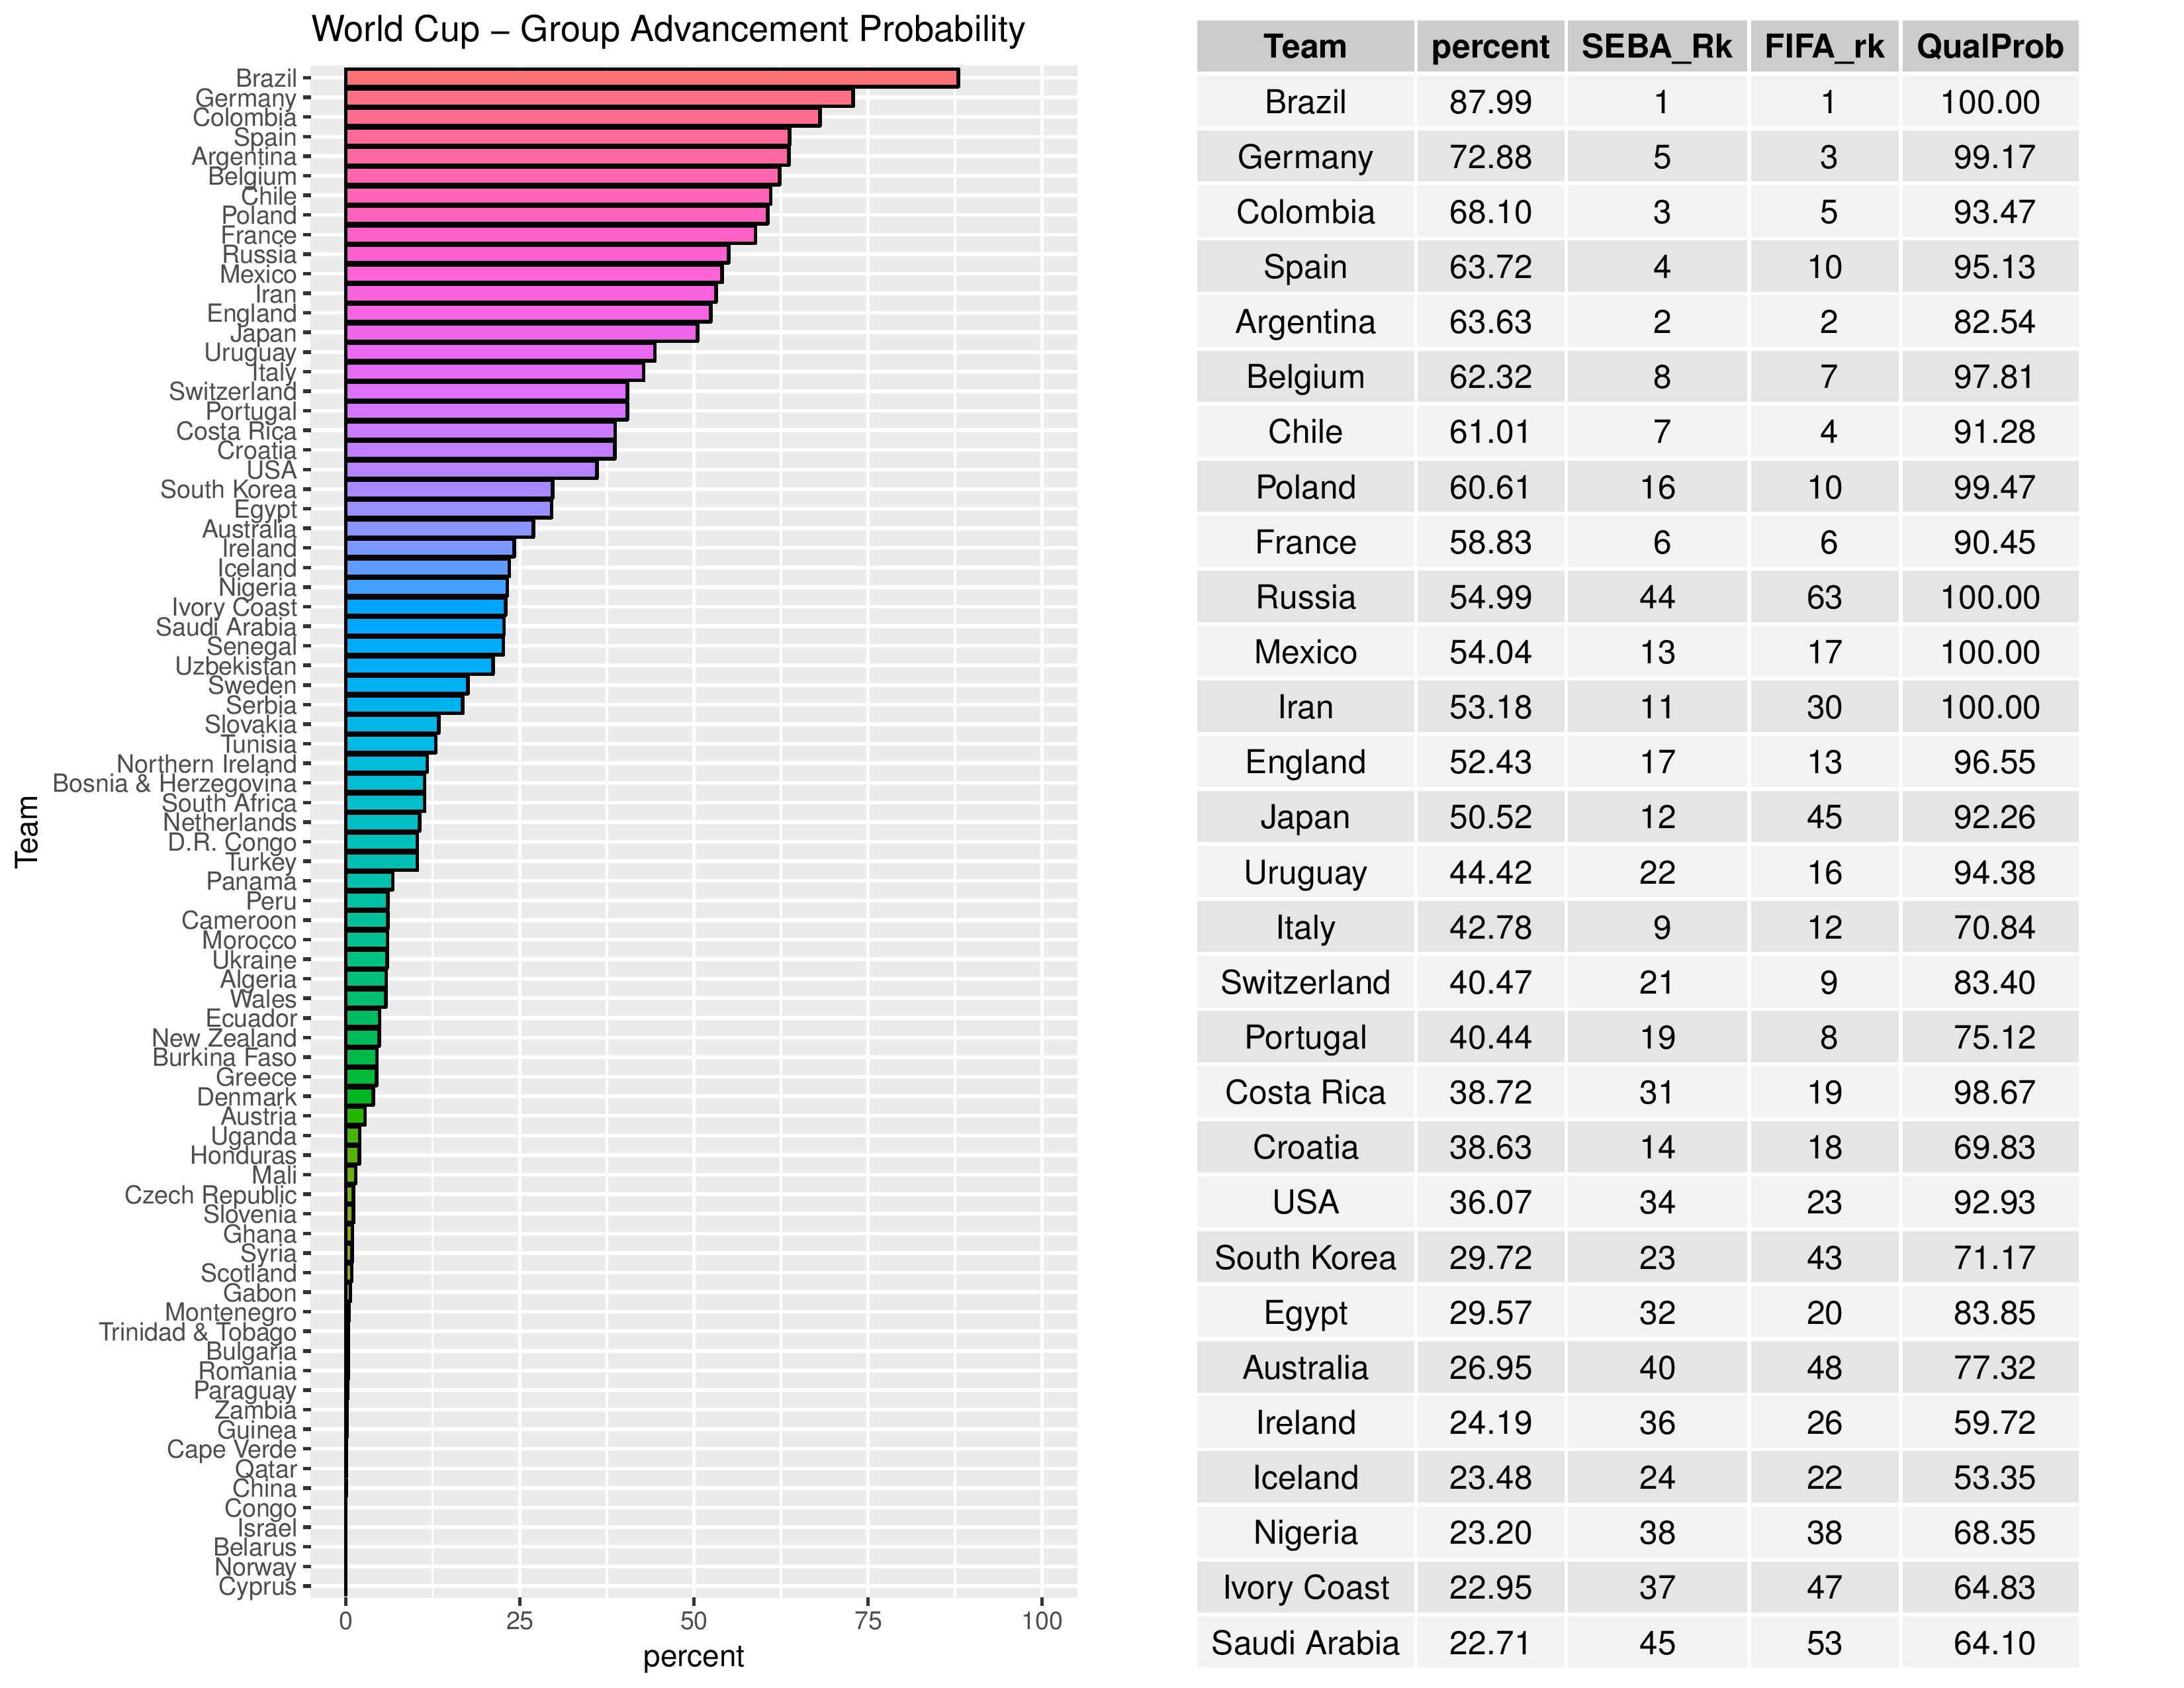
The following shows the various odds of each national team progressing out of the Group Stage. USA has increased from 32.42% to 36.07% of making it through the group stage of the World Cup.
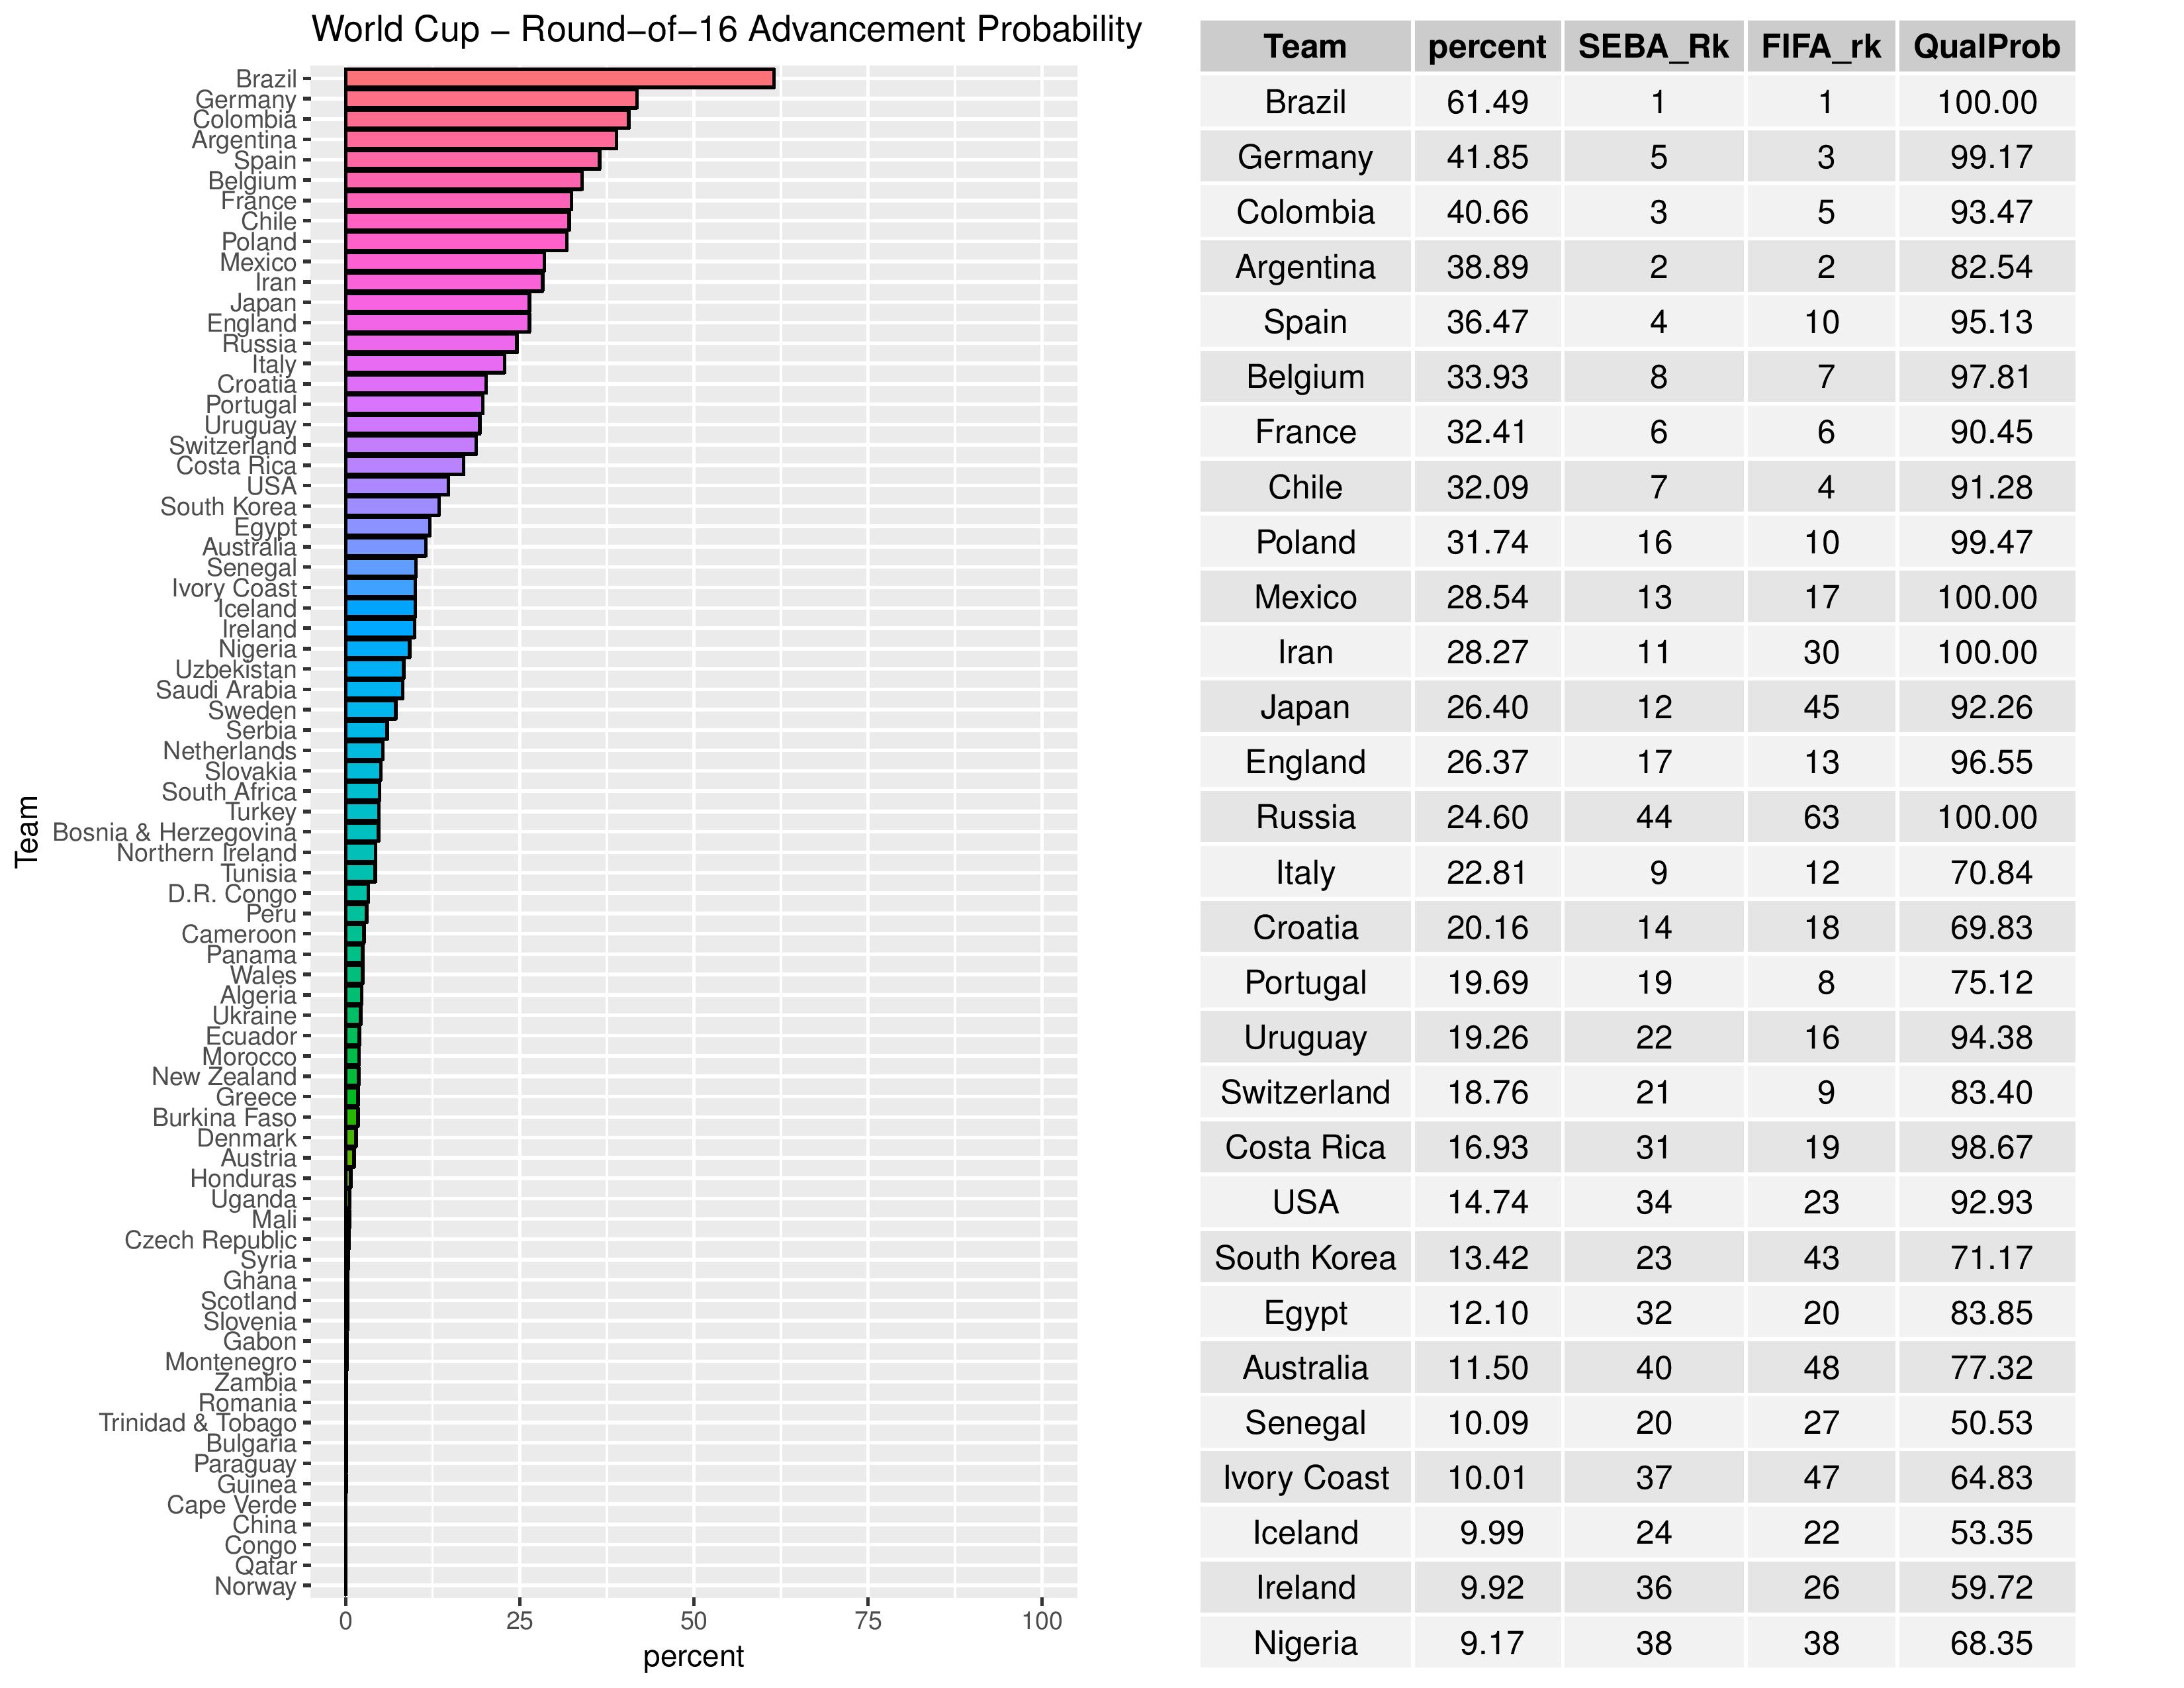
The following shows the probabilities of teams advancing through the Round of 16. The USA has increased from 13.54% to 14.74% in their chances of making it through the Round of 16.
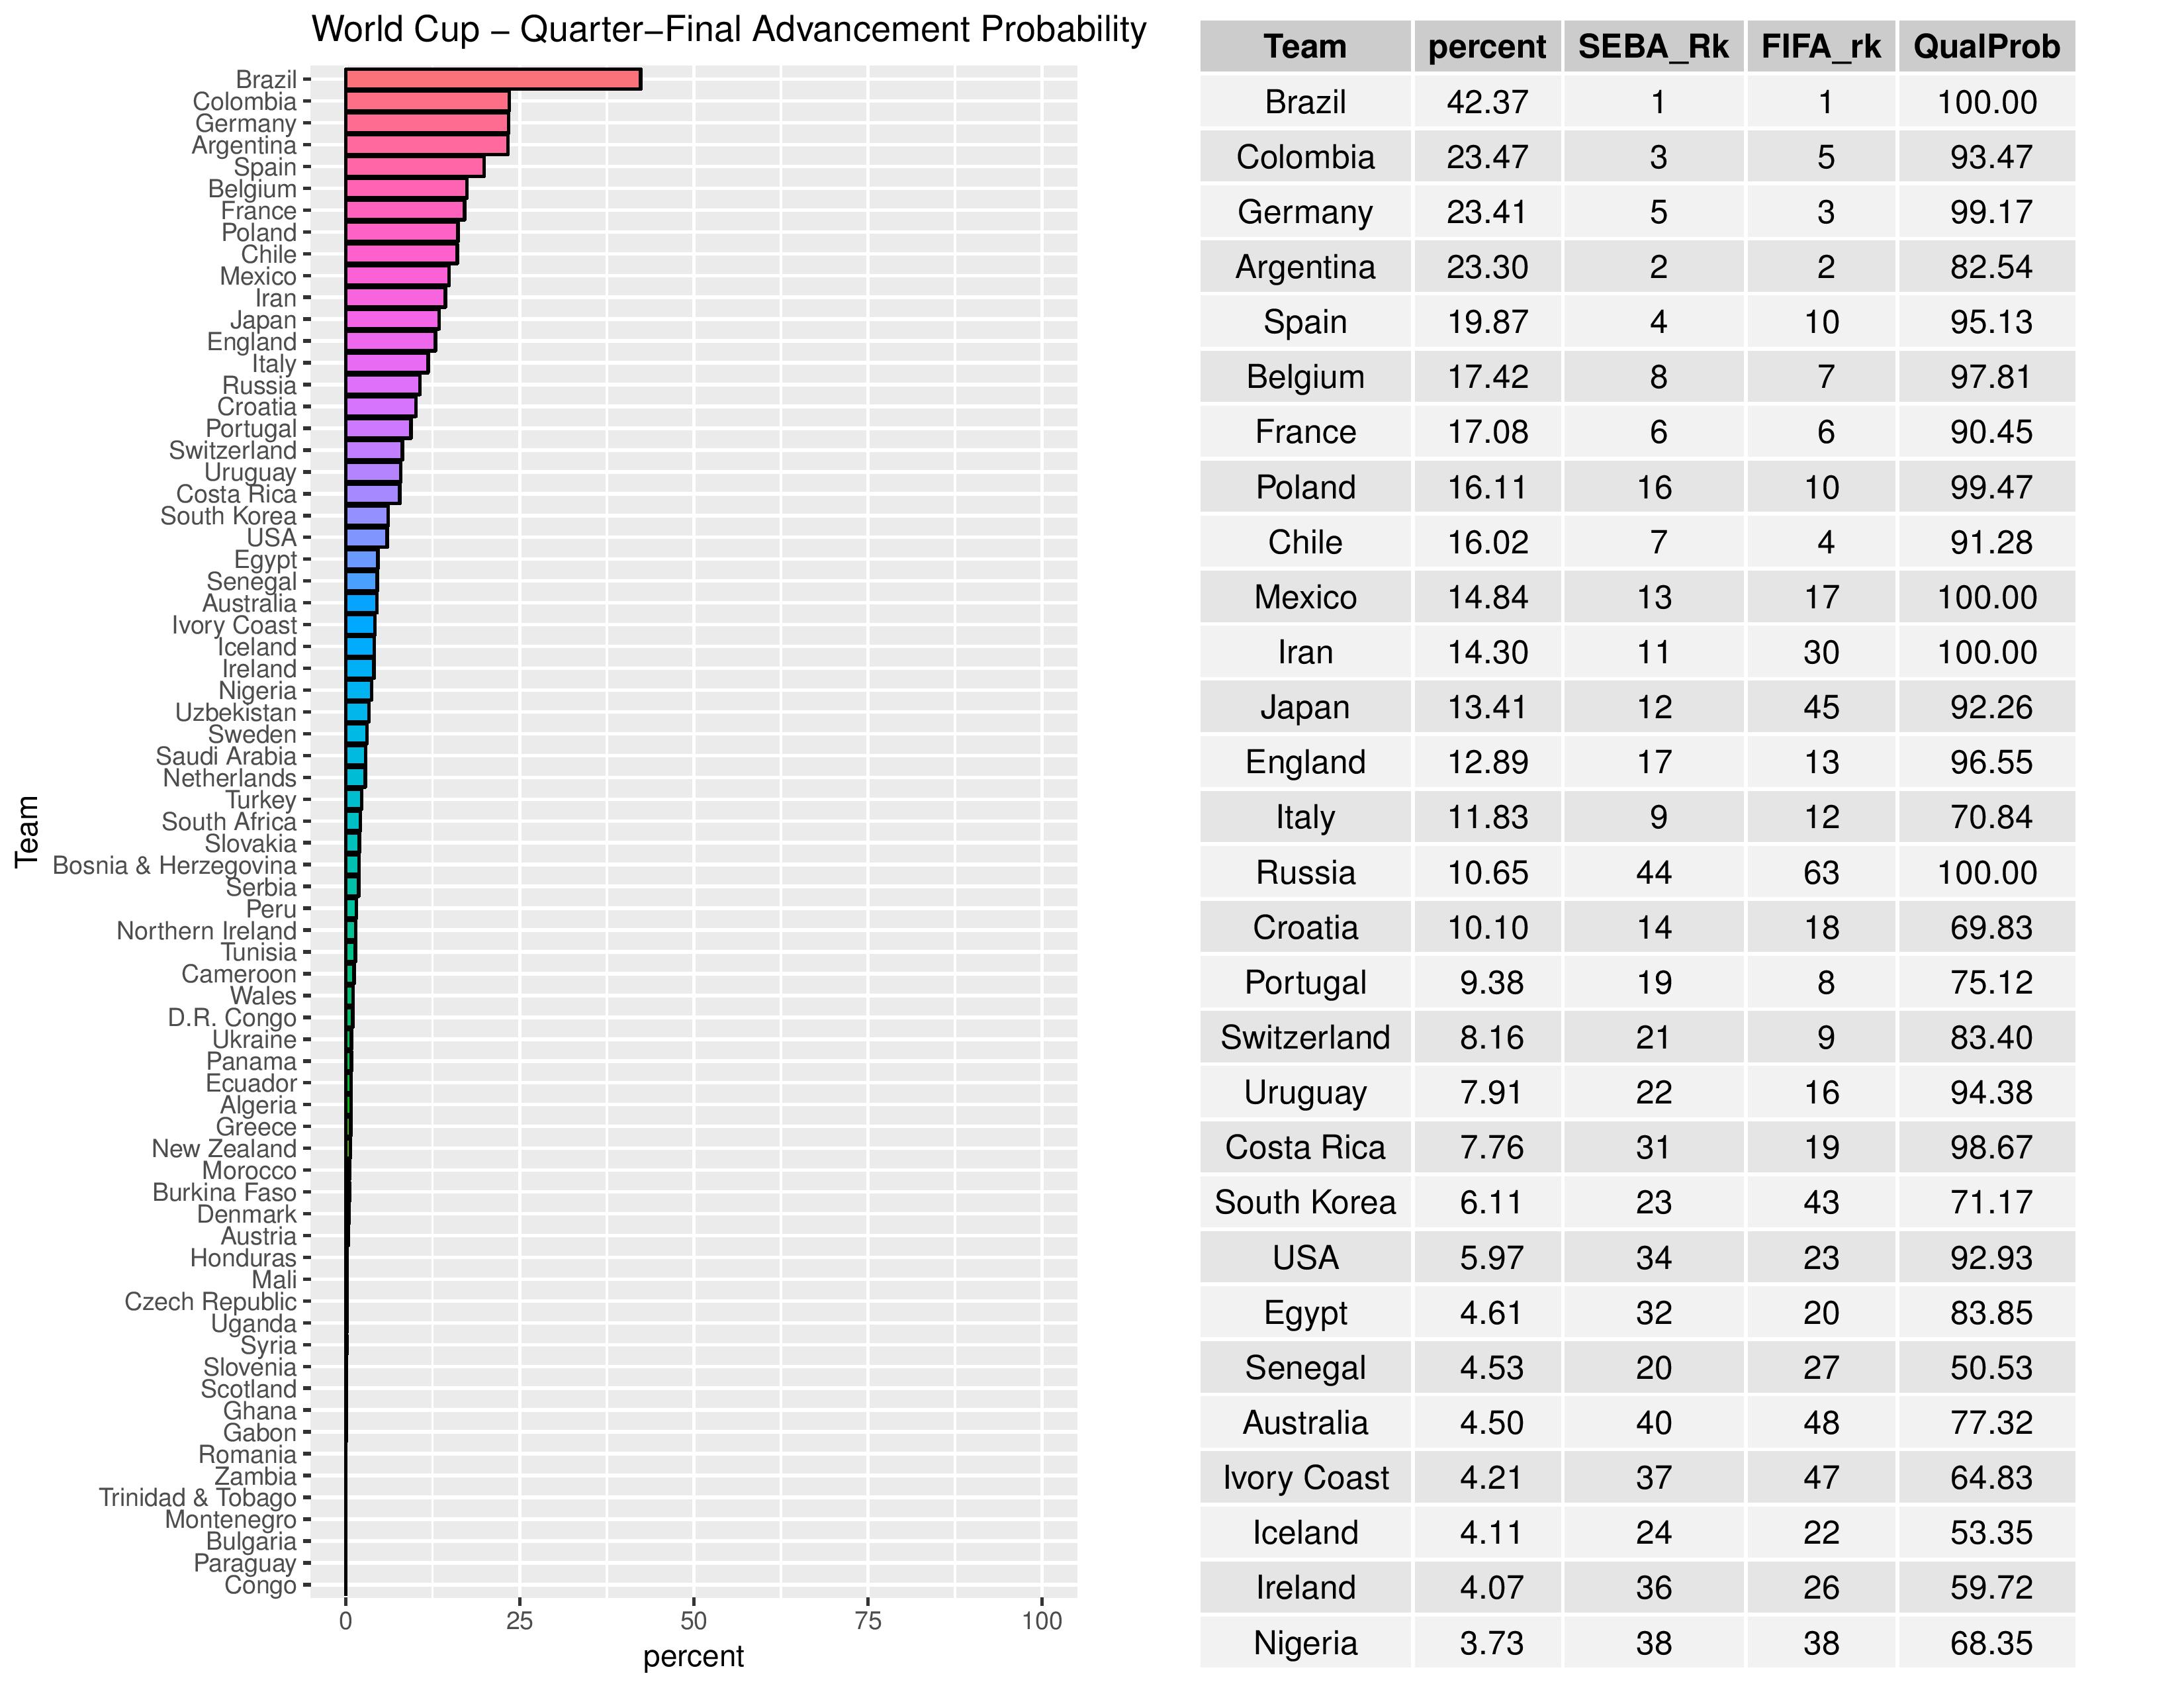
The following shows the probabilities of teams advancing through the quarterfinal. USA has increased chances from 5.24% to 5.97% of making it through the quarterfinal.
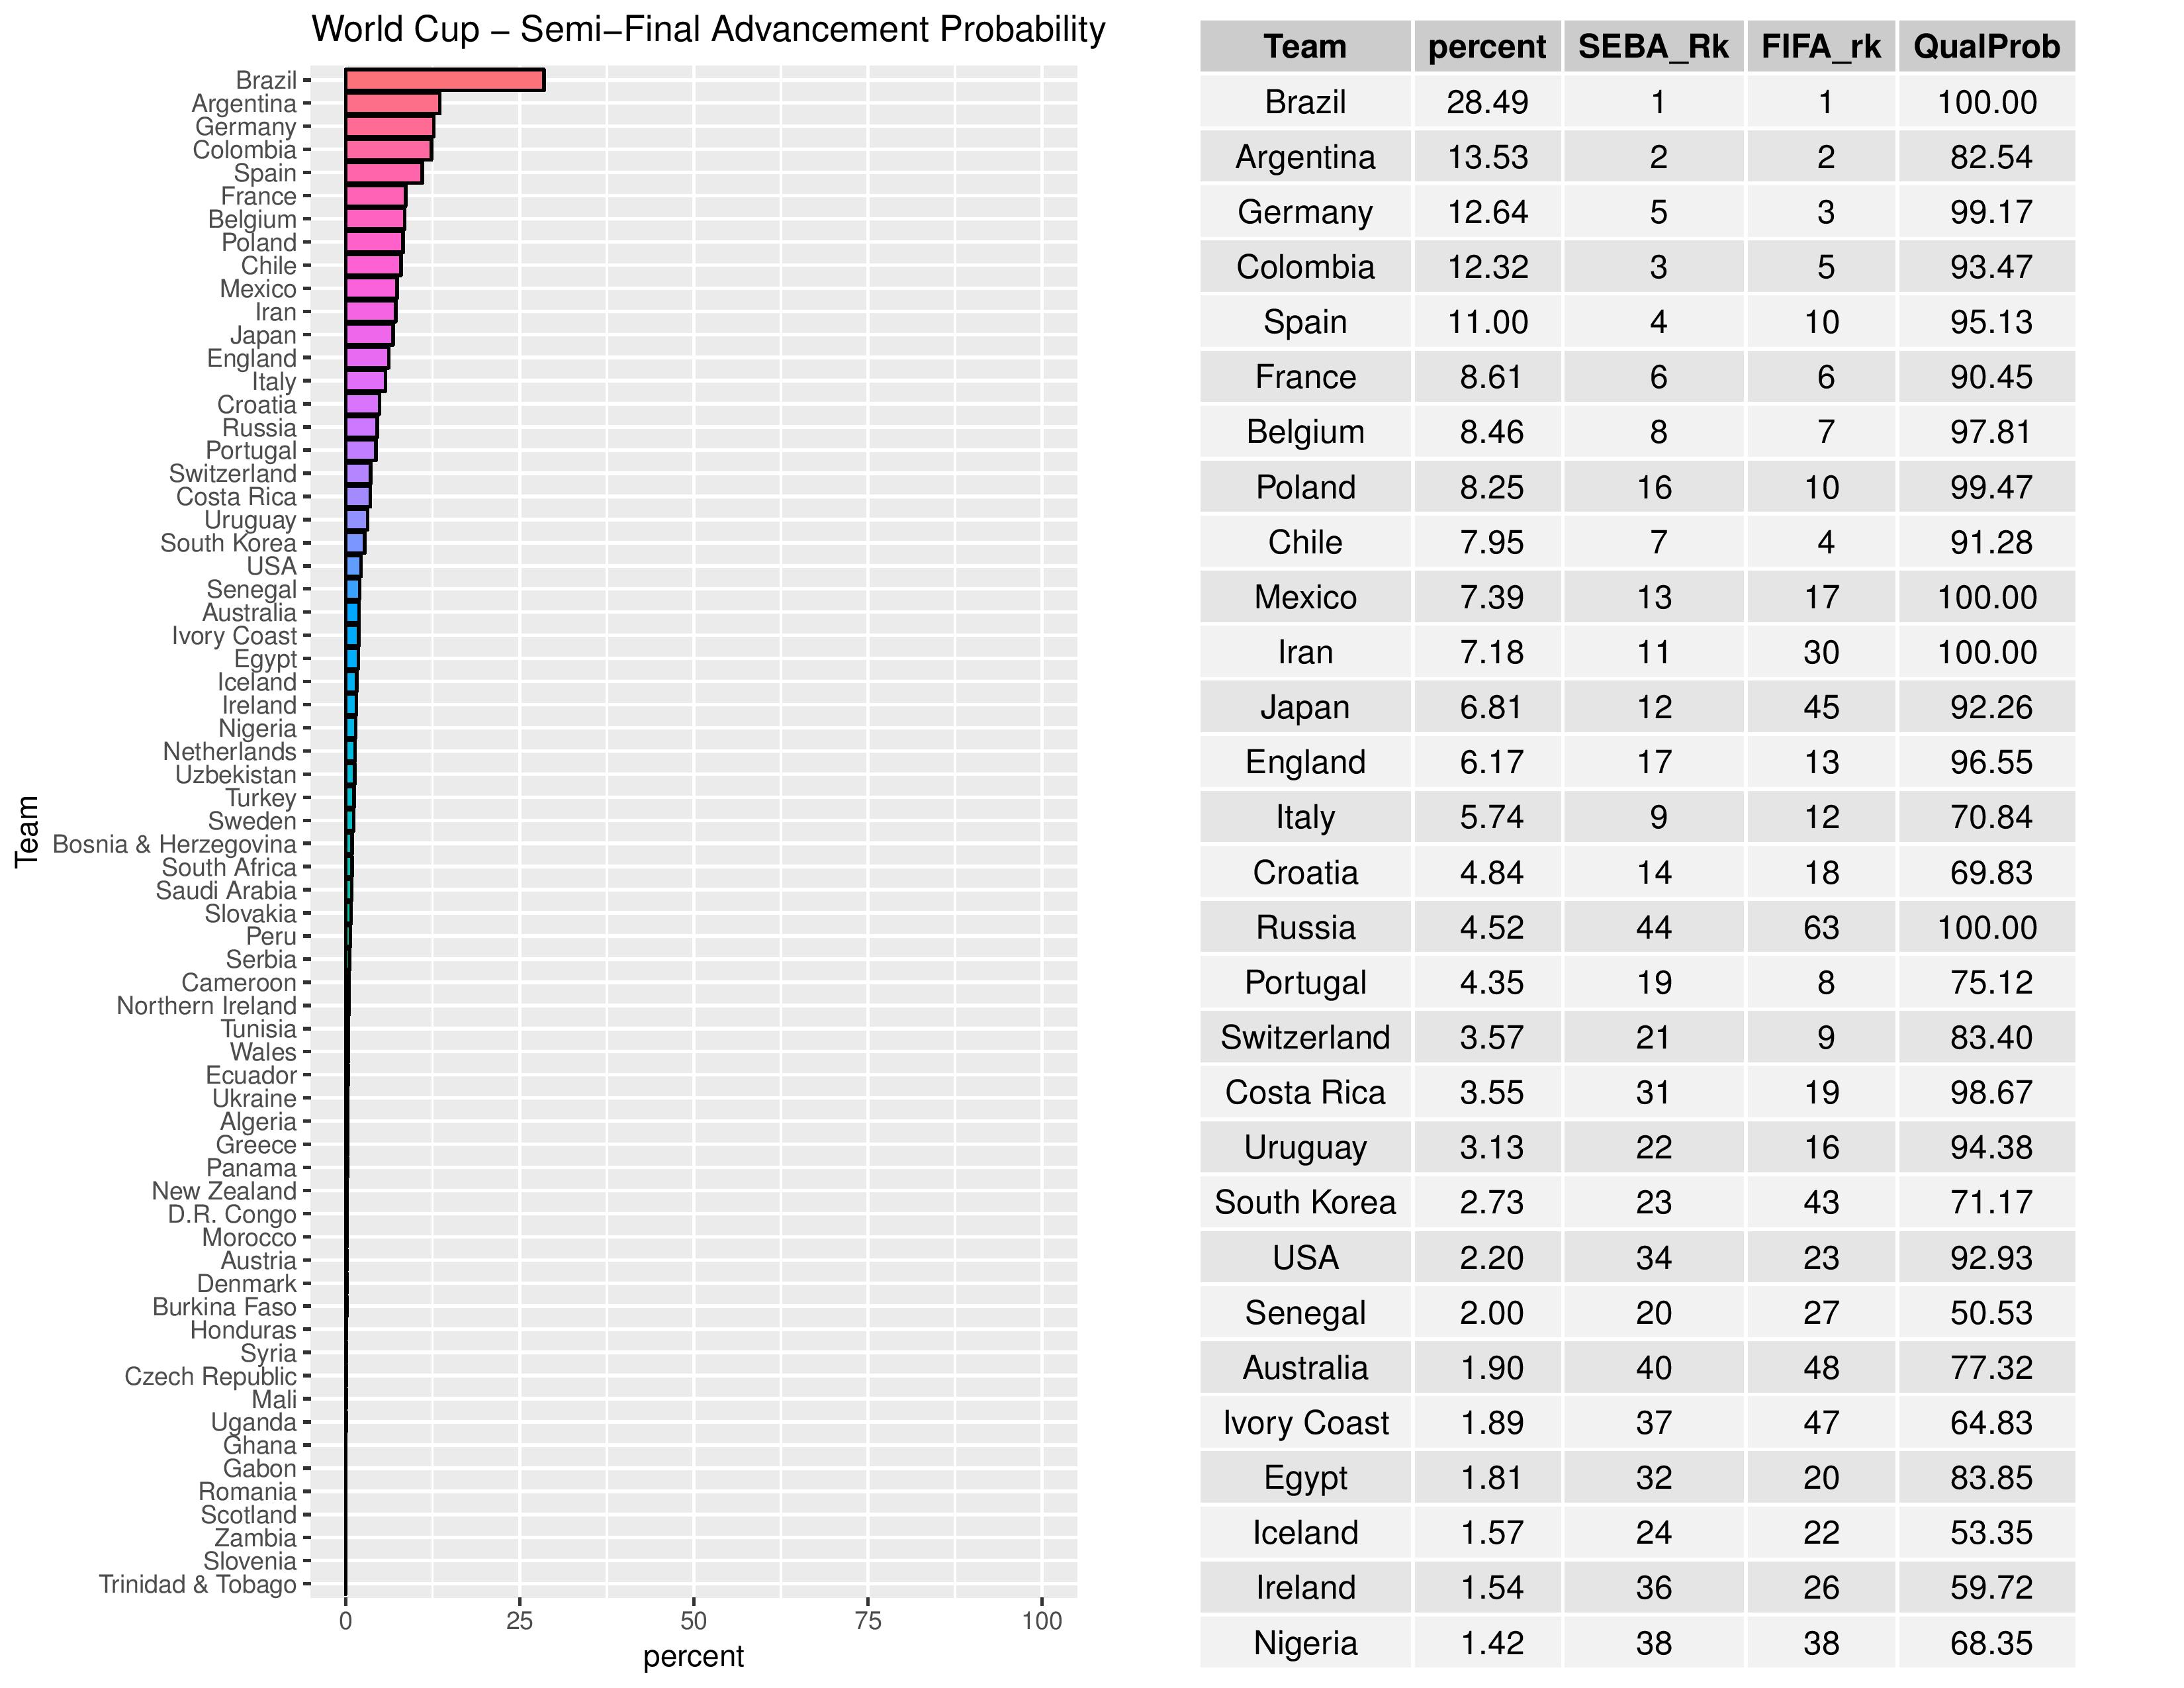
The following shows the probabilities of teams advancing through the semifinal. USA has increased from 1.82% to 2.20% in chances of making it through the semifinal.
Gold Cup
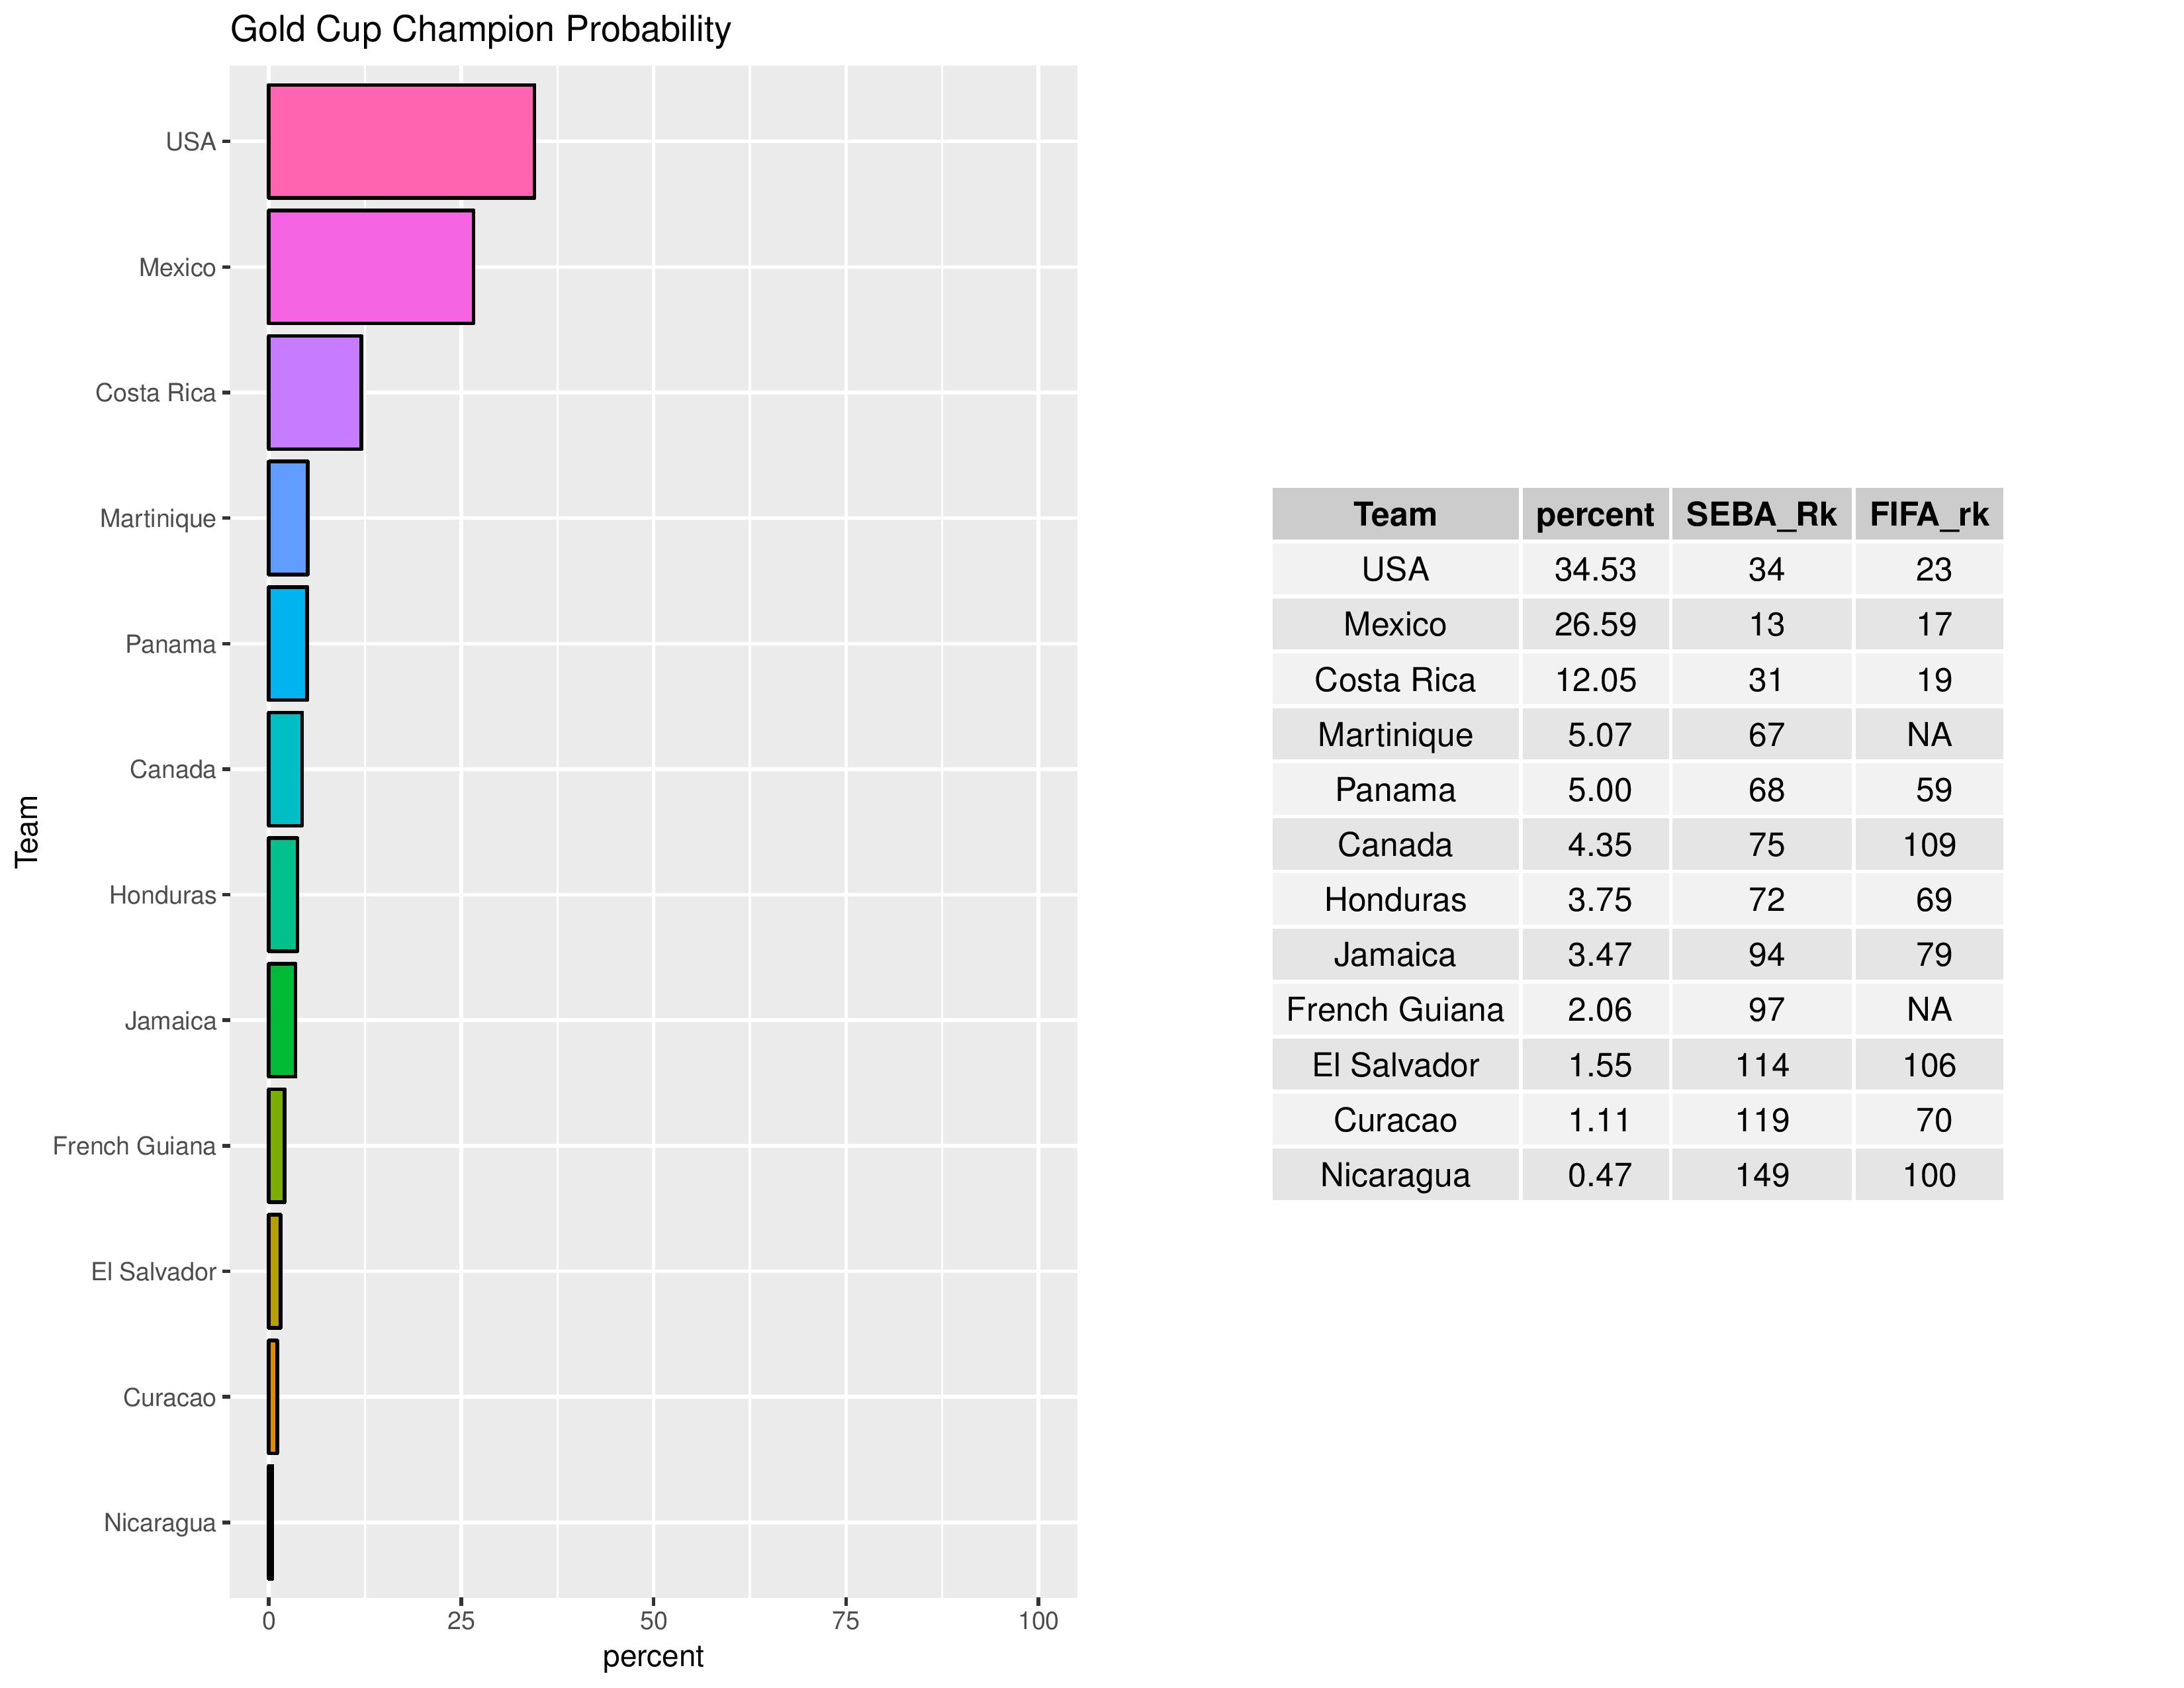
The following shows the Gold Cup champion forecast. The’s USA odds of winning the Gold Cup have increased from 33.14% to 34.53% from the last published forecast.
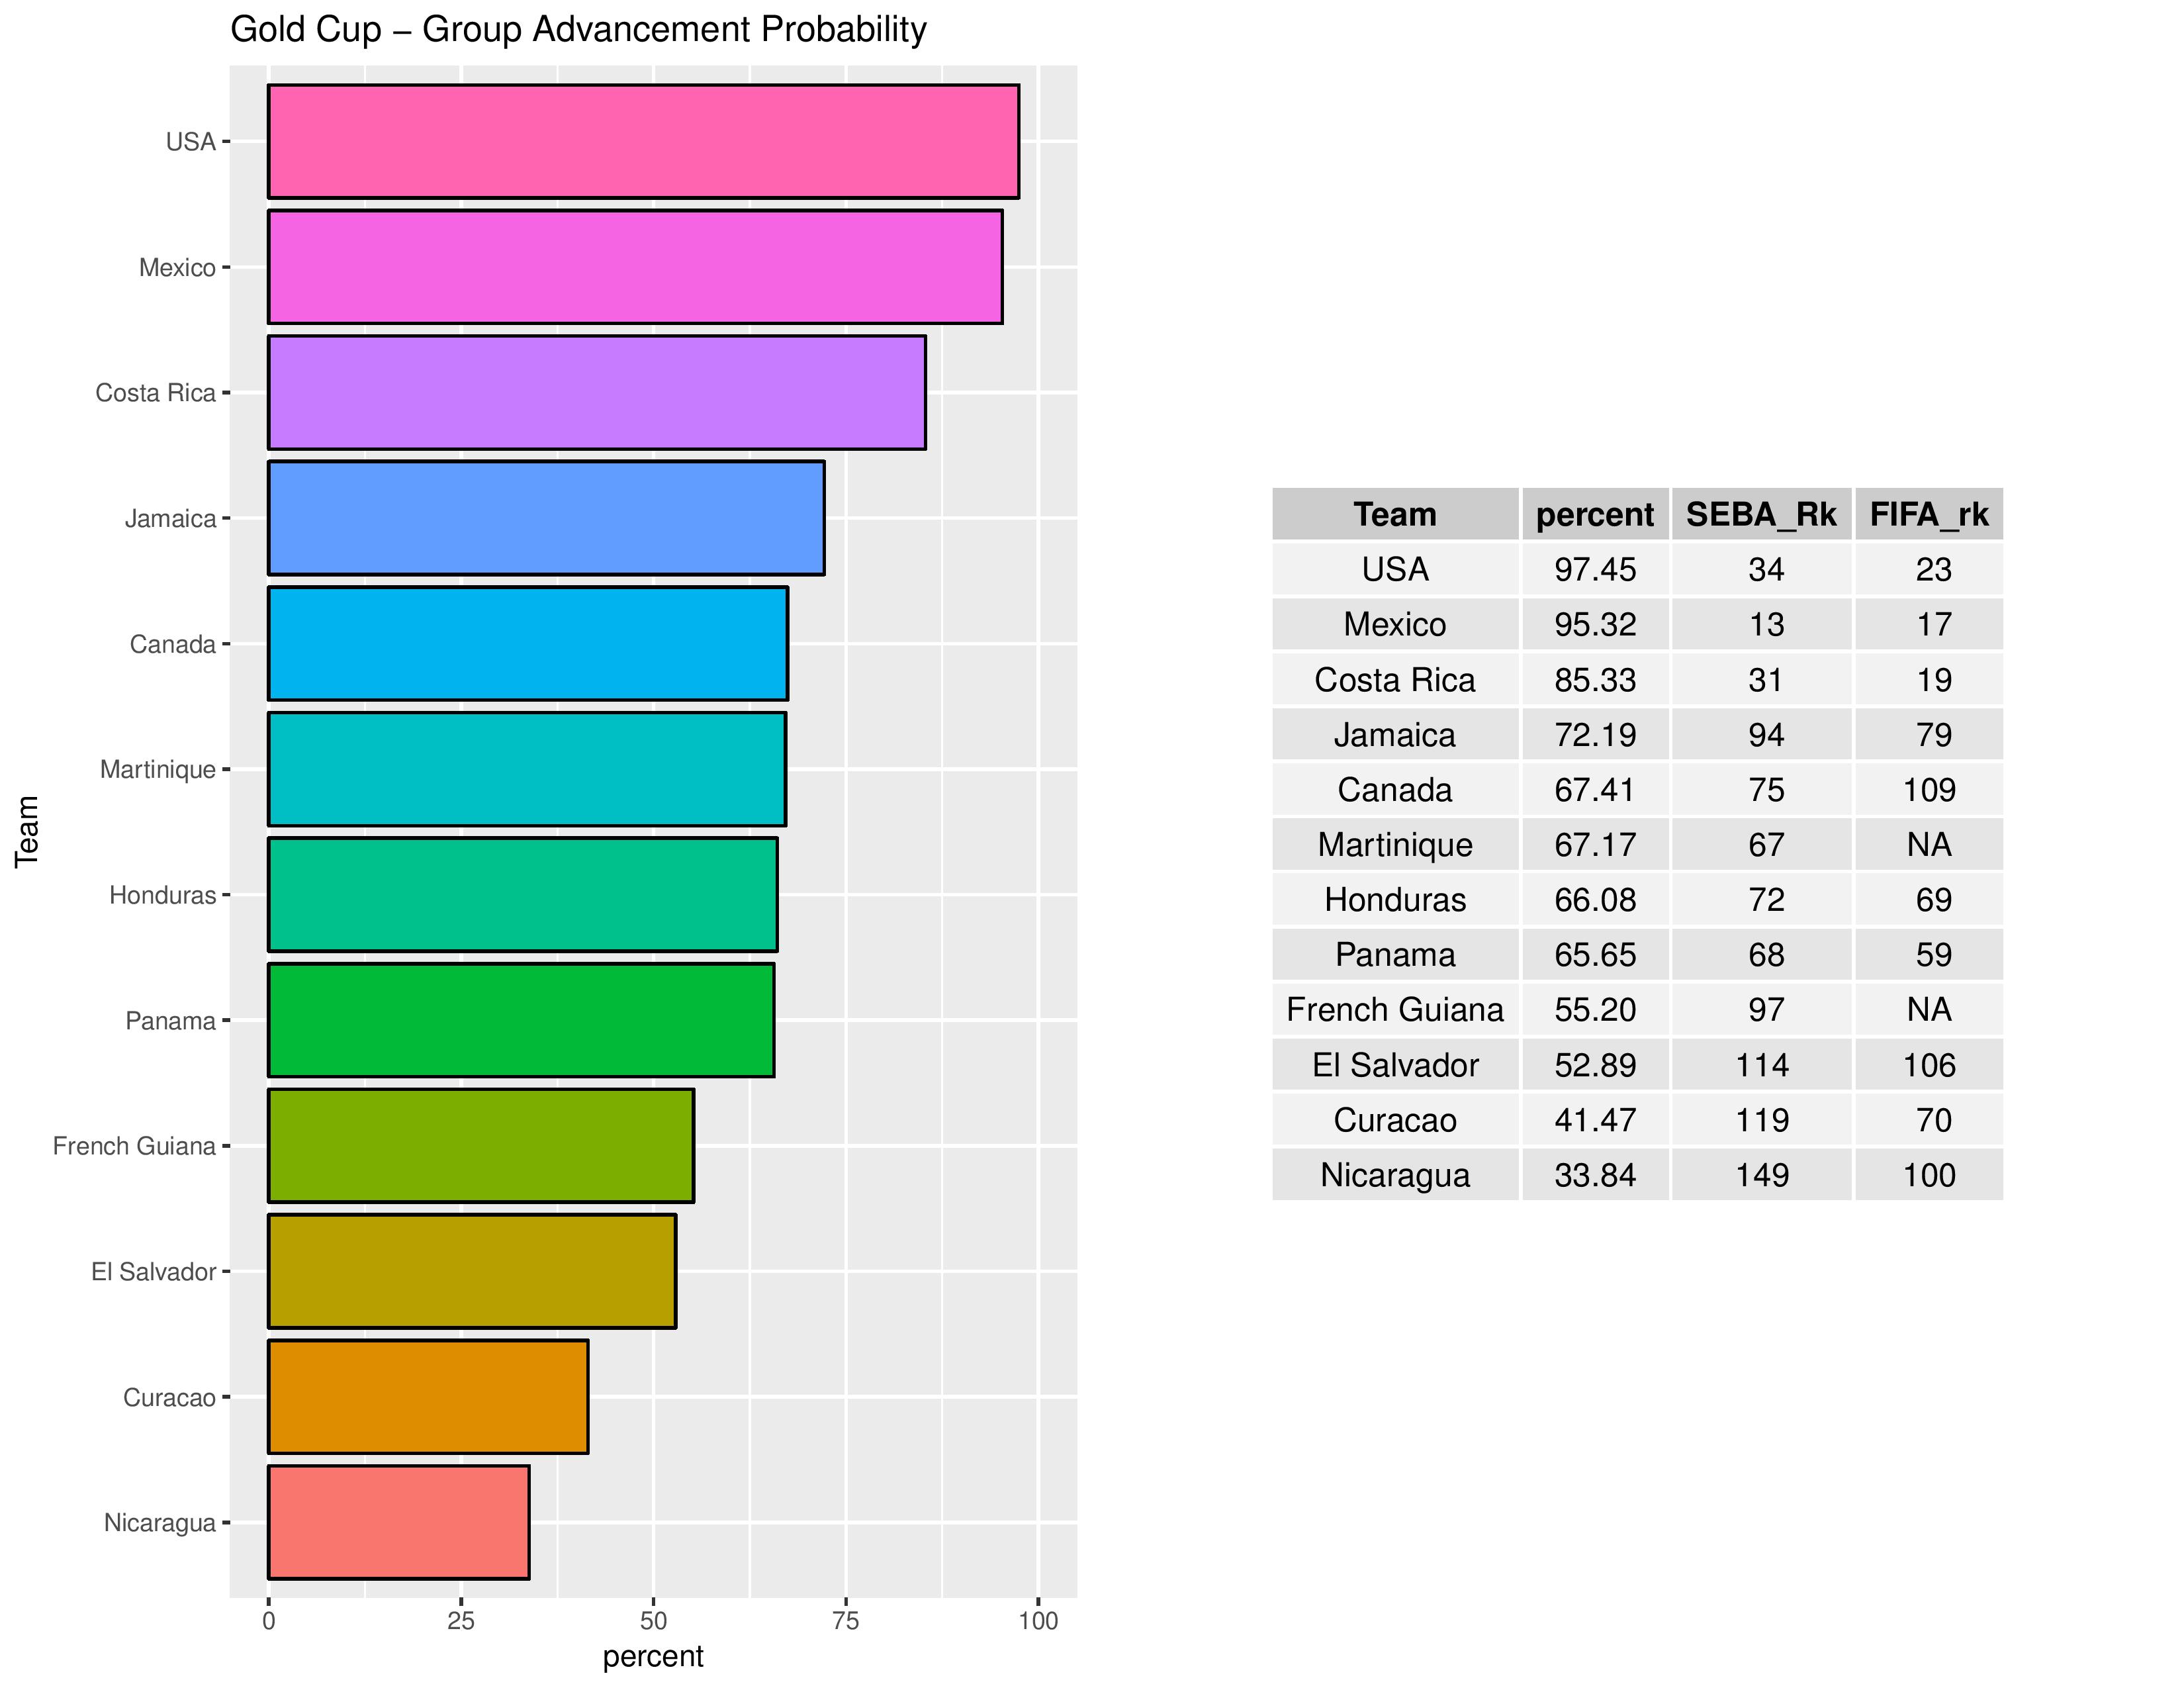
The following shows the probabilities of teams advancing through the group stage of the Gold Cup. The USA’s chances increased from 97.24% to 97.45% of advancing through the group stage.
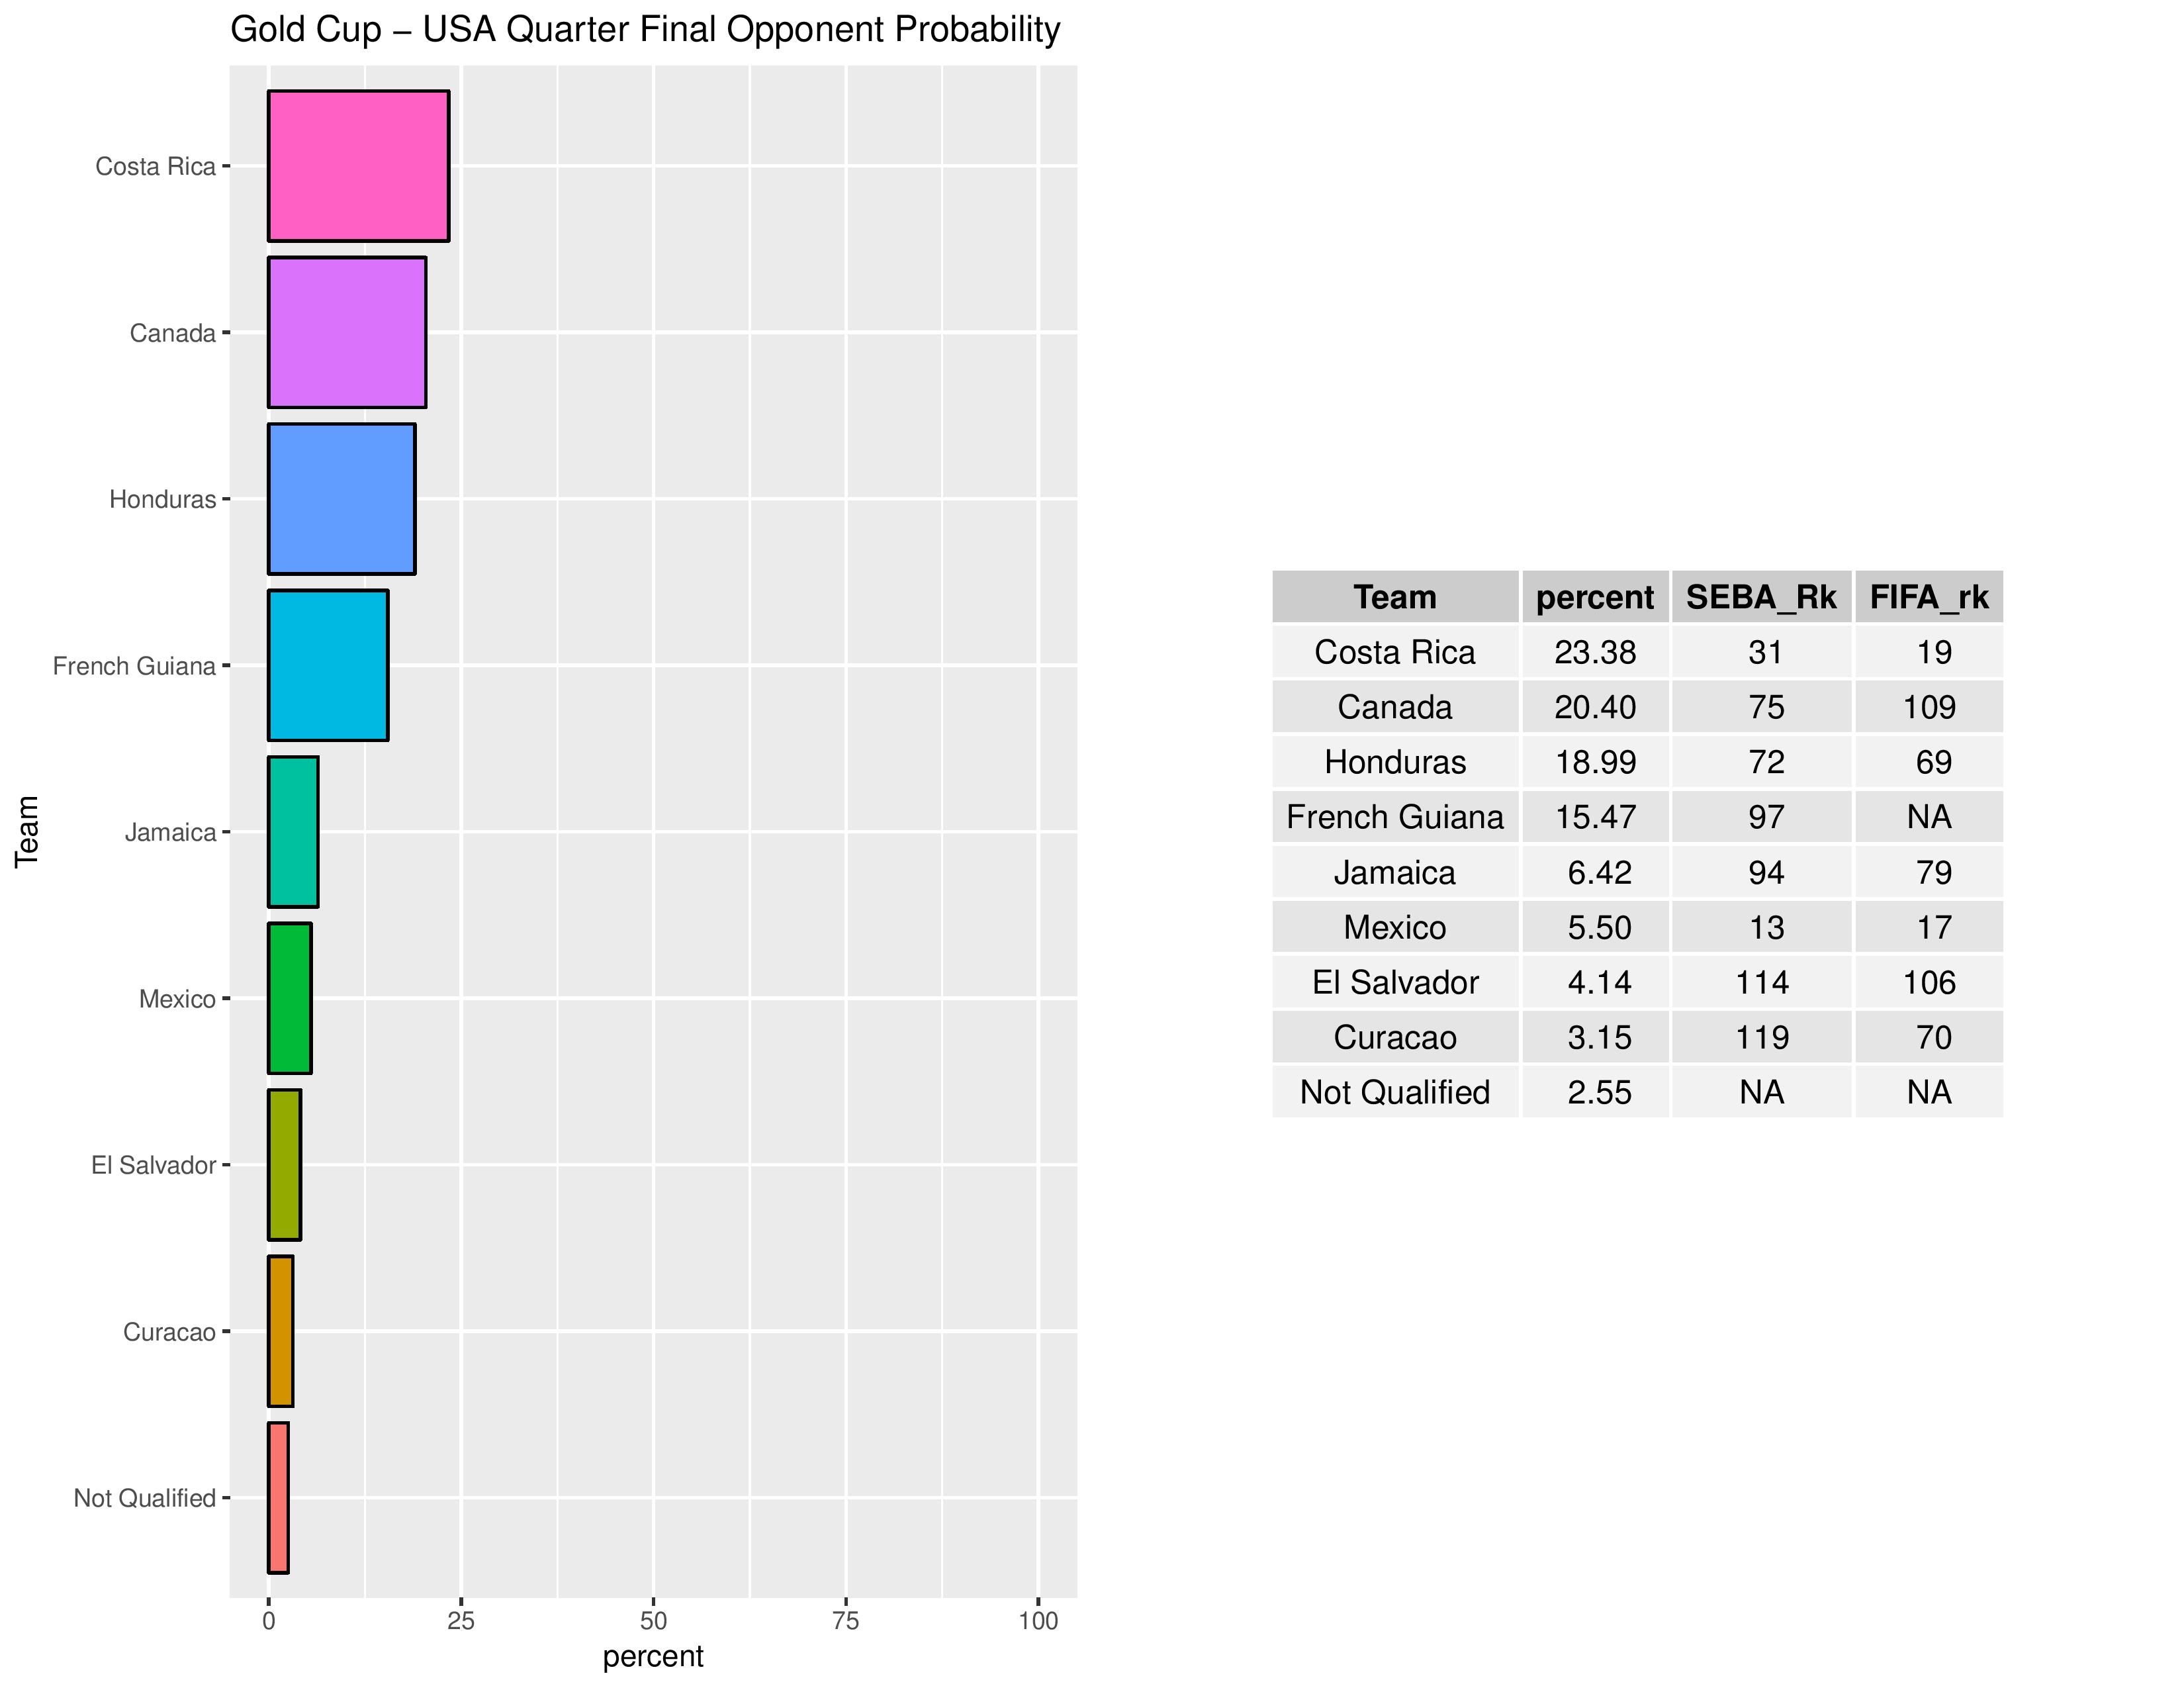
The following shows the probabilities of the USA’s quarterfinal opponent.
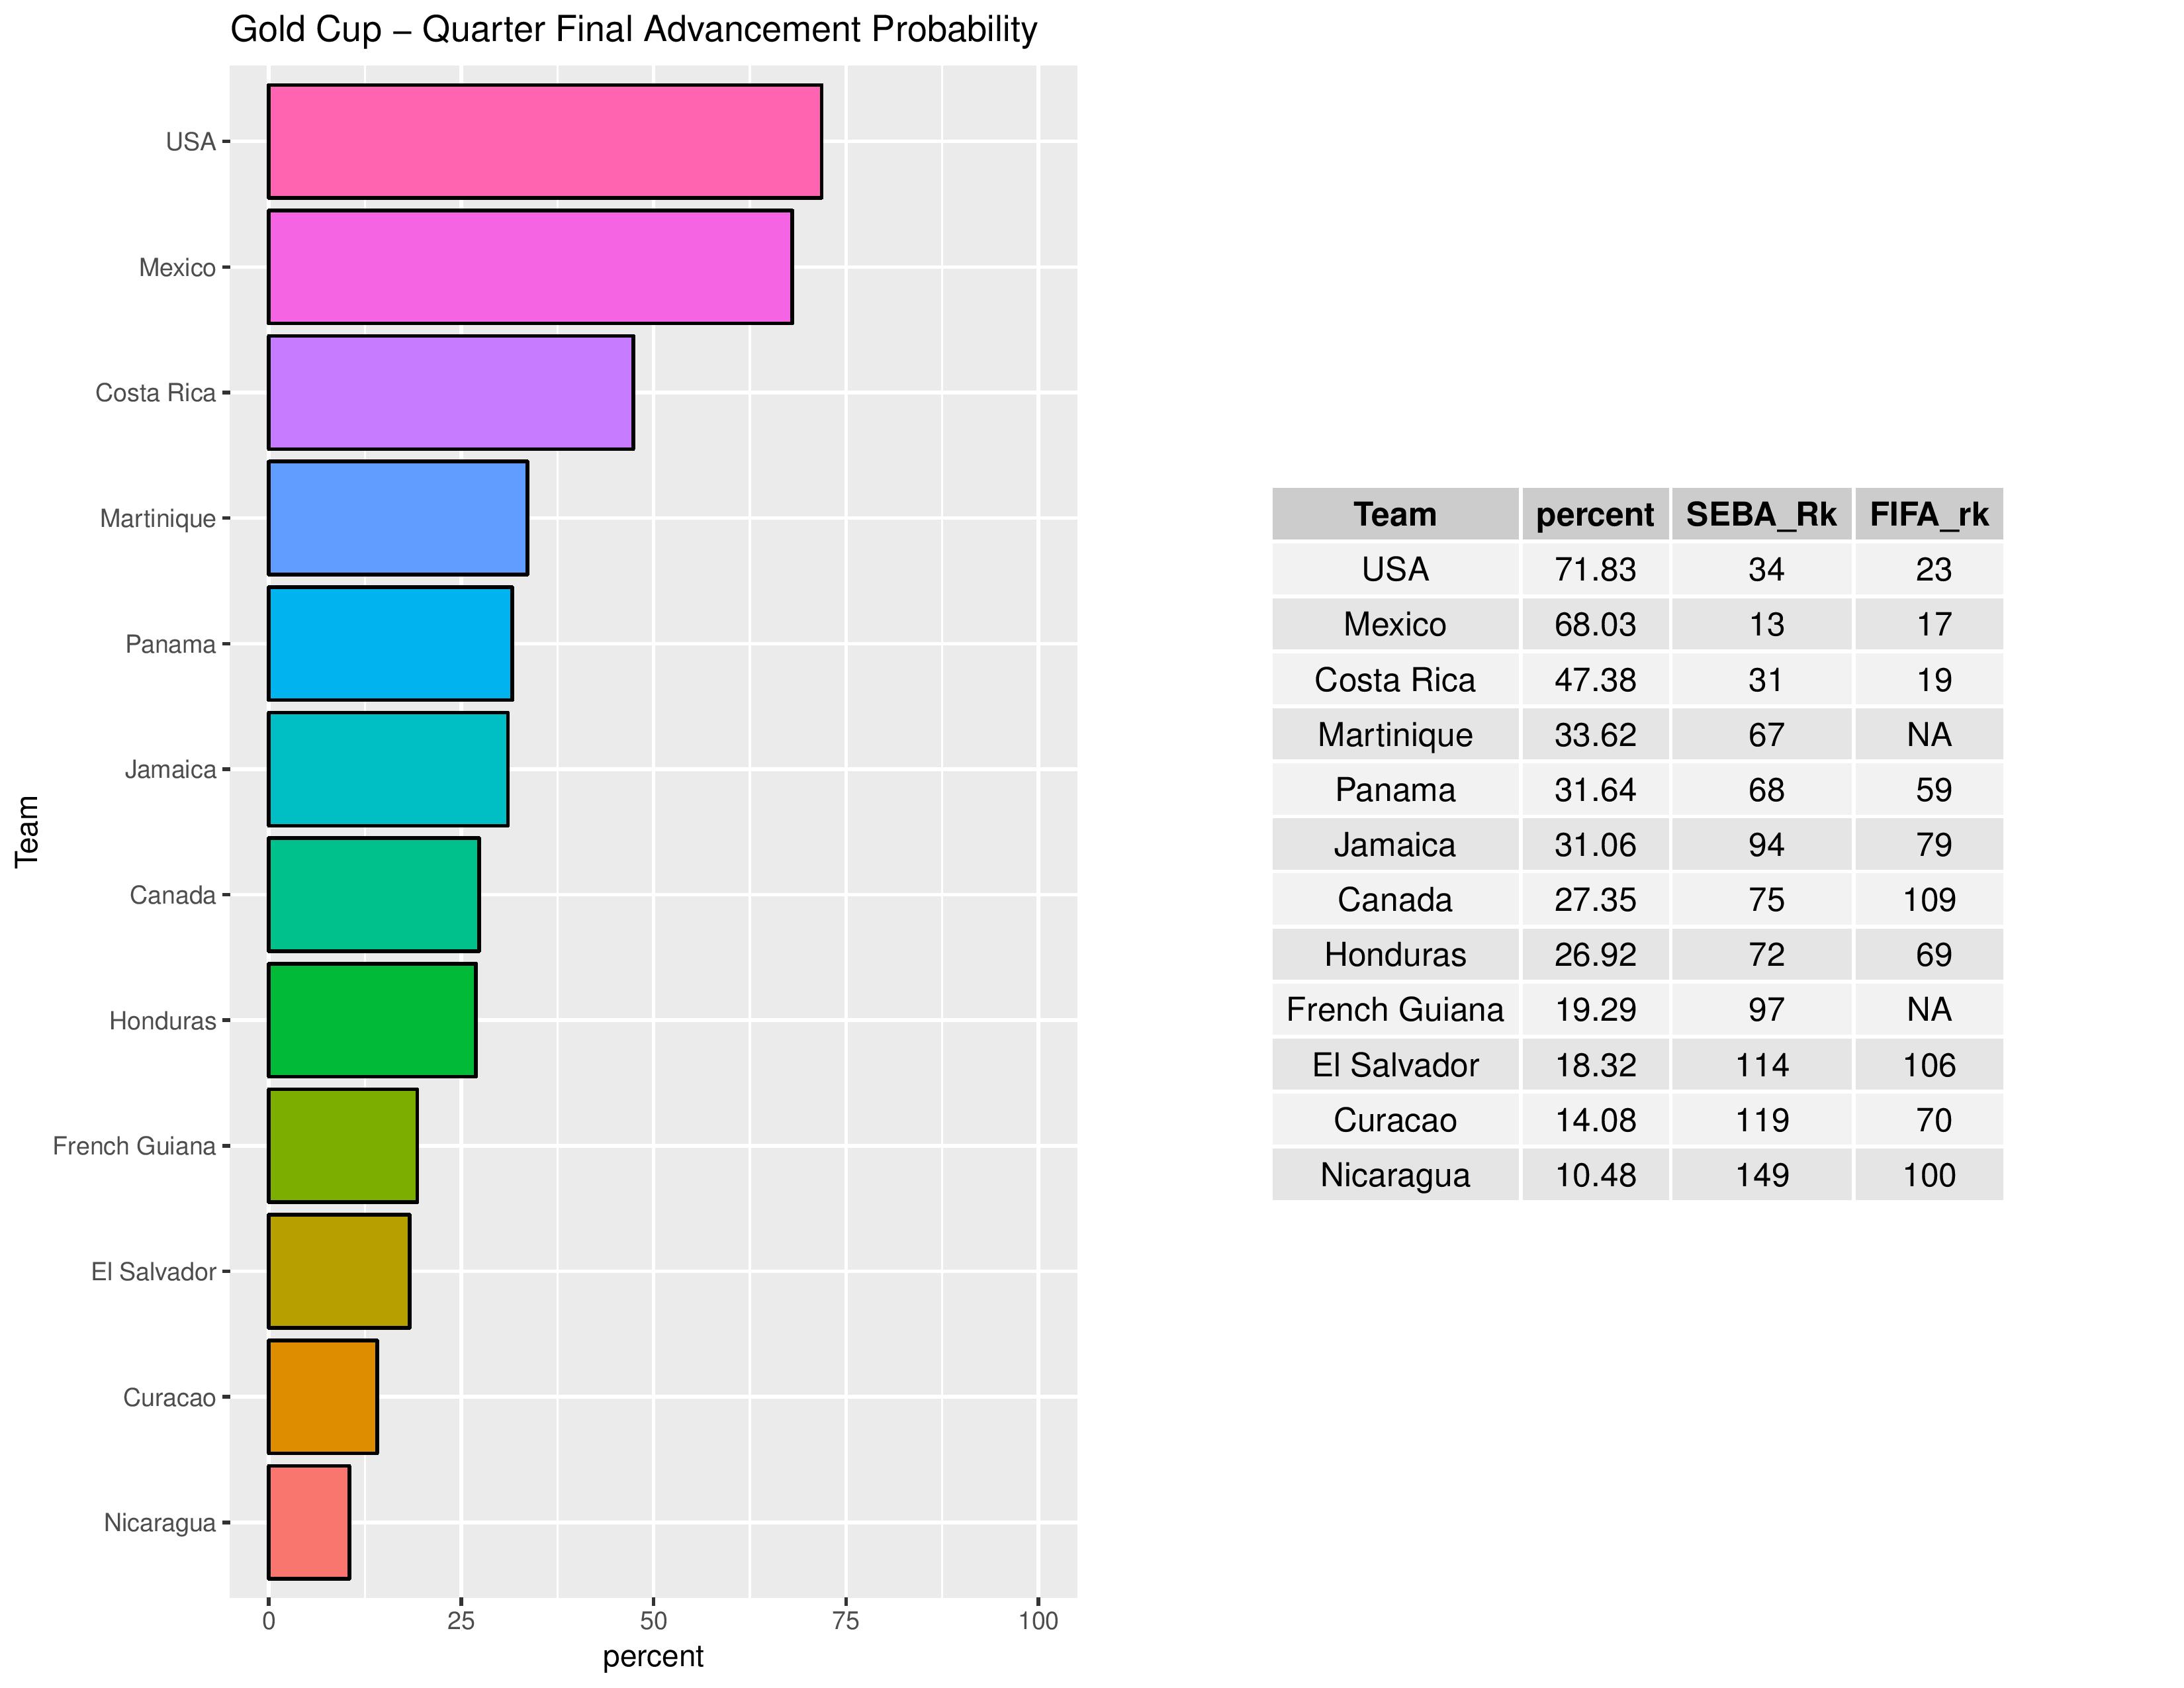
The following shows the probabilities of teams advancing through the quarterfinal. The USA increased chances from 71.08% to 71.83% in advancing through the quarterfinal.
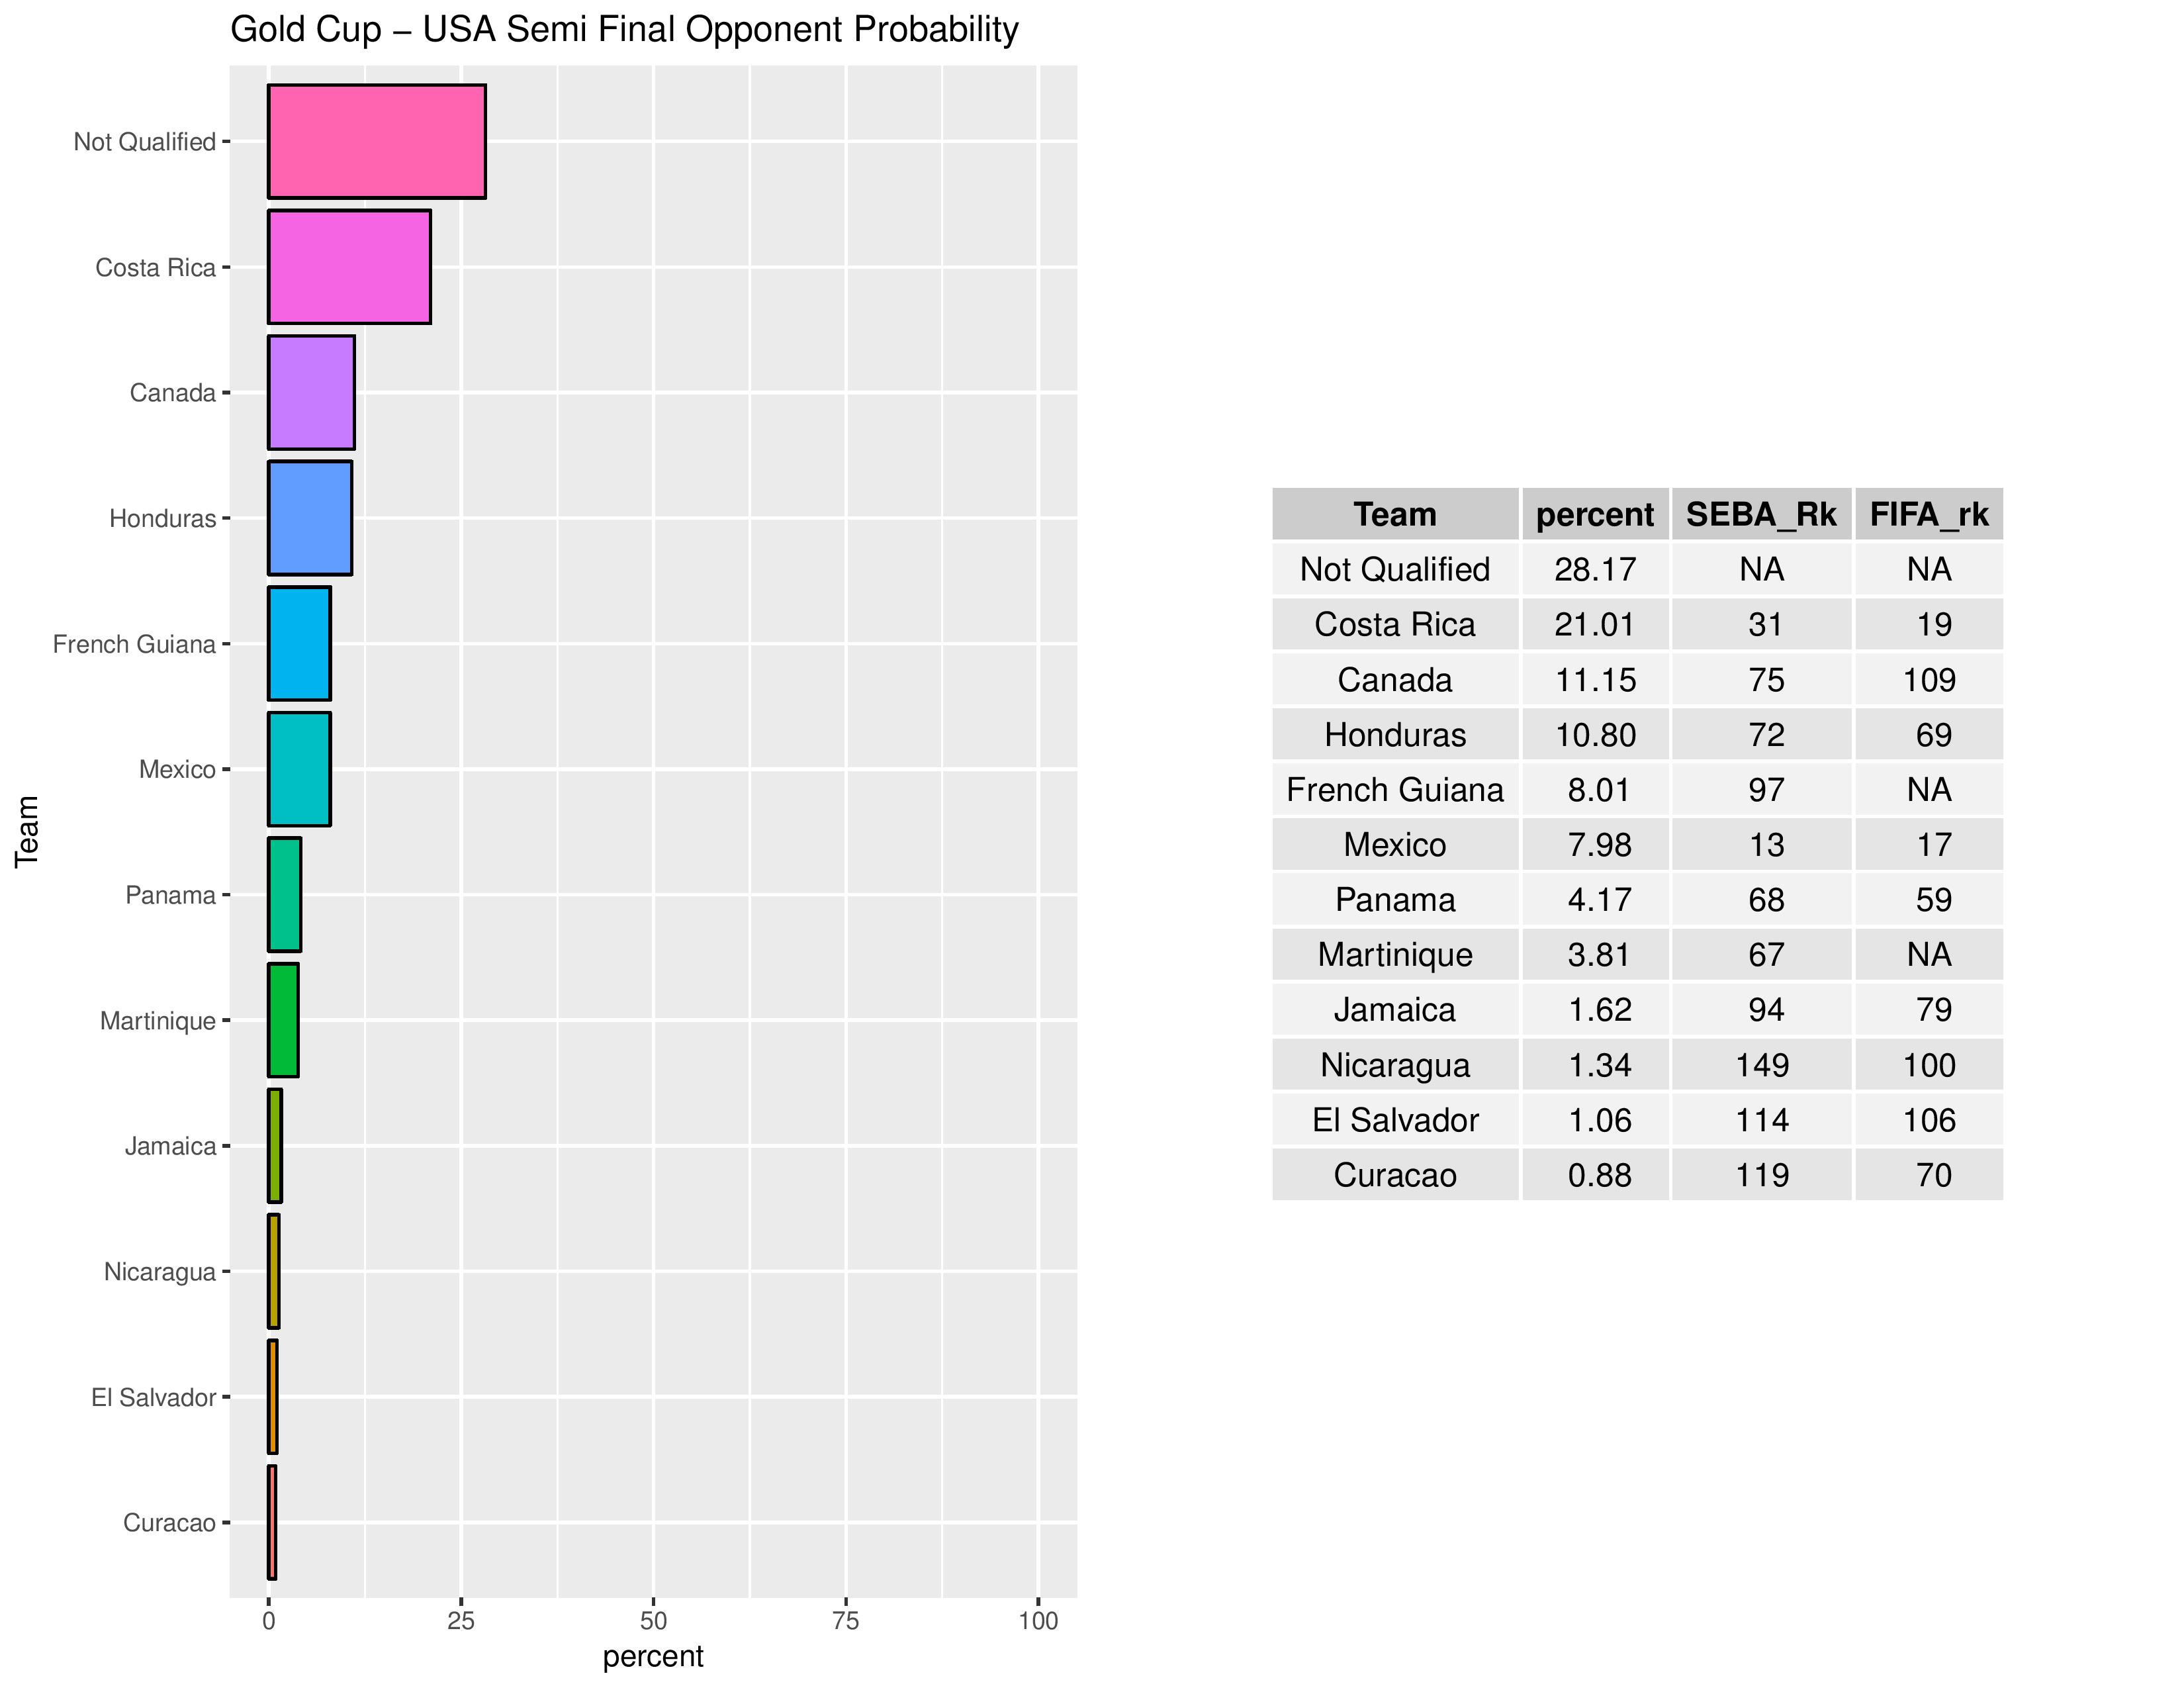
The following shows the probabilities of the USA’s semifinal opponent.
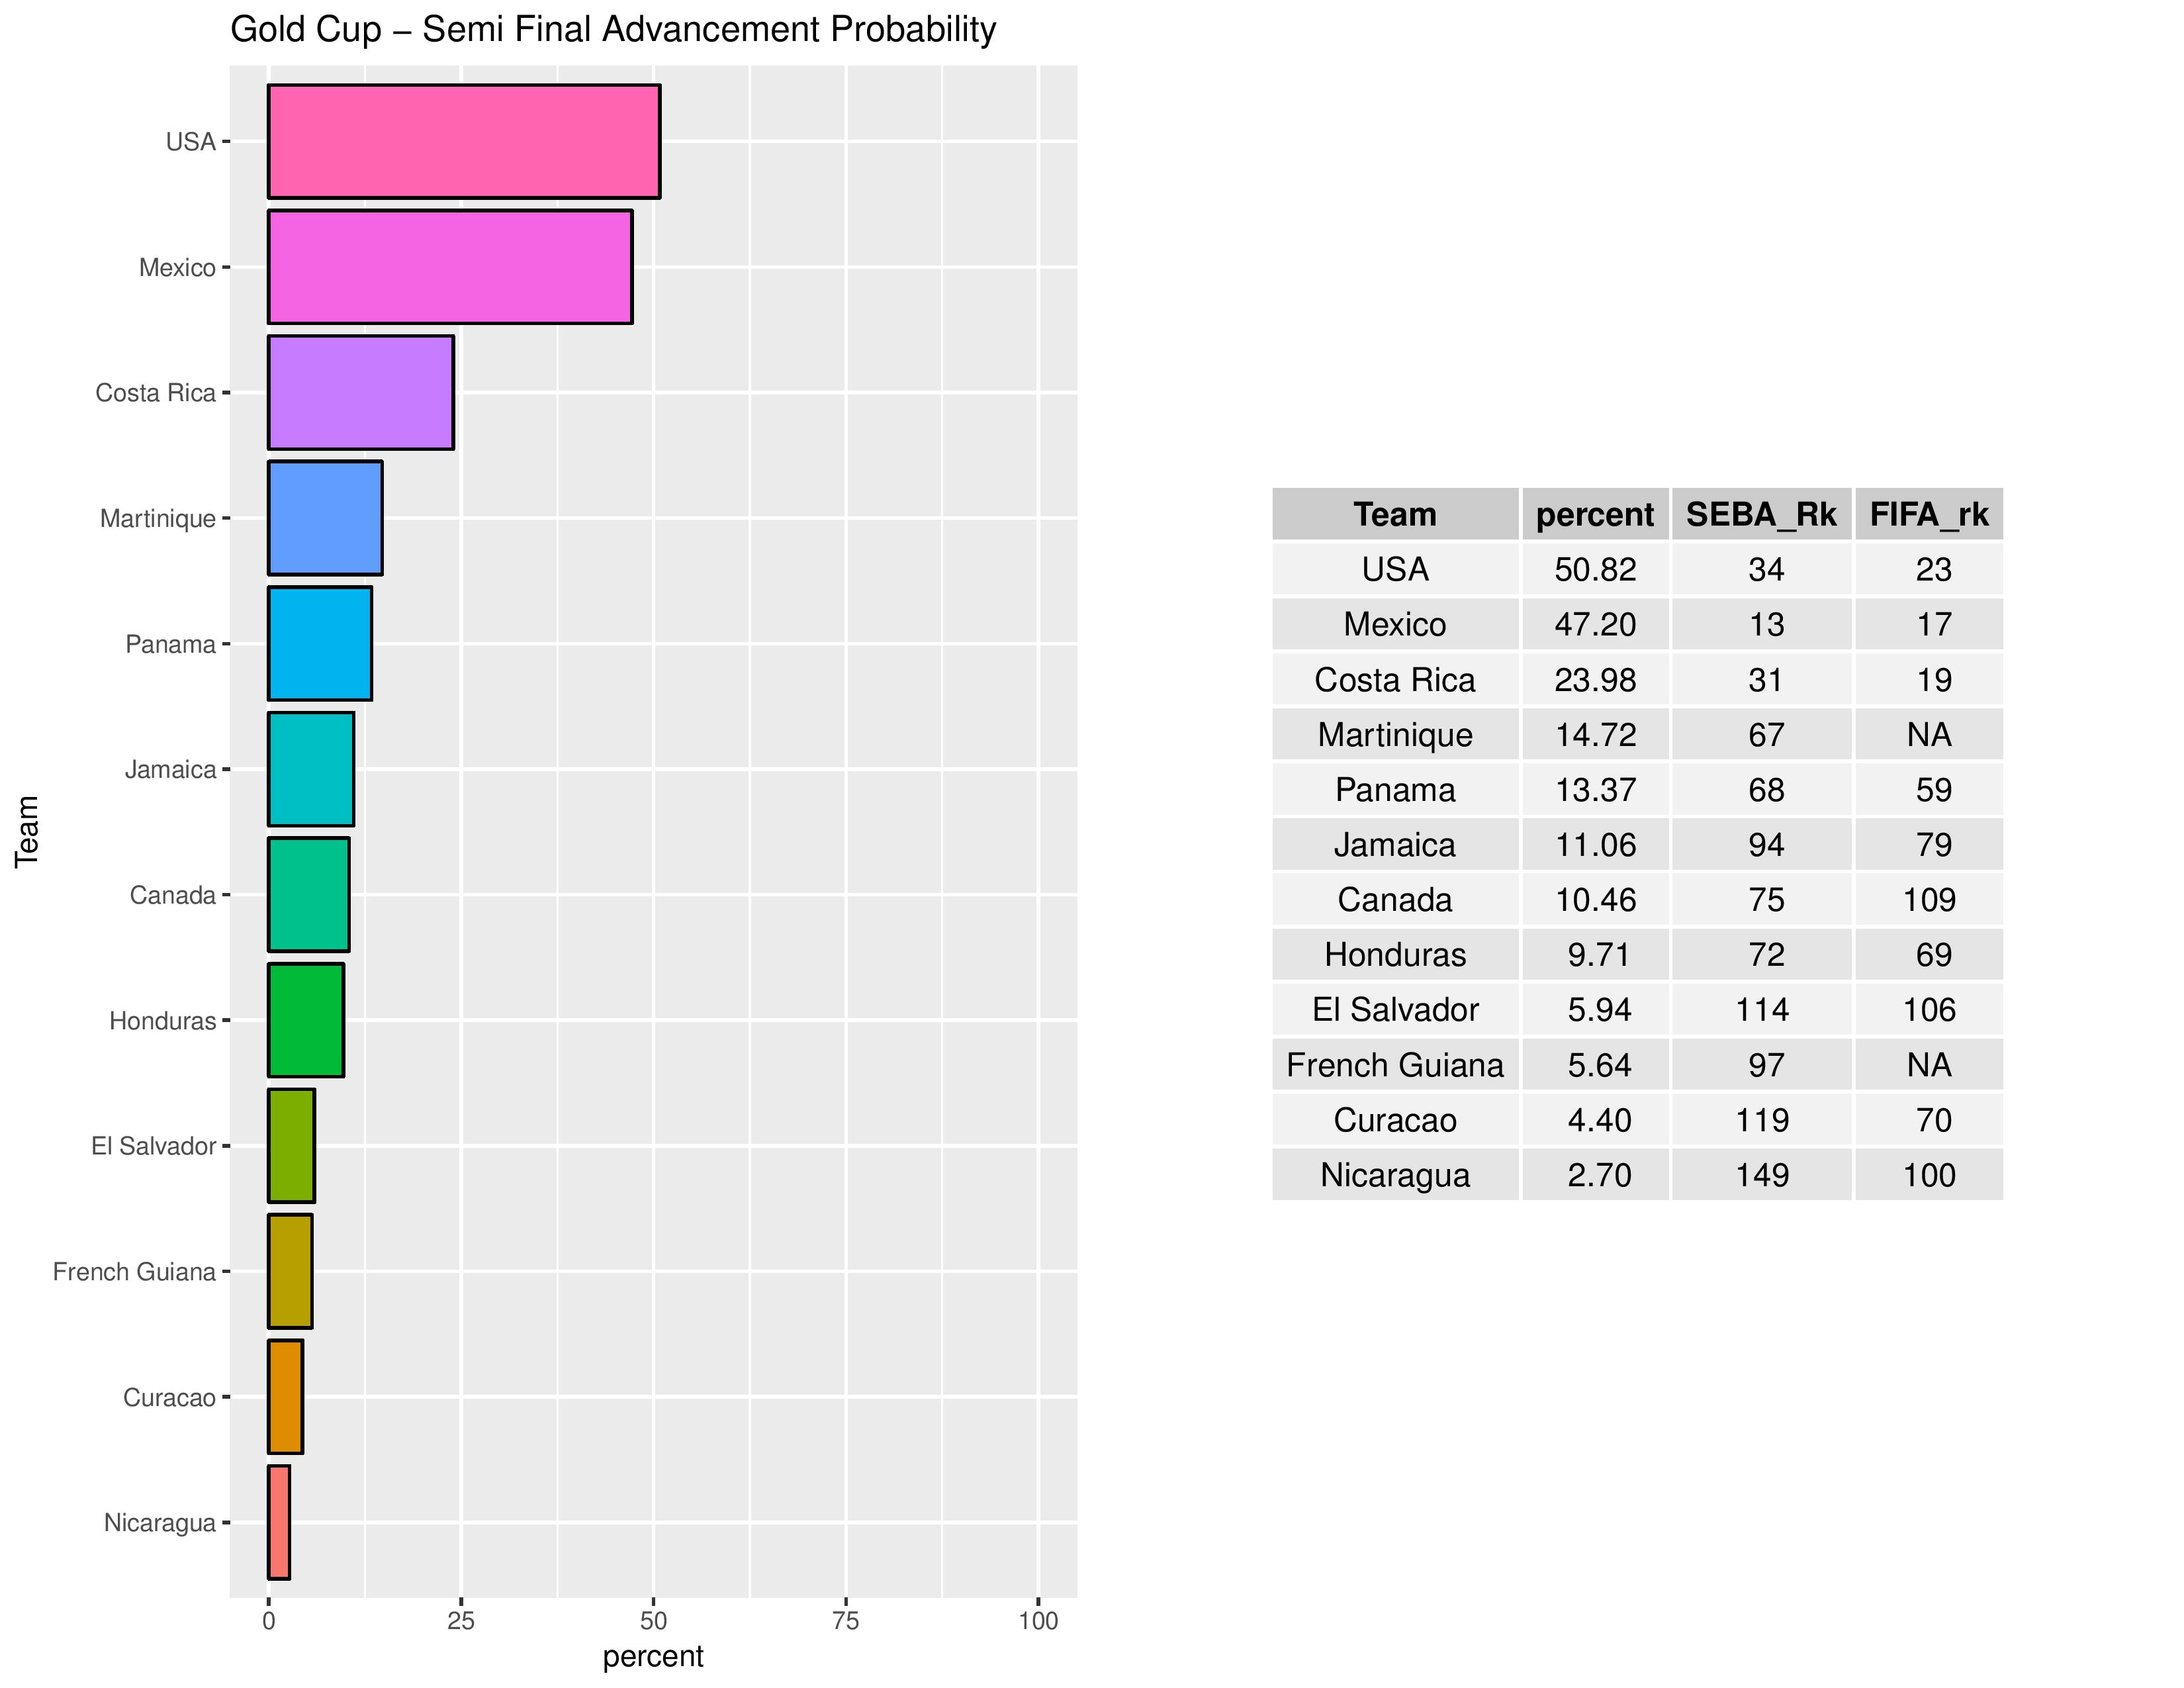
The following shows the probabilities of each team advancing through the semifinal. The USA has increased from 49.78% to 50.82% in chances of advancing through the semifinal.
The following shows the probabilities of USA’s final opponent.

Other Tournaments
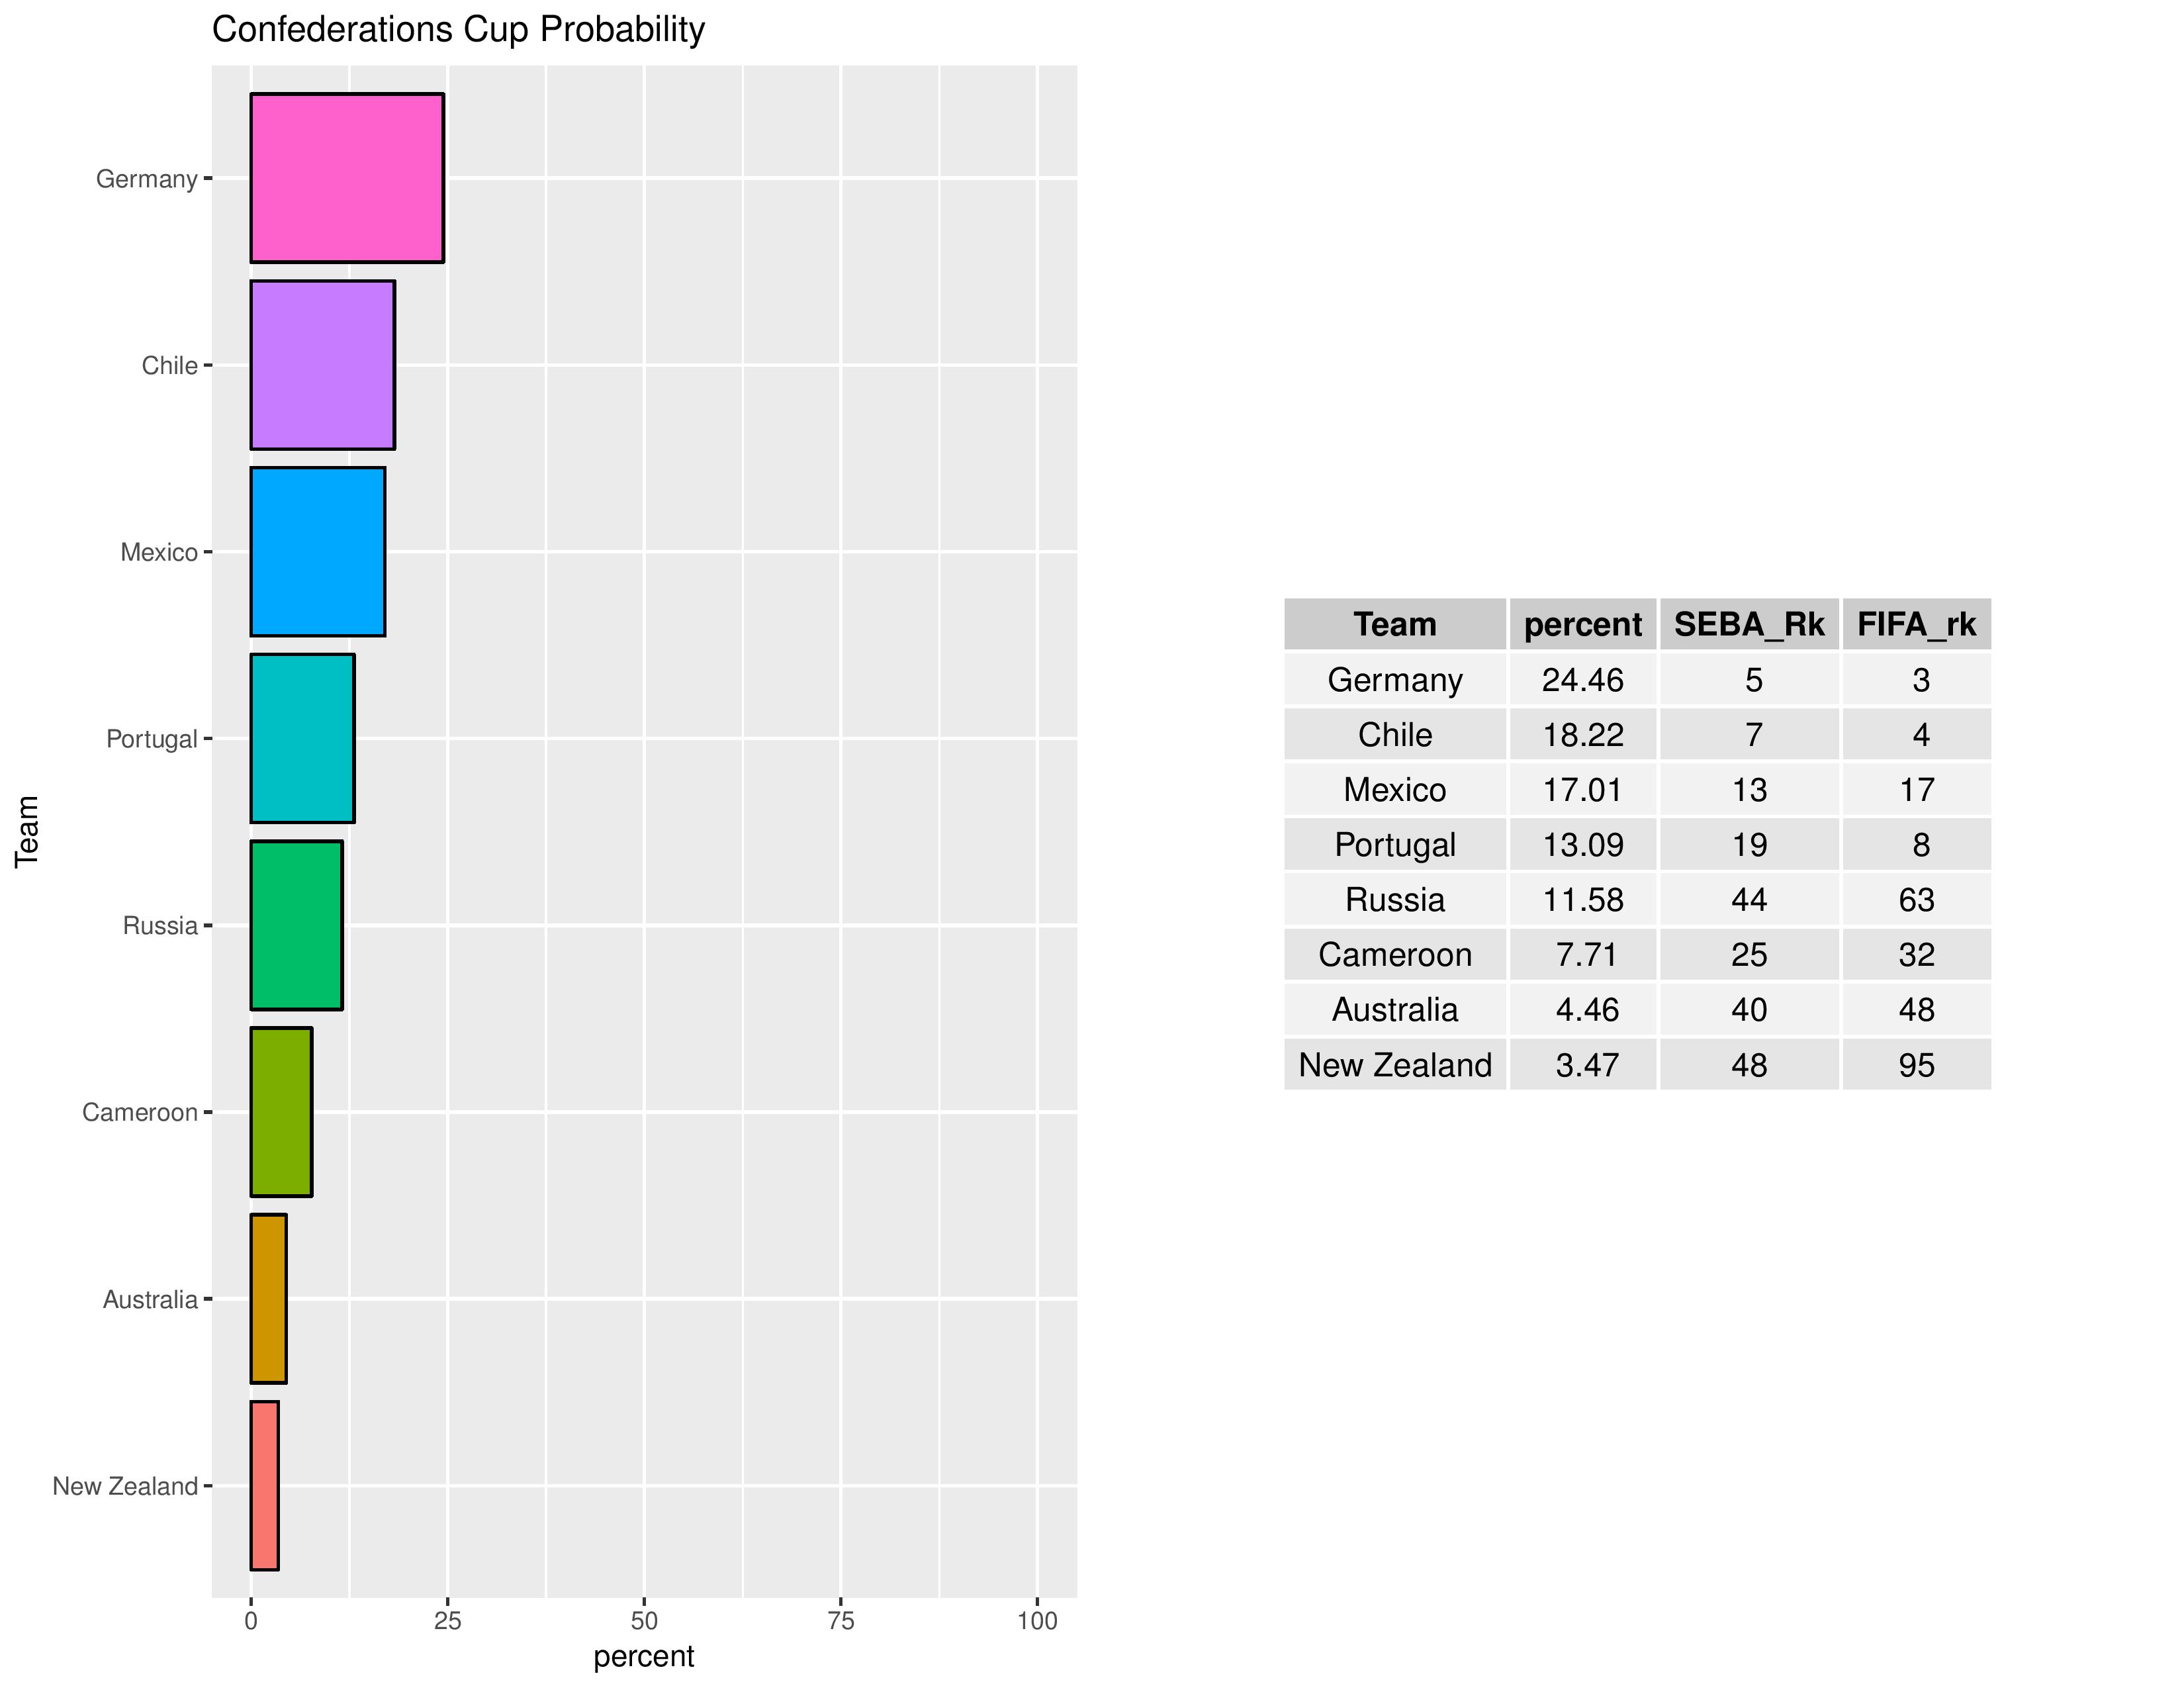
The following shows the Confederations Cup projections. CONCACAF’s representative, Mexico, has seen its odds of winning decrease from 18.26% to 17.01%.
The first match begins this Saturday.
FIFA Rankings Comparison
For a discussion on how the FIFA rankings system differs from SEBA’s, check out the article from 3/28/2017.
The following shows, according to SEBA, the top-10 overrated teams to the left and the top-10 underrated teams to the right.
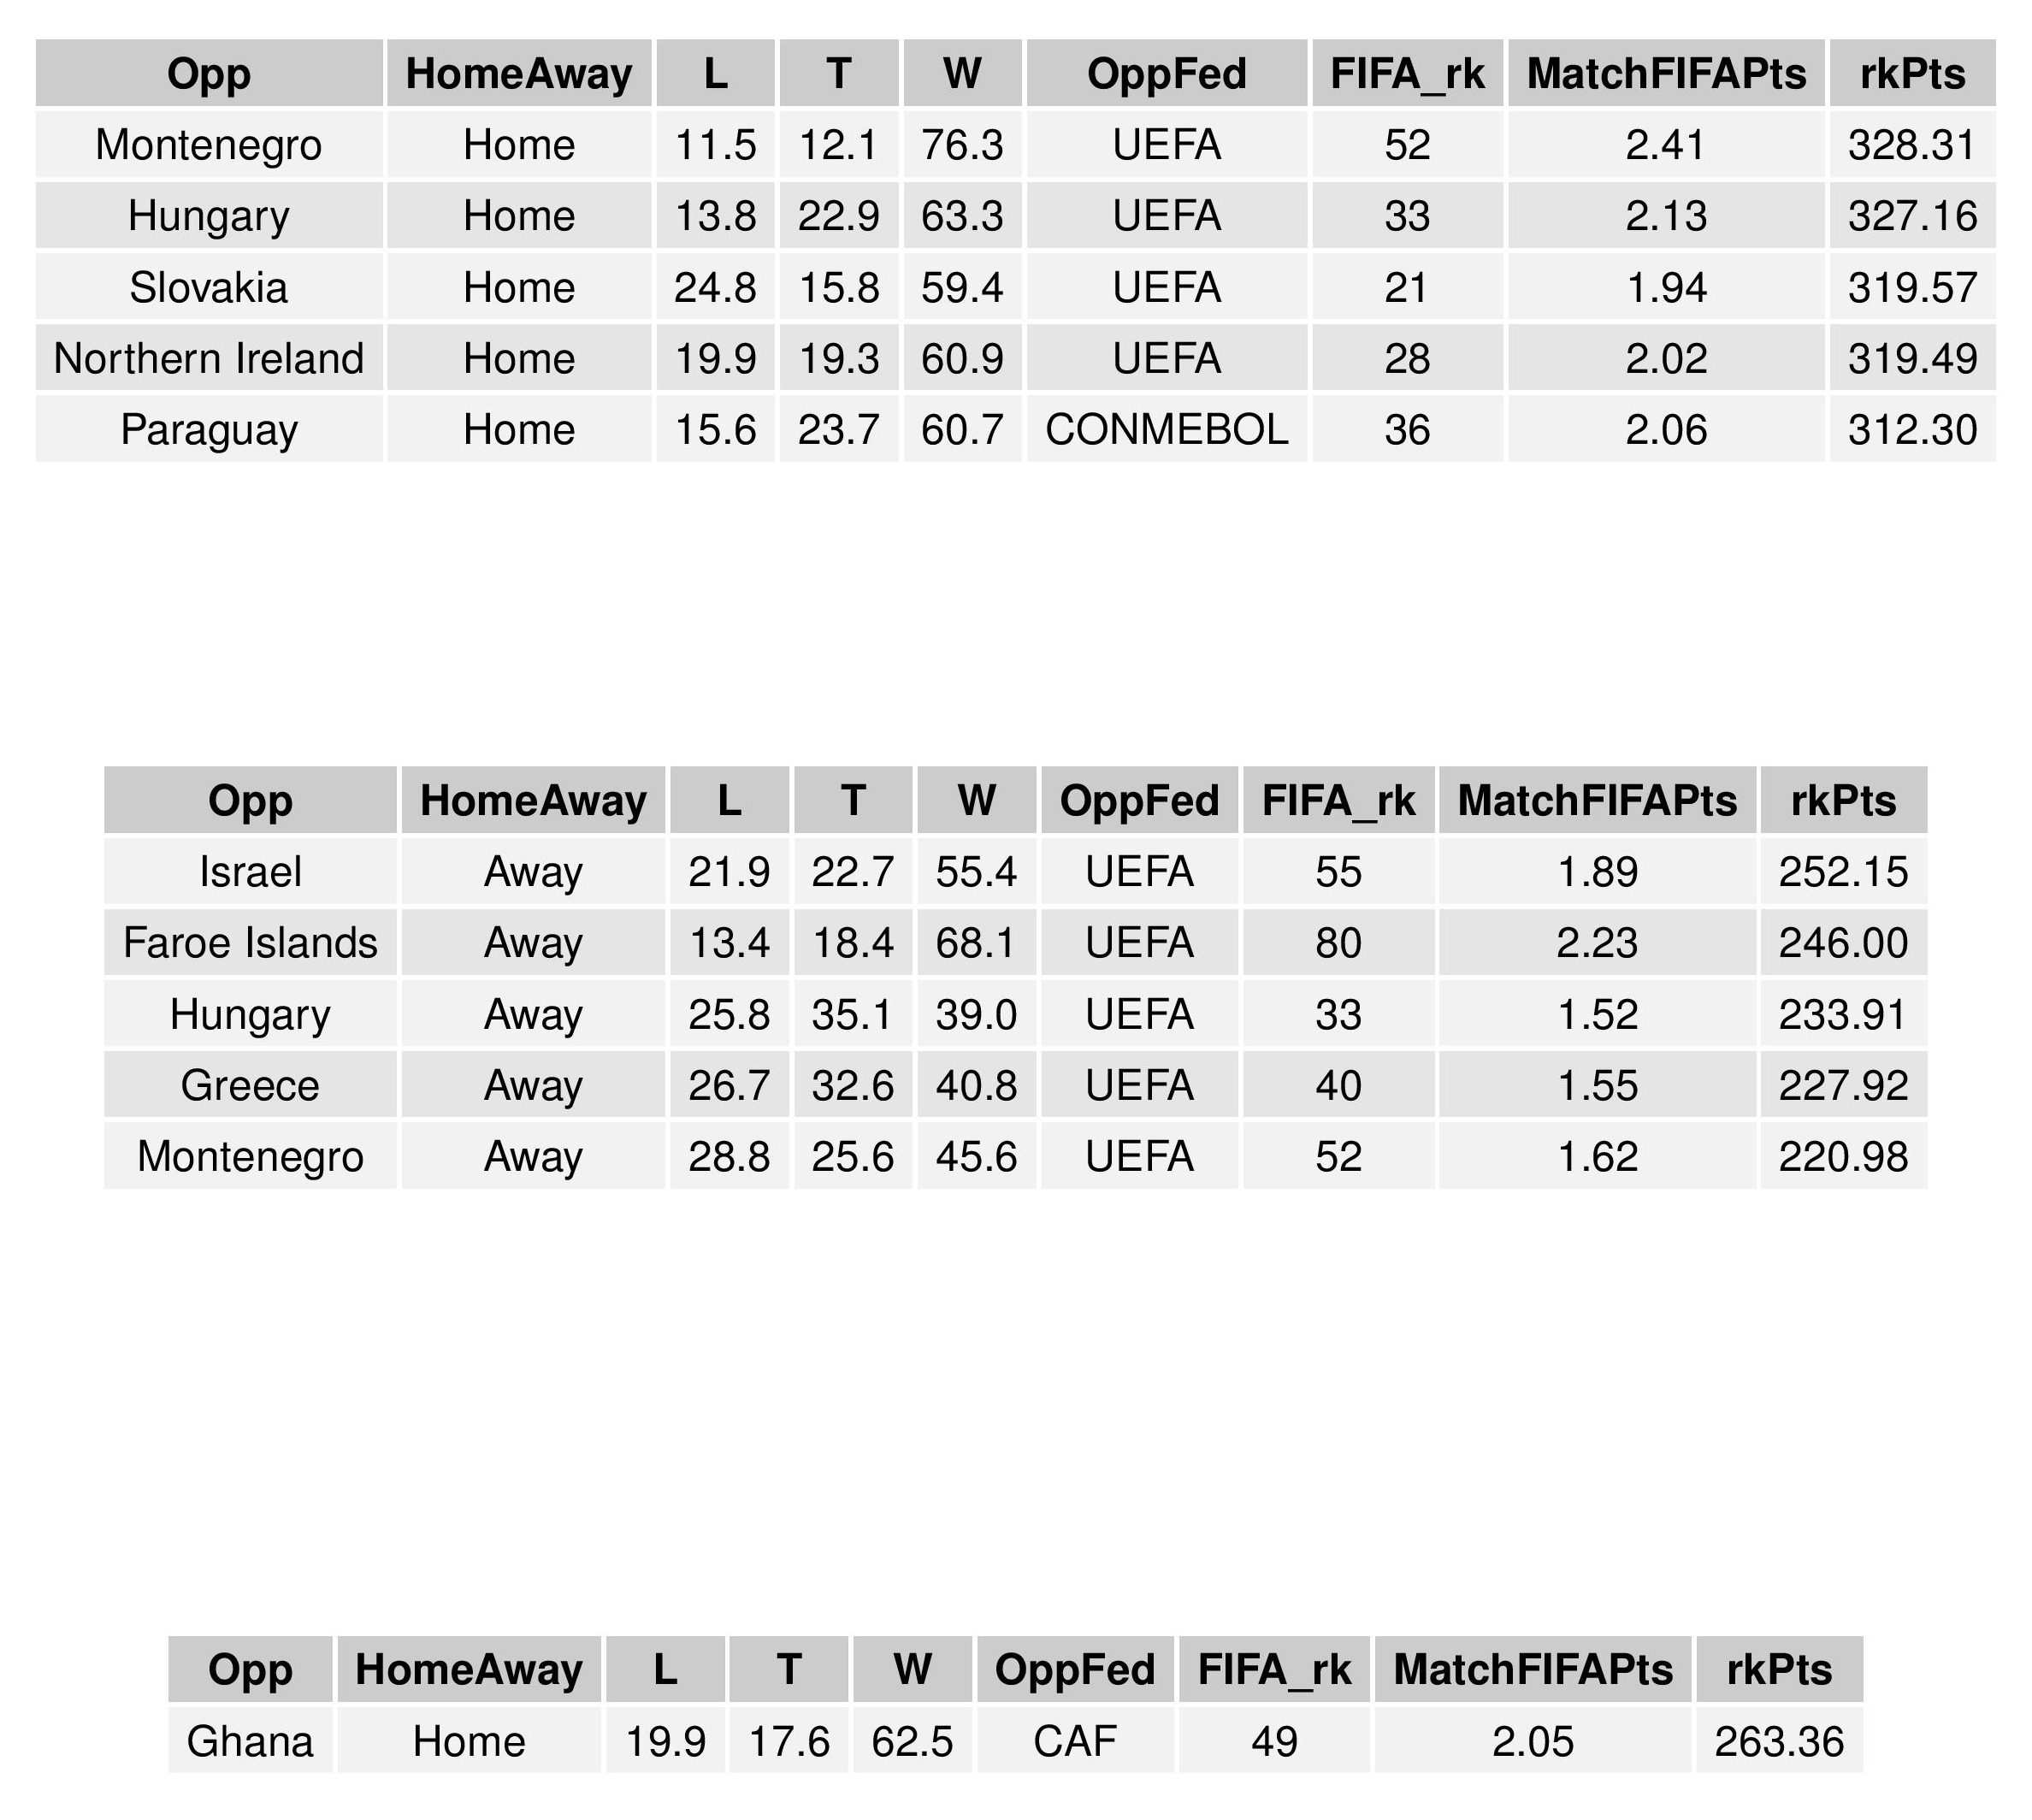
The following shows, if the USA wanted to schedule its friendlies to best manipulate the FIFA ranking system, who they should schedule against. The top table shows home matches, which are inherently the best choice for manipulating the FIFA rankings system. The second table shows, if the USA needs to schedule away friendlies, who they should schedule against in that scenario. The third table shows the current USA scheduled matches.
The MatchFIFAPts are 3-times-win-probability + draw-probability. rkPts represents the average expected points the USA might receive within FIFA’s point system for their rankings.
Scheduled USA Matches
Finally, the following shows the probabilities of results for upcoming USA matches.

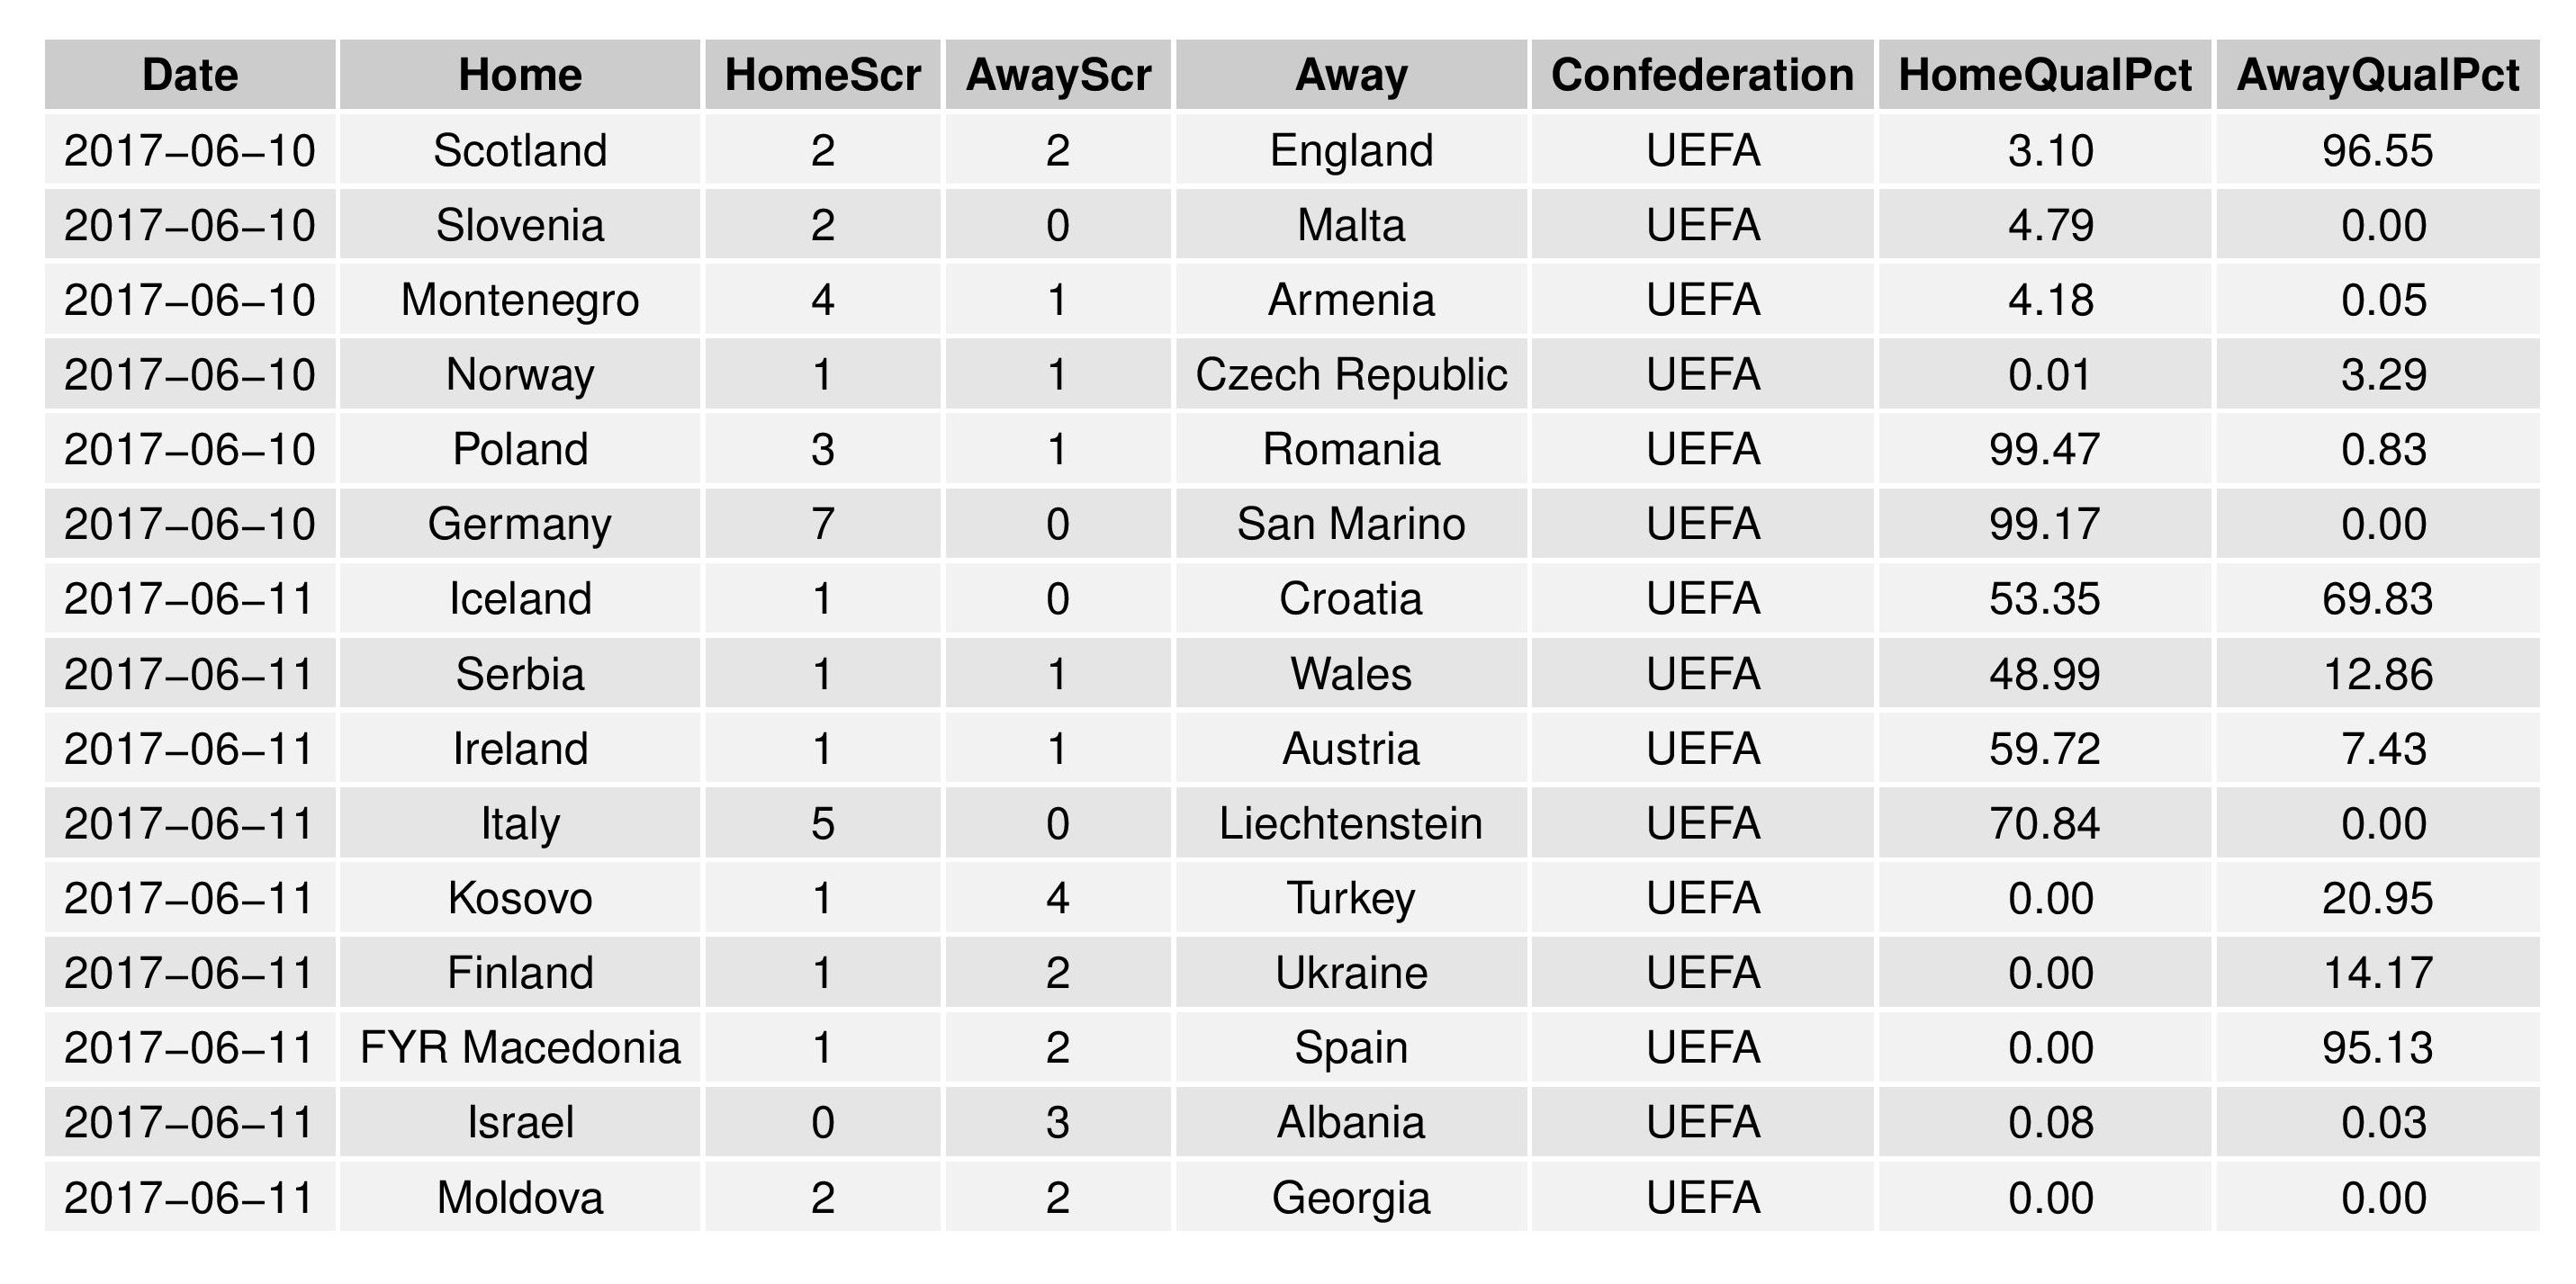
World Cup Qualification Results
The following just shows the most recent World Cup Qualification matches included in the model by federation, accompanied by their current qualification odds.
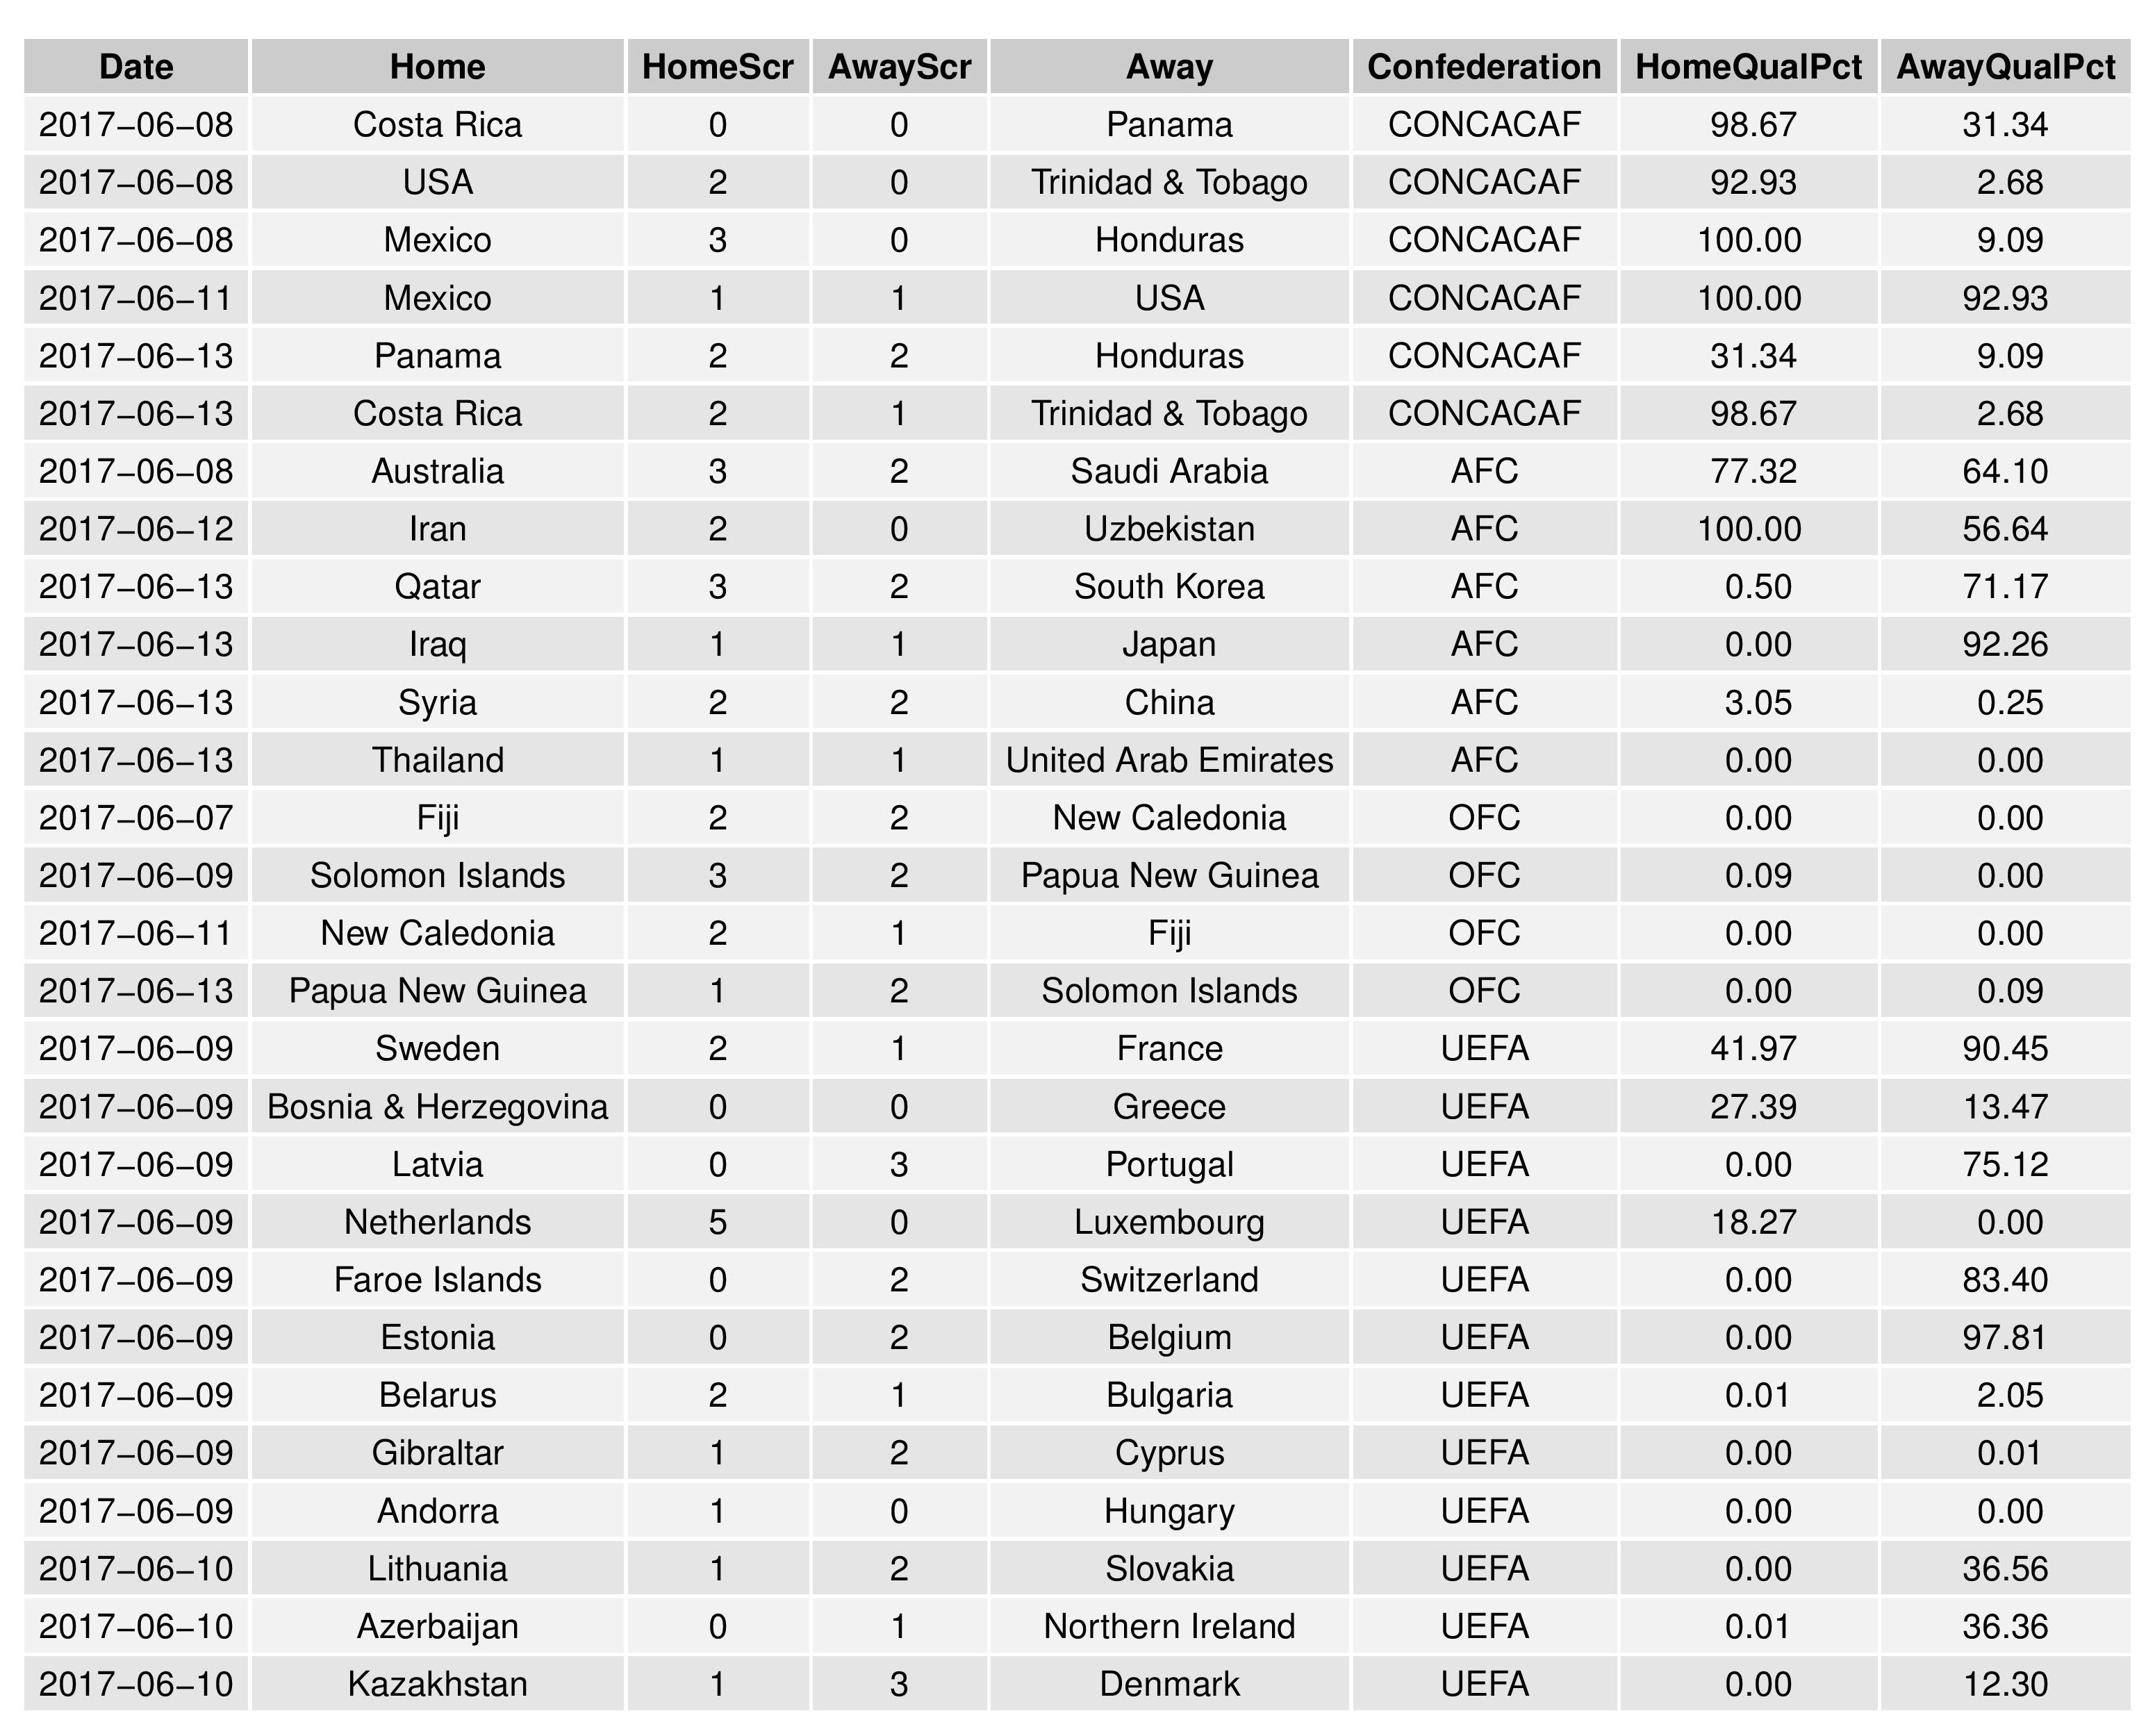

Interesting the difference between the US and Panama qualifying for Russia despite the fact that they are only 1 point (and 3 goals in GD) apart.
.
Also interesting that Mexico is listed at 100% to qualify but don’t yet have a Q by their name.
With regards to the US/Panama odds difference:
1. The model considers the USMNT to be considerably superior to the lower-3-hex teams (before the hex began, it had Panama at 25% odds with the fourth-best chances)
2. USA had a harder early schedule than Panama and therefore will have a lighter late schedule. Other than a shared Home Costa Rica match:
— The US remaining games are Away Honduras, Away Trinidad & Tobago, and Home Panama.
— Panama’s remaining games are Away Mexico, Away USA, and Home Trinidad & Tobago.
##########
As for Mexico, they haven’t mathematically clinched yet (I double-checked and found a scenario), it is so improbable that they will drop out of the top-3 that it did not occur in any of 10,000 simulations. The fact is that they are a strong team with a huge lead in World Cup Qualifying and a easy CONCACAF qualification format, so they’re pretty much locked in.