This is largely a ‘quick’ update on how the results of the USA vs Panama (and other World Cup Qualifiers around the world) impacted the projections.
Below are the current forecasts using data from matches through March 29, 2017.
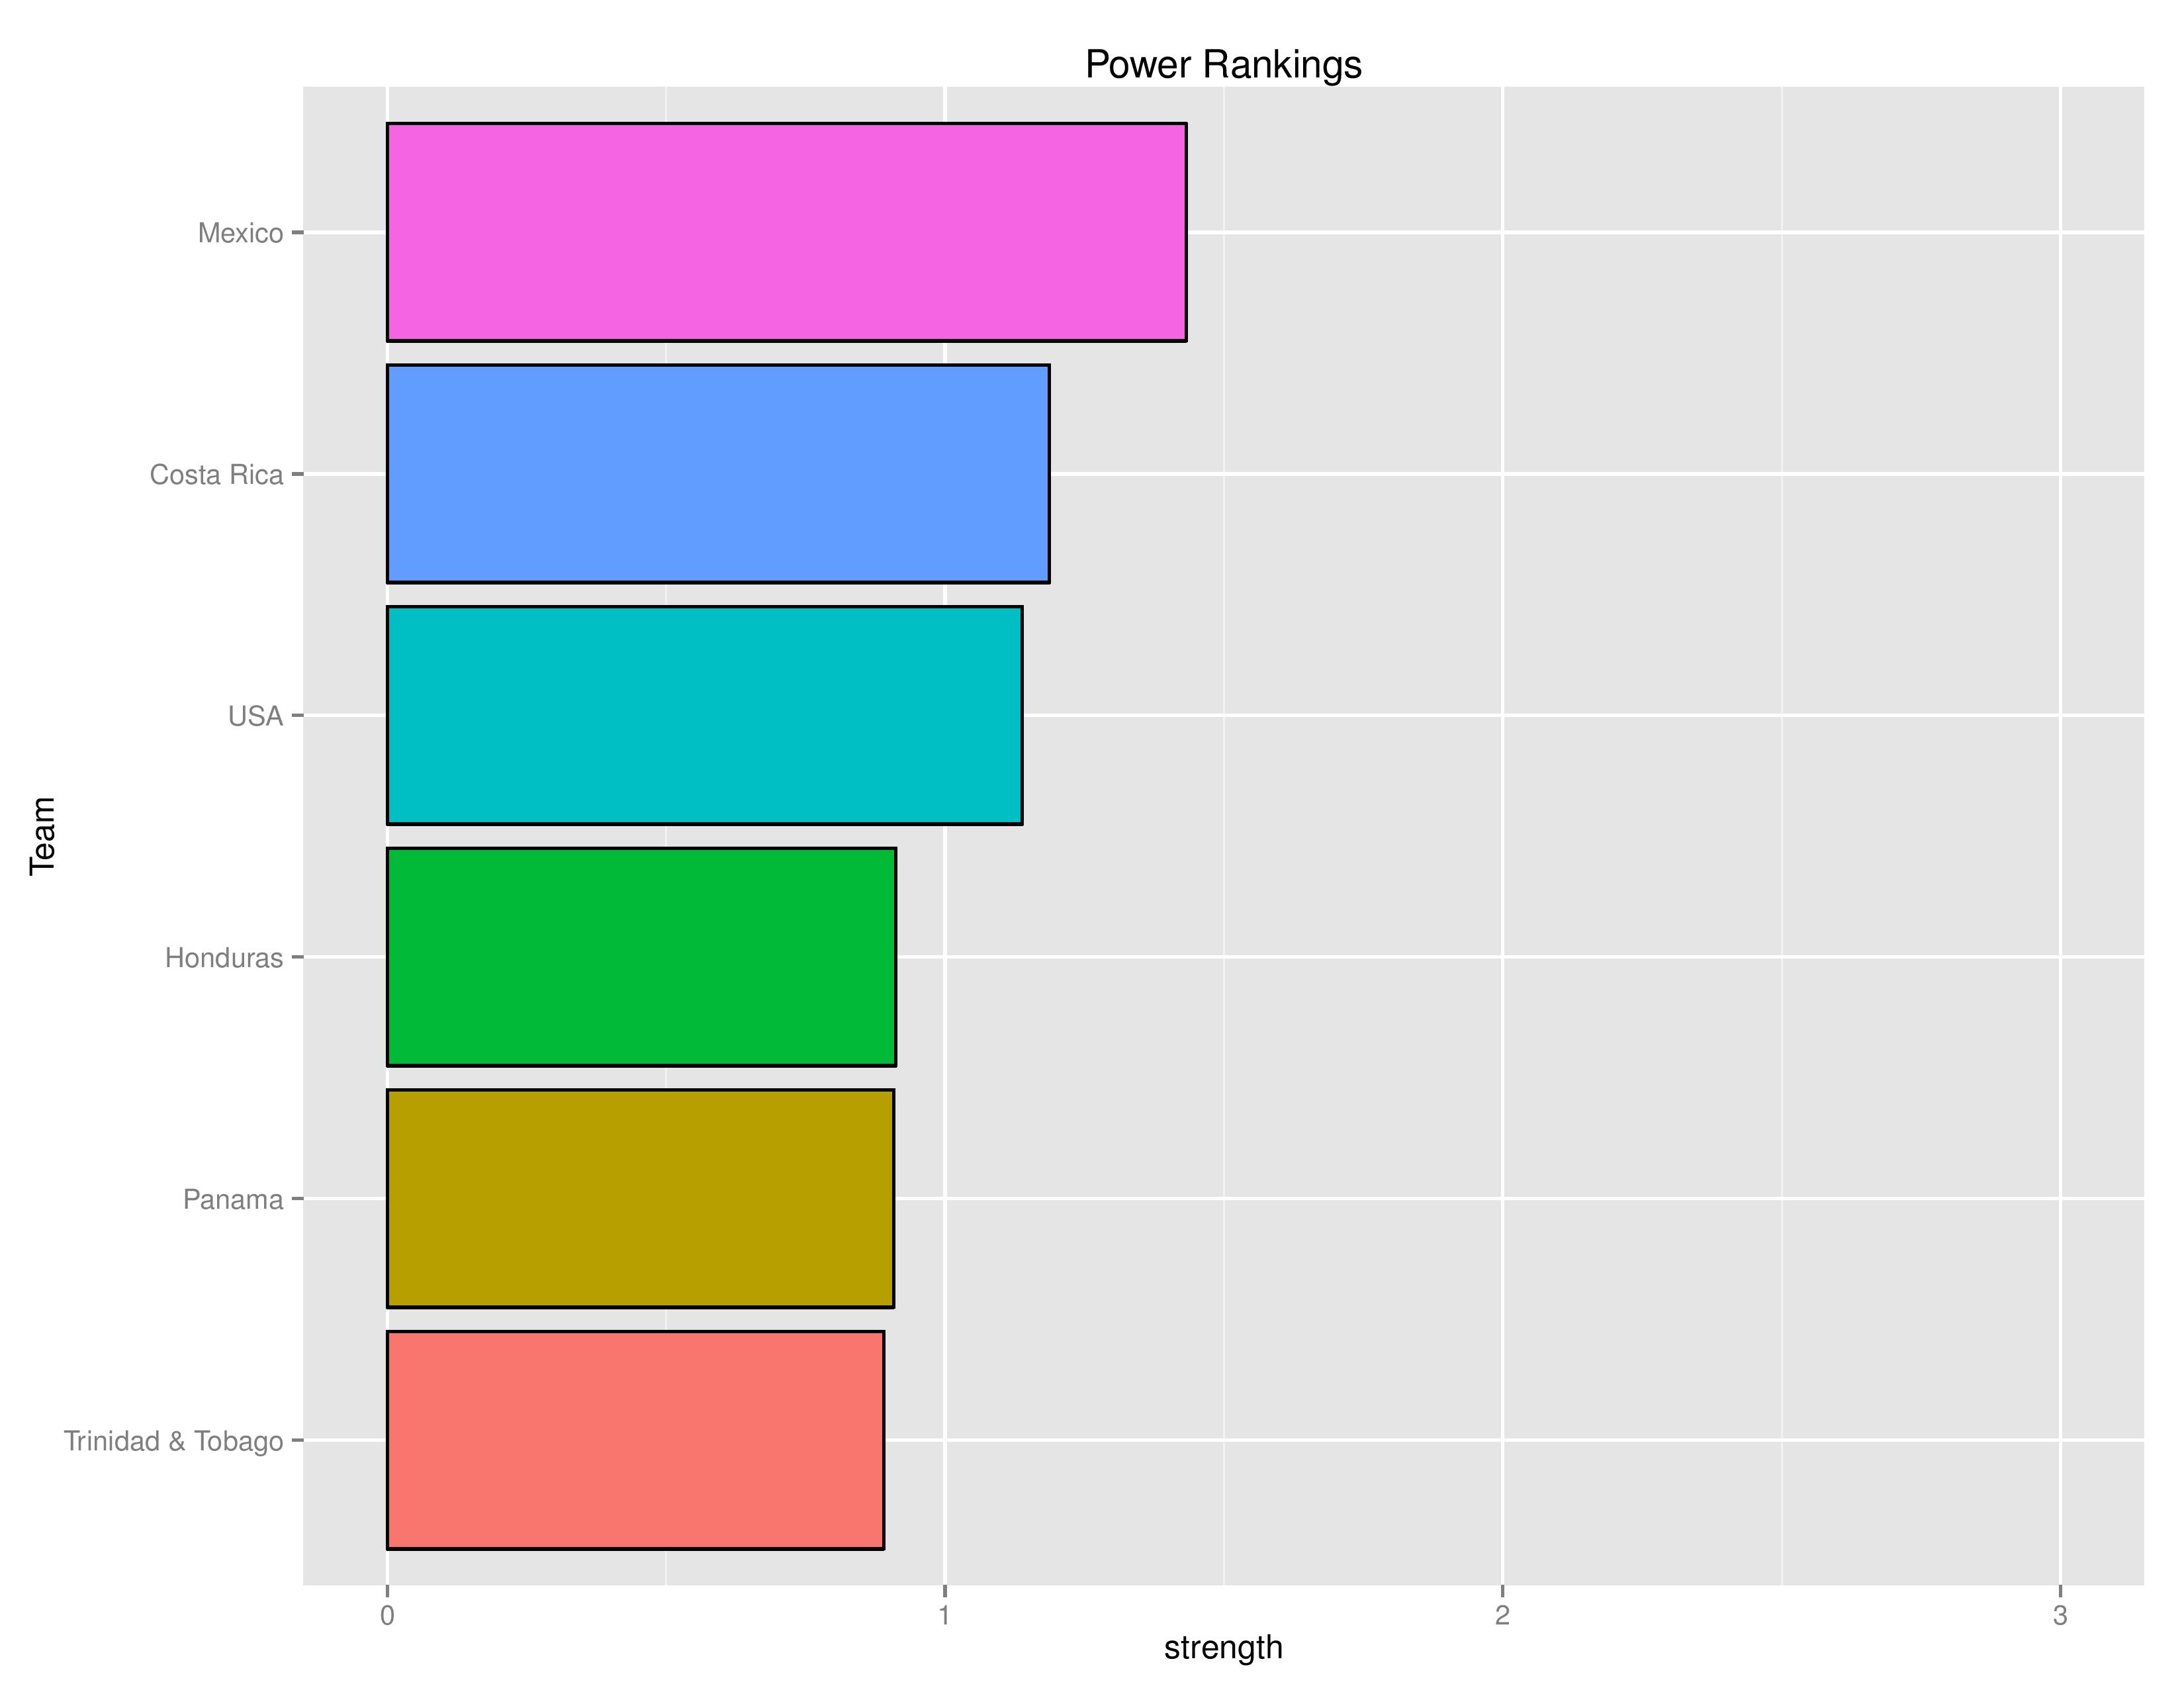
Hexagonal Power Rankings
The “Power Rankings” we concoct are the actual “strength” of the team according to competitive expectations. The value represented on the X-Axis is the average amount of points we expect that team to receive when playing against every national team that participated in the previous World Cup on neutral territory:
The following chart shows the average points bonus for a particular nation’s home field advantage. This is important in explaining why teams may seem to have favorable odds to qualify even when ranked lower.

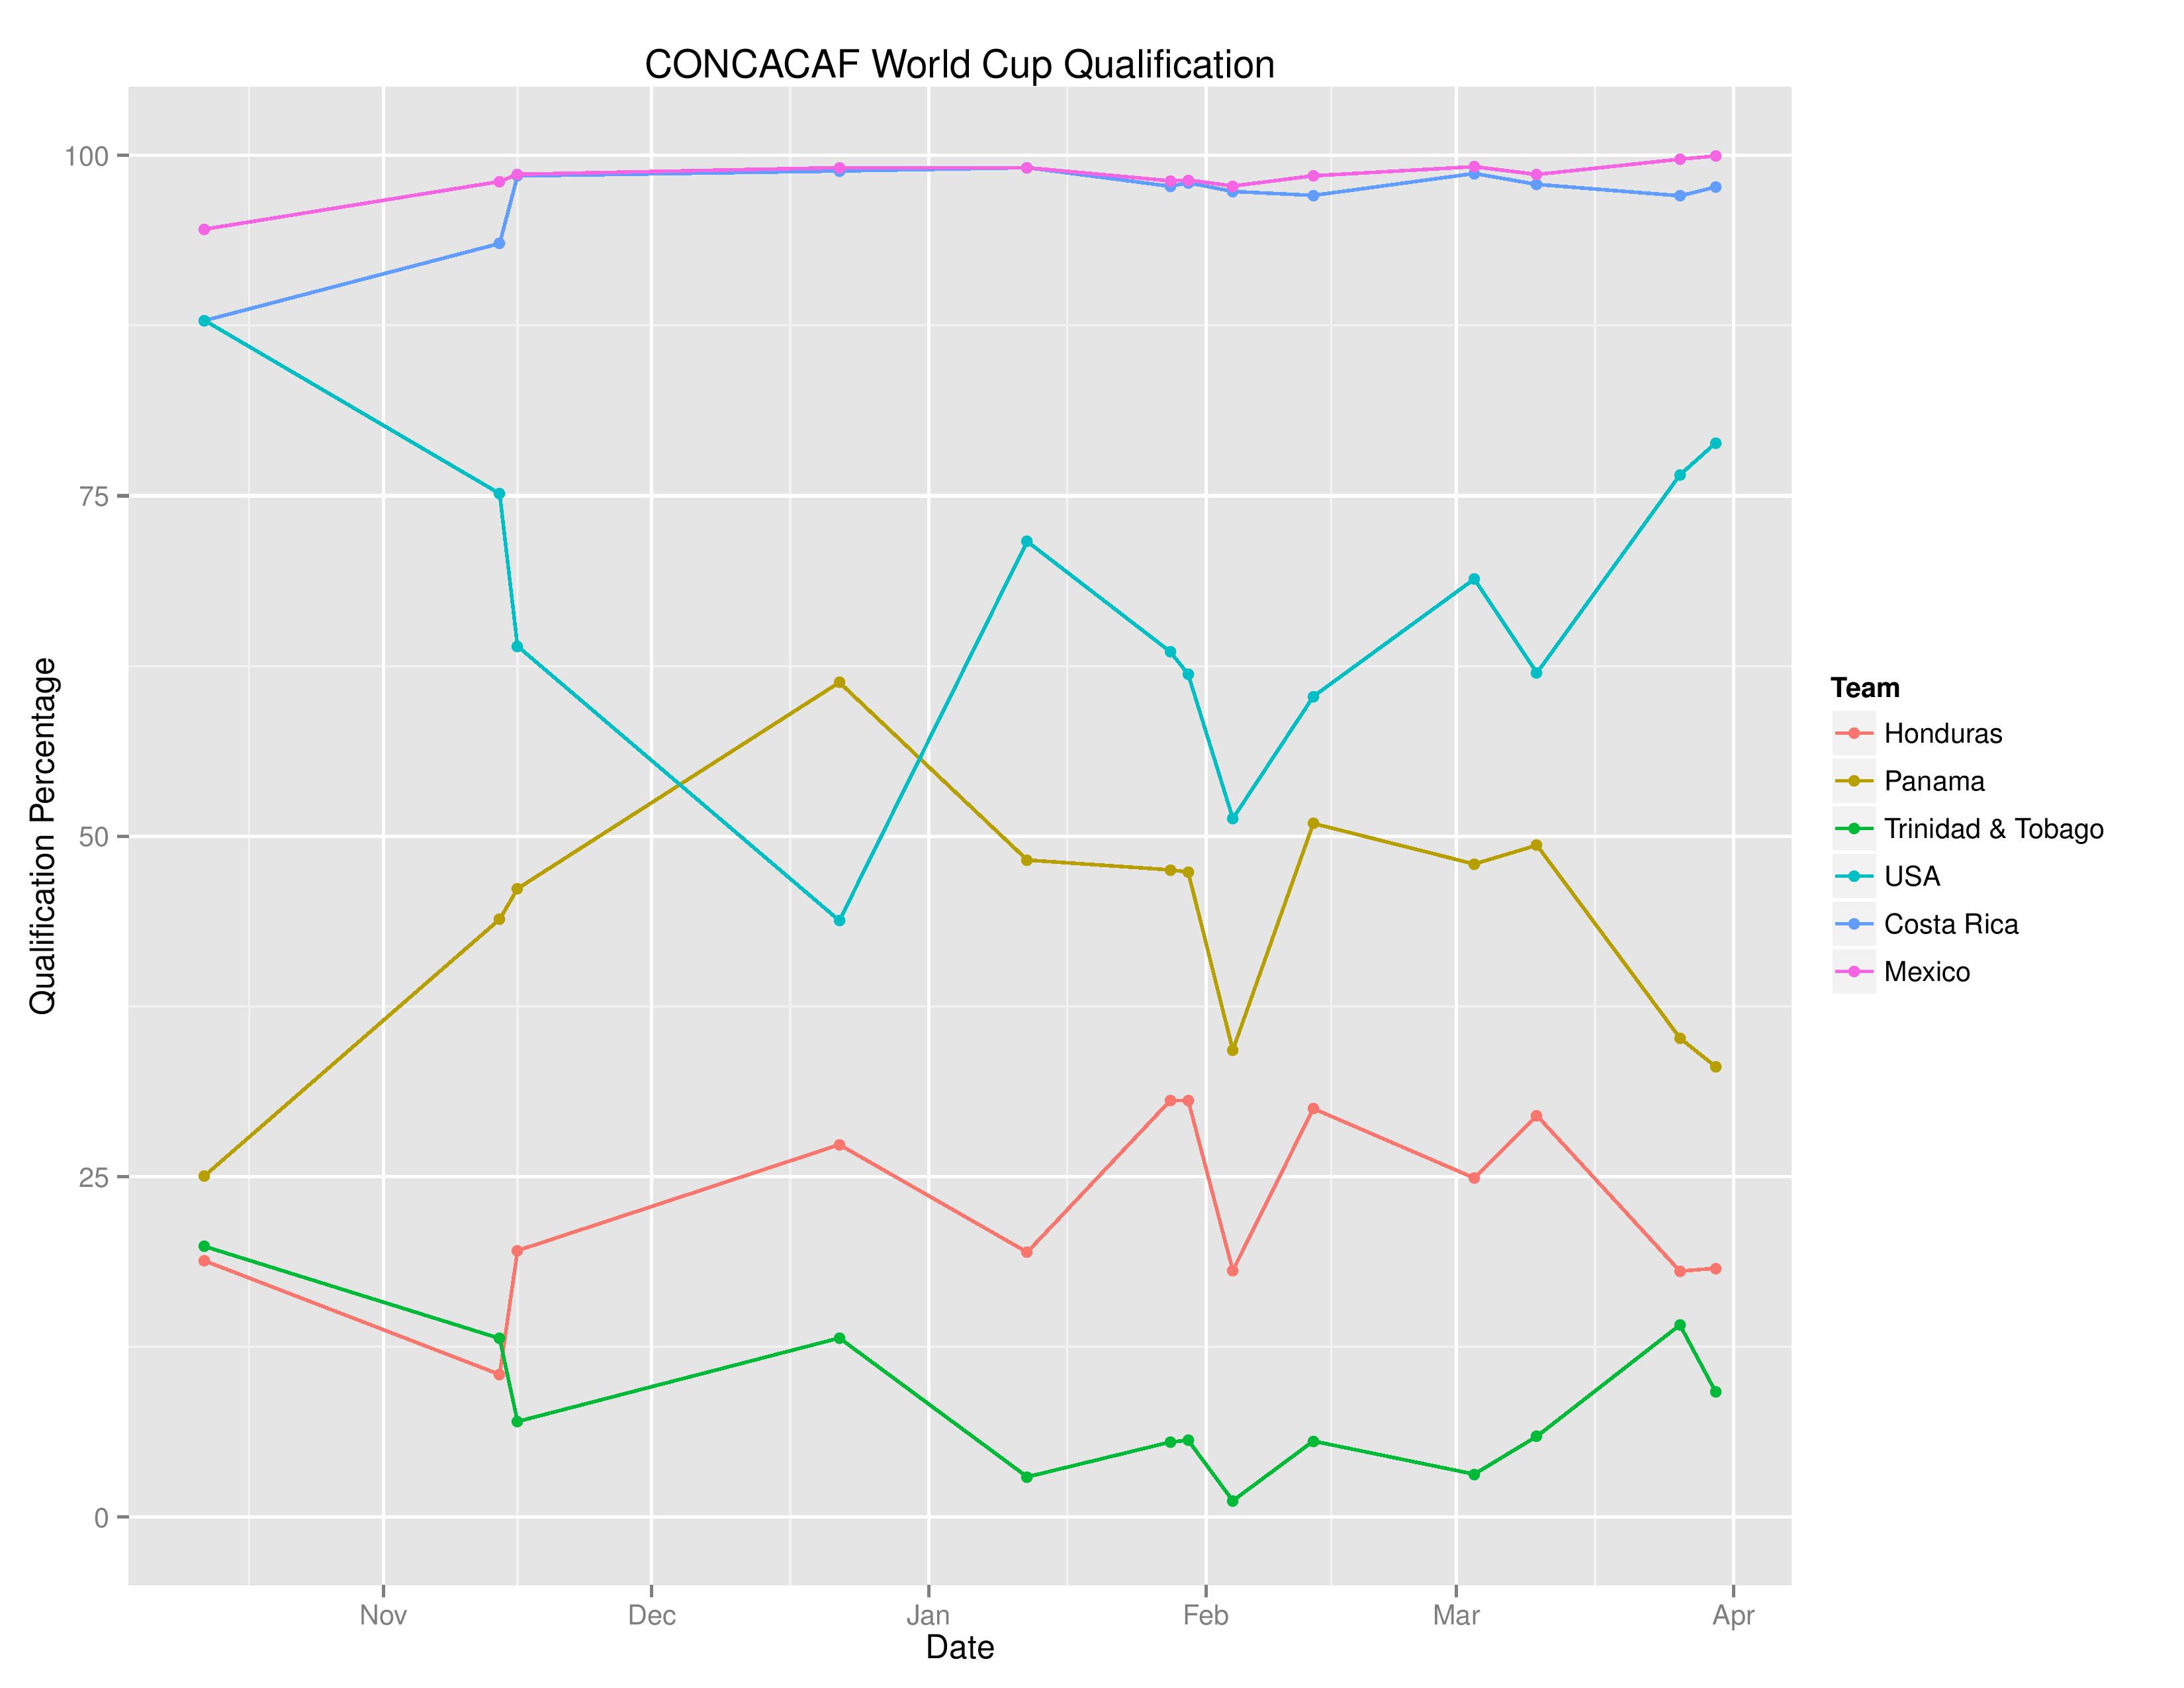
Probability Outcomes
The US has increased their chances of qualifying for the World Cup from 76.54% to 78.88% with the draw against Panama.

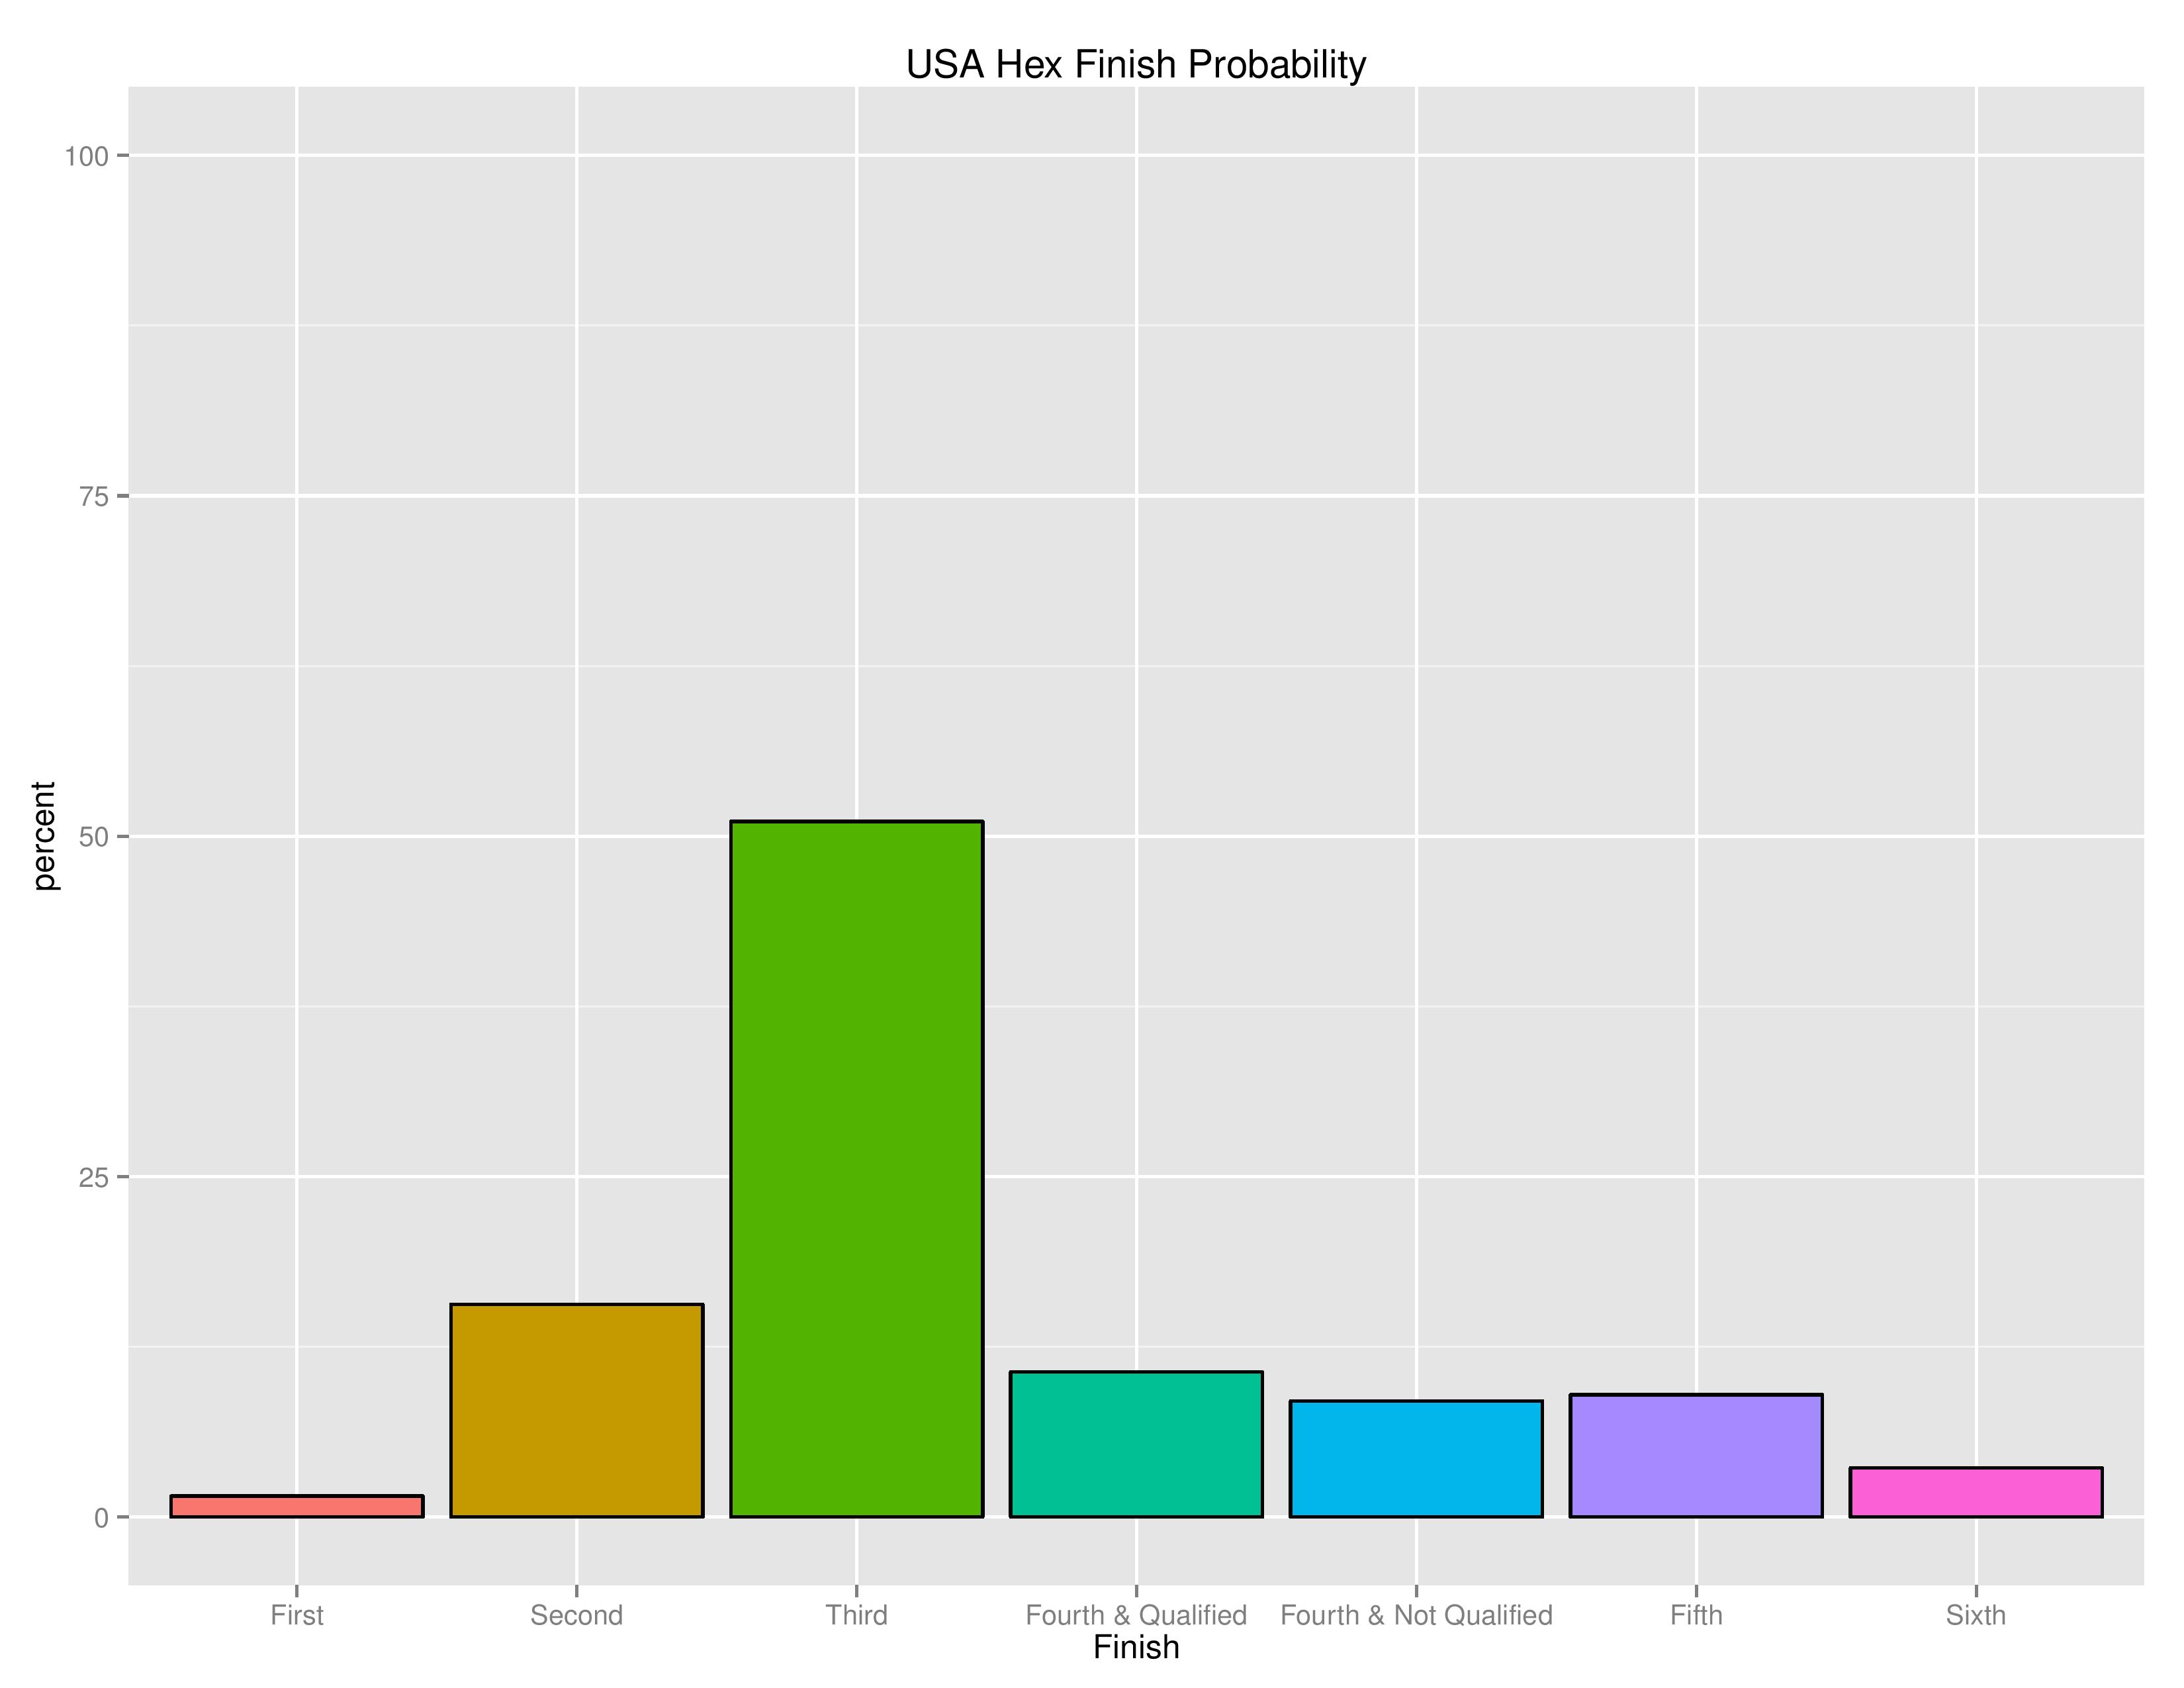
The next chart shows the probabilities of USA’s potential Hex finish.
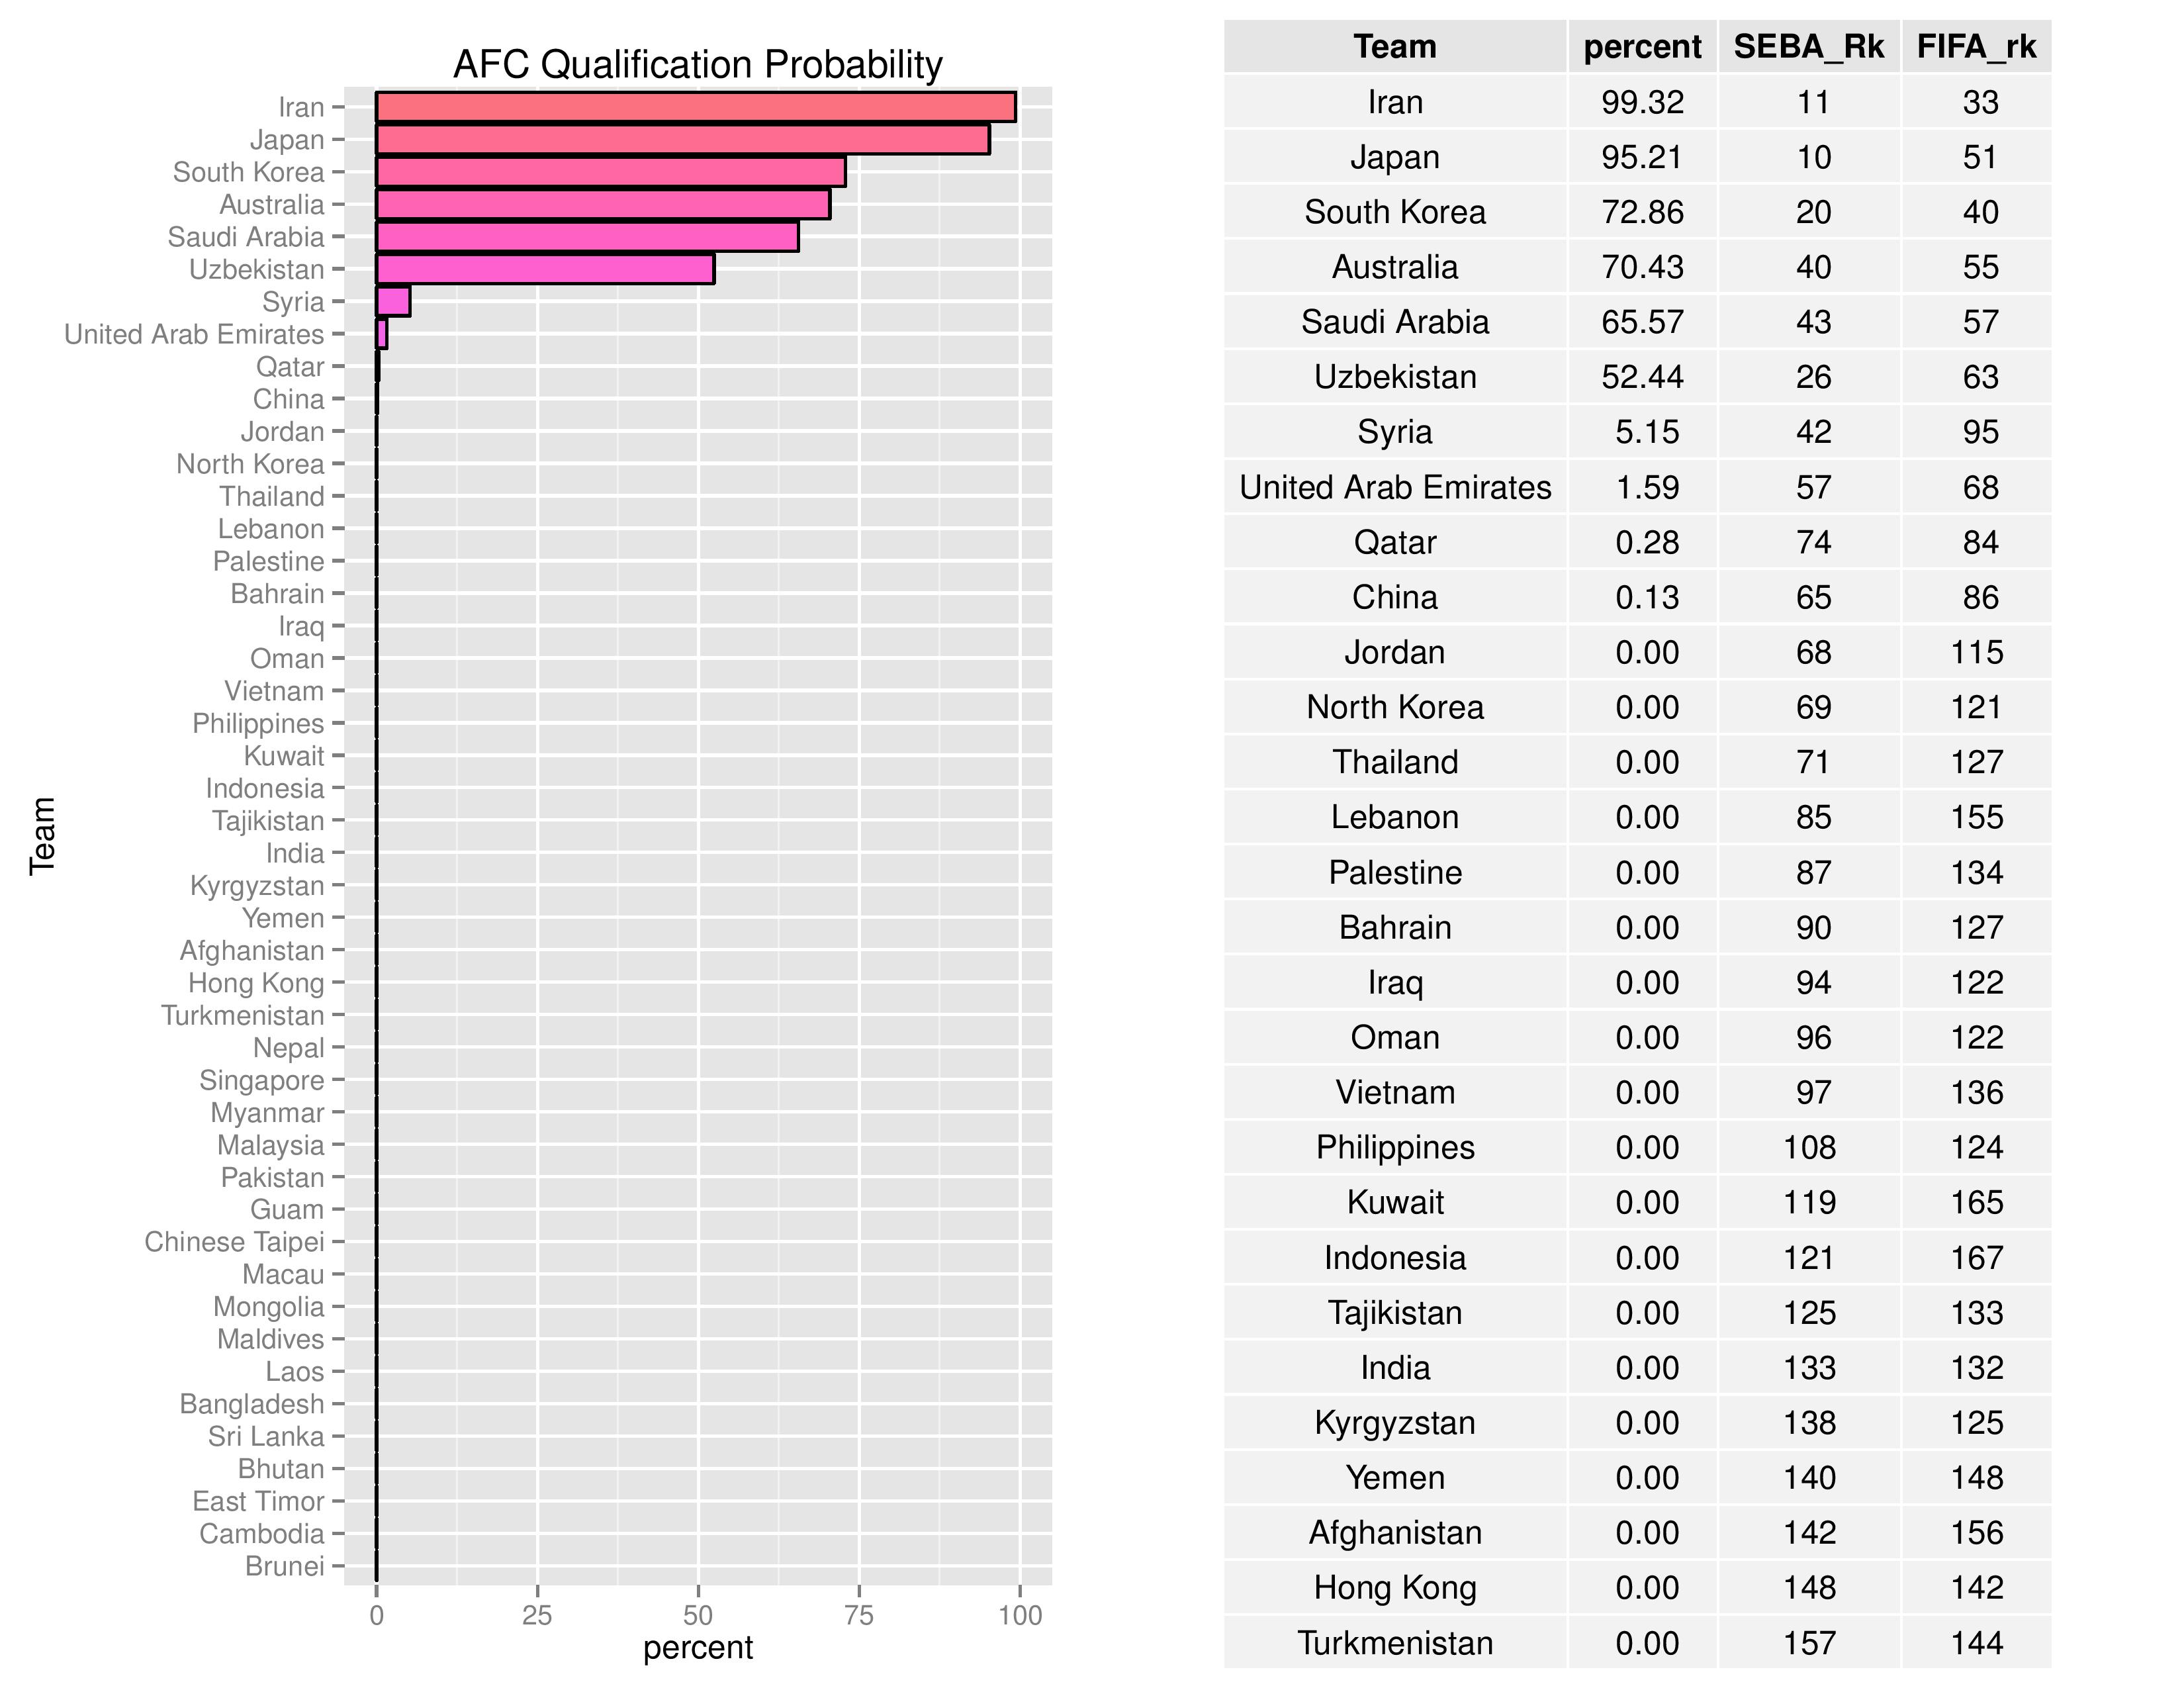
The following chart shows the likelihood of the AFC opponent for the inter-confederation opponent (4th place CONCACAF vs. 5th place AFC).
In talks I’ve had with casual US soccer followers, many people think of this like the last World Cup cycle, where Mexico had to play the weak OFC leader to qualify. I strongly recommend people not take the AFC as lightly. Placing in 4th in the Hex would not leave the USA in a strong qualification position.

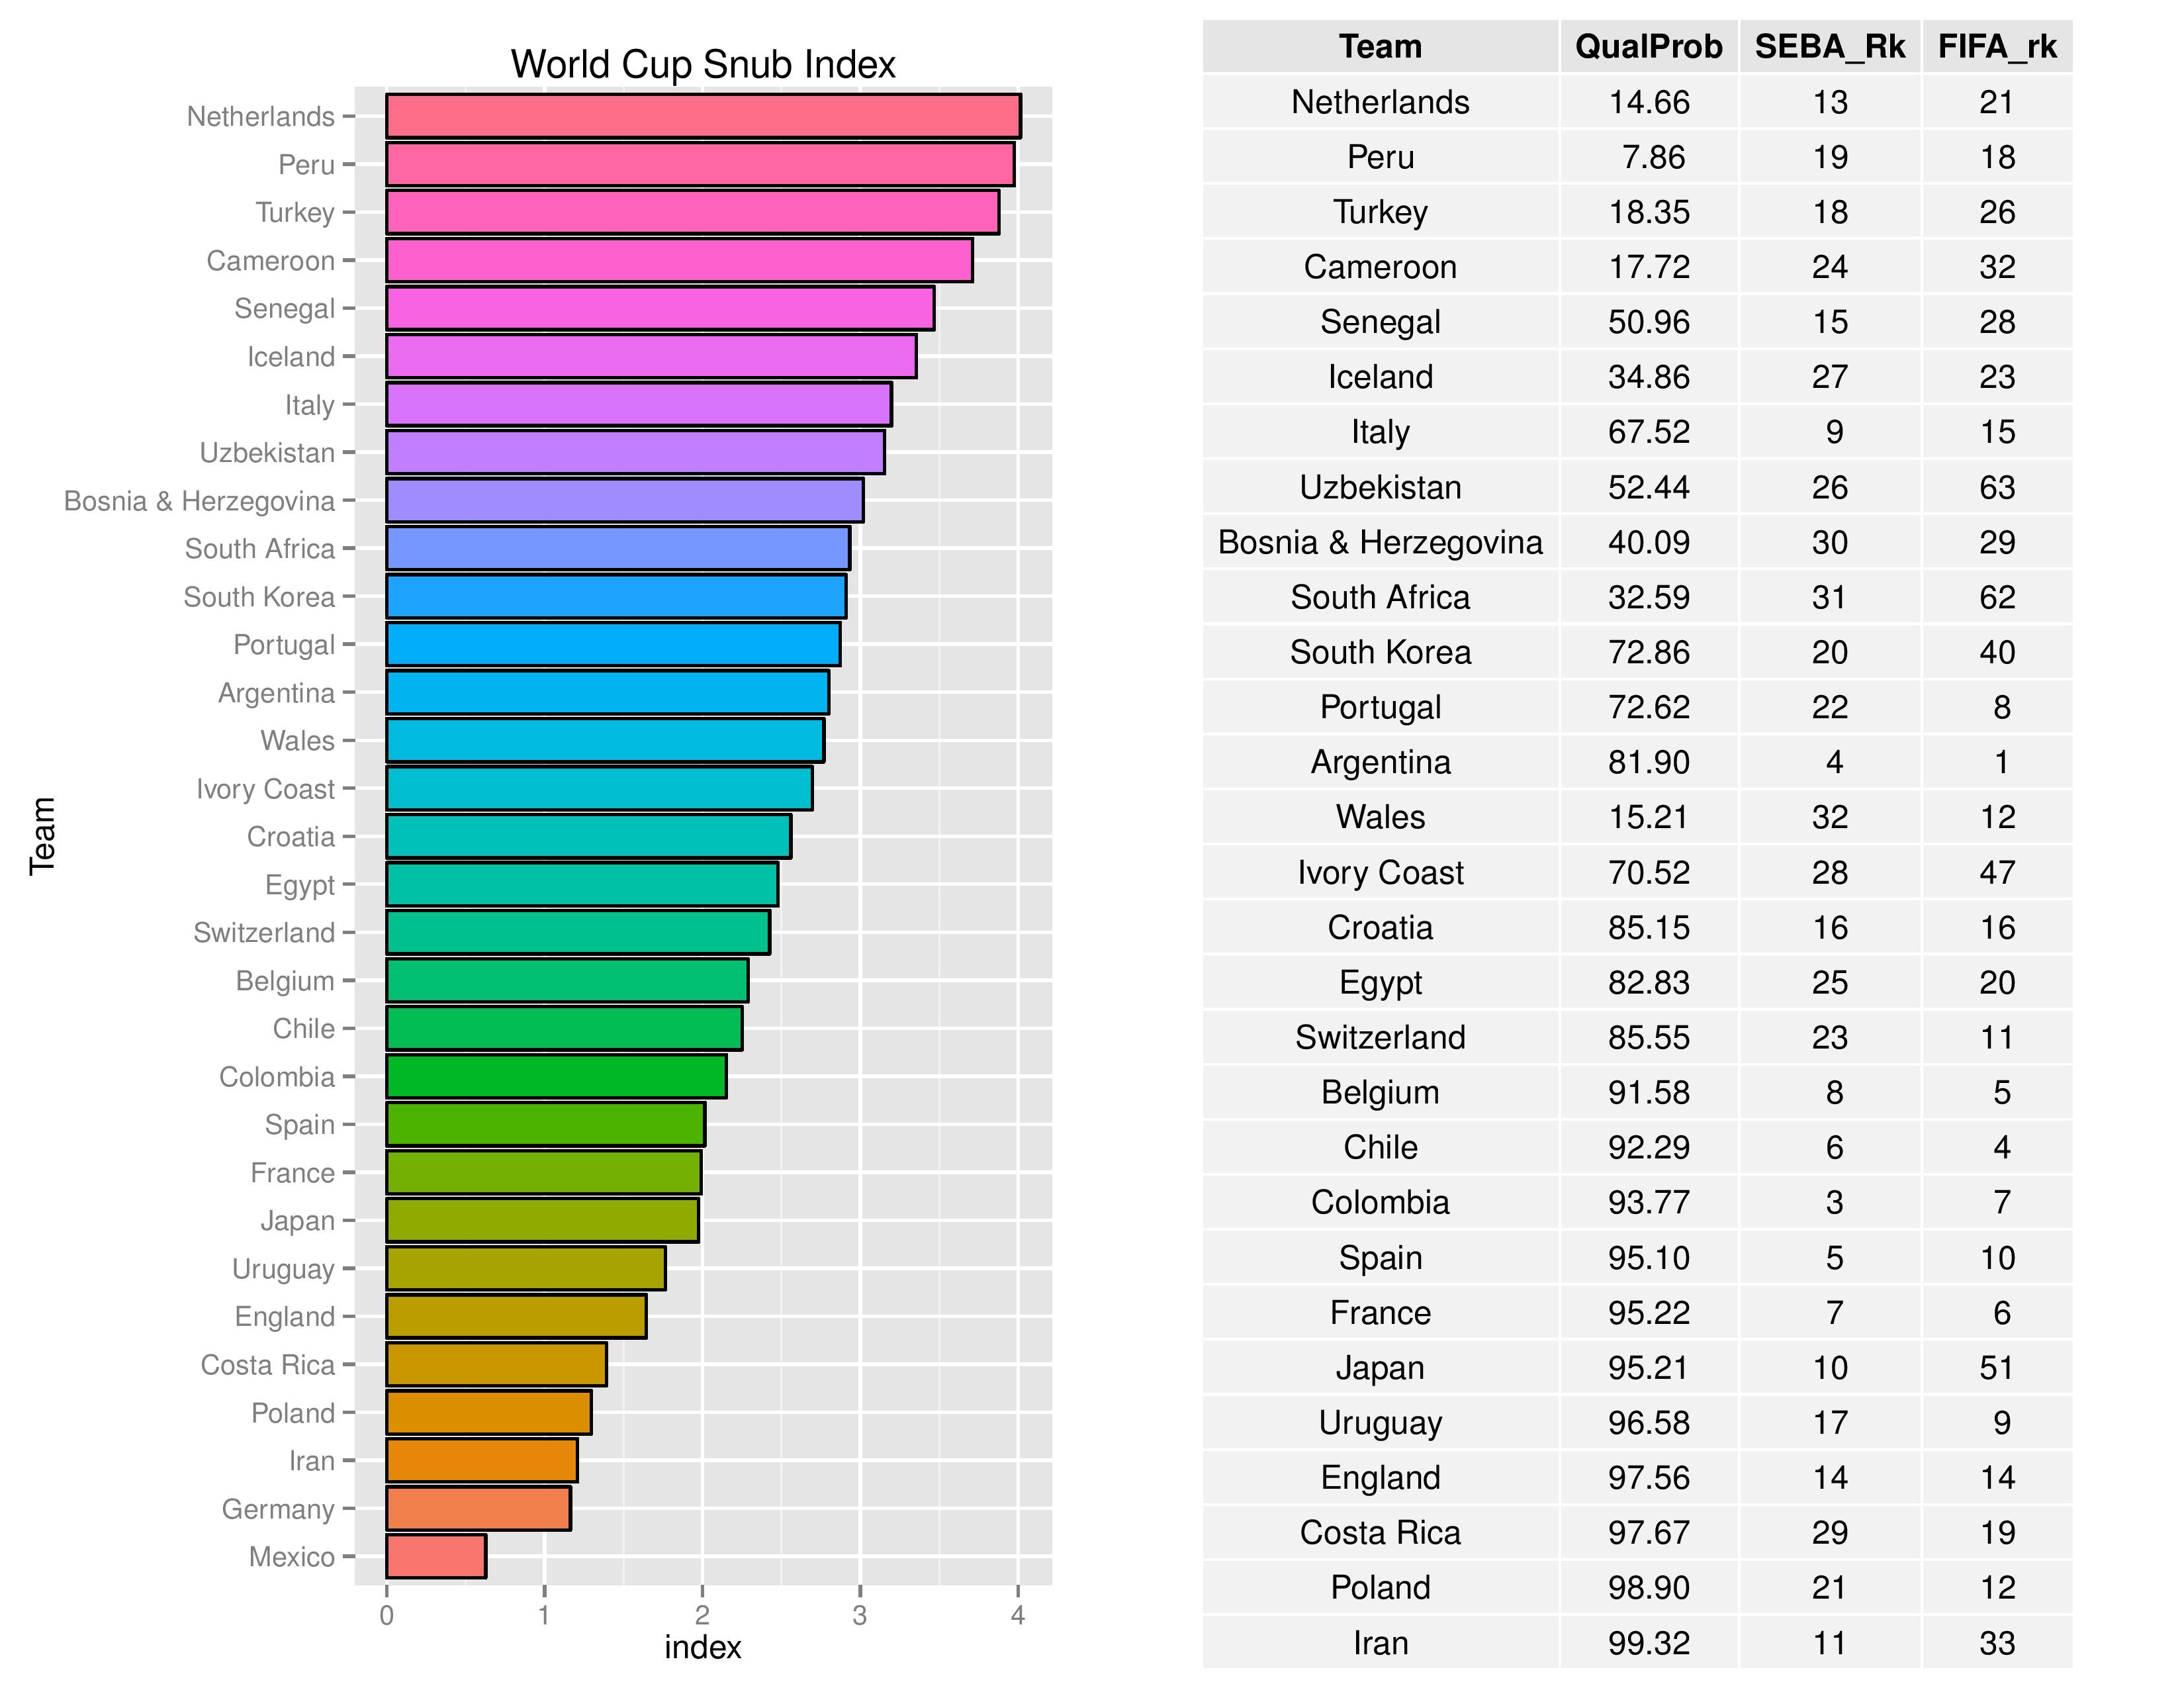
The following chart shows the “Snub Index.” The idea is based on, if the World Cup were to be a tournament for the 32 truly-top teams in the world (at least according to SEBA), then this chart is sorted by how unfortunately damaged the top 32 teams’ chances are in qualifying for the World Cup (the table shows only the top 29 teams but the graph shows all teams with a chance).
The USA is not in this chart because they are not currently quite among the top 32 teams according to SEBA.
On the other side, this chart shows the nations outside of the top 32 who, perhaps unfairly, benefit from an imperfect qualification system and are ranked by their benefit (the table shows only the top 29 teams but the graph shows all teams with a chance).
The USA are currently recognized as the 10th “luckiest” national team, as they are rated as the 35th-best-team and still have about a 79% chance of qualifying.

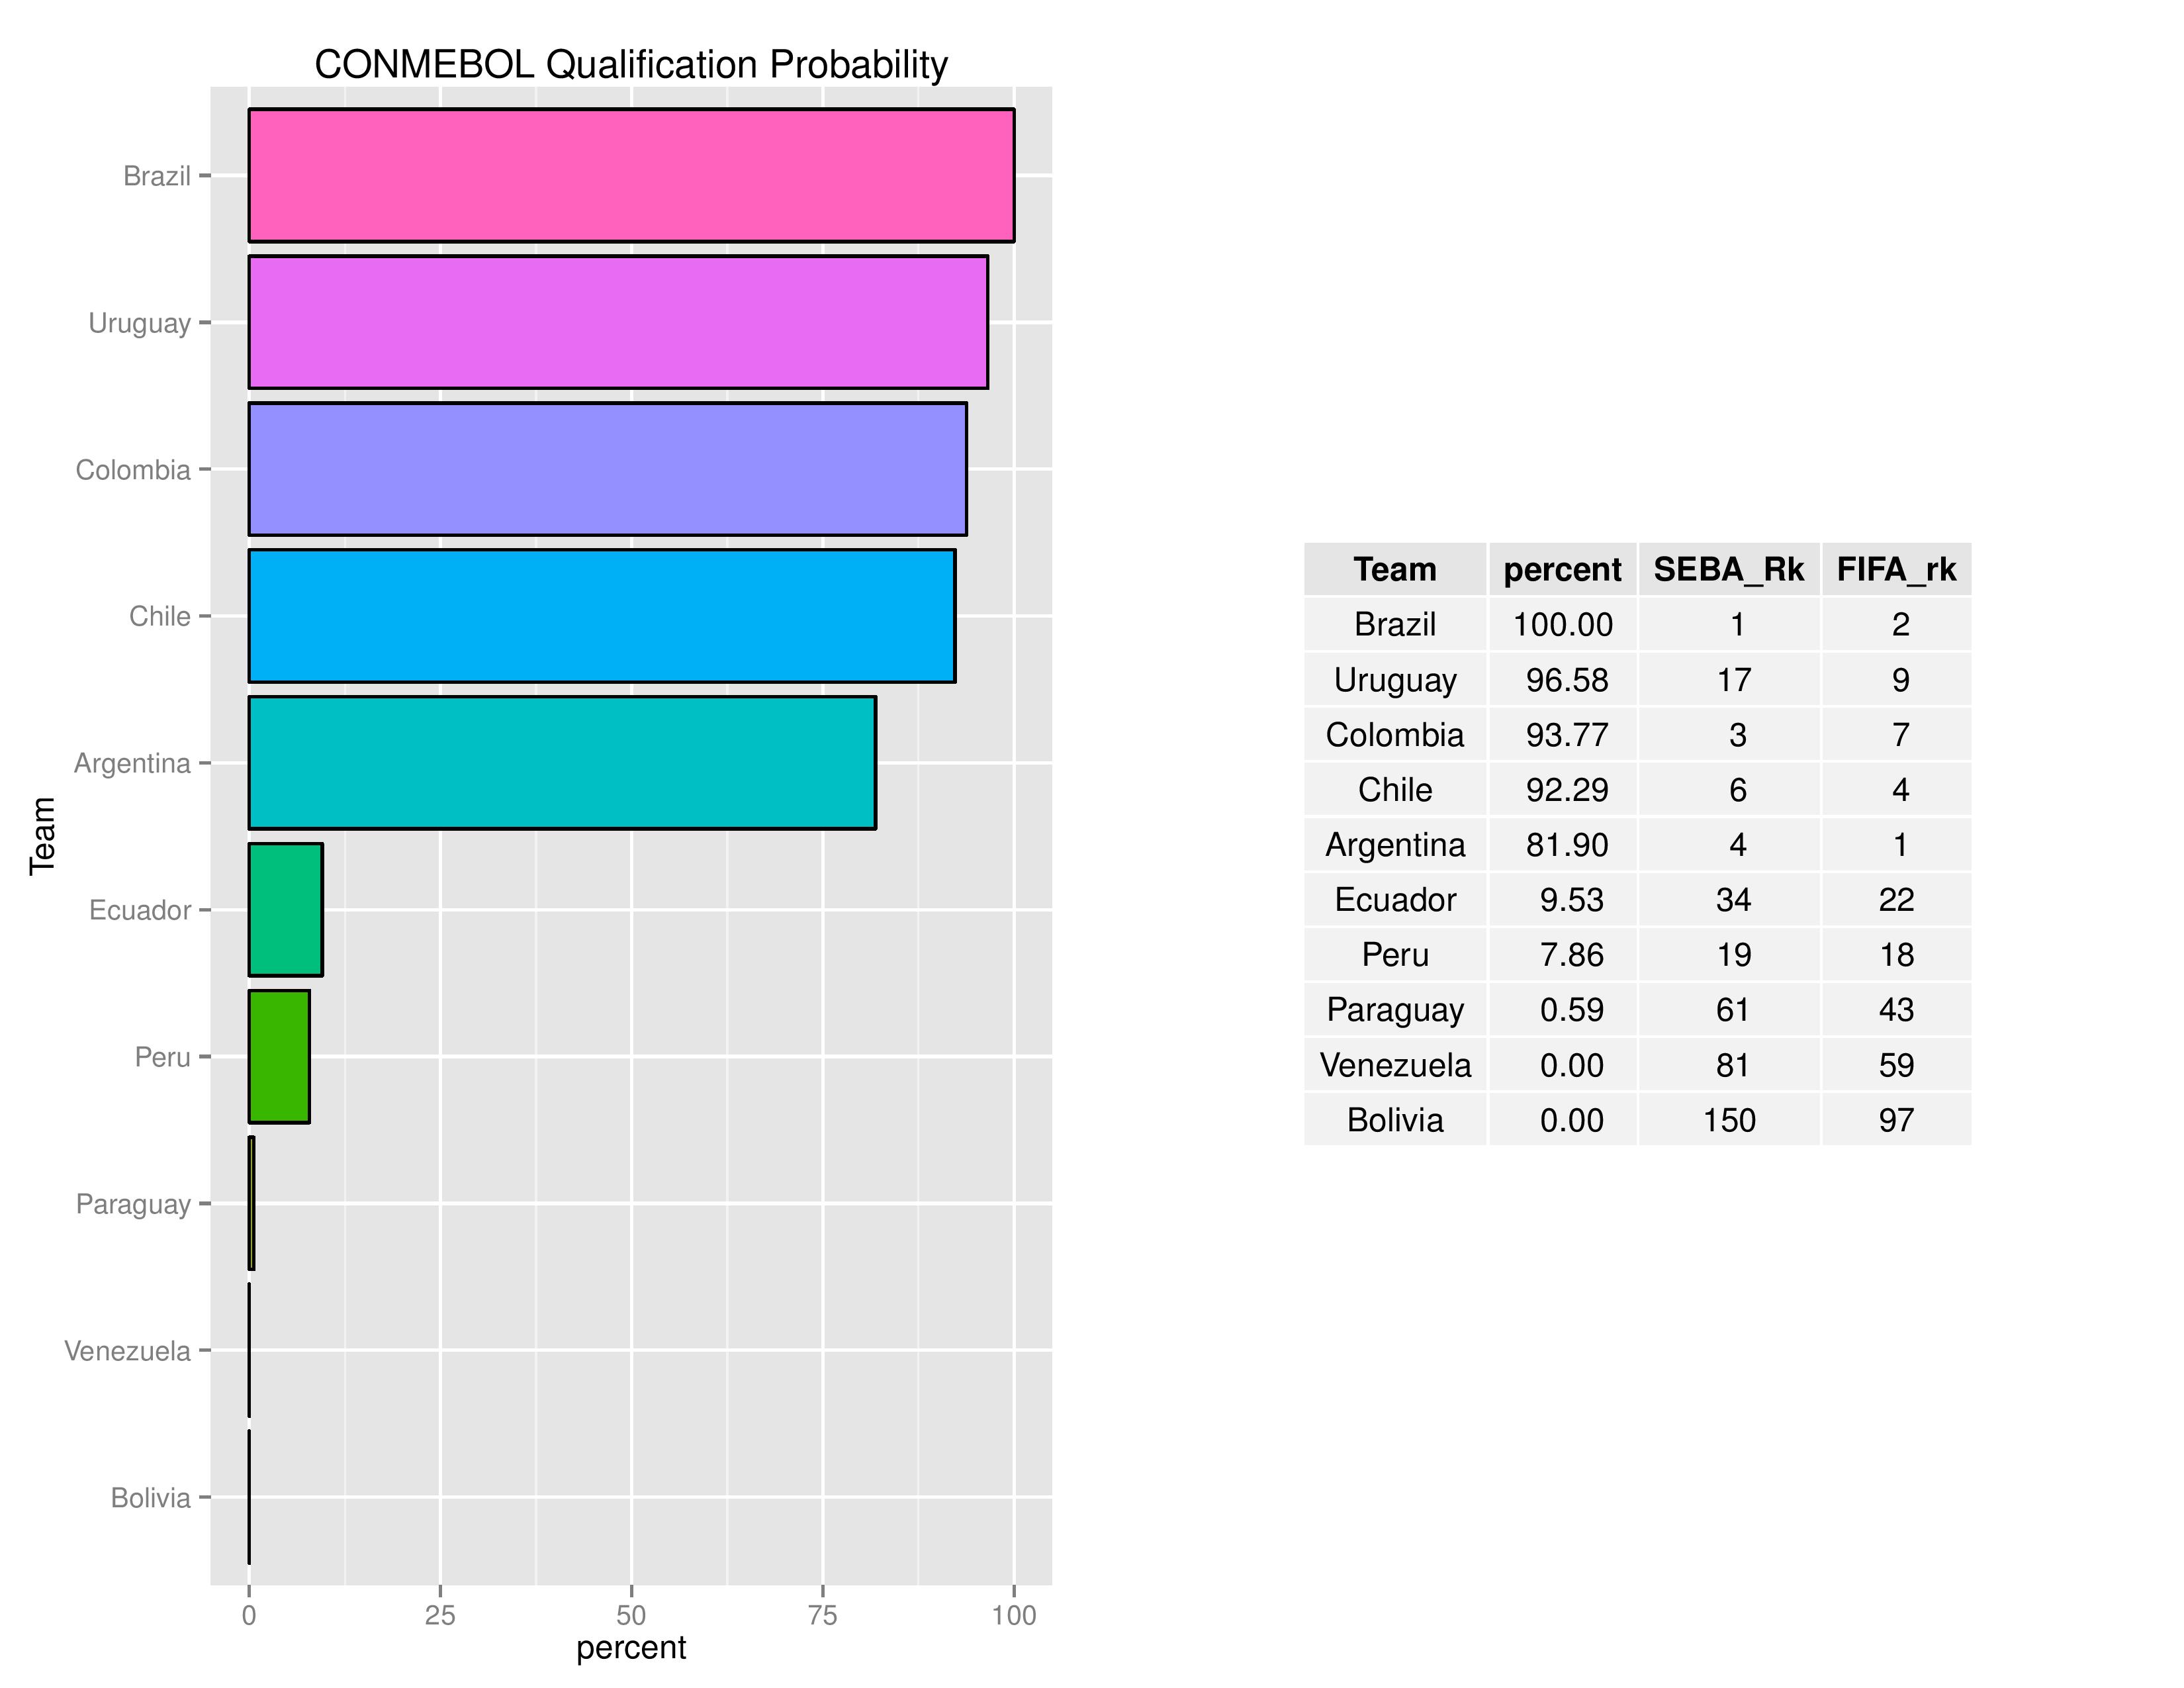
The next charts show the probabilities of other confederations qualifying for the World Cup.


So… I went a little crazy over the MLS off-season and I decided I wanted to forecast the 2018 World Cup as well. The difficulty with this is that seeding for the groups depends on the FIFA ranking system, which means I would need to forecast every team’s rank to determine the “Pot 1” teams.
For those who don’t know, Pot 1 in the World Cup refers to the host and the top 7 teams according to FIFA rankings. These will represent the Group leaders for the first round of the World Cup. The remainder of the teams in the groups are placed semi-randomly with attempts to avoid over-concentration of teams from the same federation.
For the last World Cup, the October 2013 rankings were the ones deemed ‘final’ before the World Cup draw so I’m now assuming October 2017 are the ones to shoot for. I also don’t have the forecast system perfectly aligned with reality, although it is quite similar. I have not built in the different point outcomes for PK-wins/losses in my FIFA ranking projections and I, obviously, do not have a mechanism for forecasting currently-unscheduled friendlies. However, I have forecasted every scheduled tournament between now and October.
Below shows the simulated ranks for the USA. Summary statistics are below the chart. USA’s most common forecasted rank is 25, but could go as low as 11 and as high as 66. USA’s current rank is 30.

Below is the probability of obtaining Pot 1 status. In the table, we also include the team’s qualification probability (if they don’t qualify, they can’t be in Pot 1), their current FIFA rank, and their confederation for helpful information.
USA did not not make Pot 1 in any of the 10,000 simulations. A lot of this is due to not having enough of an opportunity to ascend further in FIFA rankings. Mexico has a better chance in part due to currently being ranked higher, but also due to their qualification for the Confederations Cup, which gives a large importance multiplier in addition to top-ranking competition.

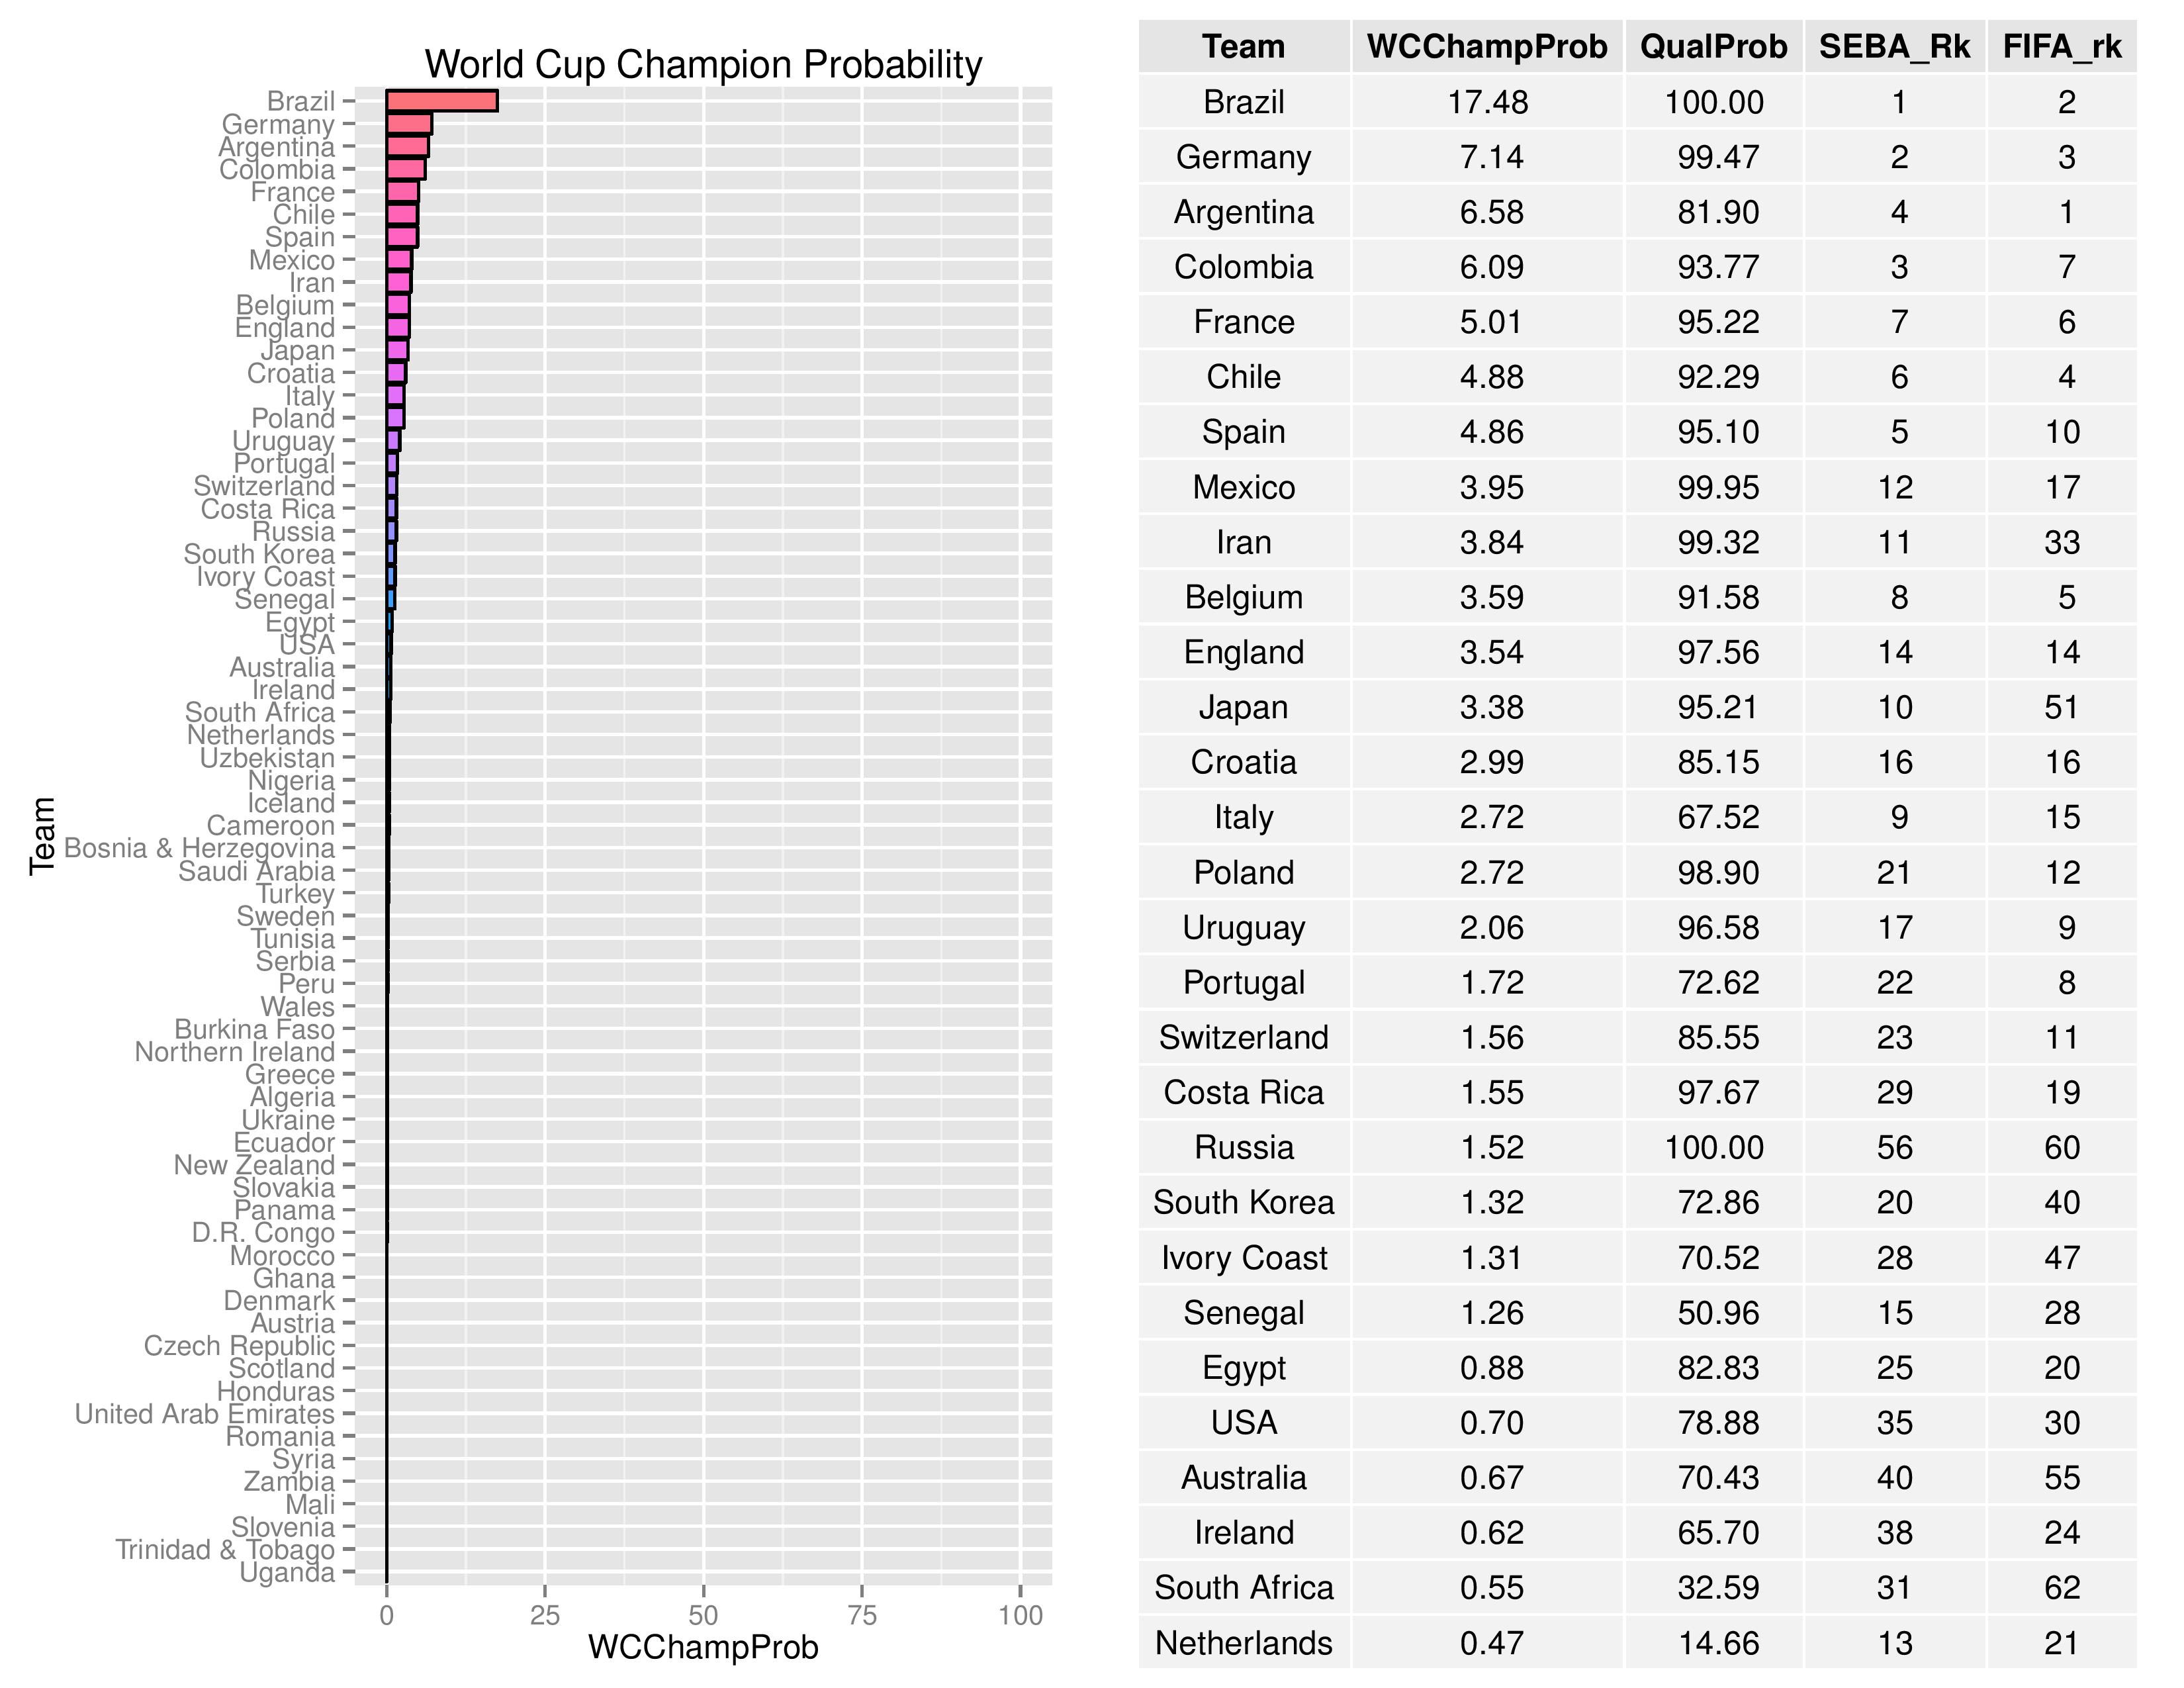
The following then manages to forecast the 2018 World Cup. Again, we accompany the odds of victory with qualification probability to help understand why some teams may be lower than expected. The USA has declined from a 0.91% chance to a 0.7% chance of winning the World Cup.
As I had to forecast these tournaments for projecting the Pot 1 draw, I might as well show the results of all the forecasted international tournaments.
The following shows the Gold Cup champion forecast. With the benefit of hosting, USA has increased its chance of winning the Gold Cup from 33.61% to 34.31%.

The following shows the Confederations Cup projections. CONCACAF’s representative, Mexico, has increased to a 19.29% chance of winning from 18.32%. They have the second-highest odds, thanks in part to an easier draw (with Russia, Portugal, and New Zealand) according to SEBA’s rankings.


For a discussion on how the FIFA rankings system differs from SEBA’s, check out the article from 3/28/2017.
The following shows, according to SEBA, the top-10 overrated teams to the left and the top-10 underrated teams to the right.

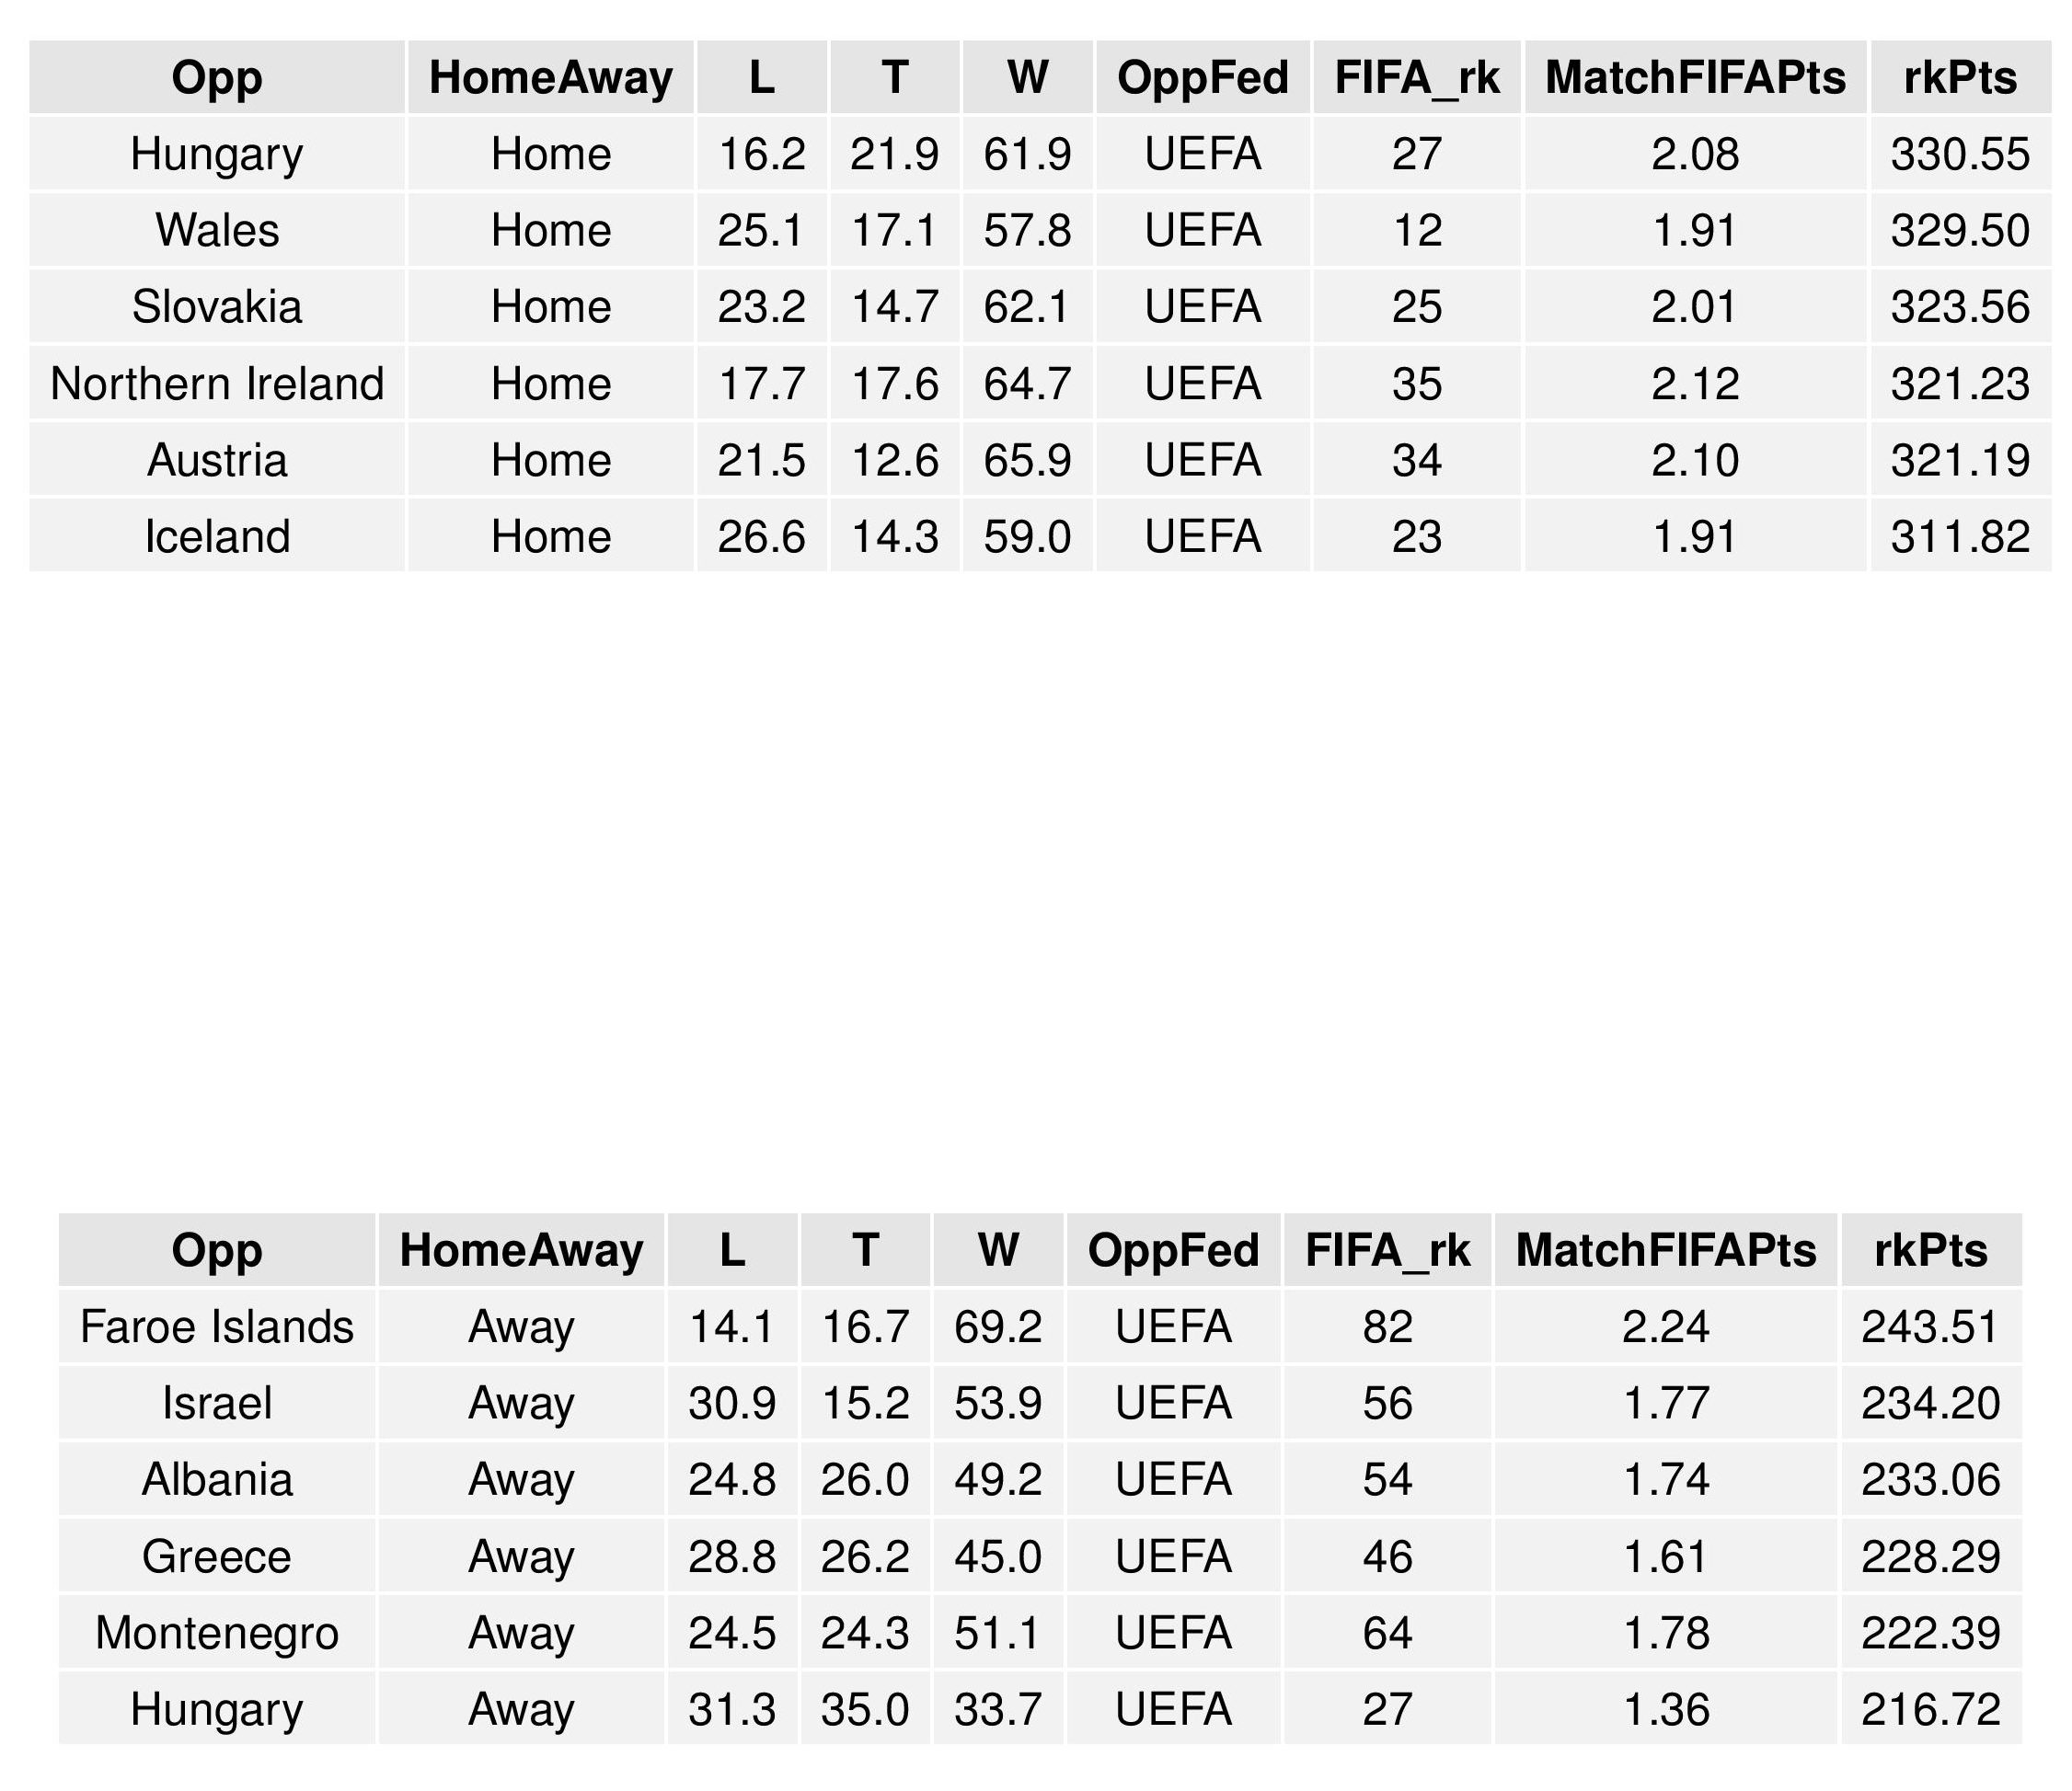
The following shows, if the USA wanted to schedule its friendlies to best manipulate the FIFA ranking system, who they should schedule against. The top table shows home matches, which are inherently the best choice for manipulating the FIFA rankings system. The bottom table shows, if the USA needs to schedule away friendlies, who they should schedule against in that scenario.
The MatchFIFAPts are 3-times-win-probability + draw-probability. rkPts represents the average expected points the USA might receive within FIFA’s point system for their rankings.
Scheduled USA Matches
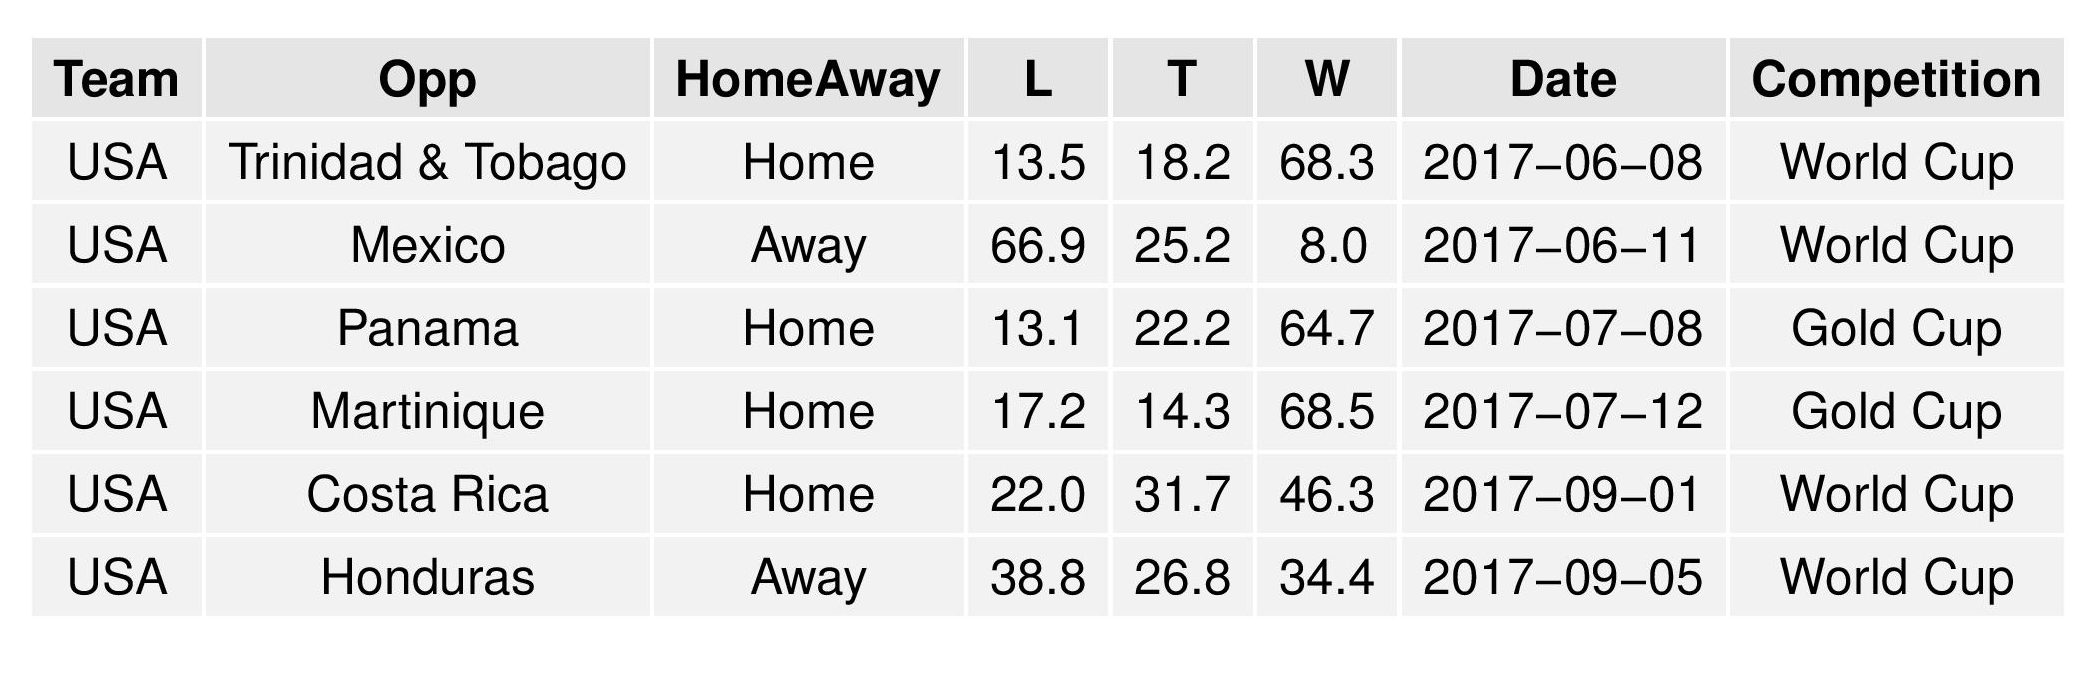
Finally, the following shows the probabilities of results for upcoming USA matches.
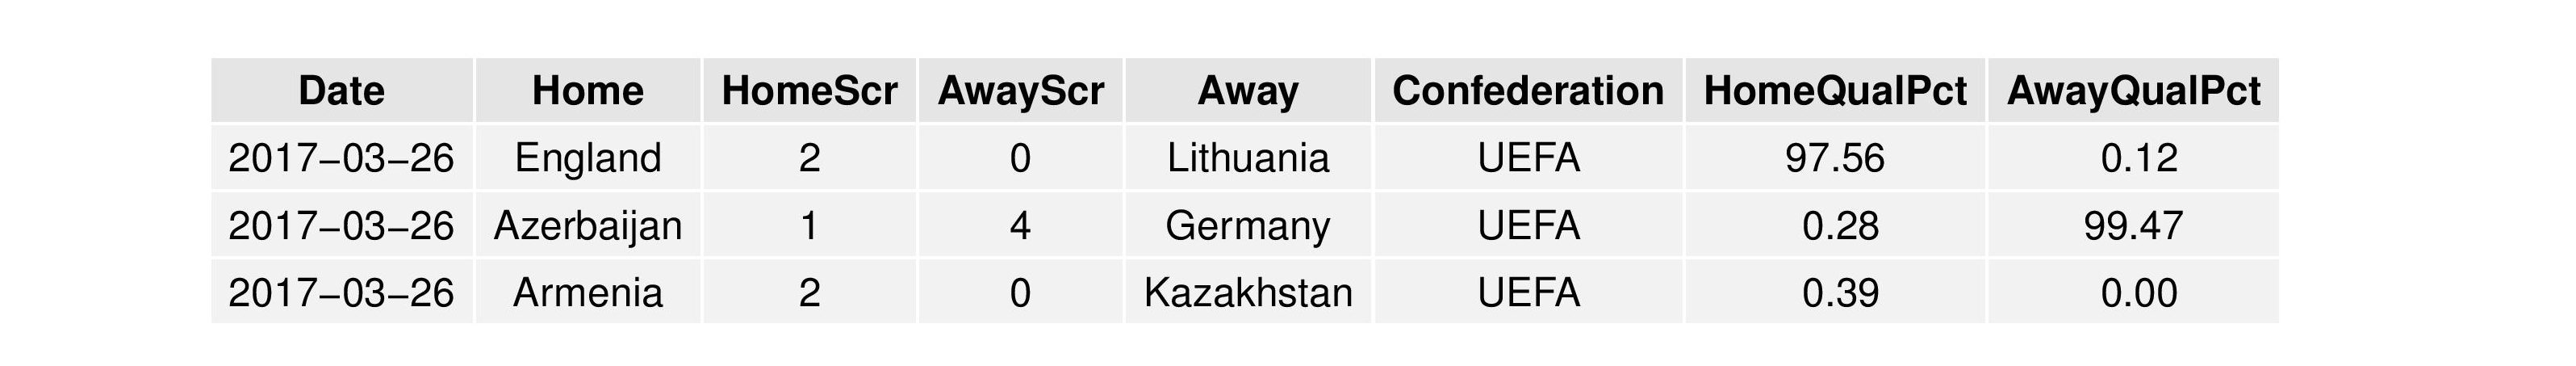
World Cup Qualification Results
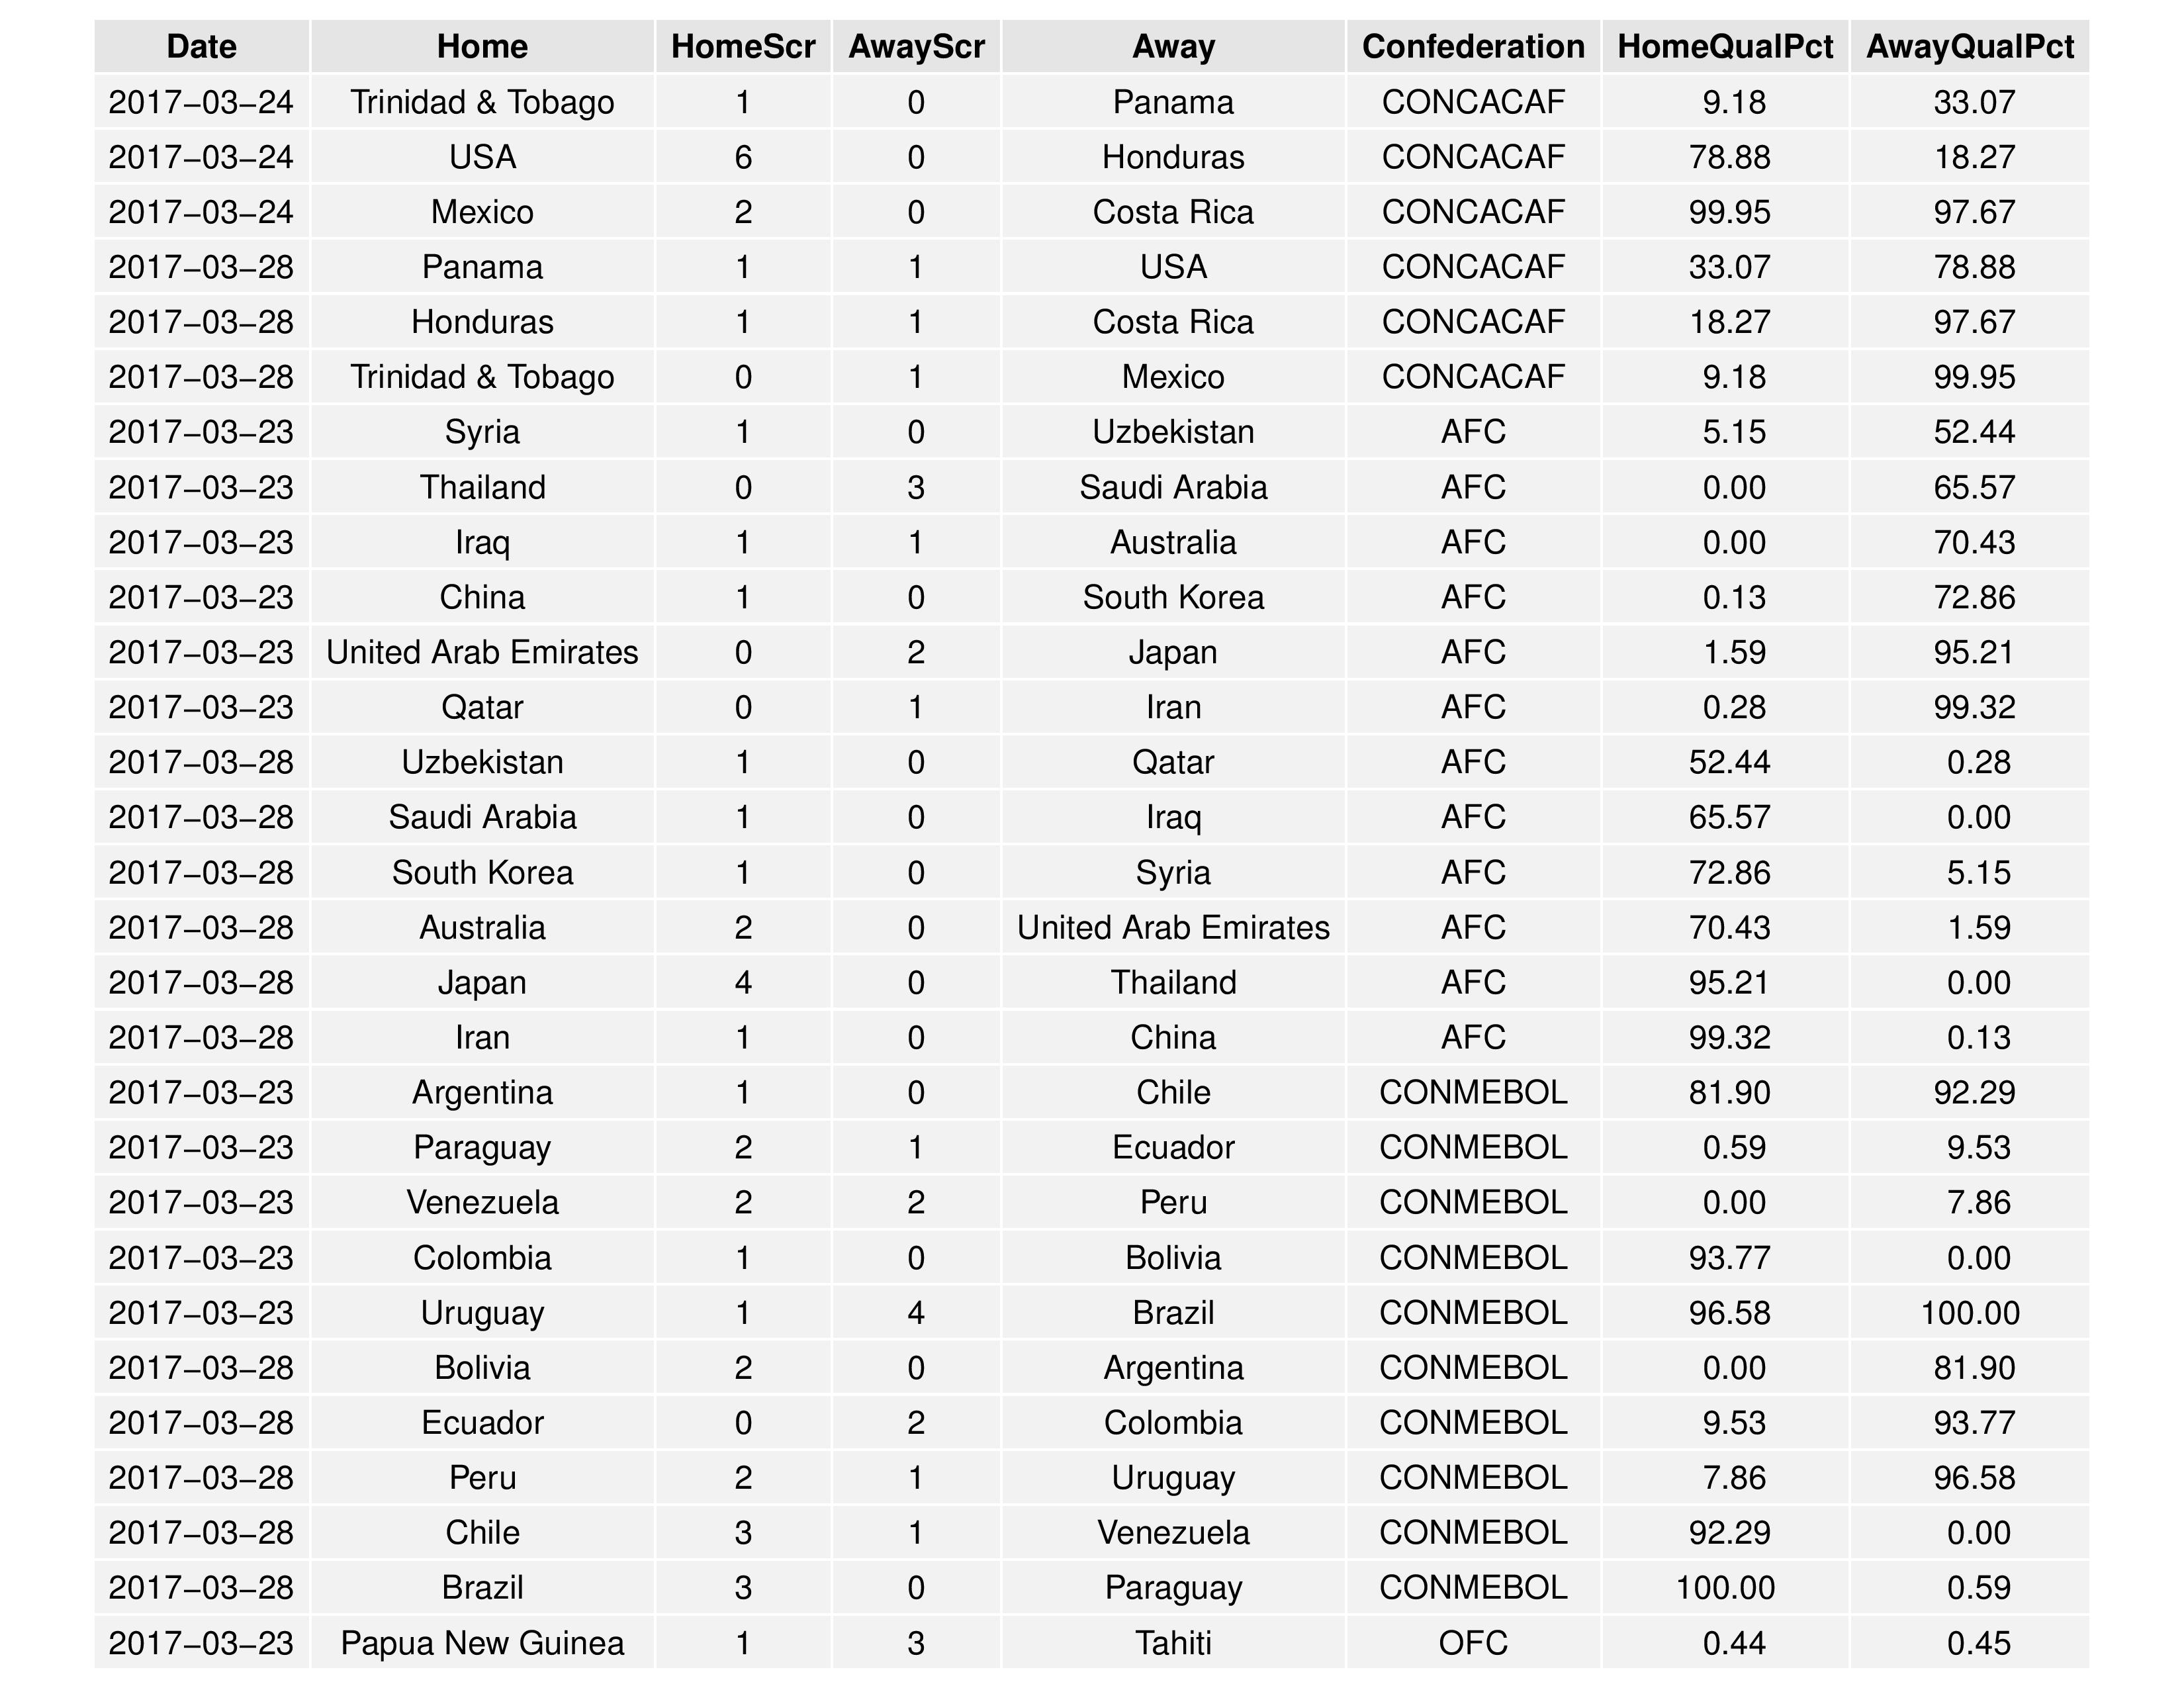
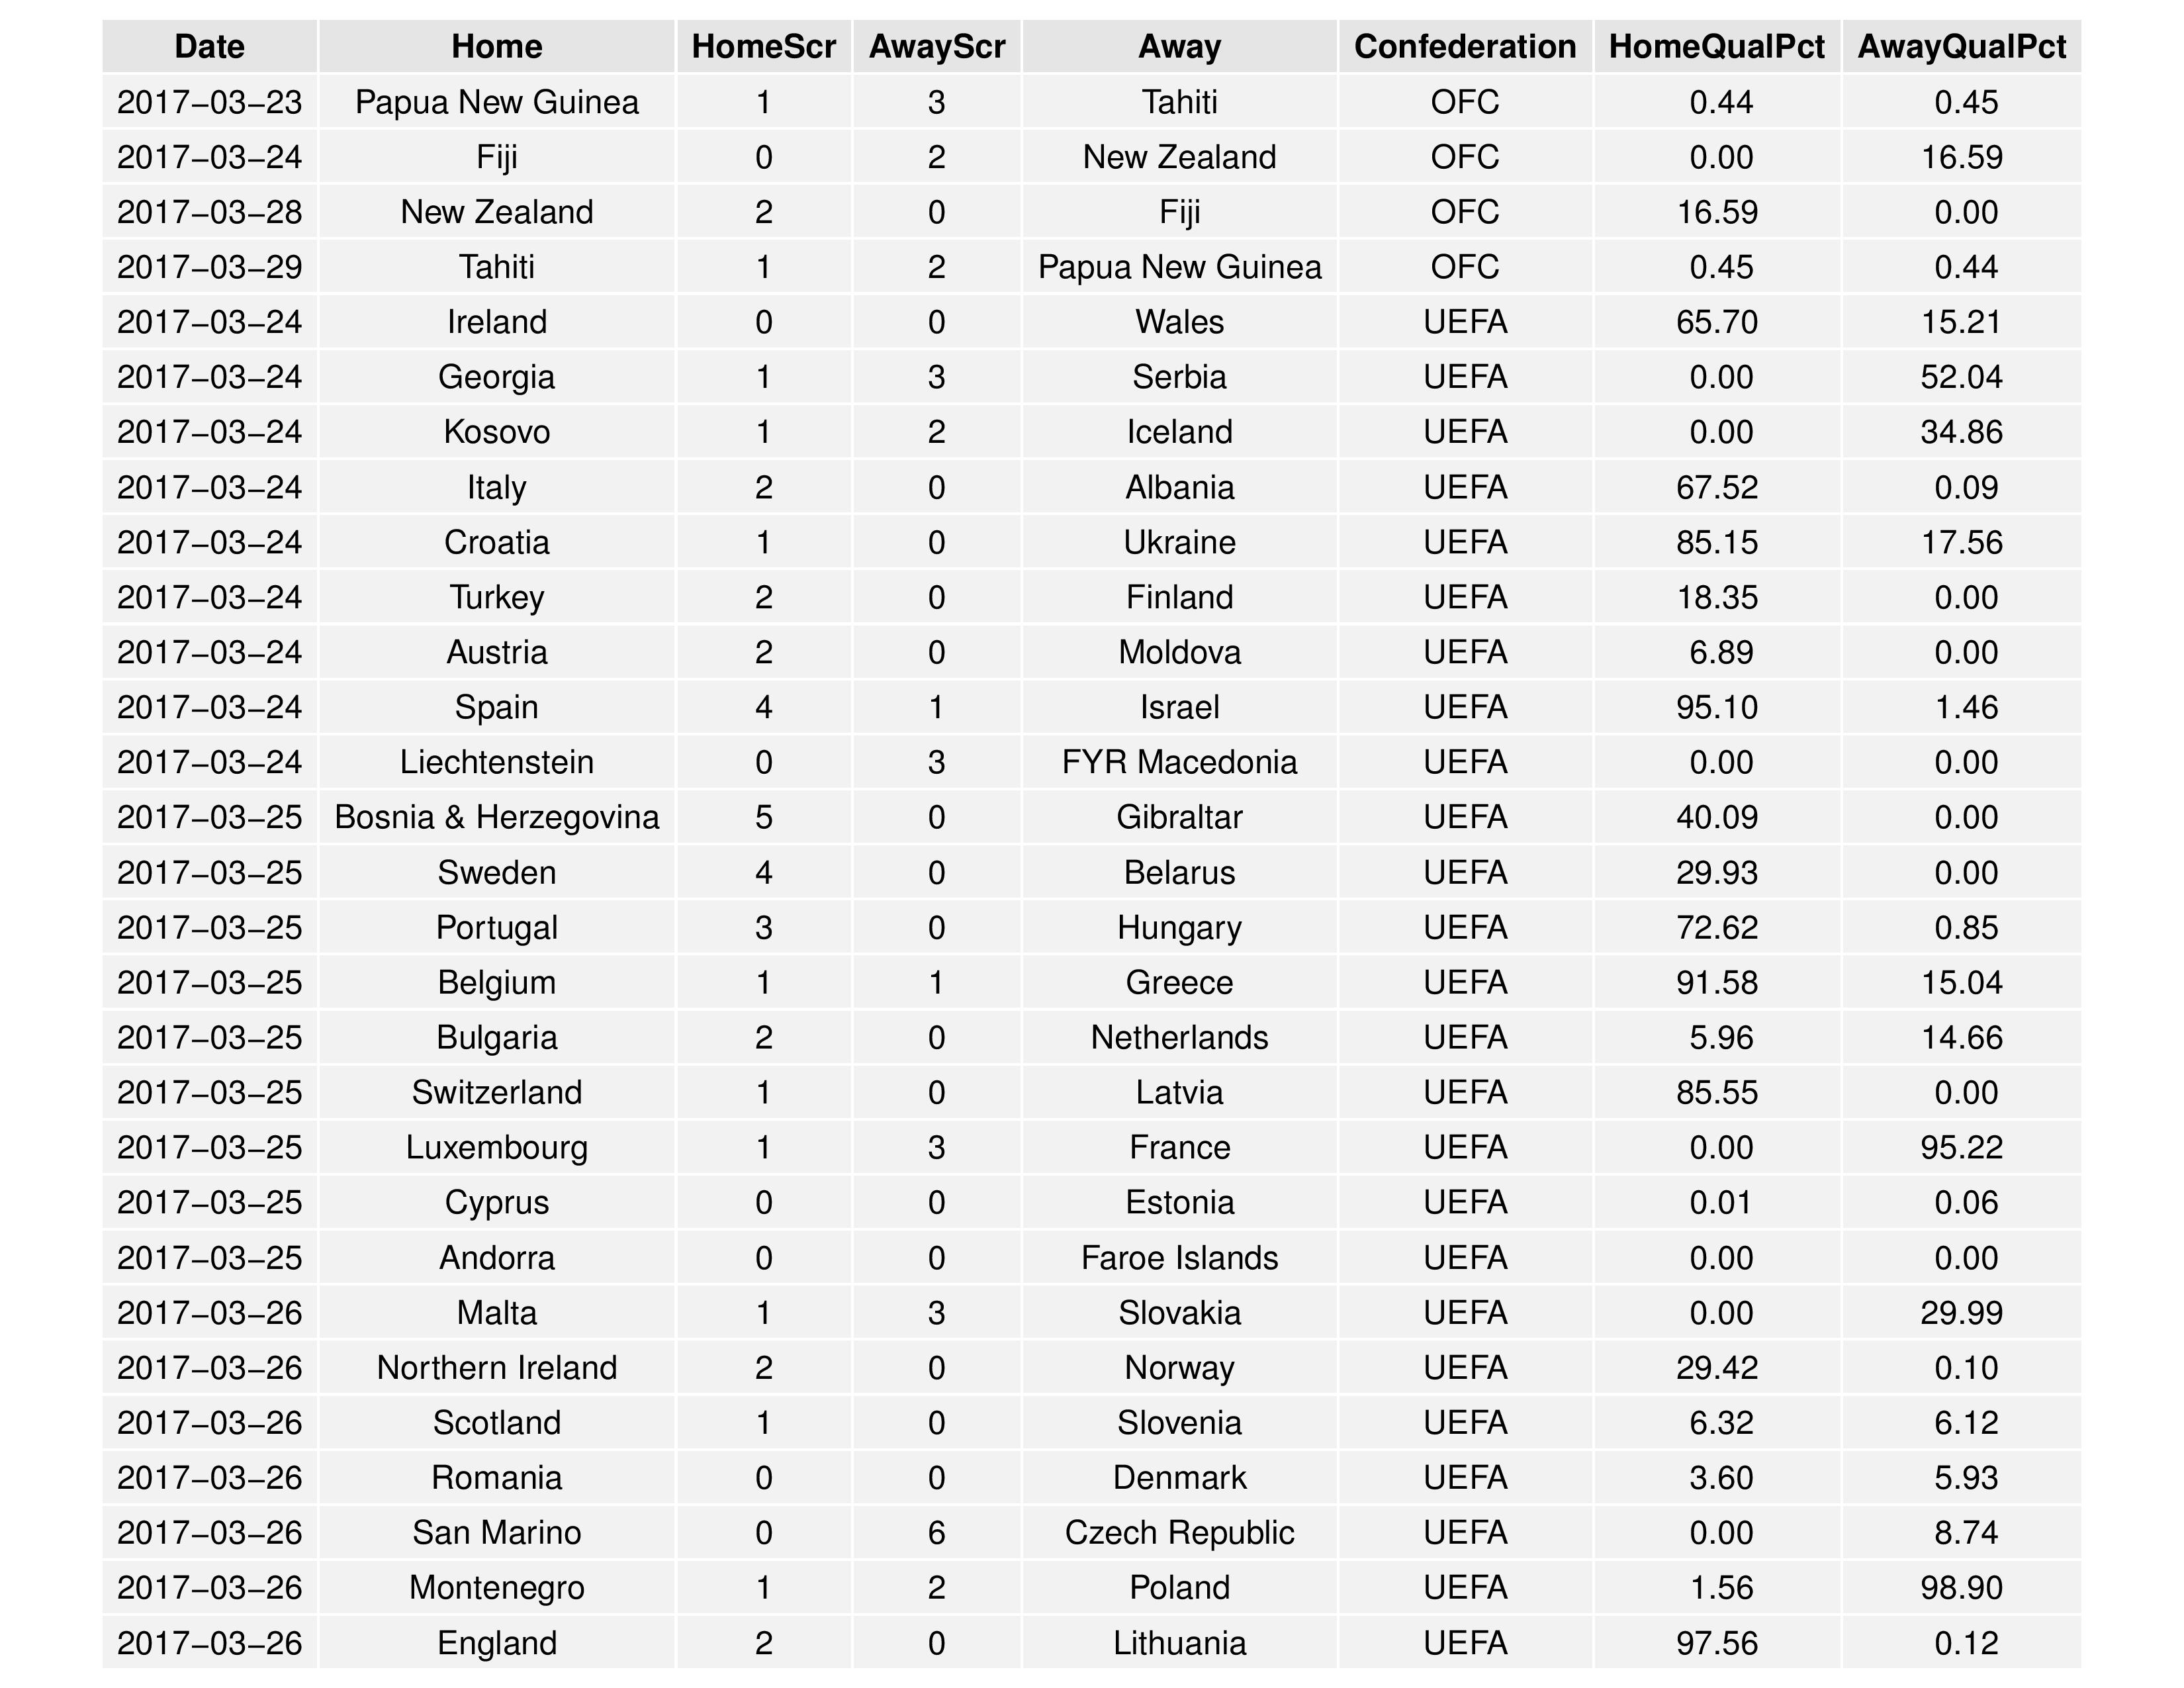
The following just shows the most recent World Cup Qualification matches included in the model by federation, accompanied by their current qualification odds.

To me the most surprising thing is that the US has a better chance to finish 2nd than 4th, considering both Costa Rica and Mexico still have 4 home games each. Worst case scenario for CR seems to be 3 home wins and a draw either at home against Mexico or on the road against Panama. That would be 17 points for CR meaning the US needs to win all three home games and get at least a win and a draw in Honduras and T&T (assuming a loss in Mexico). While possible, I think it’s more likely that they’ll slip up and finish behind Panama.
.
Also, I didn’t see any updates on Chicago Fire’s chances of making the World Cup 🙂 🙂 🙂
Actually SEBA agrees with you that the US is more likely to finish 4th than 2nd, it’s just that the 4th place in the graphic is broken out into Qualified and Not Qualified (based on likelihood of beating AFC’s 5th-placer to get into the World Cup). If you stacked them together it would be higher than 2nd.
–
We don’t have any data on how Schweinsteiger’s play will improve Chicago’s performance! 😉
Thanks for clarifying, Chris. I hadn’t counted the number of bars to realize there were 2 4th place bars.