Welcome to the Statistical Extrapolation Bayesian Analyzer Projection System, which is, of course, a tortured gathering of words used to form the SEBA Projection System.
The system consists of a model projecting the probabilities of game results and then a barrage of simulations which account for the remaining luck. So the probabilities you see below show, essentially, what the odds are of an outcome if the team continues to play like it has been.
Below are the current season forecasts using data from games through September 11, 2016.
Power Rankings
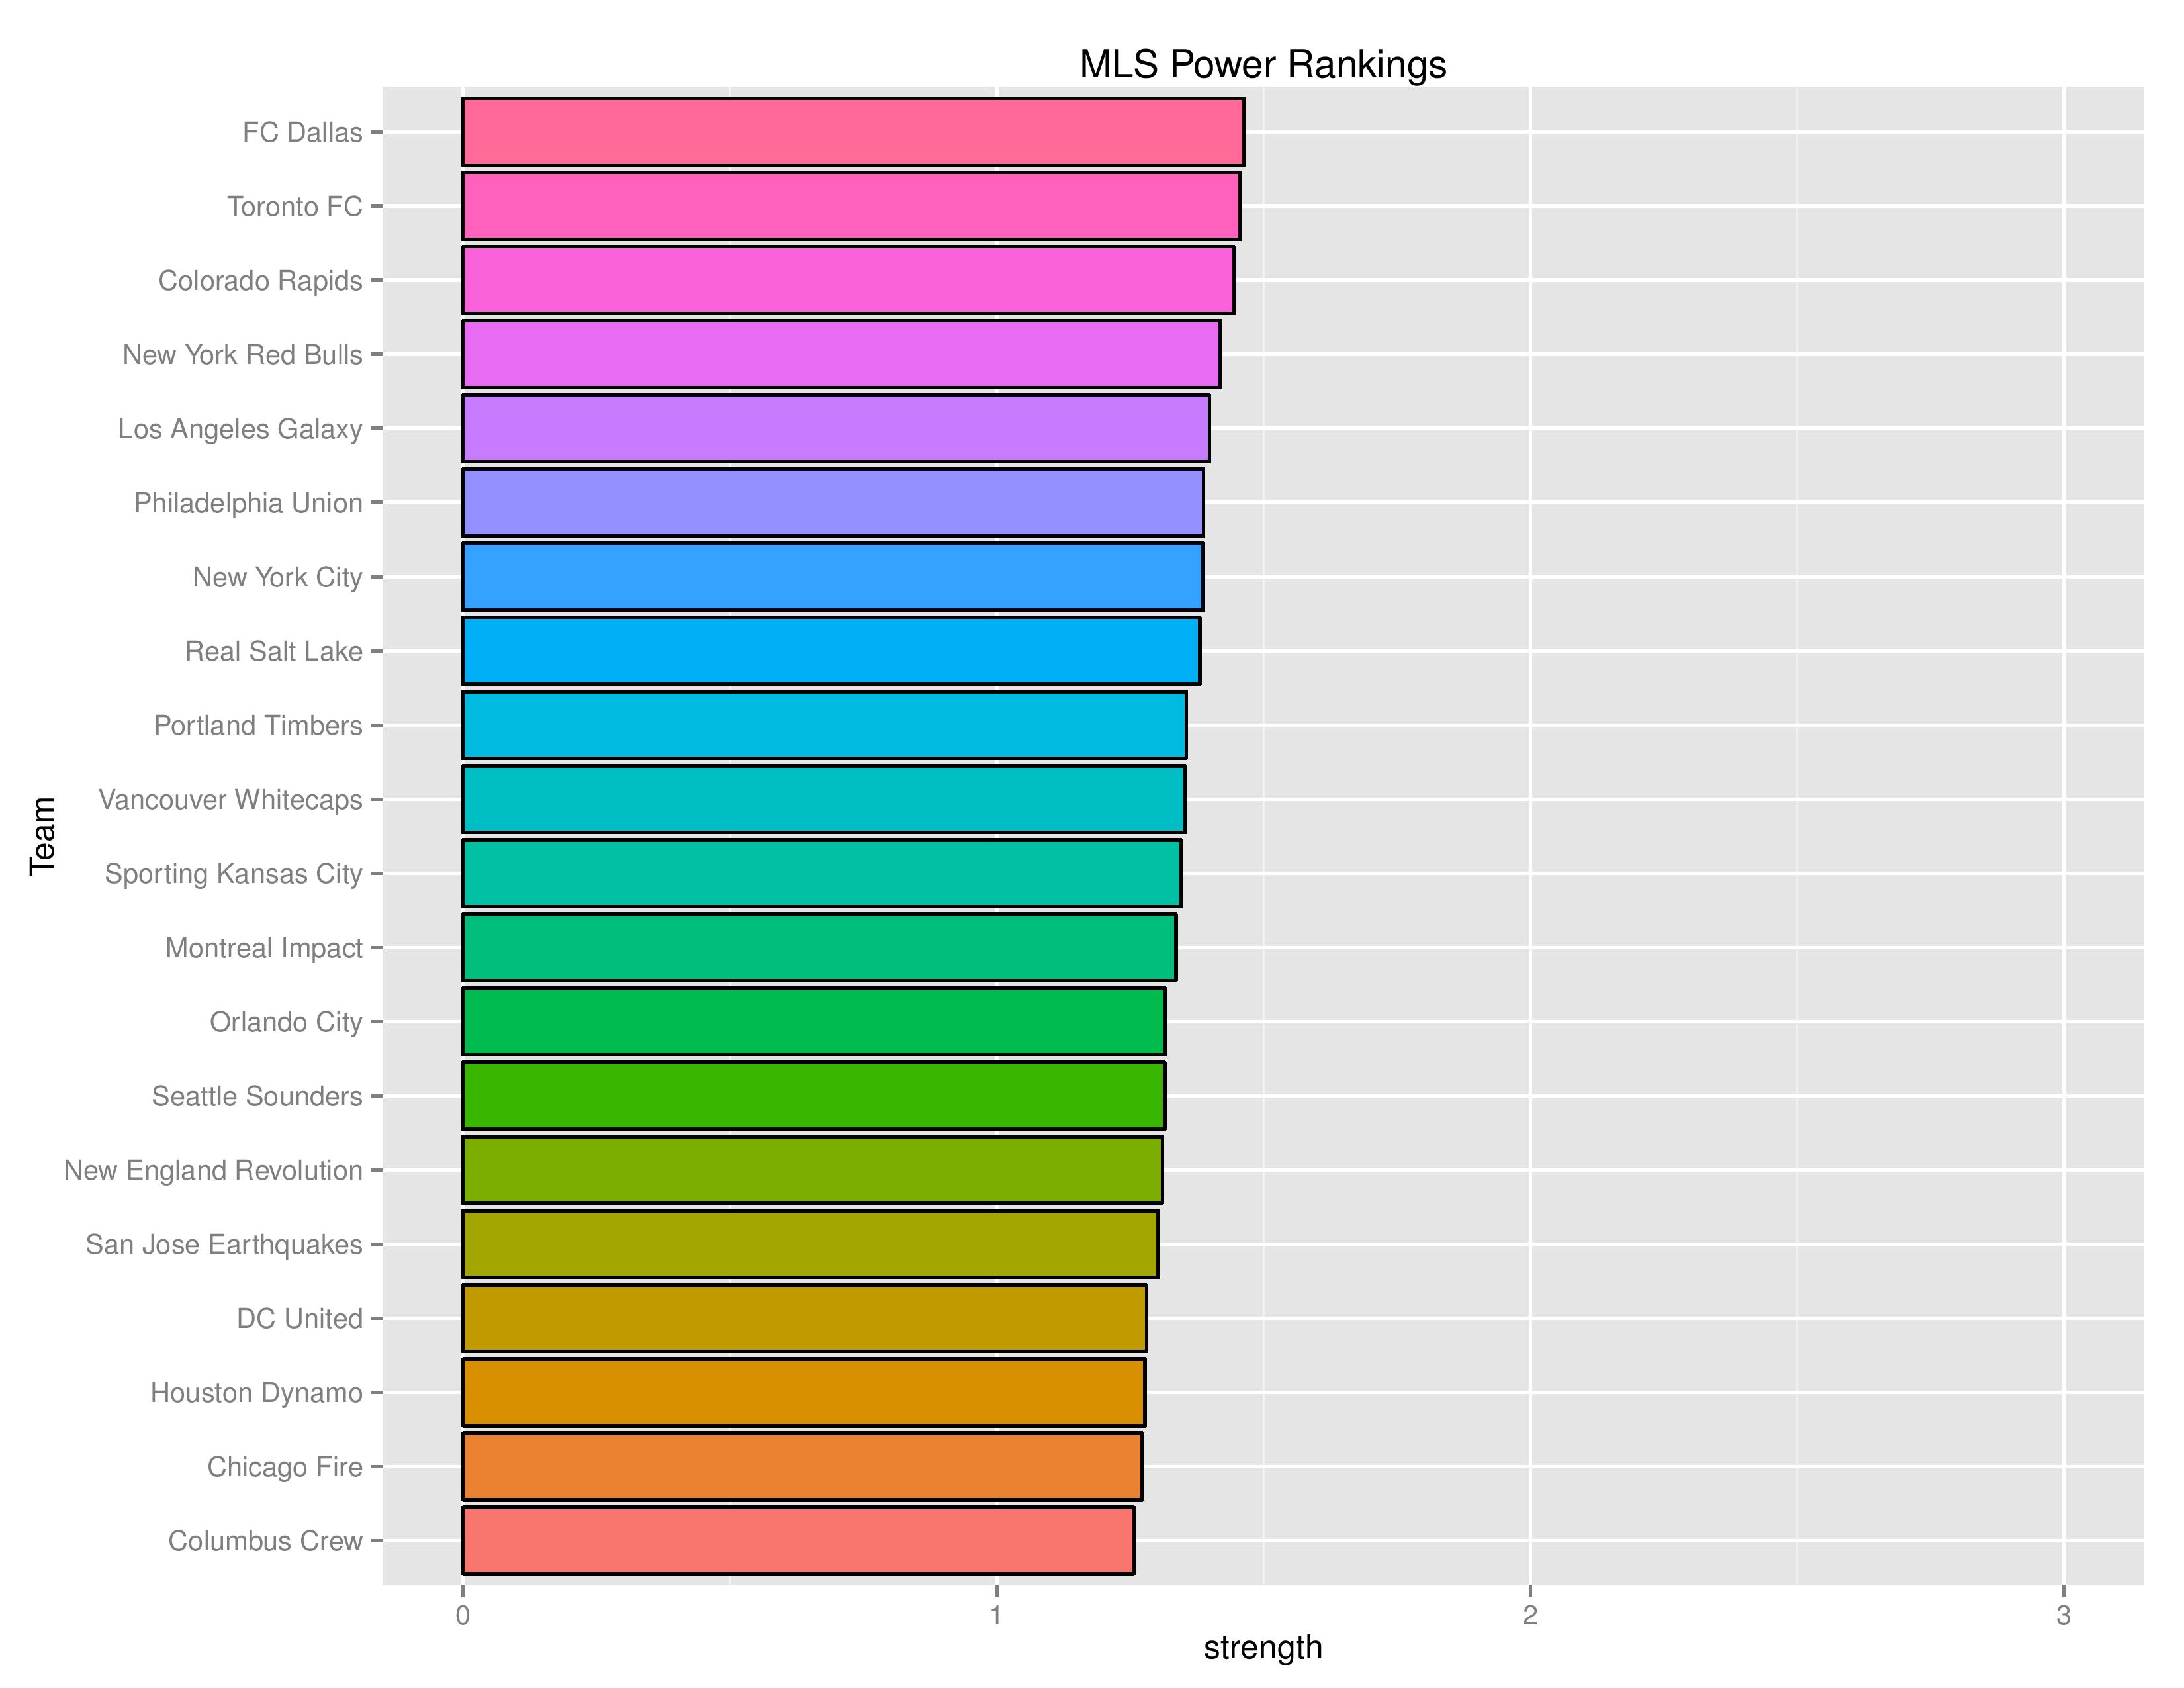
The “Power Rankings” we concoct are the actual “strength” of the team according to competitive expectations. They are computed showing average expected points result if every team in MLS played every team both home and away.
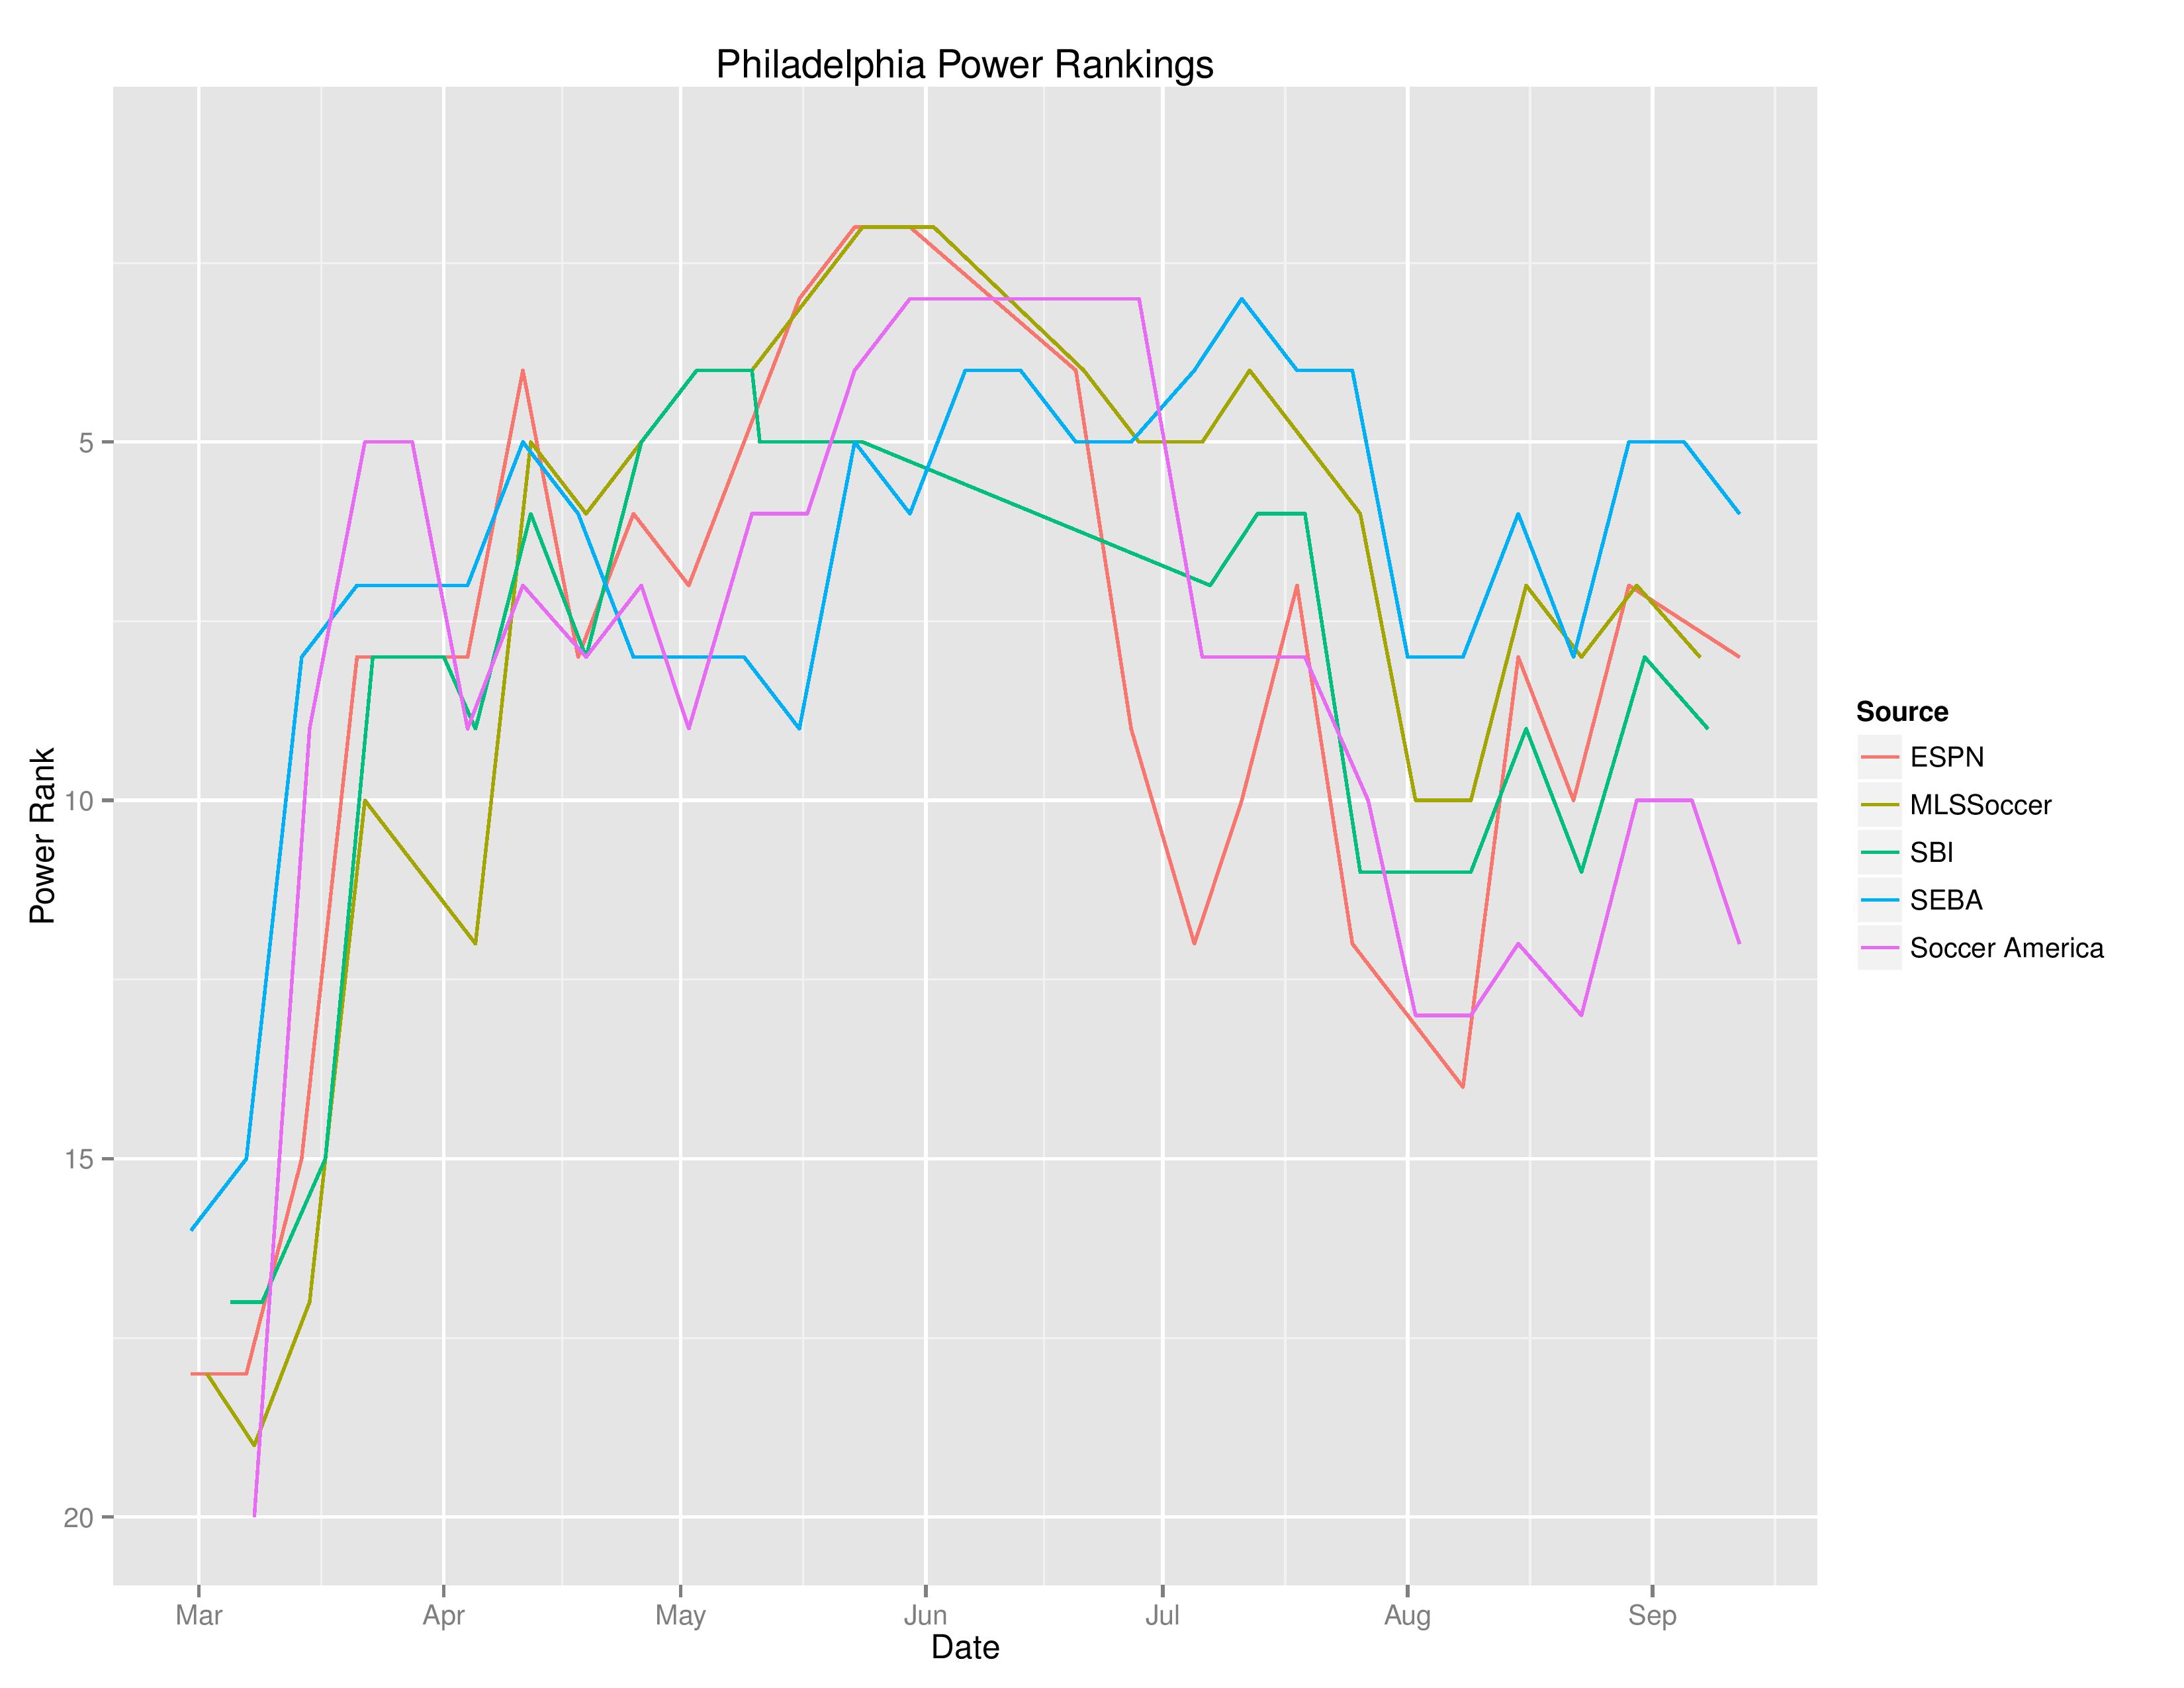
SEBA has the Union dropping to No. 6 from No. 5. At Soccer America, the Union drops to No. 12. At SI, they remain at No. 8. ESPN drops the Union one spot to No. 8.
Playoffs probability and more
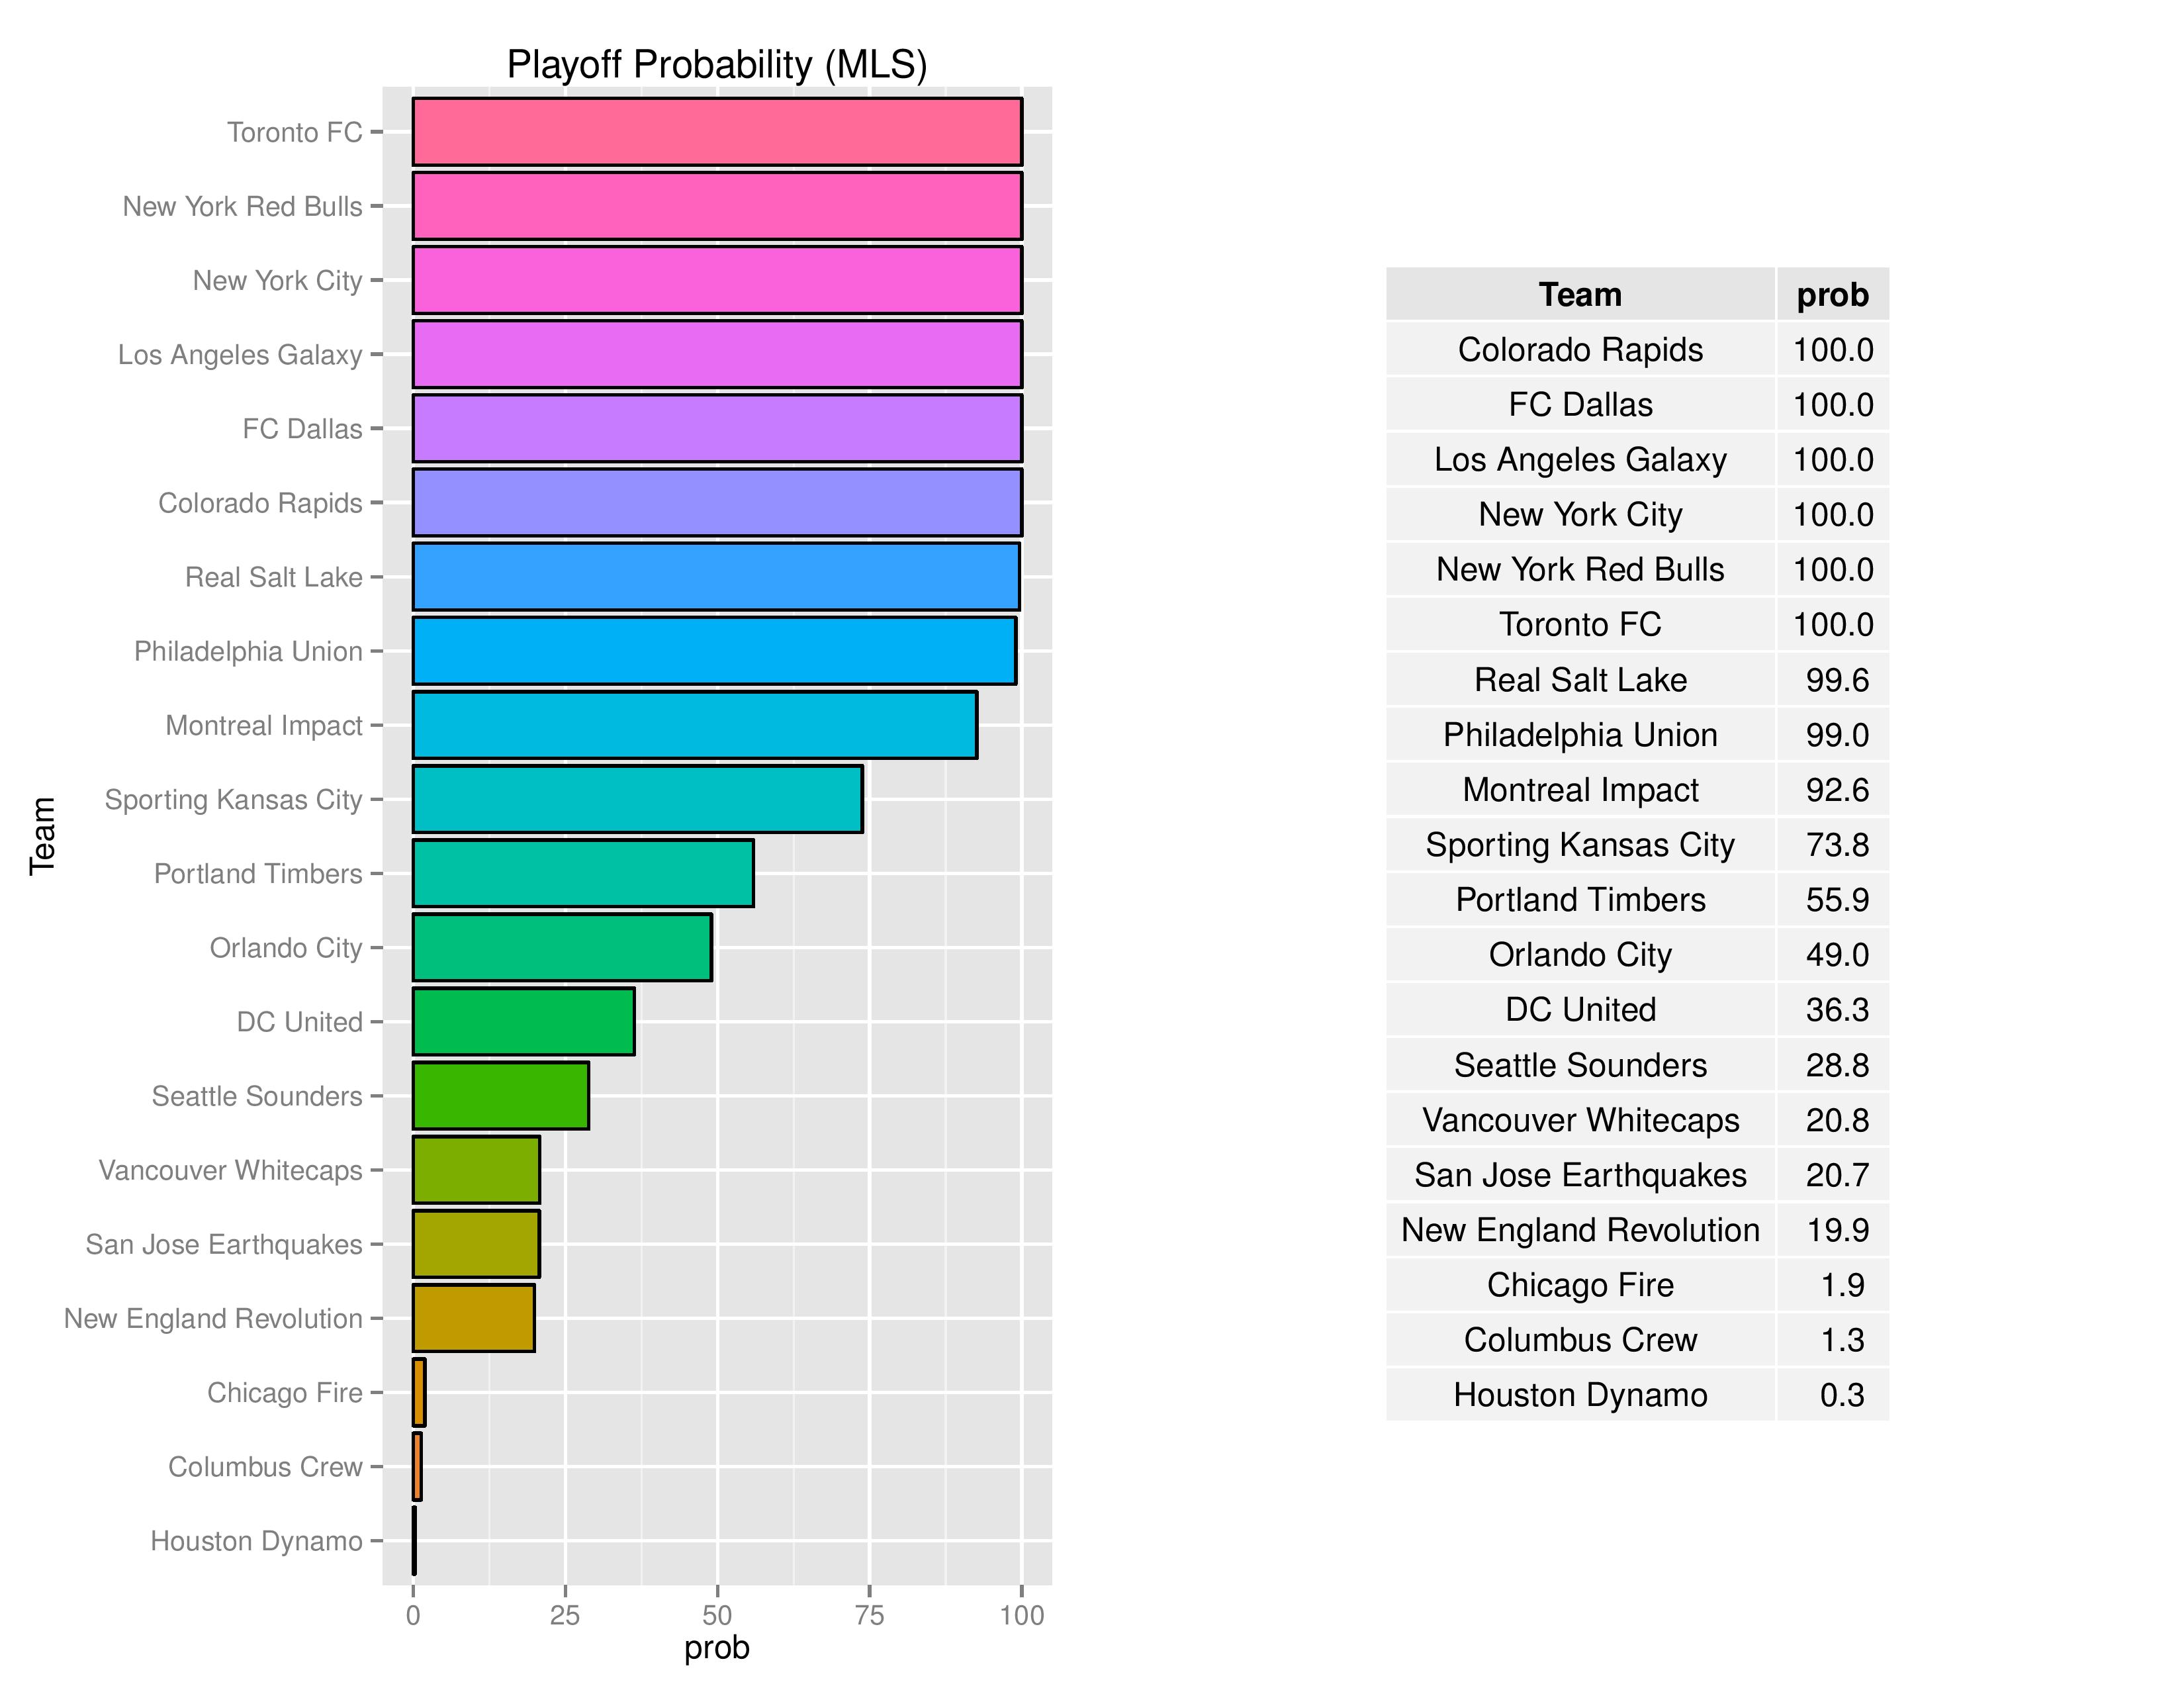
The following charts show the probabilities for making the playoffs, winning the Supporters’ Shield, winning the MLS Cup, winning the USOC Cup, and qualification for CONCACAF Champions League.
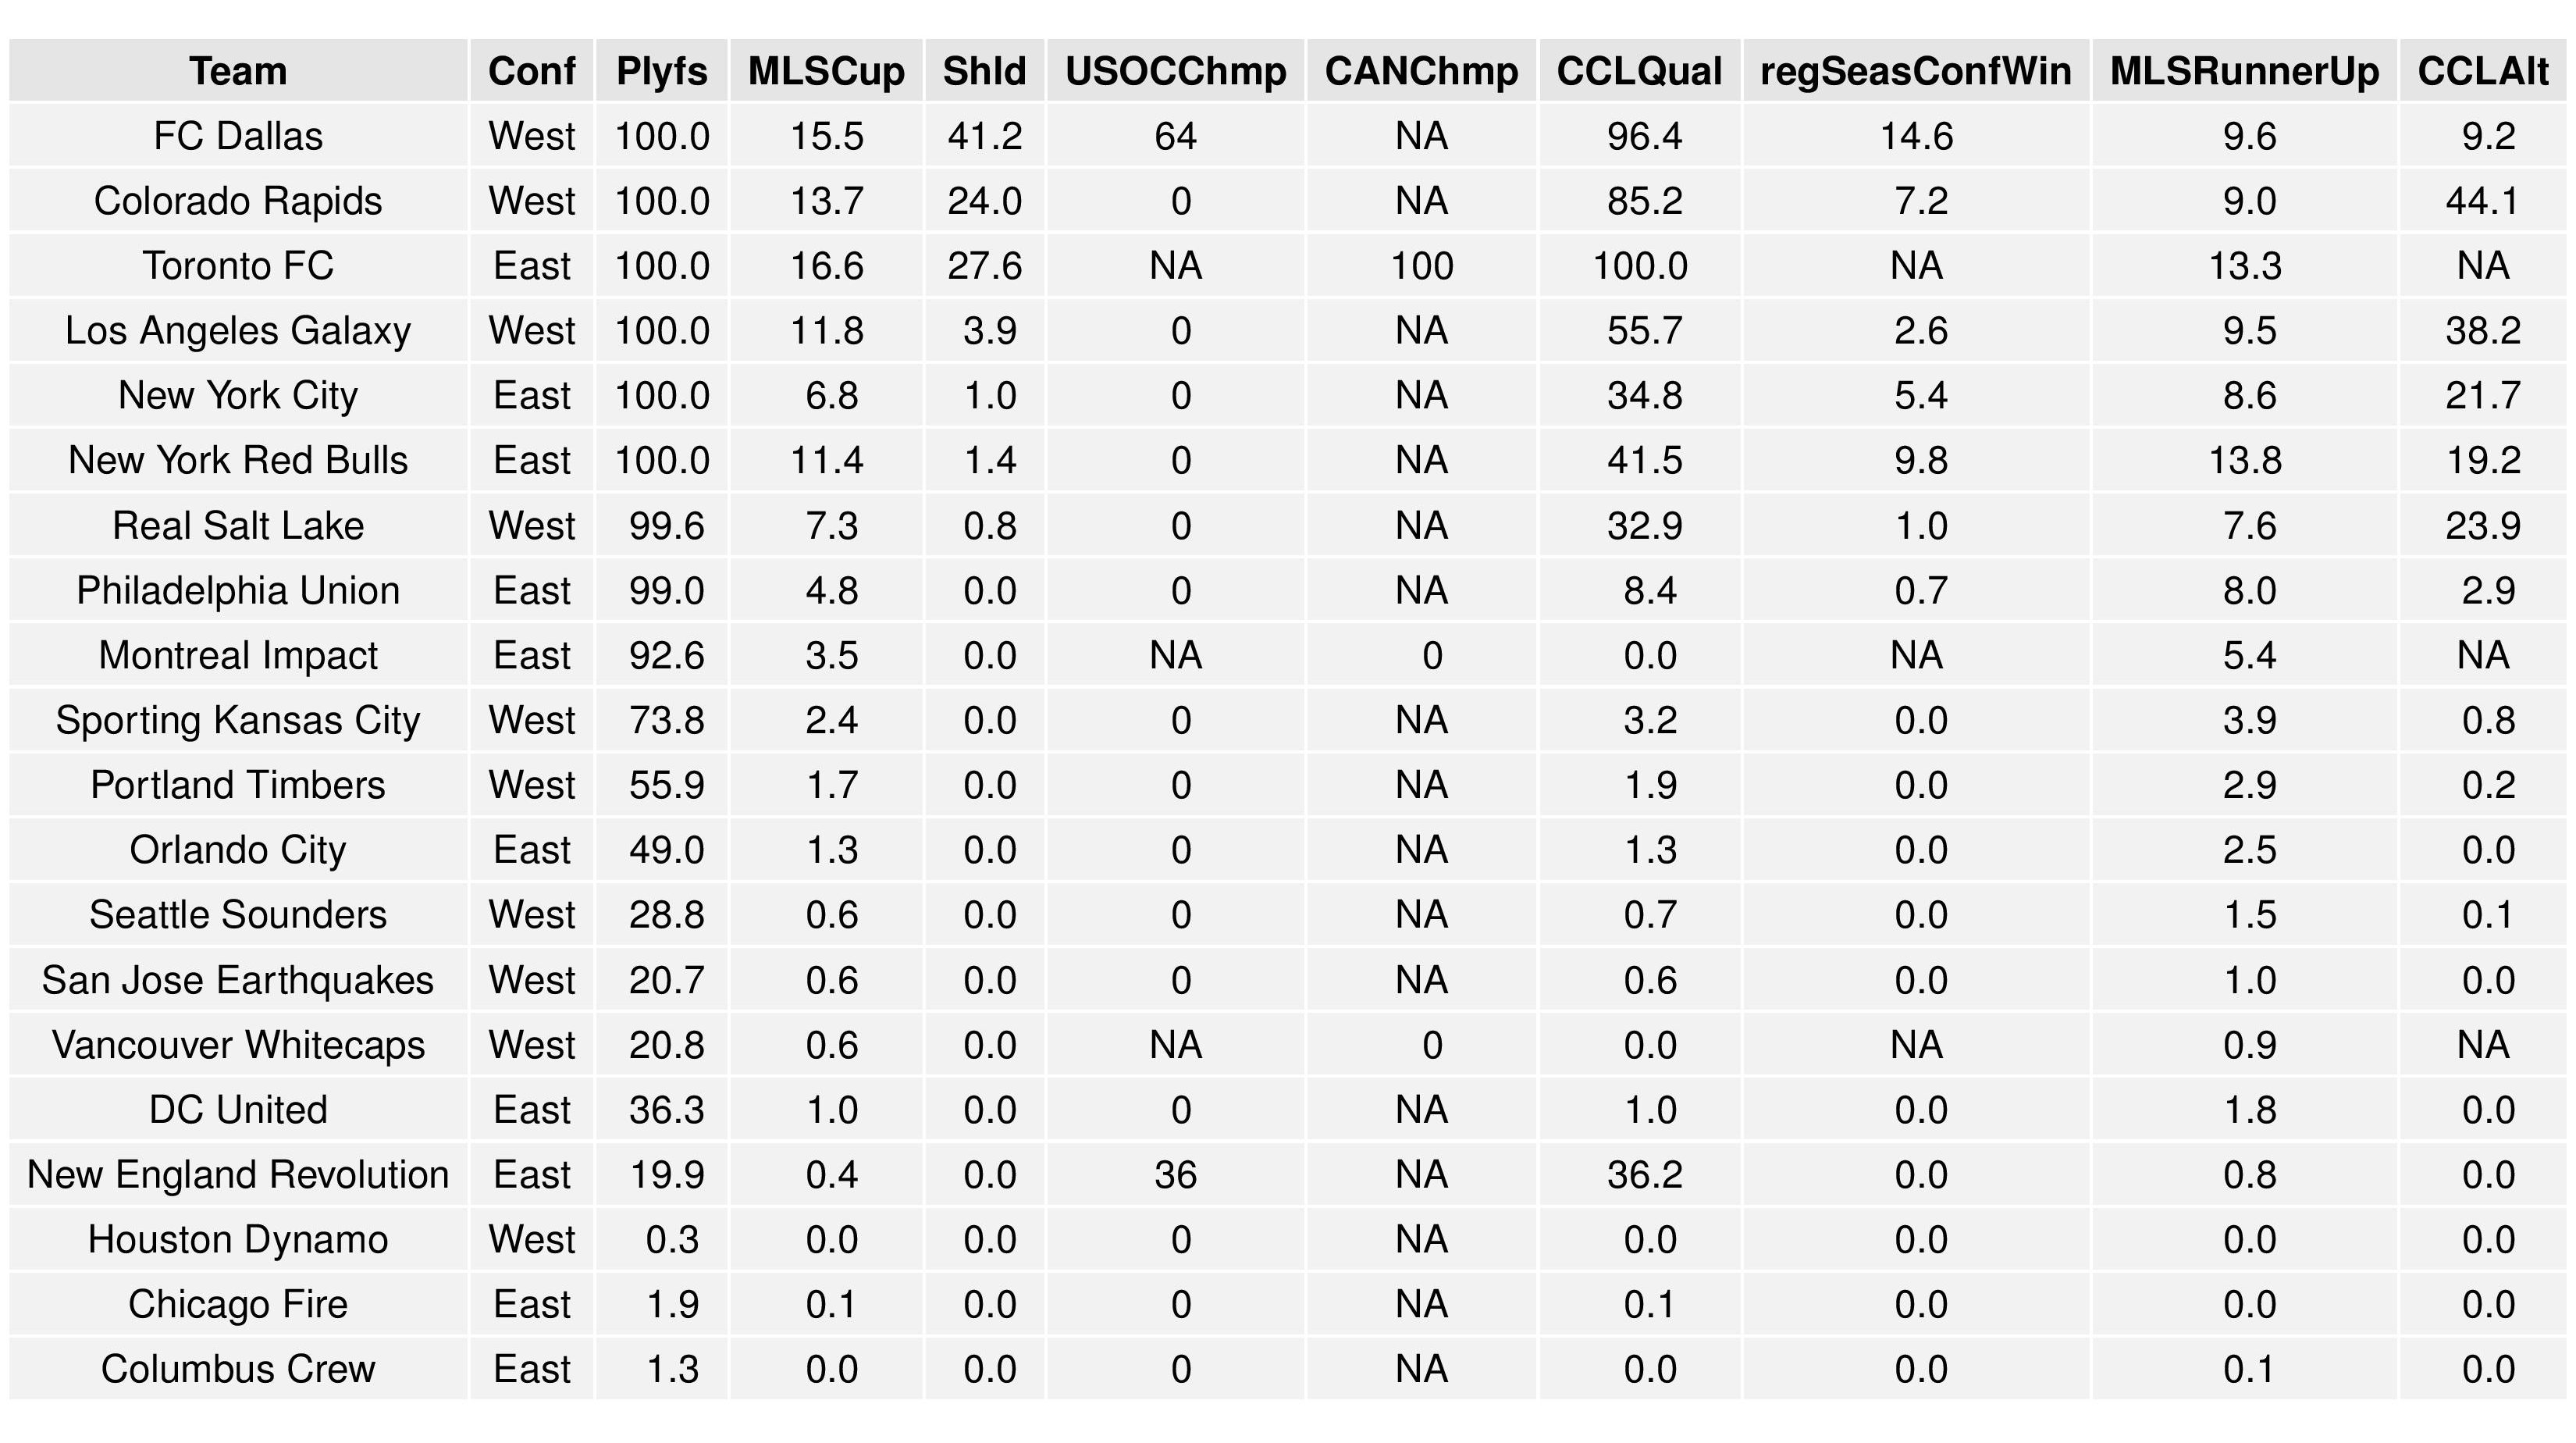
The Union went down slightly to 99.0% from 99.4% last week in their probability of making the playoffs.
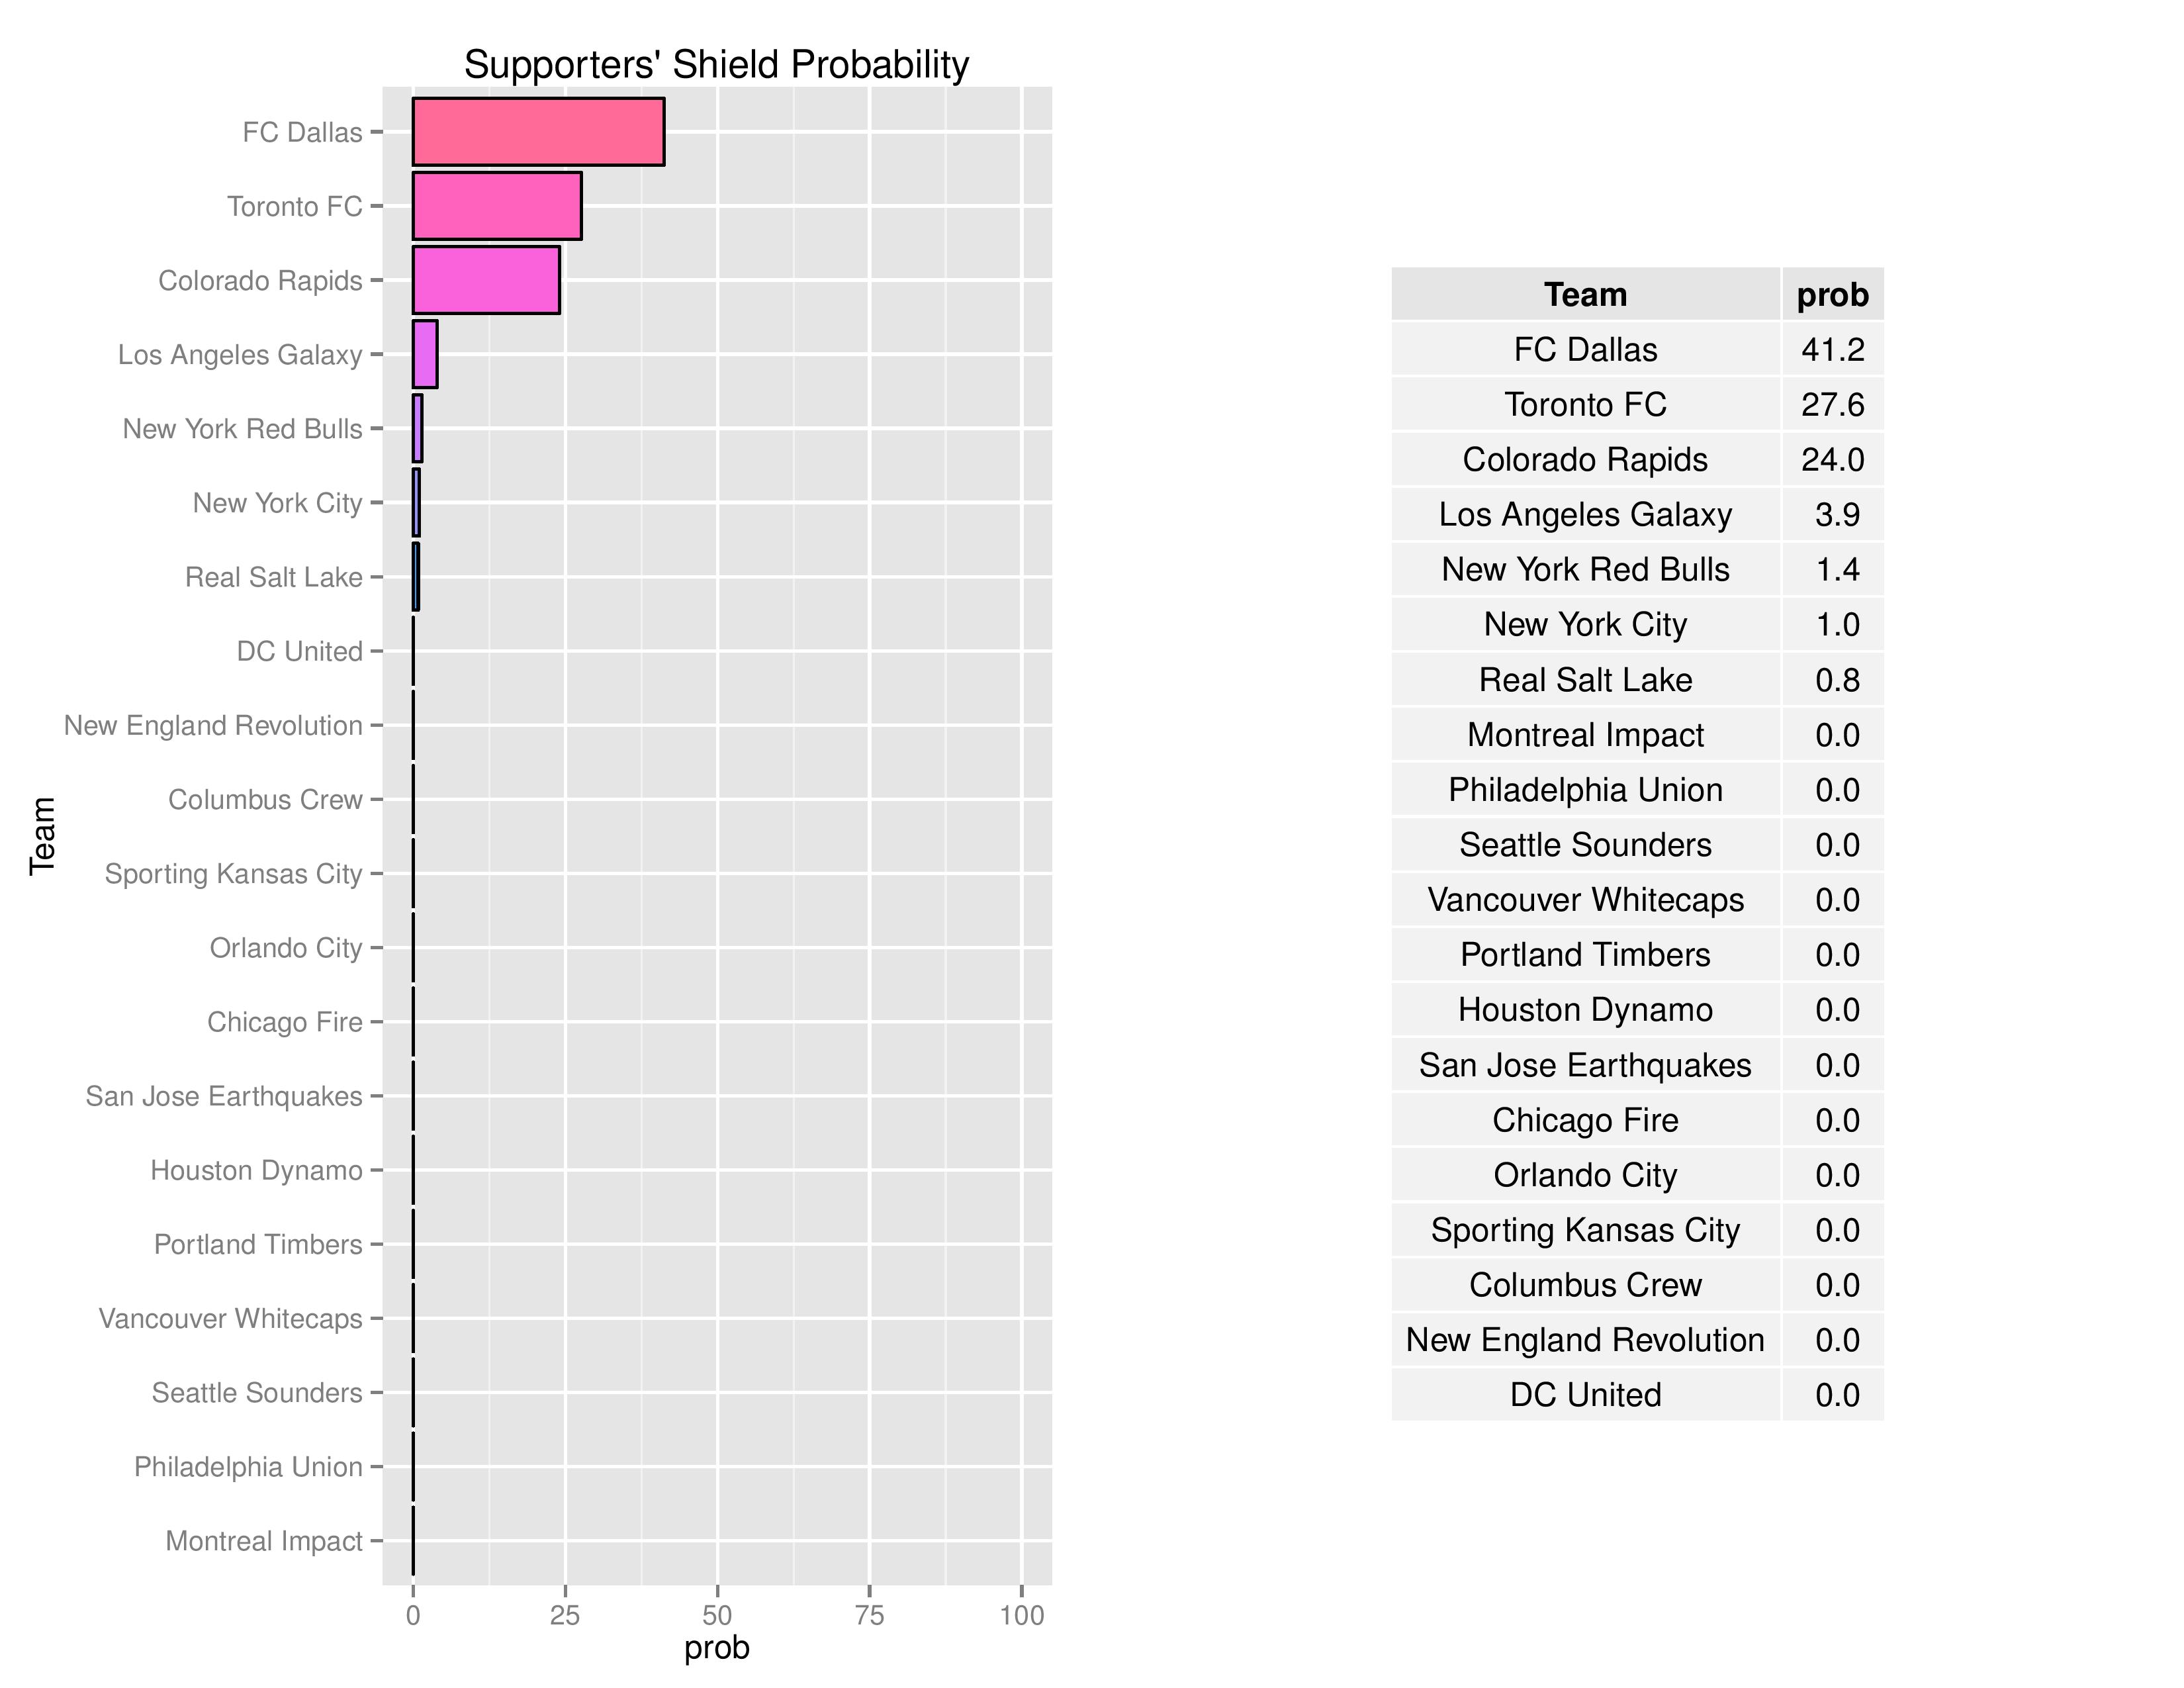
The odds of Philadelphia claiming the Supporters’ Shield dropped to 0%. FC Dallas’ odds took a large hit this past weekend but remain in the lead.
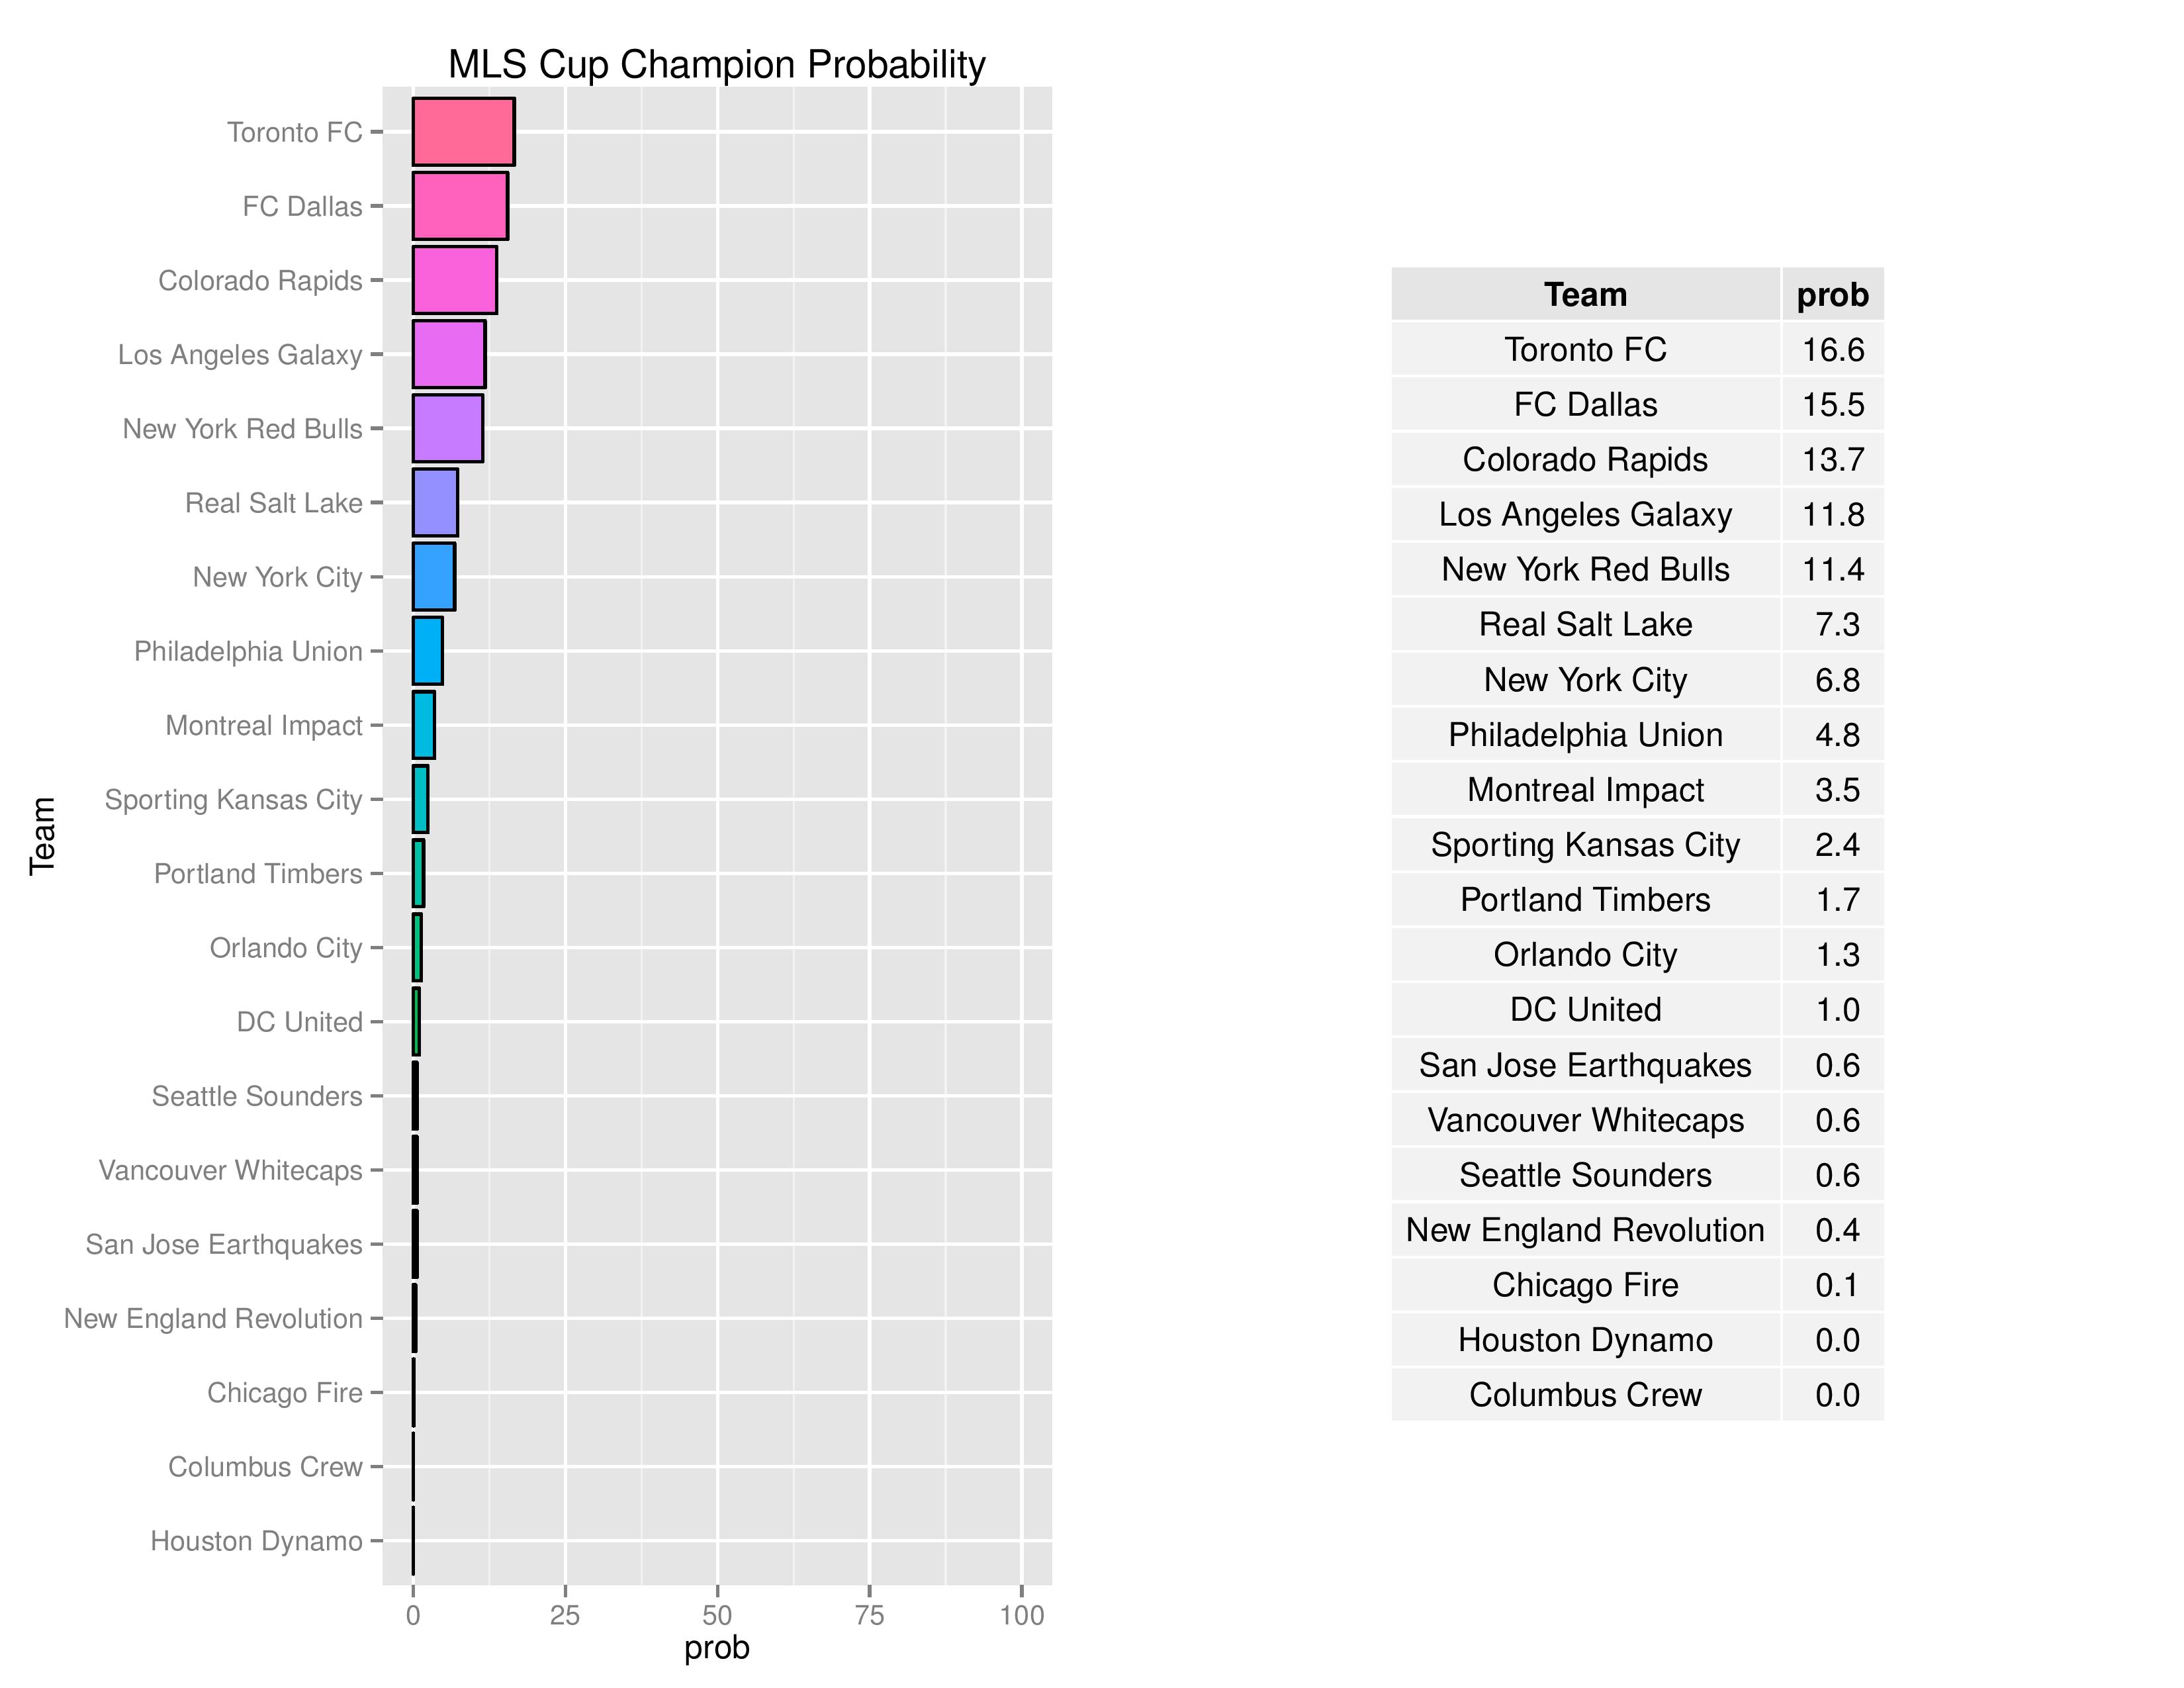
The Union declined again from 5.3% last week to 4.8% in their odds of capturing MLS Cup.
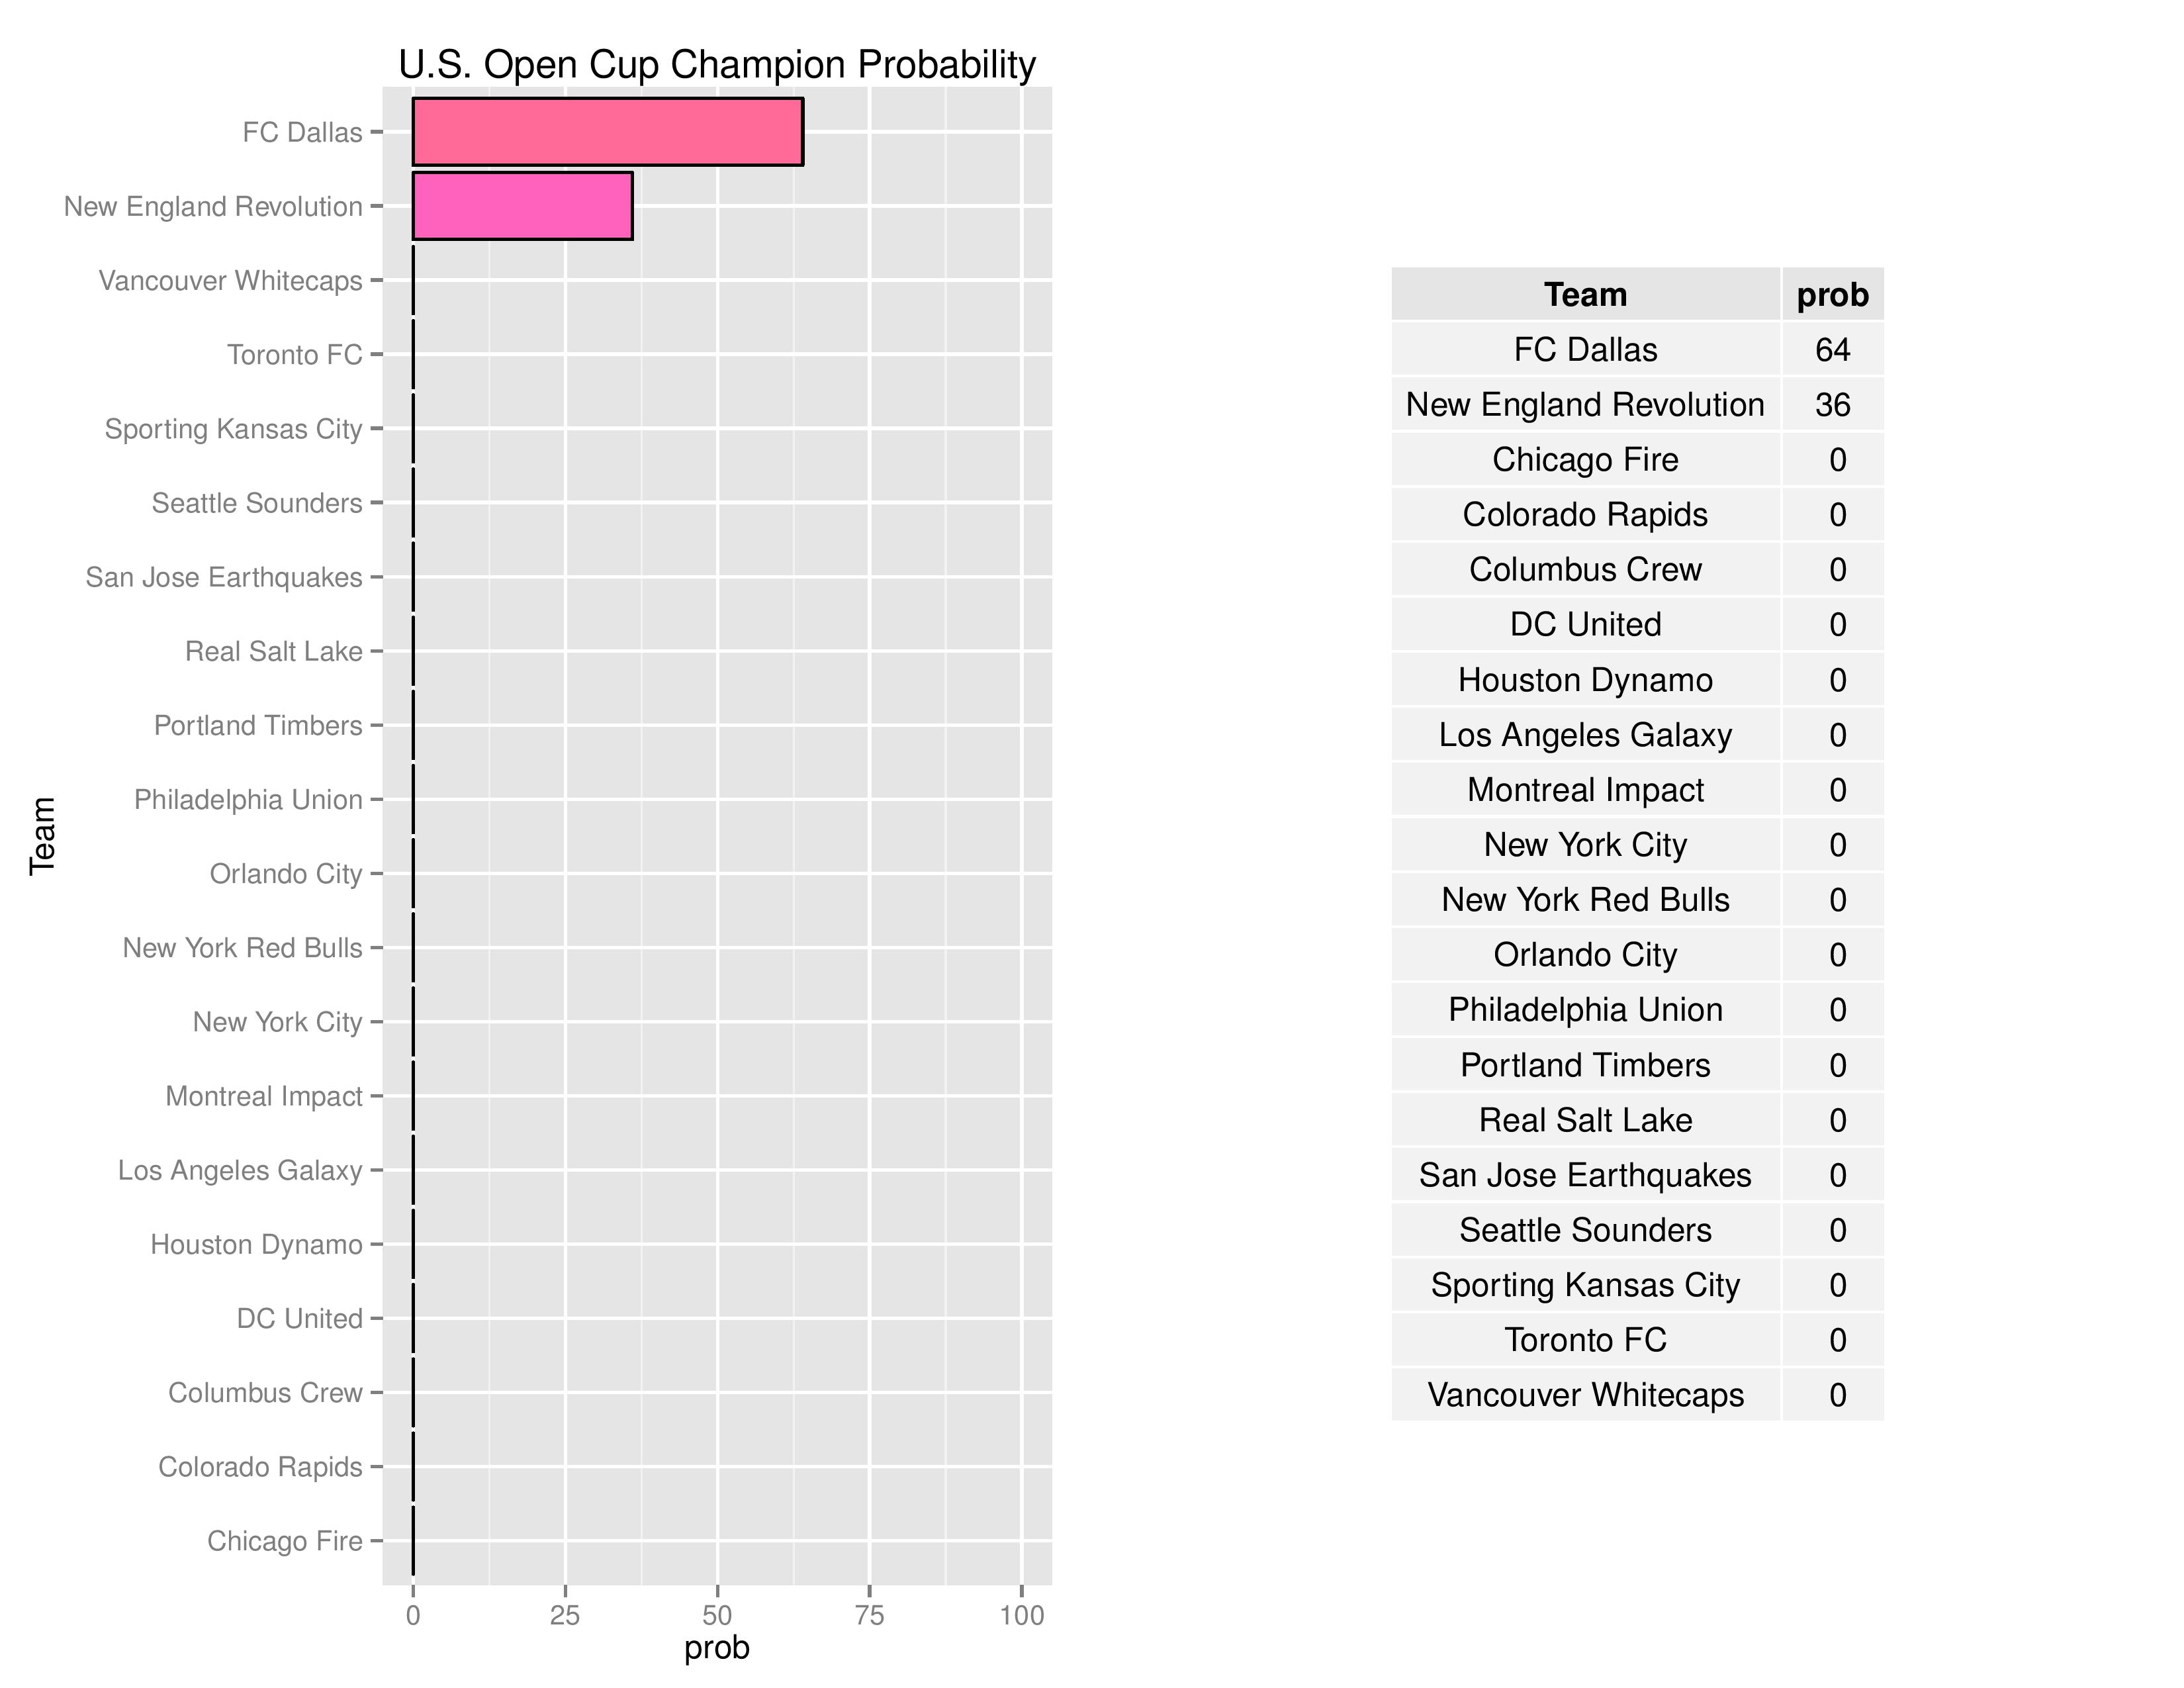
Philadelphia is eliminated from the US Open Cup. Tonight is the final. SEBA gaves FC Dallas nearly double the odds of New England, both for skill-of-team and for home-field-advantage. Dallas won the final on Tuesday night, 4-2.
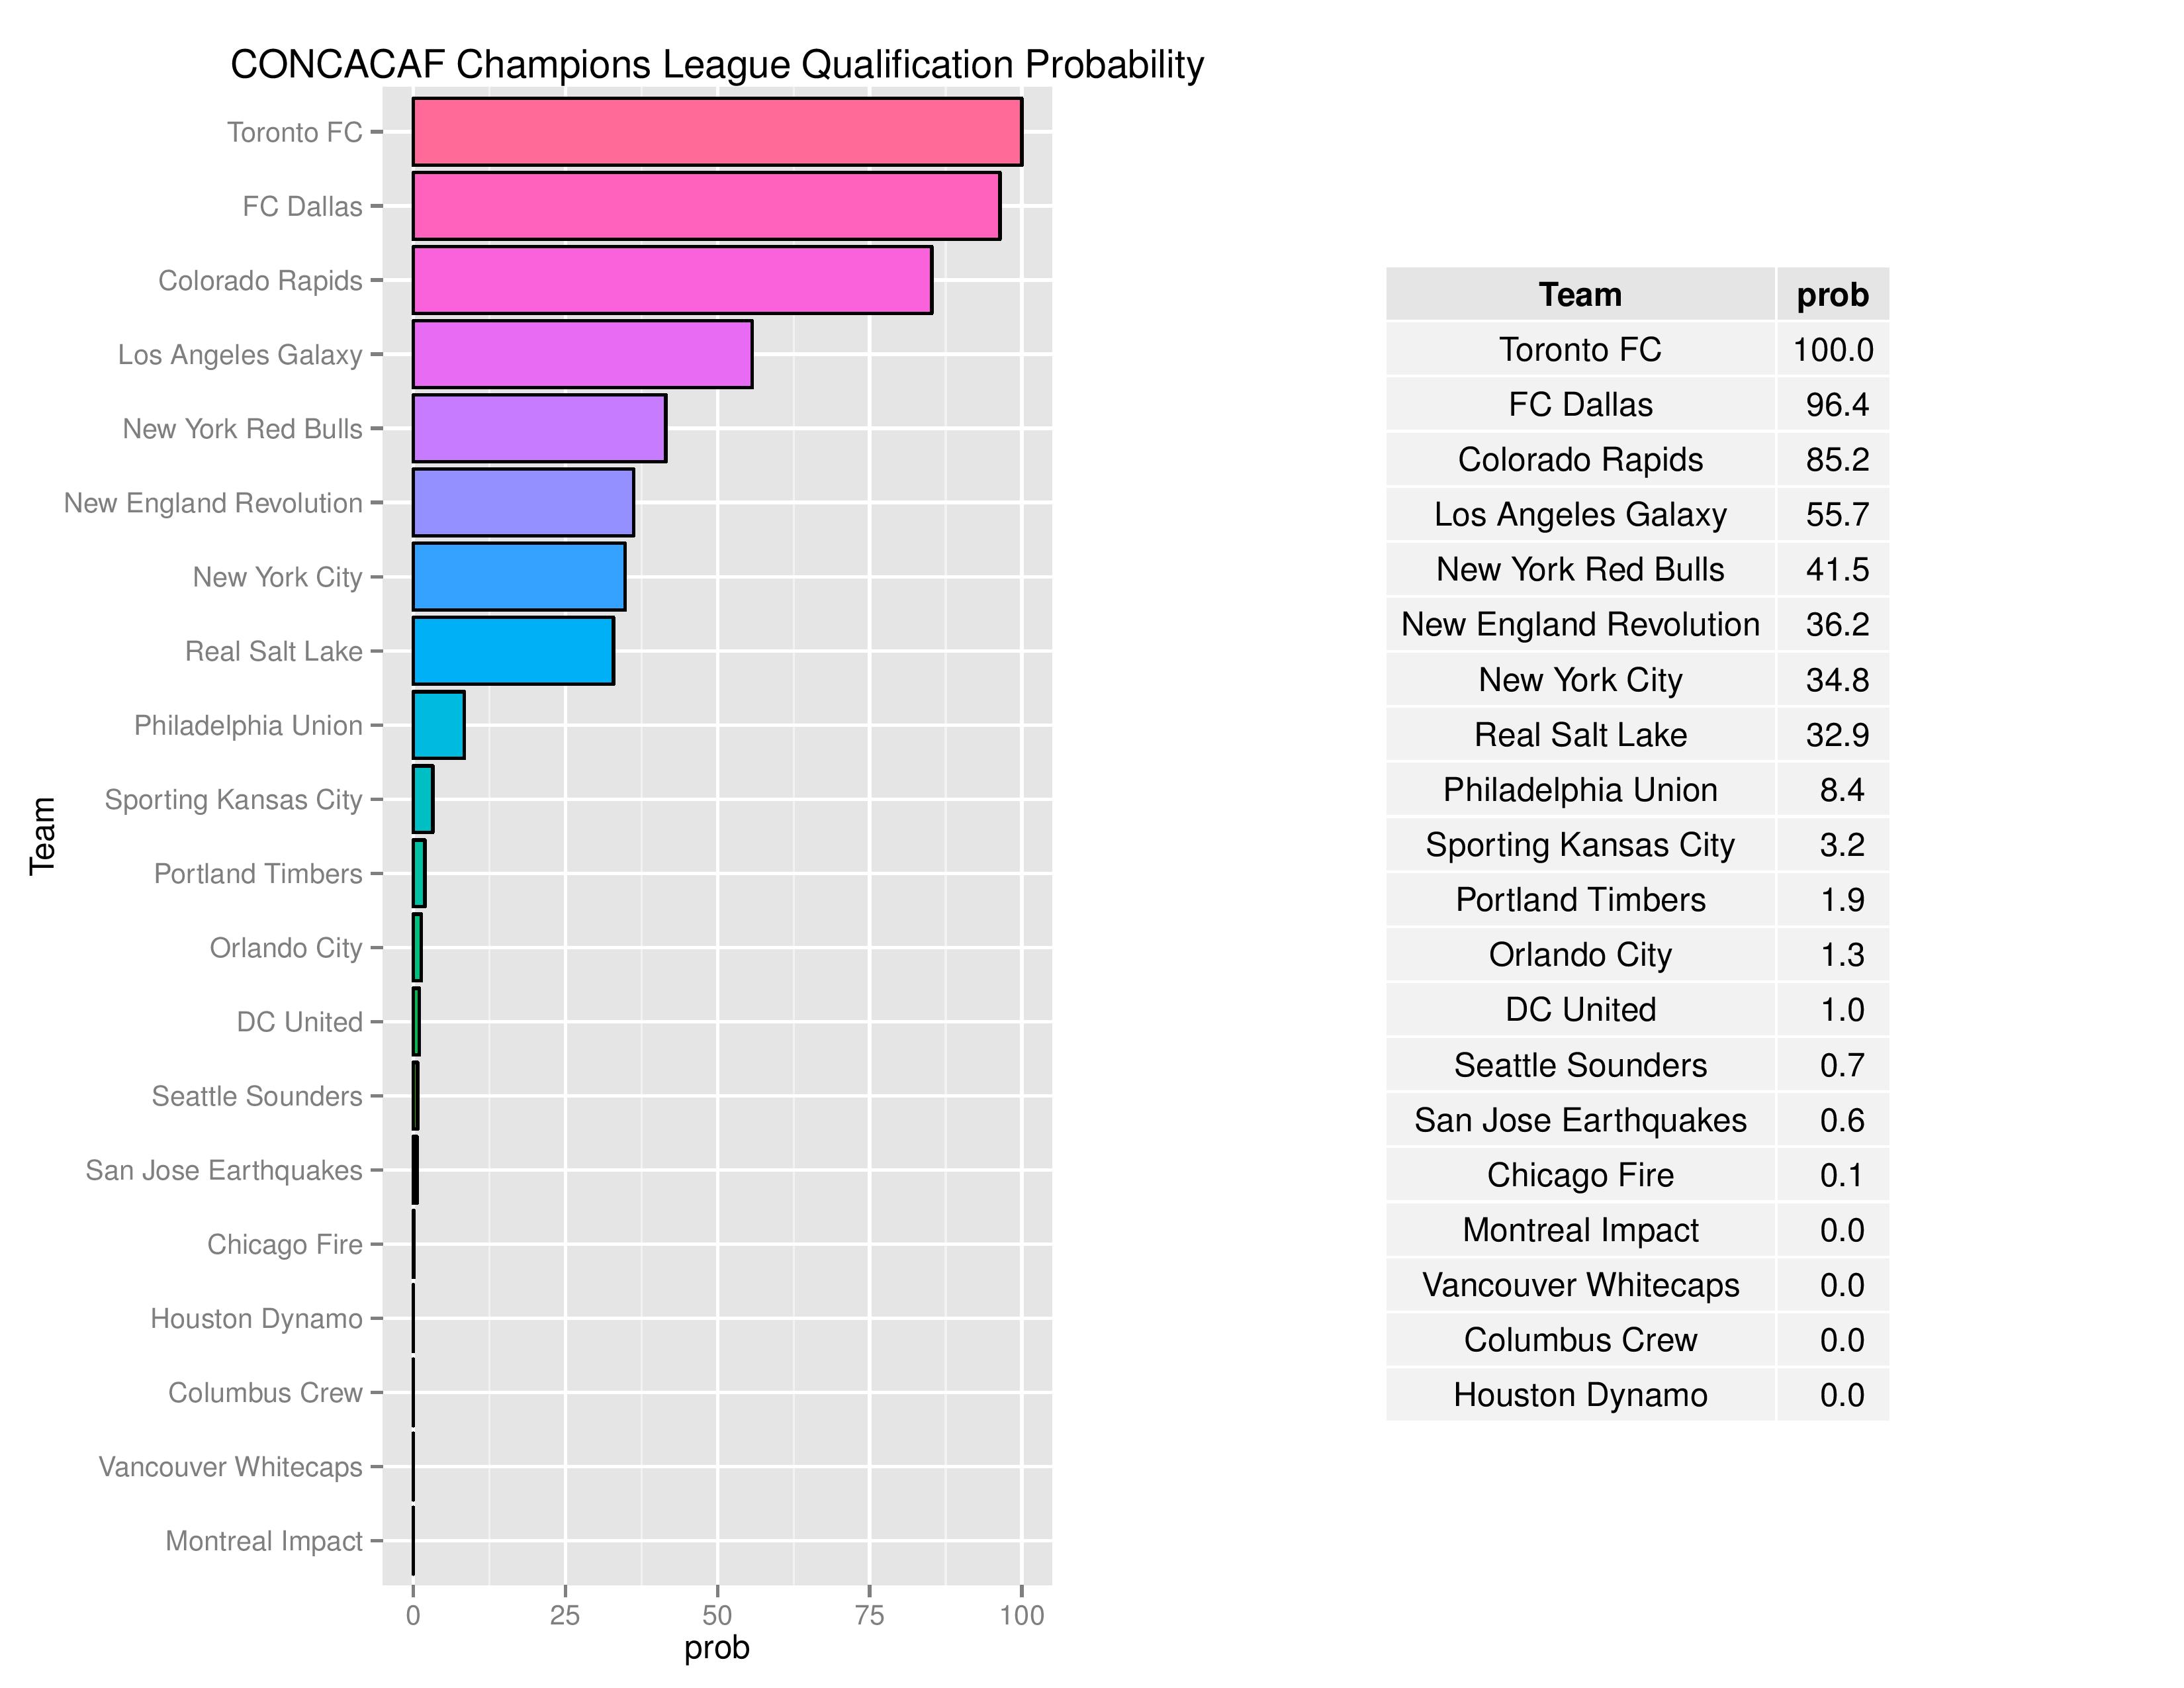
Philadelphia’s probability of qualifying for the CONCACAF Champions League has fallen again to 8.4% from 12.1%.
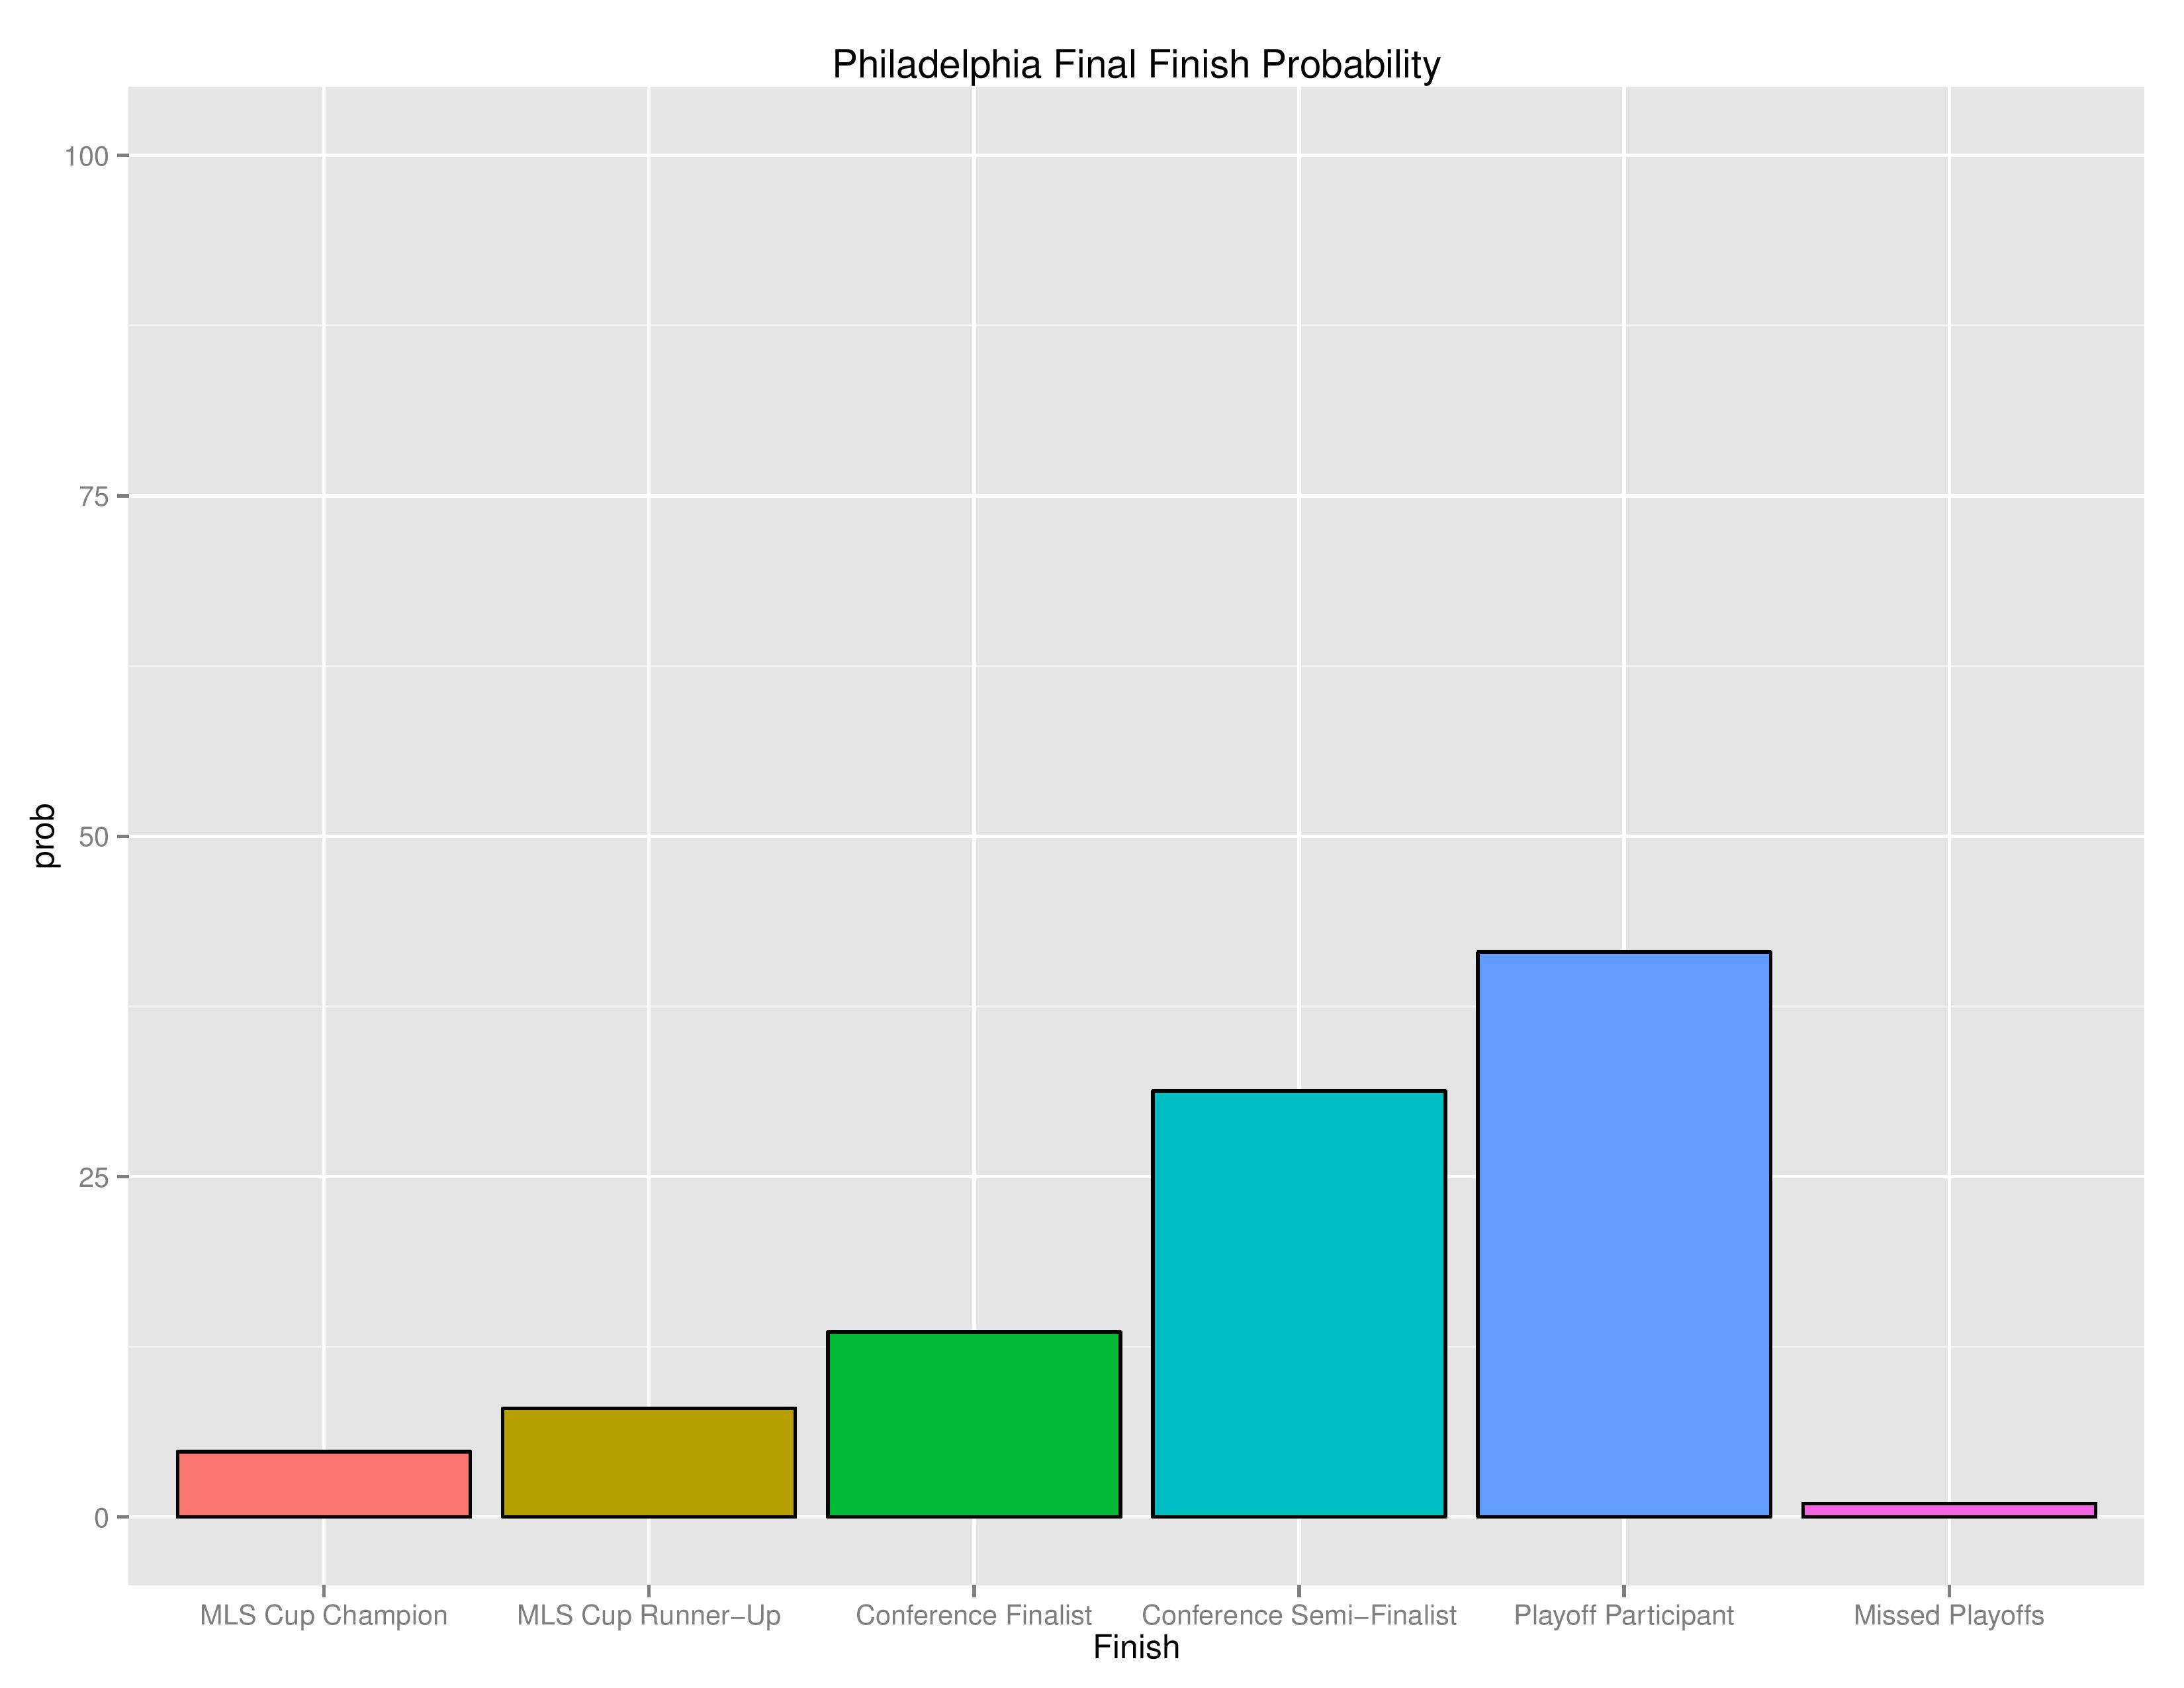
Philadelphia finishing
The following shows the probability of various playoff categories and Philadelphia’s probability of each of them.
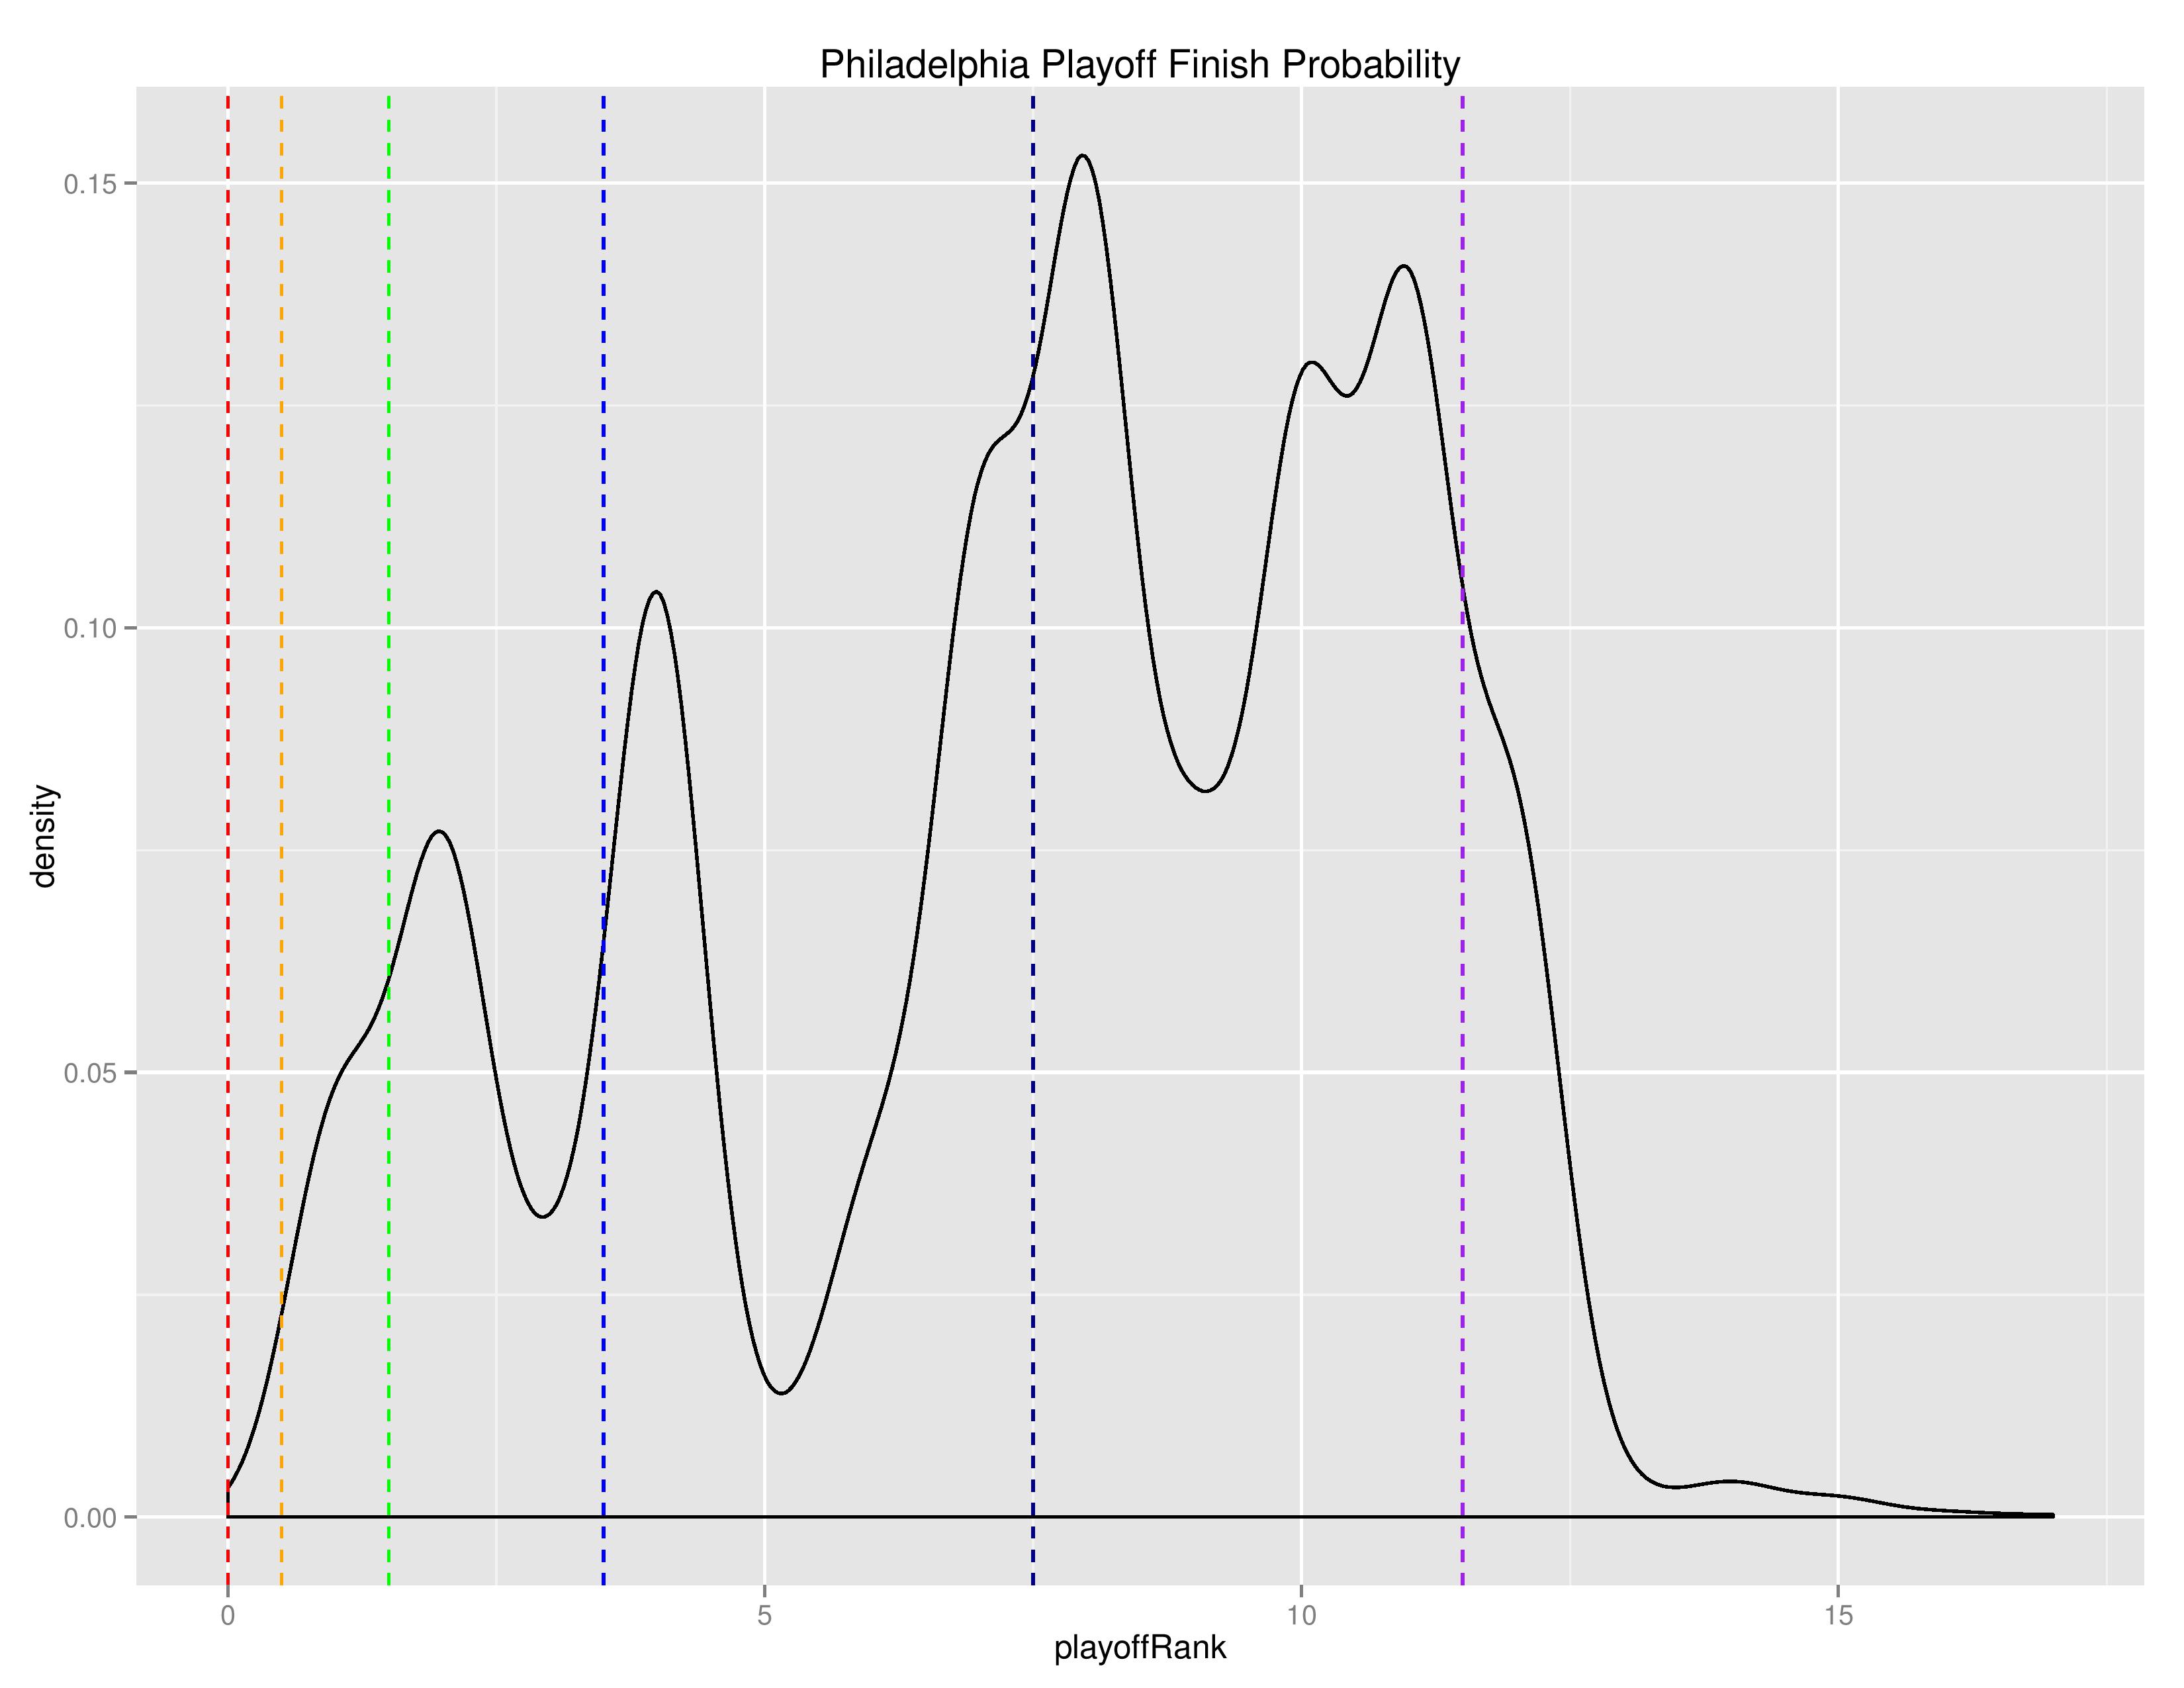
The following is a “density” chart showing the relative probability of Philadelphia finishing at the different after-playoffs rankings from 1 to 20.
The following is the list of Philadelphia’s remaining scheduled matches accompanied by result probabilities as predicted by SEBA.

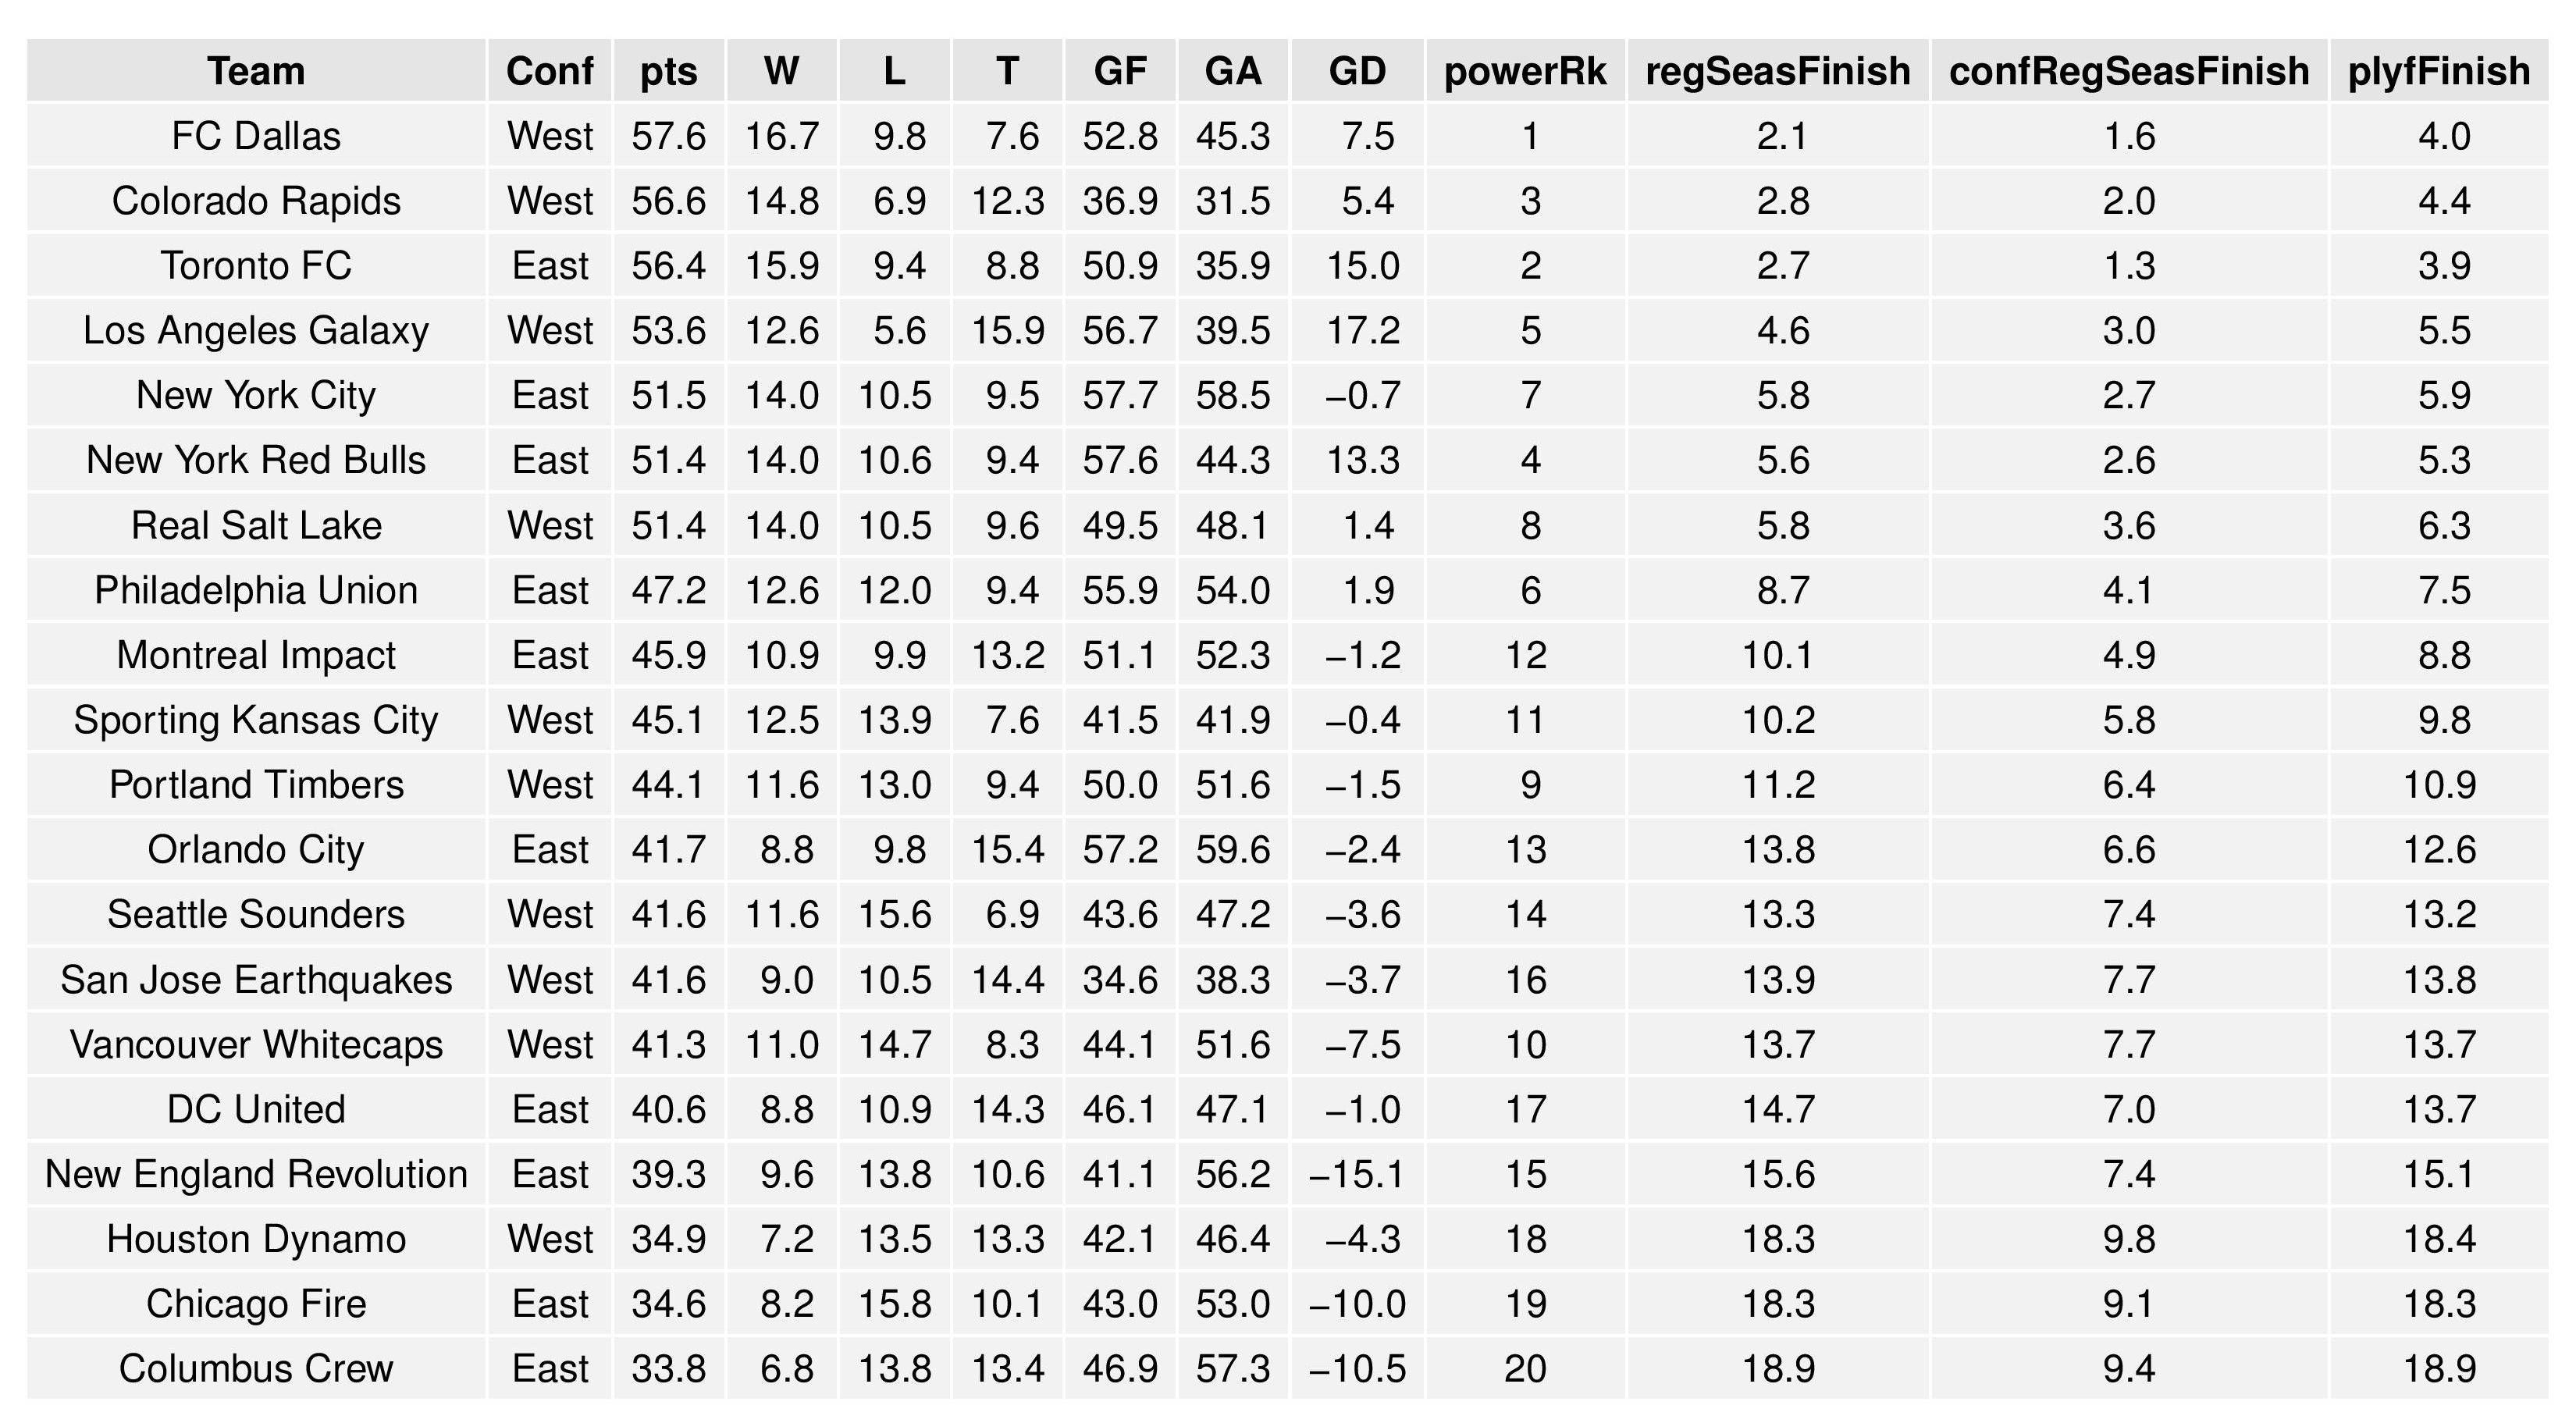
The charts below show the average results of all the simulations and the probabilities associated with all of the above. The chart is broken up into two parts in order to better fit on your screen.
(Note: CCLAlternate refers to qualifying for CONCACAF Champions League non-traditionally. U.S. teams qualify by winning the MLS Cup, winning the Supporters’ Shield, winning the Conference in the regular season, and by winning the U.S. Open Cup. If a Canadian team wins any of these or a U.S. team wins more than one, the extra slots are filled by top regular season performers.) (Also, “regSeasFinish” refers to finishing the conference in first place AND not winning other CCL slots like MLSCup, Supporters’ Shield, and USOC)
Changes Over Time
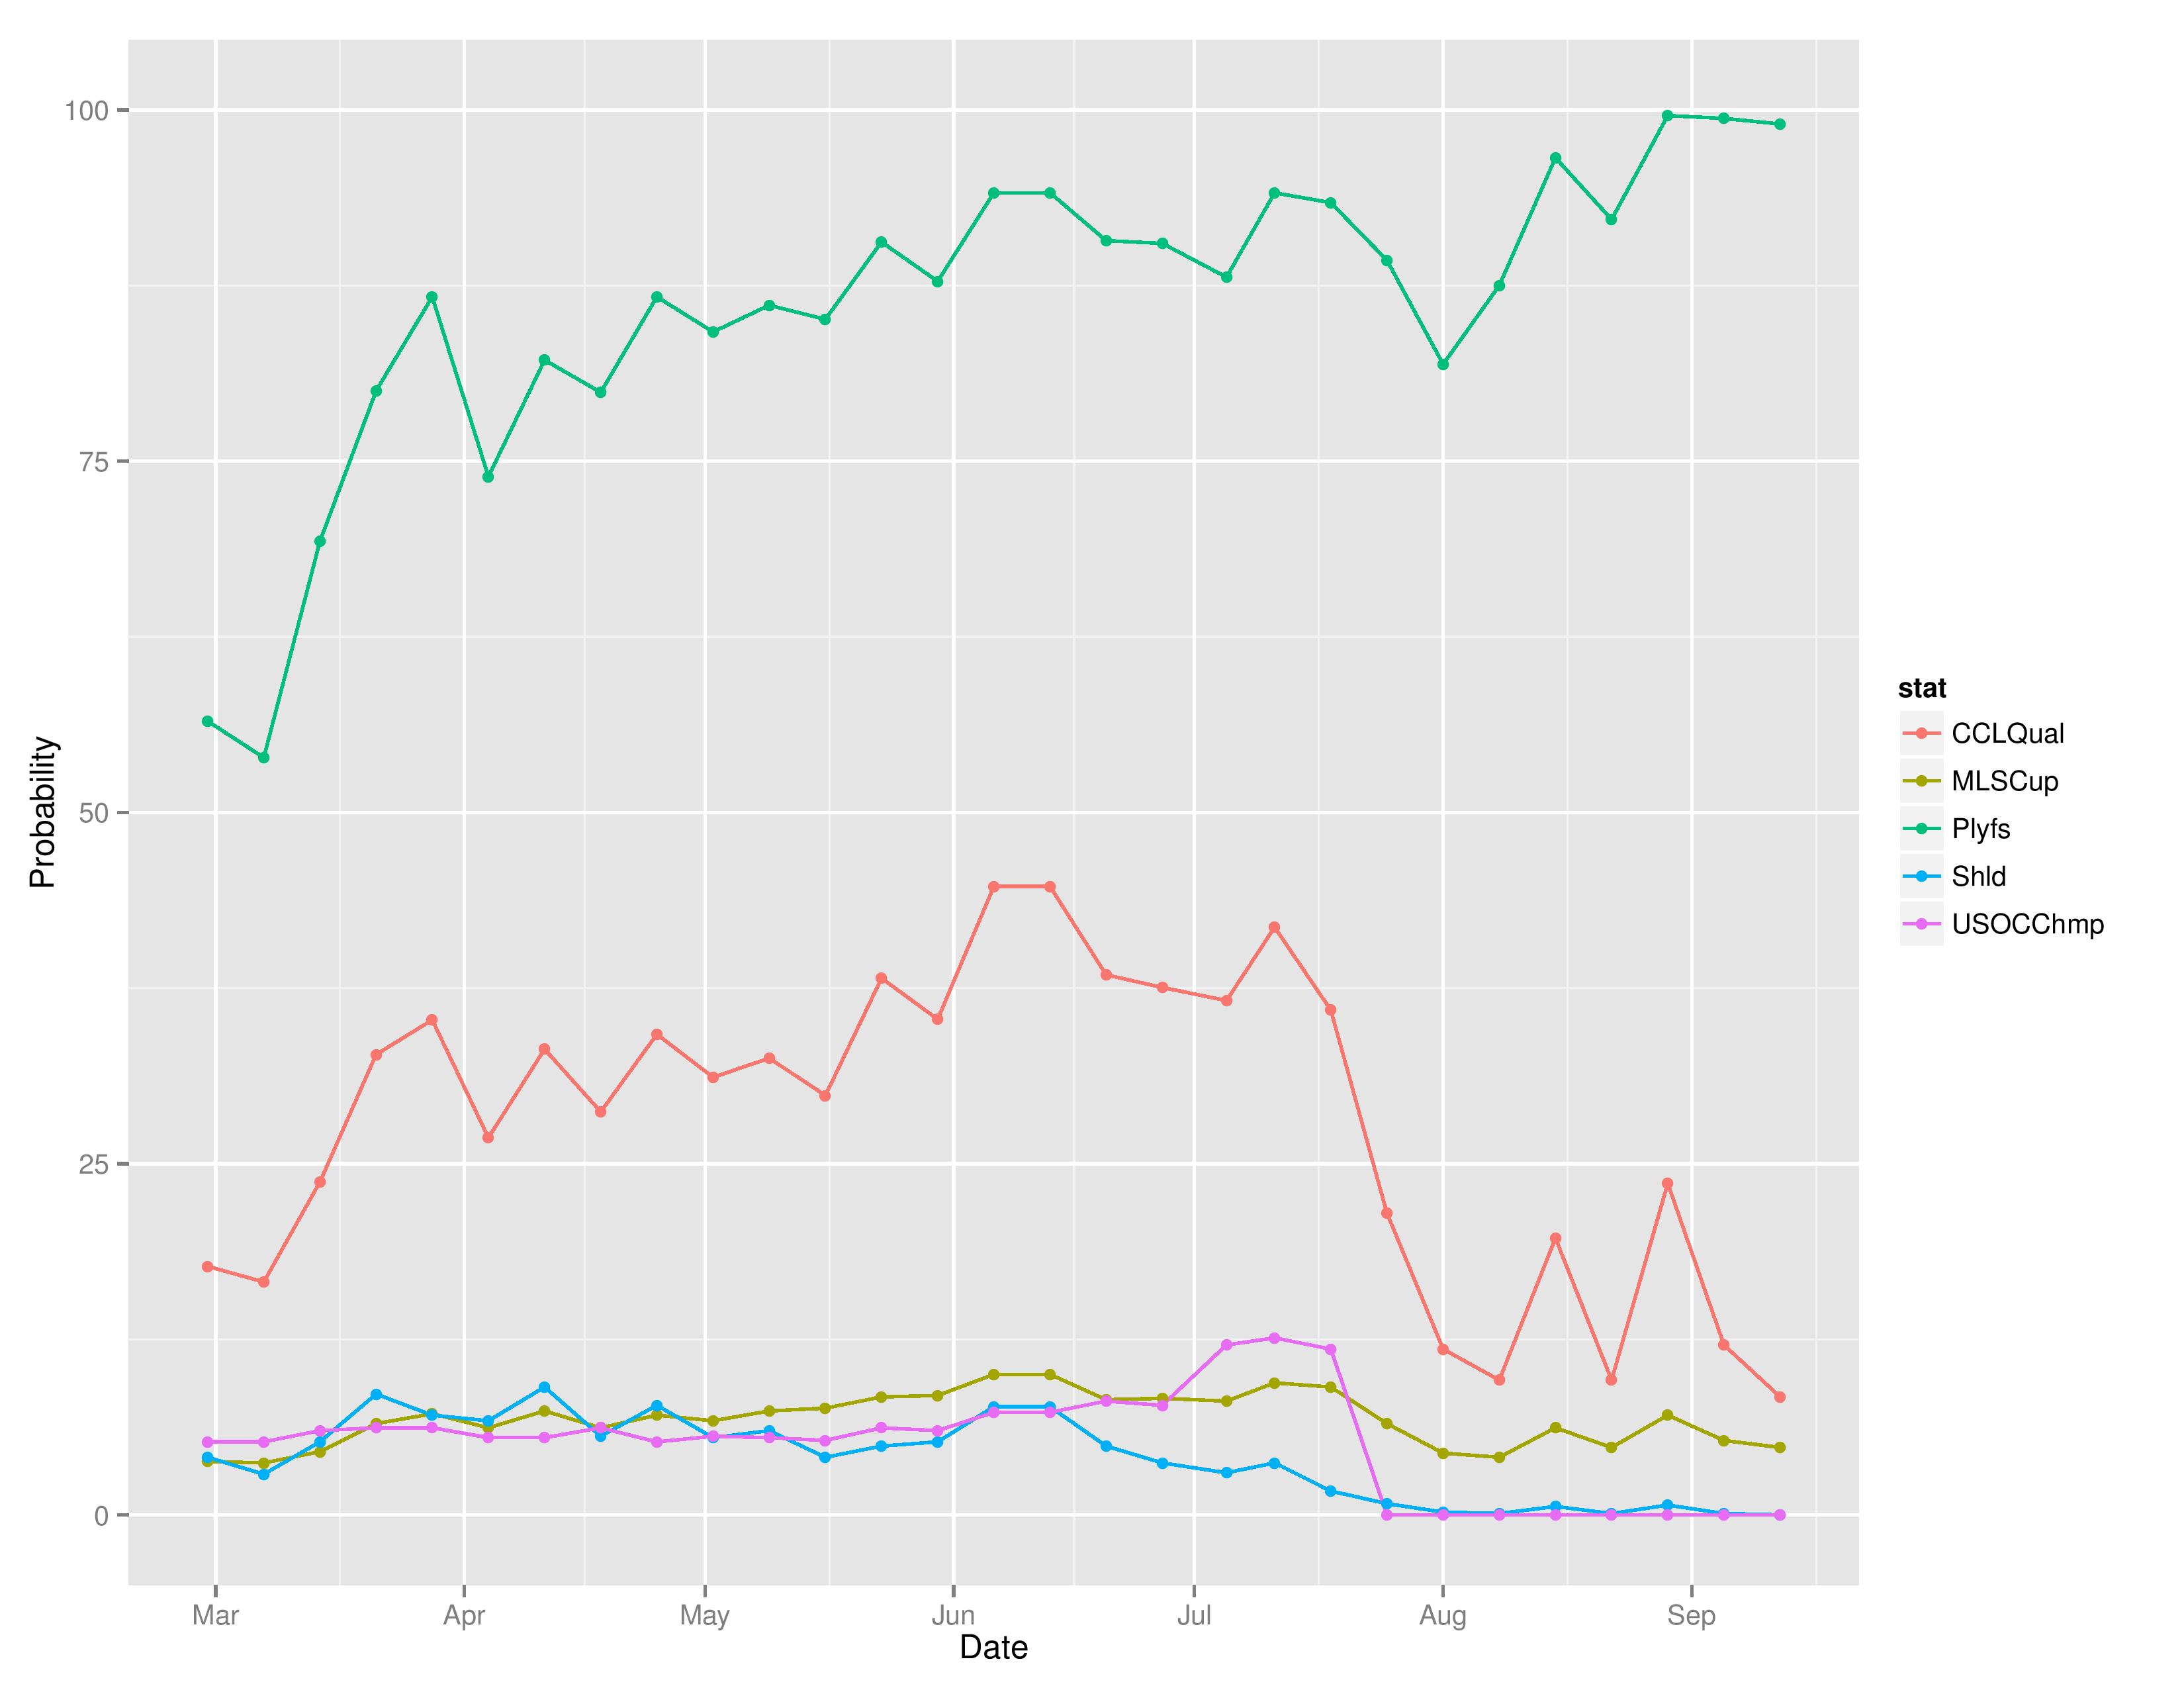
This chart shows how Philadelphia’s chances at each of the outcomes has evolved over the course of the season.
This shows the evolution of Philadelphia’s movement within SEBA and other media outlets’ power rankings.
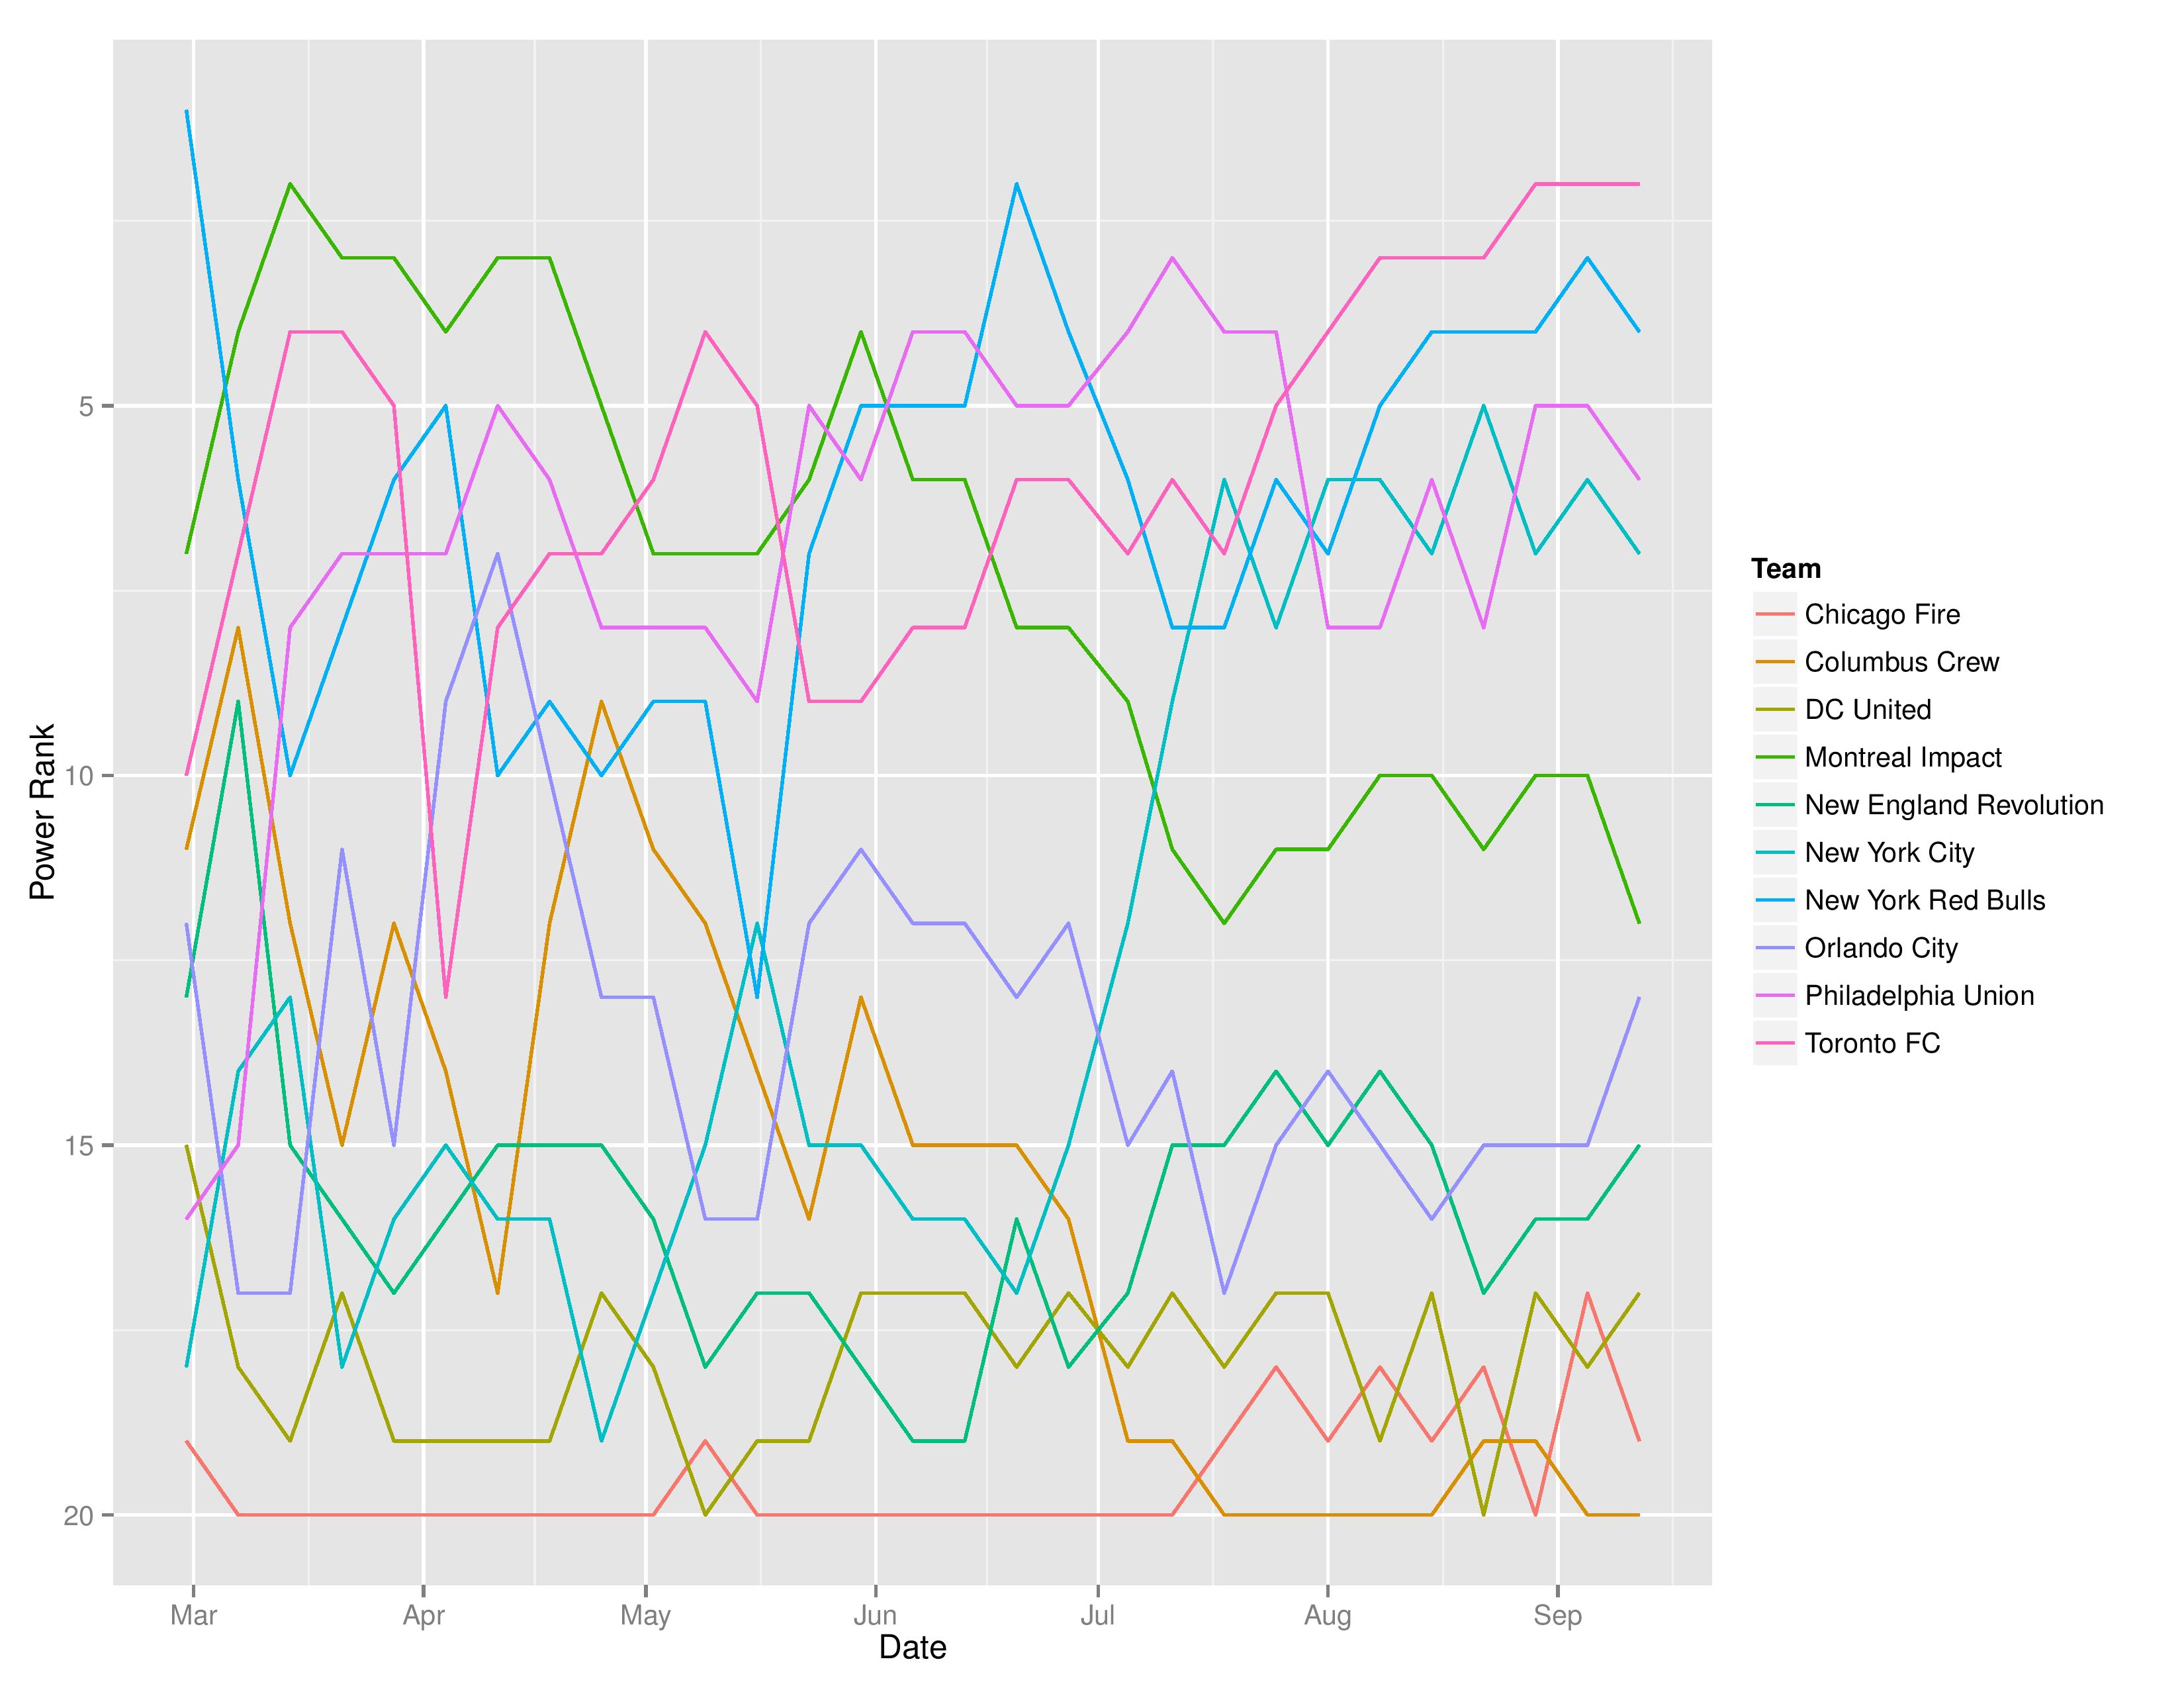
This shows the MLS Eastern Conference’s power rankings’ evolution in SEBA throughout the season.
Records
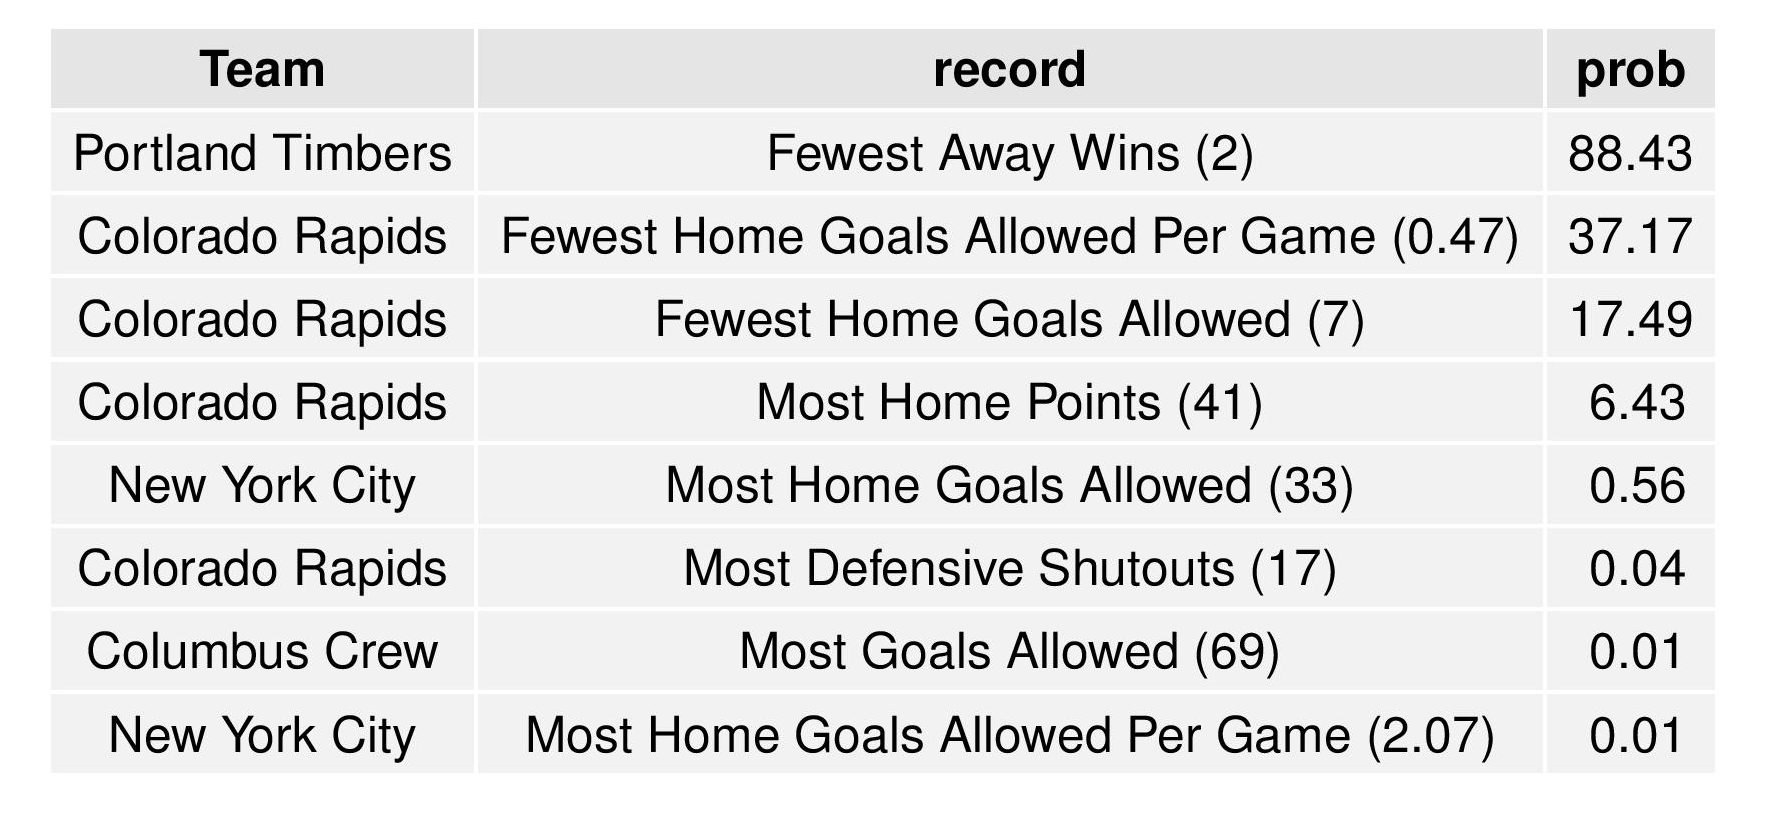
This shows the odds of breaking MLS single-season records, not of holding them. If more than one team could break the same record this season, they would both be represented below.
(Philadelphia did not break any single-season records in any of the 15,000 simulations.)
The following table shows all single-season records that had a record broken in at least one simulation. However, it limits the records to show only the most probable team for breaking each record.
USL Projections
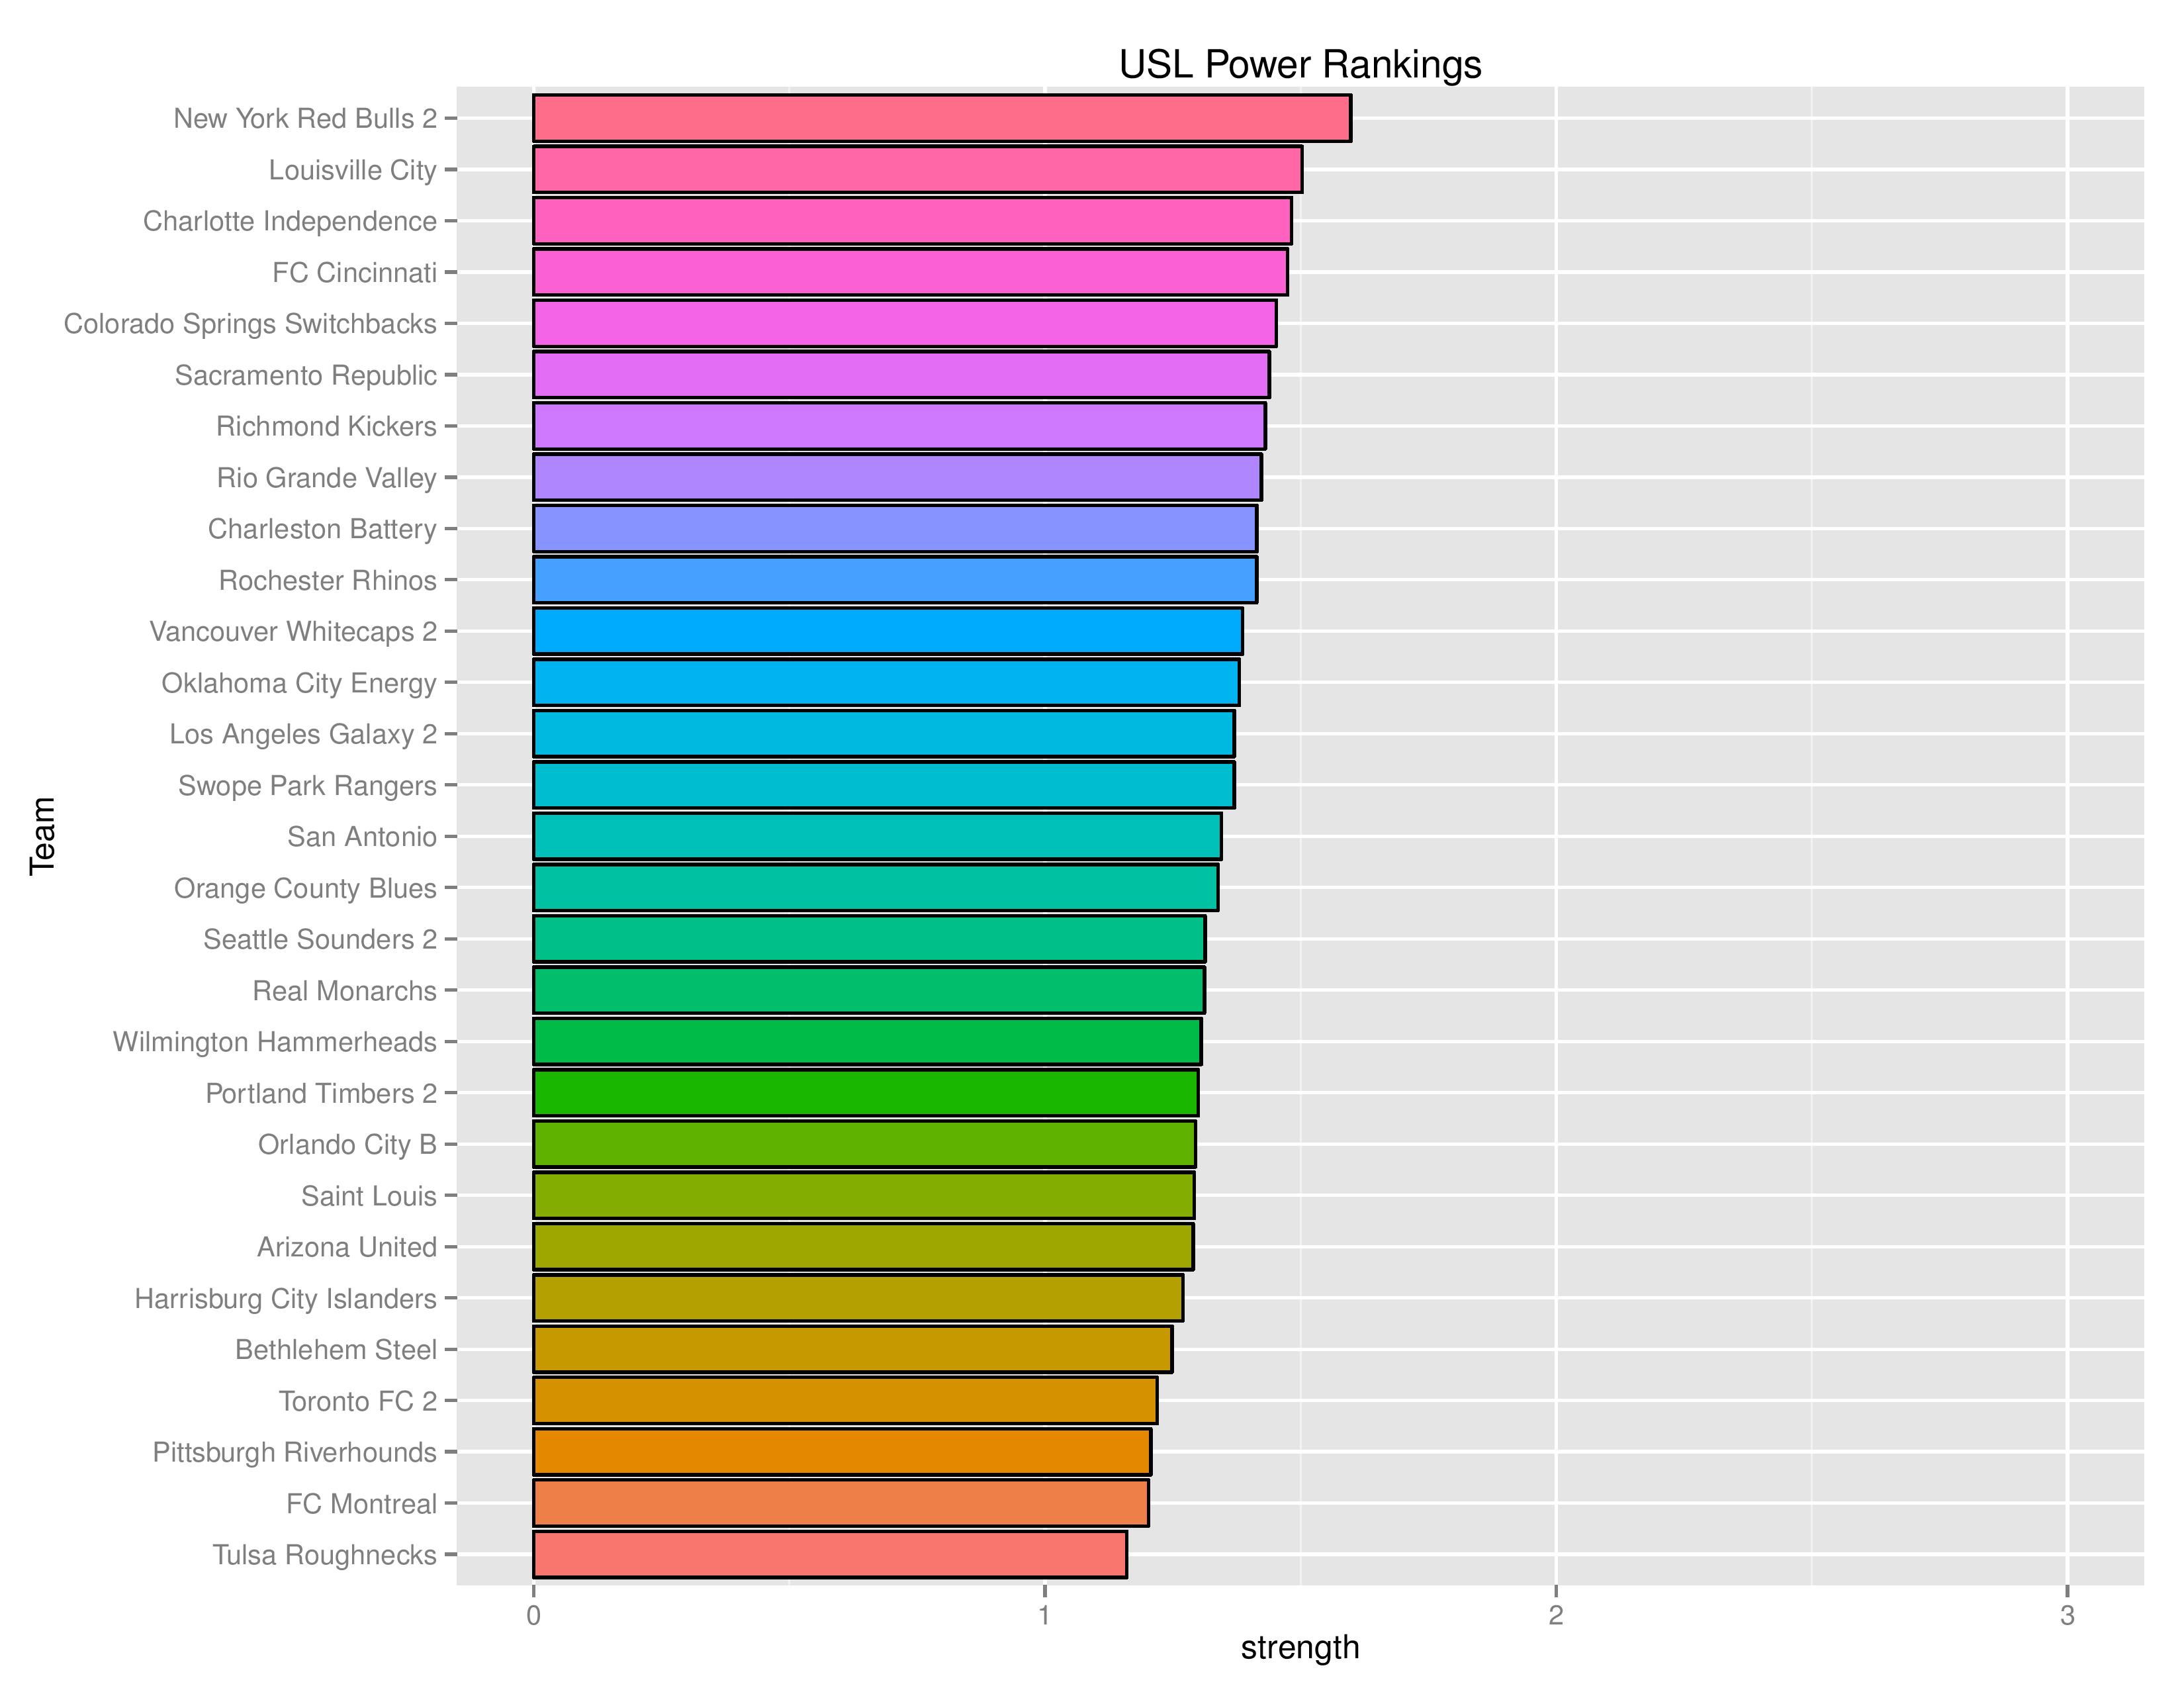
Bethlehem remained at 25th and the Harrisburg City Islanders declined one spot to 24th from 23rd. USLSoccer.com‘s top 10 rankings do not include either team.
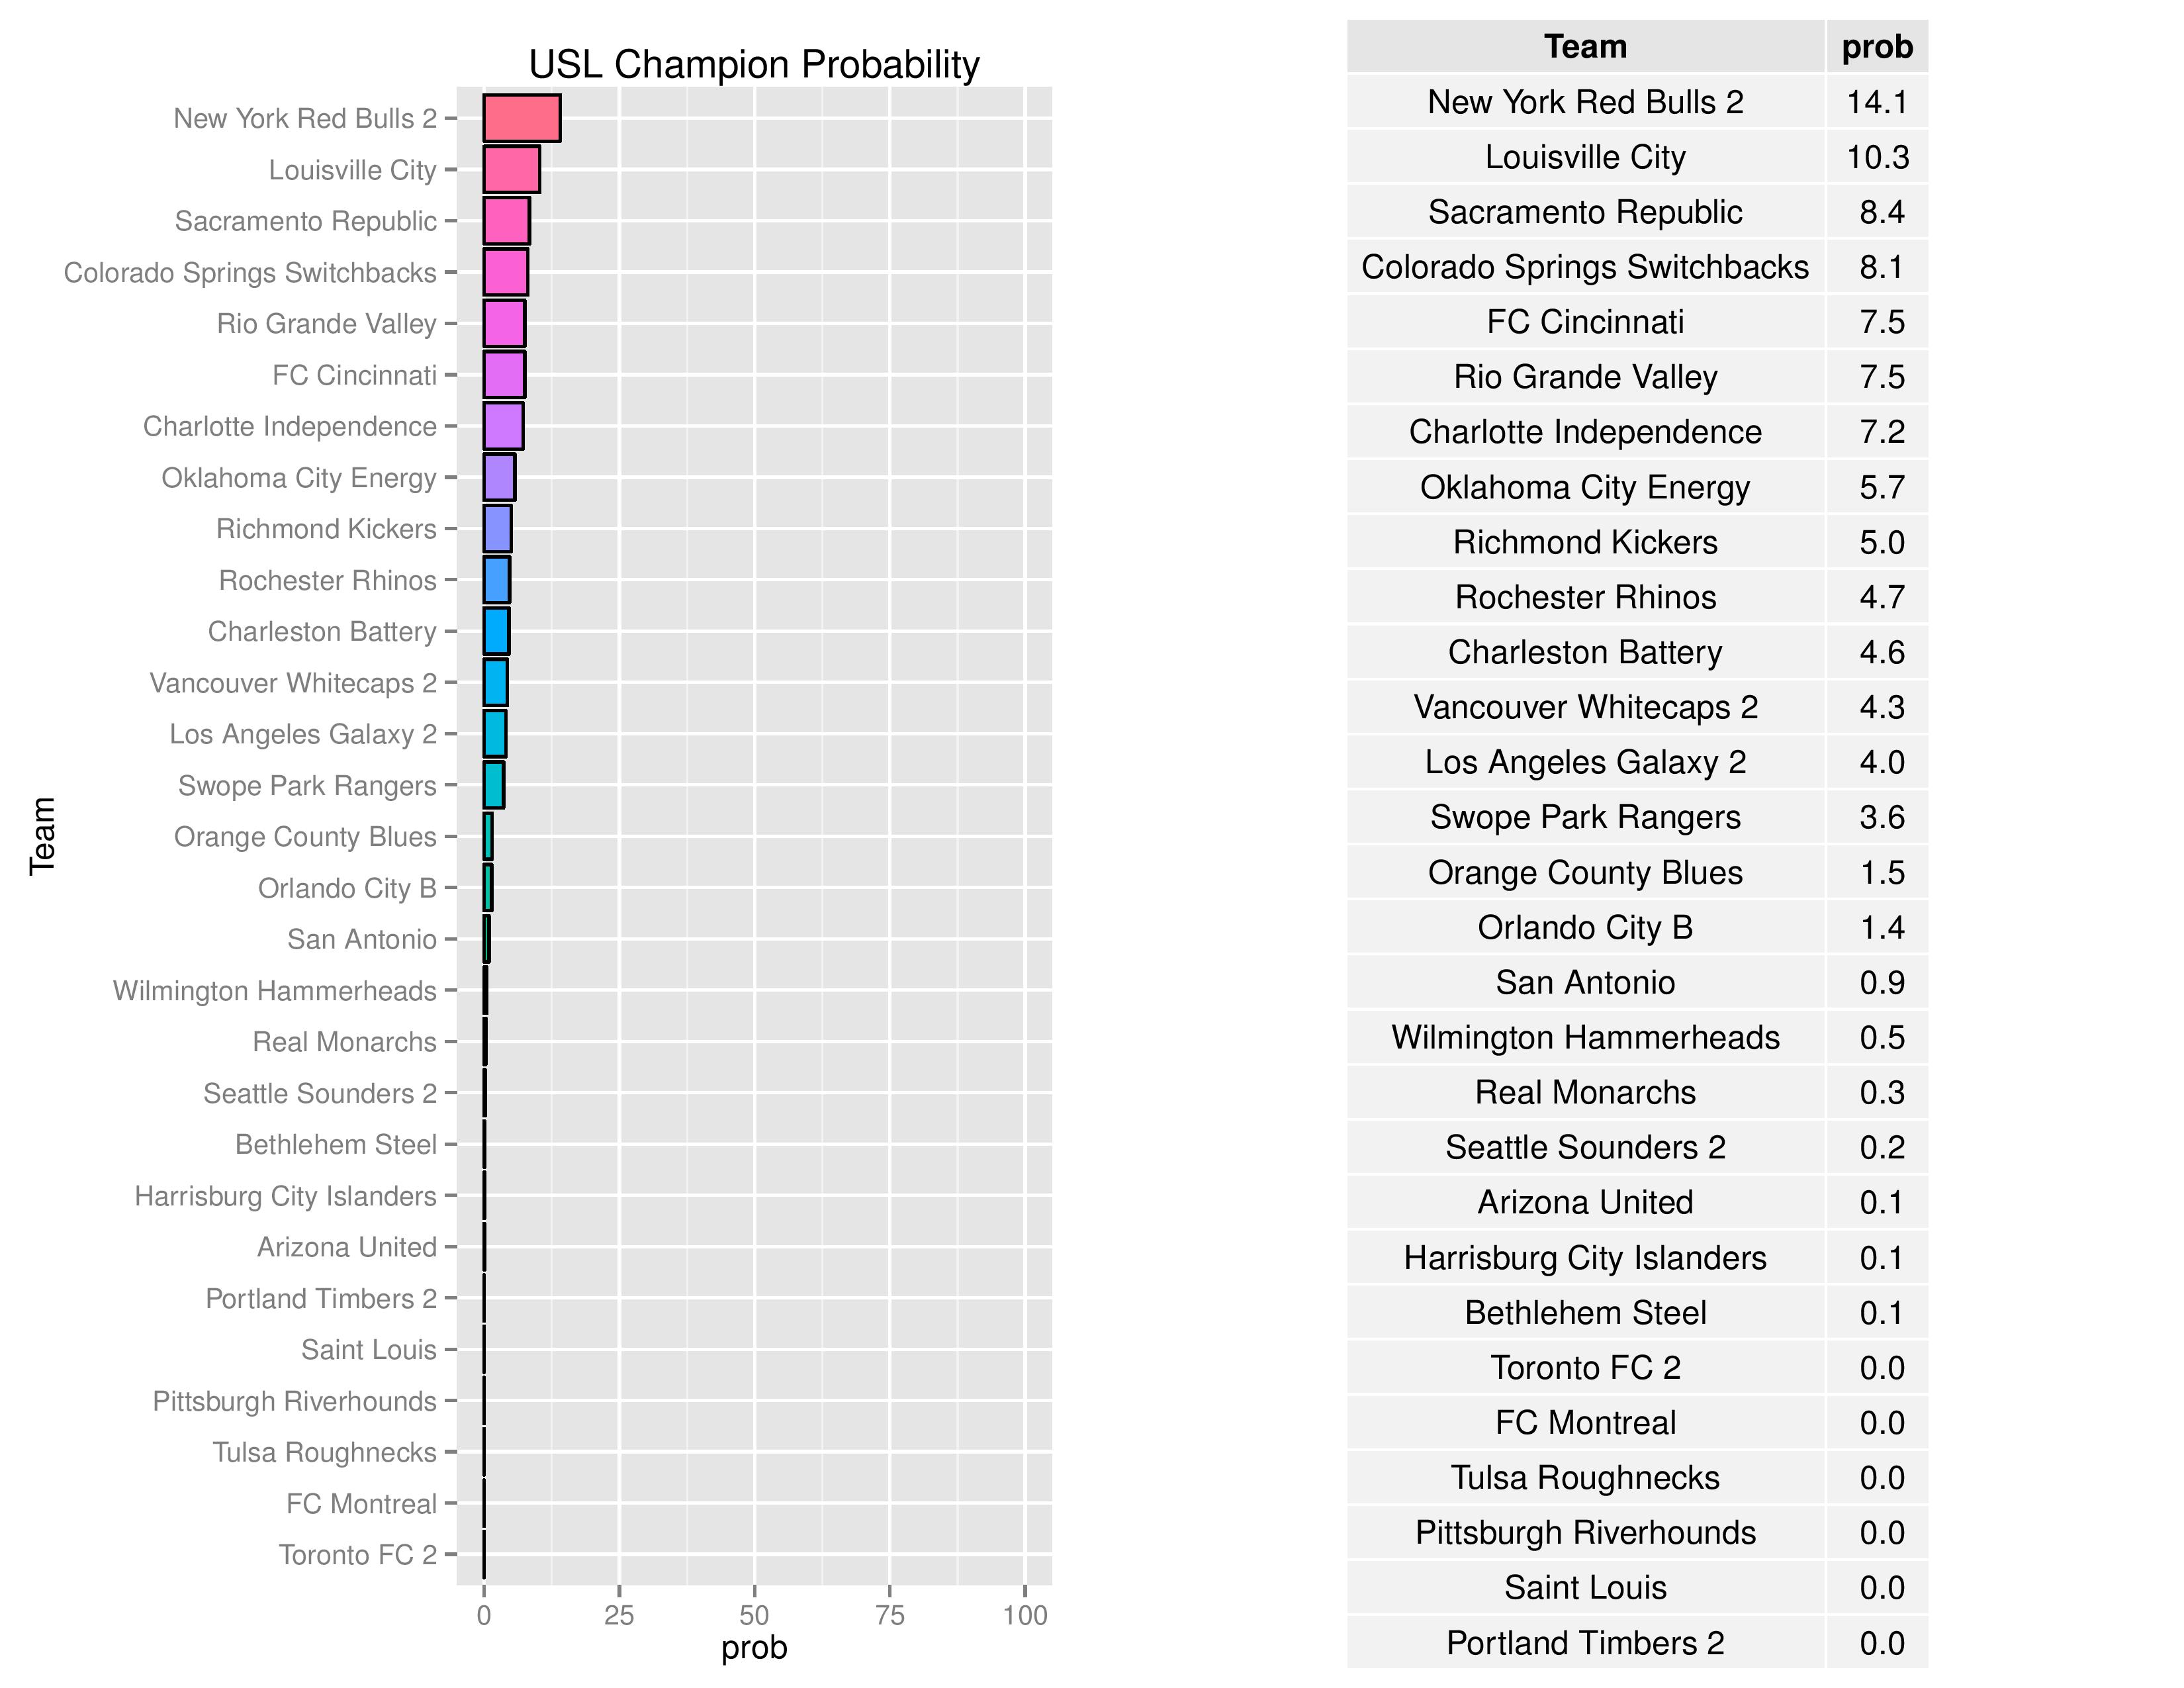
Bethlehem’s probability of making the playoffs actually increased despite the loss from 4.9% to 7.0%. Harrisburg City’s increased to 6.6% from 4.7%. They can thank the losses of many playoff contenders this week, including and especially, key losses for Orlando City B (loss to Toronto-2), San Antonio (home loss to fellow-contender Orange County), and Real Monarchs (home loss to Saint Louis).
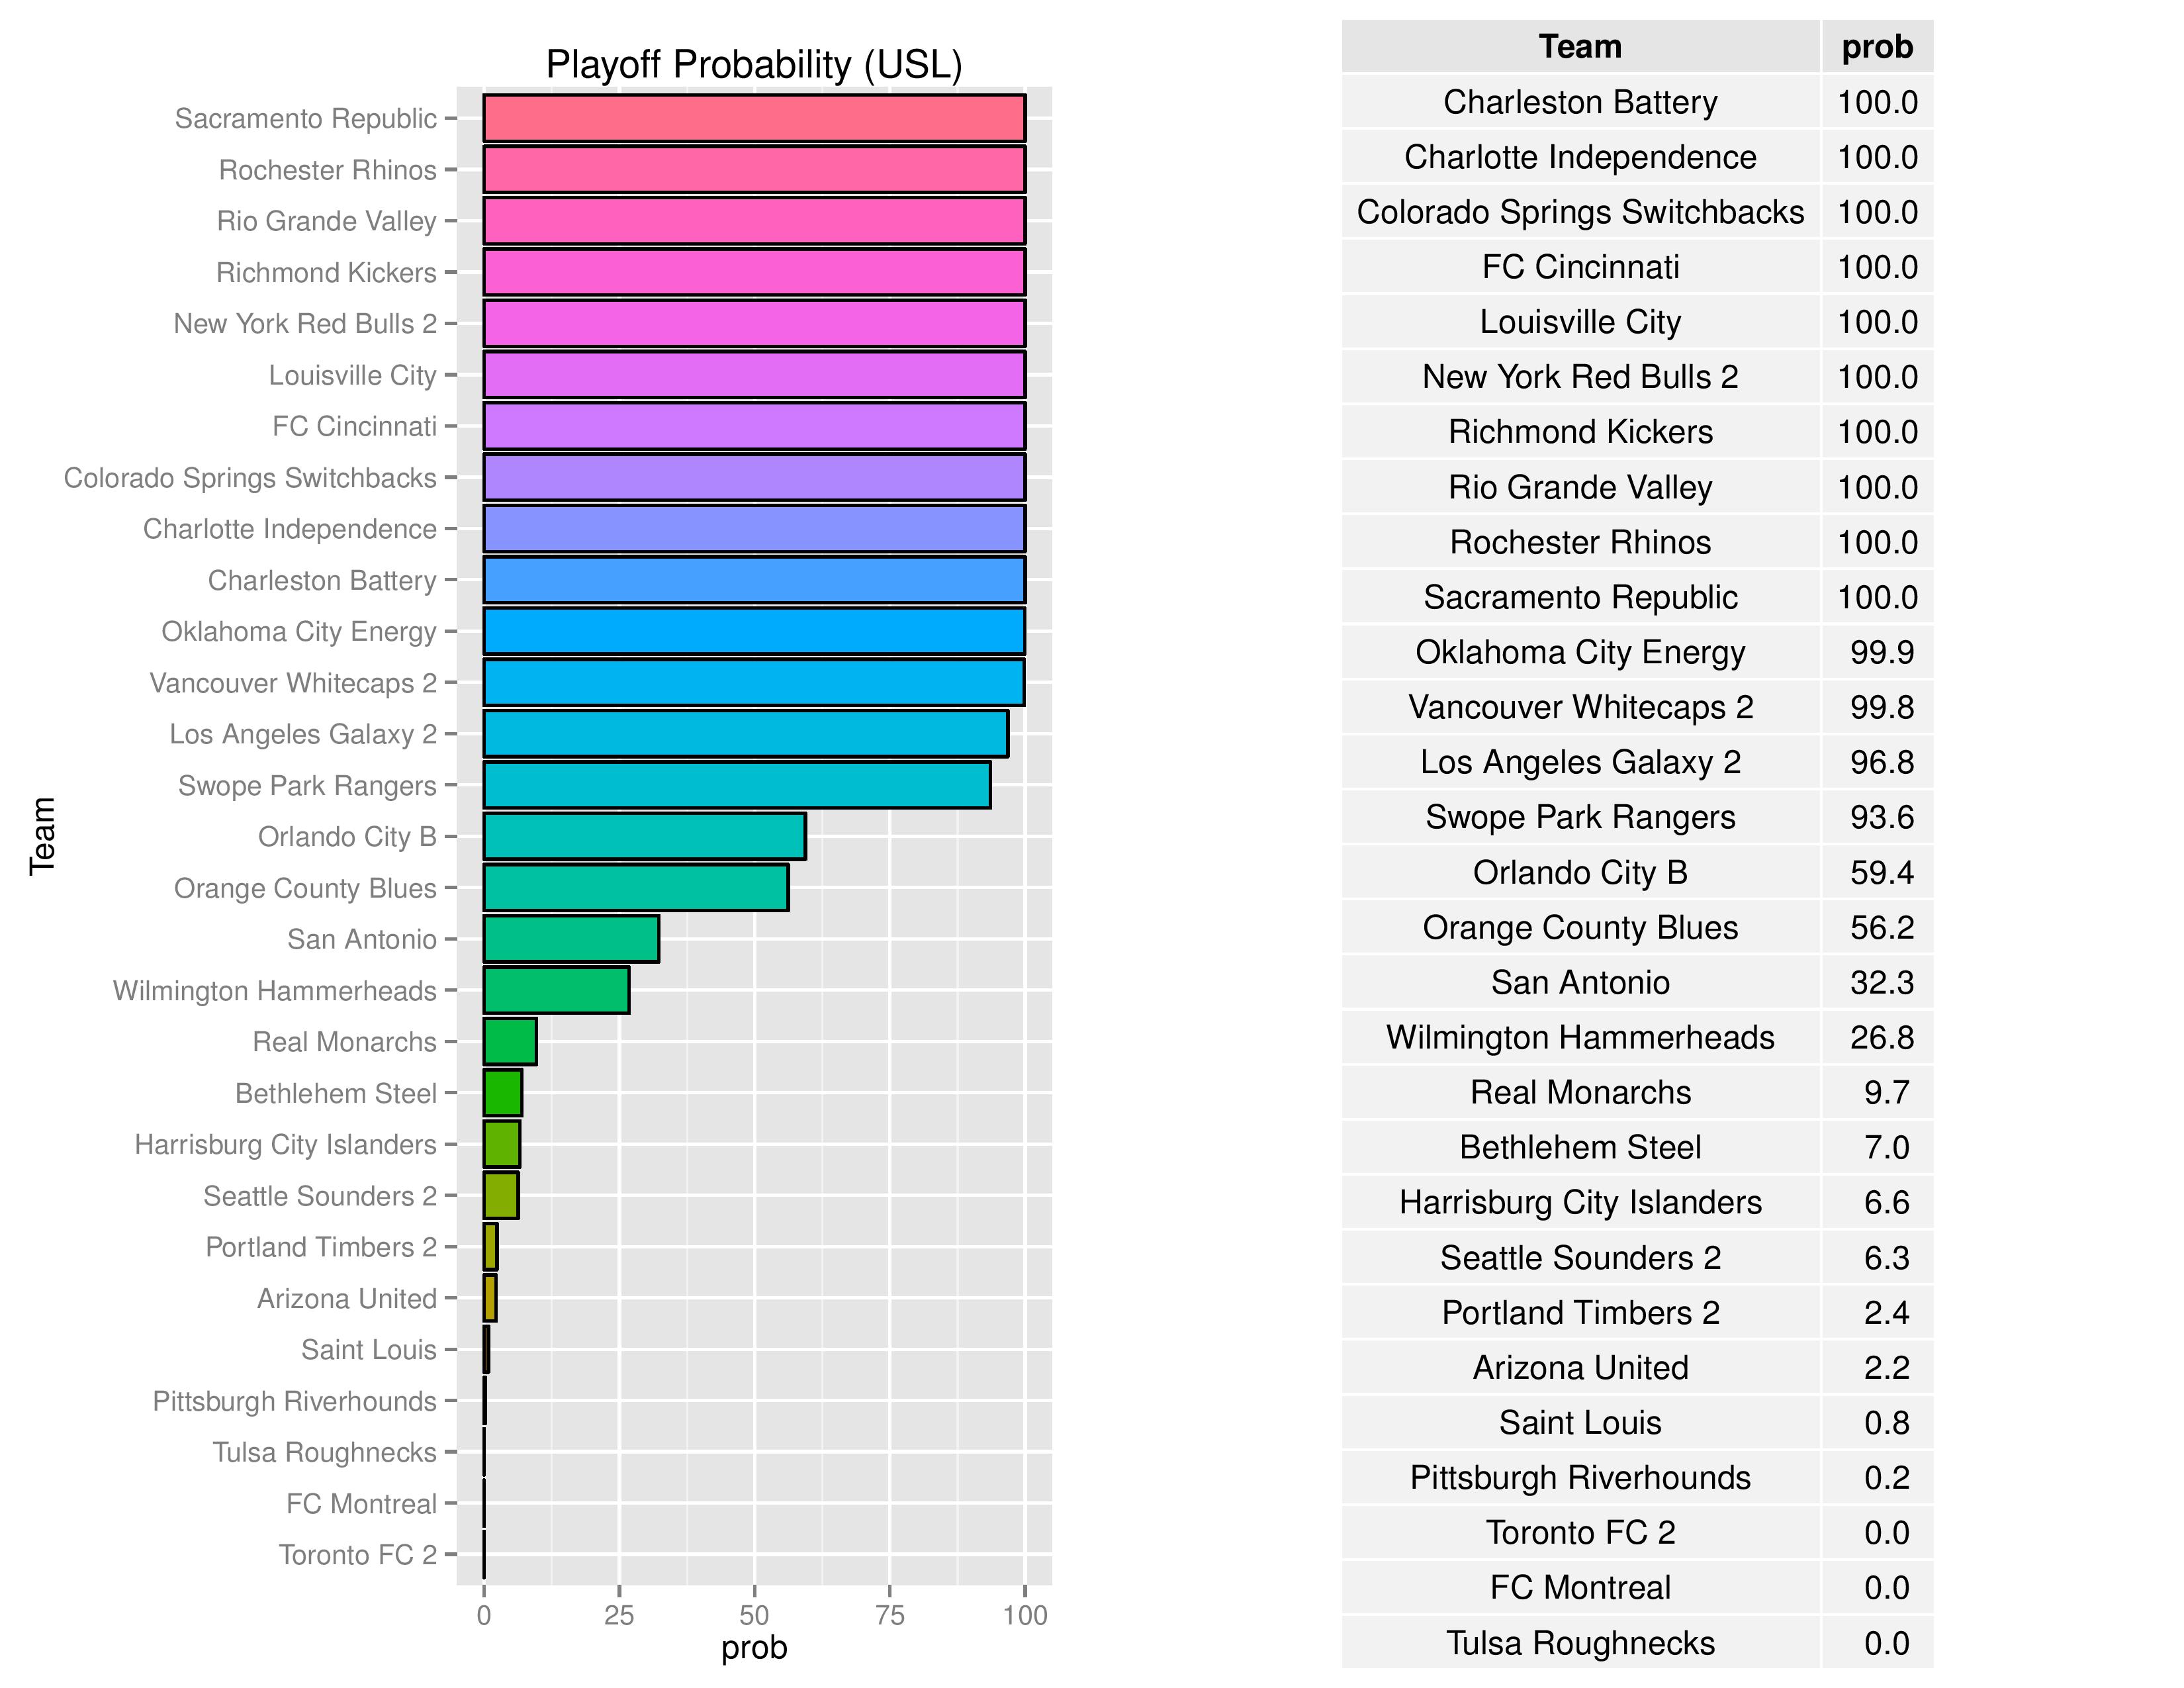
NYRB-2 has clinched the Regular Season Title.

Bethlehem’s probability of winning the USL Championship remained at 0.1%. Harrisburg City’s chances also remained at 0.1%.
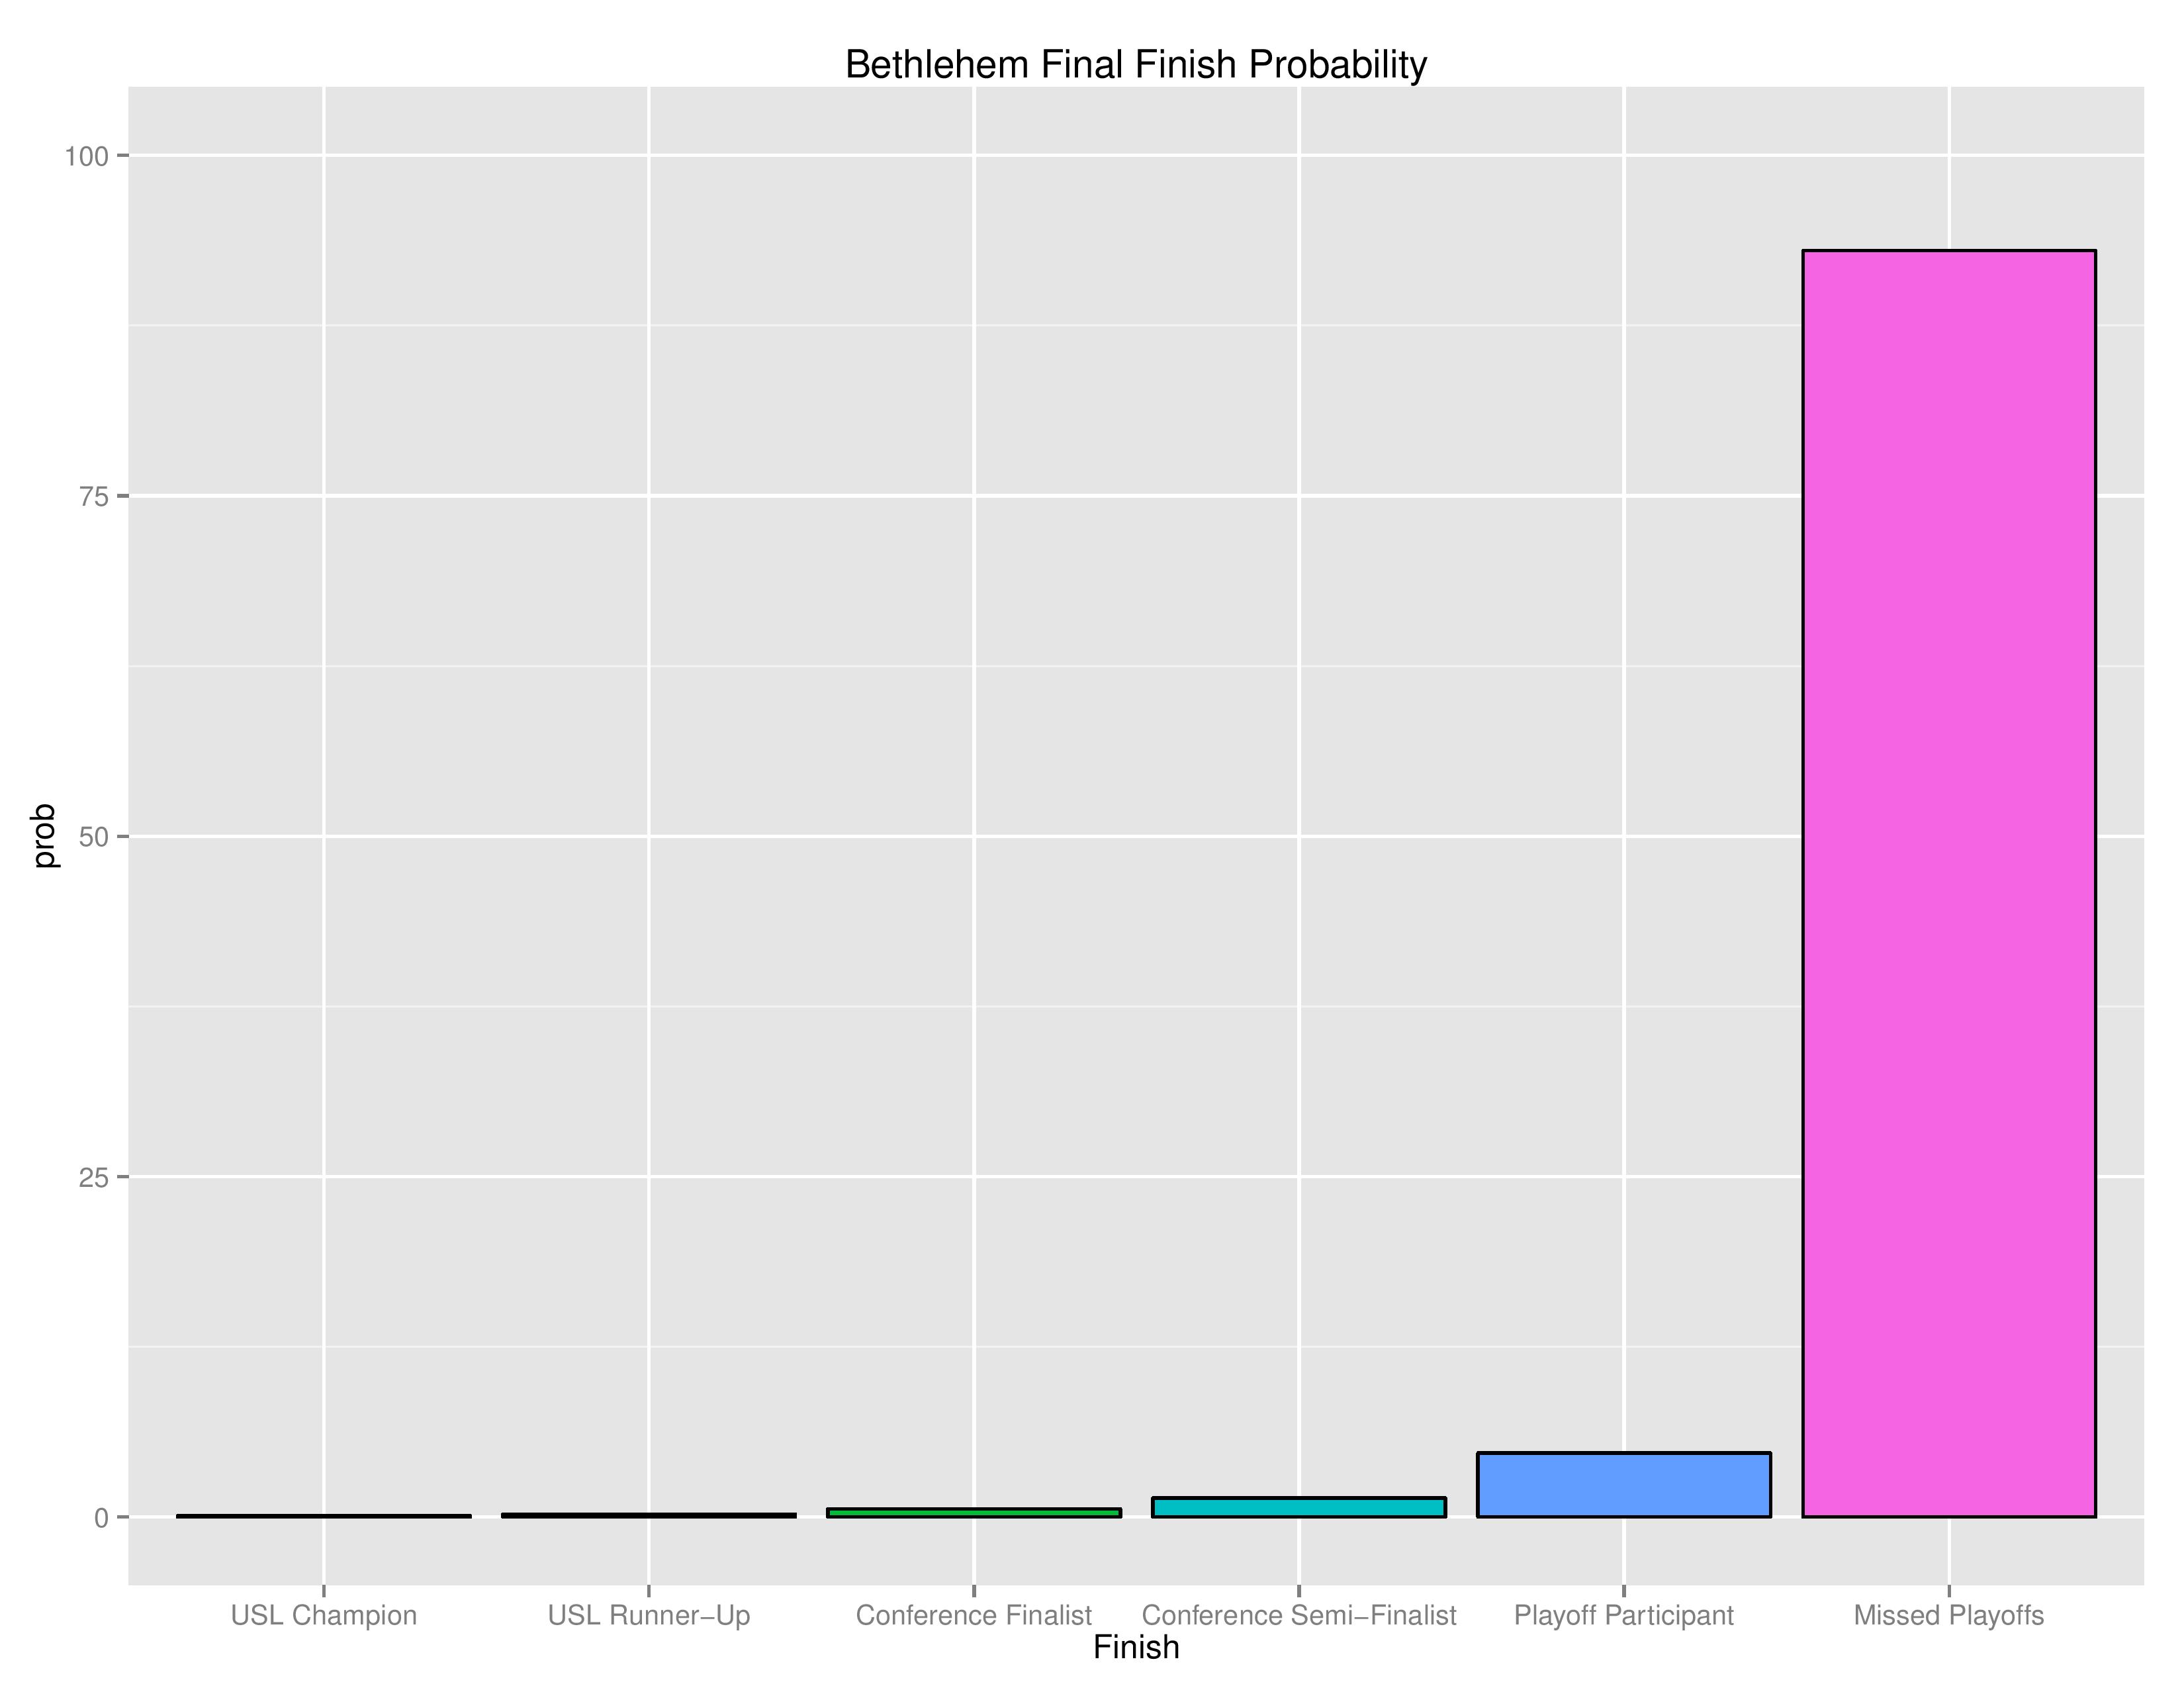
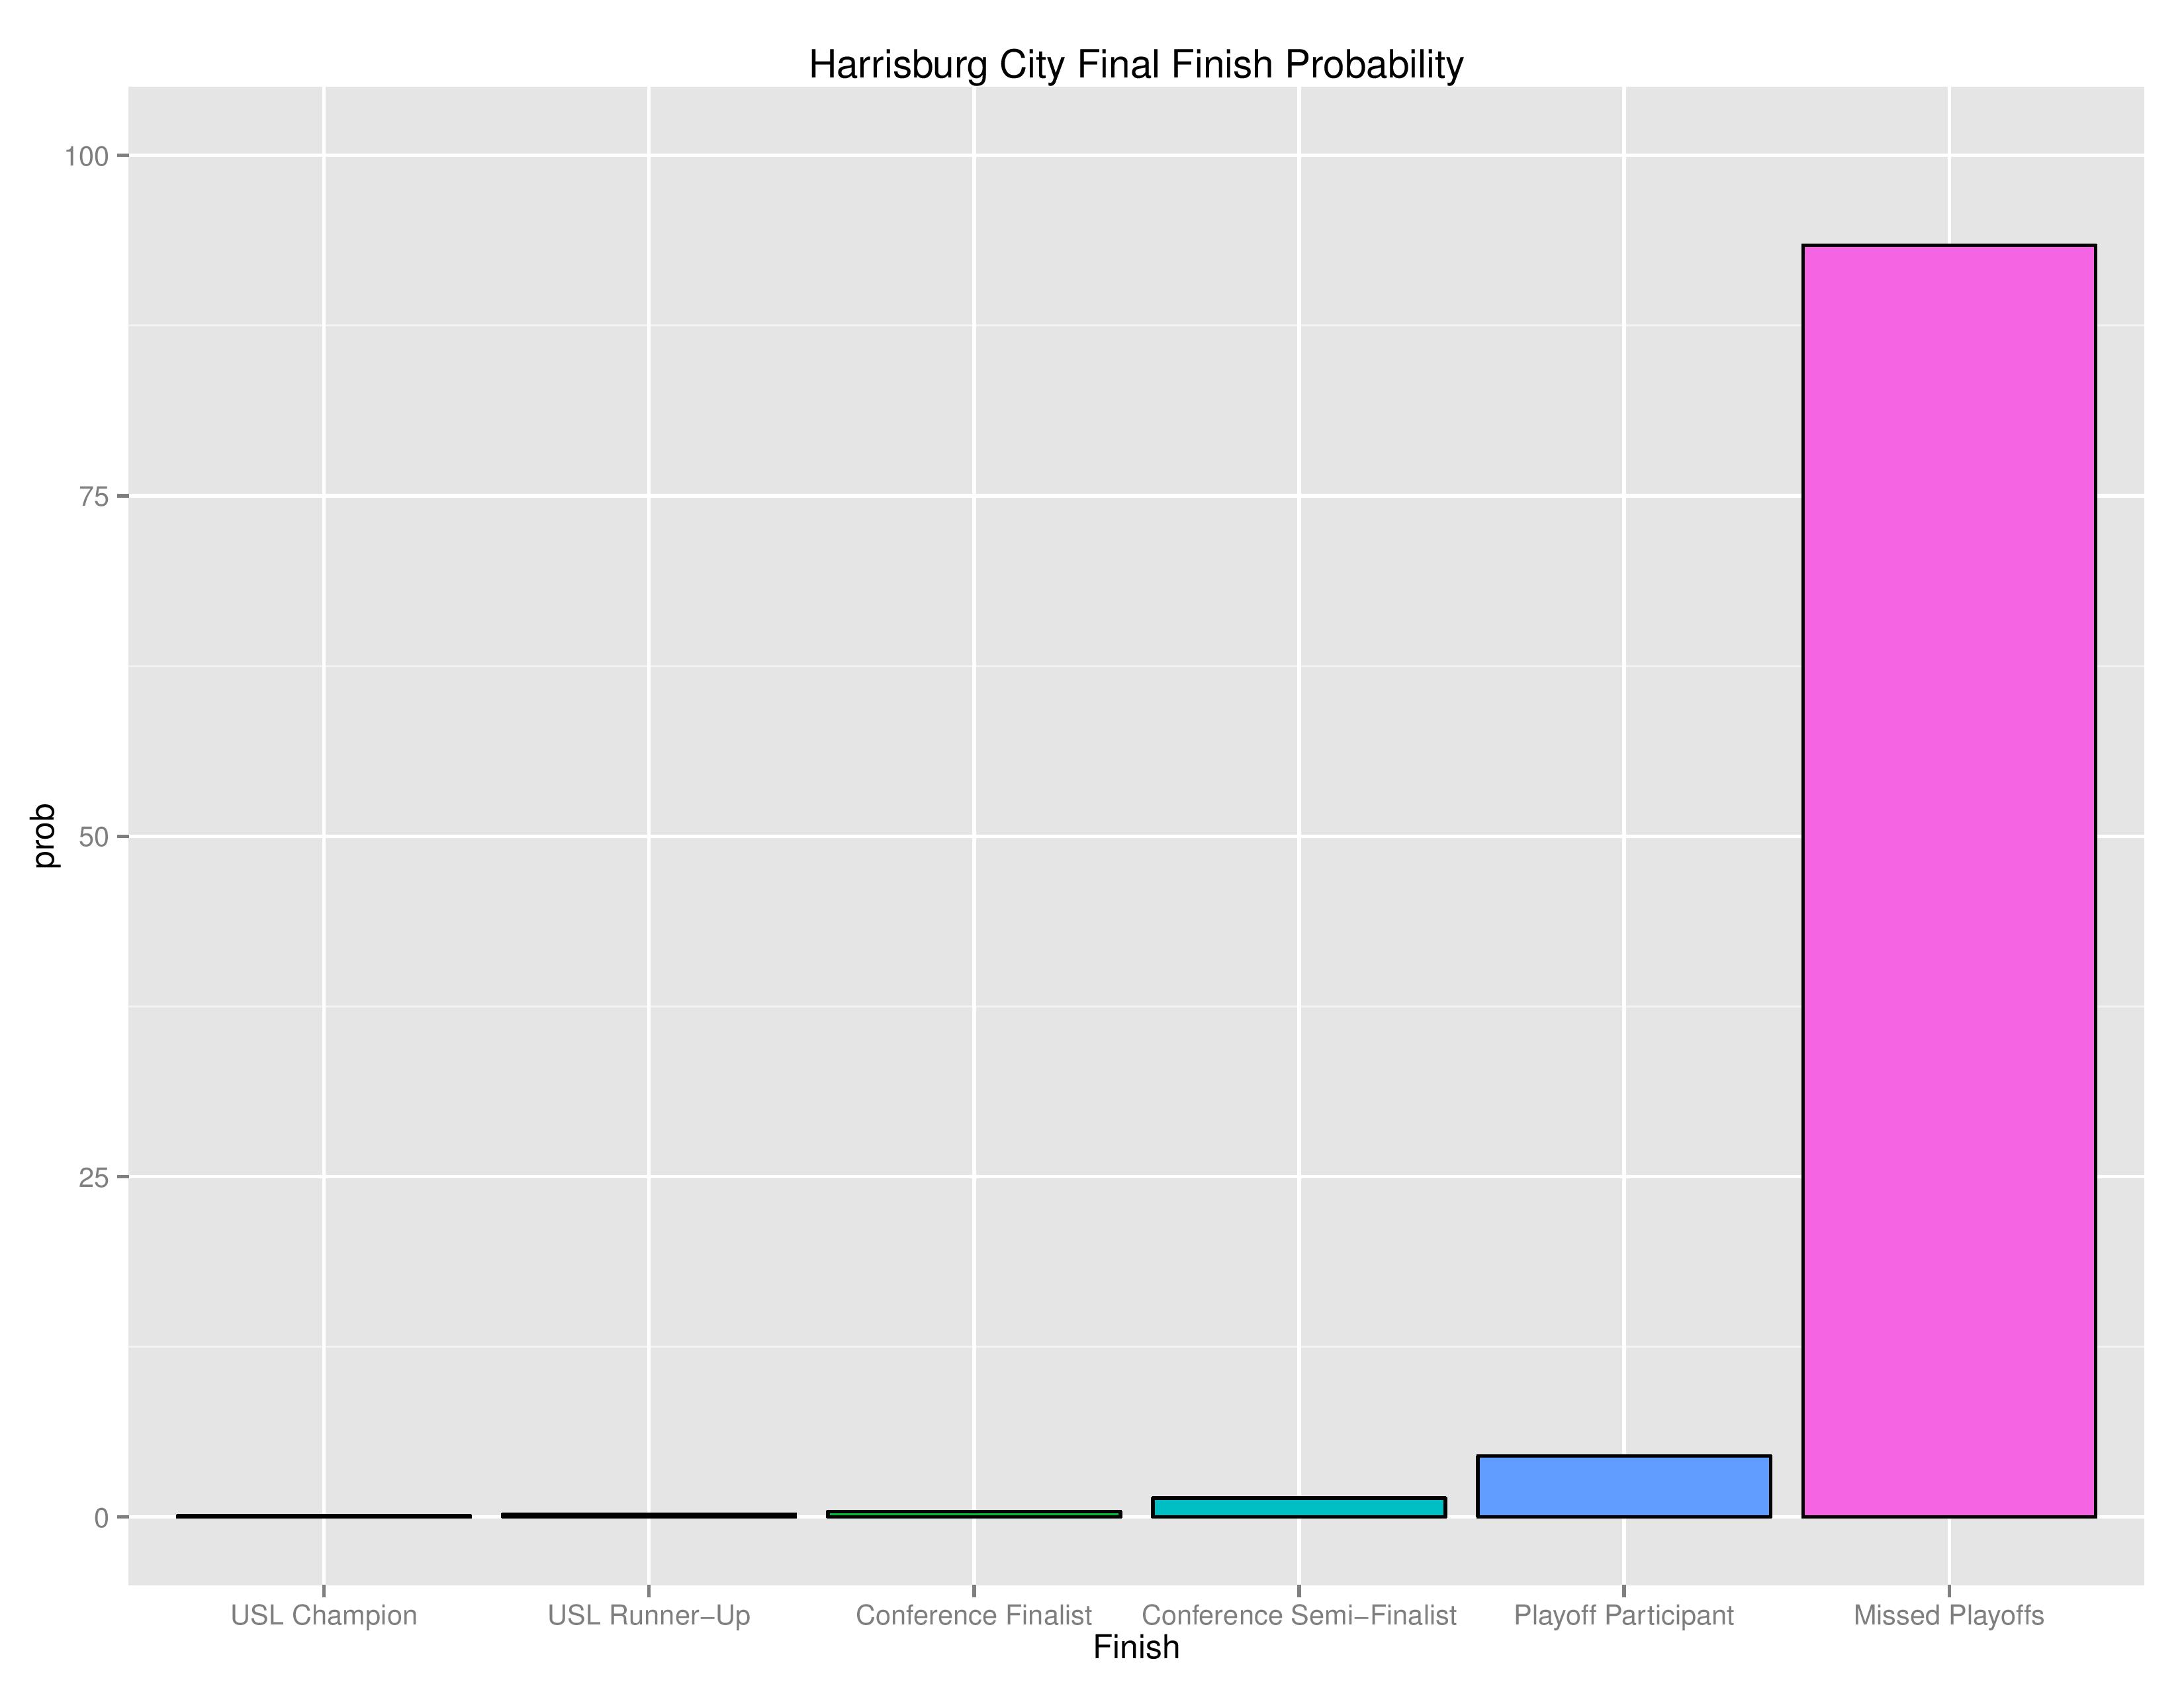
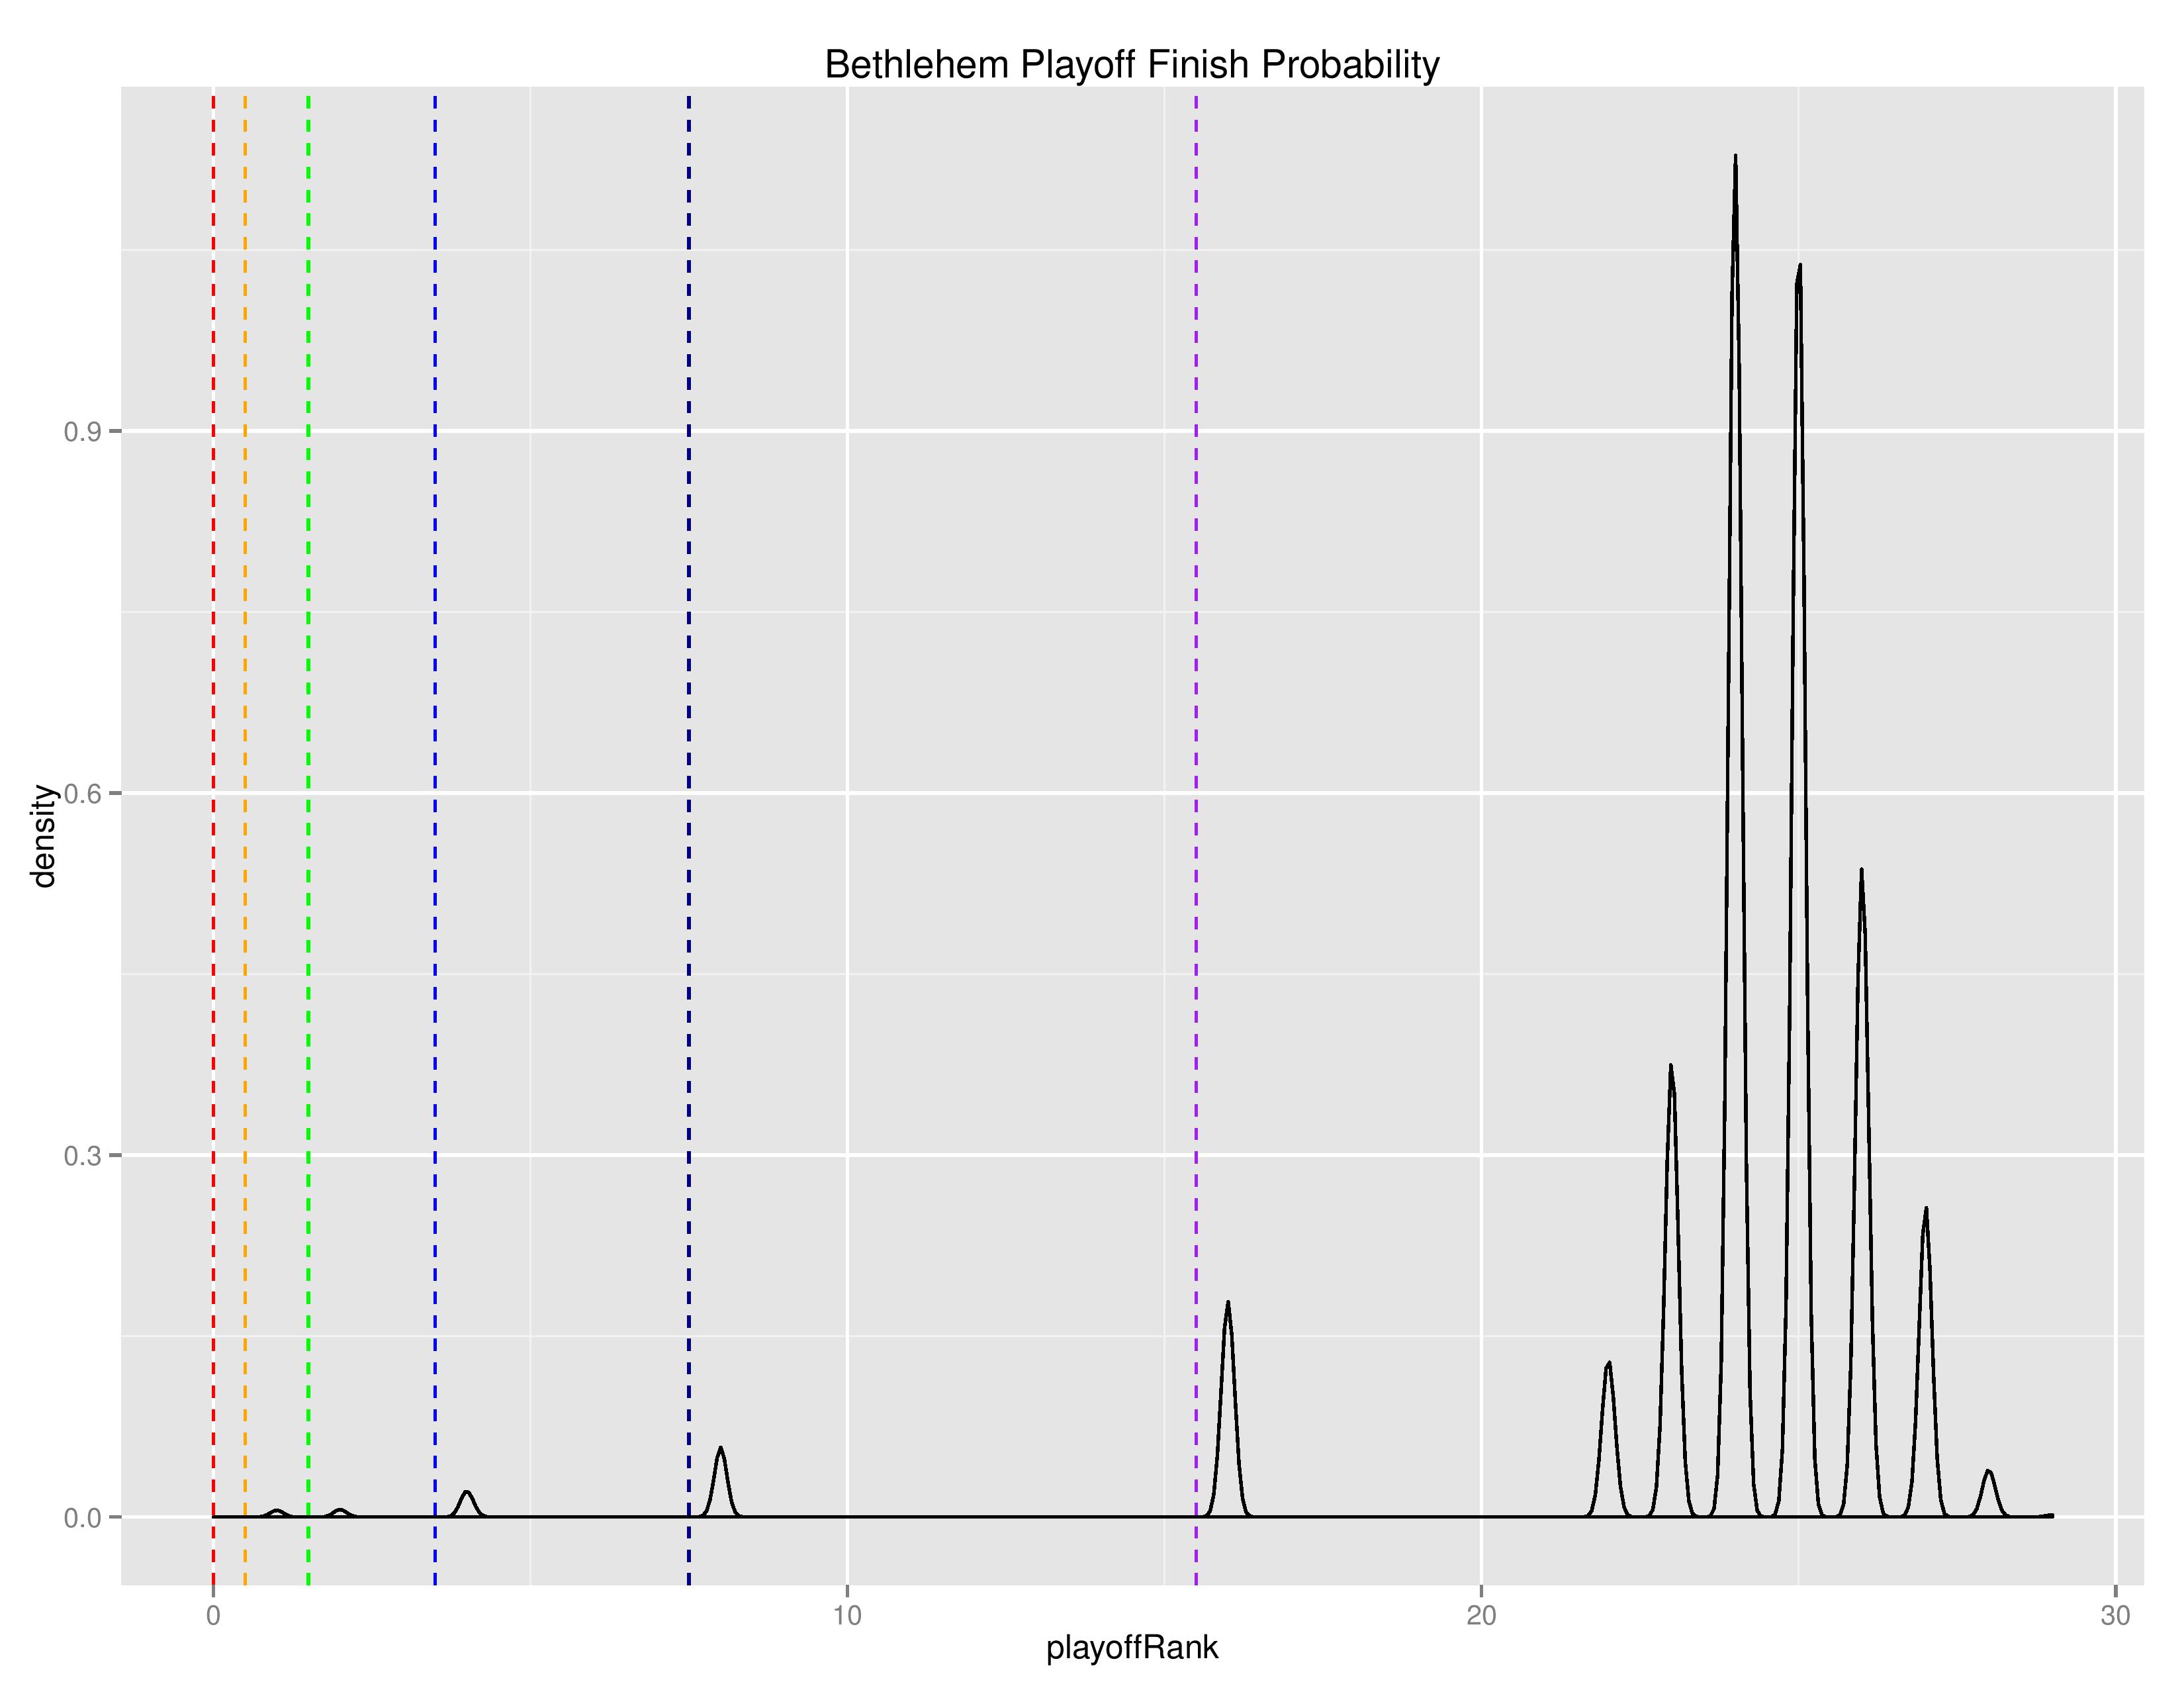
As with MLS, the below density charts show the relative probabilities of Bethlehem and Harrisburg finishing for their final playoff-rank.
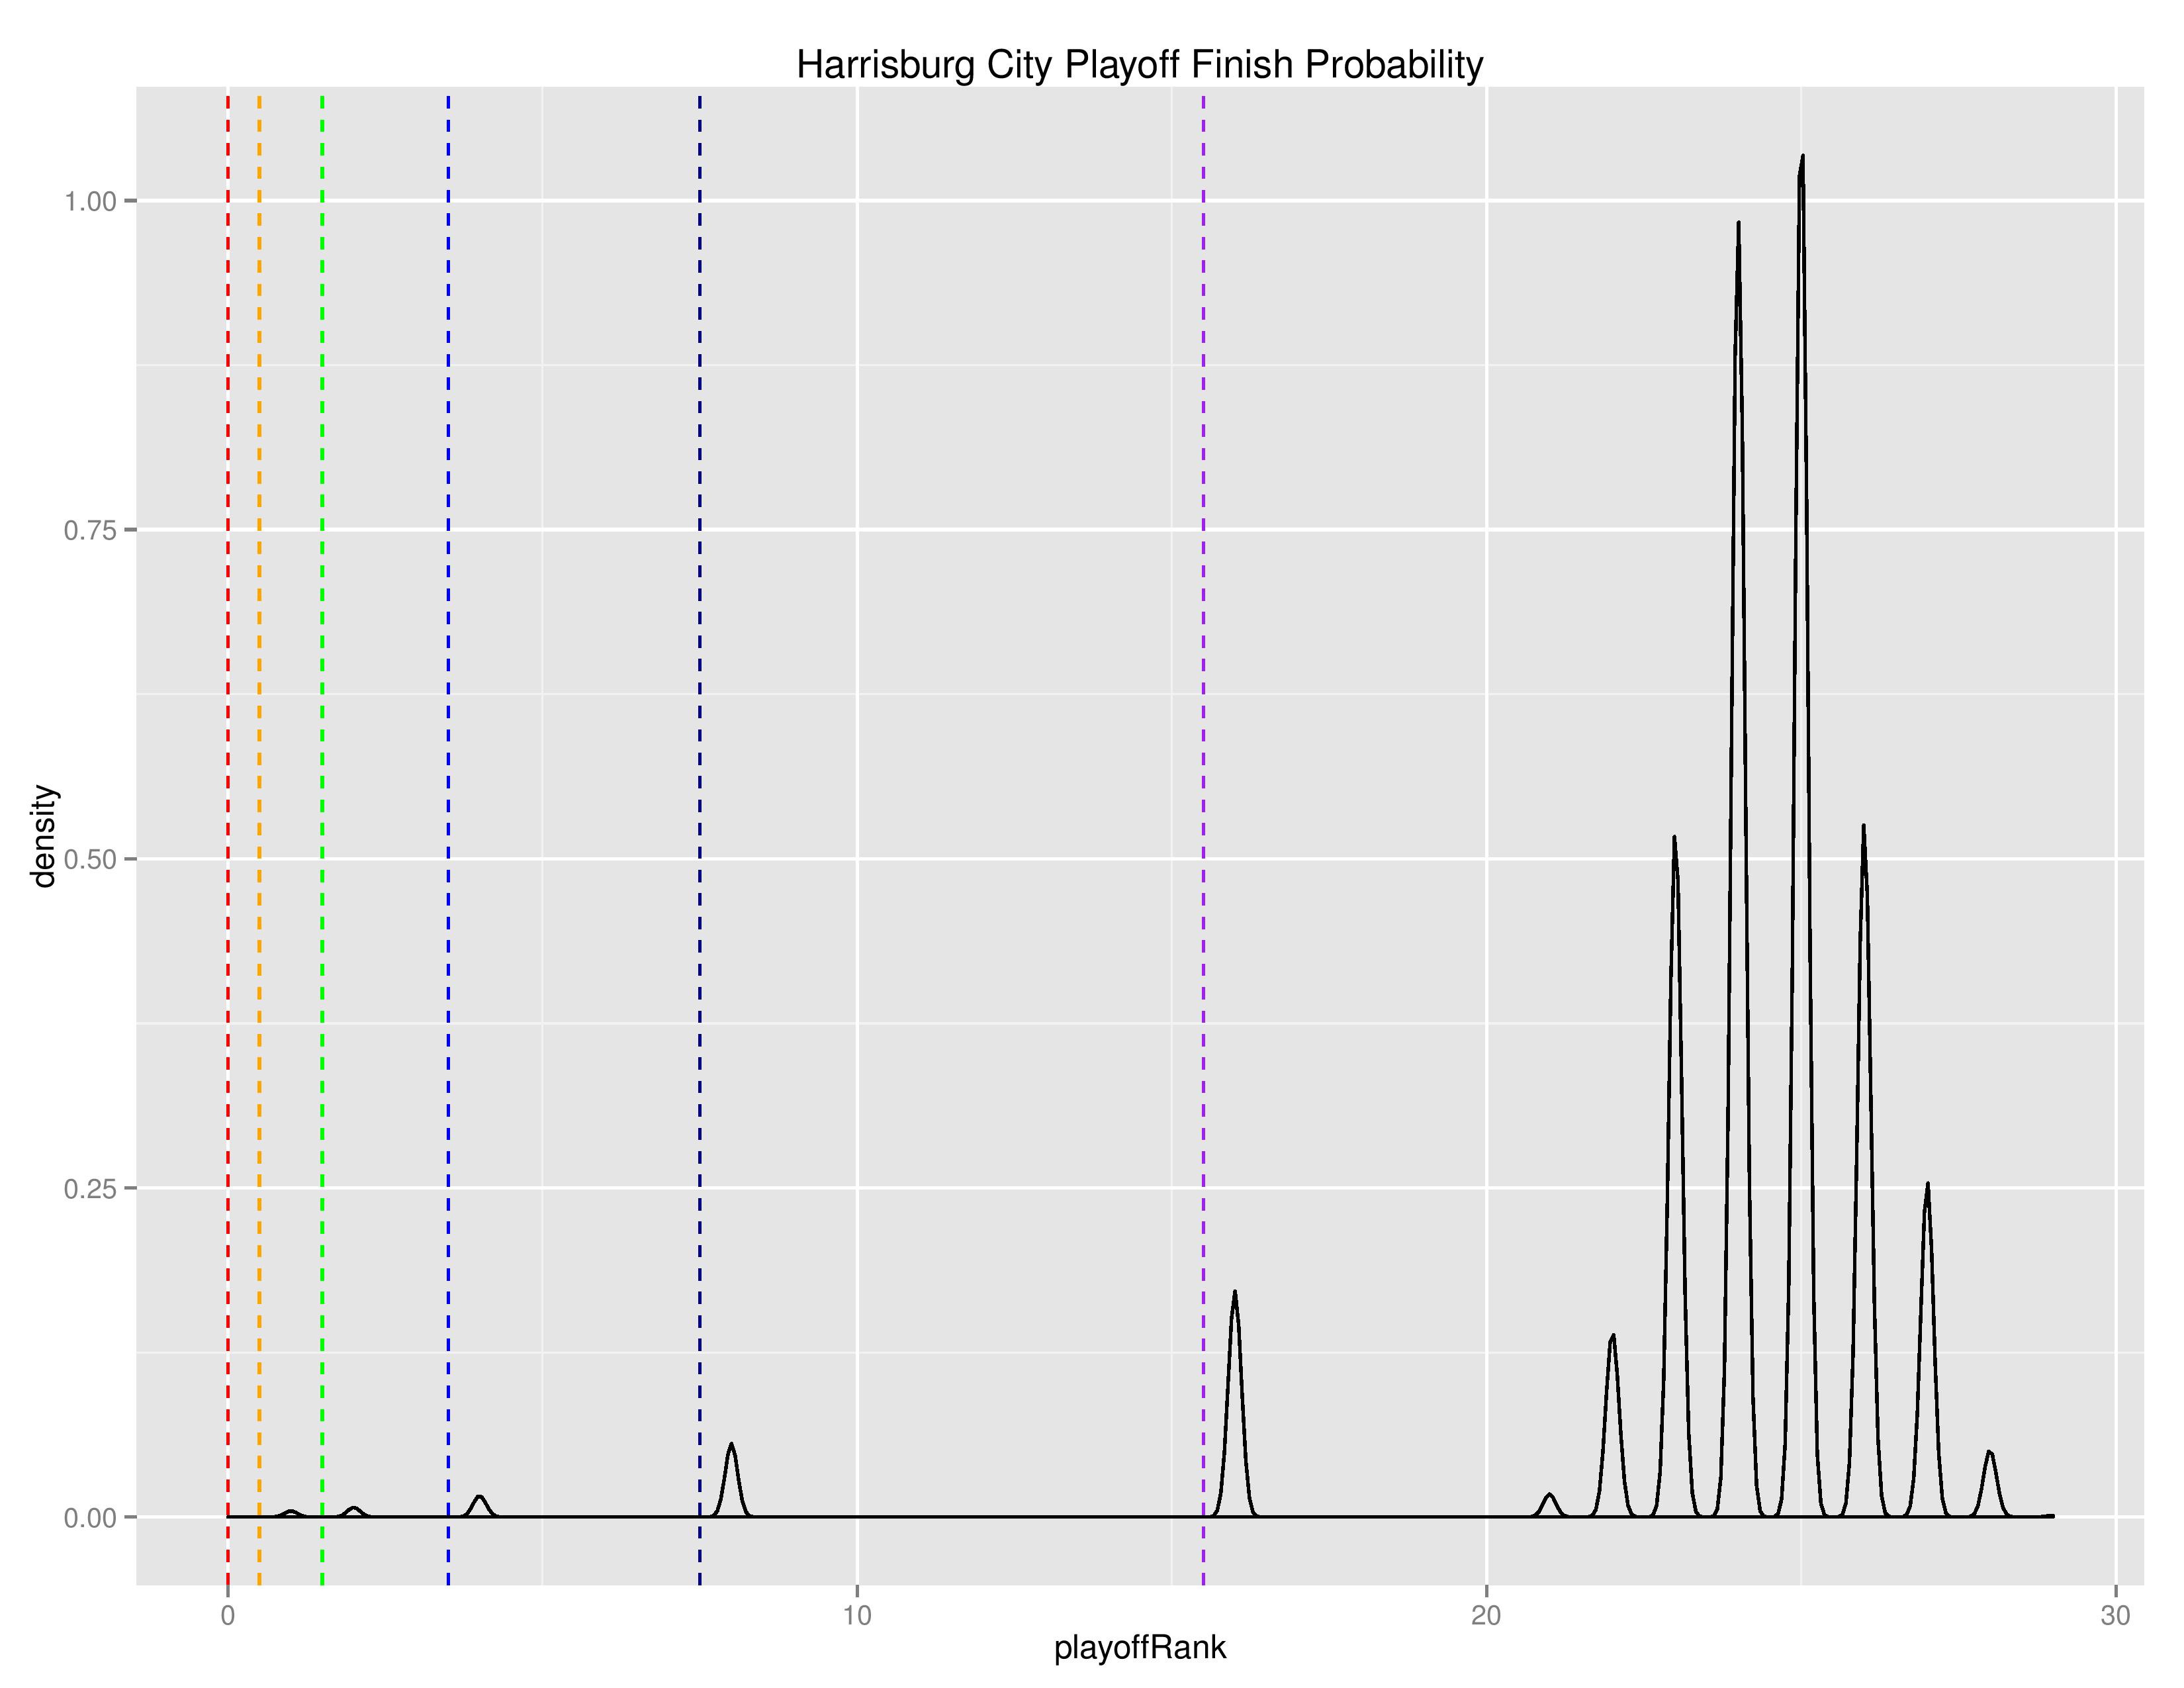
The following are the upcoming matches and associated probabilities for Bethlehem and Harrisburg City.


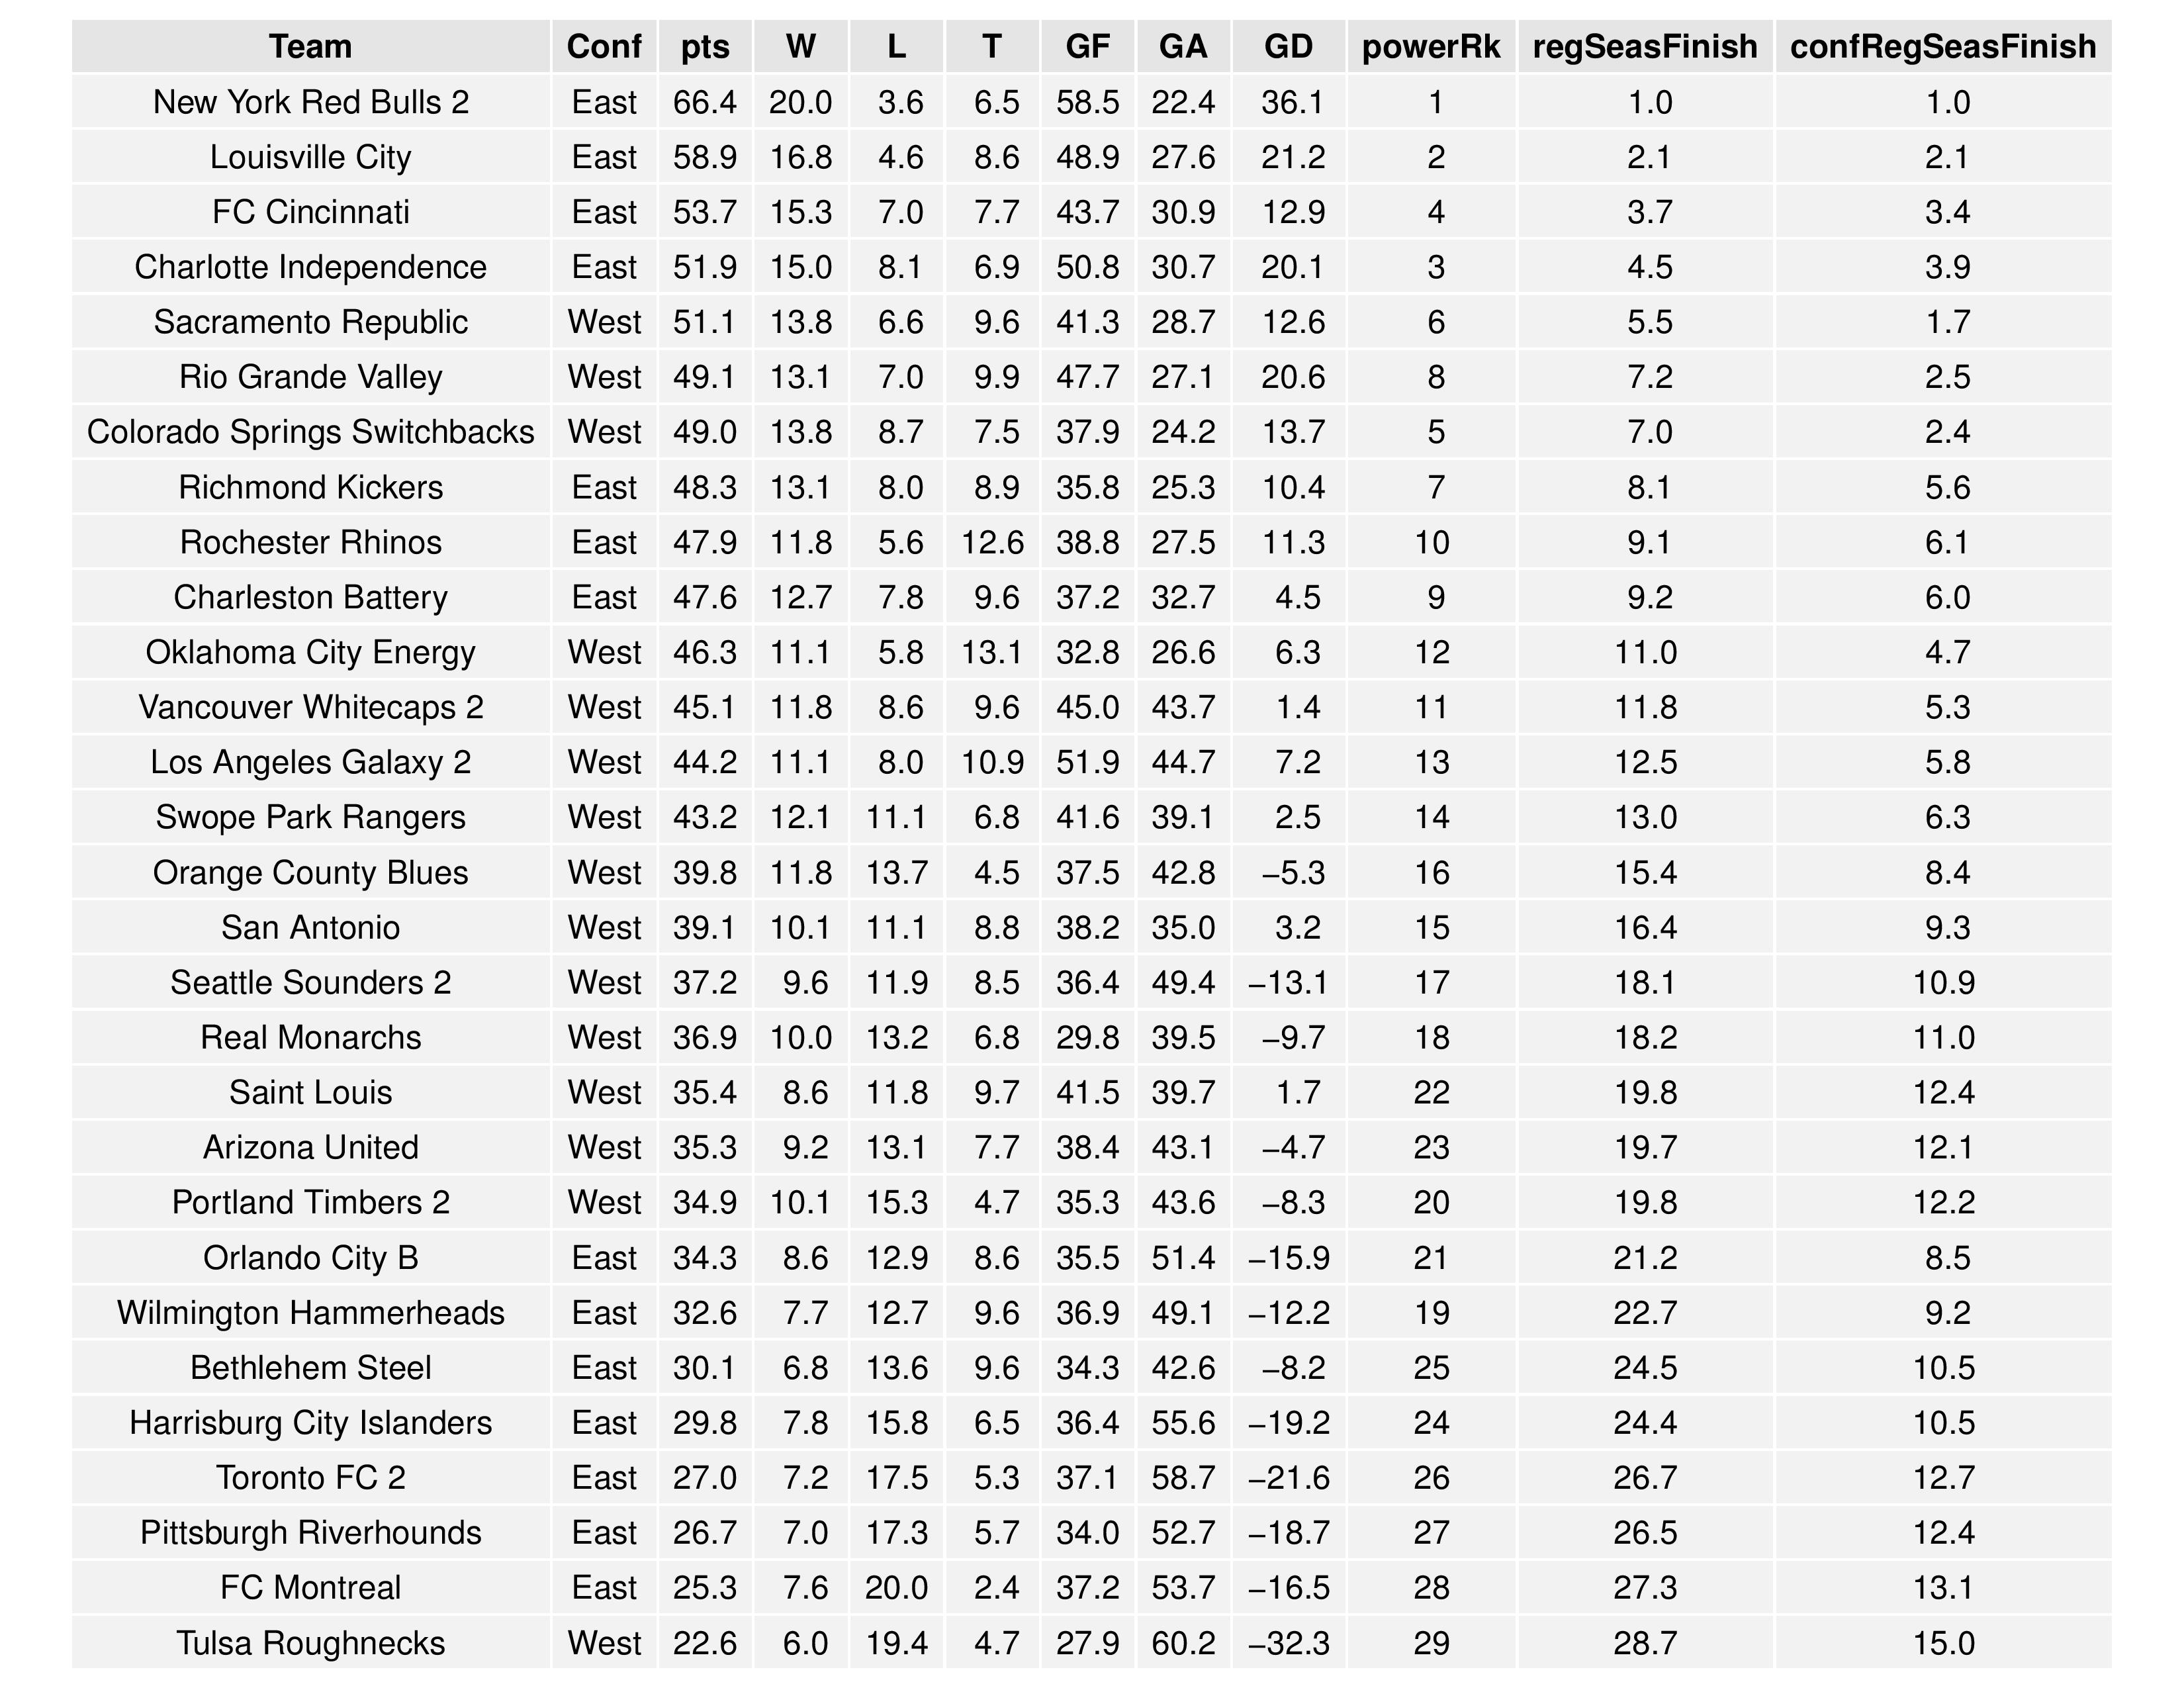
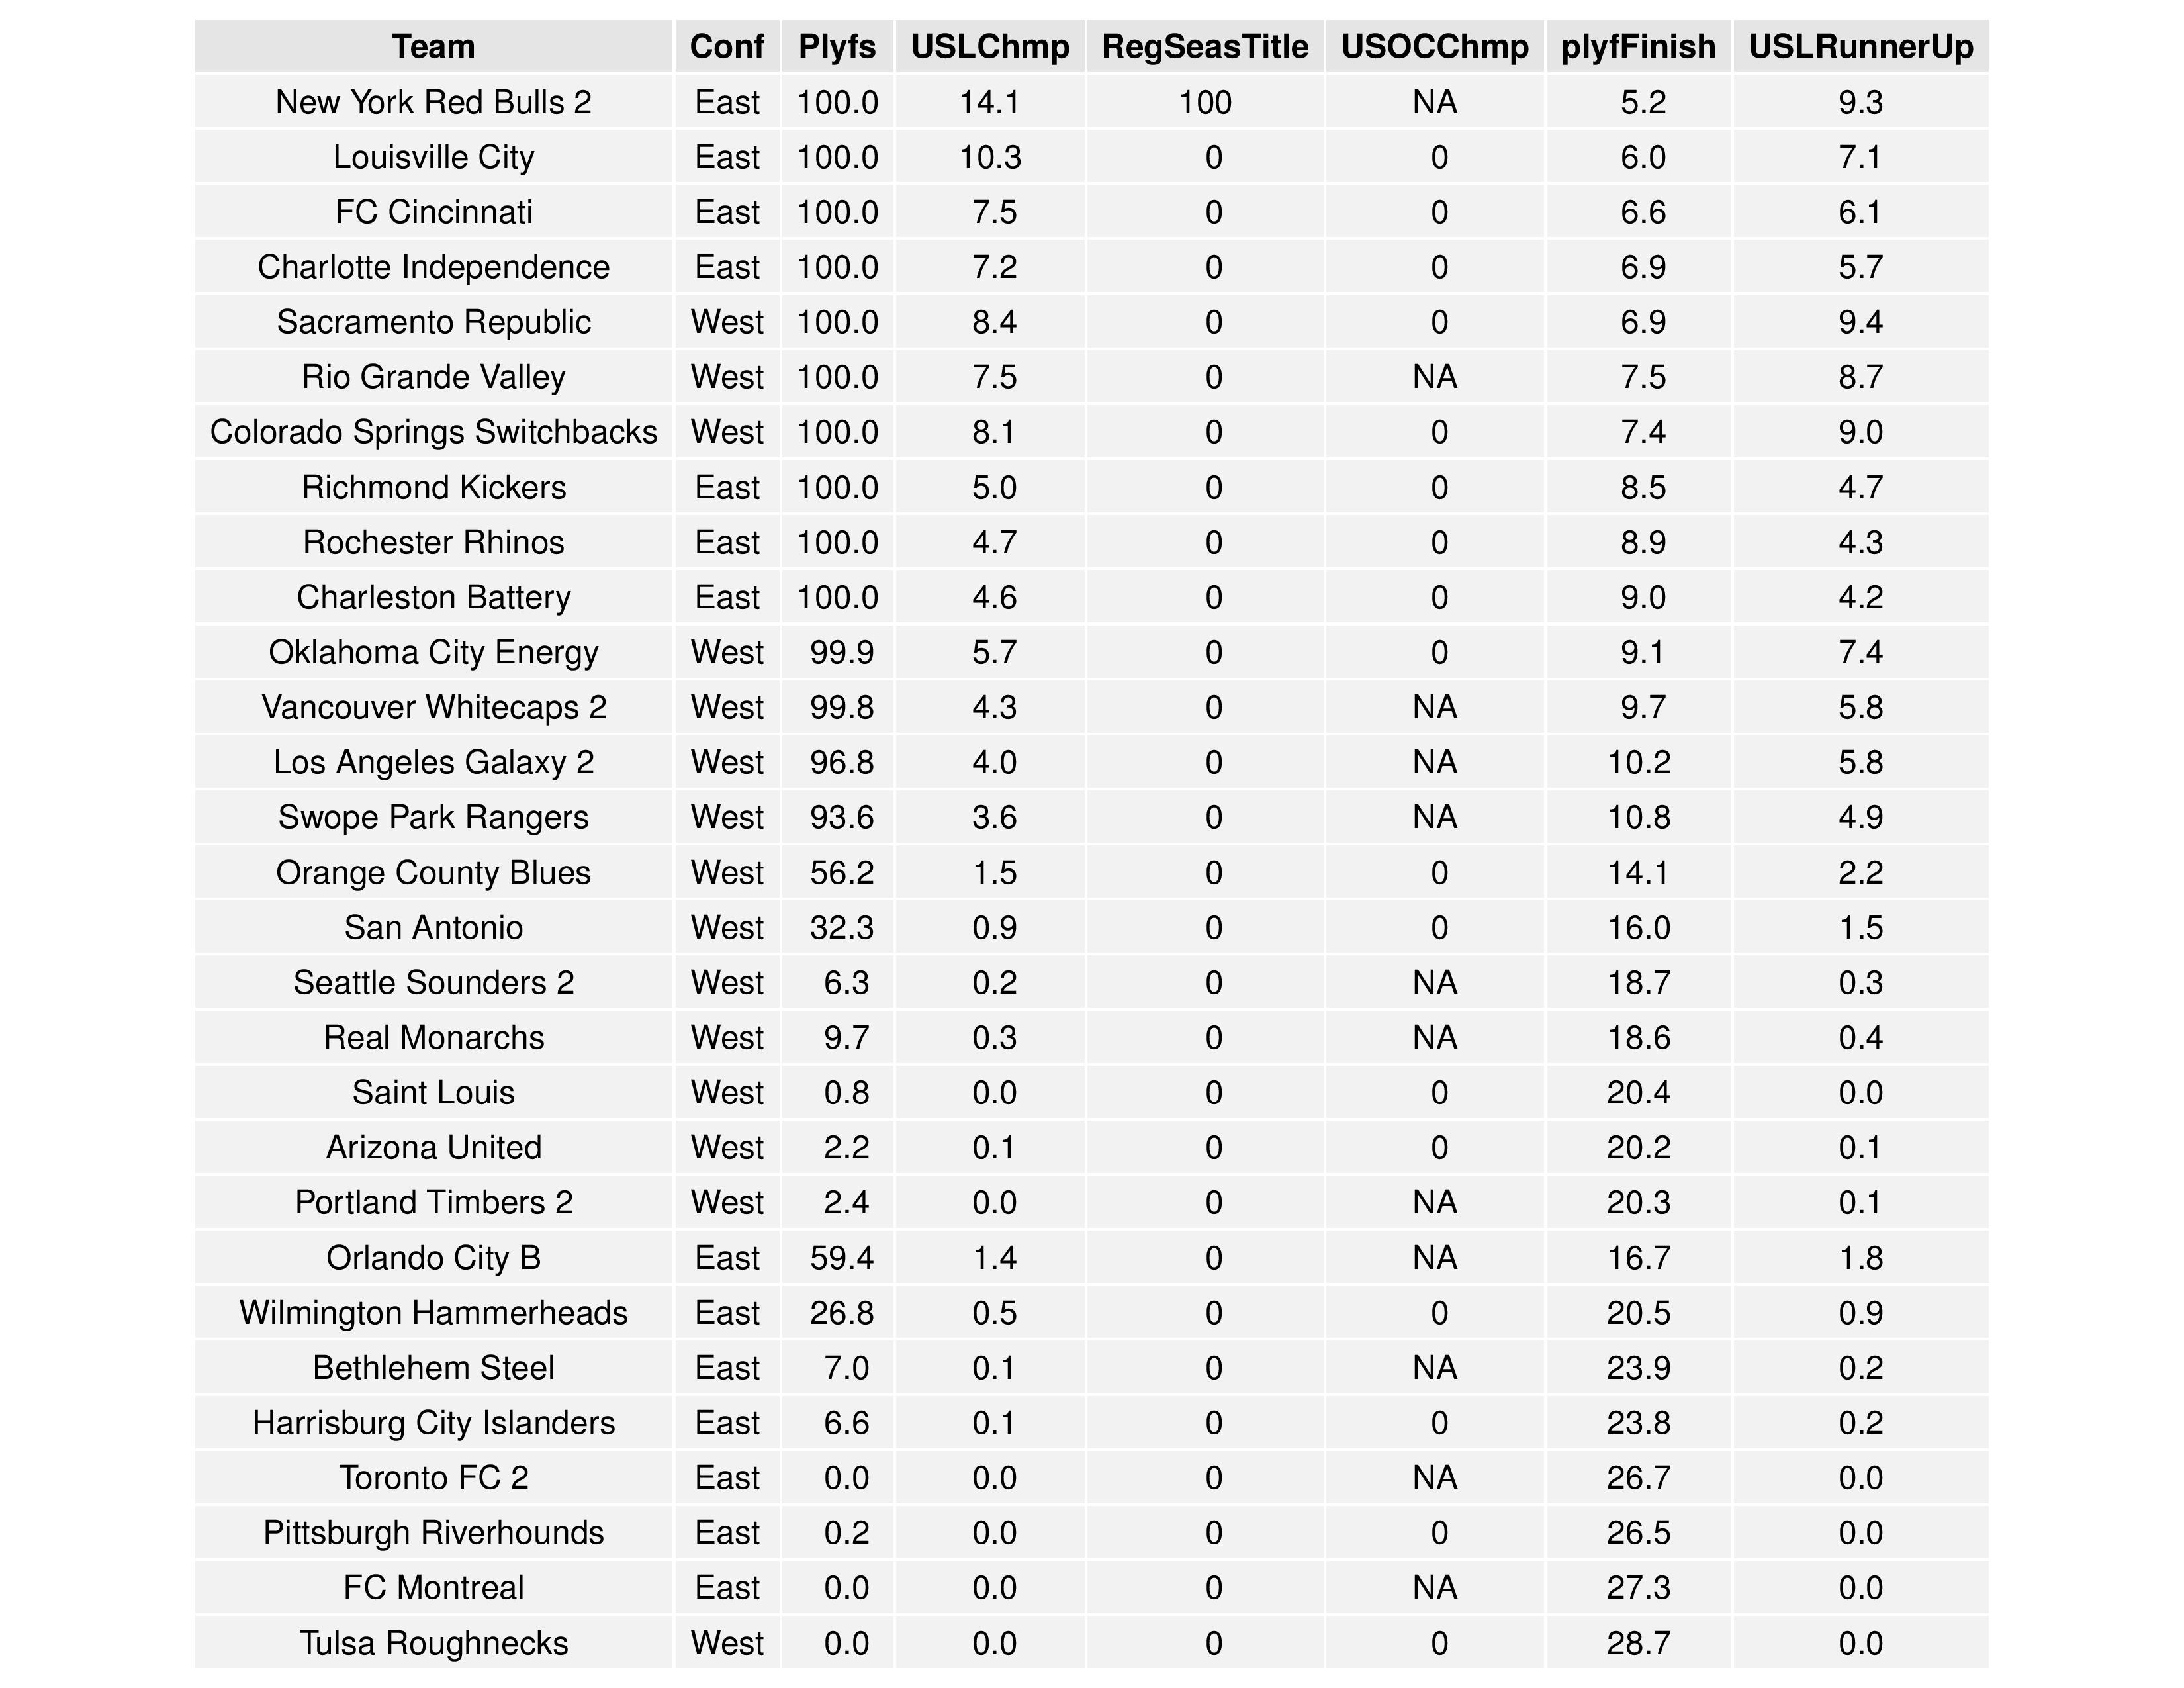
The following tables show the average simulation results. They are divided into two tables to present better to your screen.
Changes over time
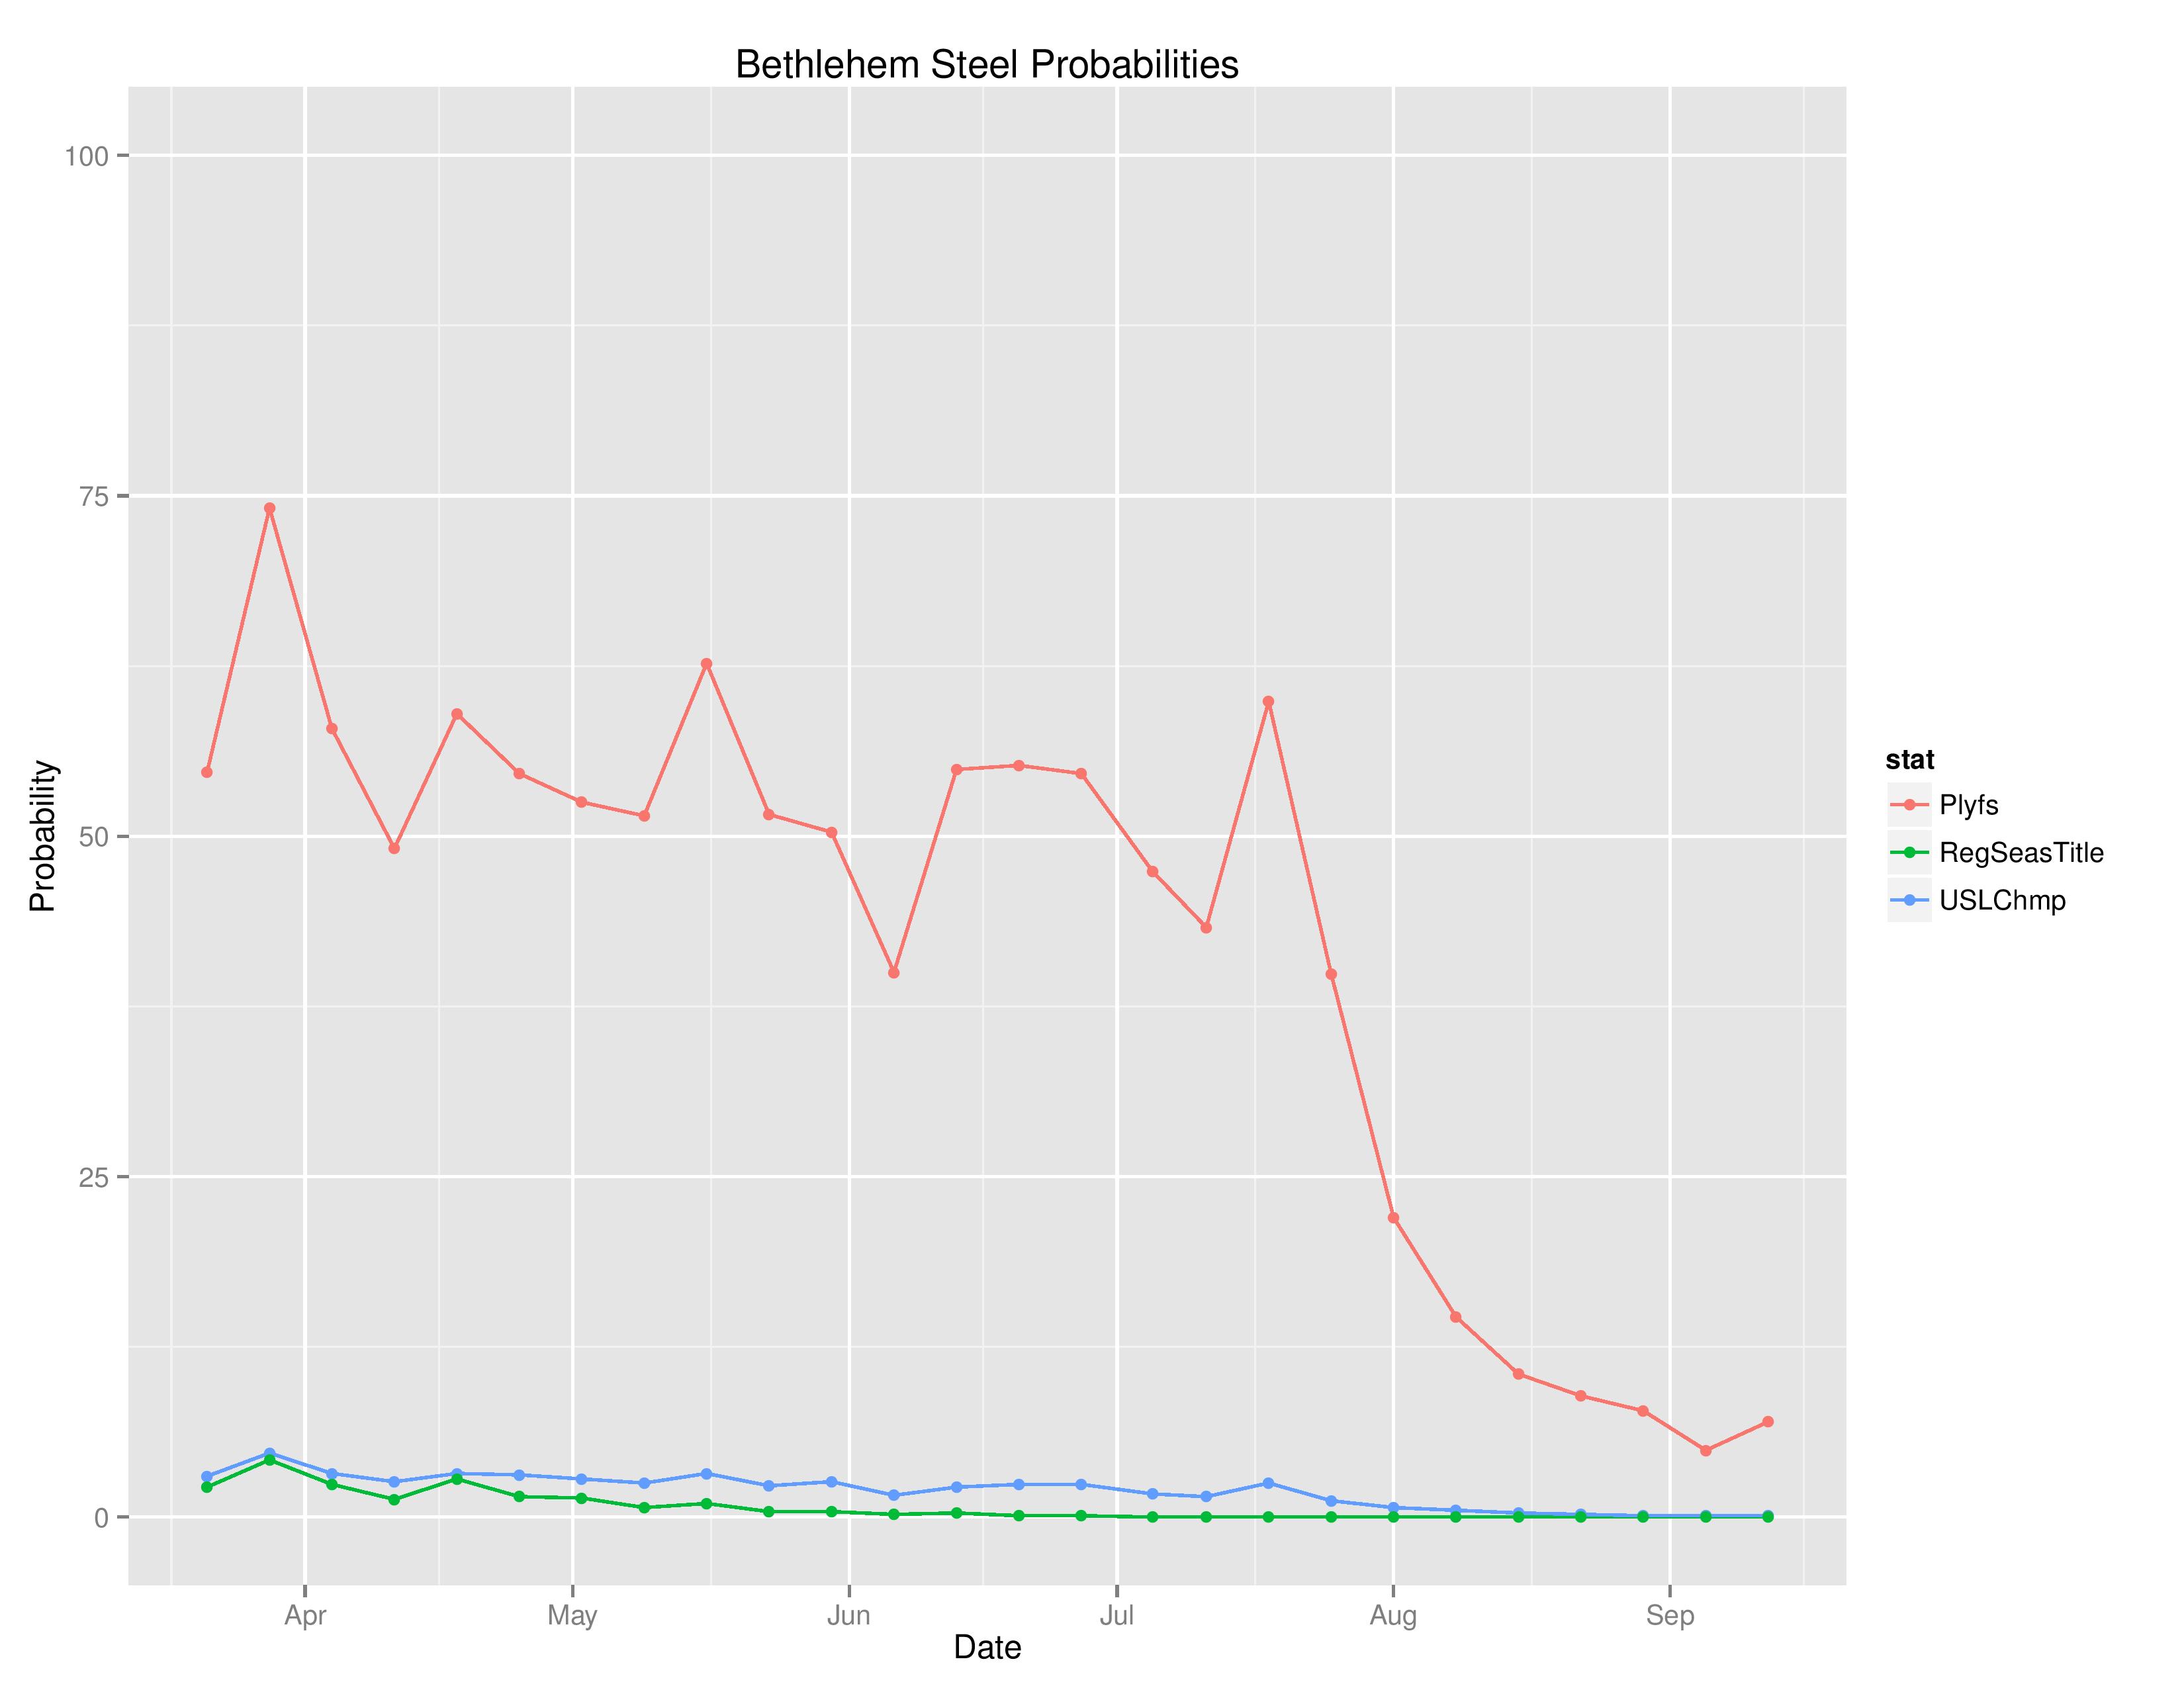
Below shows the probabilities of various outcomes for Bethlehem over the course of the season.
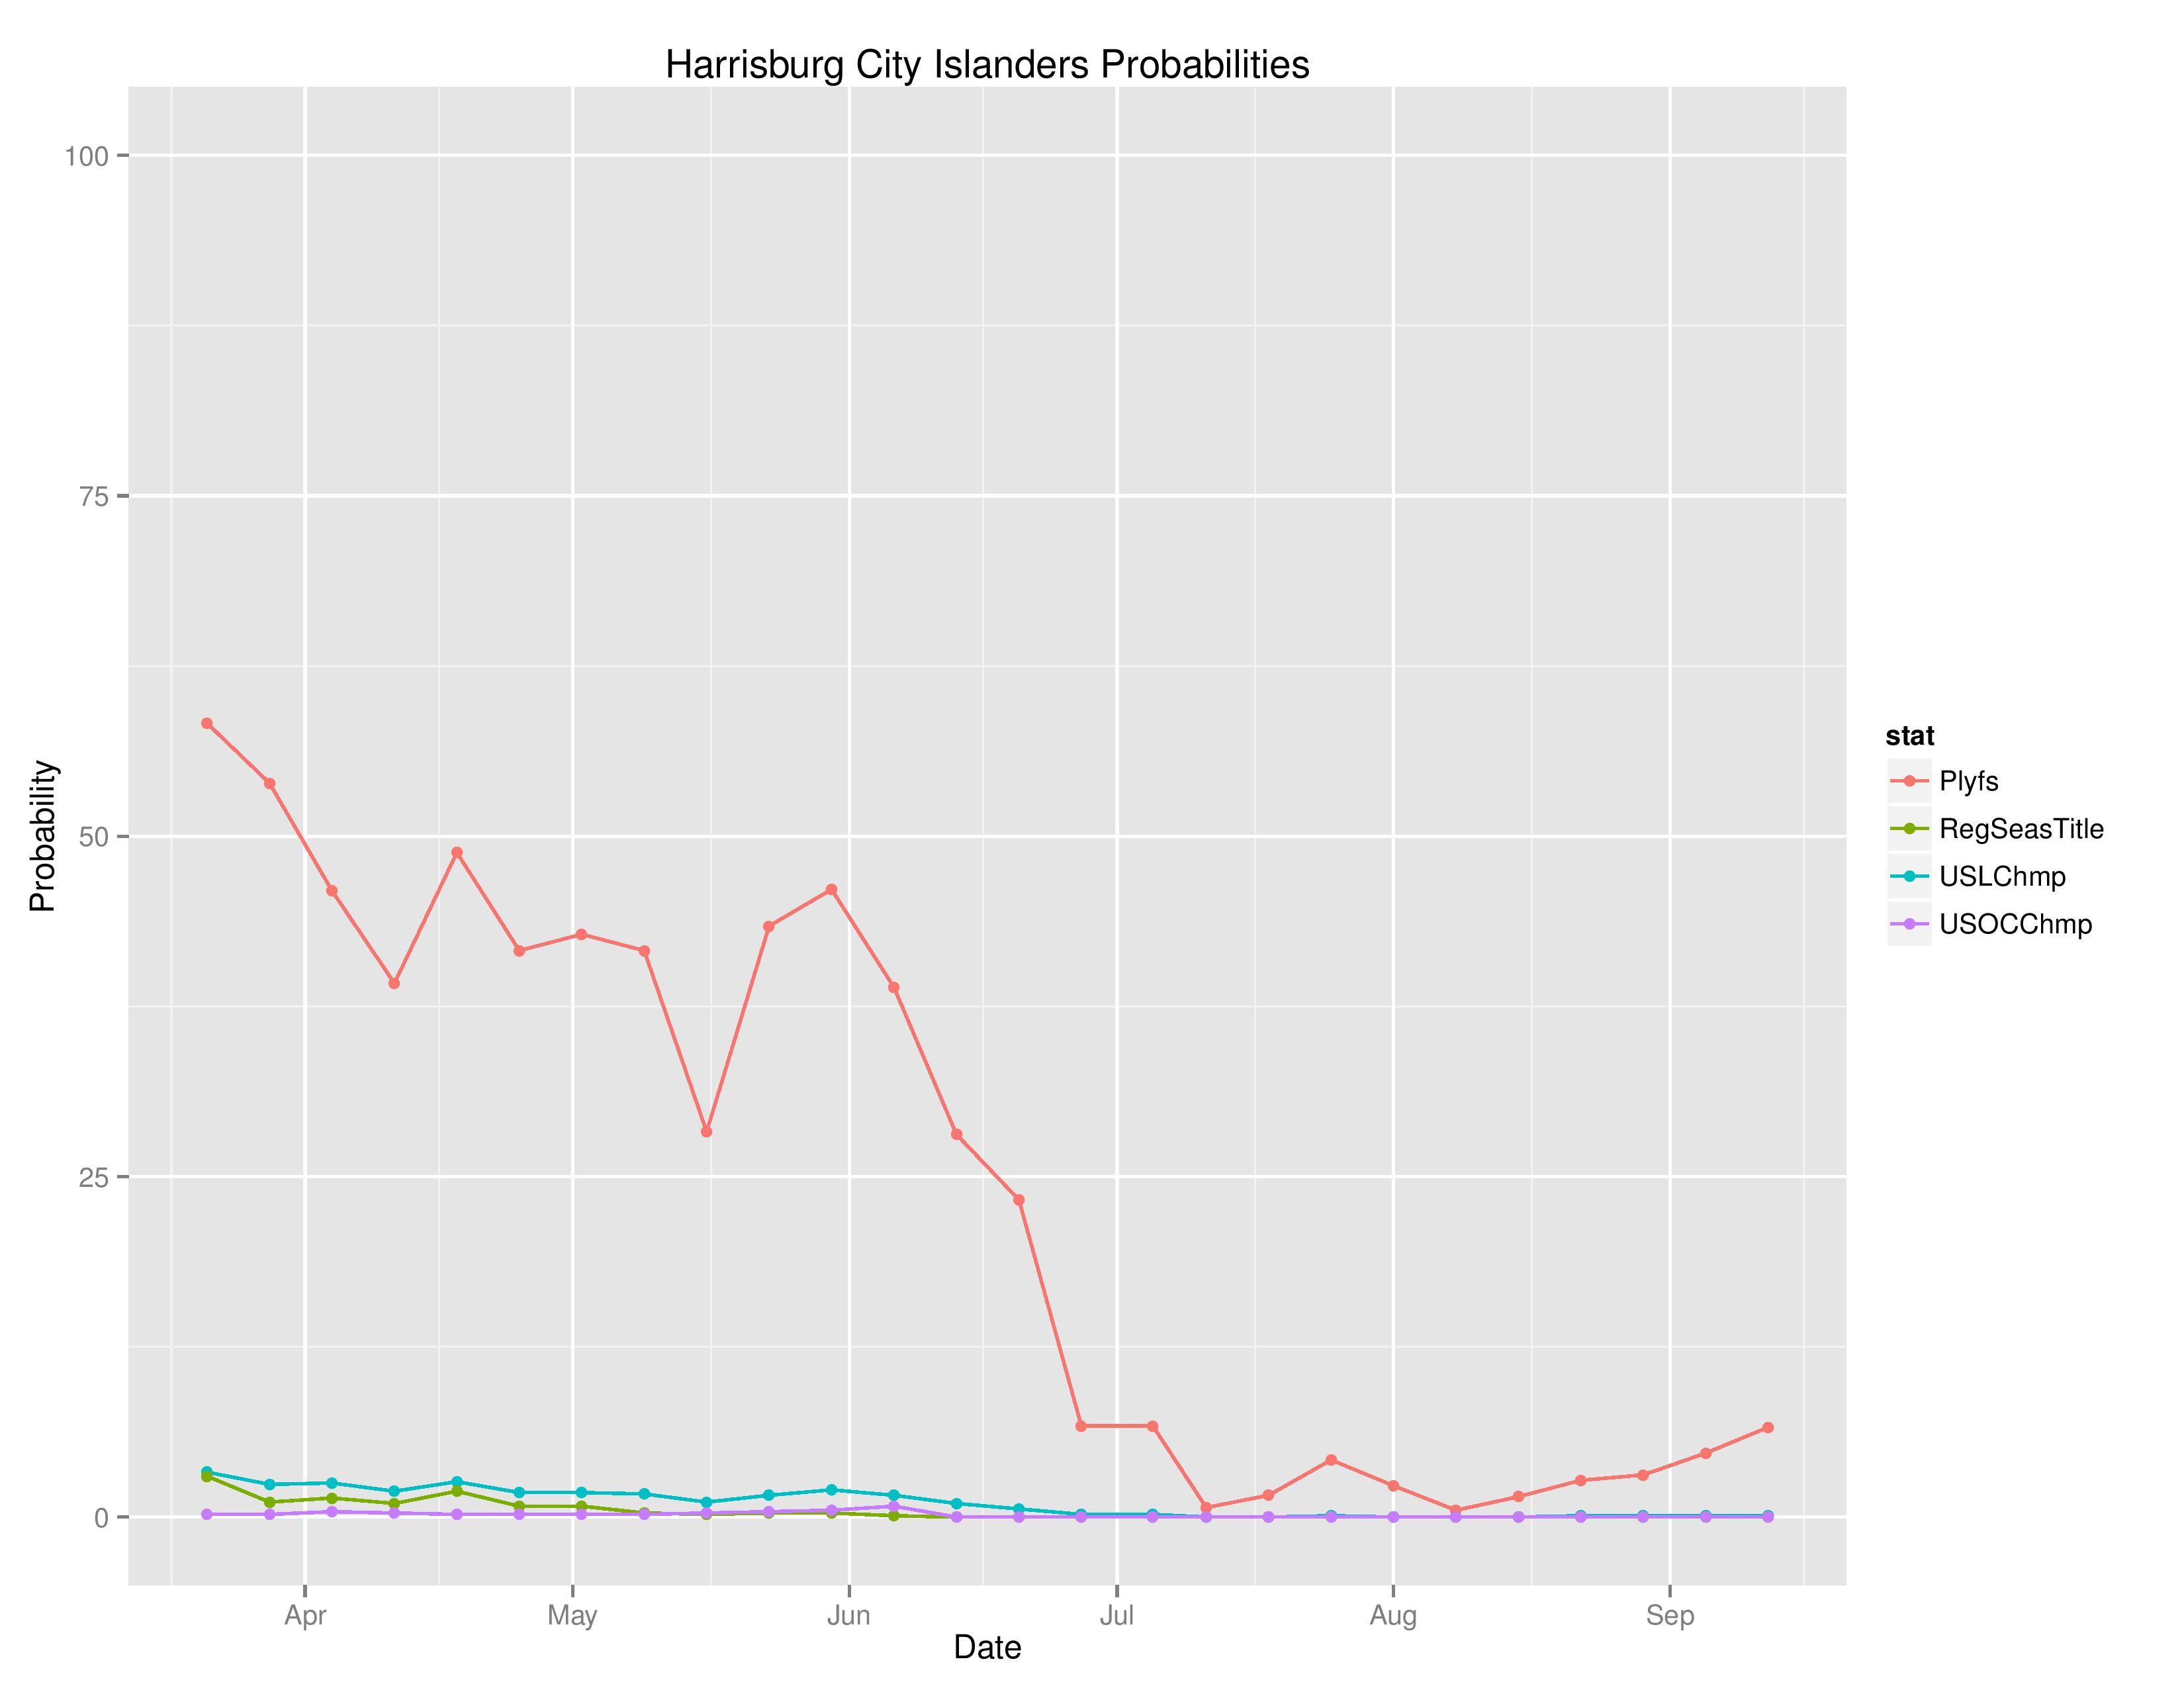
Below shows the probabilities of various outcomes for Harrisburg over the course of the season.
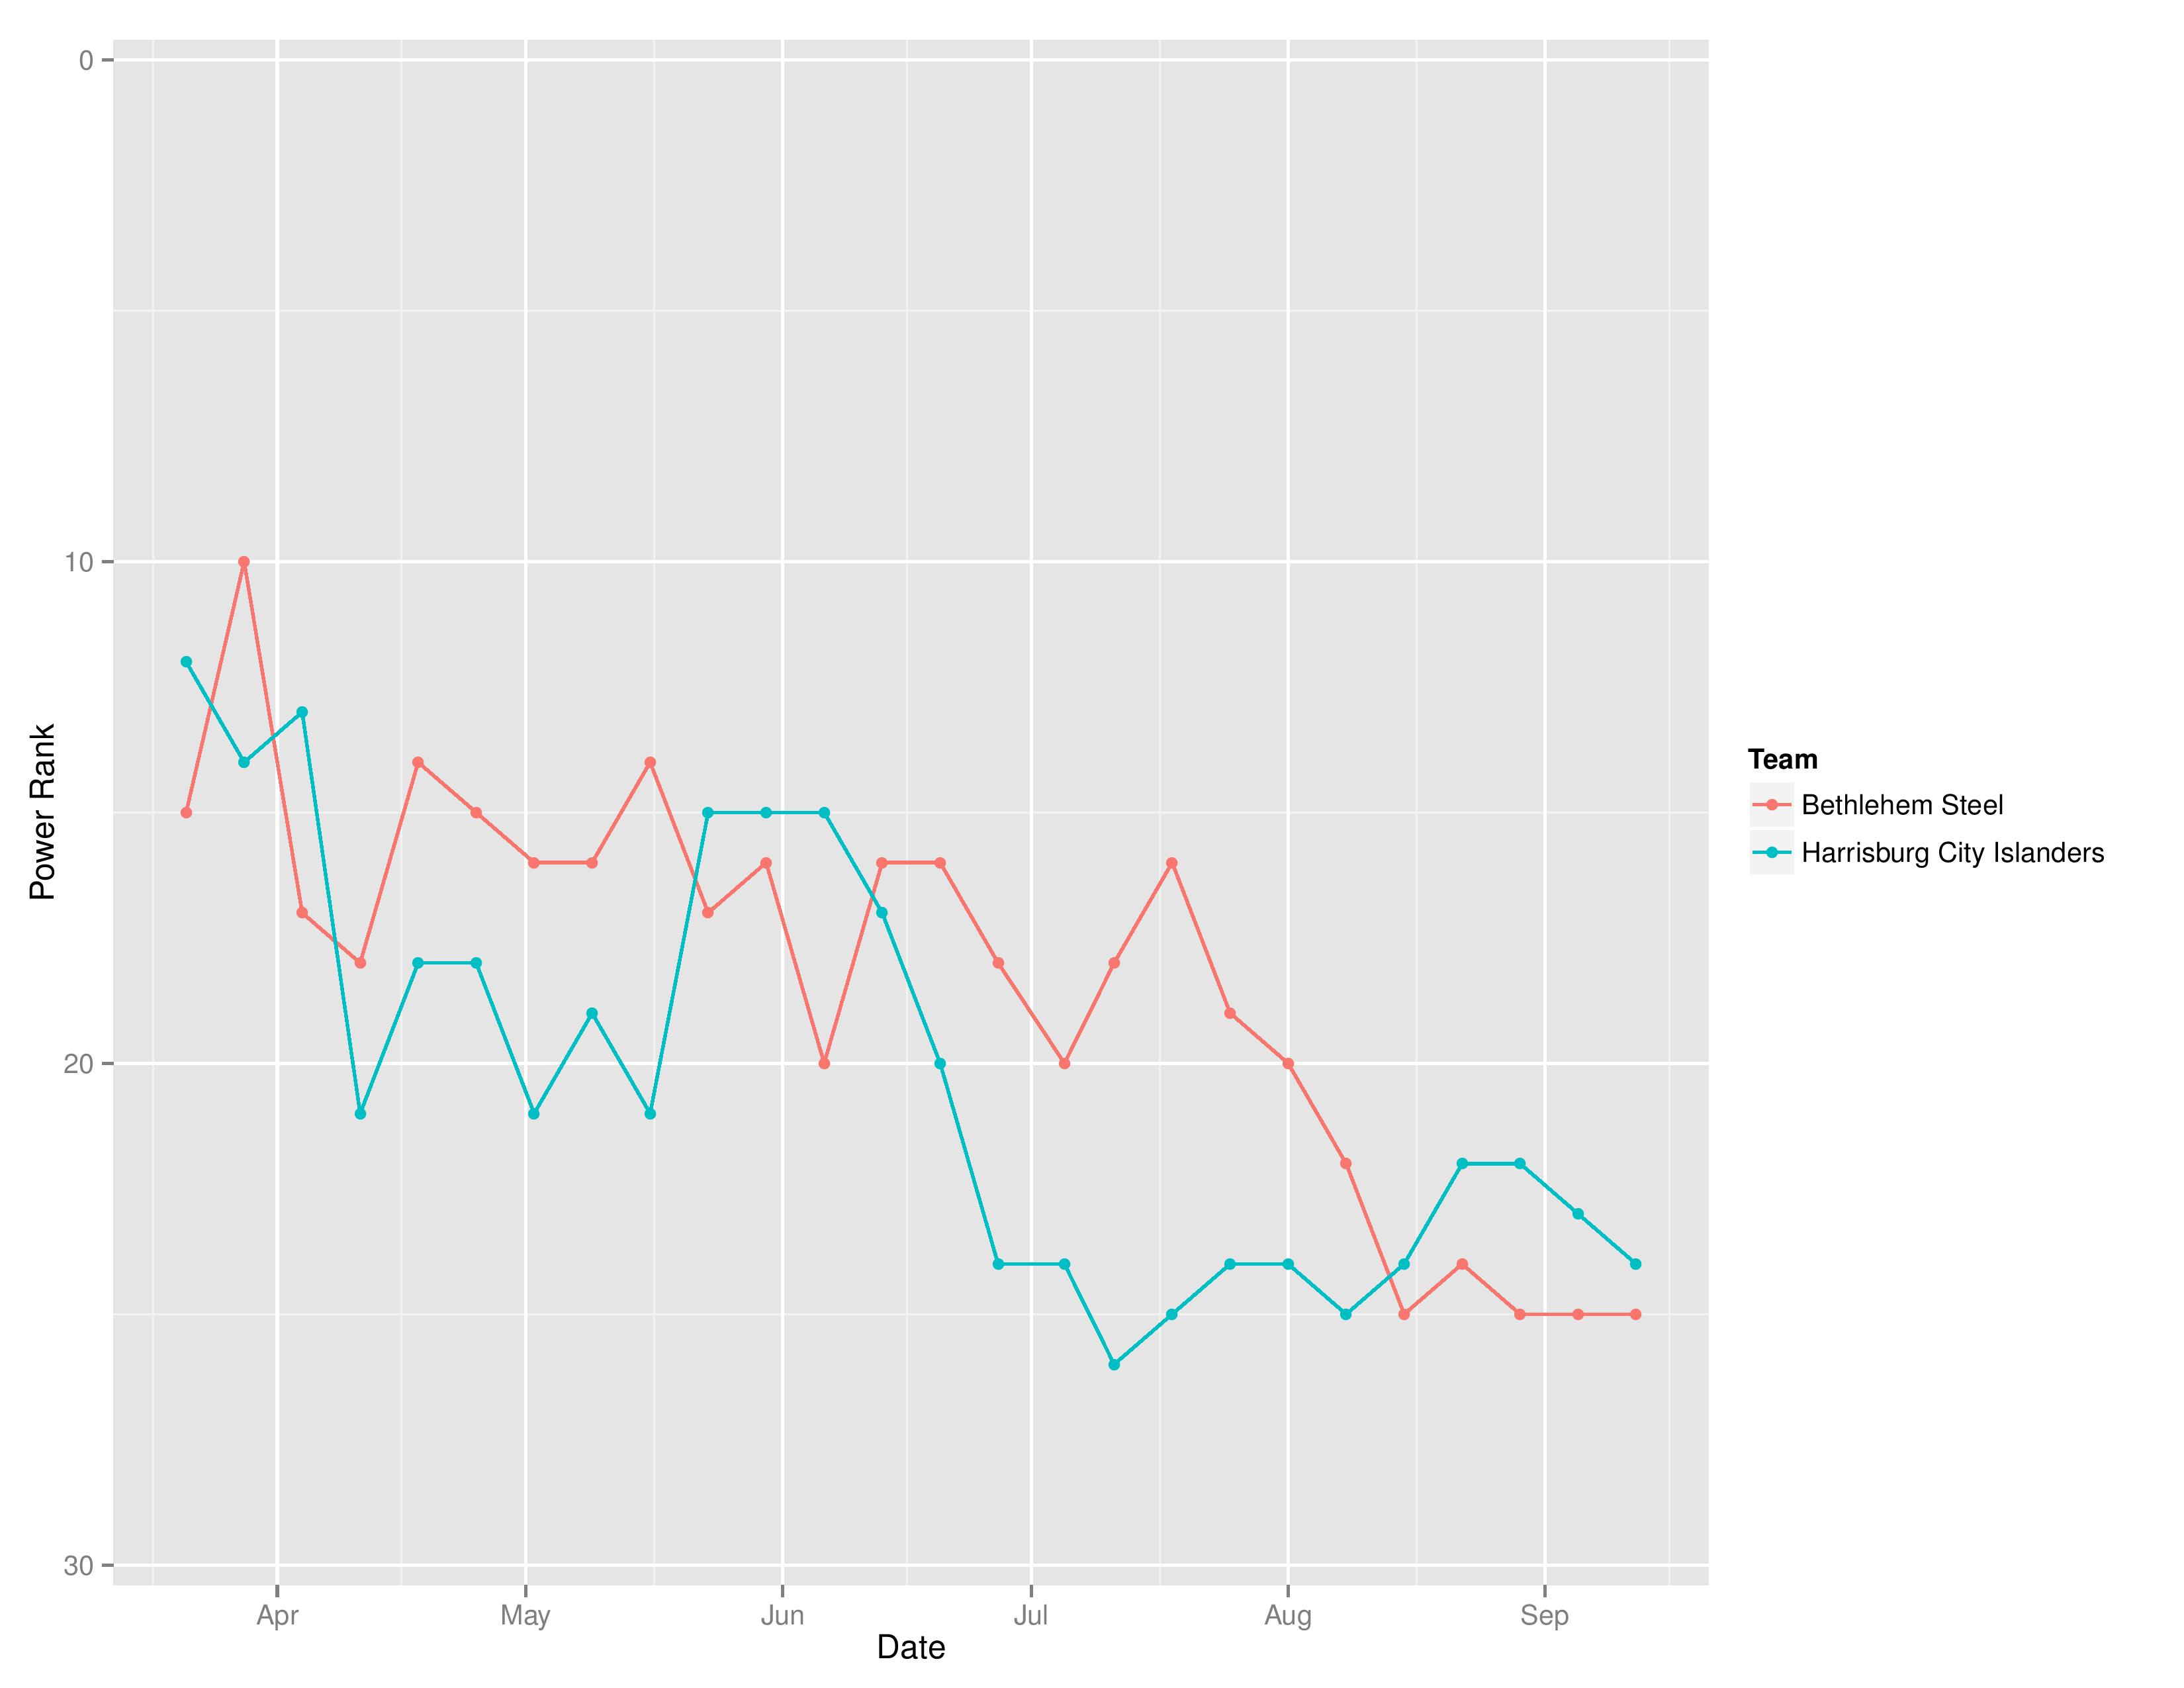
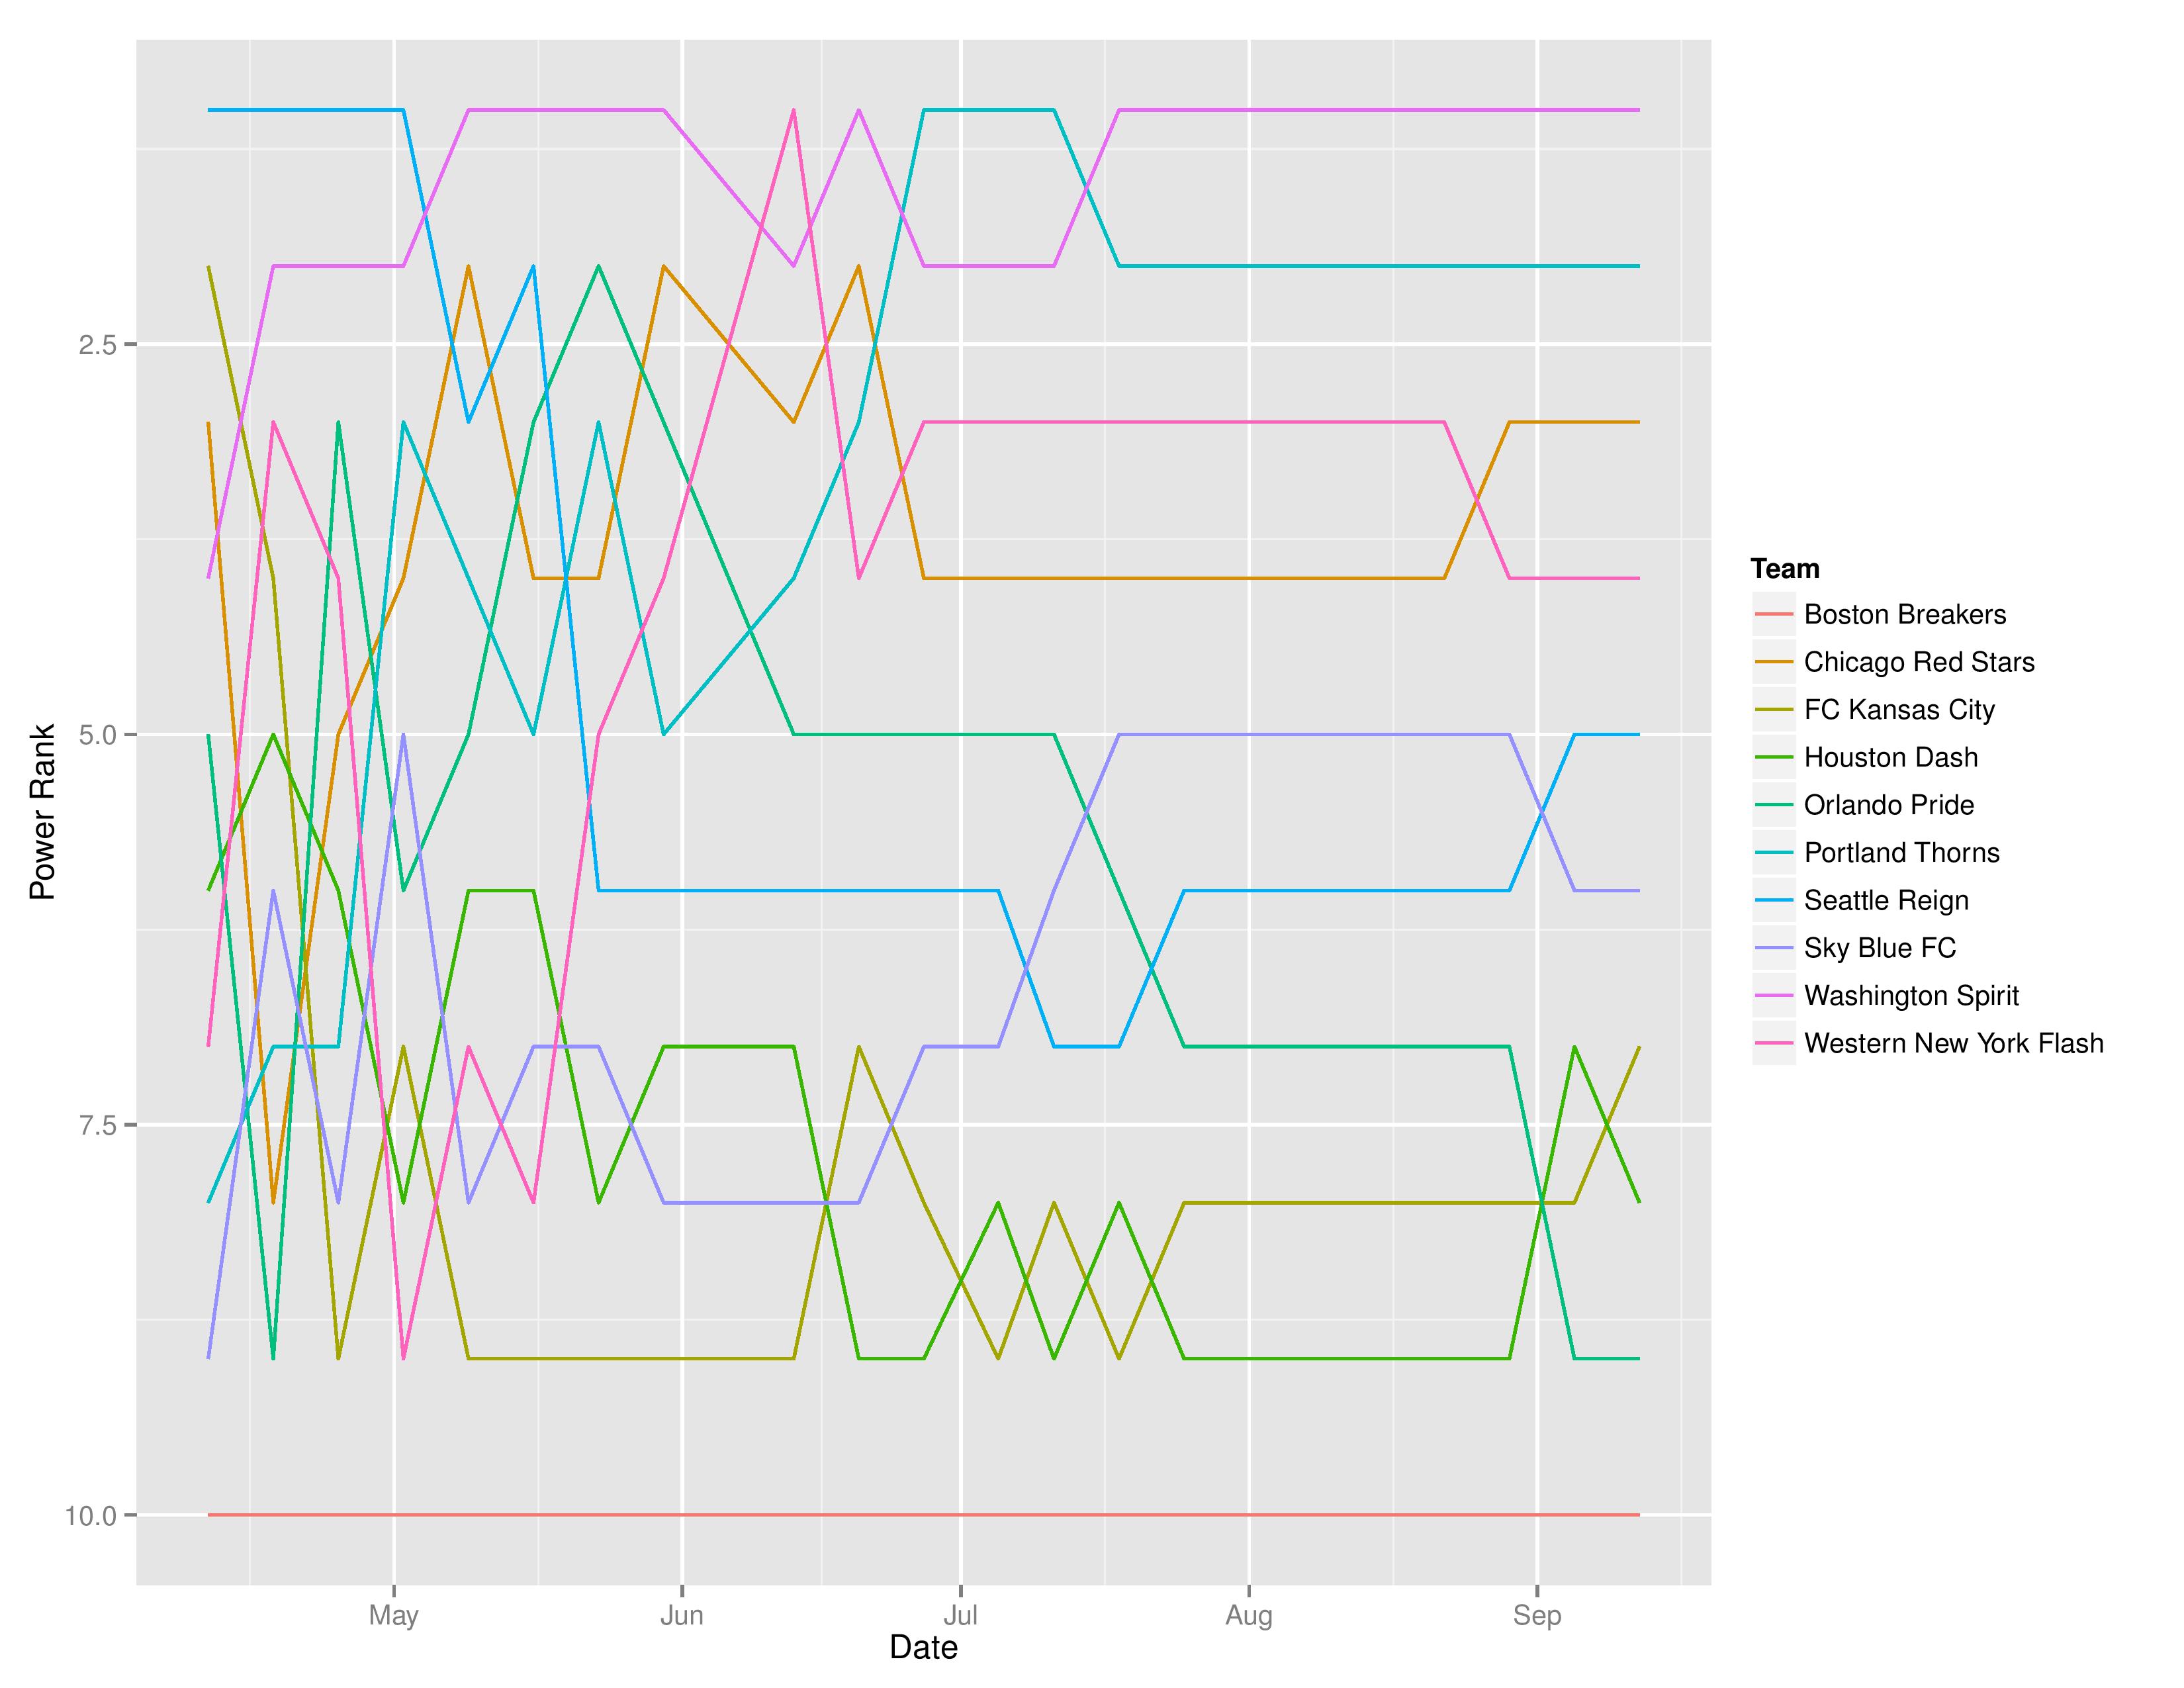
Below shows the evolution of SEBA’s power rankings for Bethlehem Steel FC and the Harrisburg City Islanders.
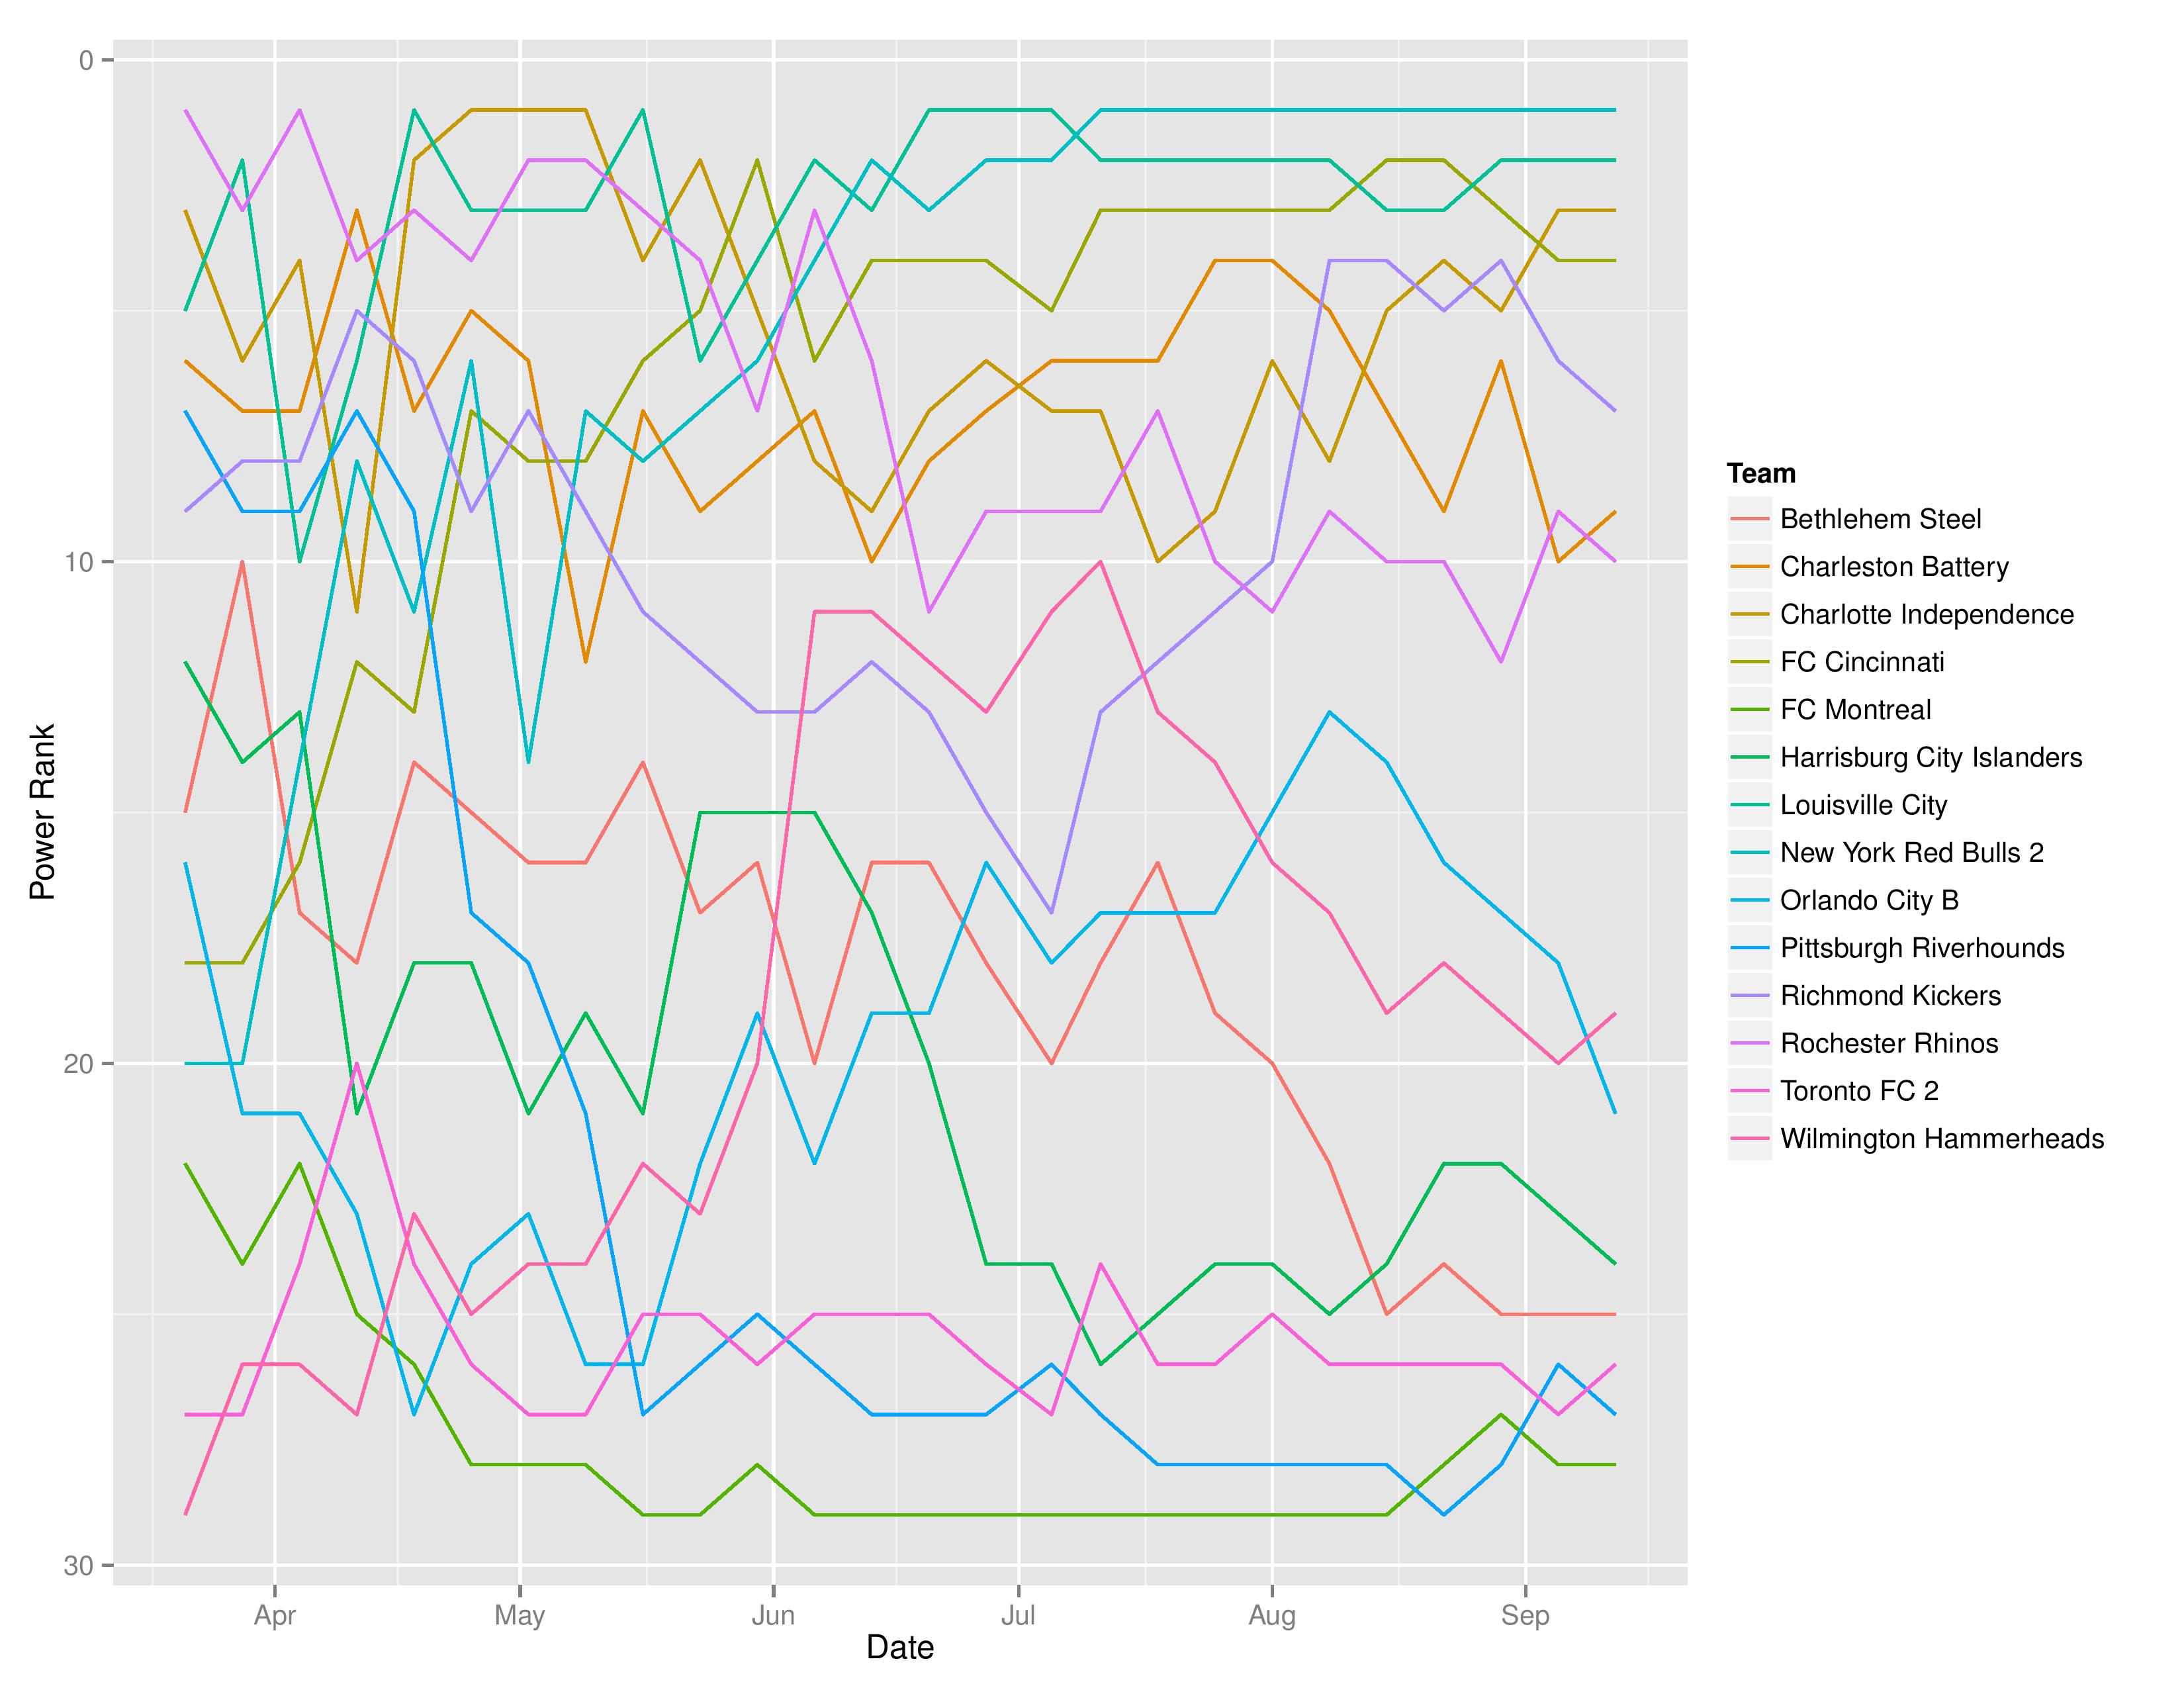
Below shows SEBA’s power rankings evolution for the USL East over the course of the season
NWSL Projections
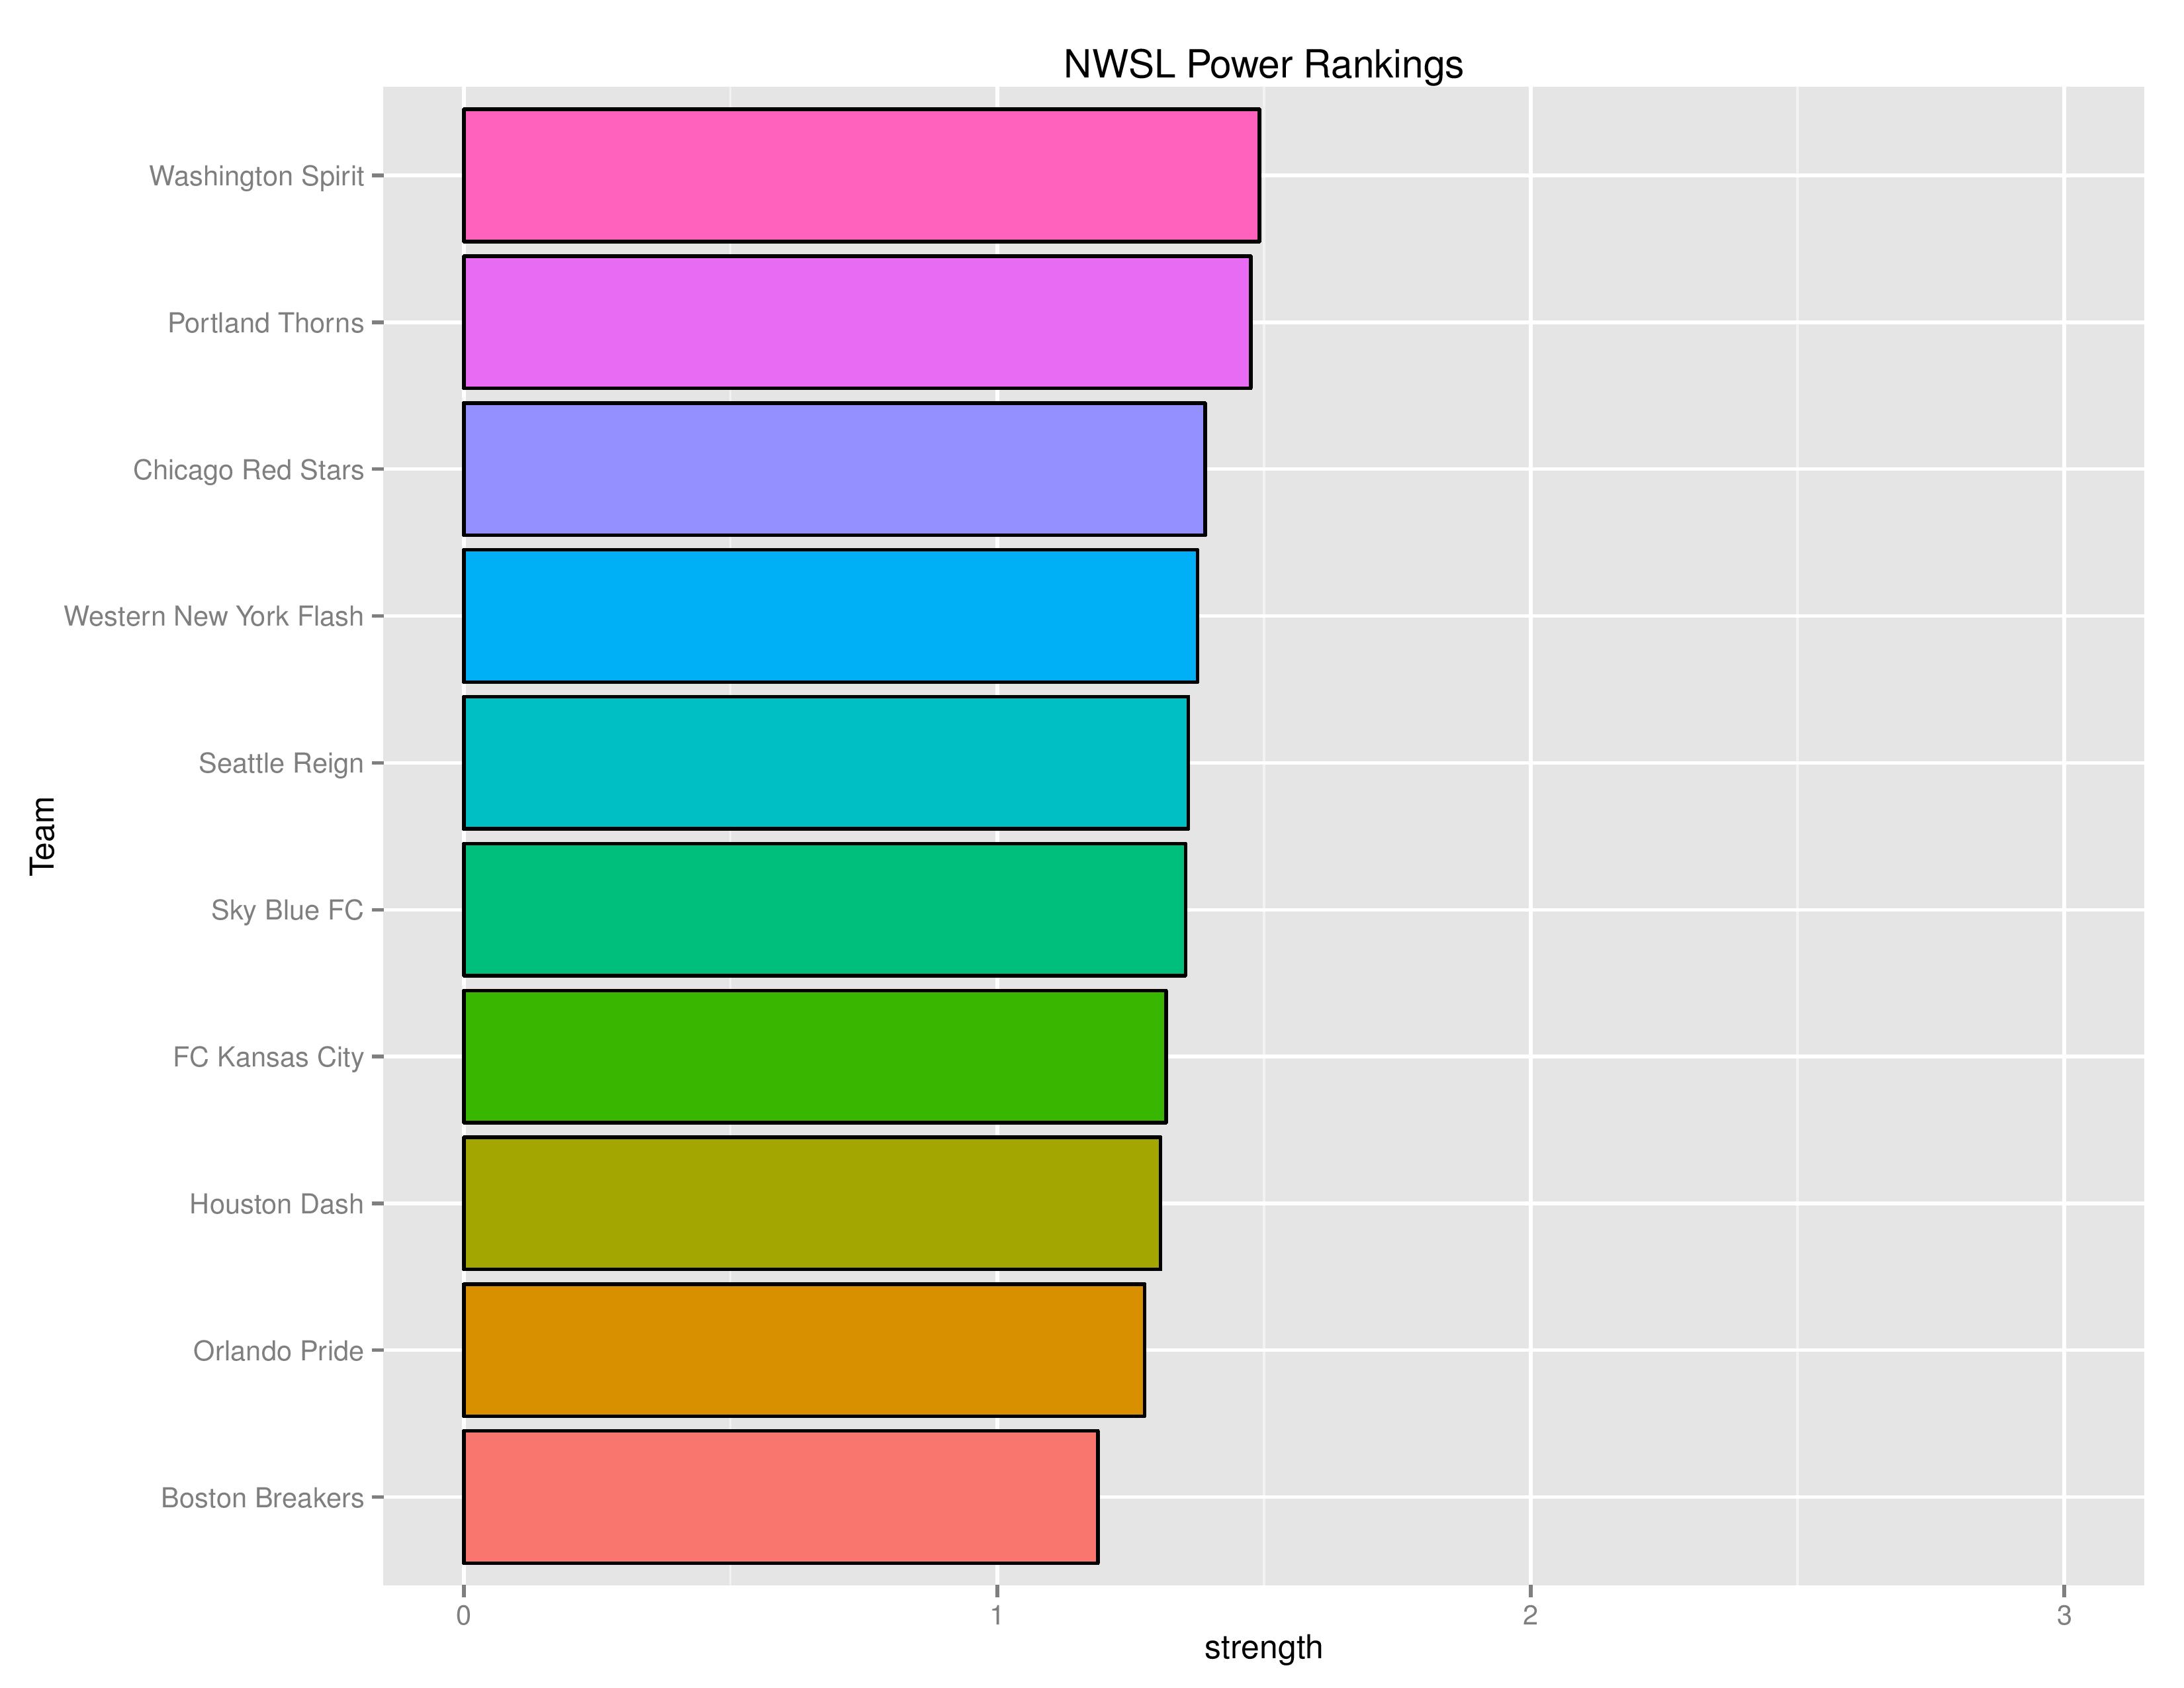
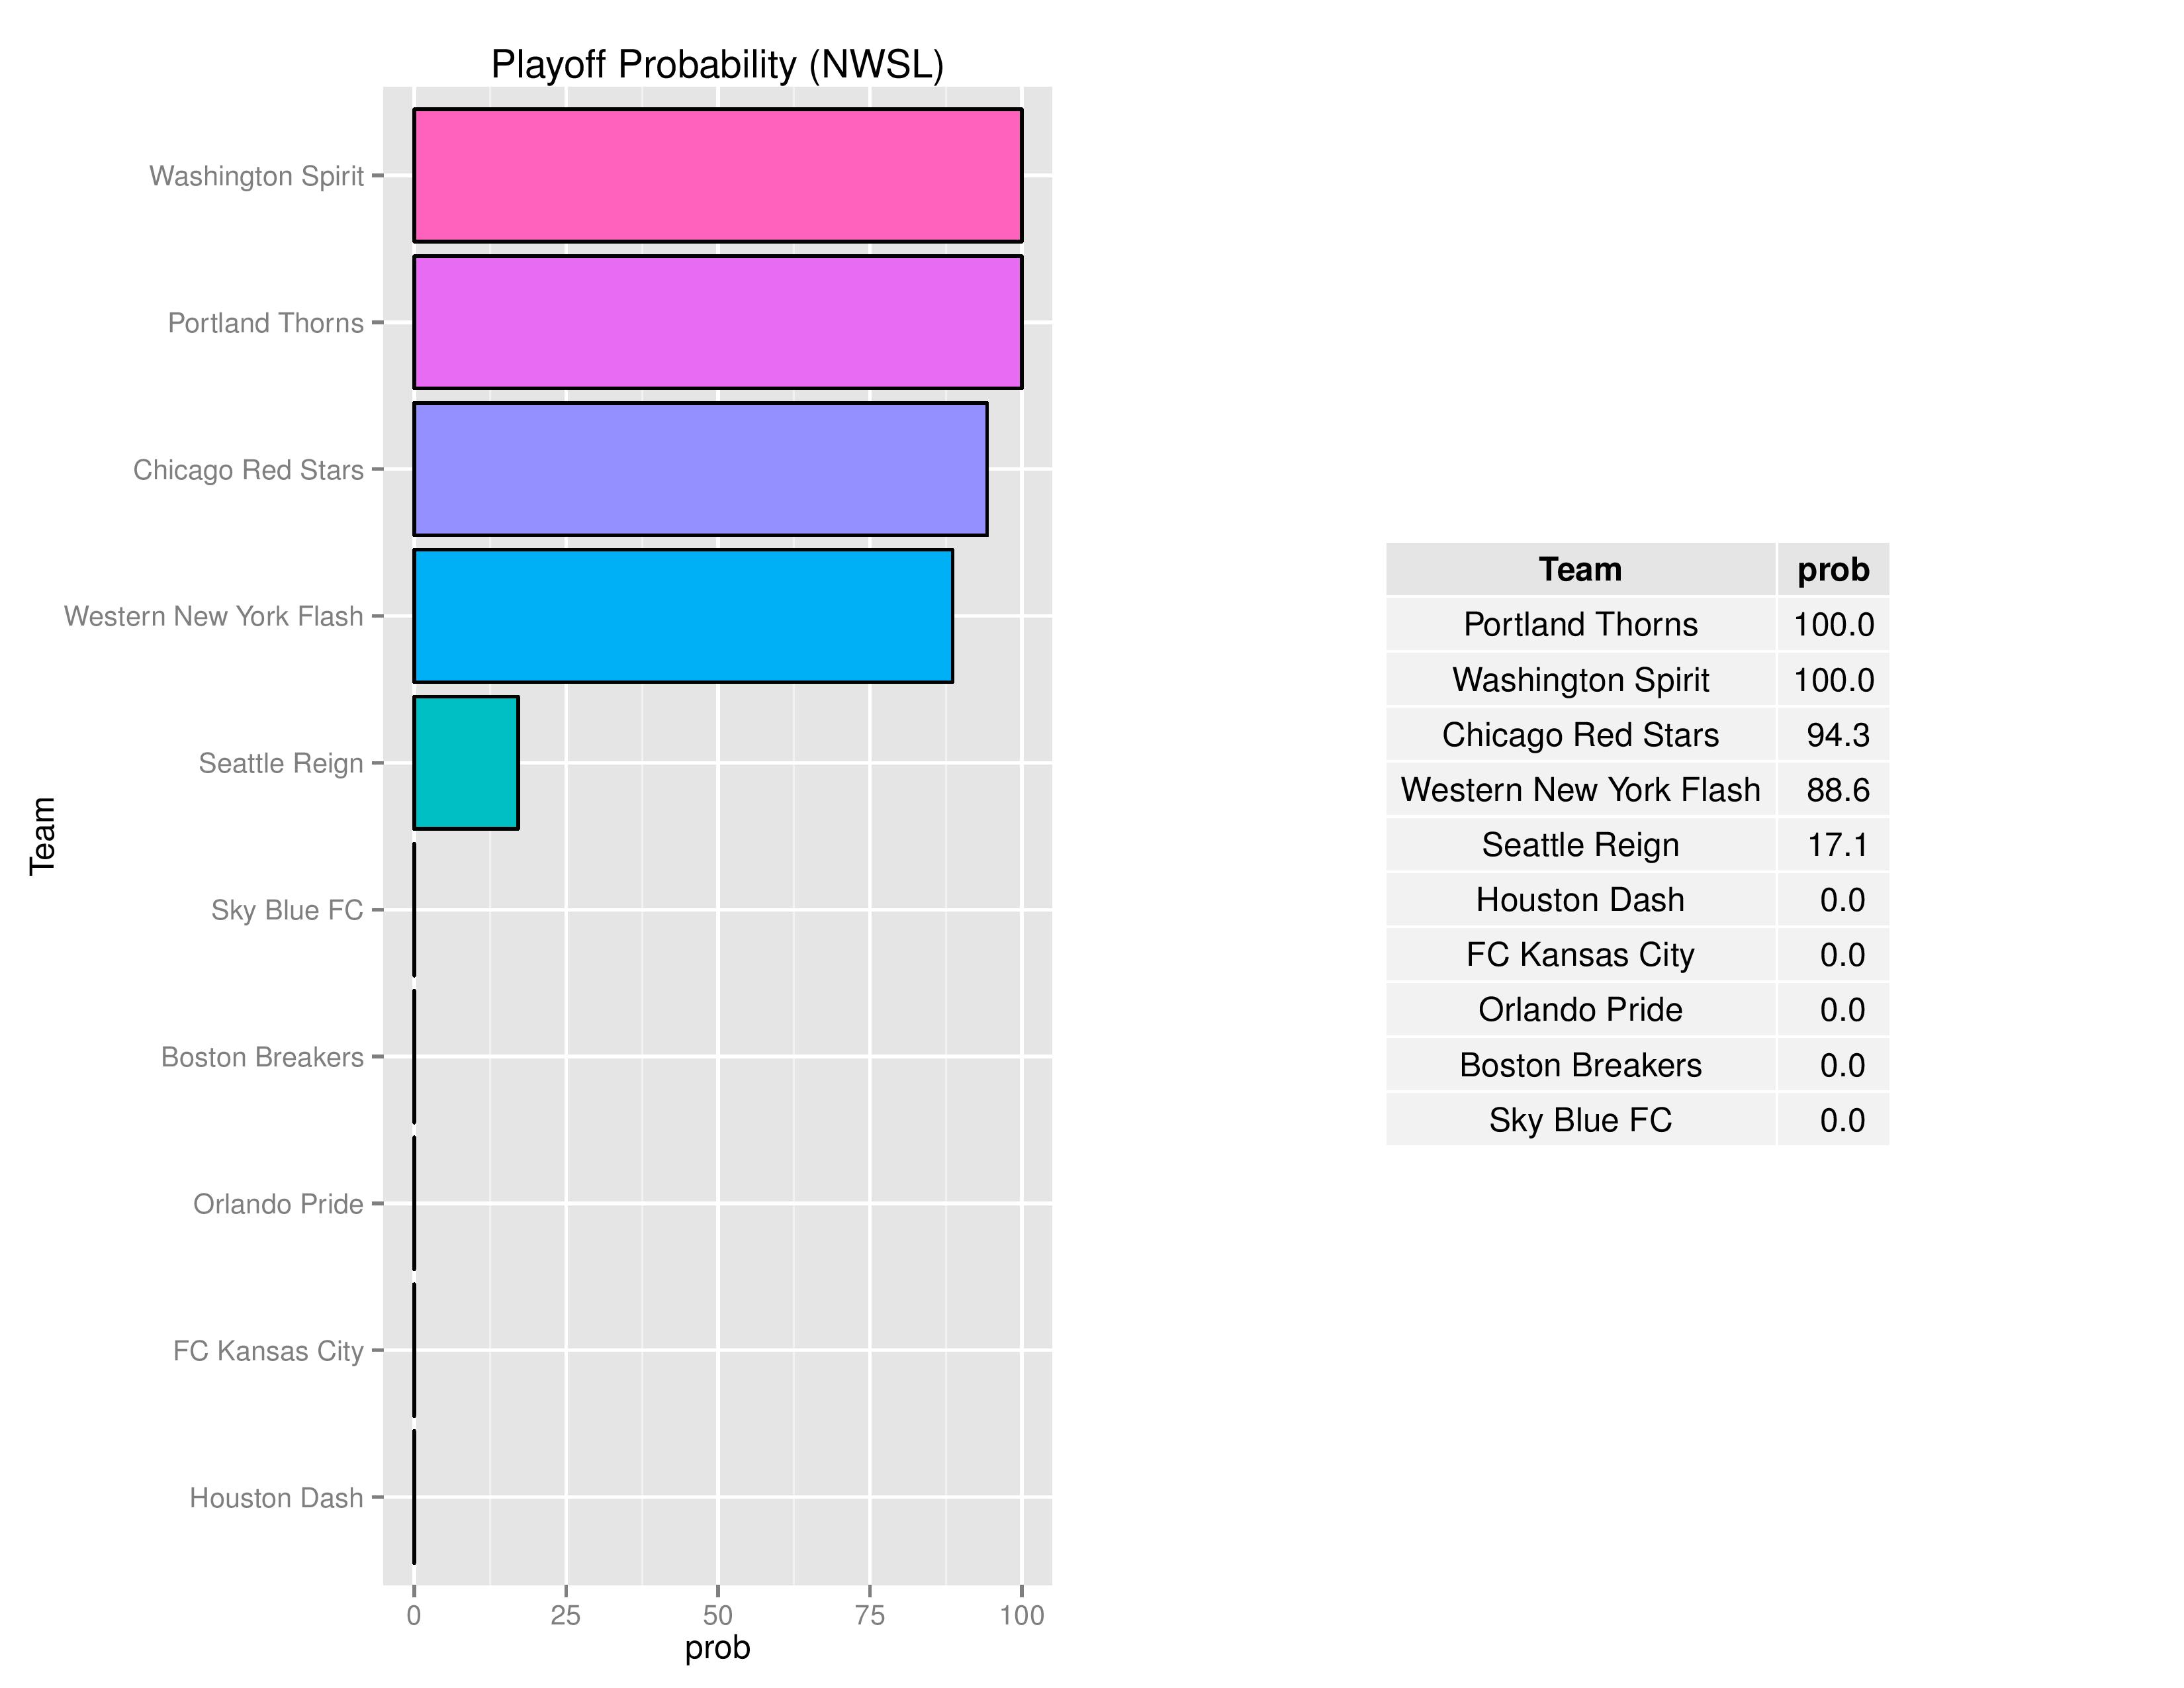
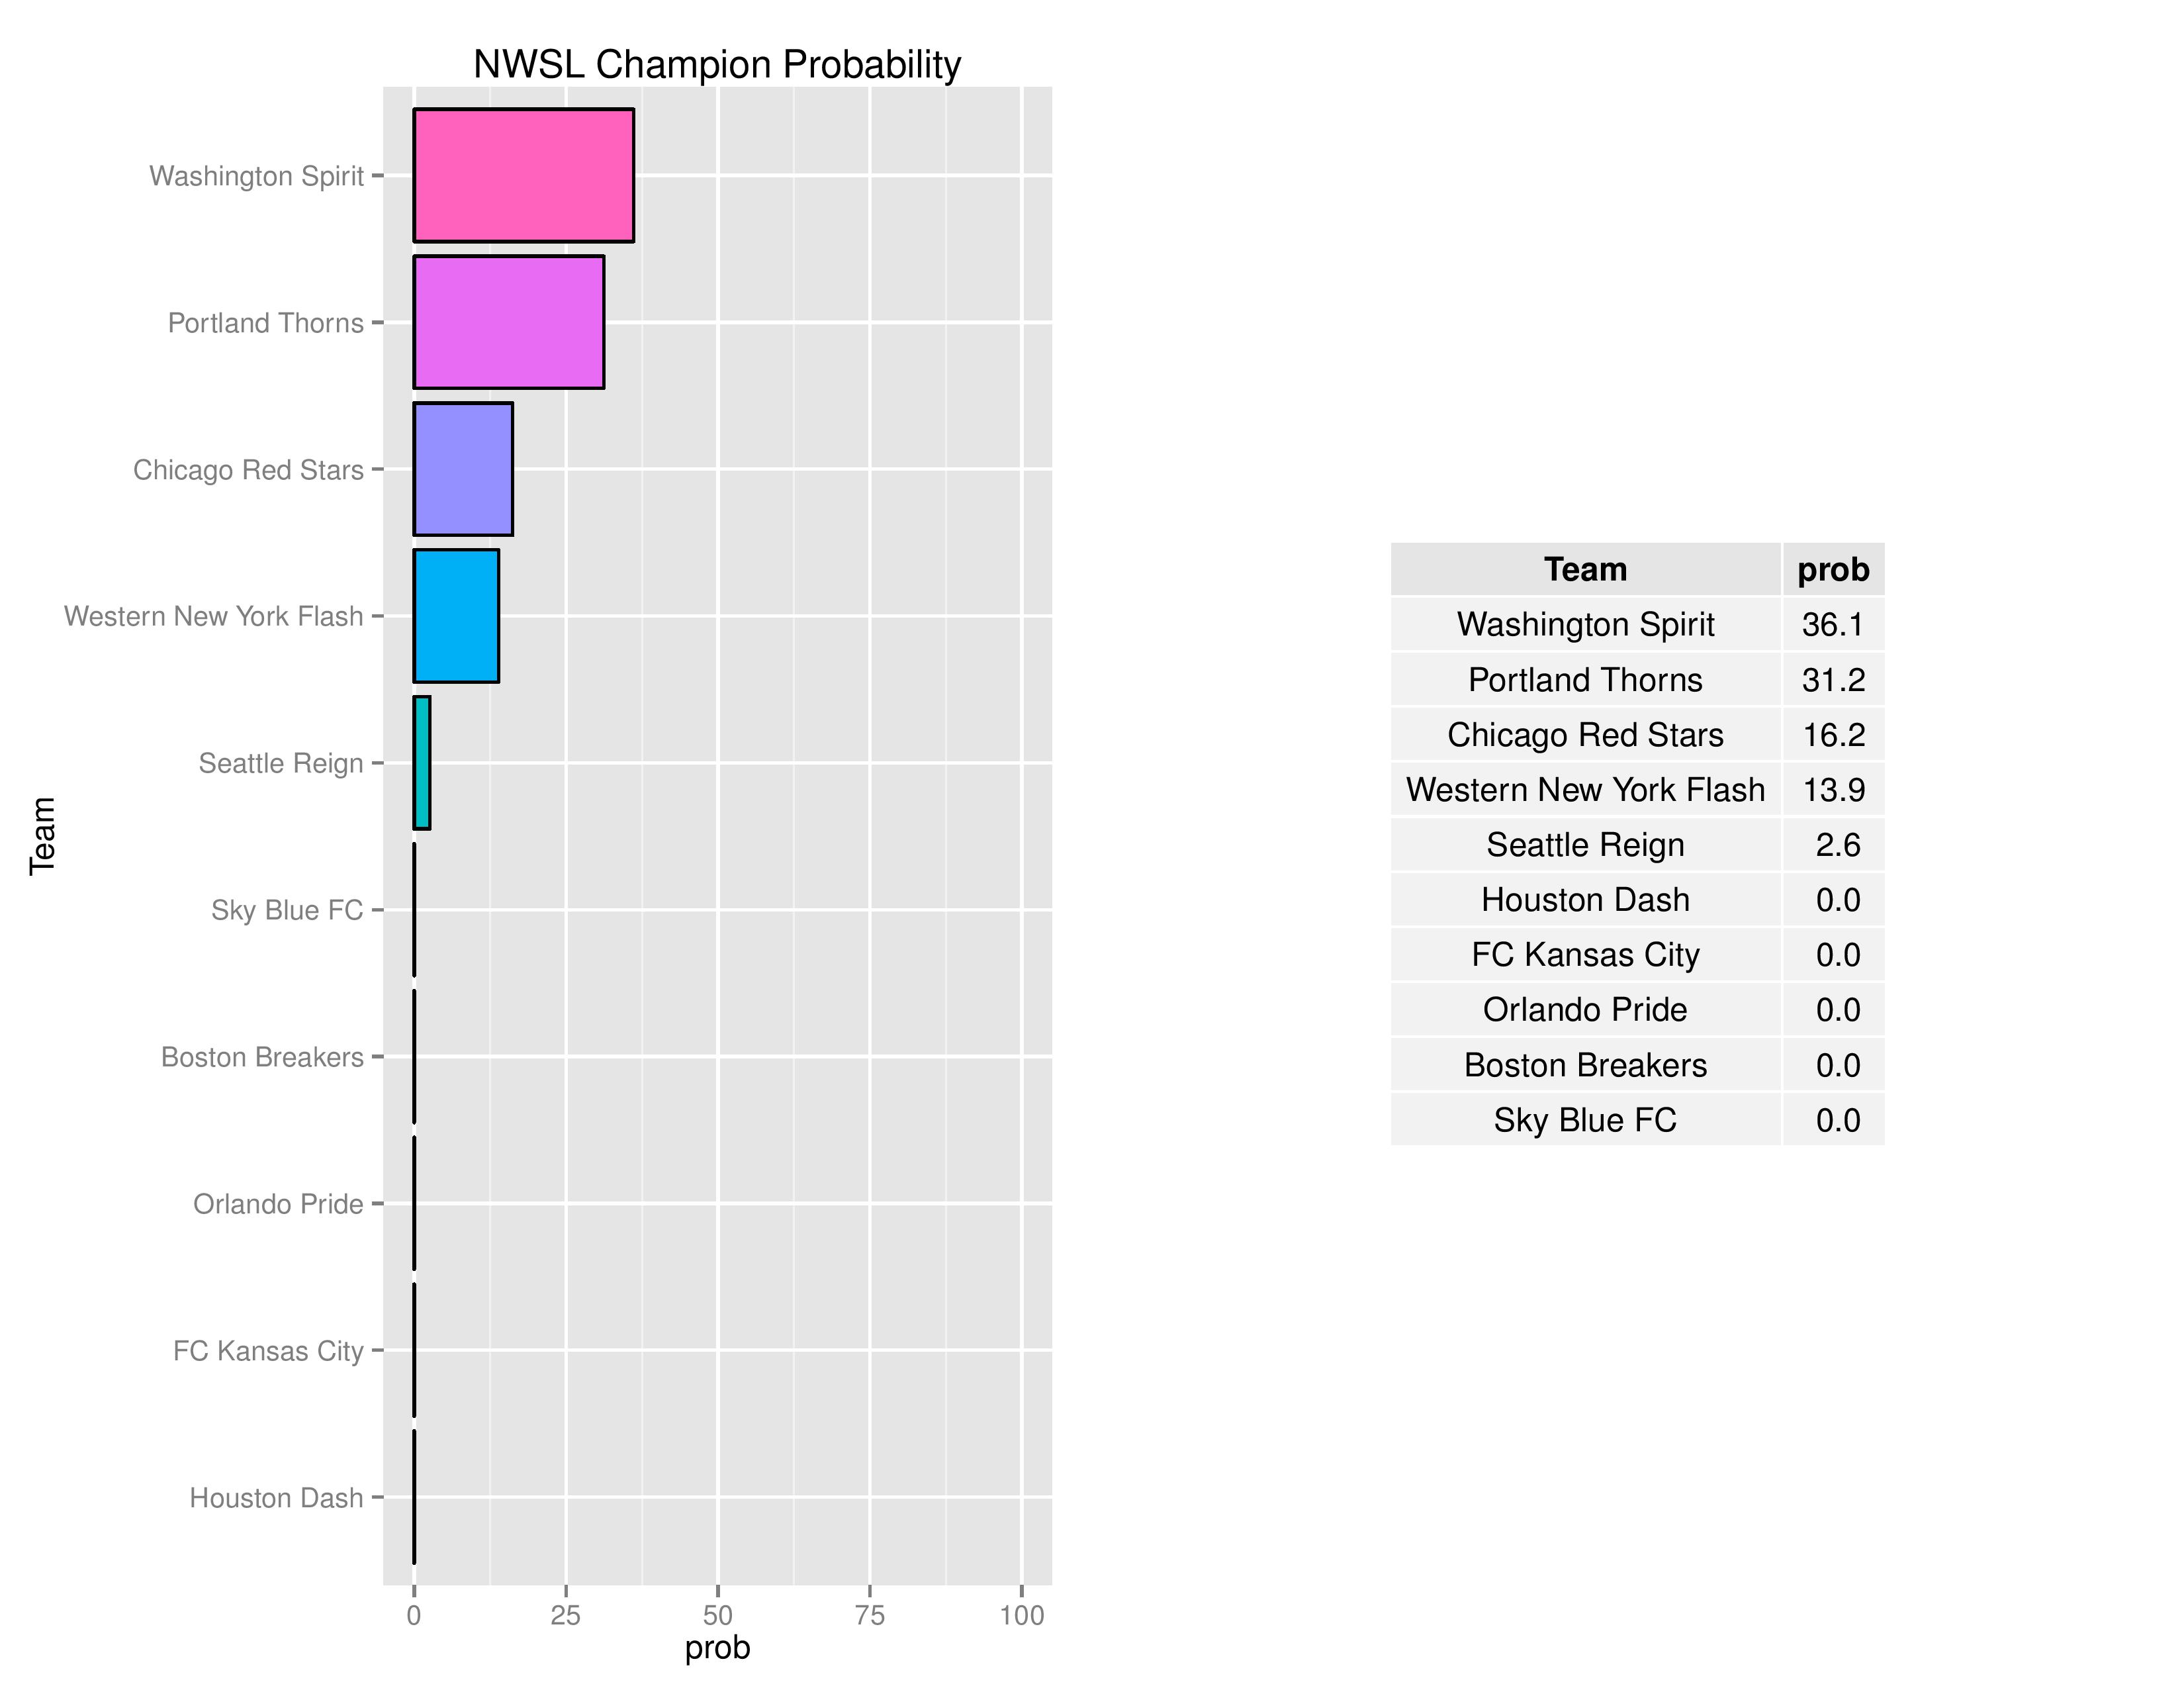
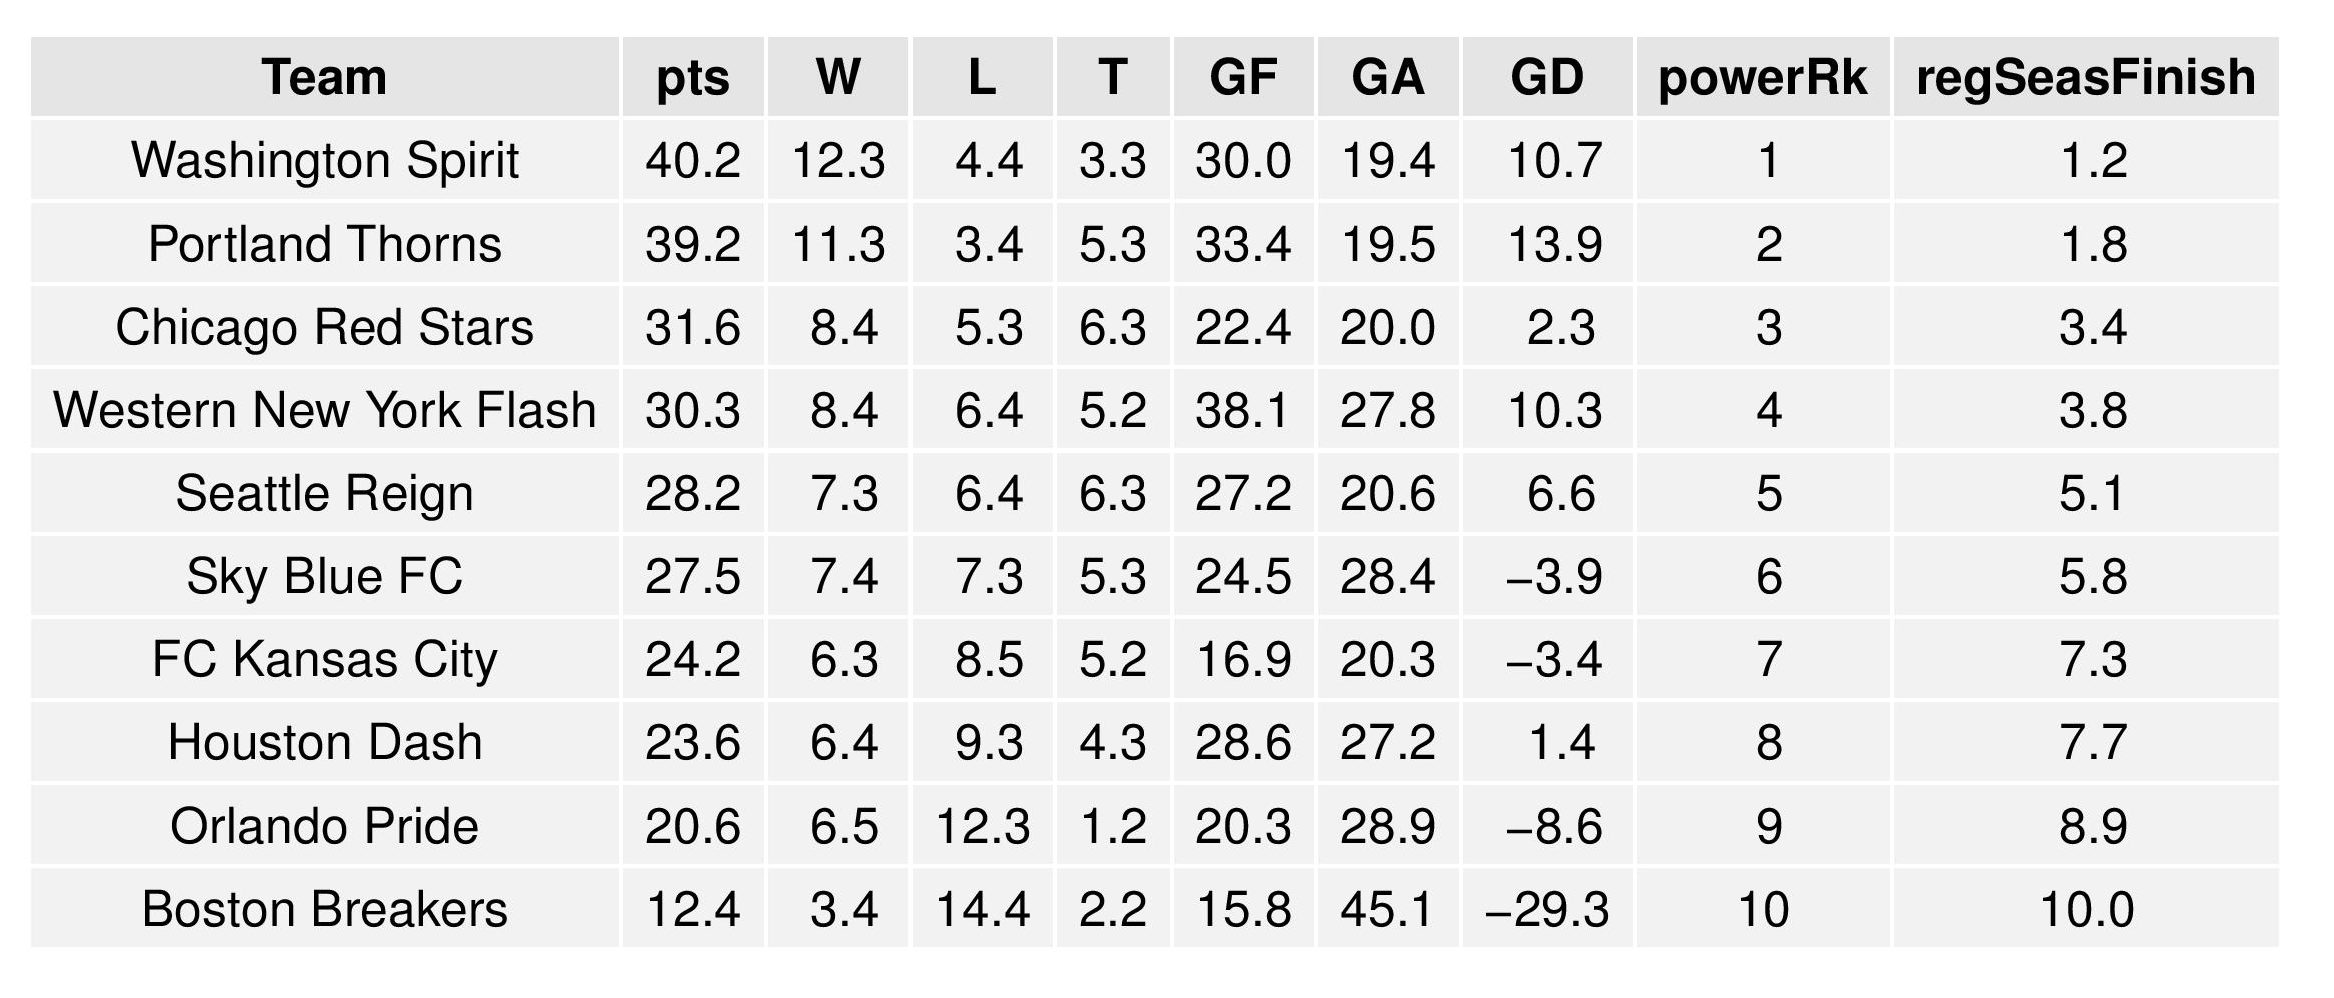
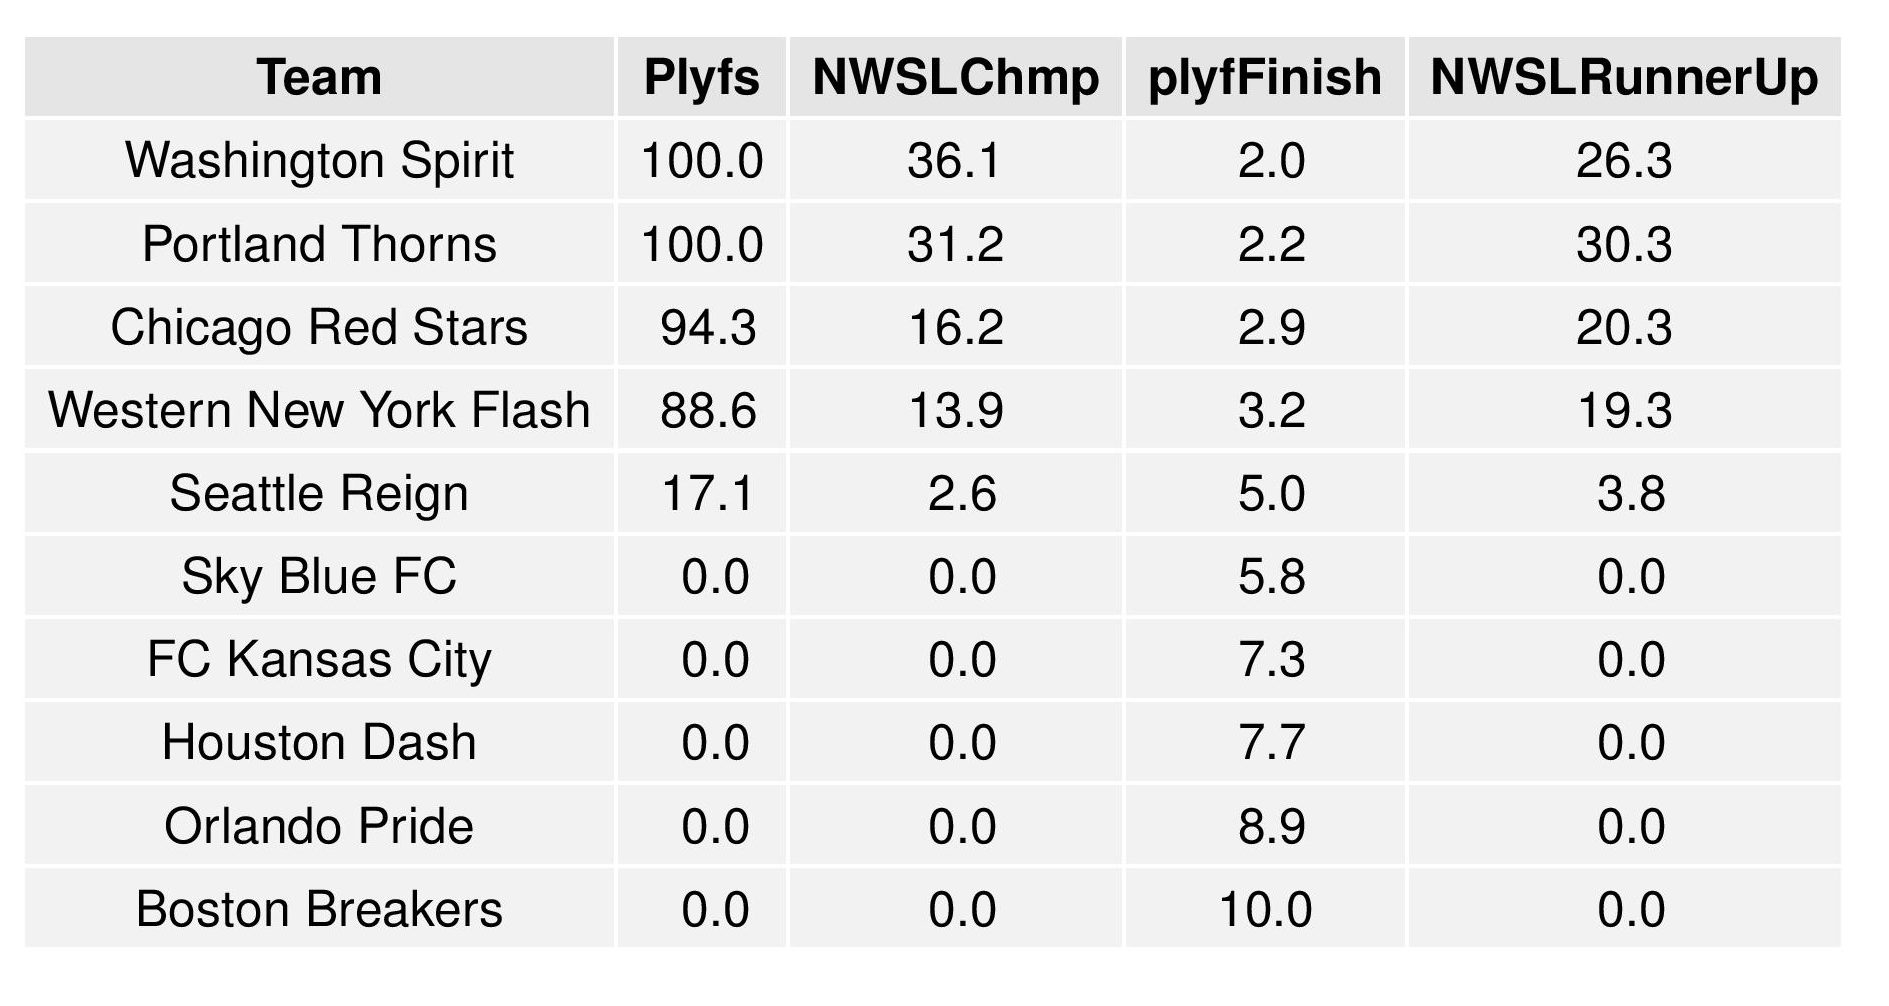
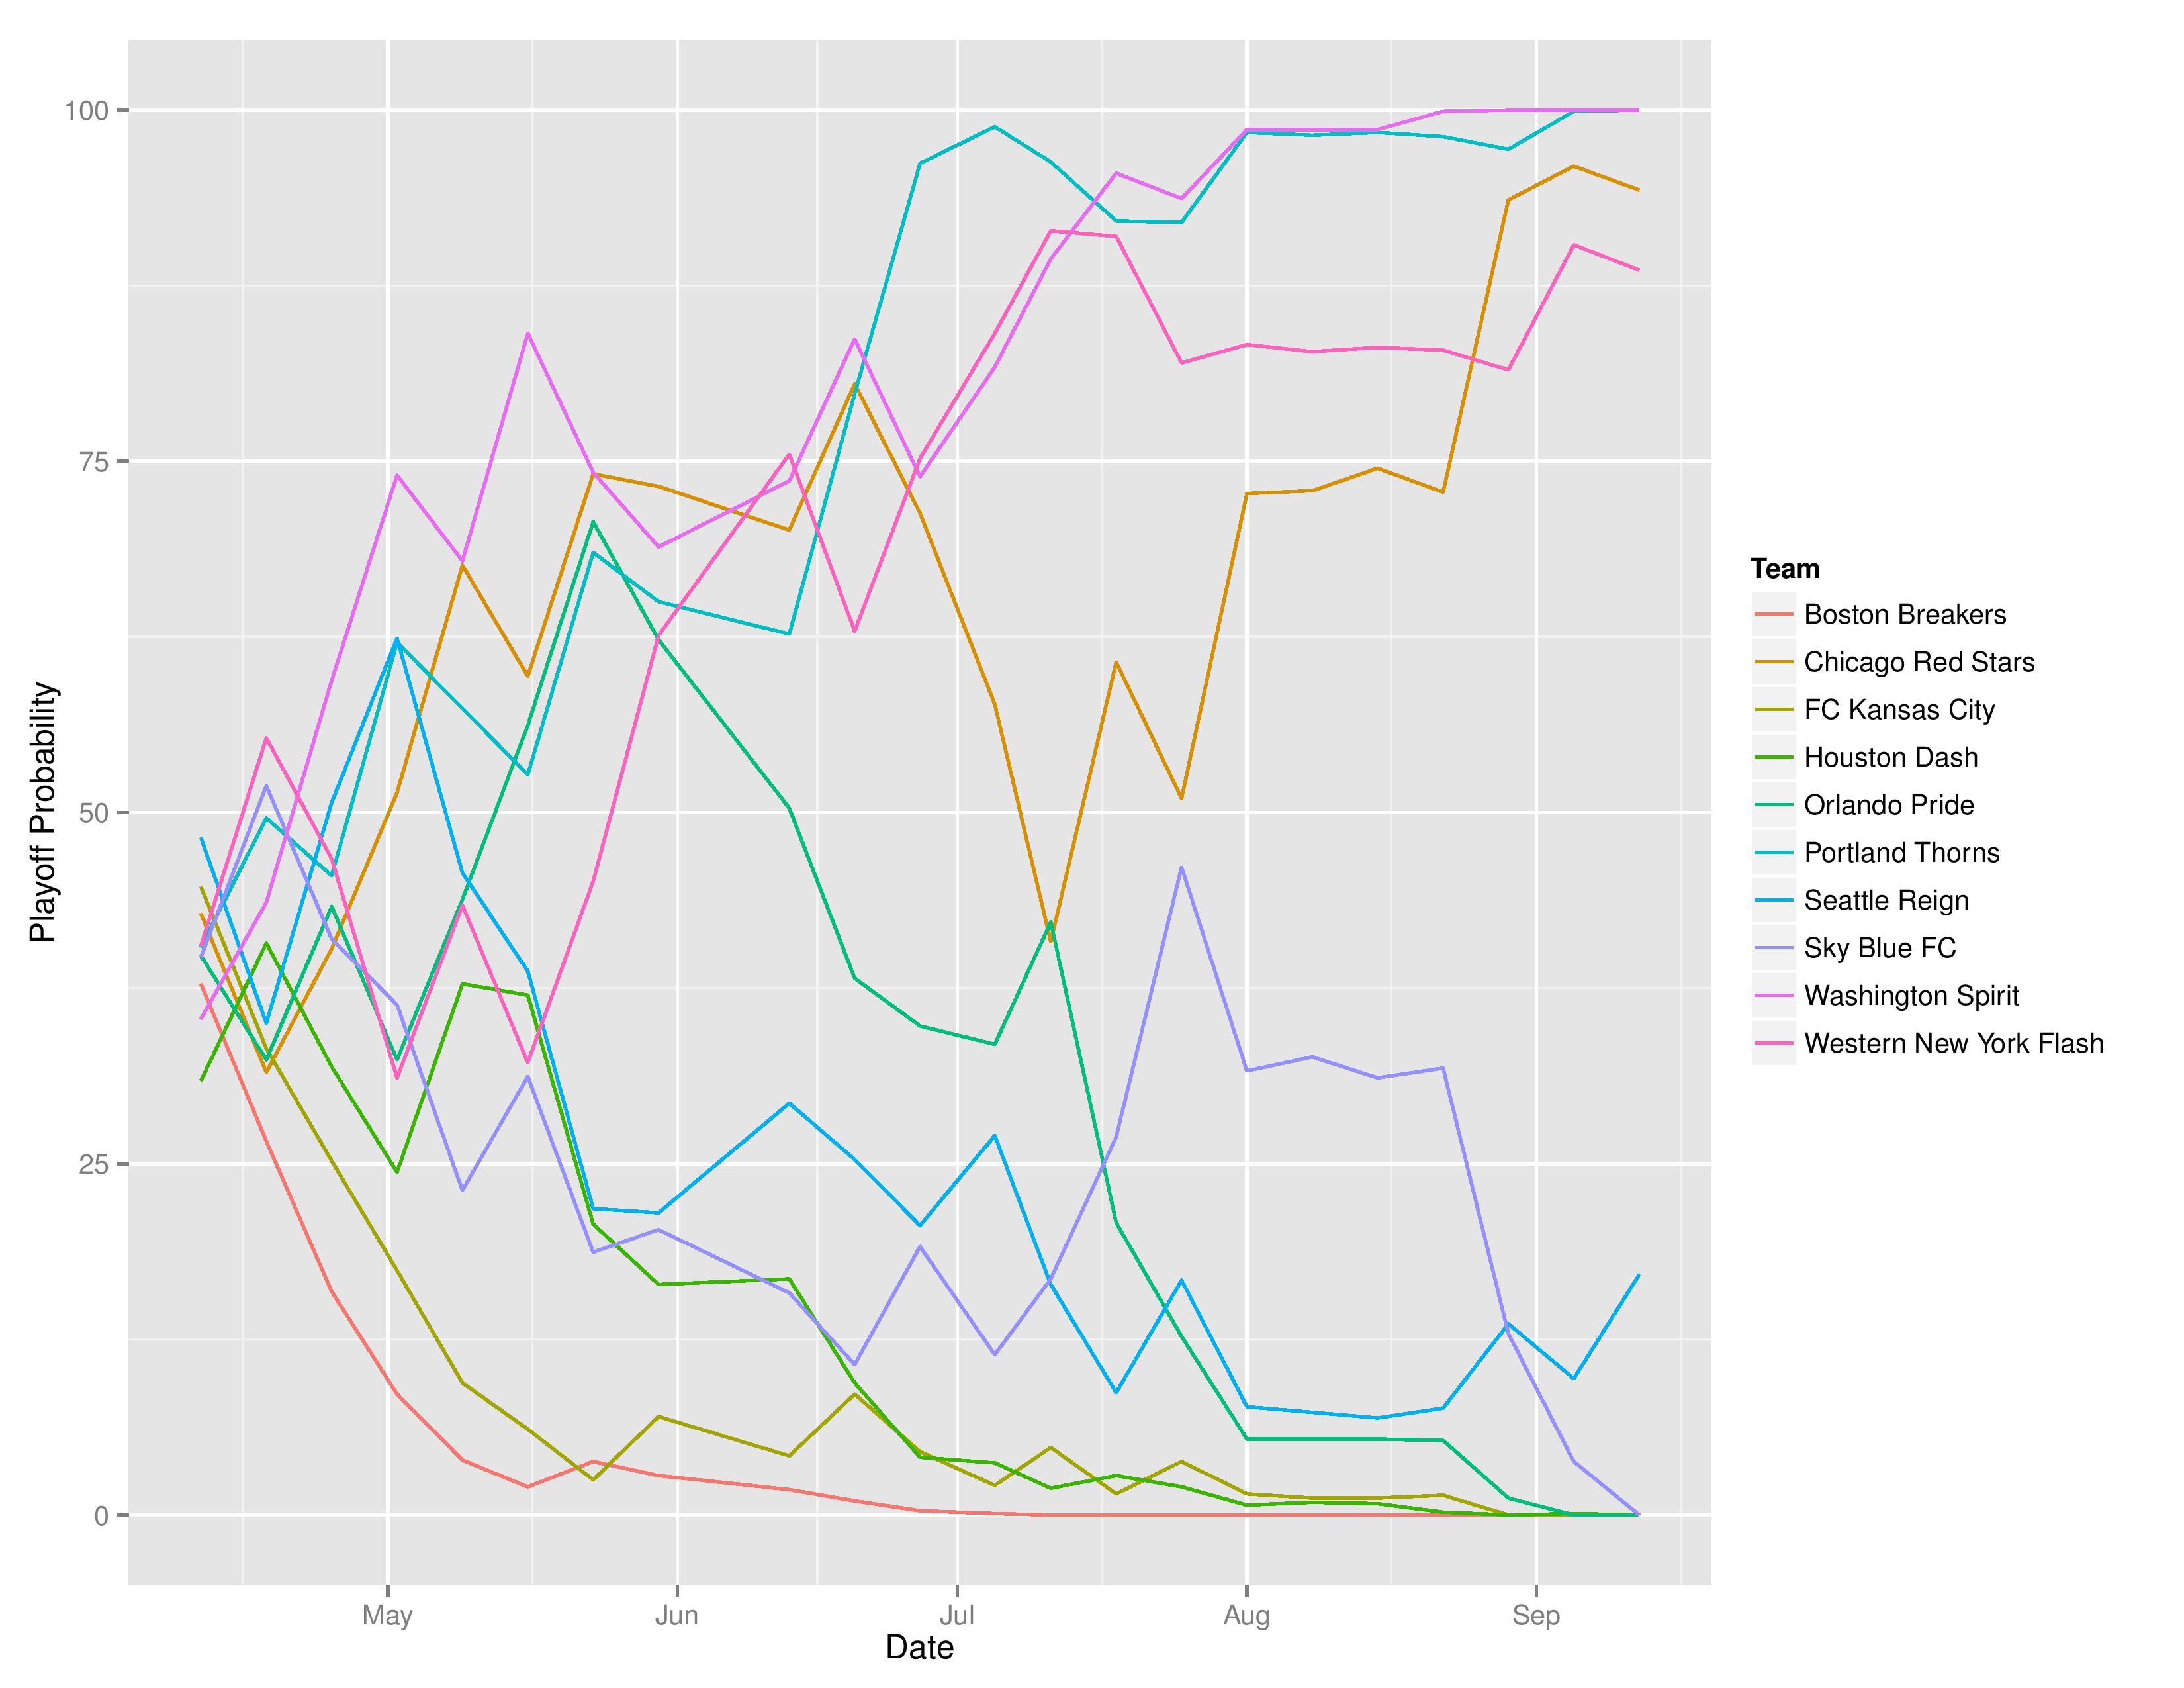
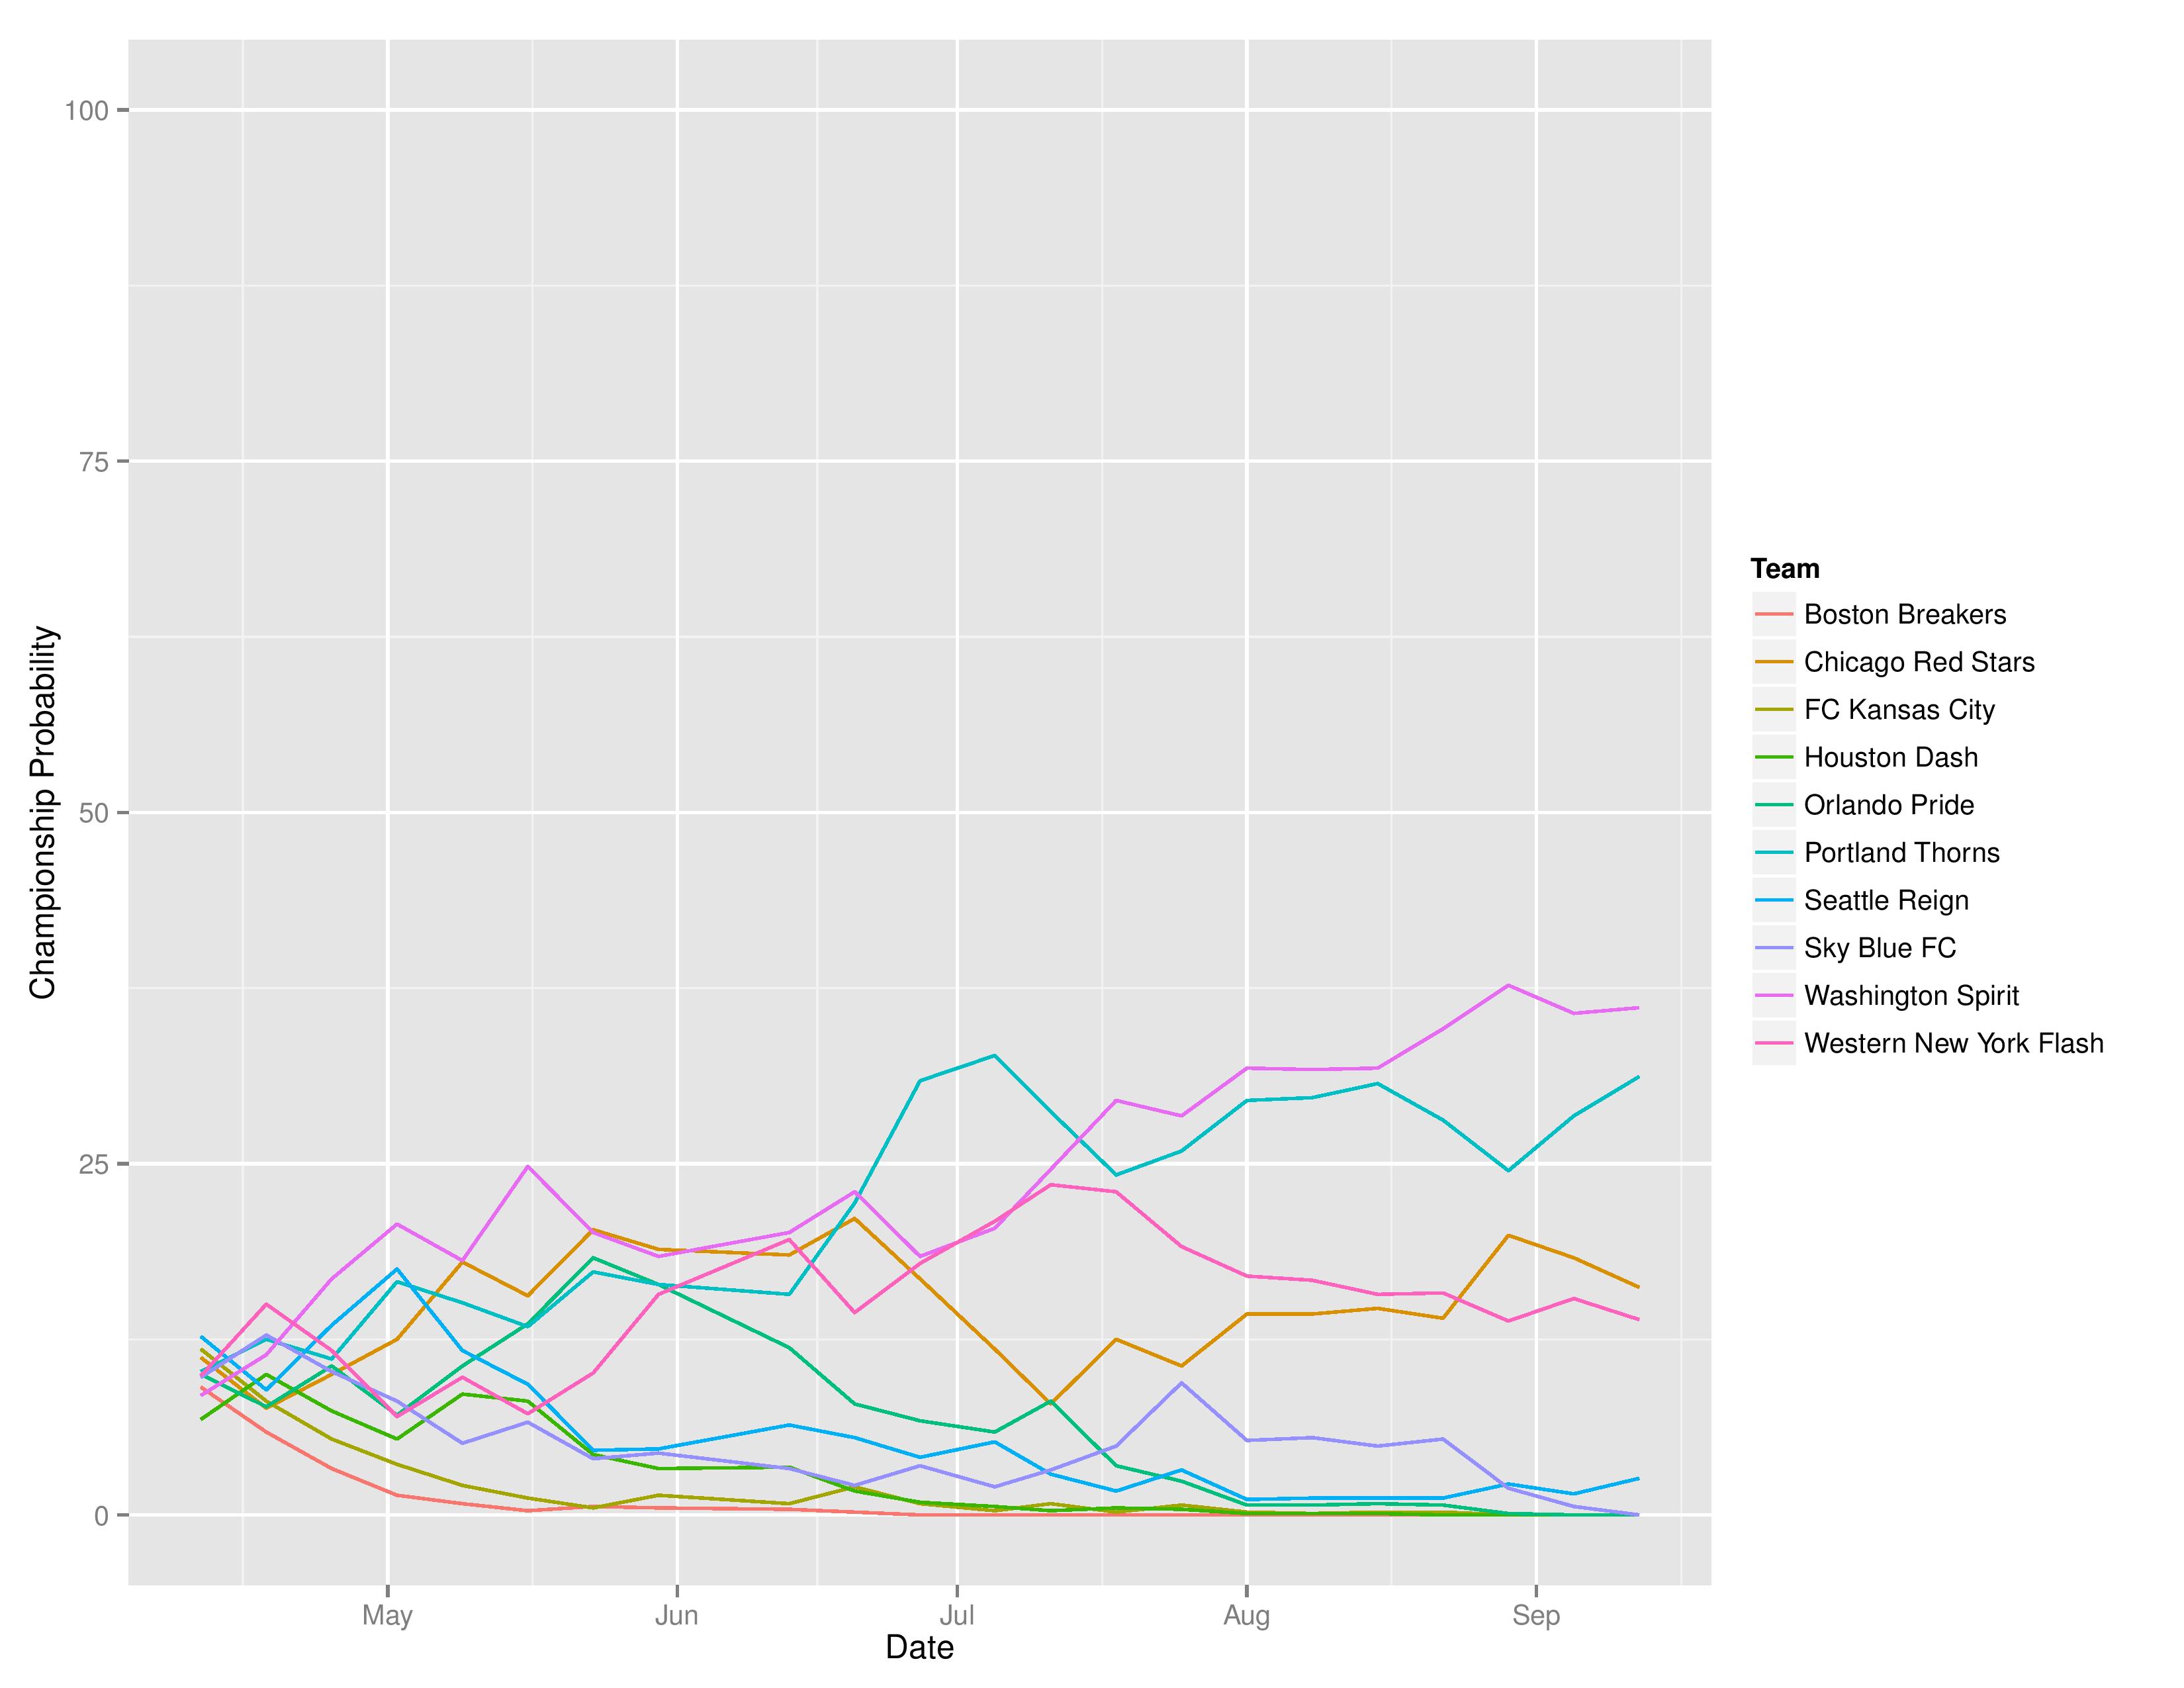
The following tables are the average simulation results produced by SEBA.

Question concerning your projections for the USL.
.
Given that your basic assumption is that teams continue to play in the manner that they have been, AND
.
Given the fact that USL has had absolutely no inter conference play and will not until the championship game itself.
.
How do you develop the ability to compare validly the two conferences’ teams to each other?
.
It seems to this statistical analysis neophyte that there exists a complete and perfect absence of any data allowing comparisons of any kind, given your basic assumption above, between the conferences.
.
The underlying reason for my question is that one an intuitive qualitative basis there is an apparently non-random major difference between the two conferences, their levels of historical experience with the attendant benefits and weaknesses correlating there unto. In English, the East has ALL the survivors of the older versions of the league.
.
And the nature of travel is different between the conferences. The Steel have flown twice this season, Orlando and Louisville. I would imagine that Rio Grande Valley has considered a bus only for trips to San Antonio.
.
The Steel changed time zones at most once, to Louisville unless central Kentucky follows the same Summer Time practices as does Indiana in which case not even then, maybe. St. Louis probably changes time by two hours every time it travels to the west Coast. The two conferences coul be relabeled the “Jet-lagged” and the “Not Jet-lagged.”
.
Just curious. I do enjoy seeing how your statistics stack up with my old fashioned seat of the pants guesses. Usually we agree fairly closely.