Welcome to the Statistical Extrapolation Bayesian Analyzer Projection System, which is, of course, a tortured gathering of words used to form the SEBA Projection System.
The system consists of a model projecting the probabilities of game results and then a barrage of simulations which account for the remaining luck. So the probabilities you see below show, essentially, what the odds are of an outcome if the team continues to play like it has been.
Below are the current season forecasts using data from games through August 28, 2016.
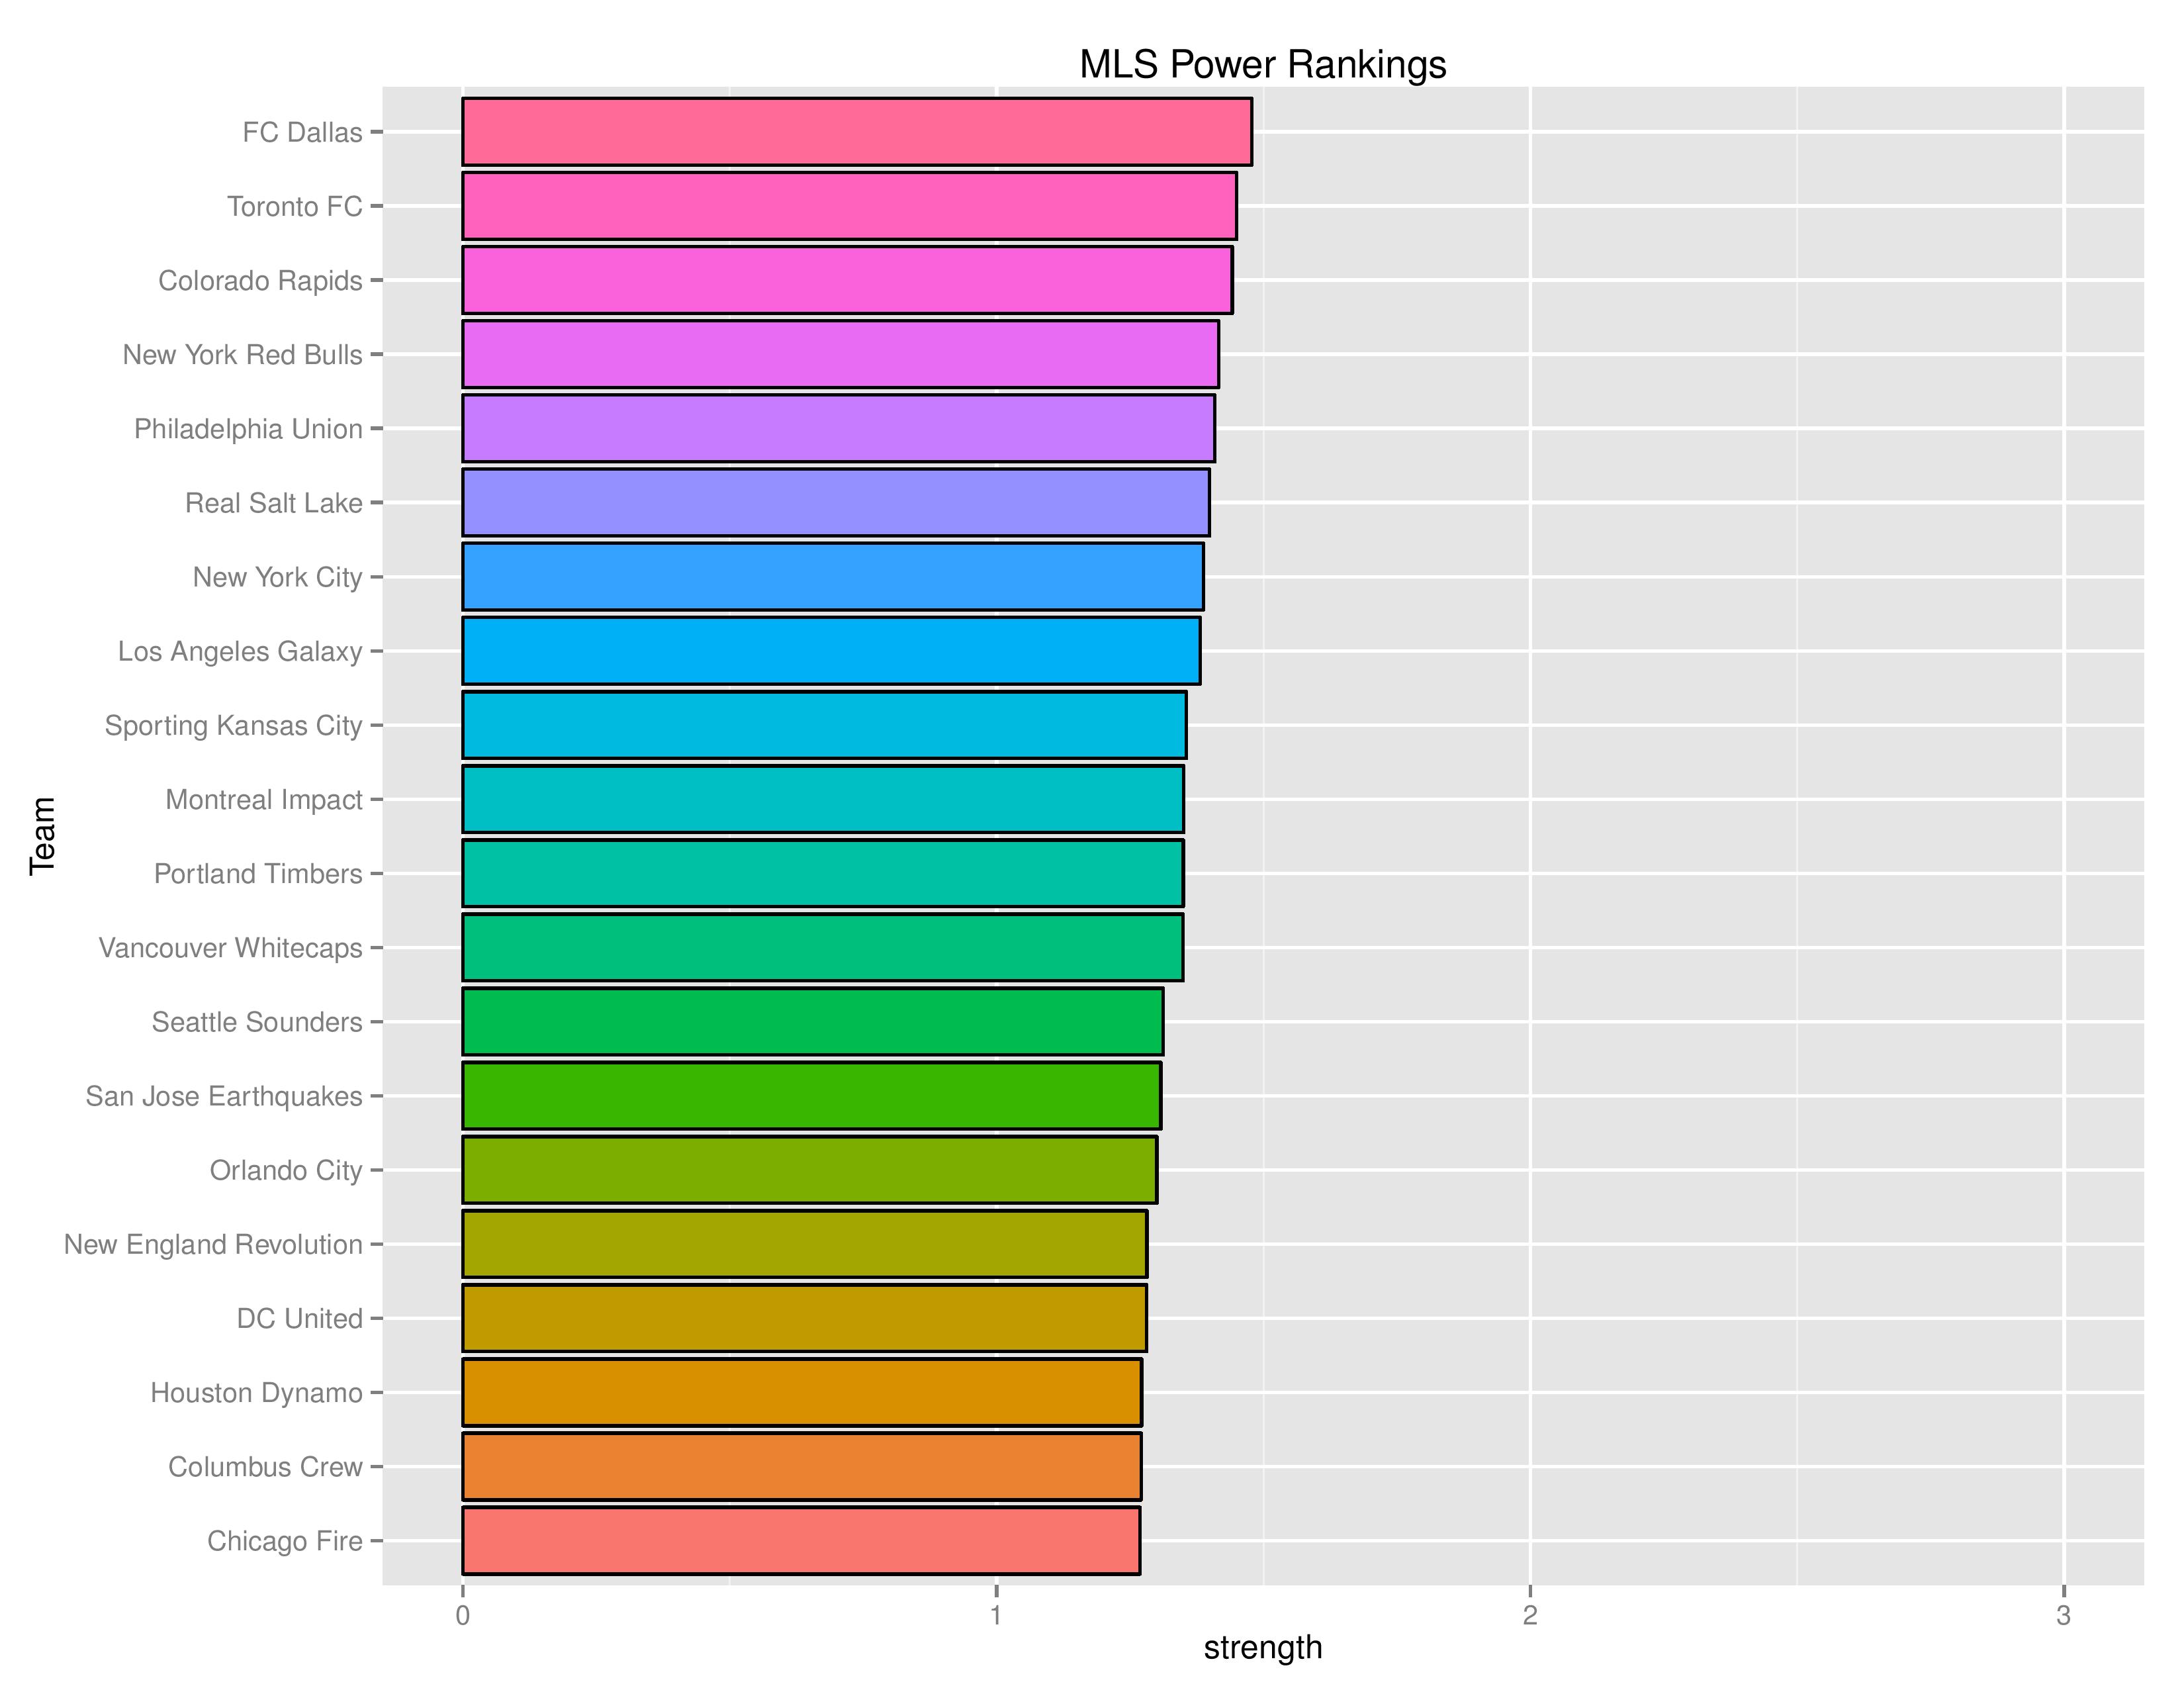
Power Rankings
The “Power Rankings” we concoct are the actual “strength” of the team according to competitive expectations. They are computed showing average expected points result if every team in MLS played every team both home and away.
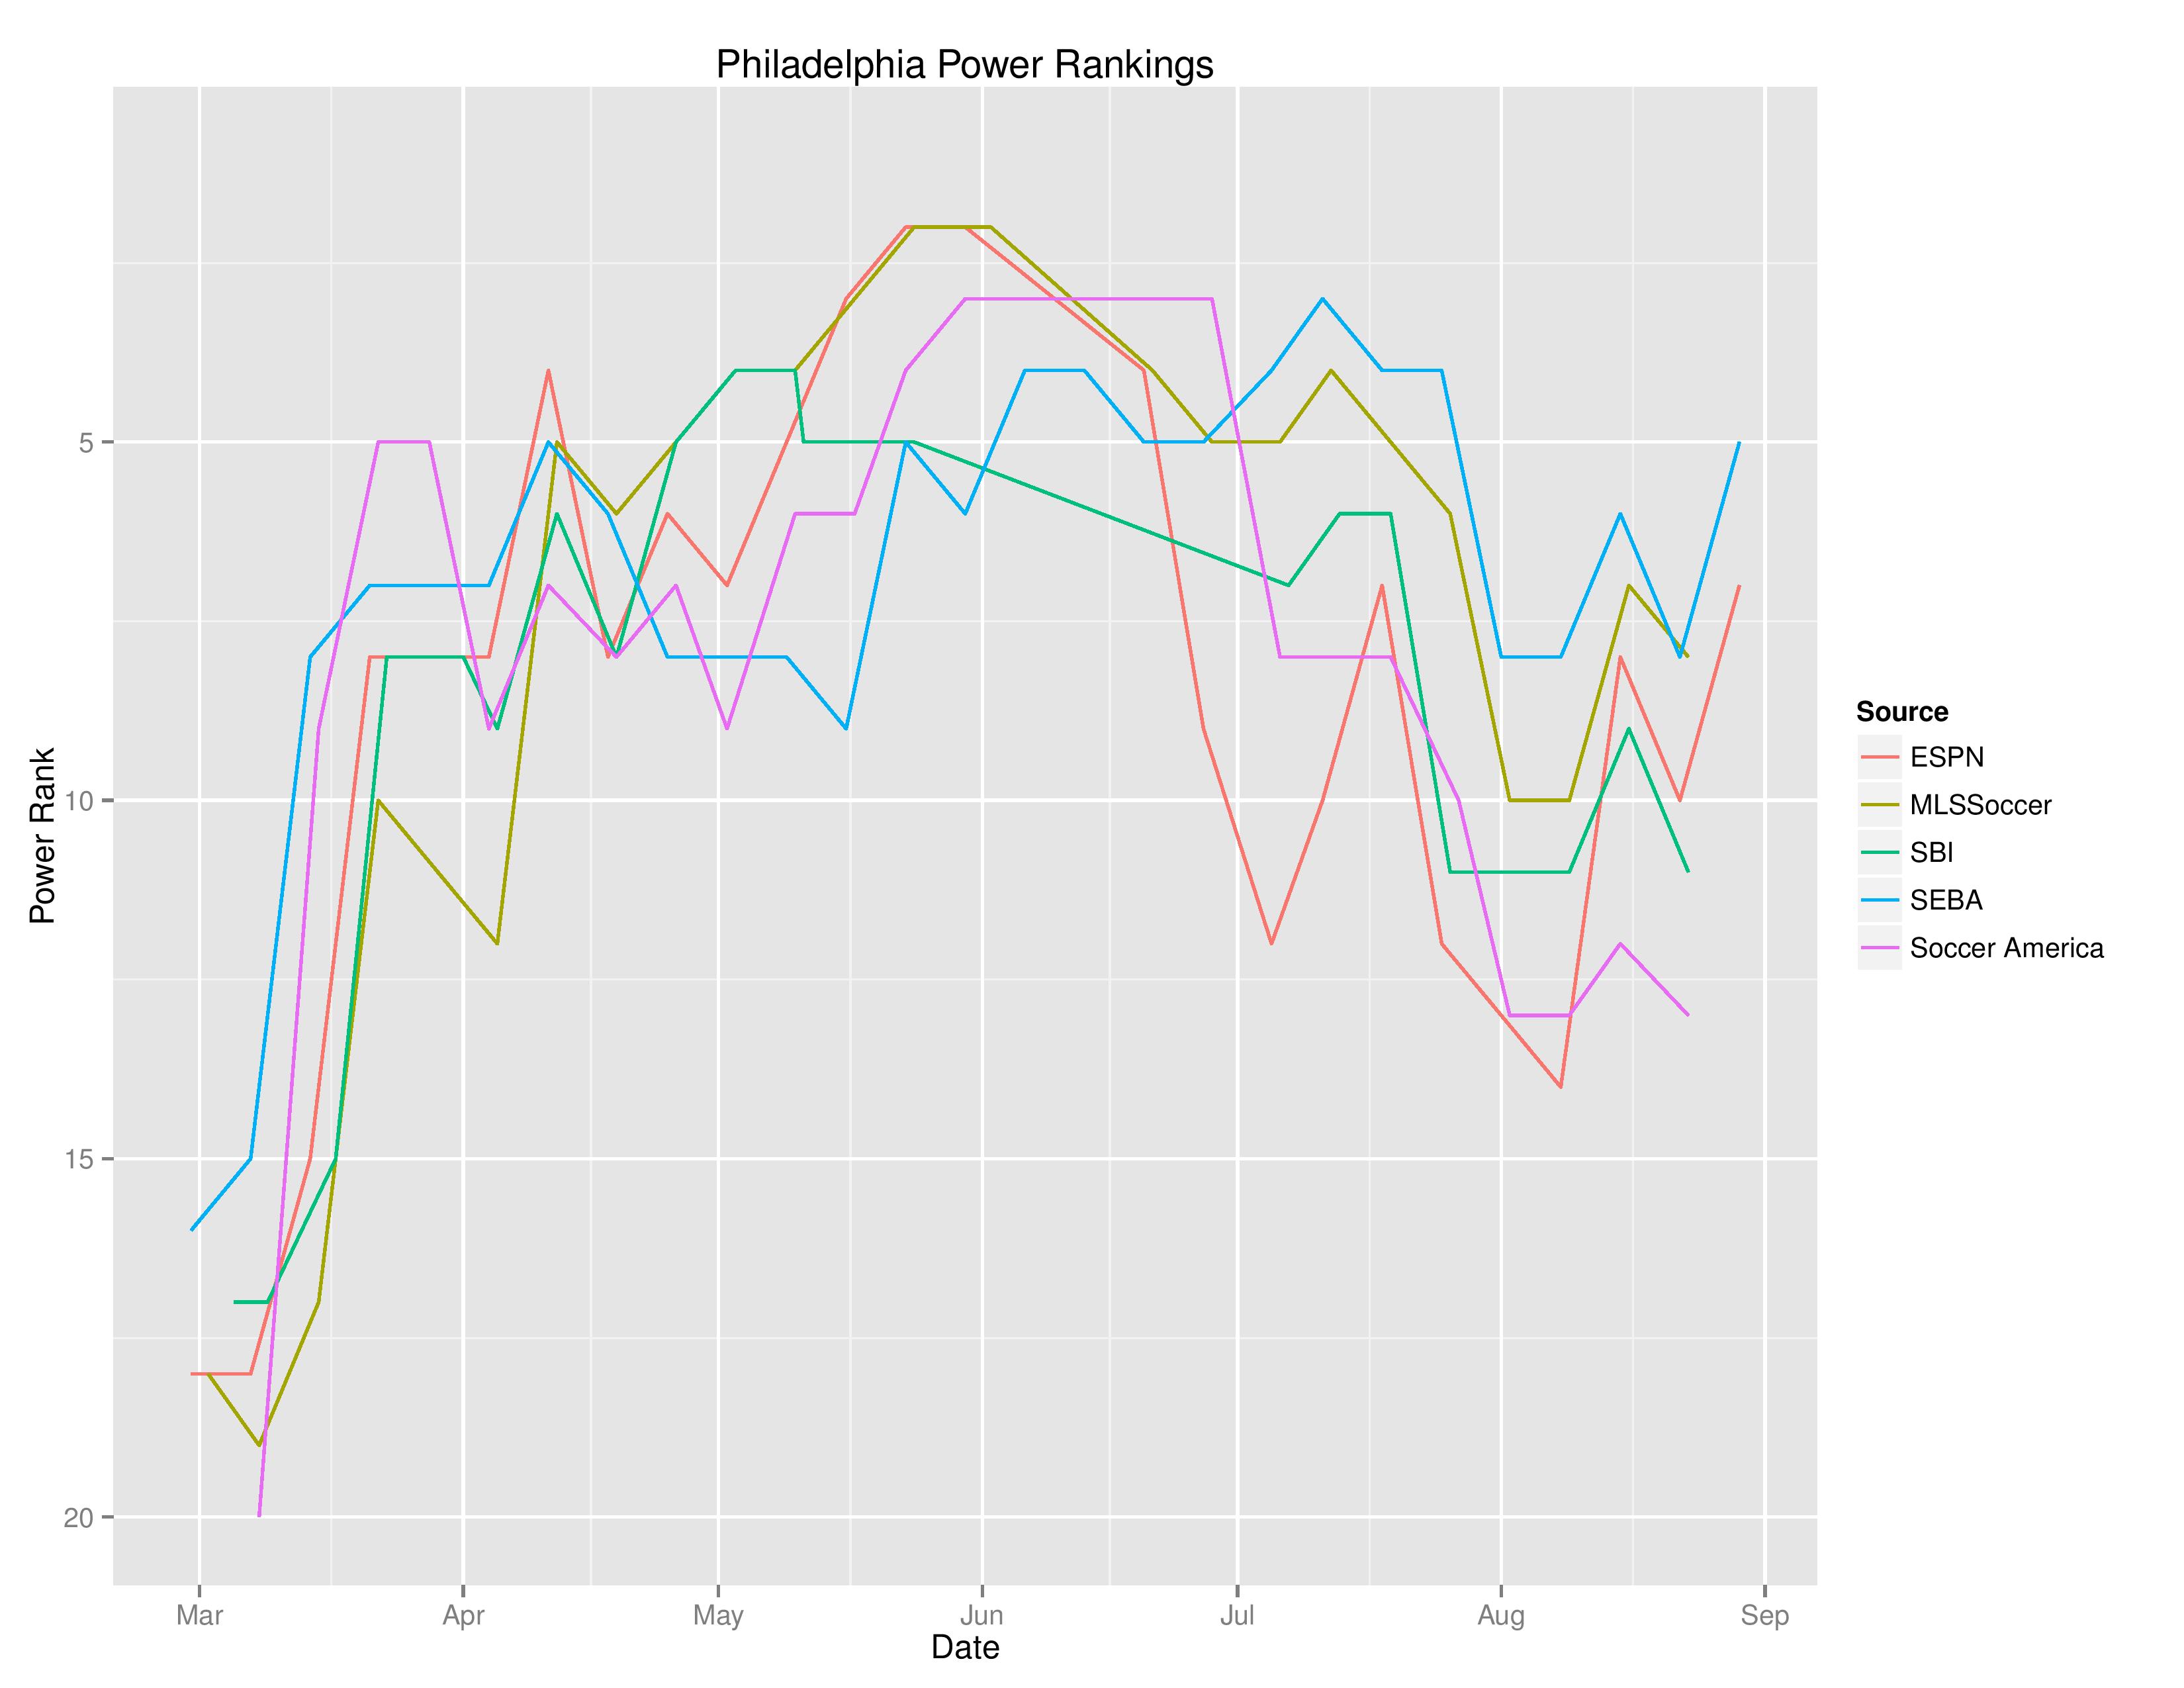
SEBA has the Union improving up to No. 5 from No. 8. ESPN has the Union up three spots to No. 7 from No. 10. At Soccer America, the Union move up three spots to No. 10. At SI, the Union move up two spots to No. 7.
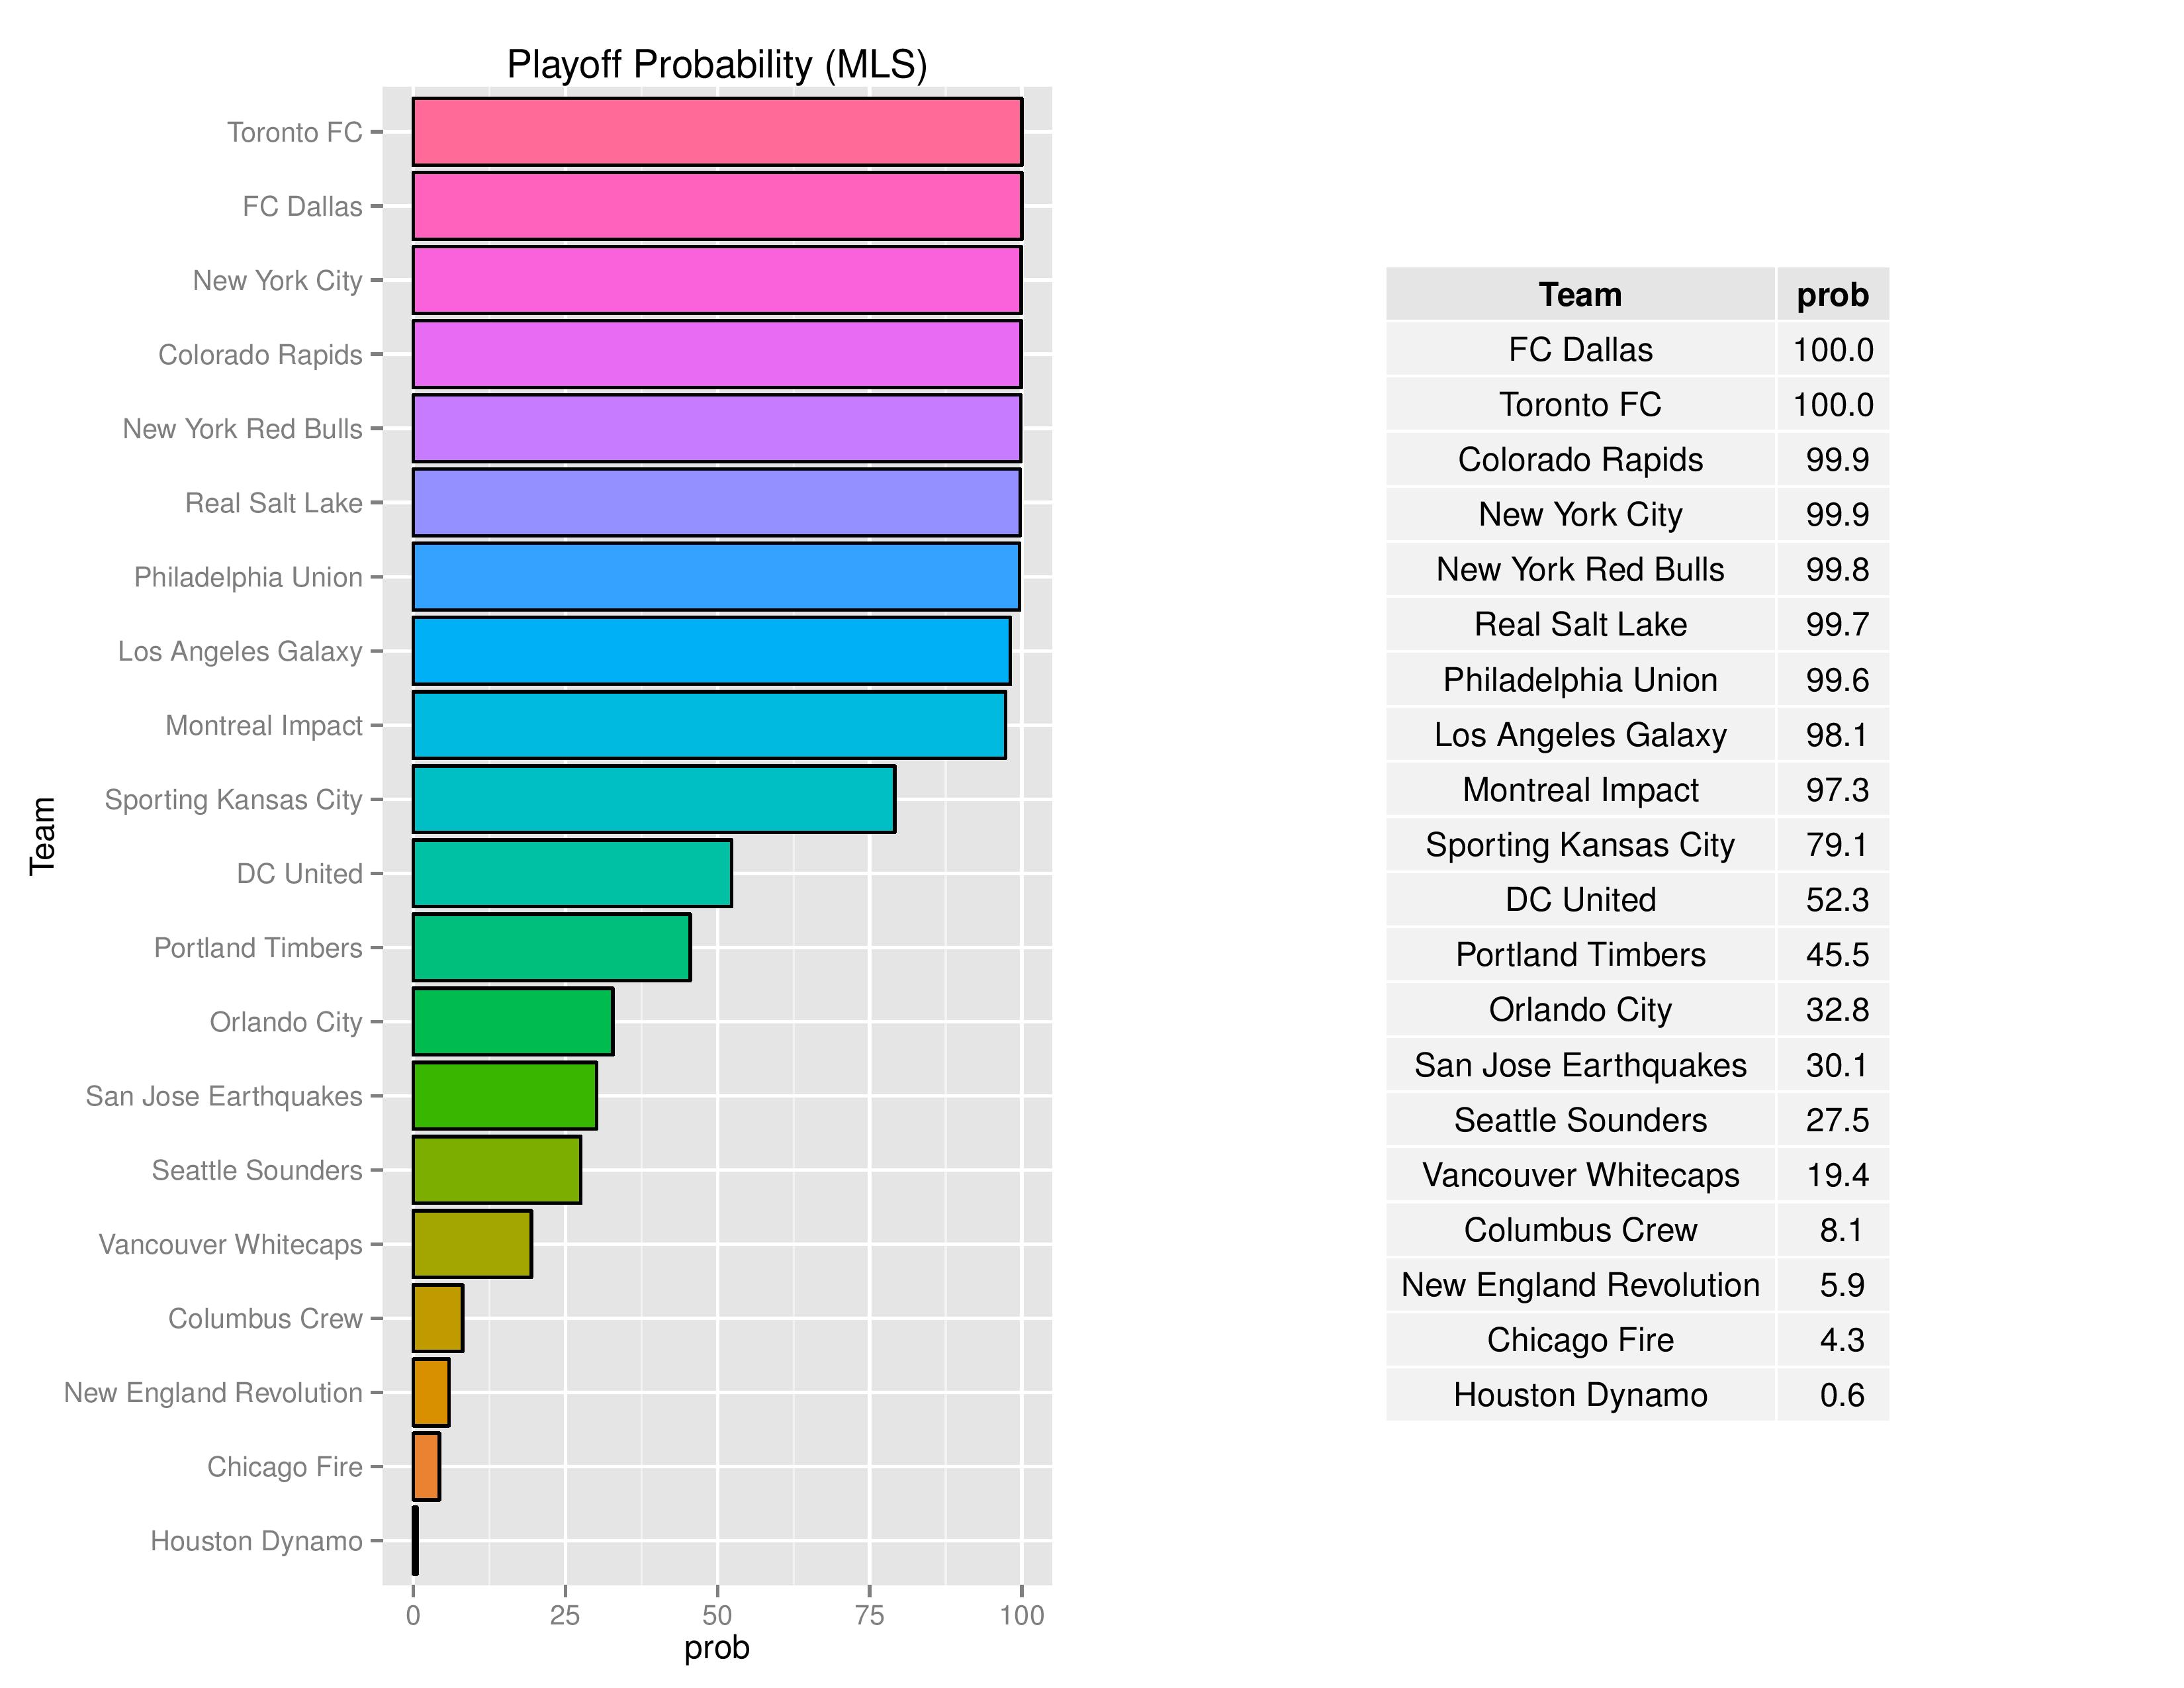
Playoffs probability and more
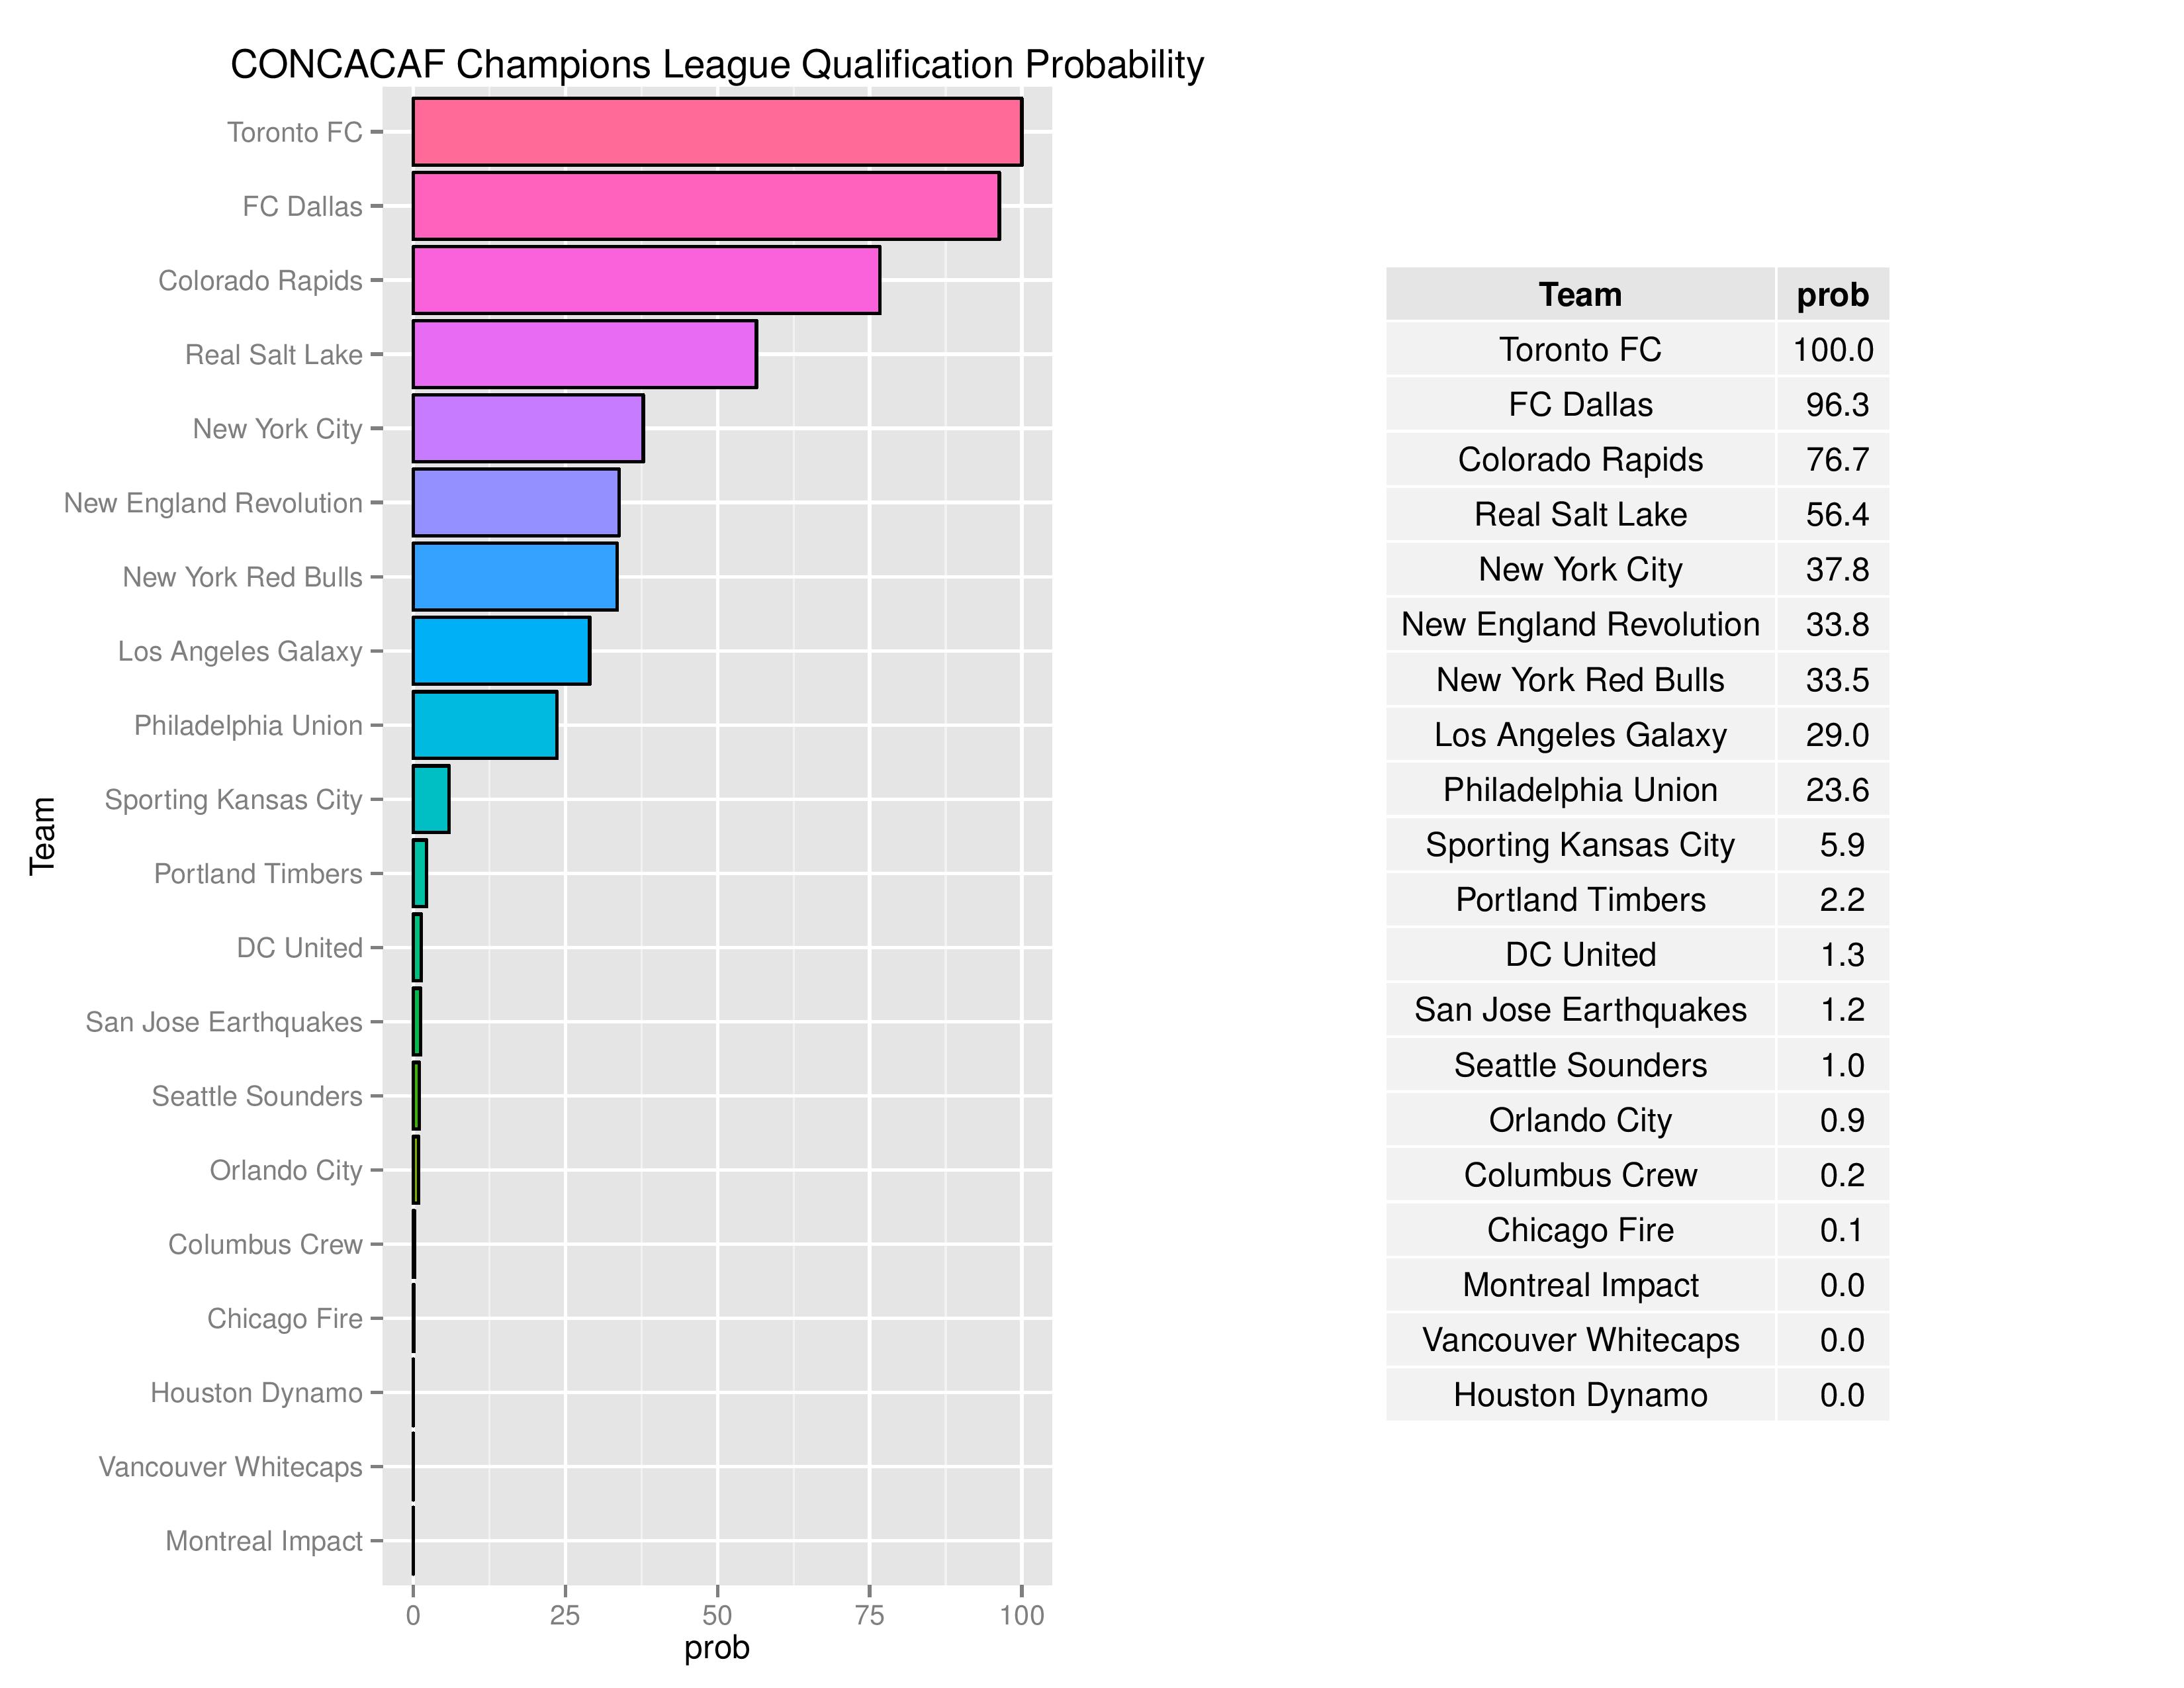
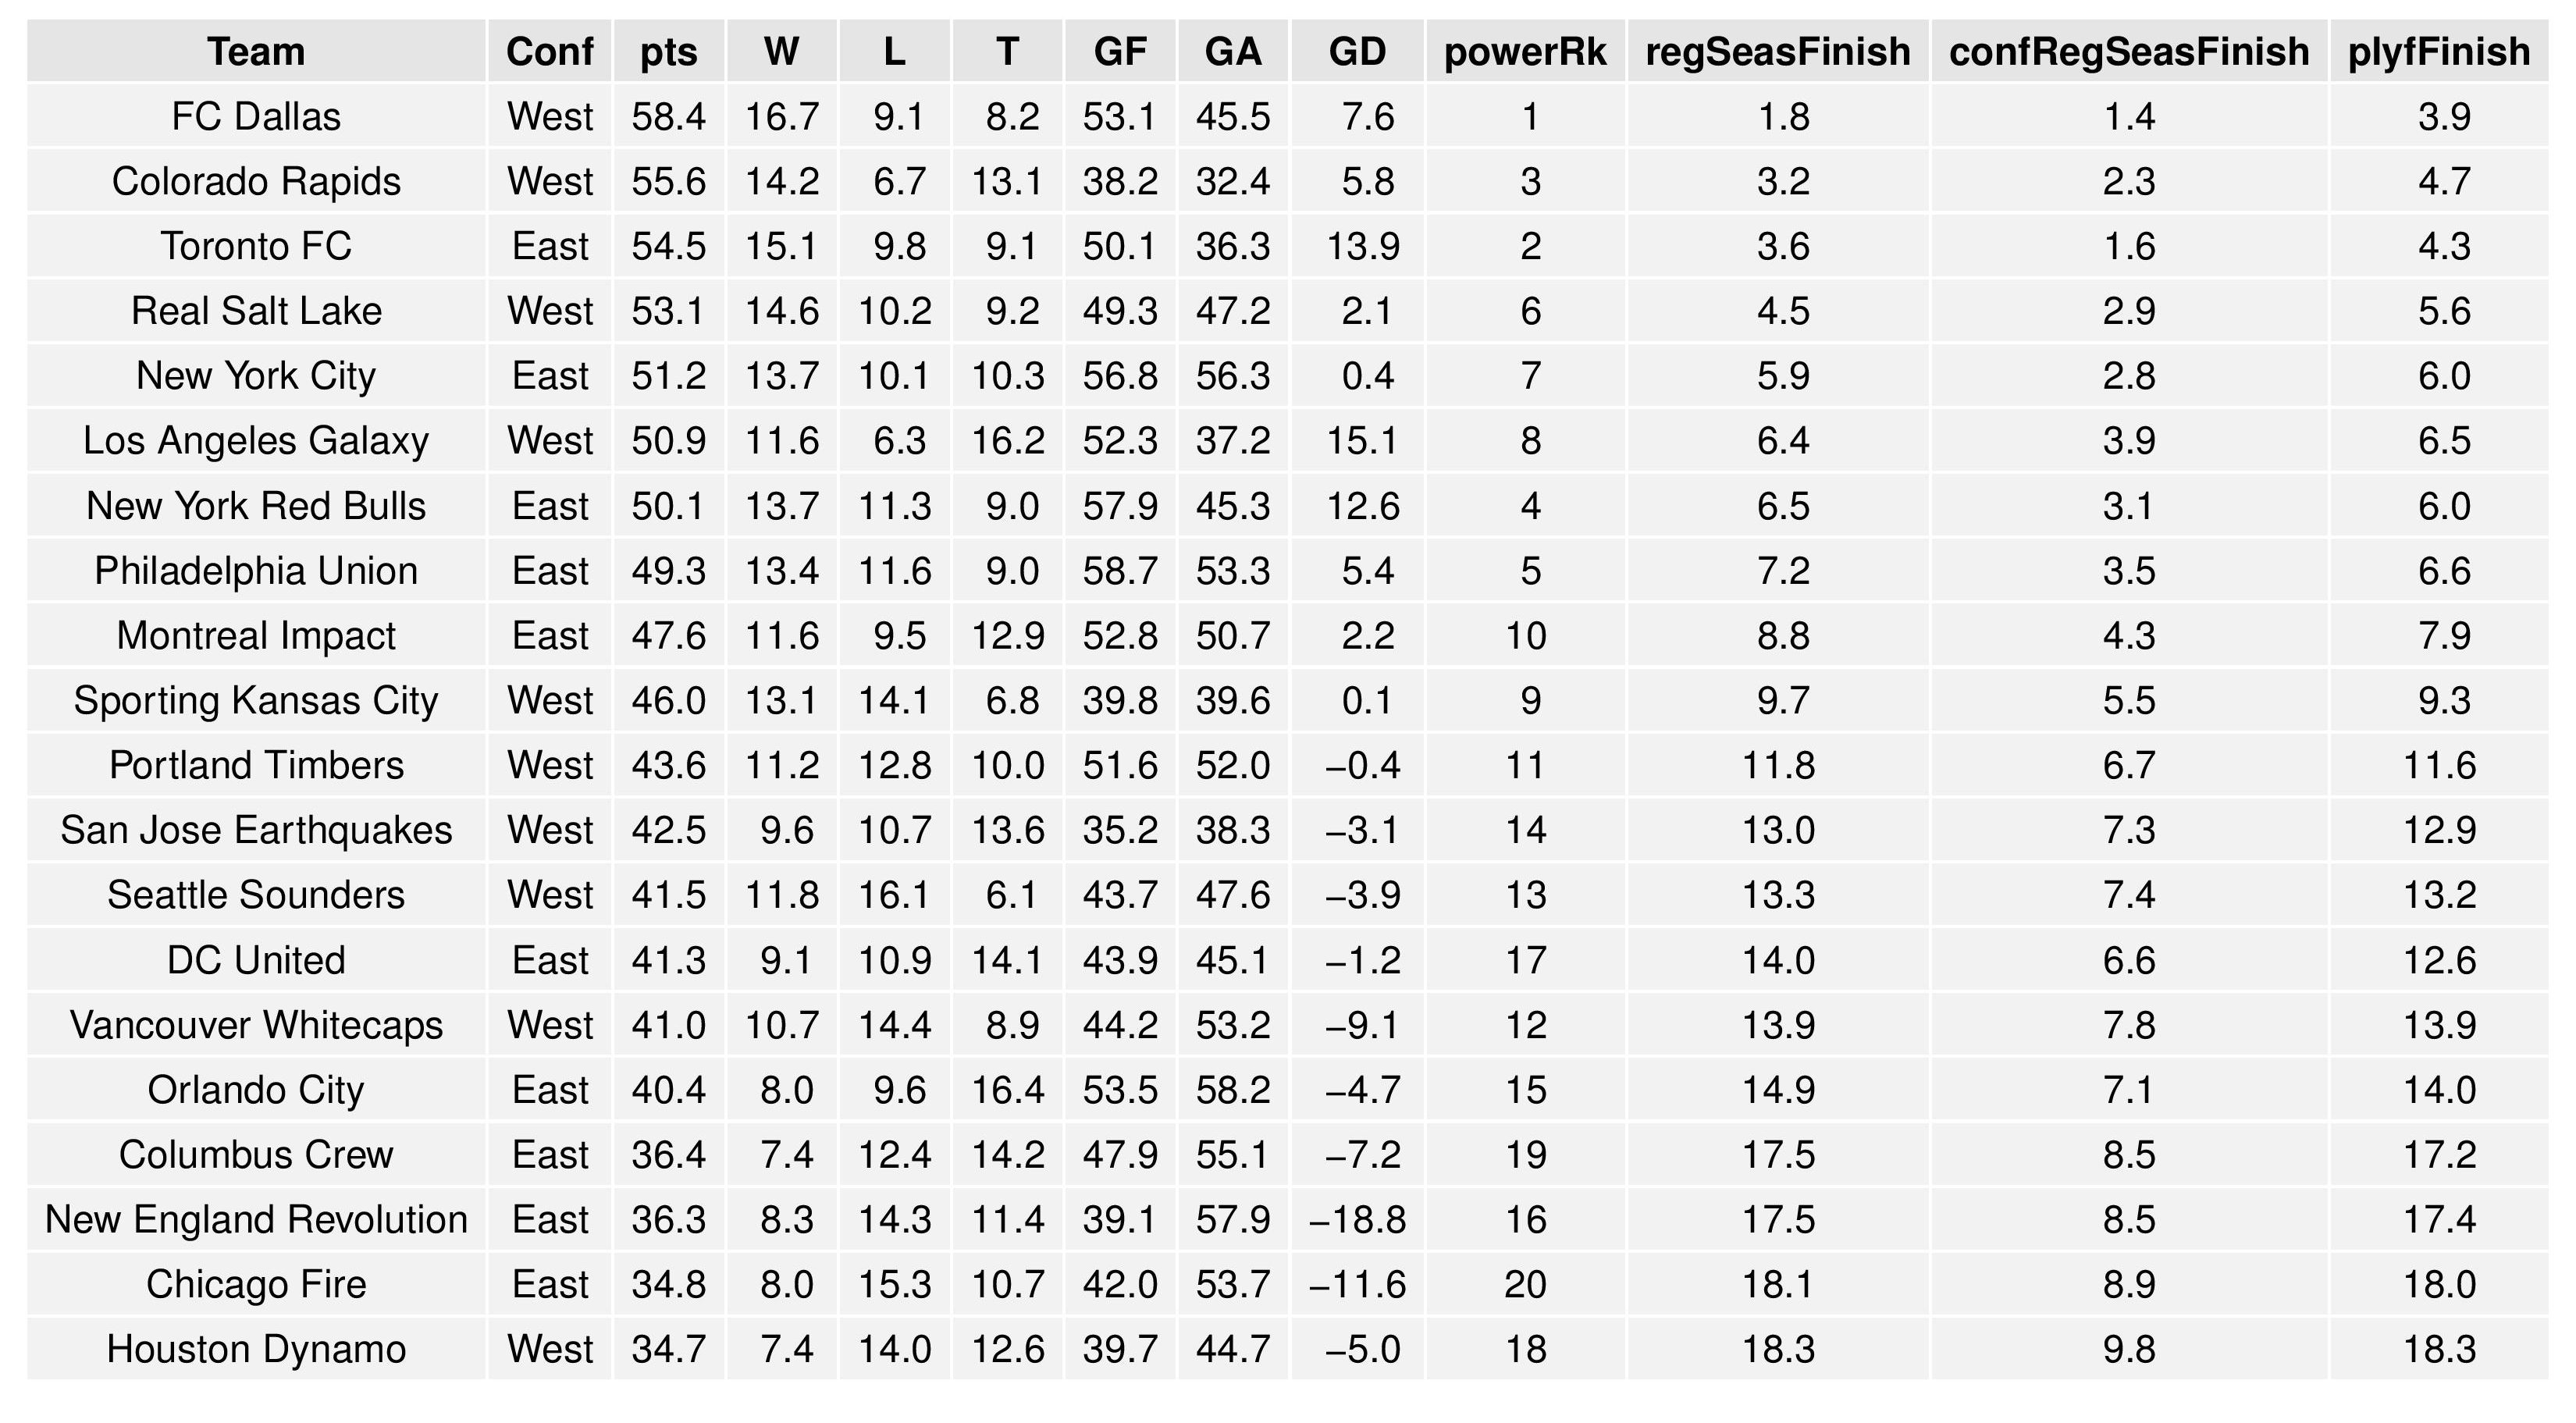
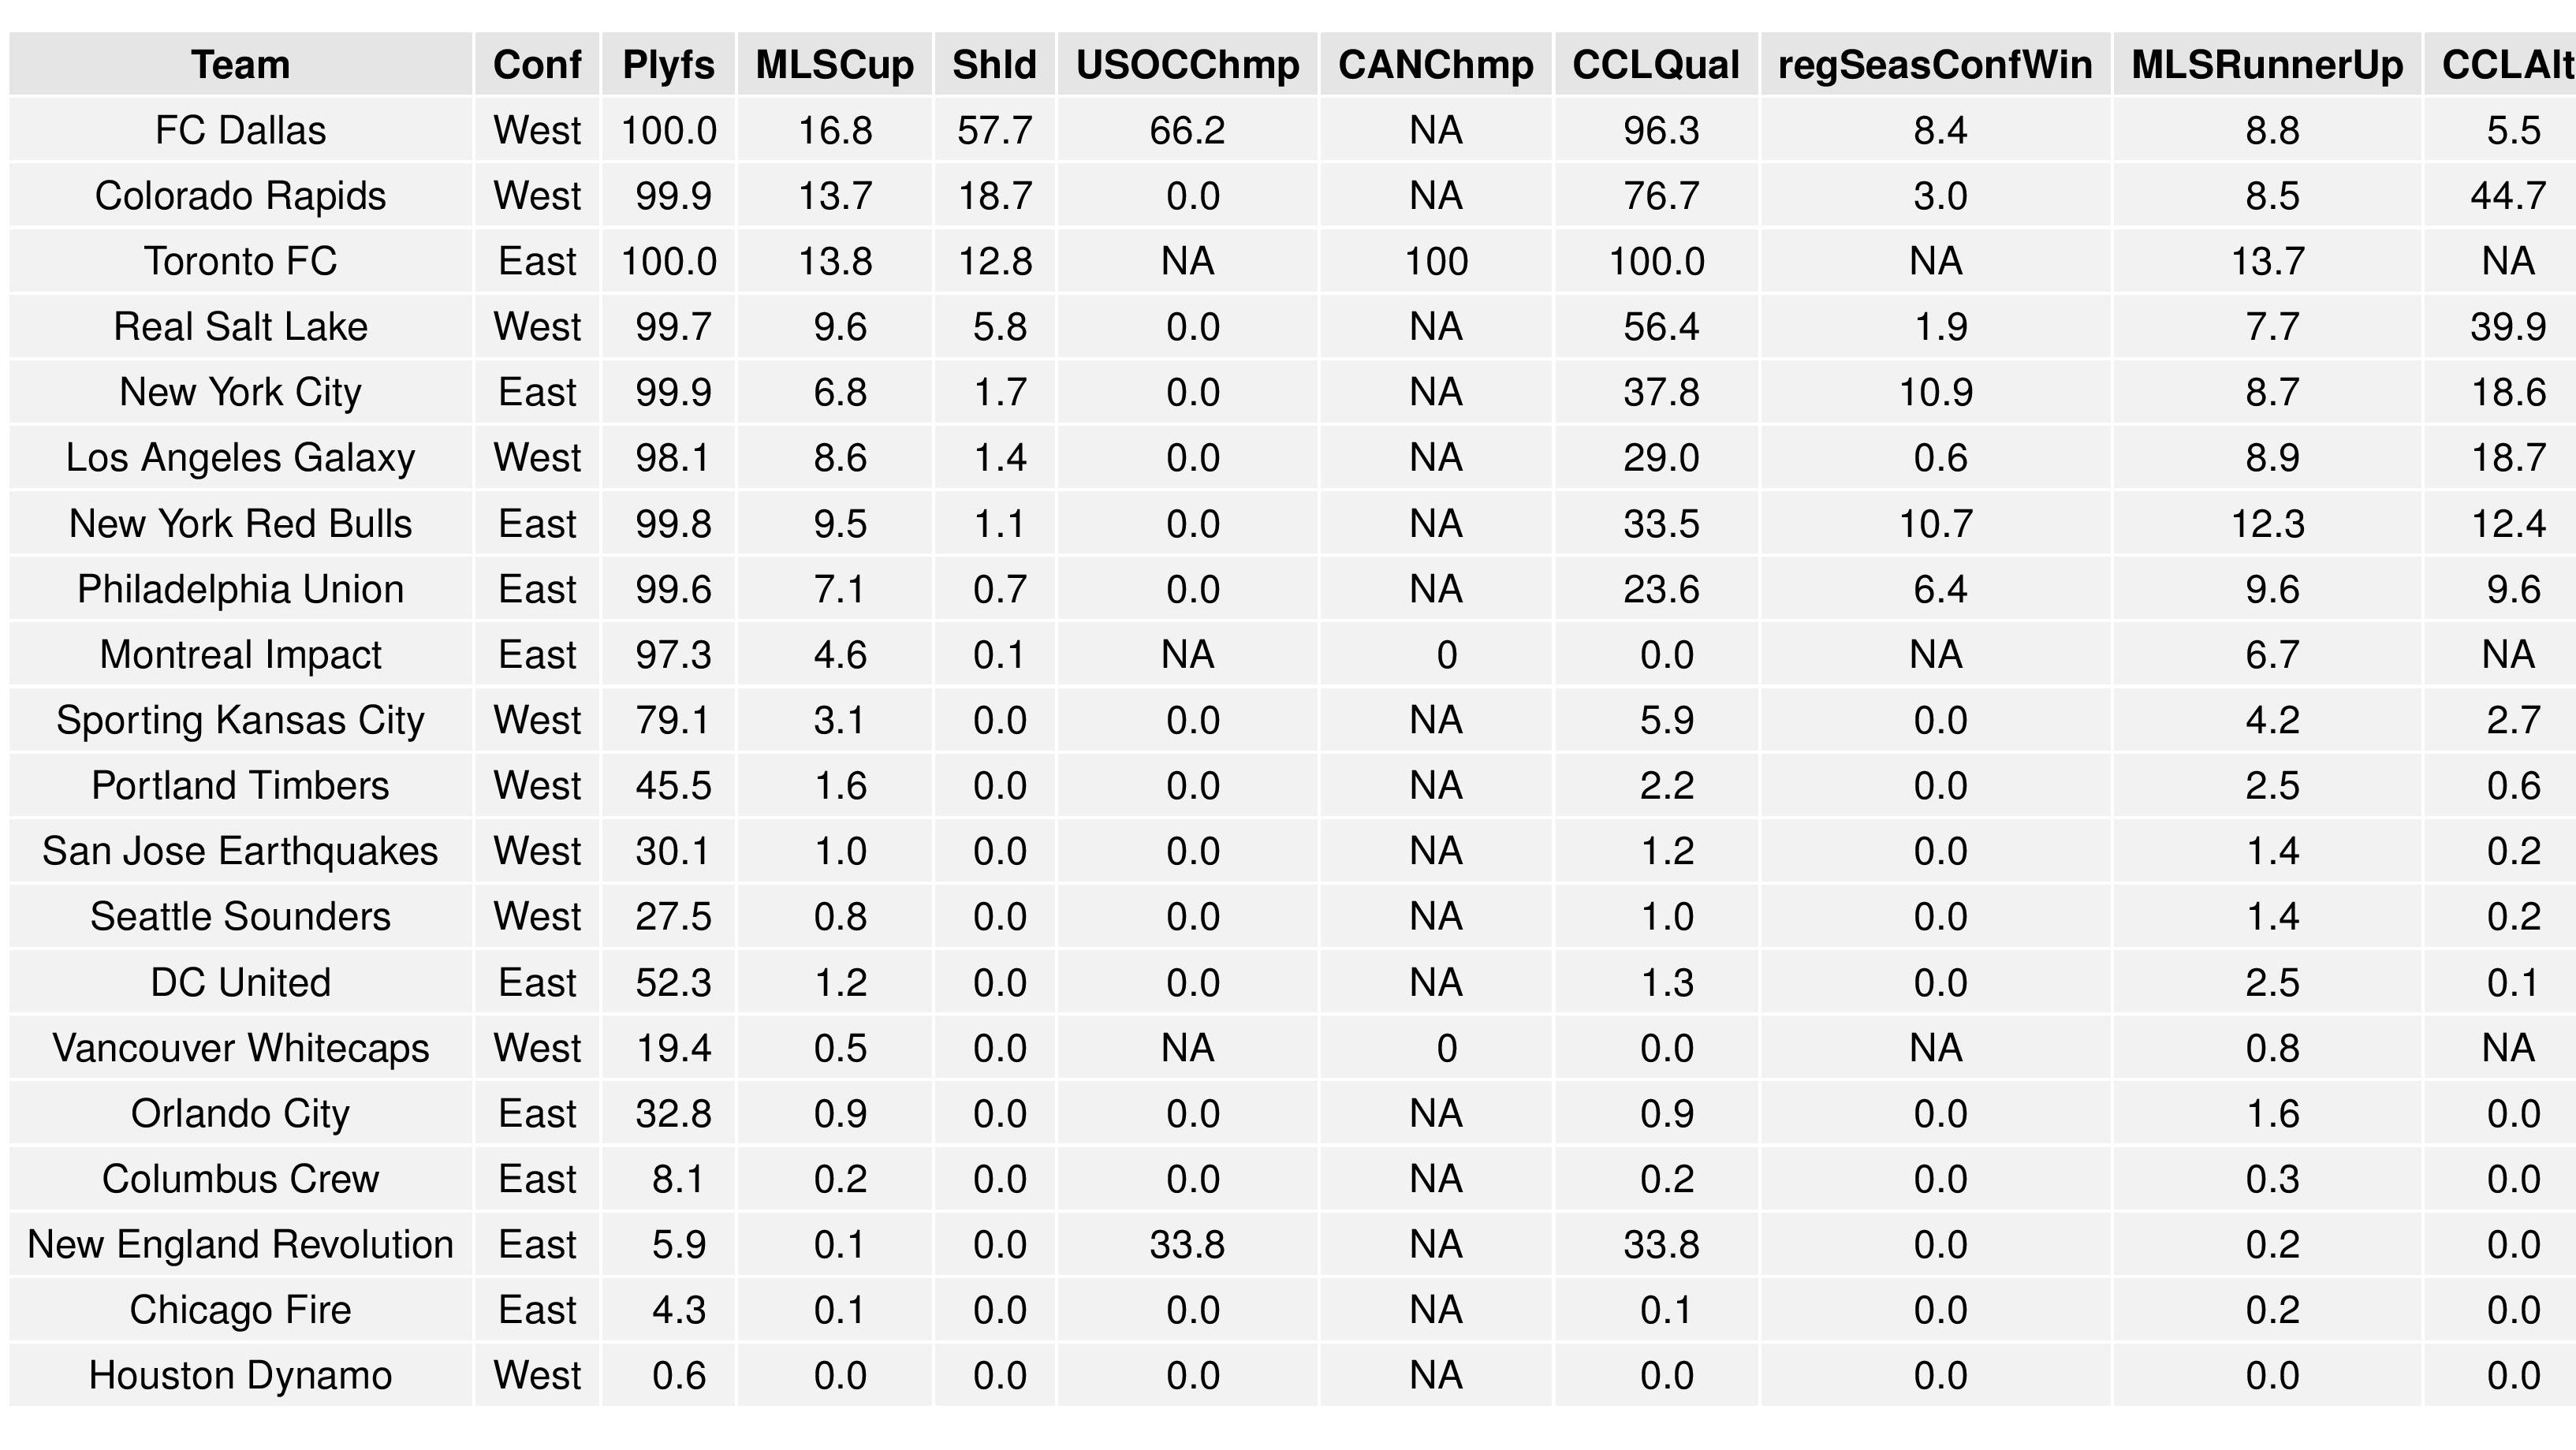
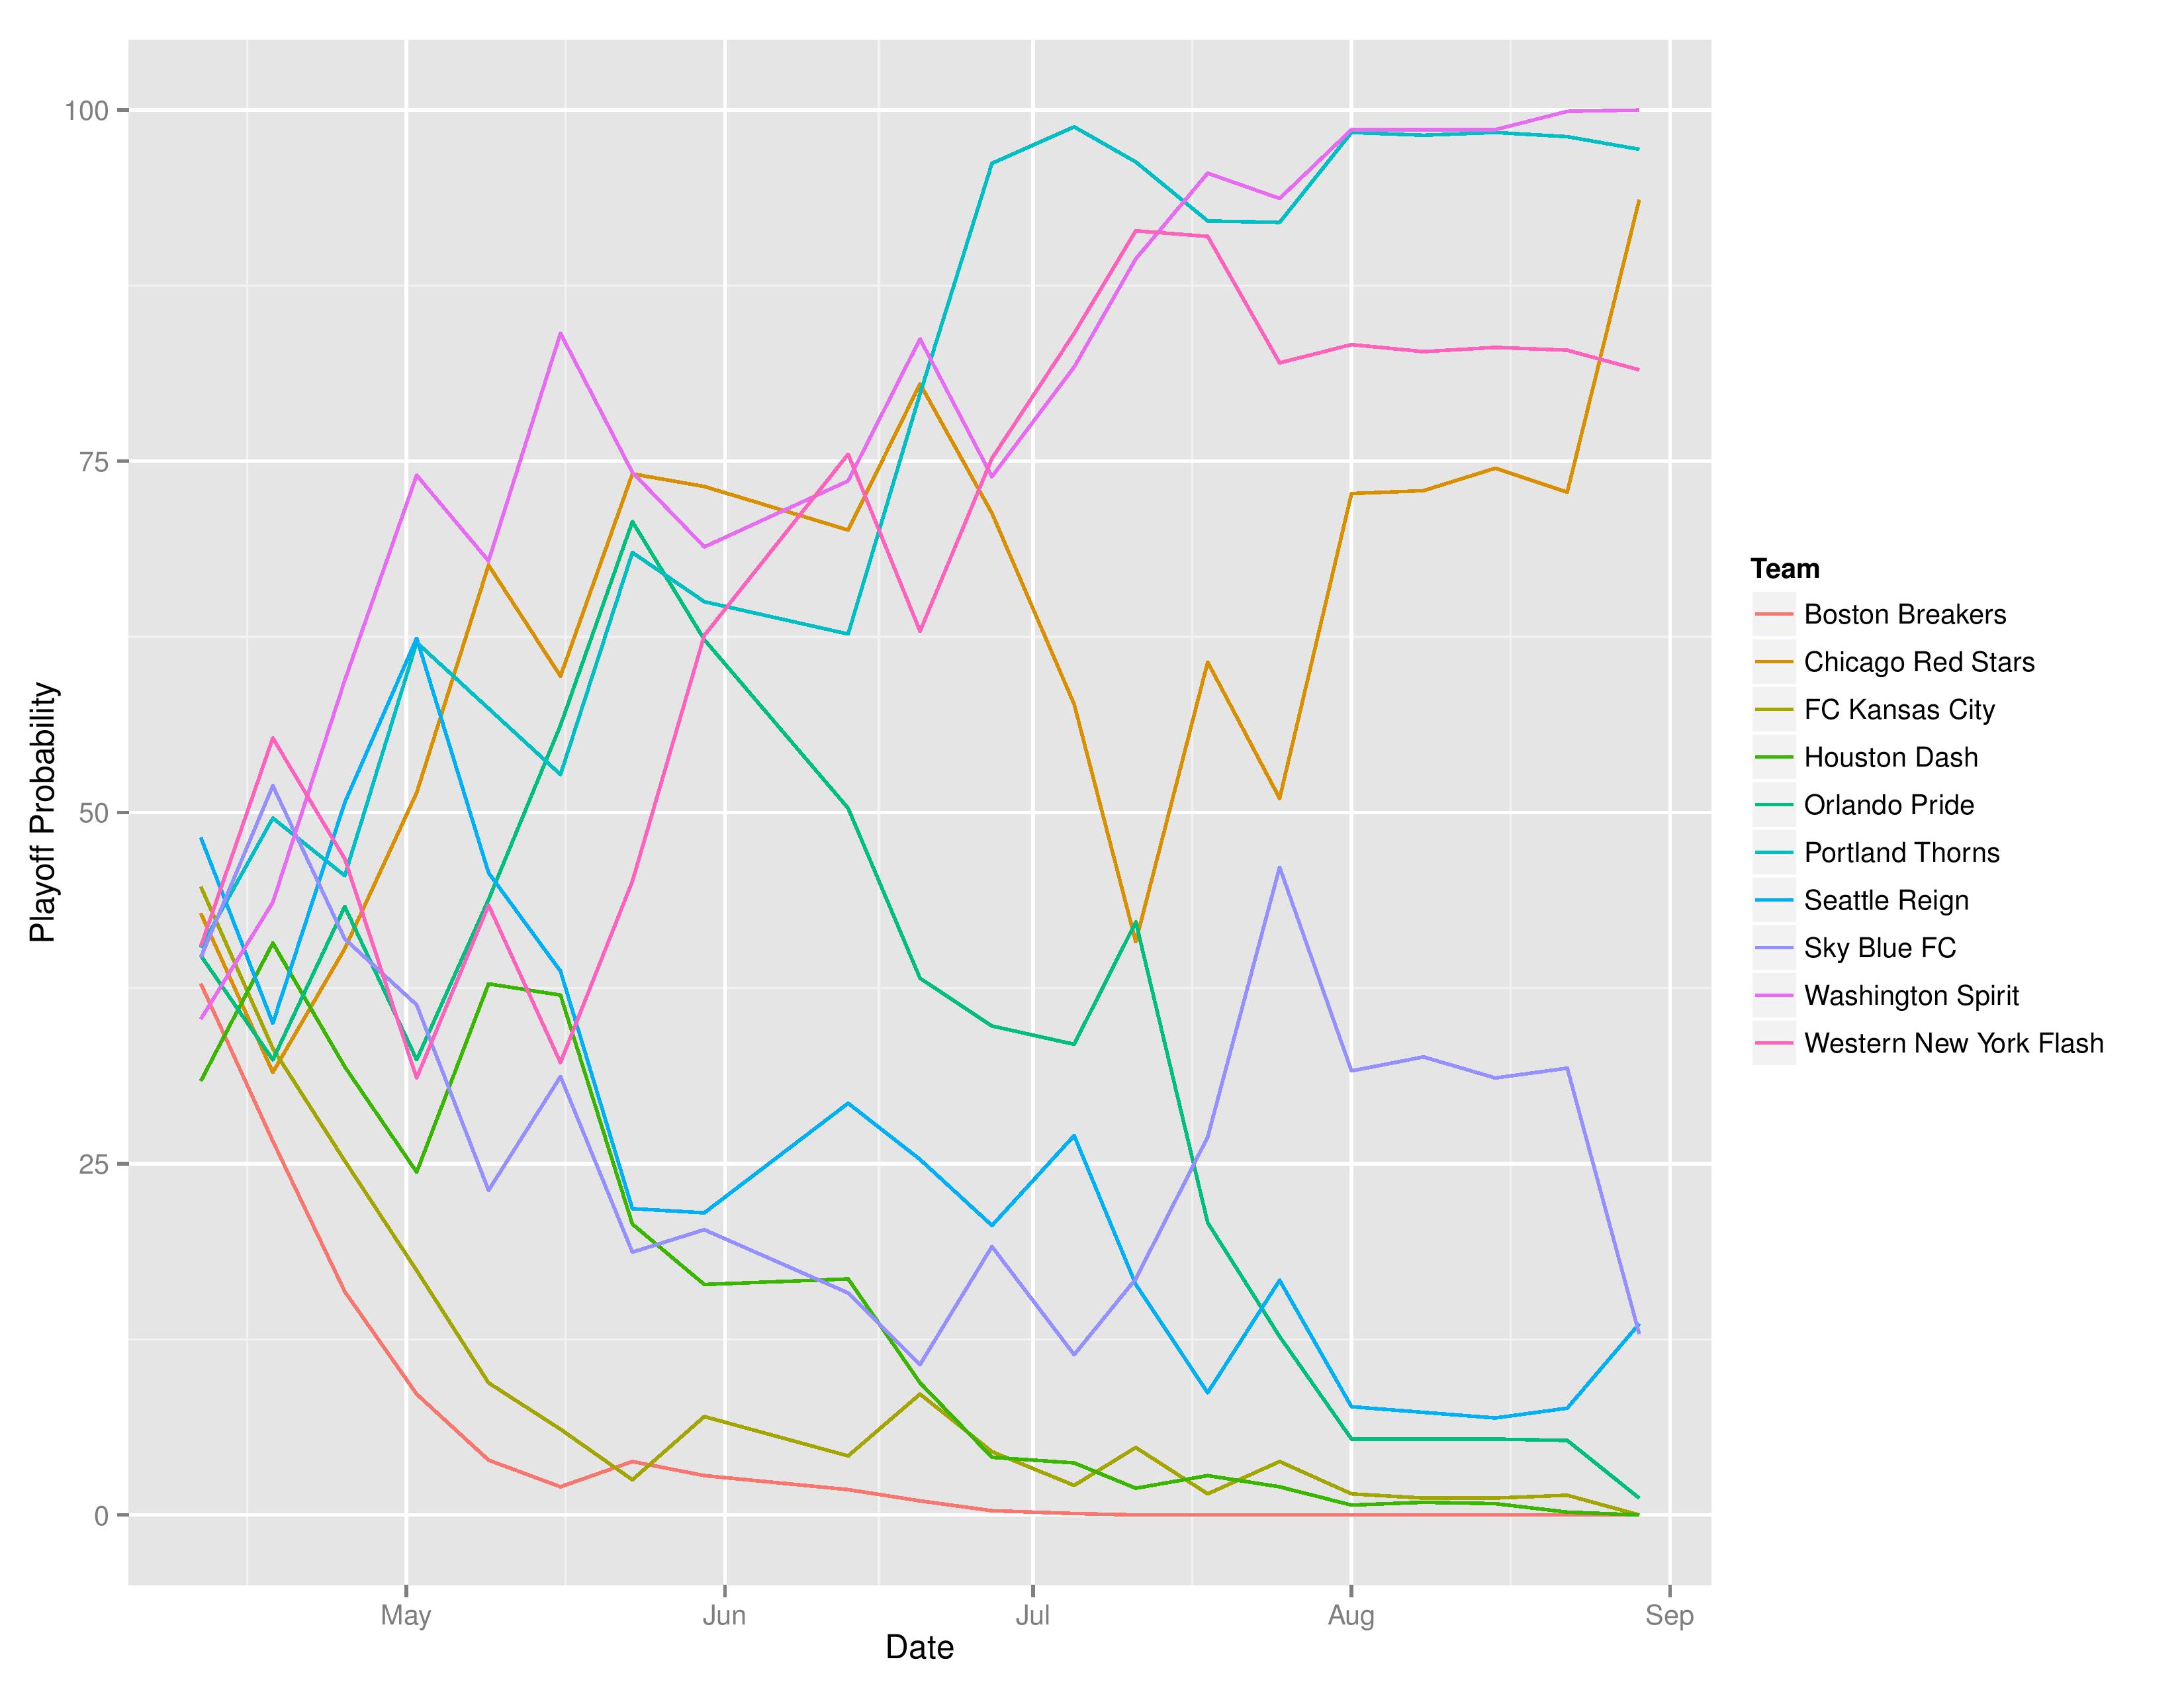
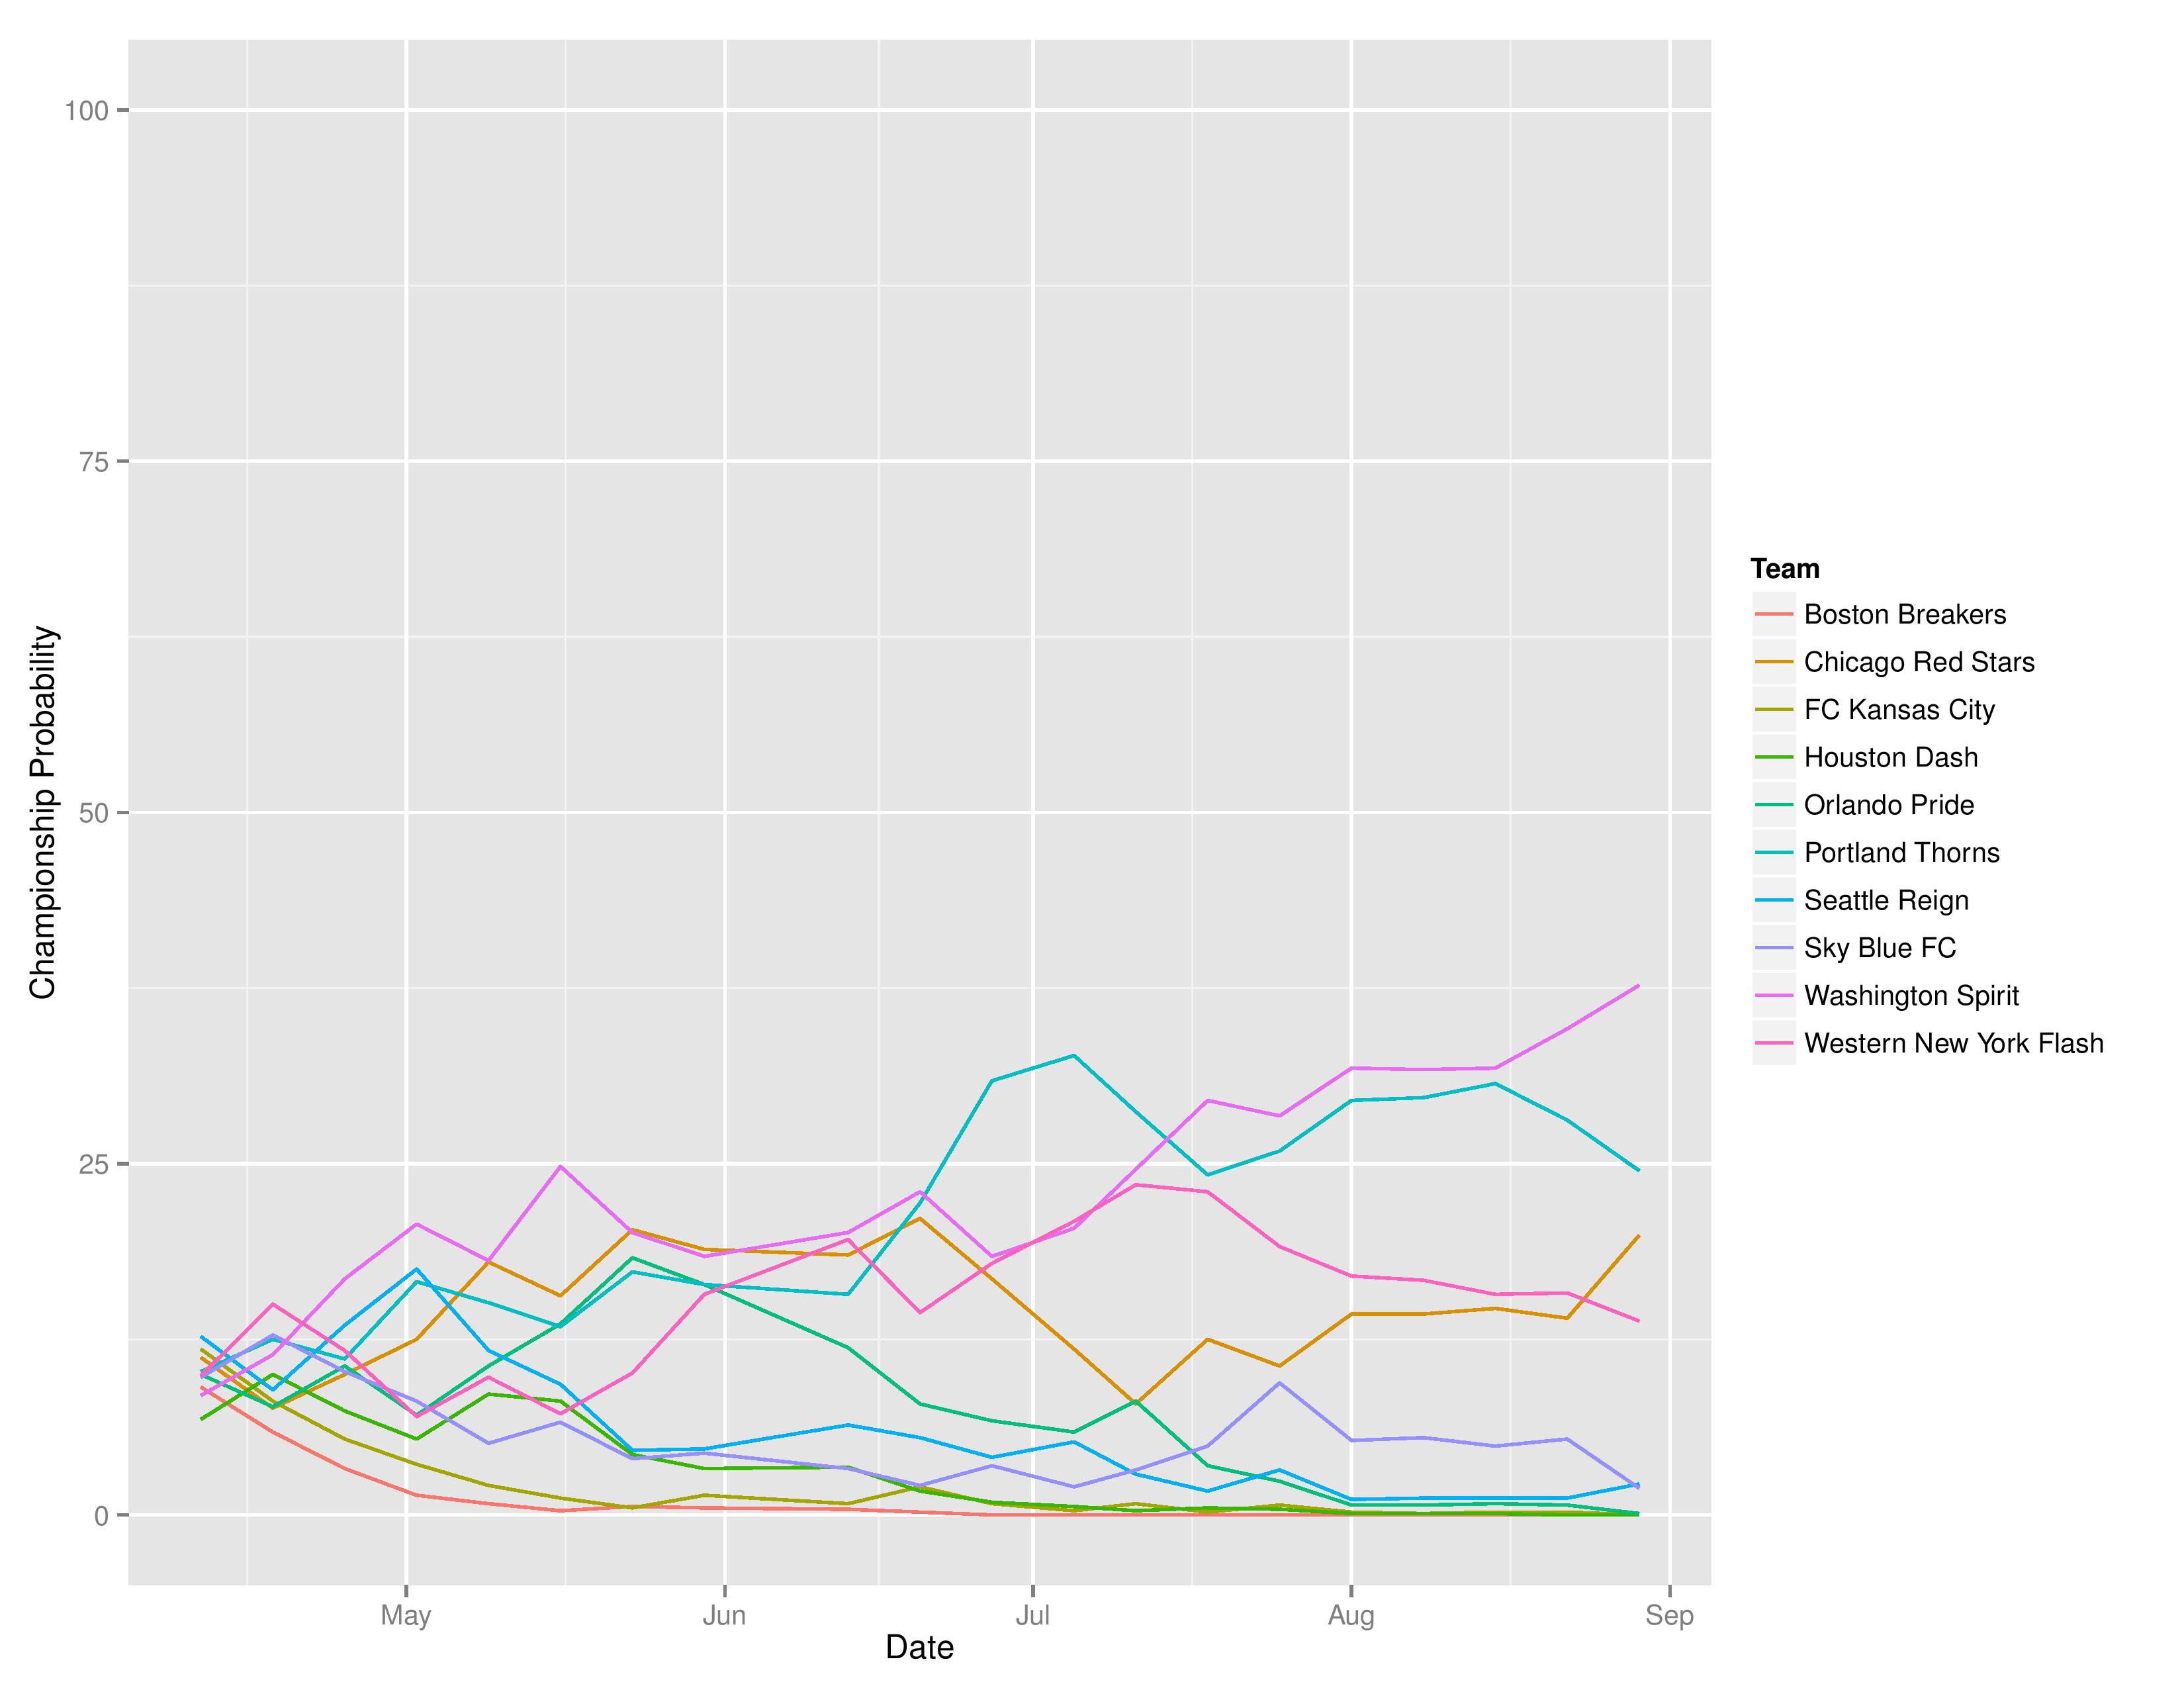
The following charts show the probabilities for making the playoffs, winning the Supporters’ Shield, winning the MLS Cup, winning the USOC Cup, and qualification for CONCACAF Champions League.
The Union went up to 99.6% from 92.2% last week in their probability of making the playoffs.
The odds of Philadelphia claiming the Supporters’ Shield improved from 0.1% to 0.7% with FC Dallas starting to run away with the chances.

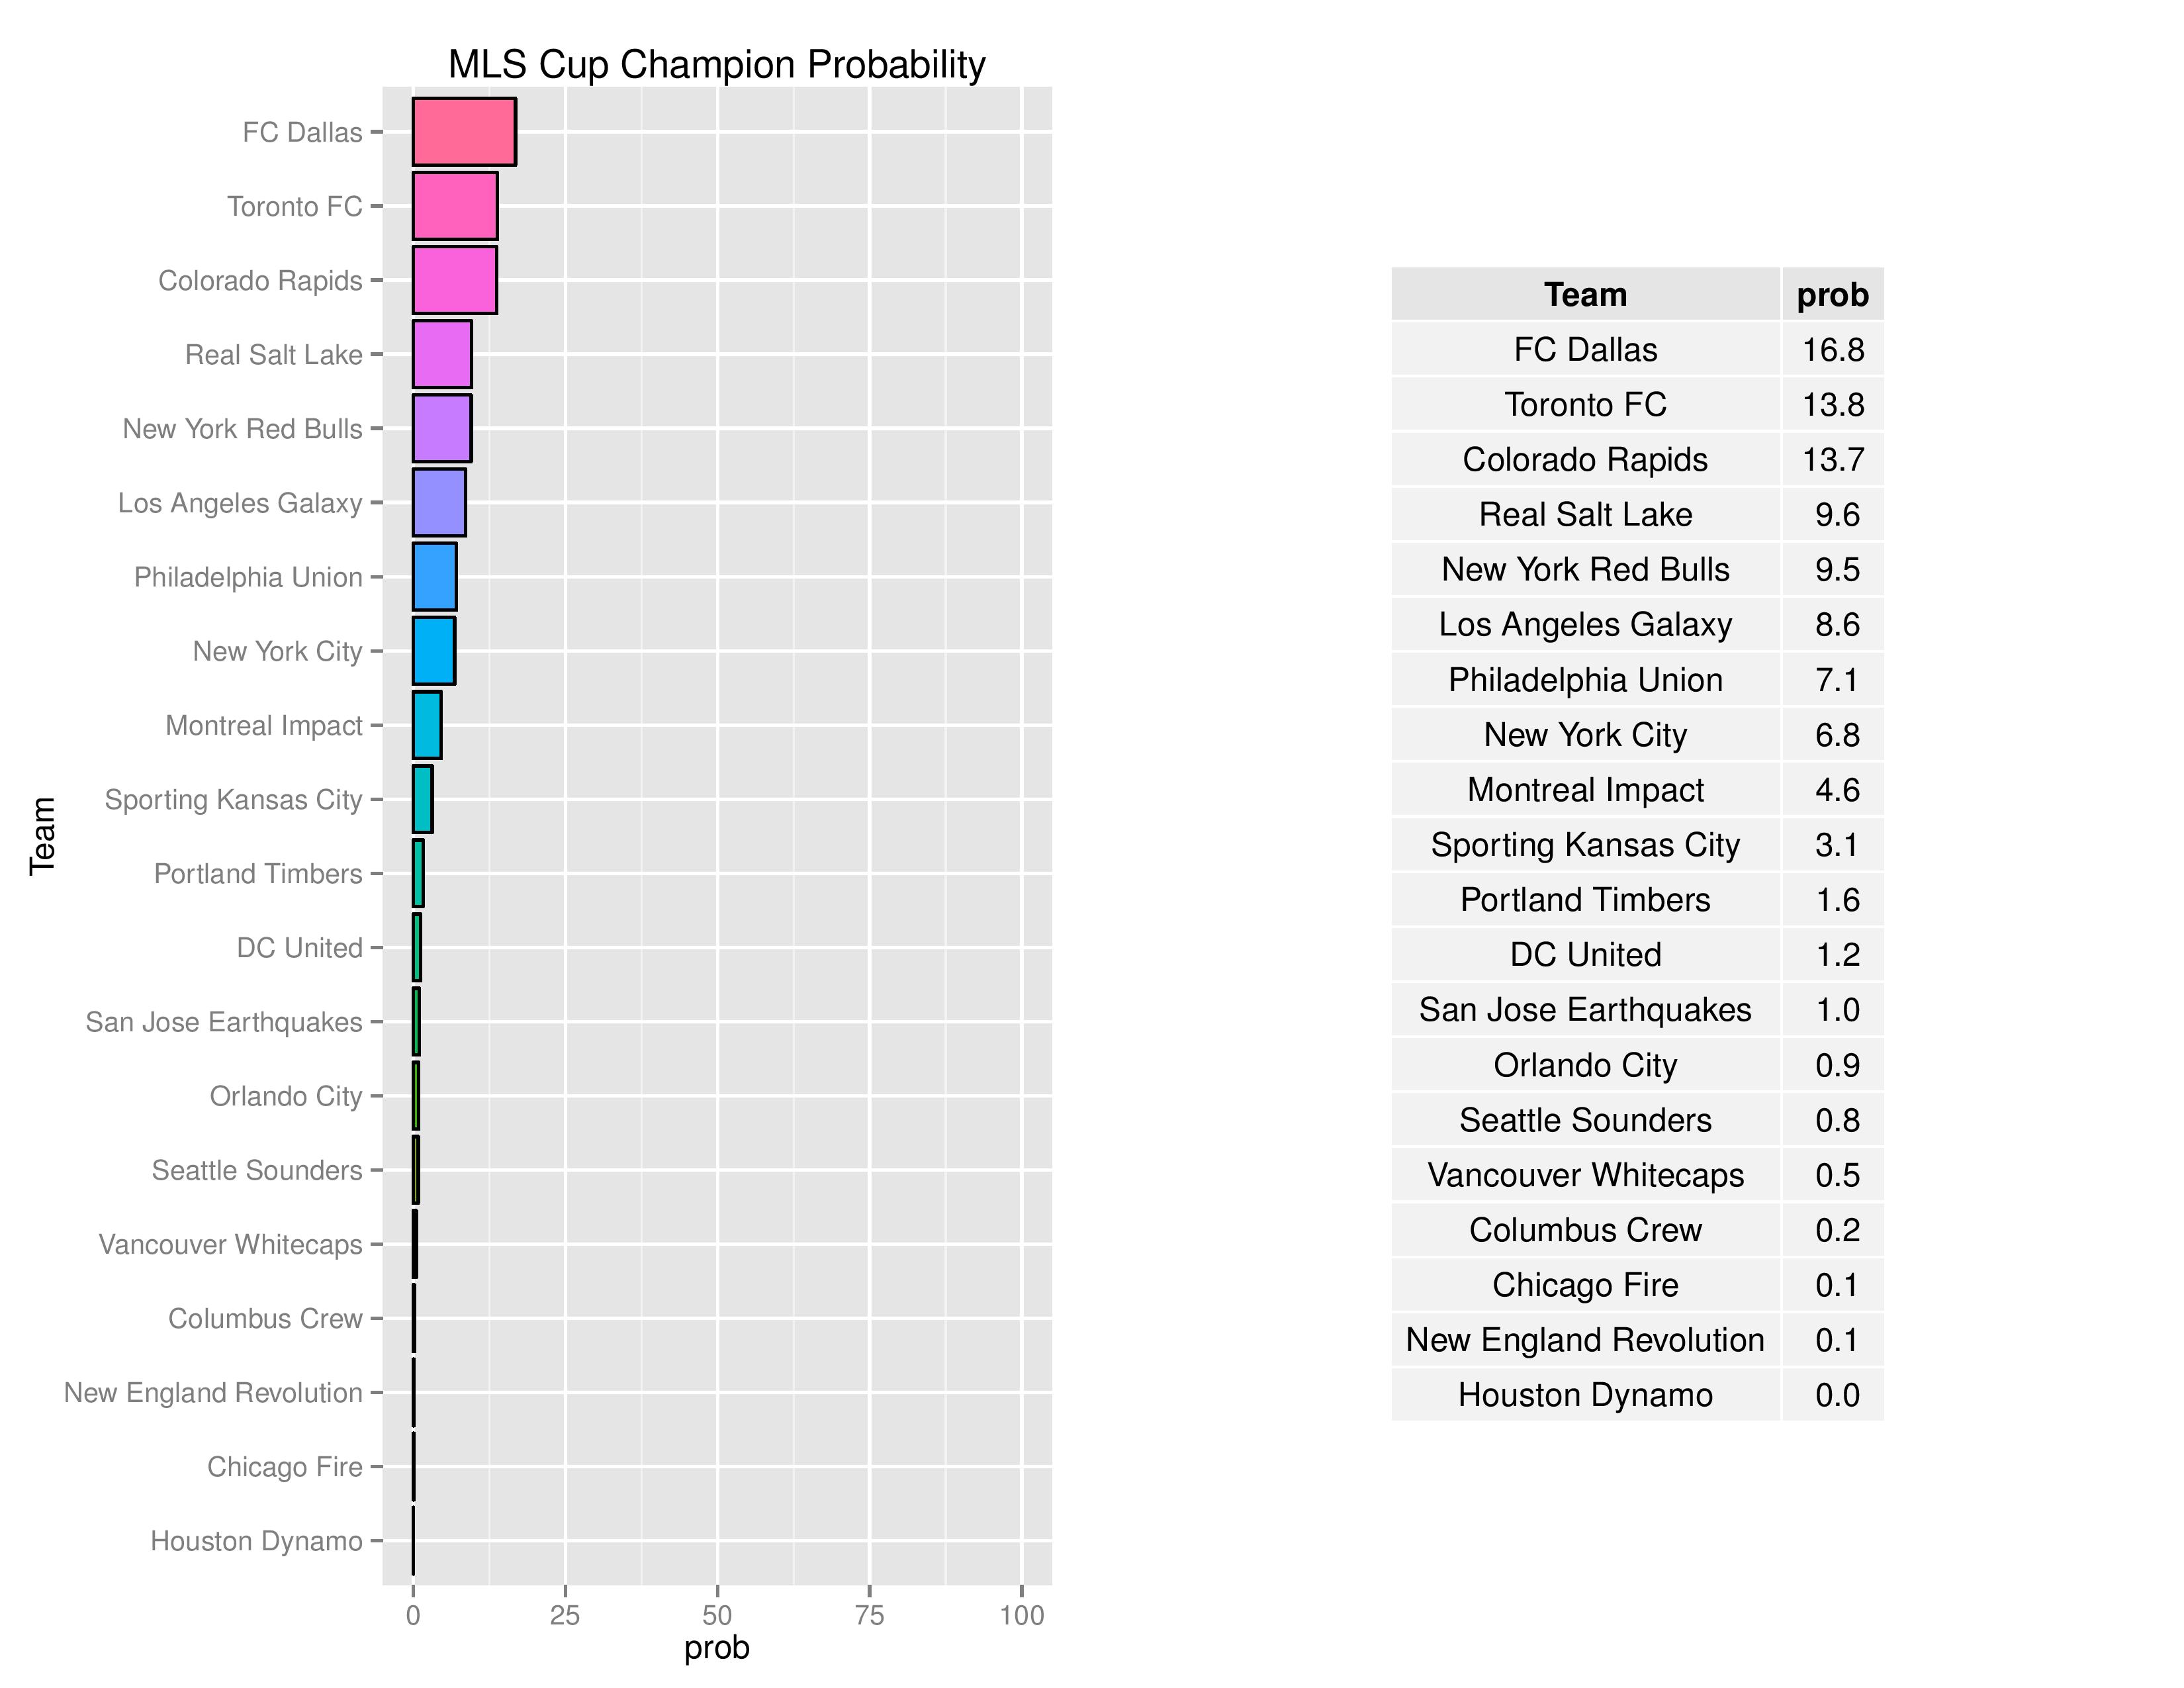
The Union increased from 4.8% last week to 7.1% in their odds of capturing MLS Cup. FC Dallas has moved back ahead of Toronto despite the Eastern Conference’s weaker position. Philadelphia made up some ground on getting a first-round-bye, but the lack of certainty is hurting their chances at the crown.
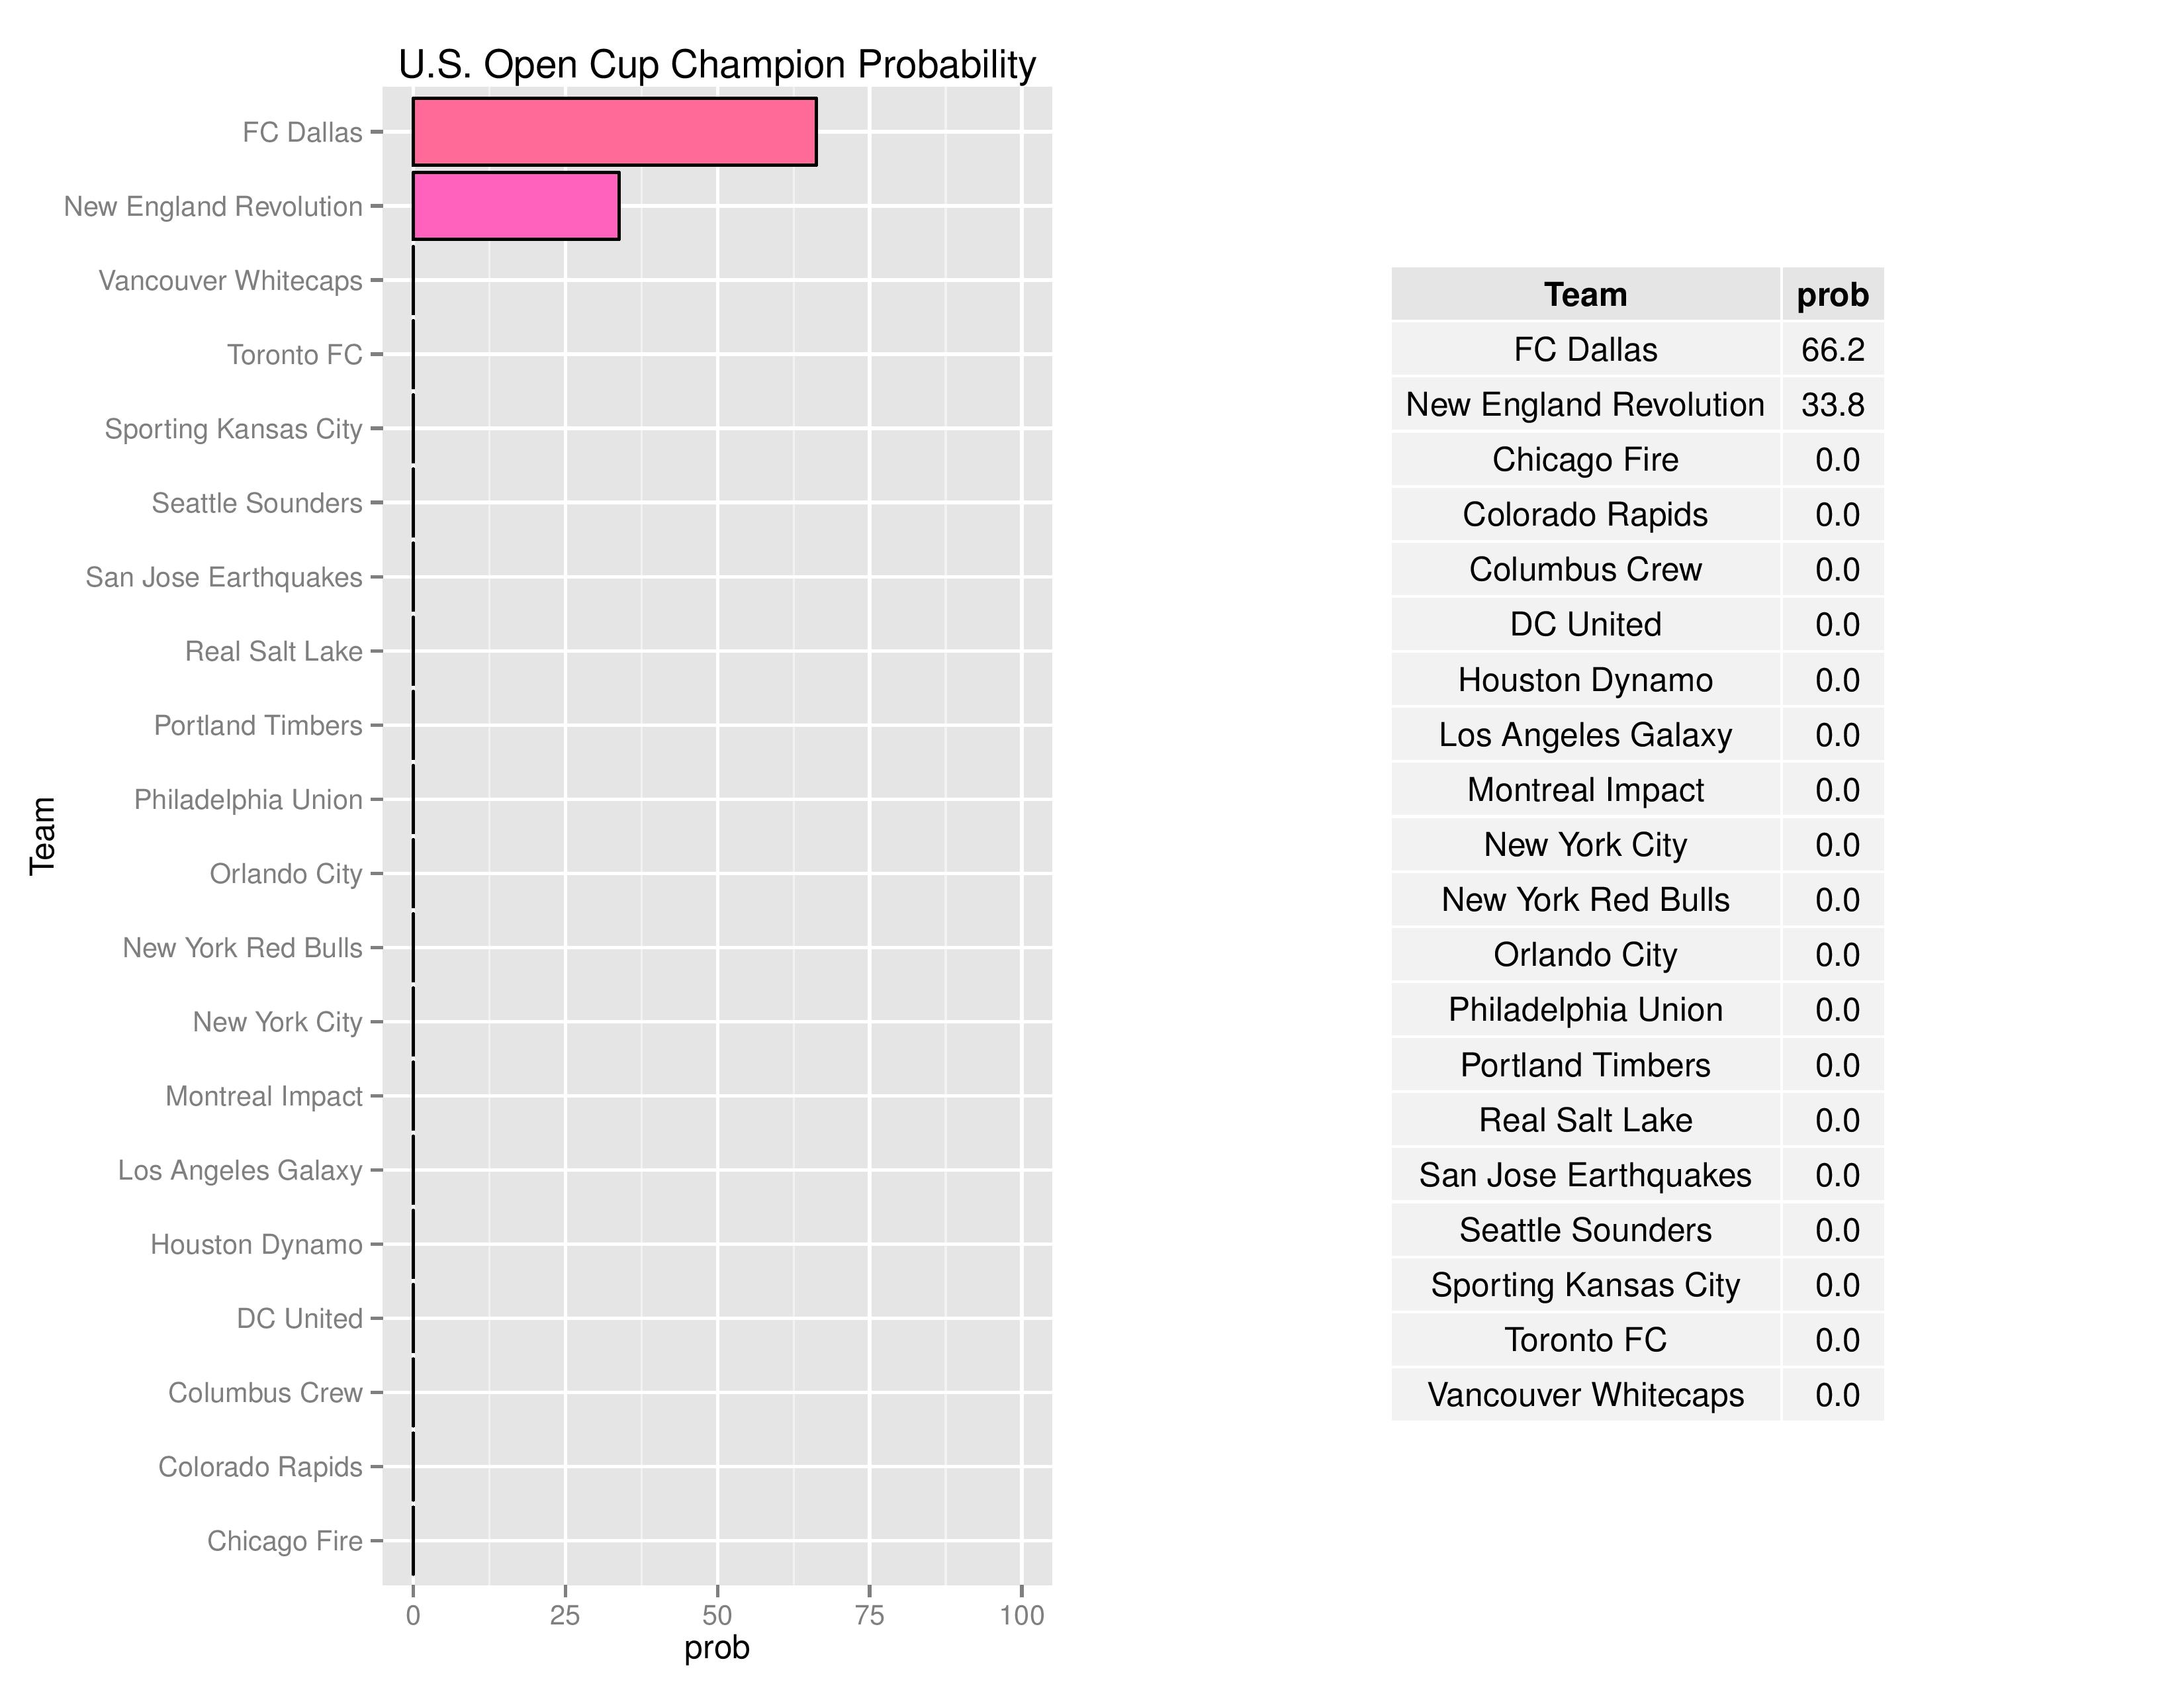
Philadelphia is eliminated from the US Open Cup. In addition to being the best team in MLS, FC Dallas also has home field advantage which gives them a tremendous edge on the USOC (and guaranteed access to the CCL Champions’ League). Then again, New England has less to play for in MLS which the model does not currently account for.
Philadelphia’s probability of qualifying for the CONCACAF Champions League has boosted to 23.6%. Philadelphia’s probability of qualification is still largely dependent on topping Toronto and both NY teams for the conference leader, but the MLS Cup certainly helps if the Union can avoid a first-round-matchup.
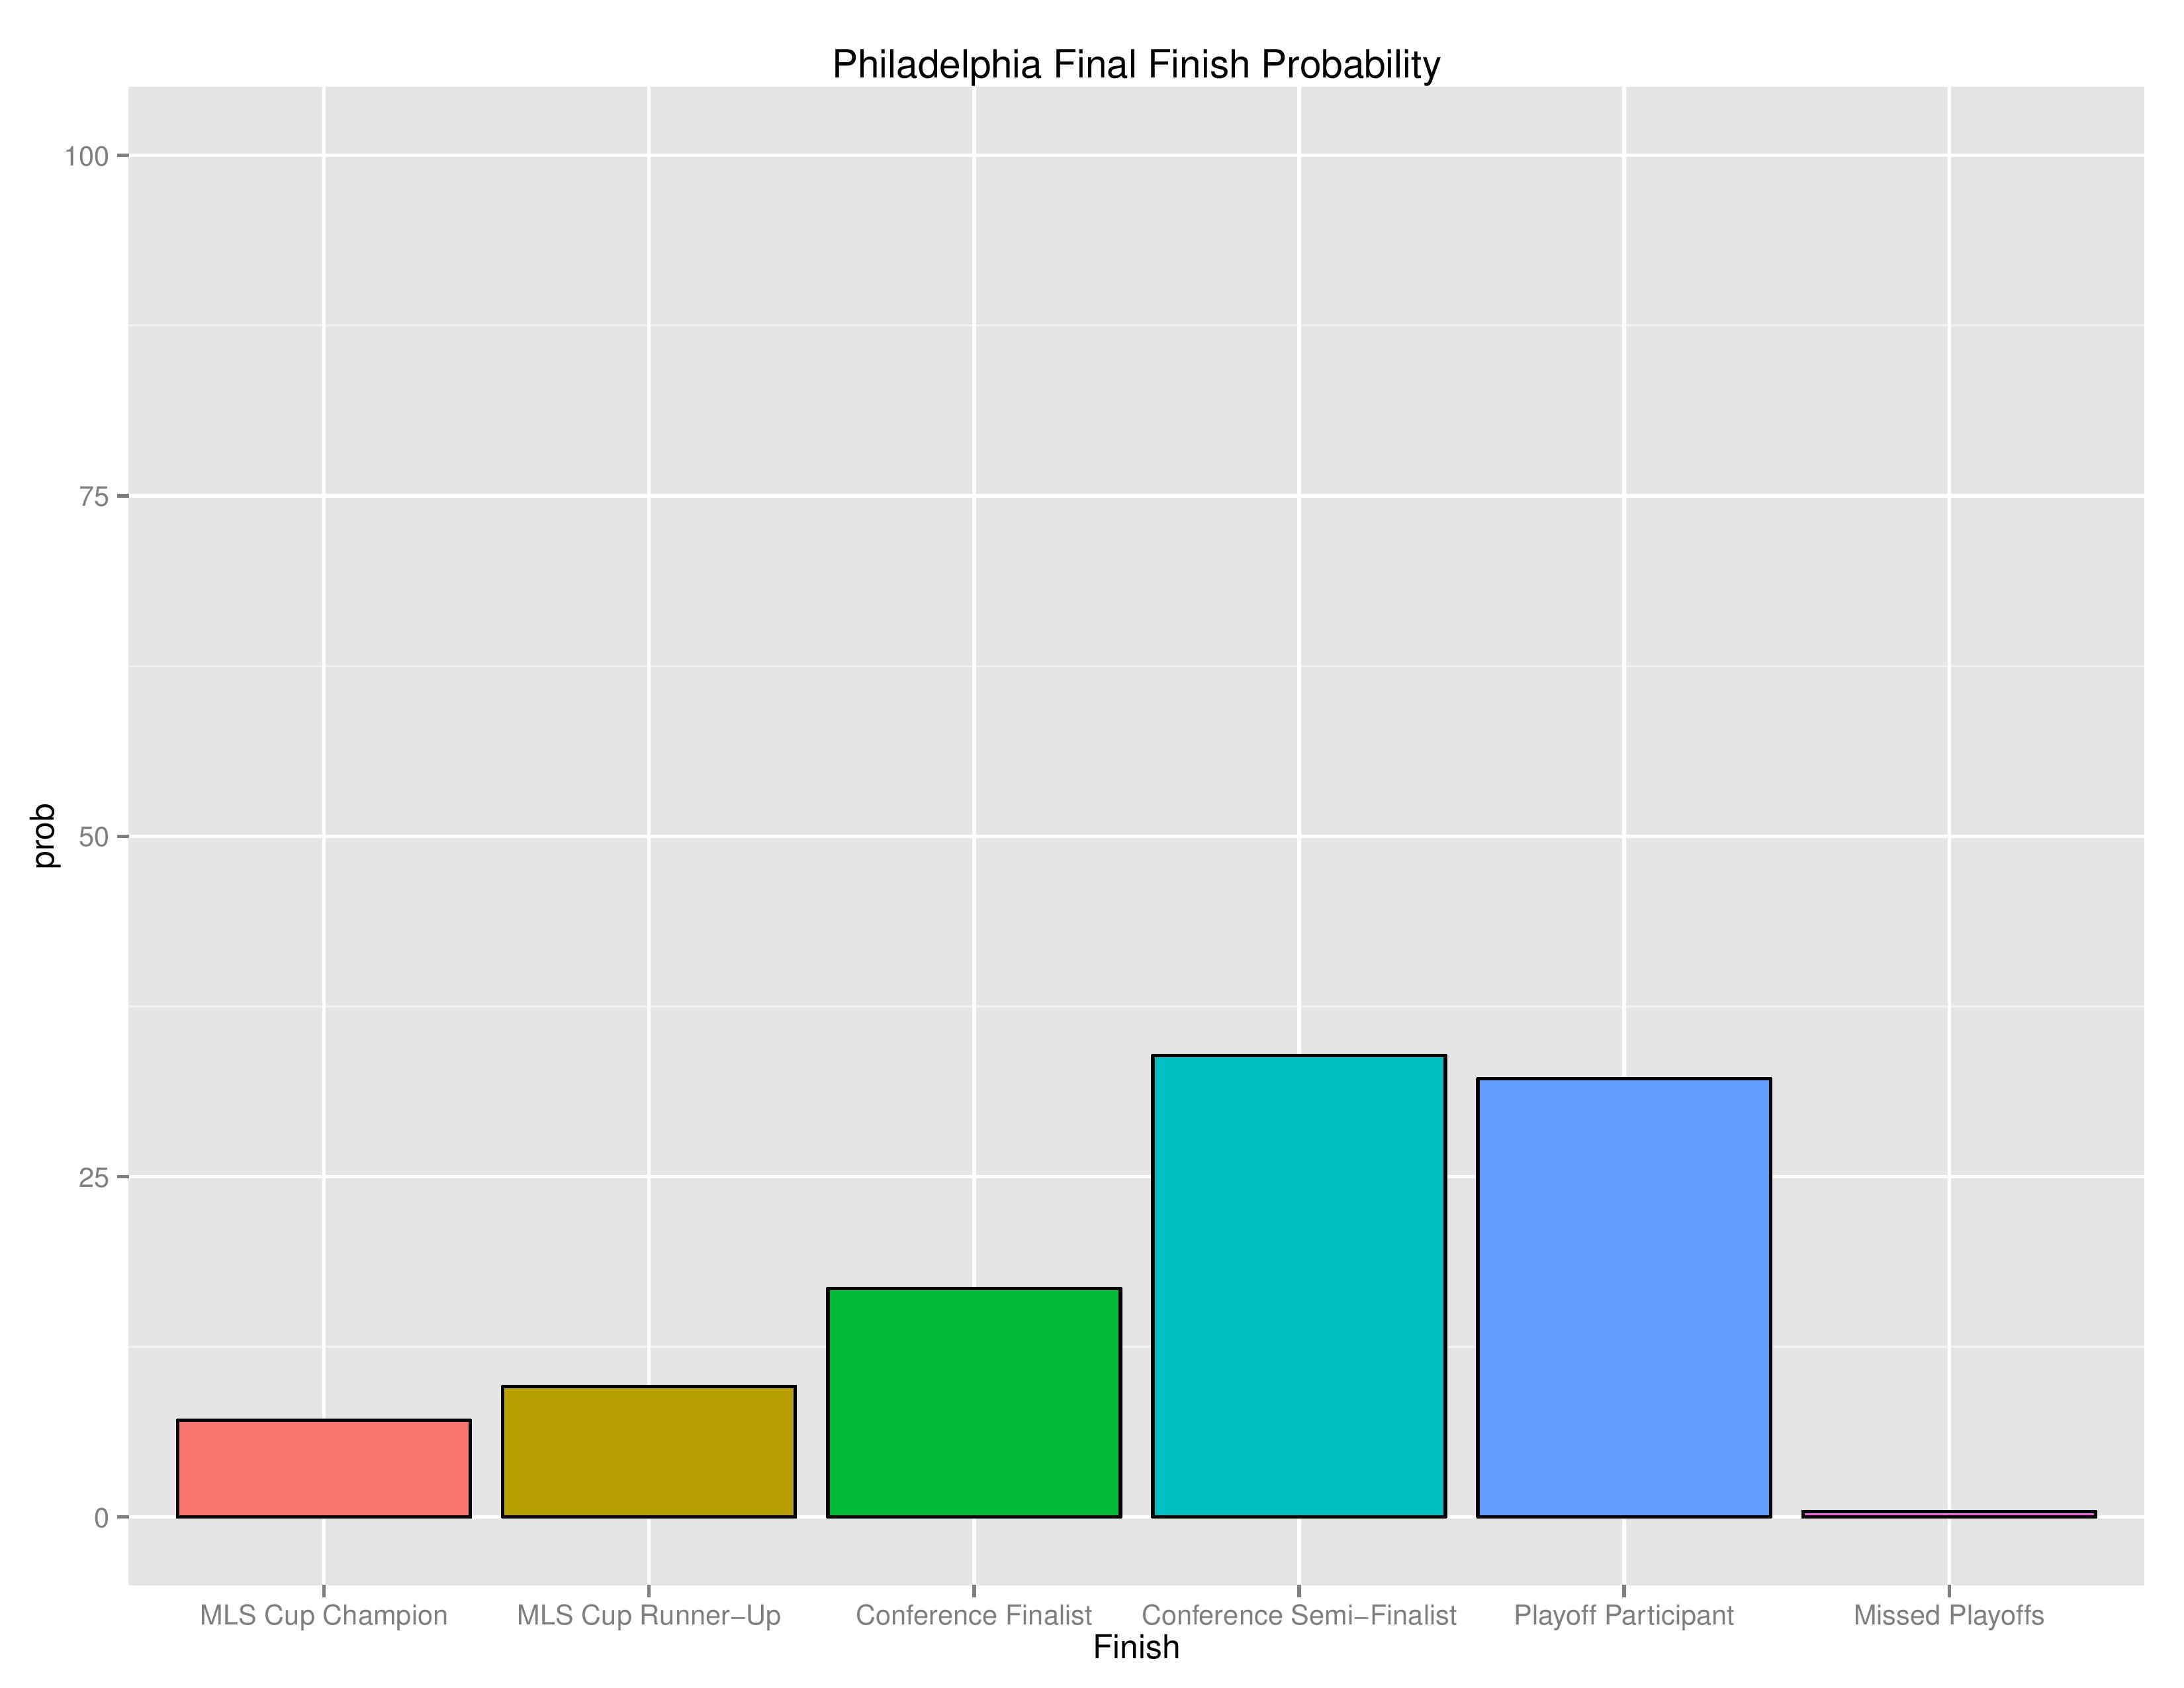
Philadelphia finishing
The following shows the probability of various playoff categories and Philadelphia’s probability of each of them.
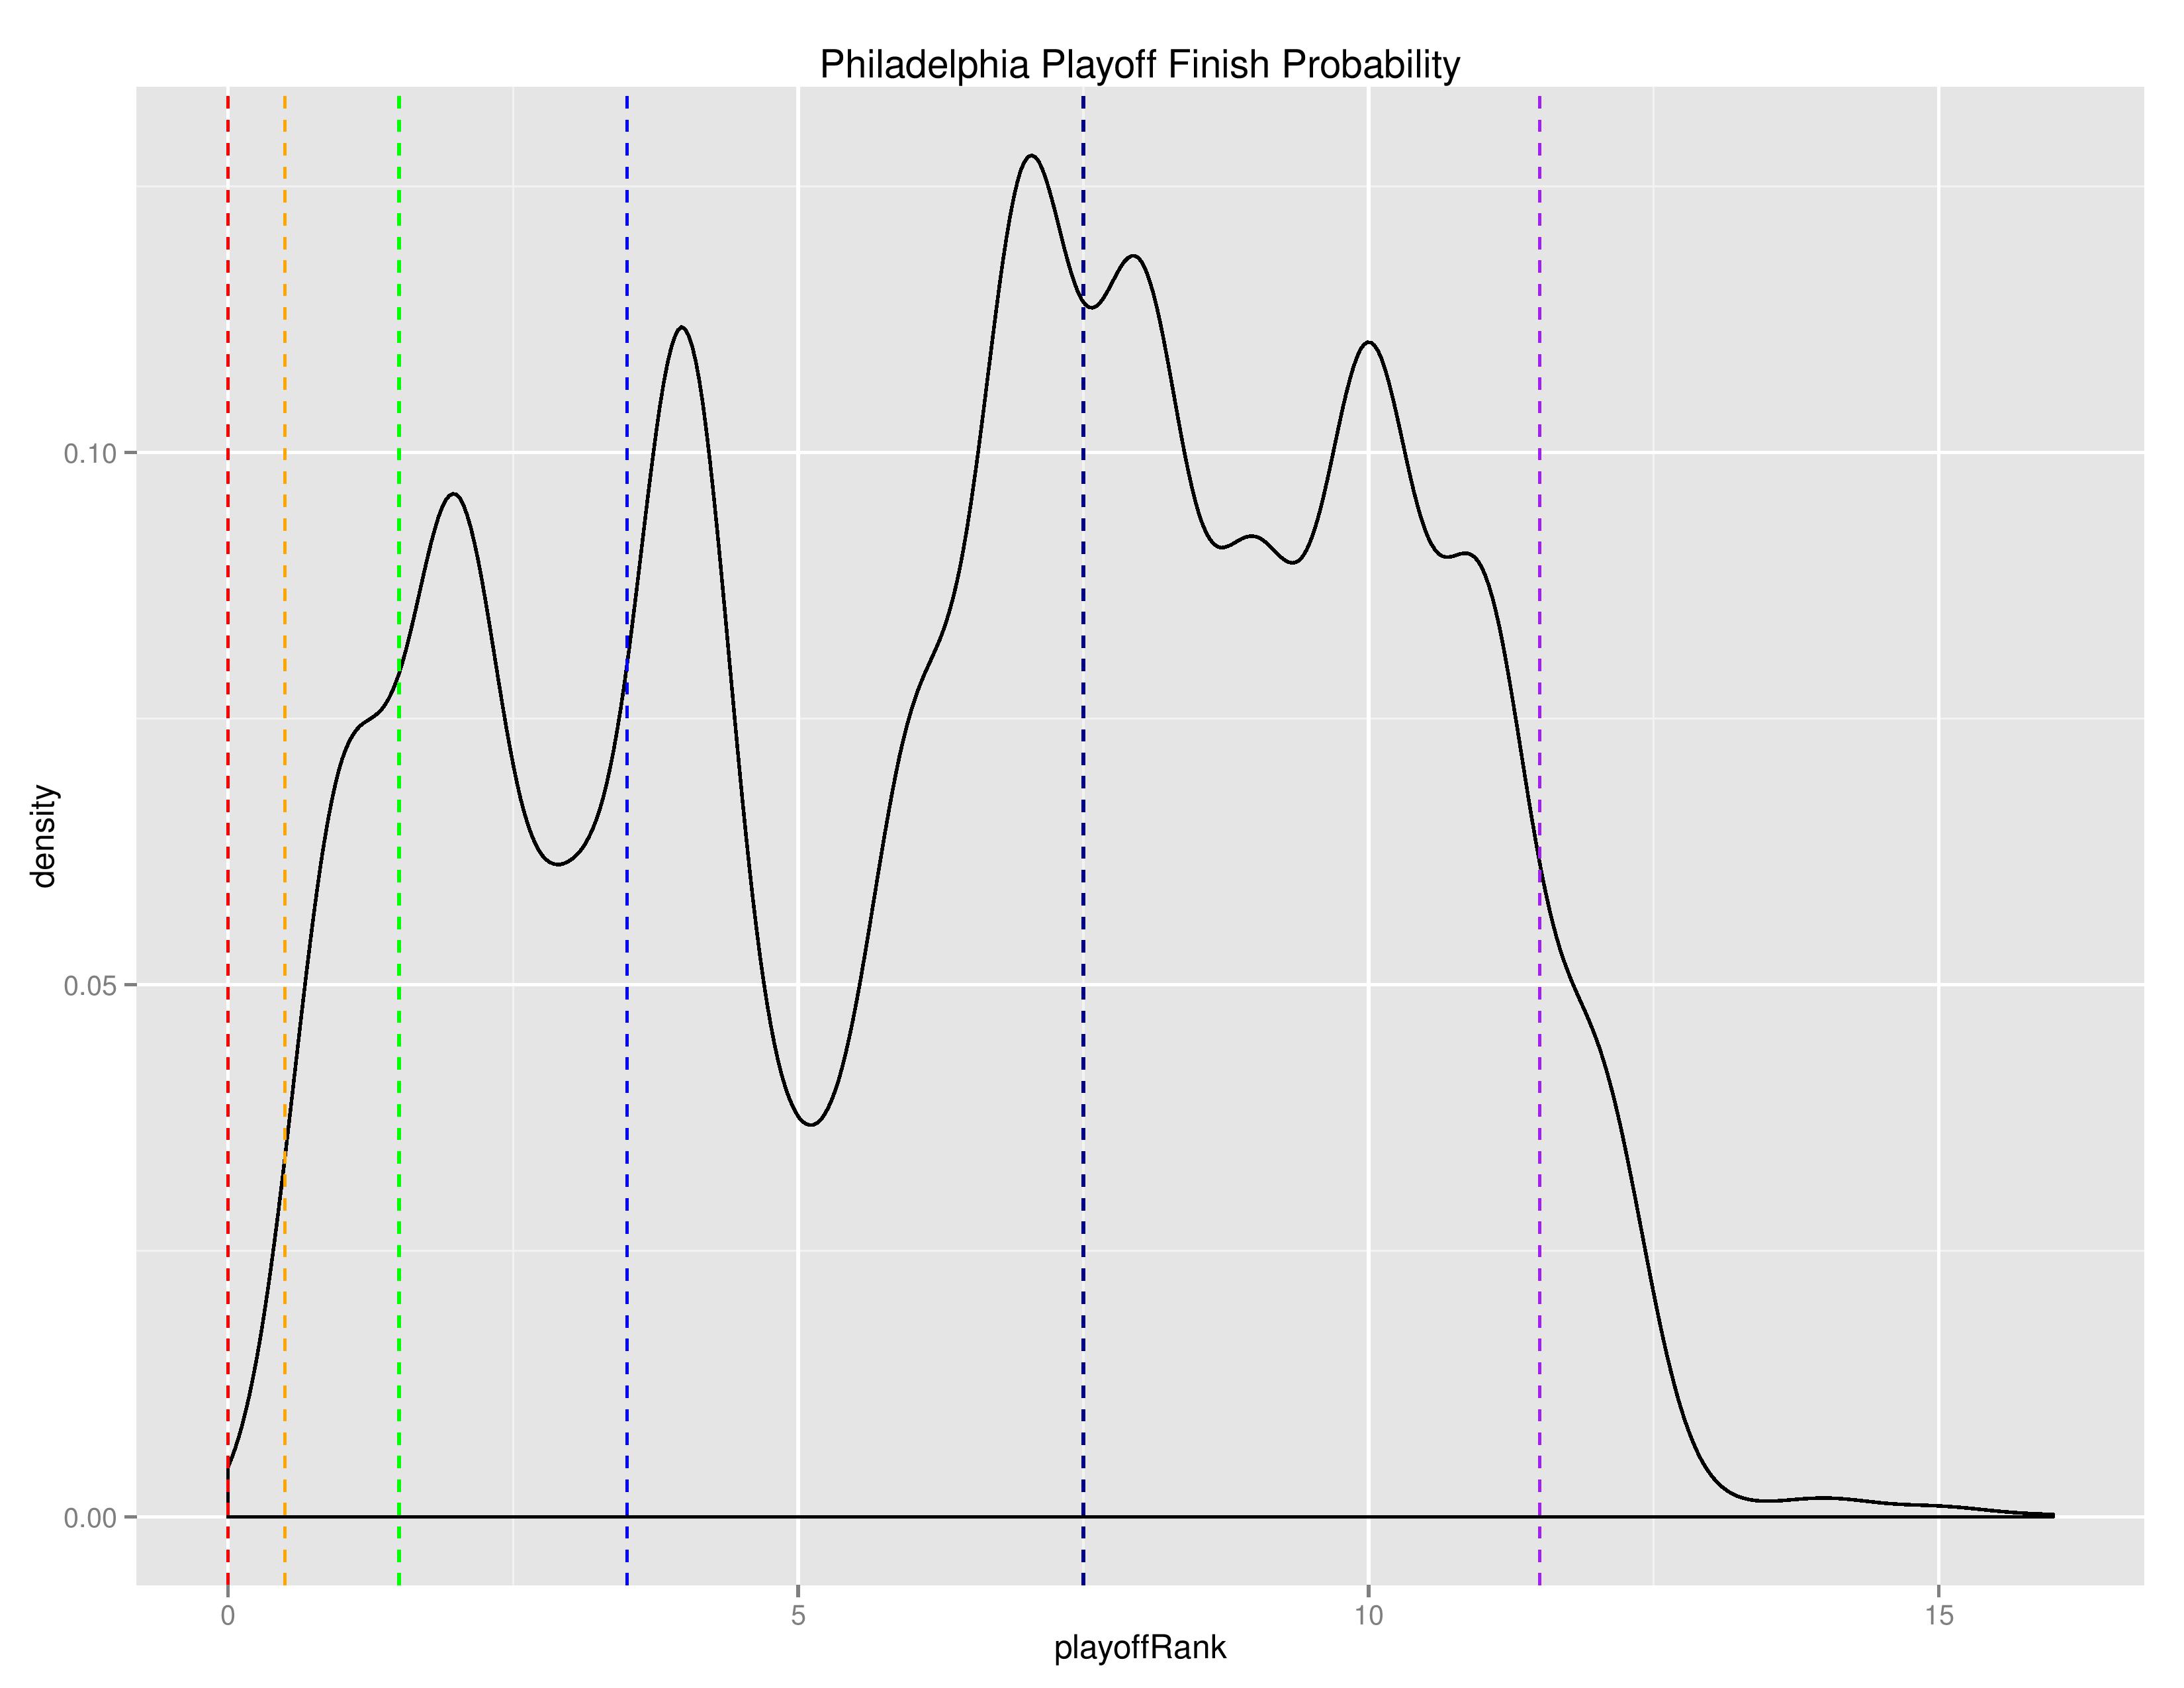
The following is a “density” chart showing the relative probability of Philadelphia finishing at the different after-playoffs rankings from 1 to 20.
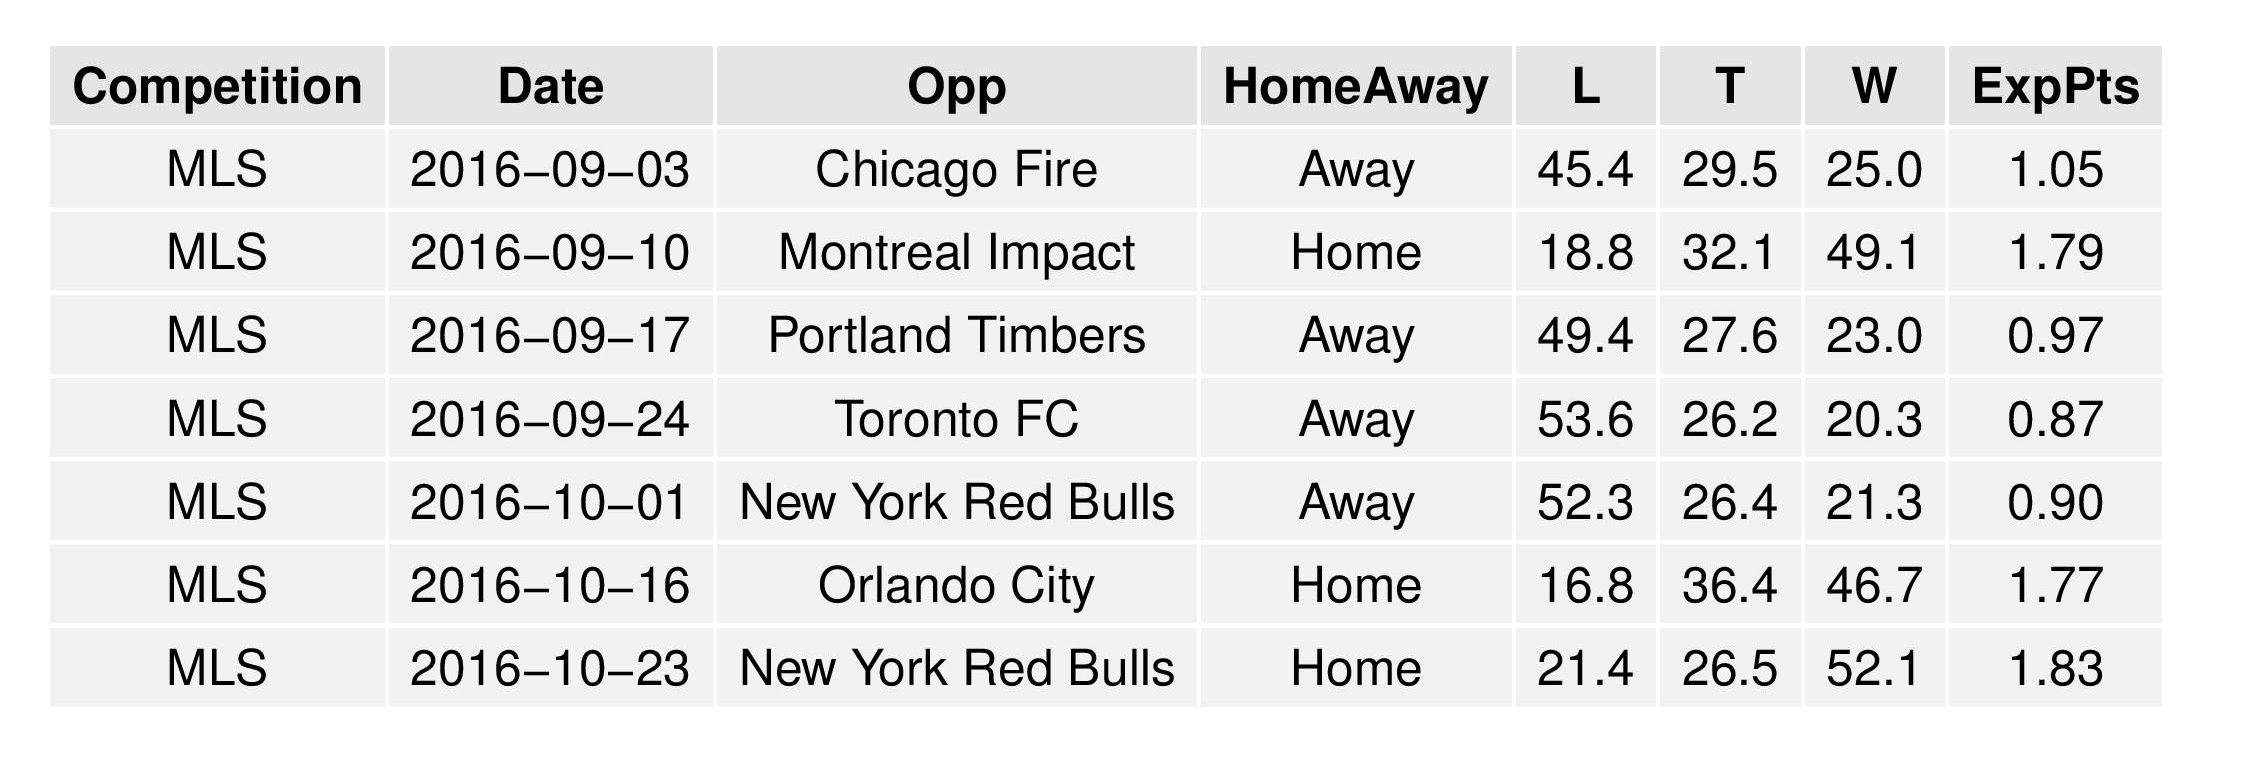
The following is the list of Philadelphia’s remaining scheduled matches accompanied by result probabilities as predicted by SEBA.
The charts below show the average results of all the simulations and the probabilities associated with all of the above. The chart is broken up into two parts in order to better fit on your screen.
(Note: CCLAlternate refers to qualifying for CONCACAF Champions League non-traditionally. U.S. teams qualify by winning the MLS Cup, winning the Supporters’ Shield, winning the Conference in the regular season, and by winning the U.S. Open Cup. If a Canadian team wins any of these or a U.S. team wins more than one, the extra slots are filled by top regular season performers.) (Also, “regSeasFinish” refers to finishing the conference in first place AND not winning other CCL slots like MLSCup, Supporters’ Shield, and USOC)
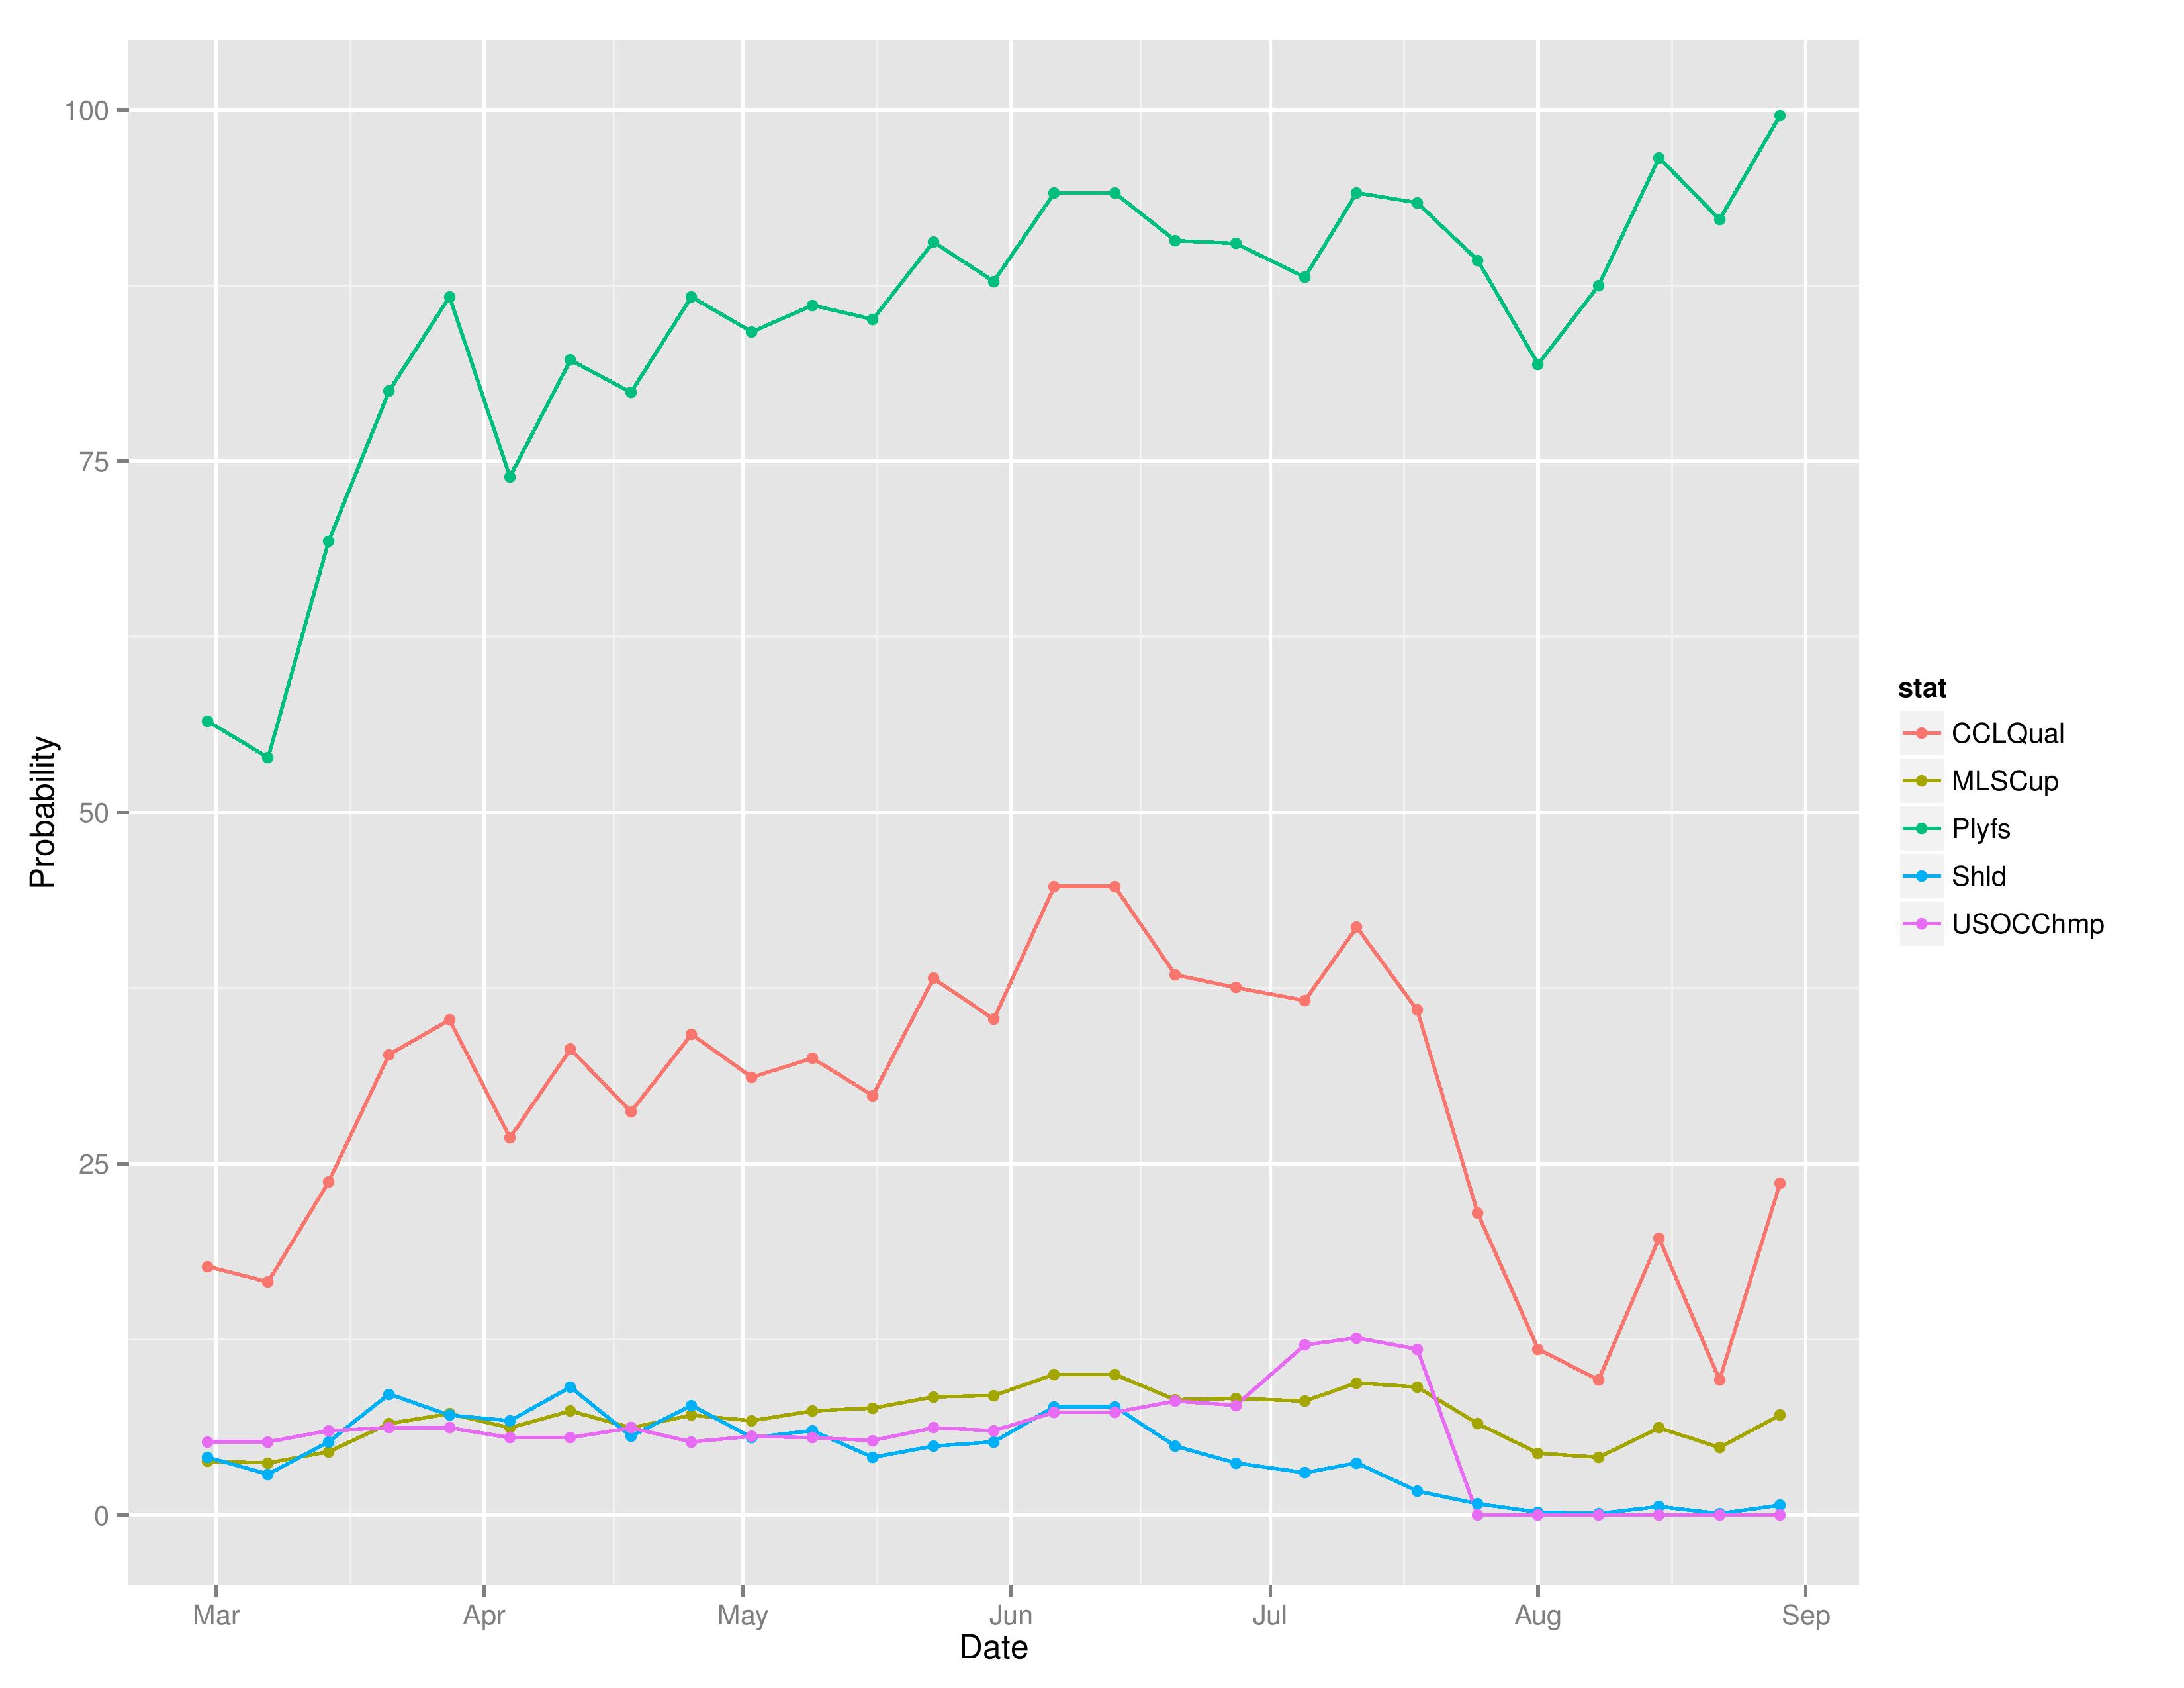
Changes Over Time
This chart shows how Philadelphia’s chances at each of the outcomes has evolved over the course of the season.
This shows the evolution of Philadelphia’s movement within SEBA and other media outlets’ power rankings.
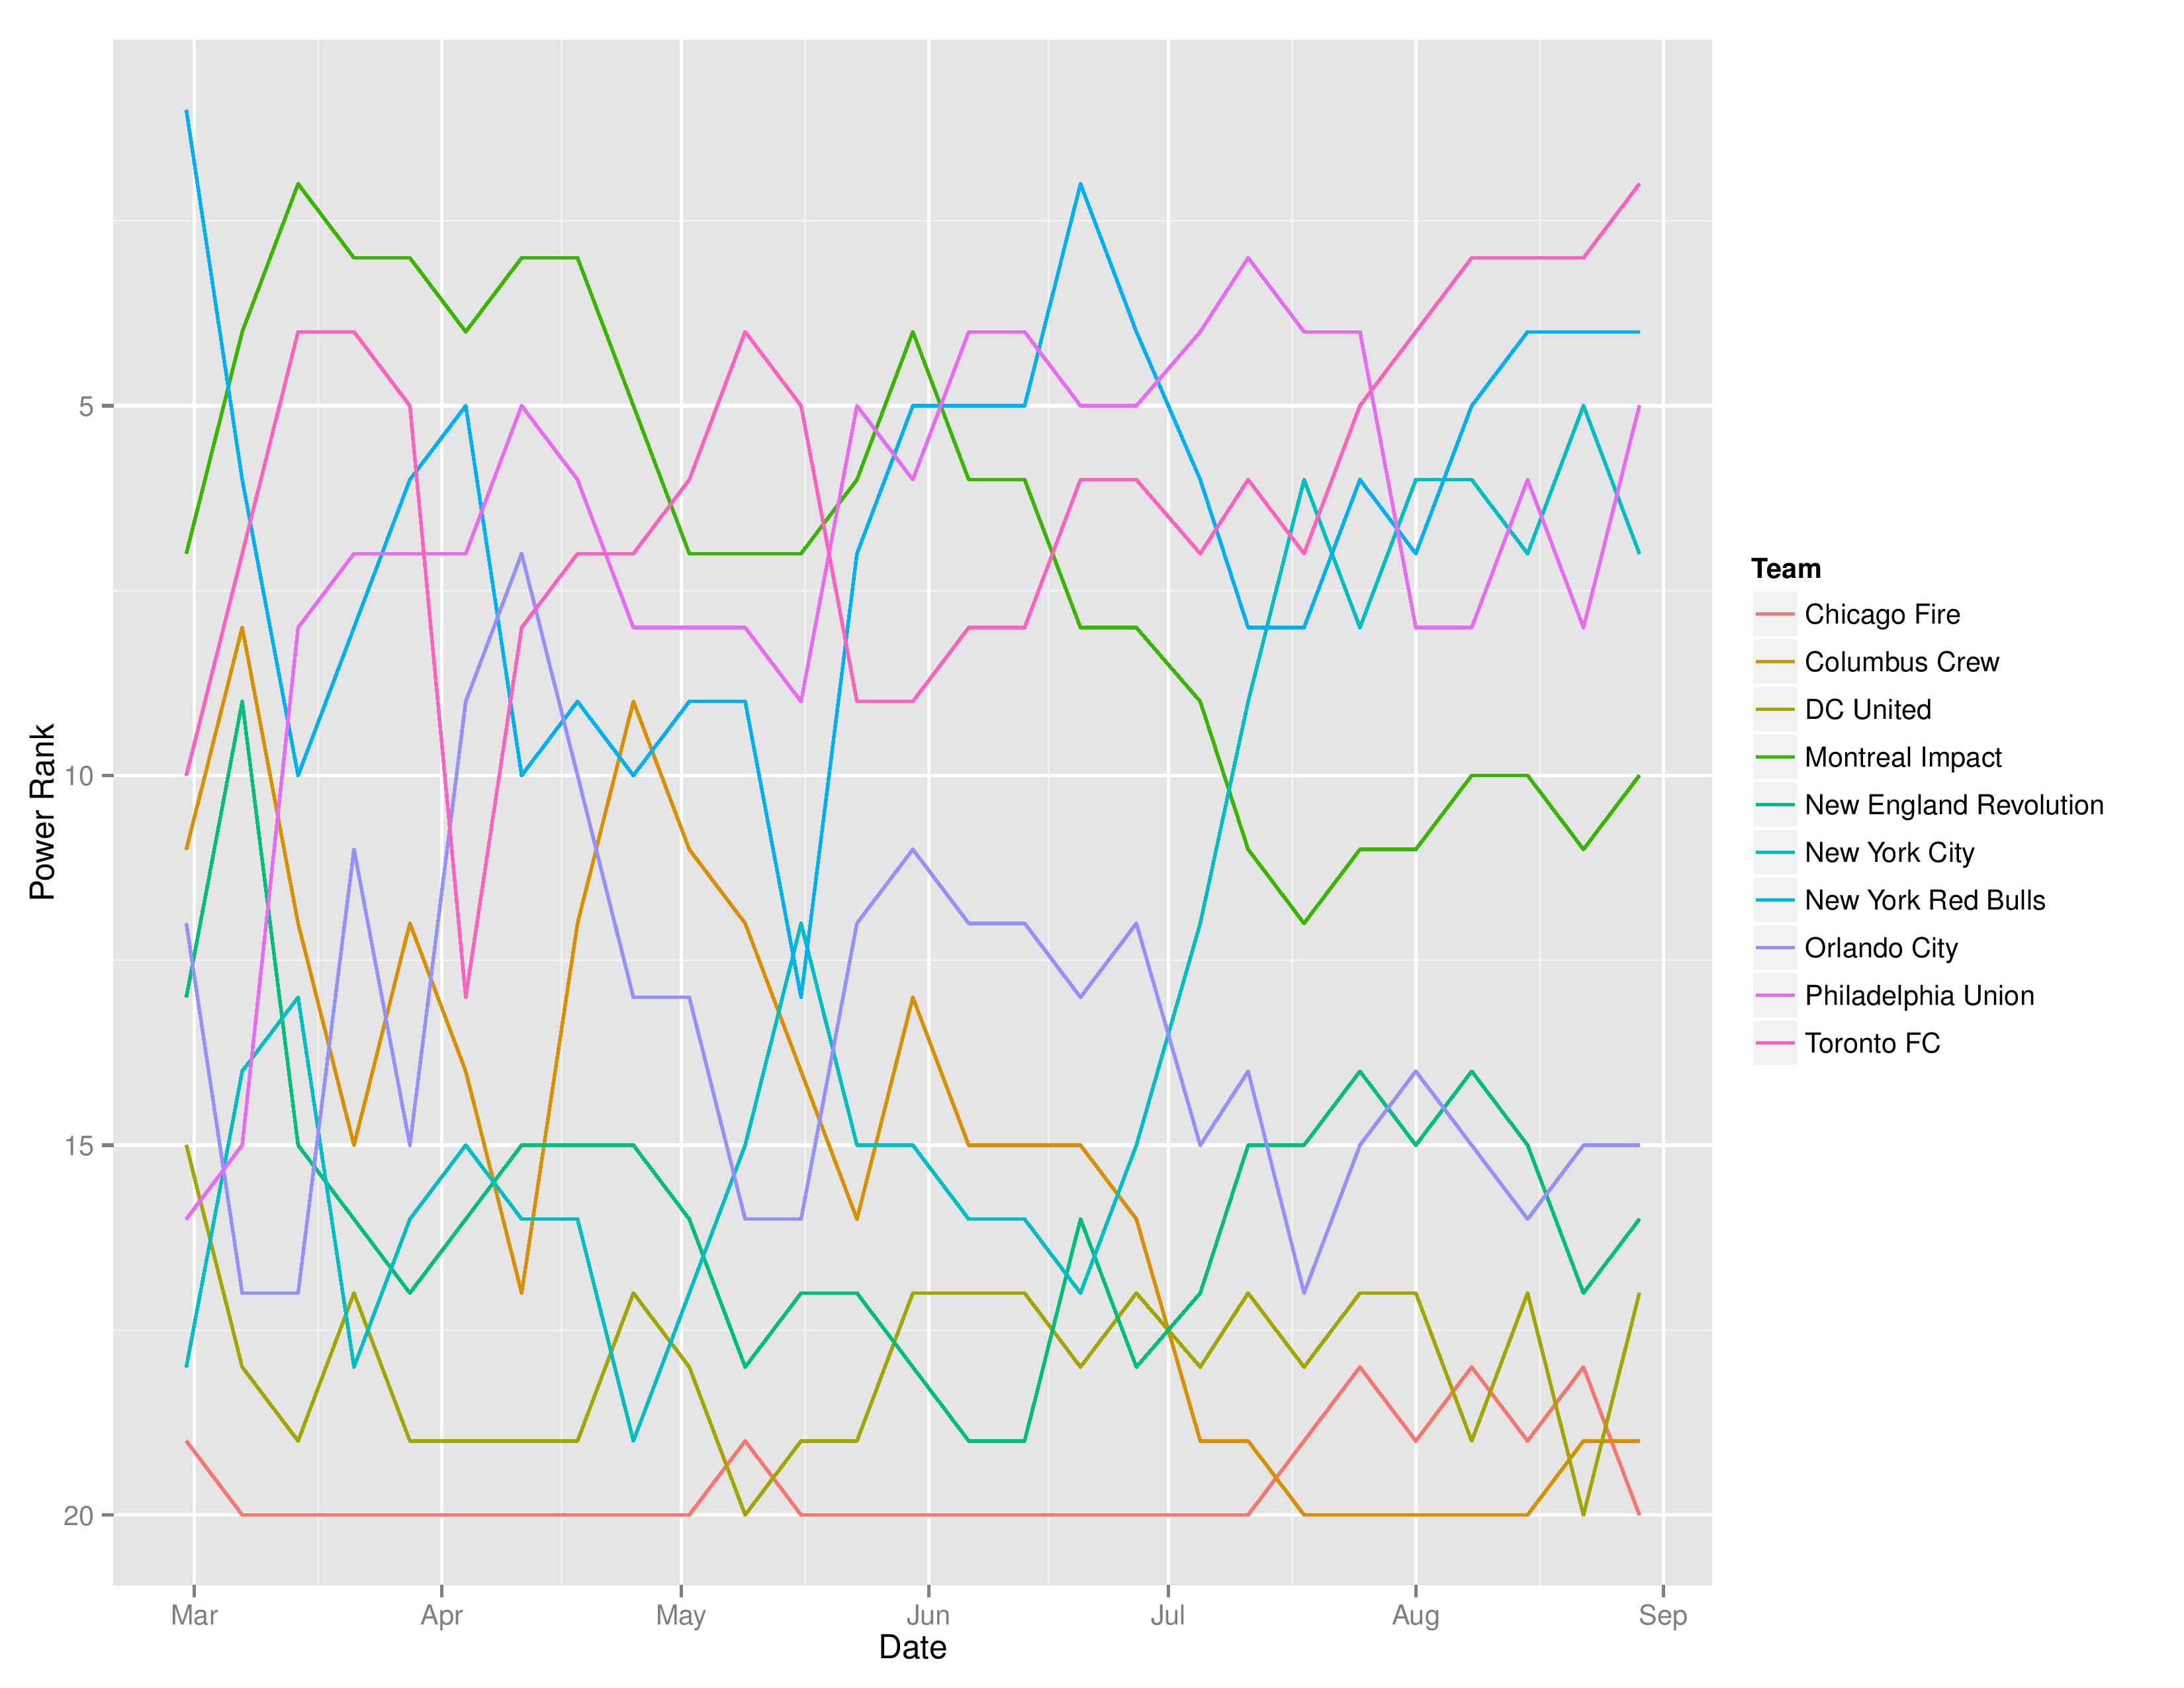
This shows the MLS Eastern Conference’s power rankings’ evolution in SEBA throughout the season.
Records
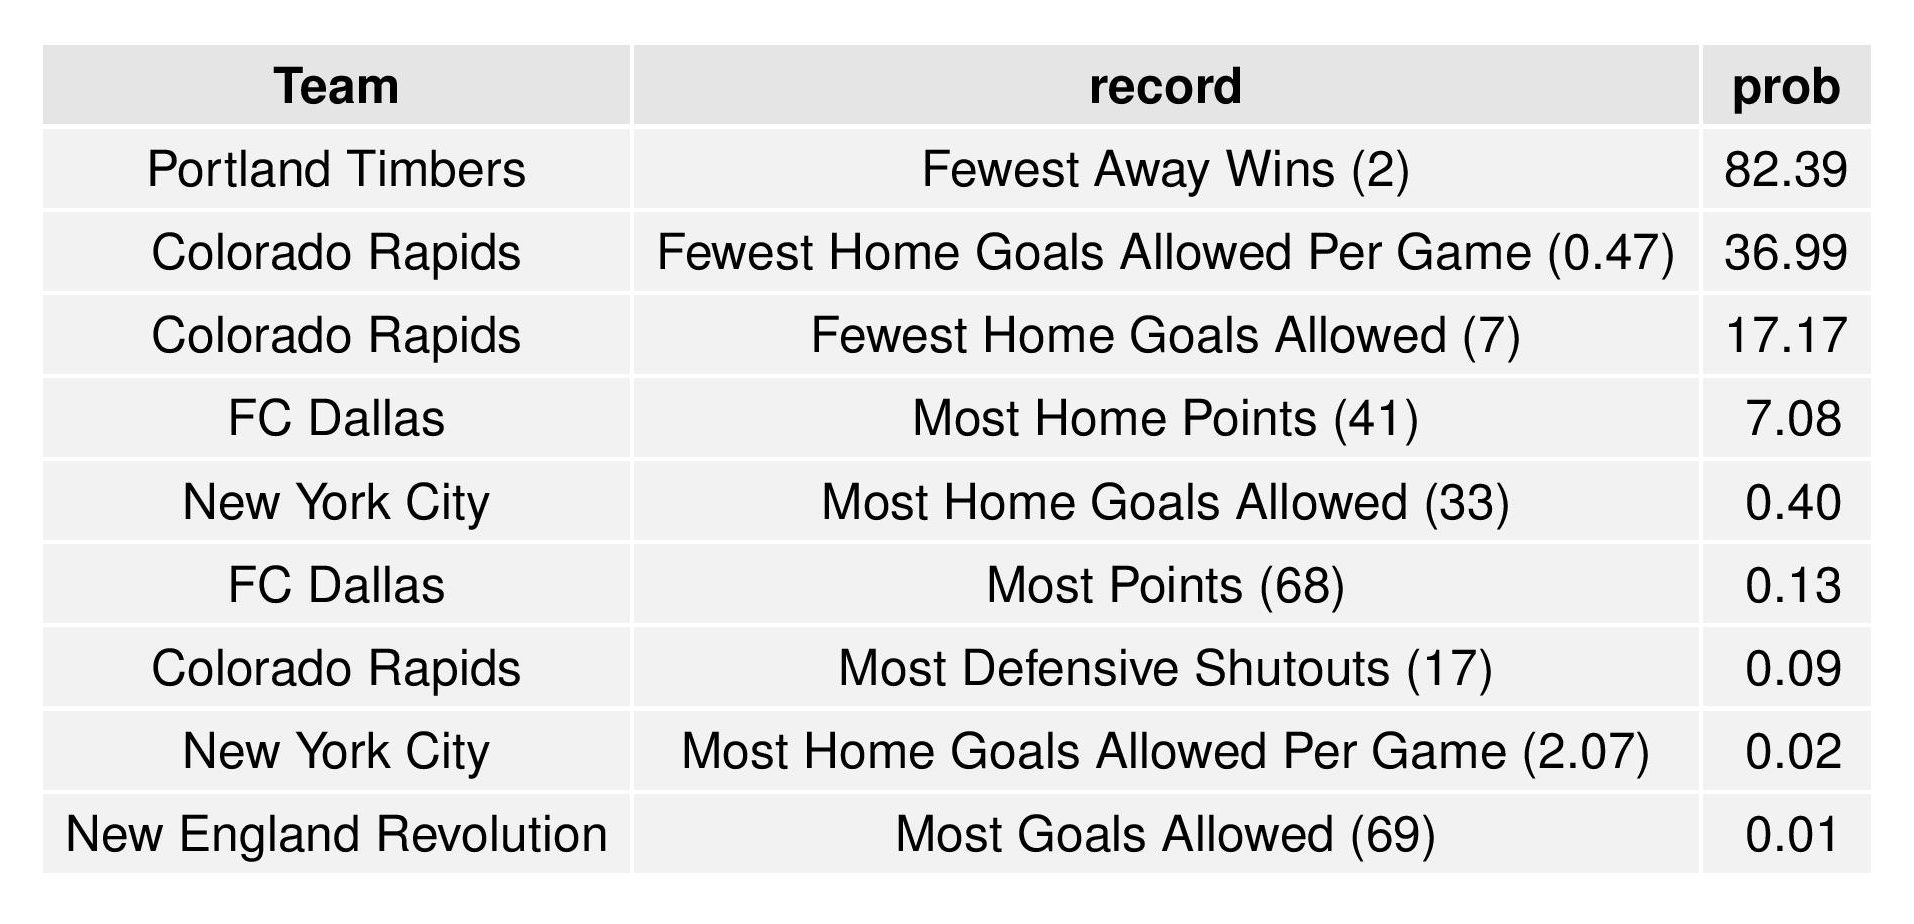
This shows the odds of breaking MLS single-season records, not of holding them. If more than one team could break the same record this season, they would both be represented below.
(Philadelphia did not break any single-season records in any of the 15,000 simulations.)
The following table shows all single-season records that had a record broken in at least one simulation. However, it limits the records to show only the most probable team for breaking each record.
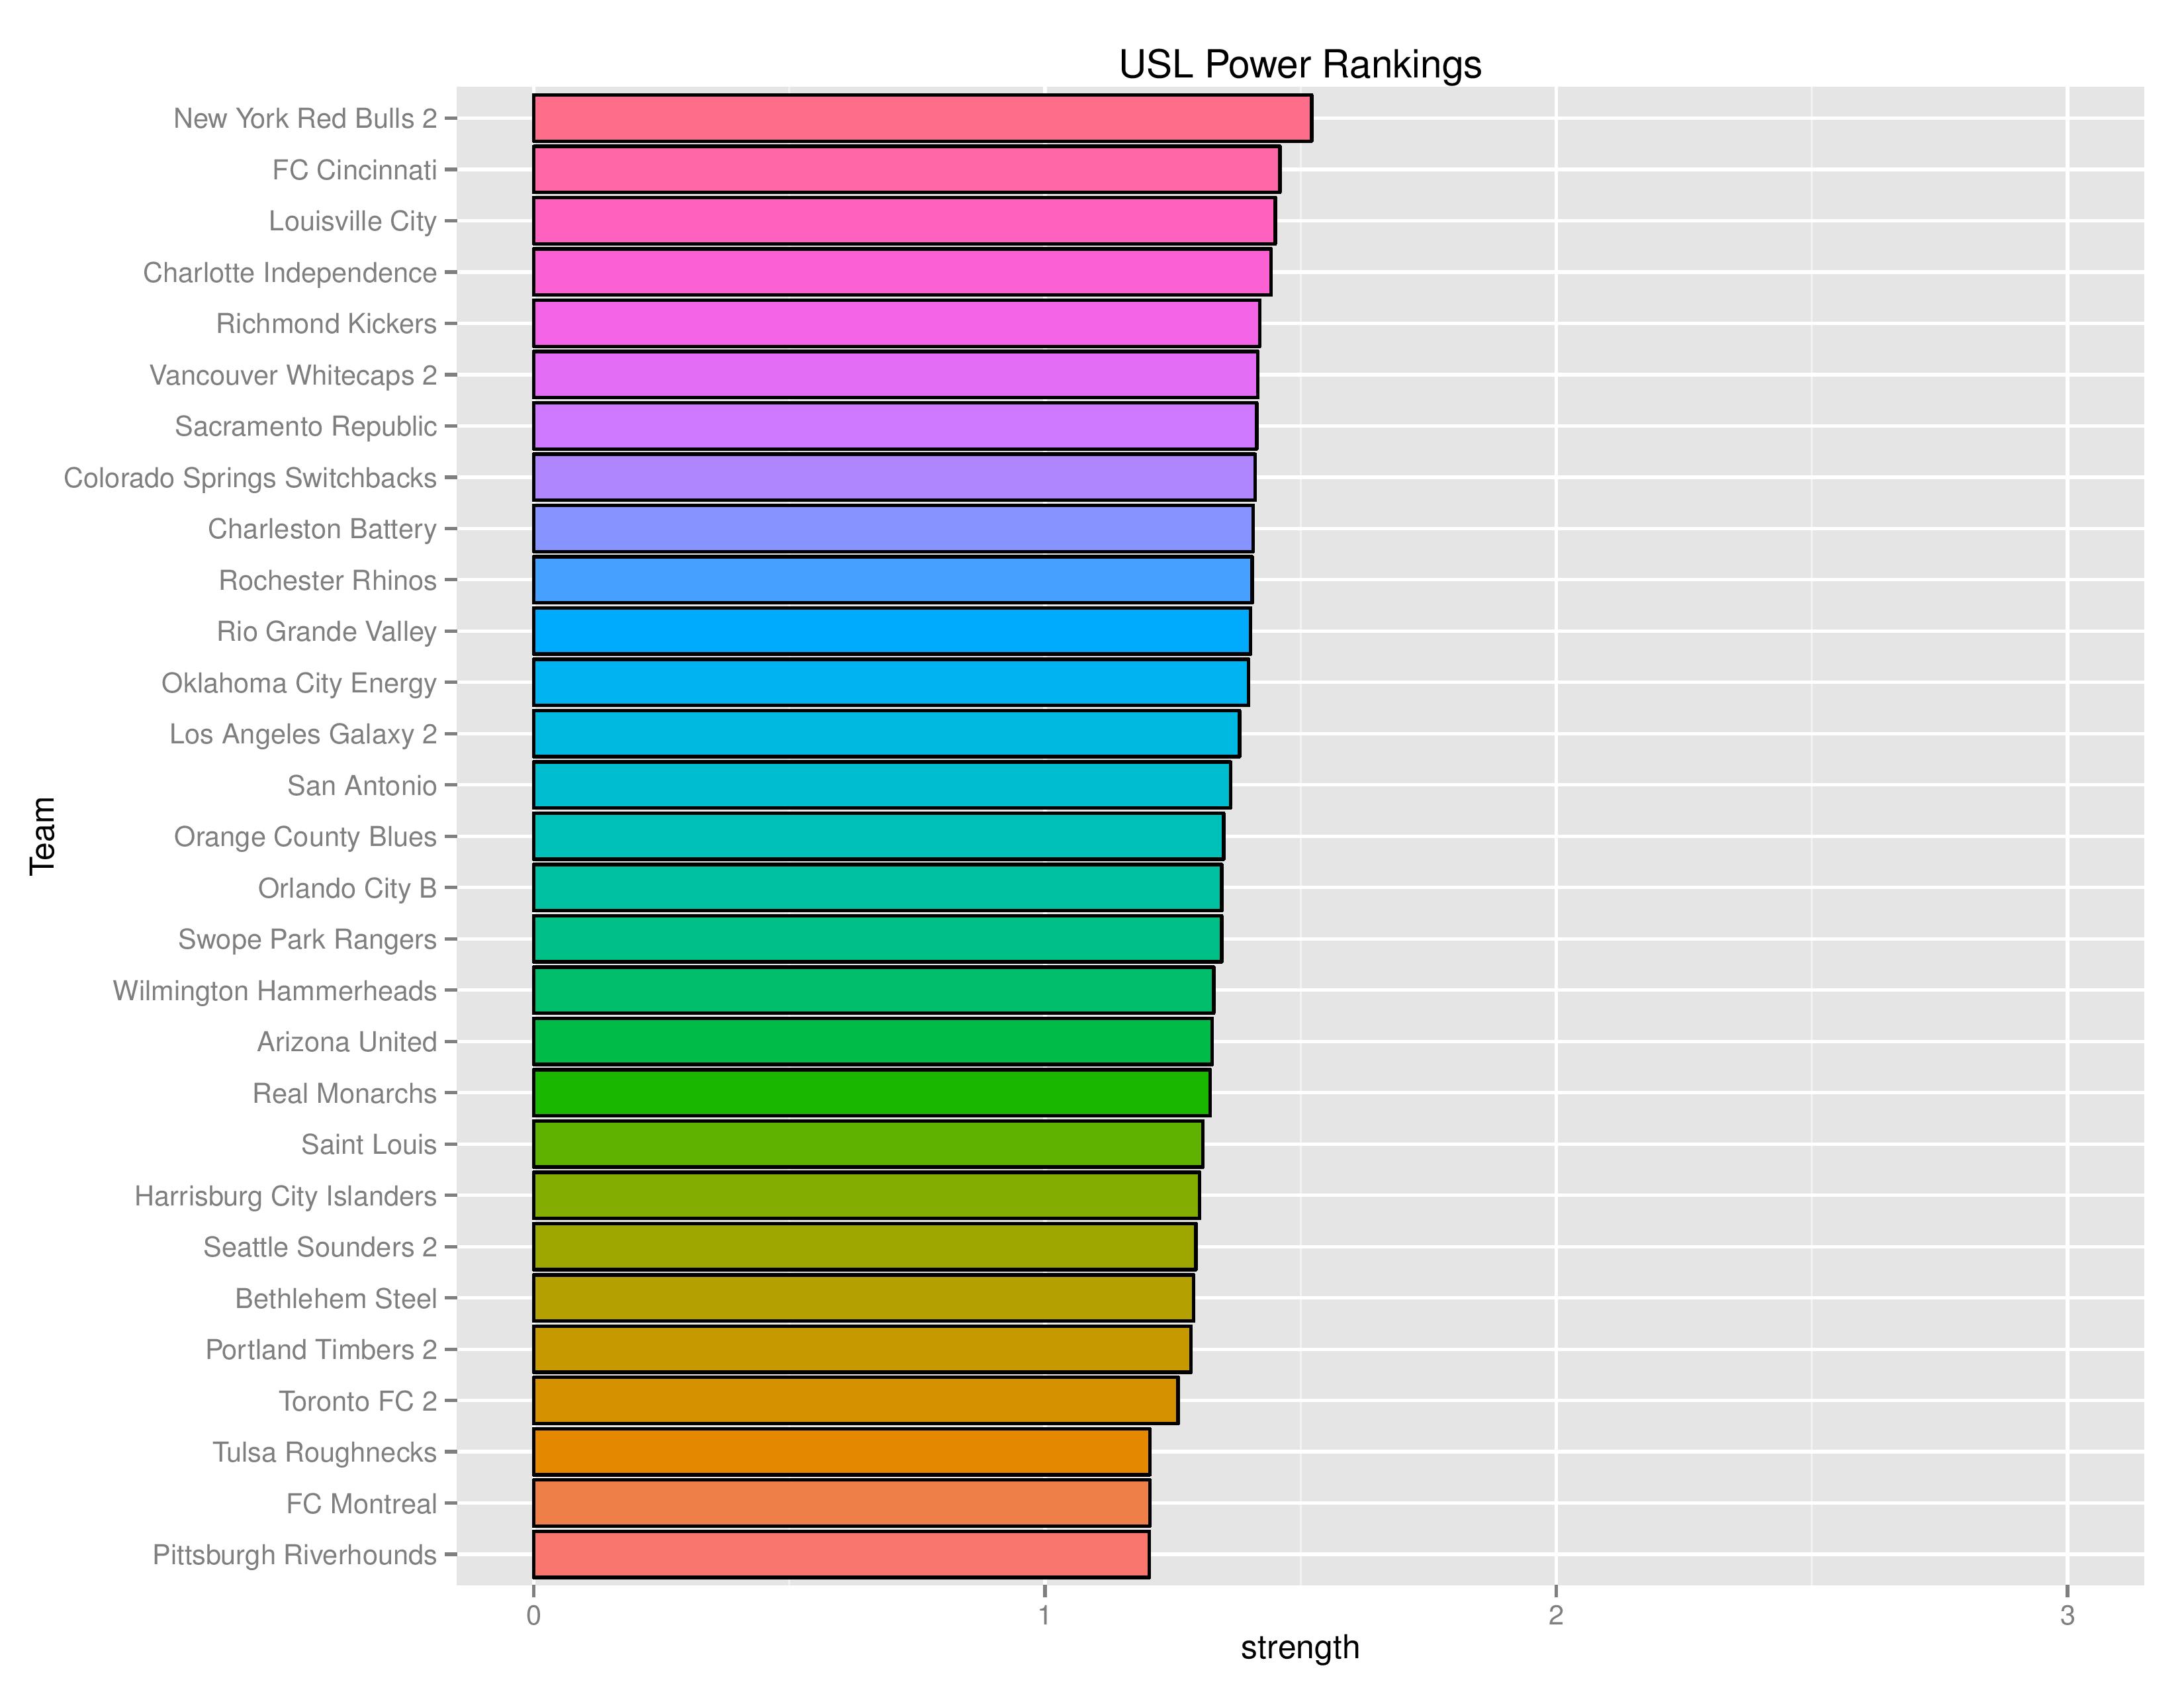
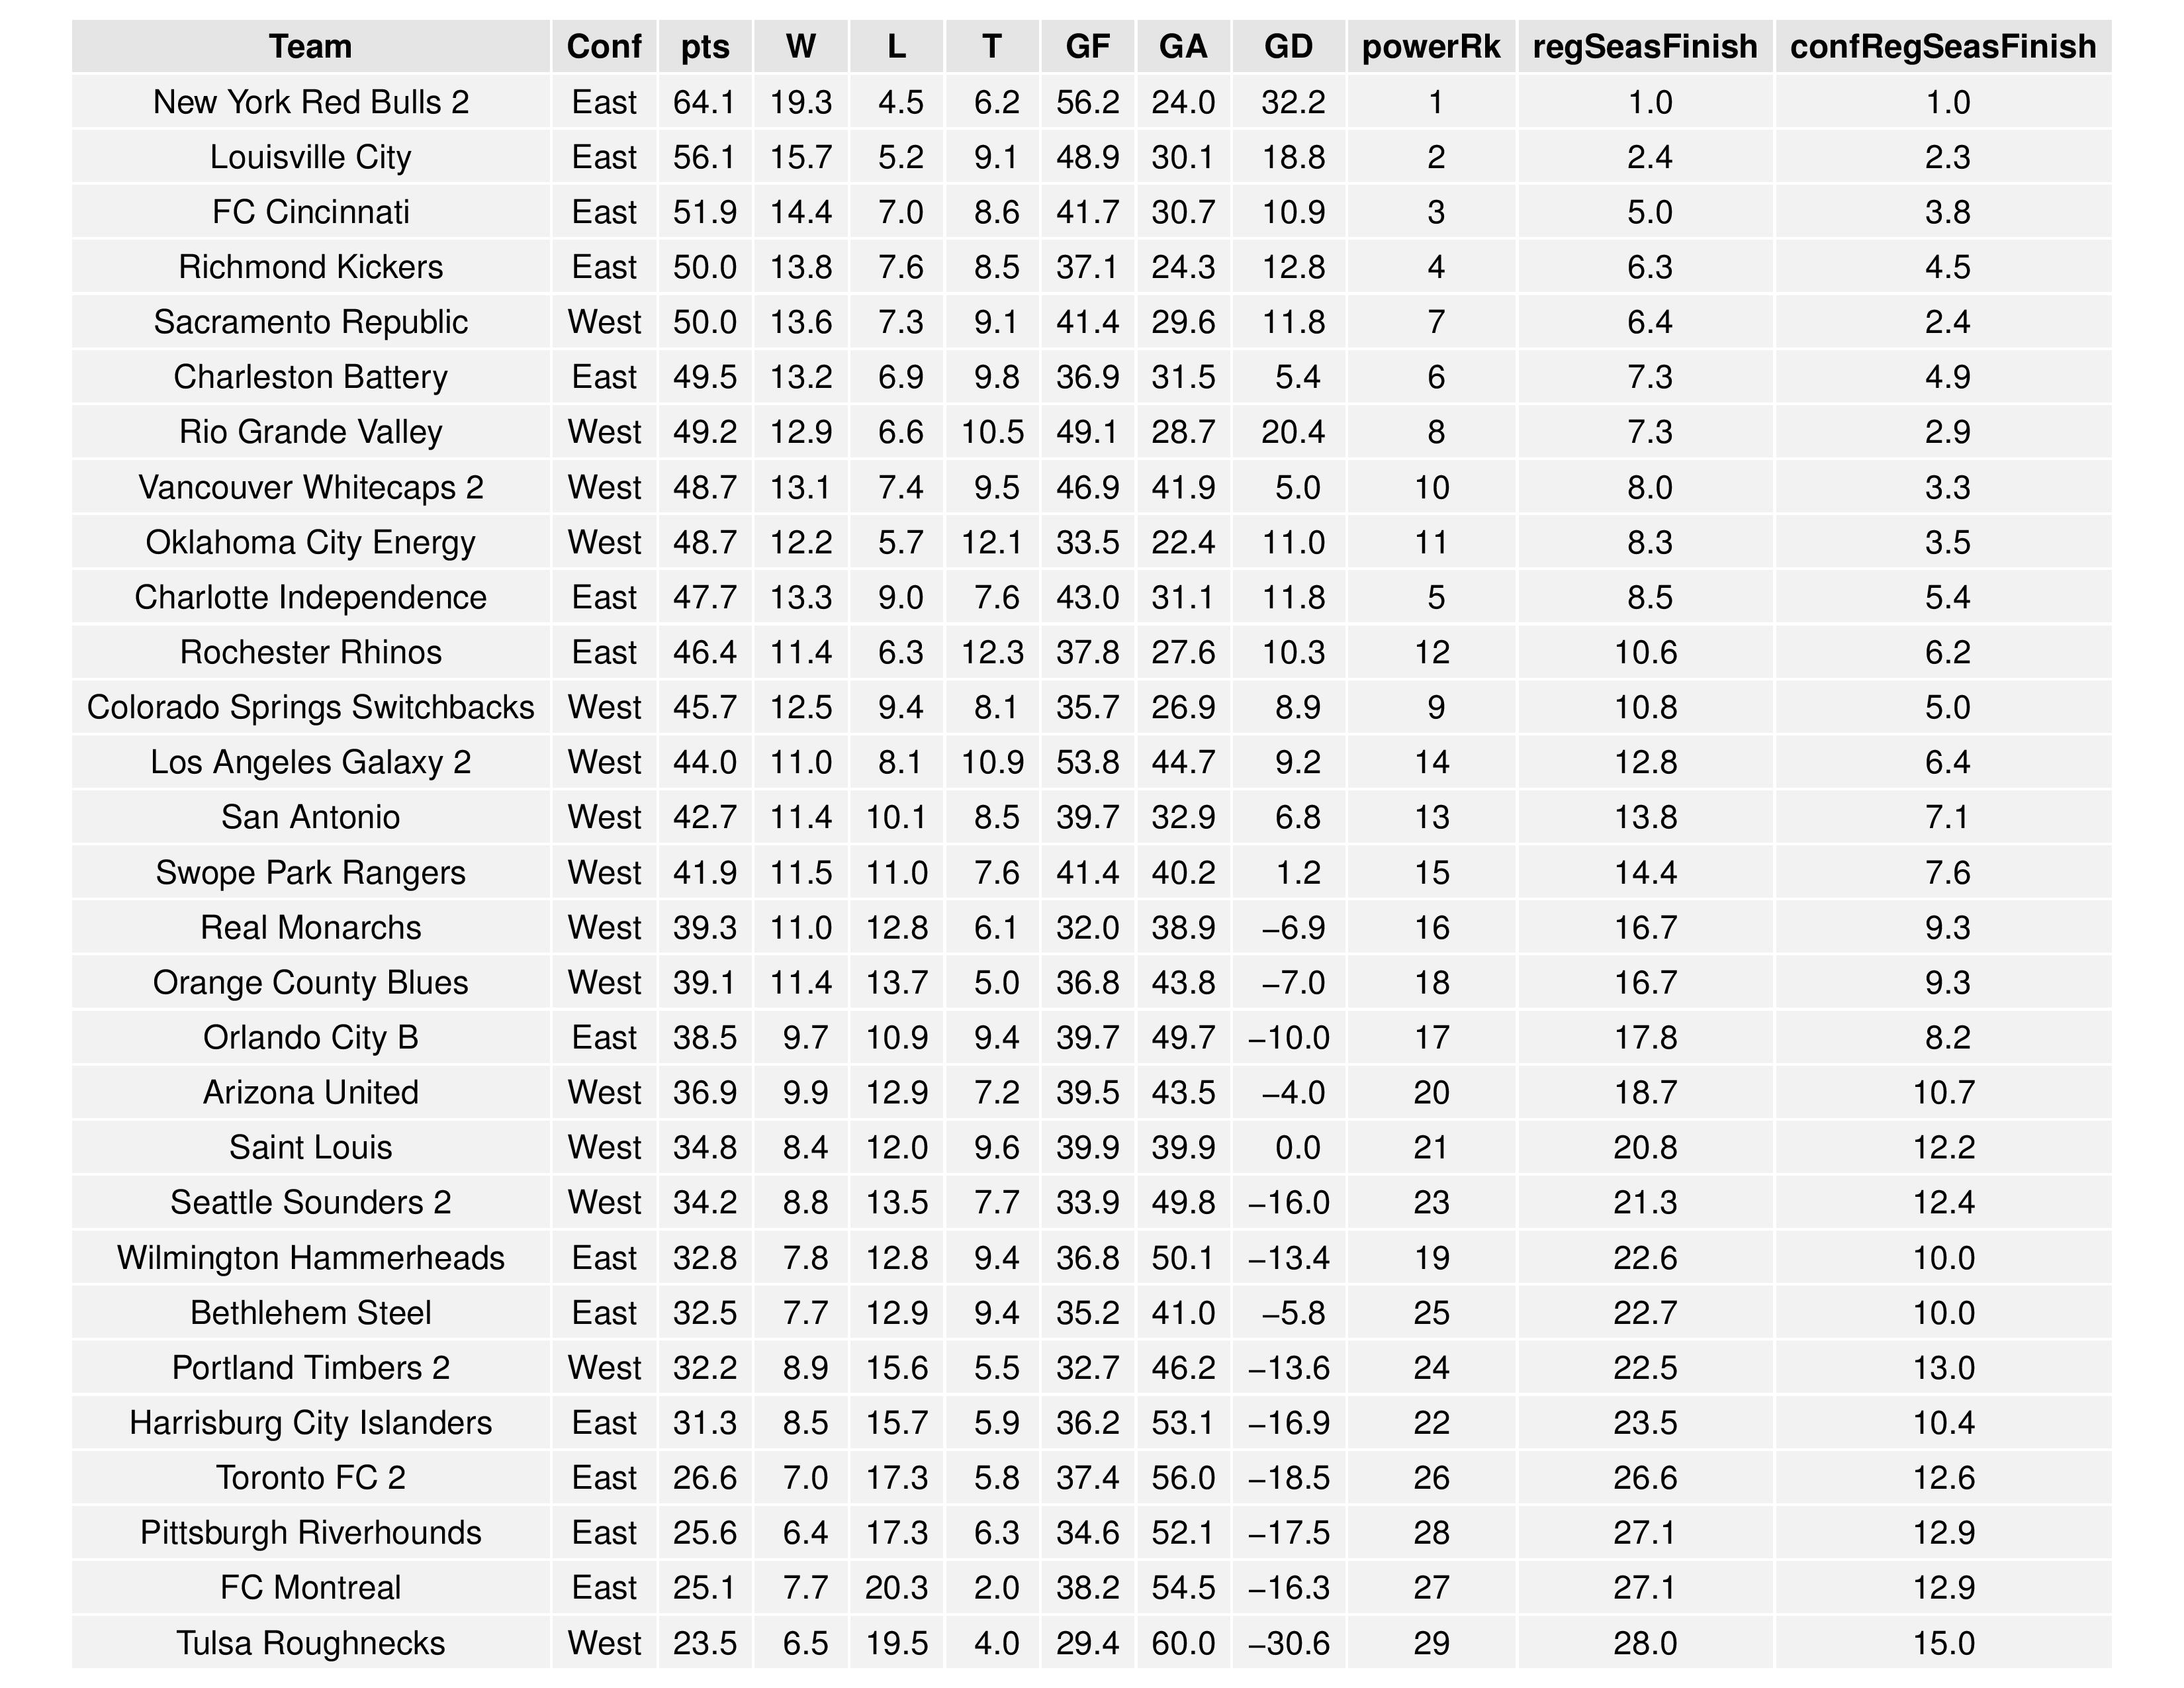
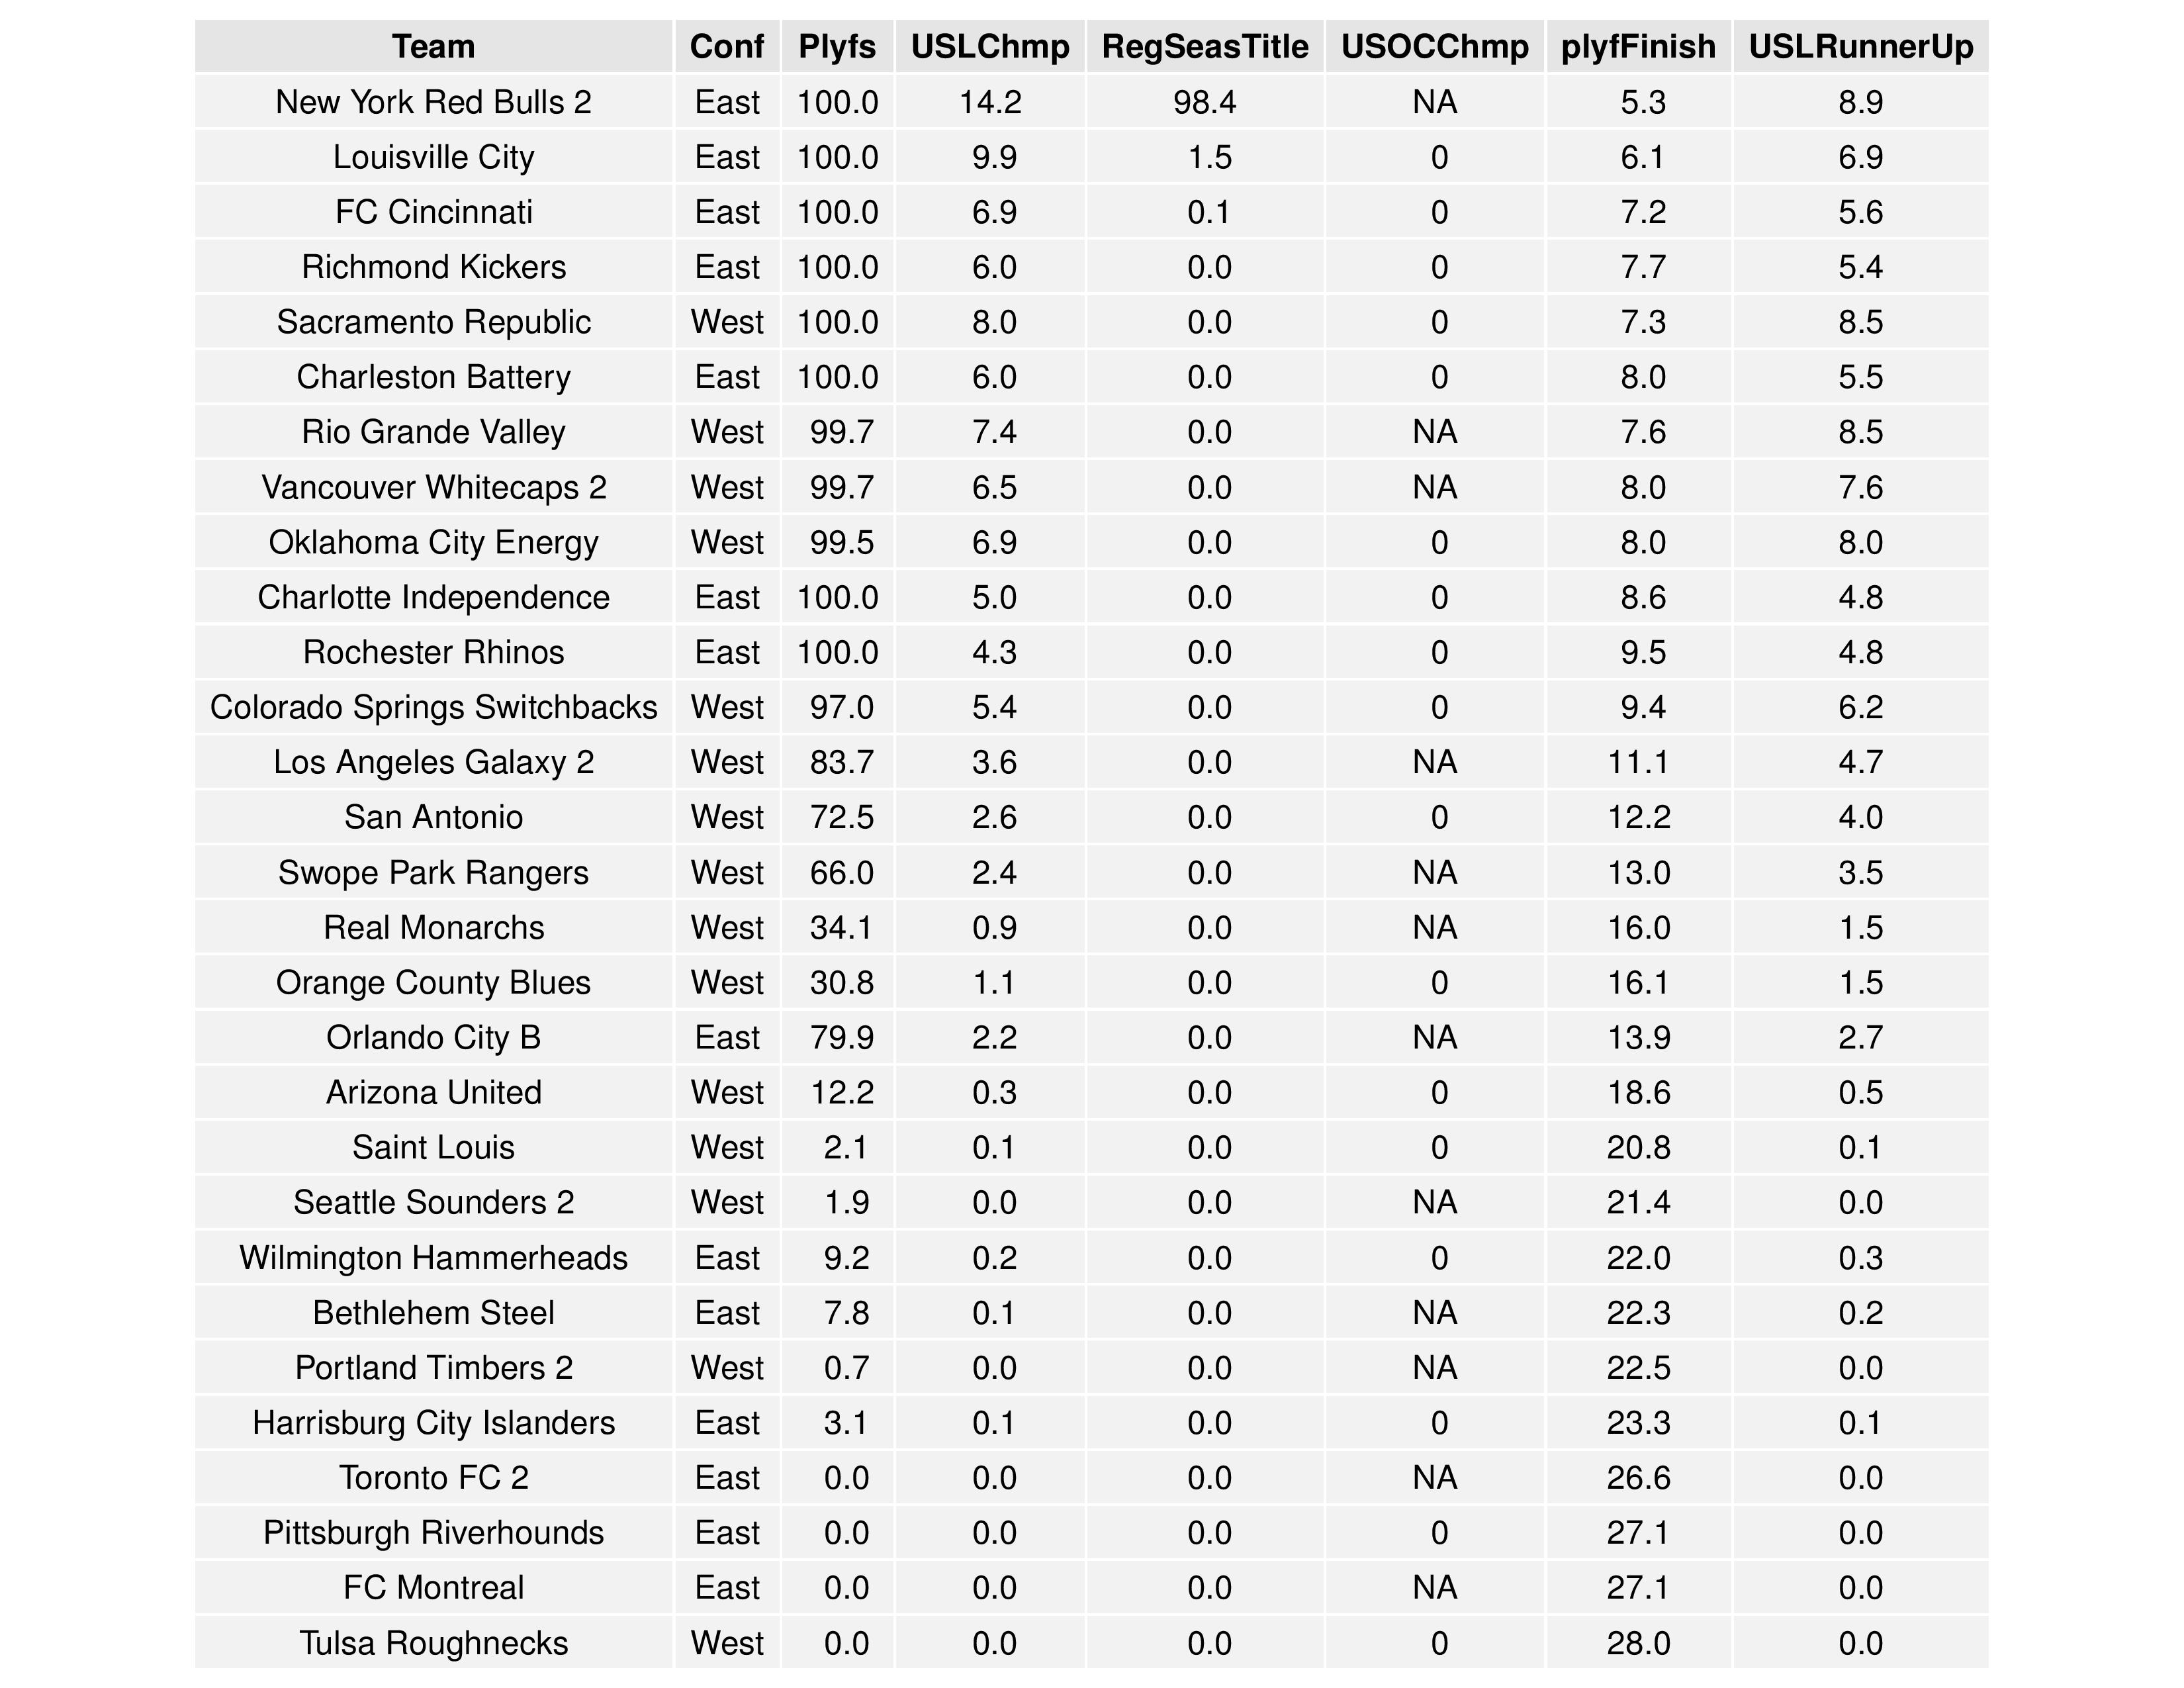
USL Projections
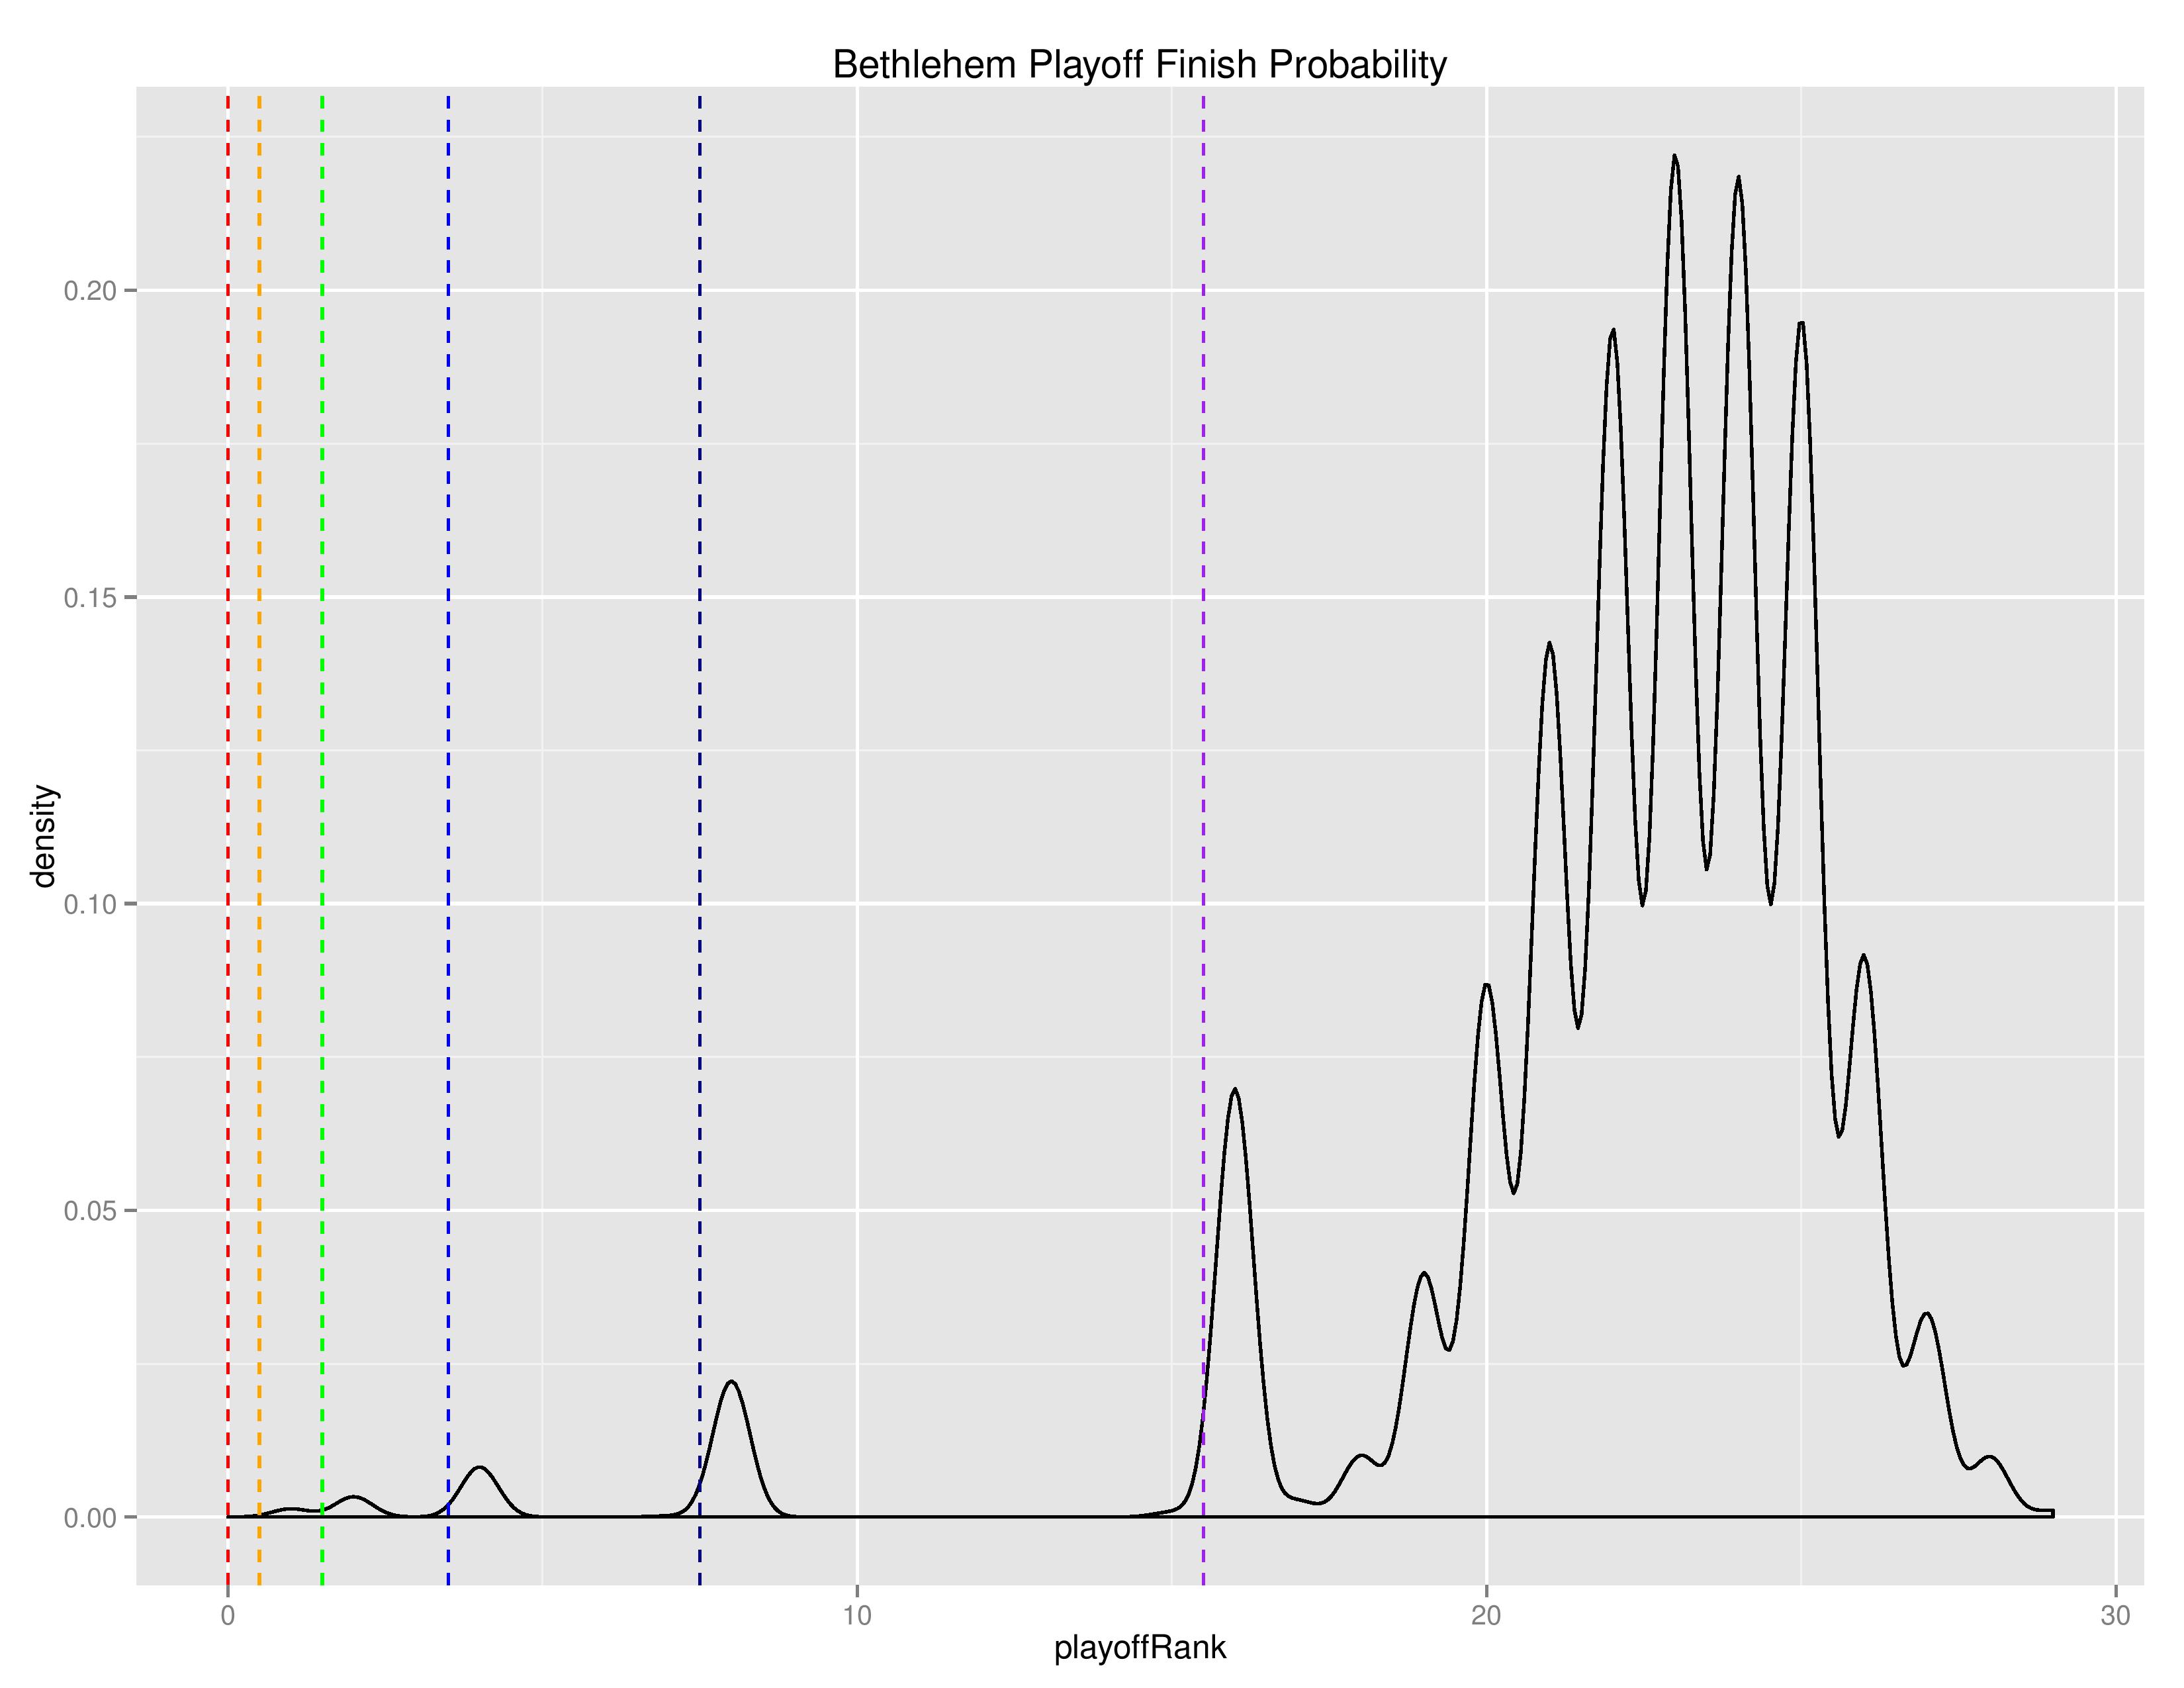
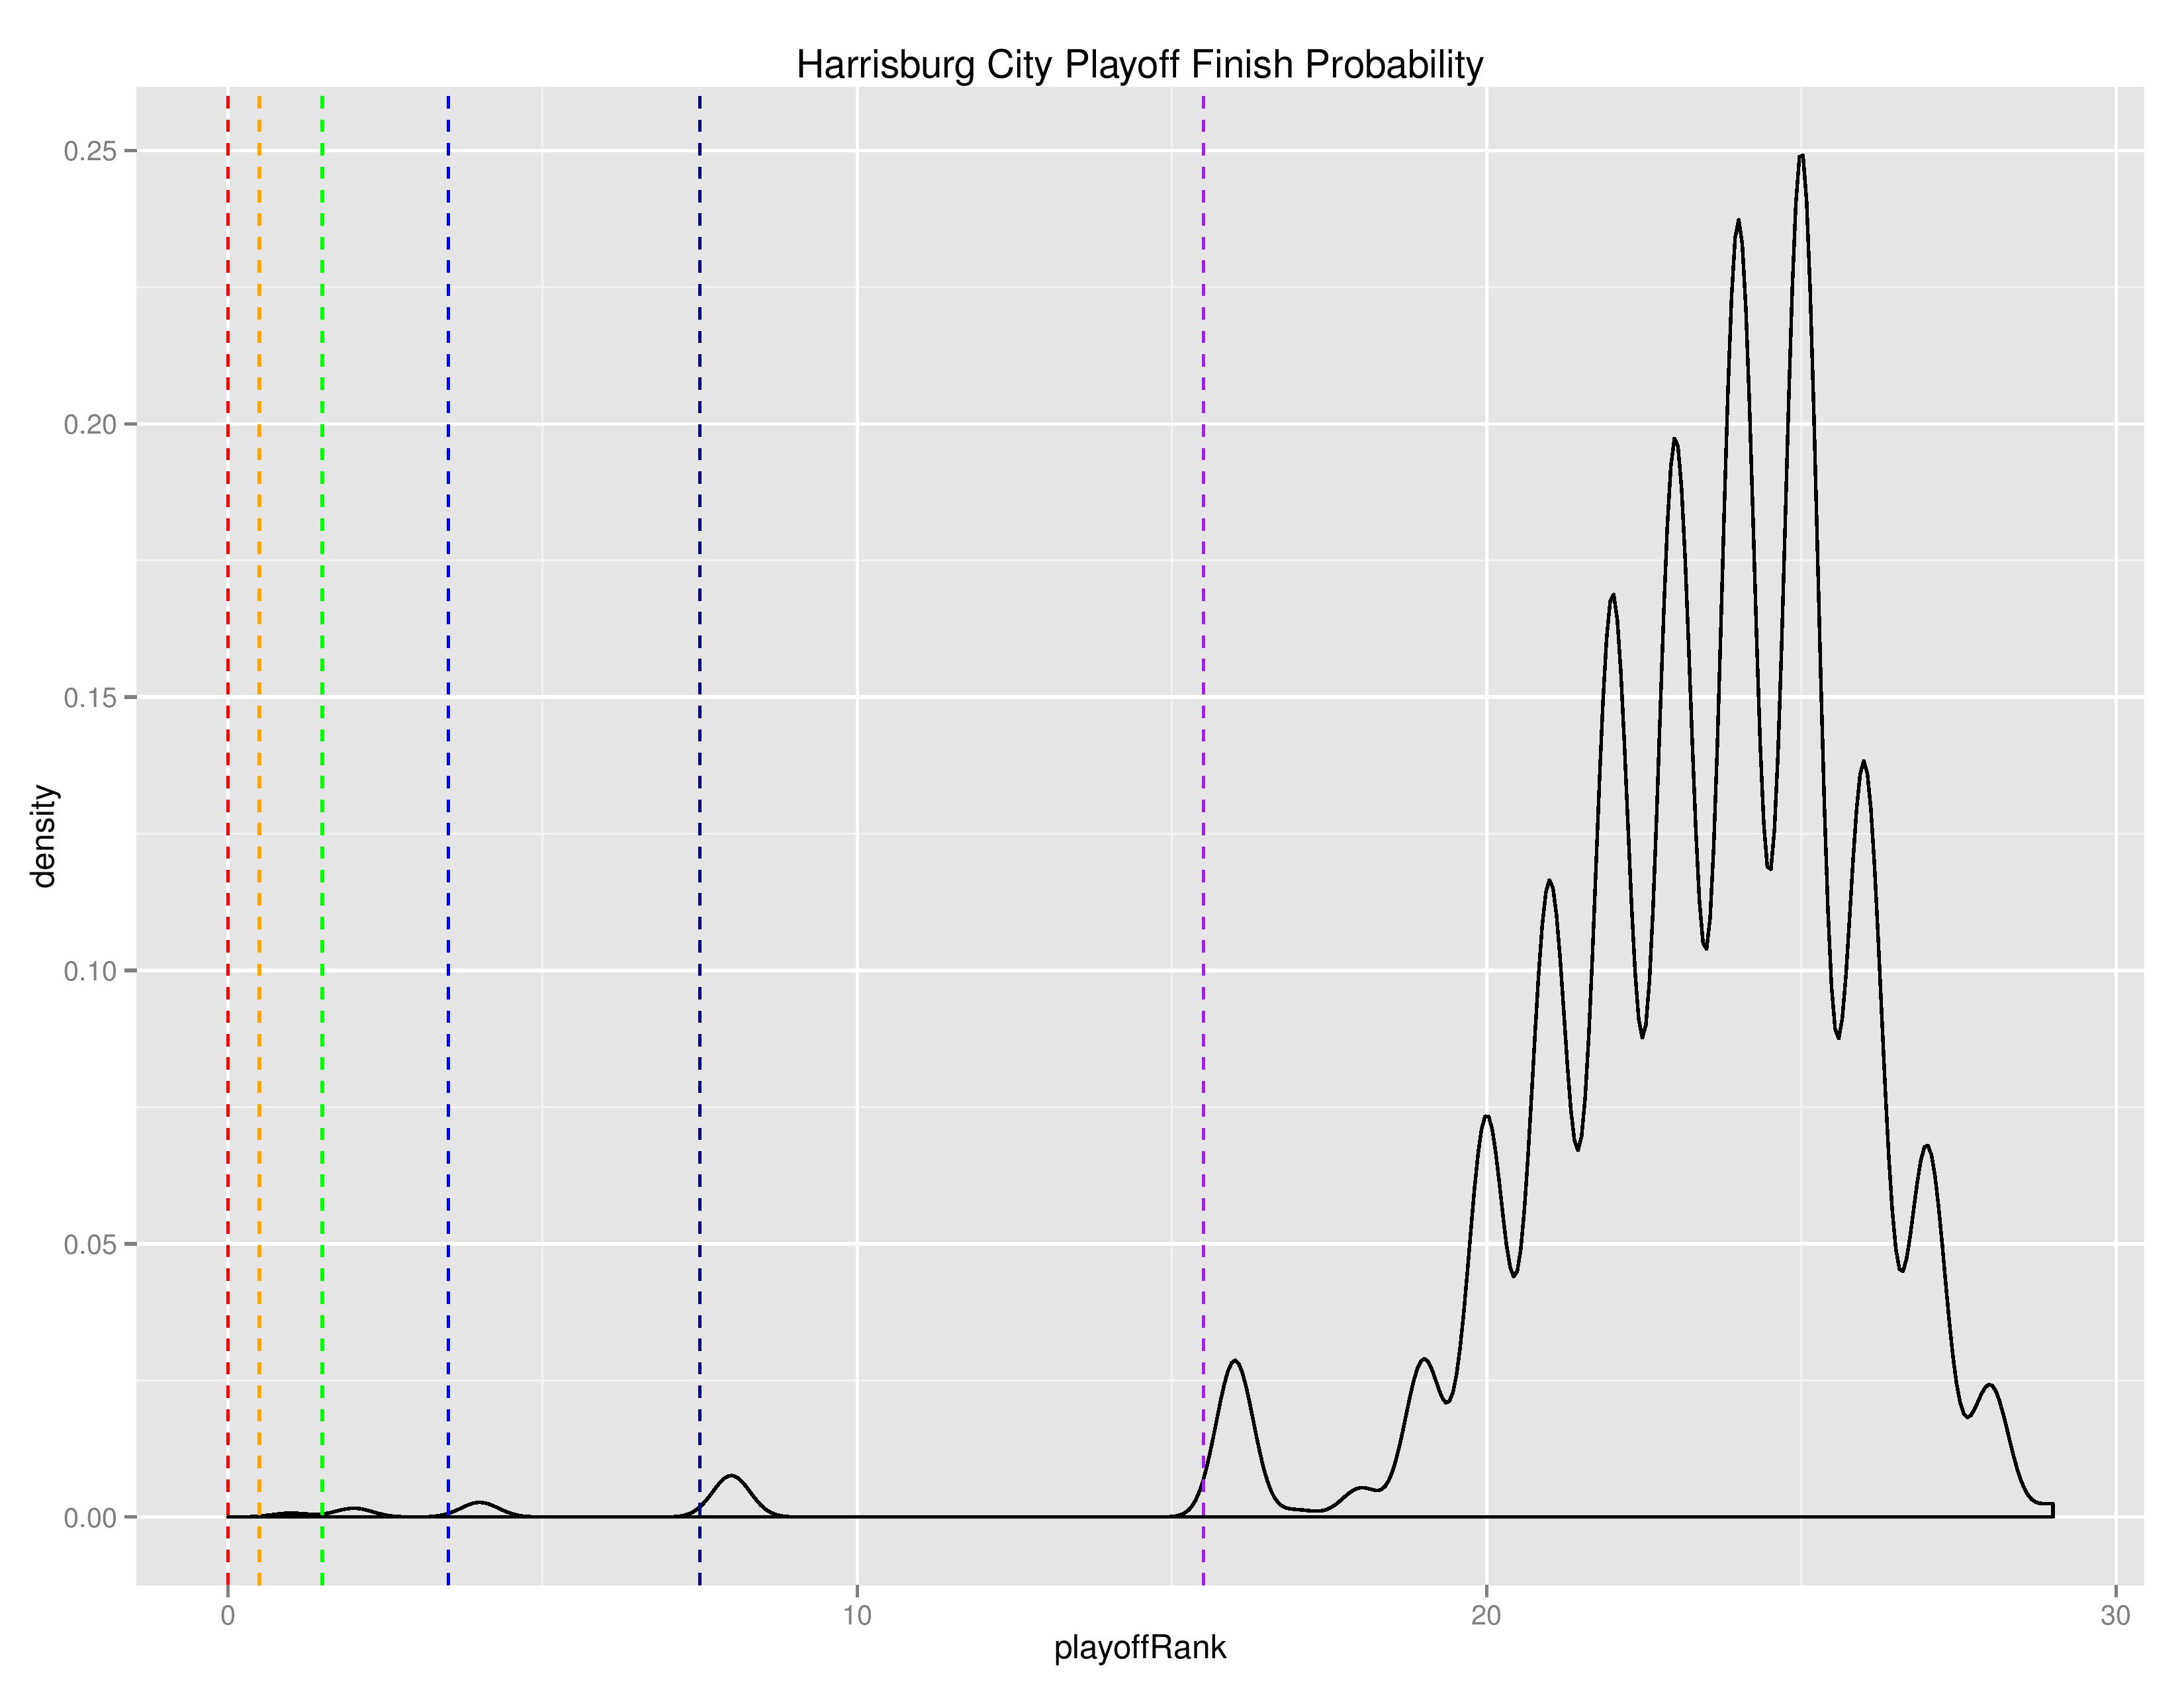
Bethlehem remained at 24th and the Harrisburg City Islanders also remained at 22nd. USLSoccer.com‘s top 10 rankings do not include either team.
Bethlehem’s probability of making the playoffs continues to decline from 8.9% to 7.8%. Harrisburg City’s increased to 1.5% from 3.1%.
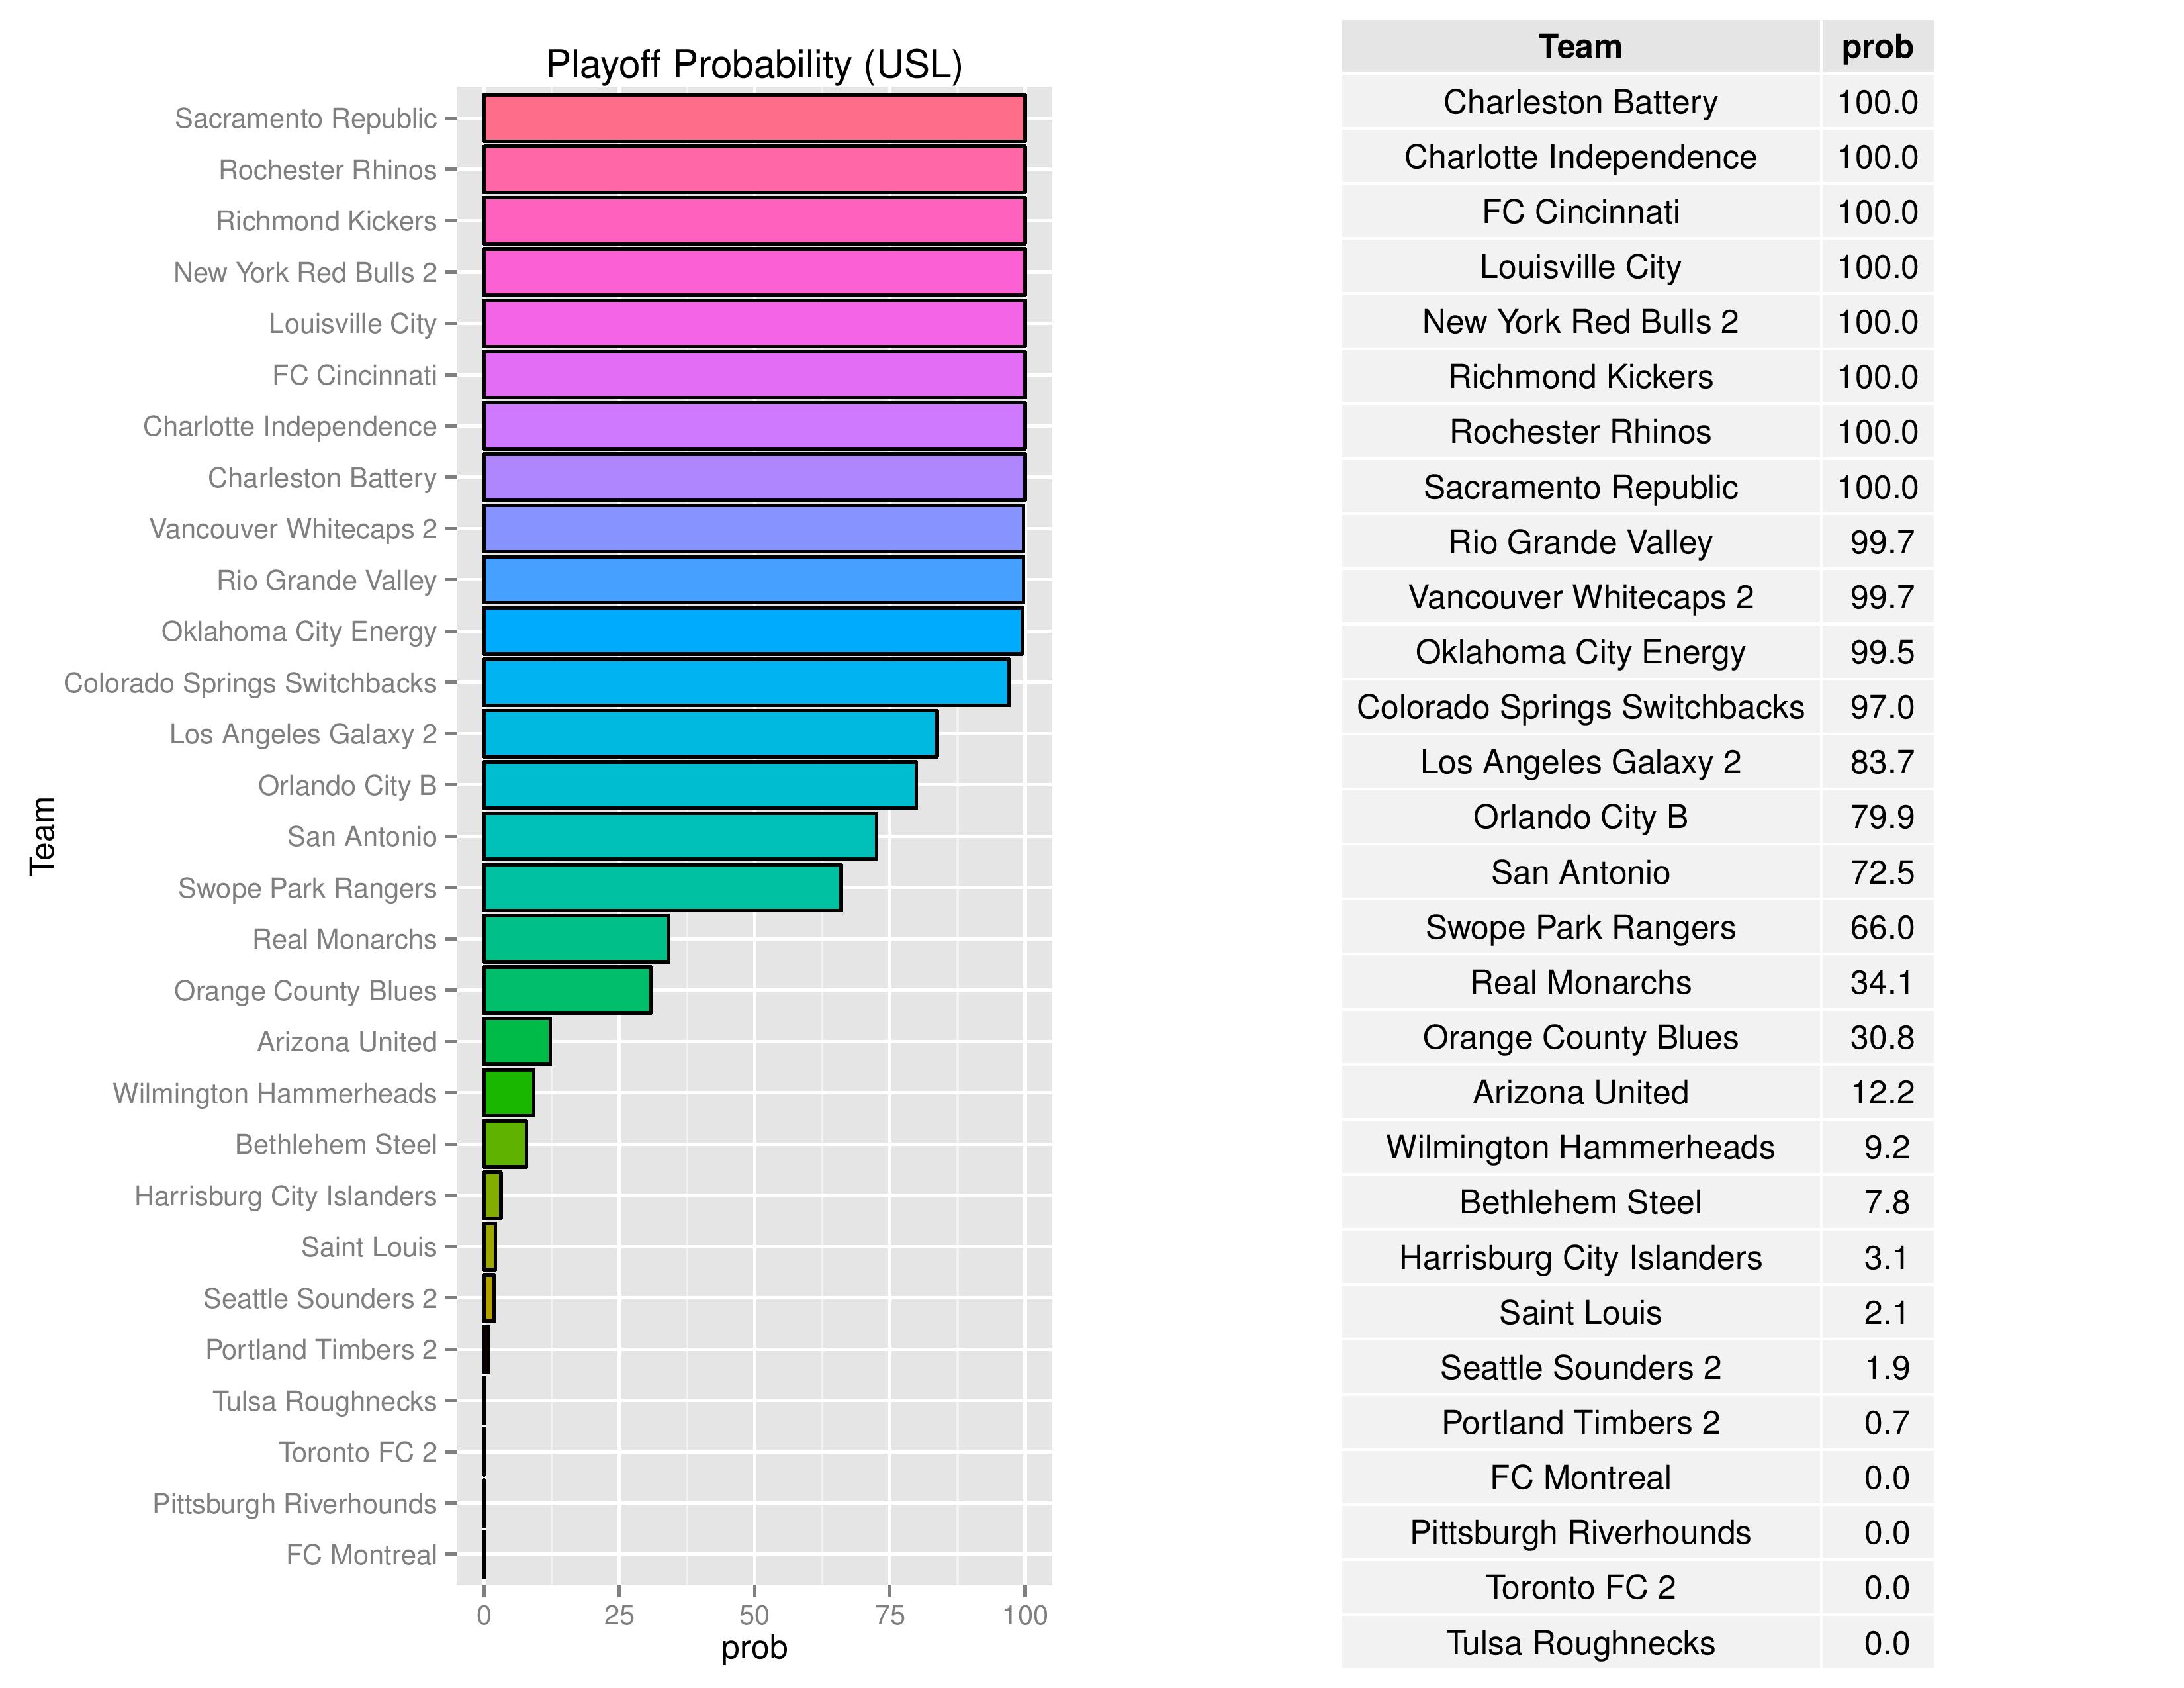
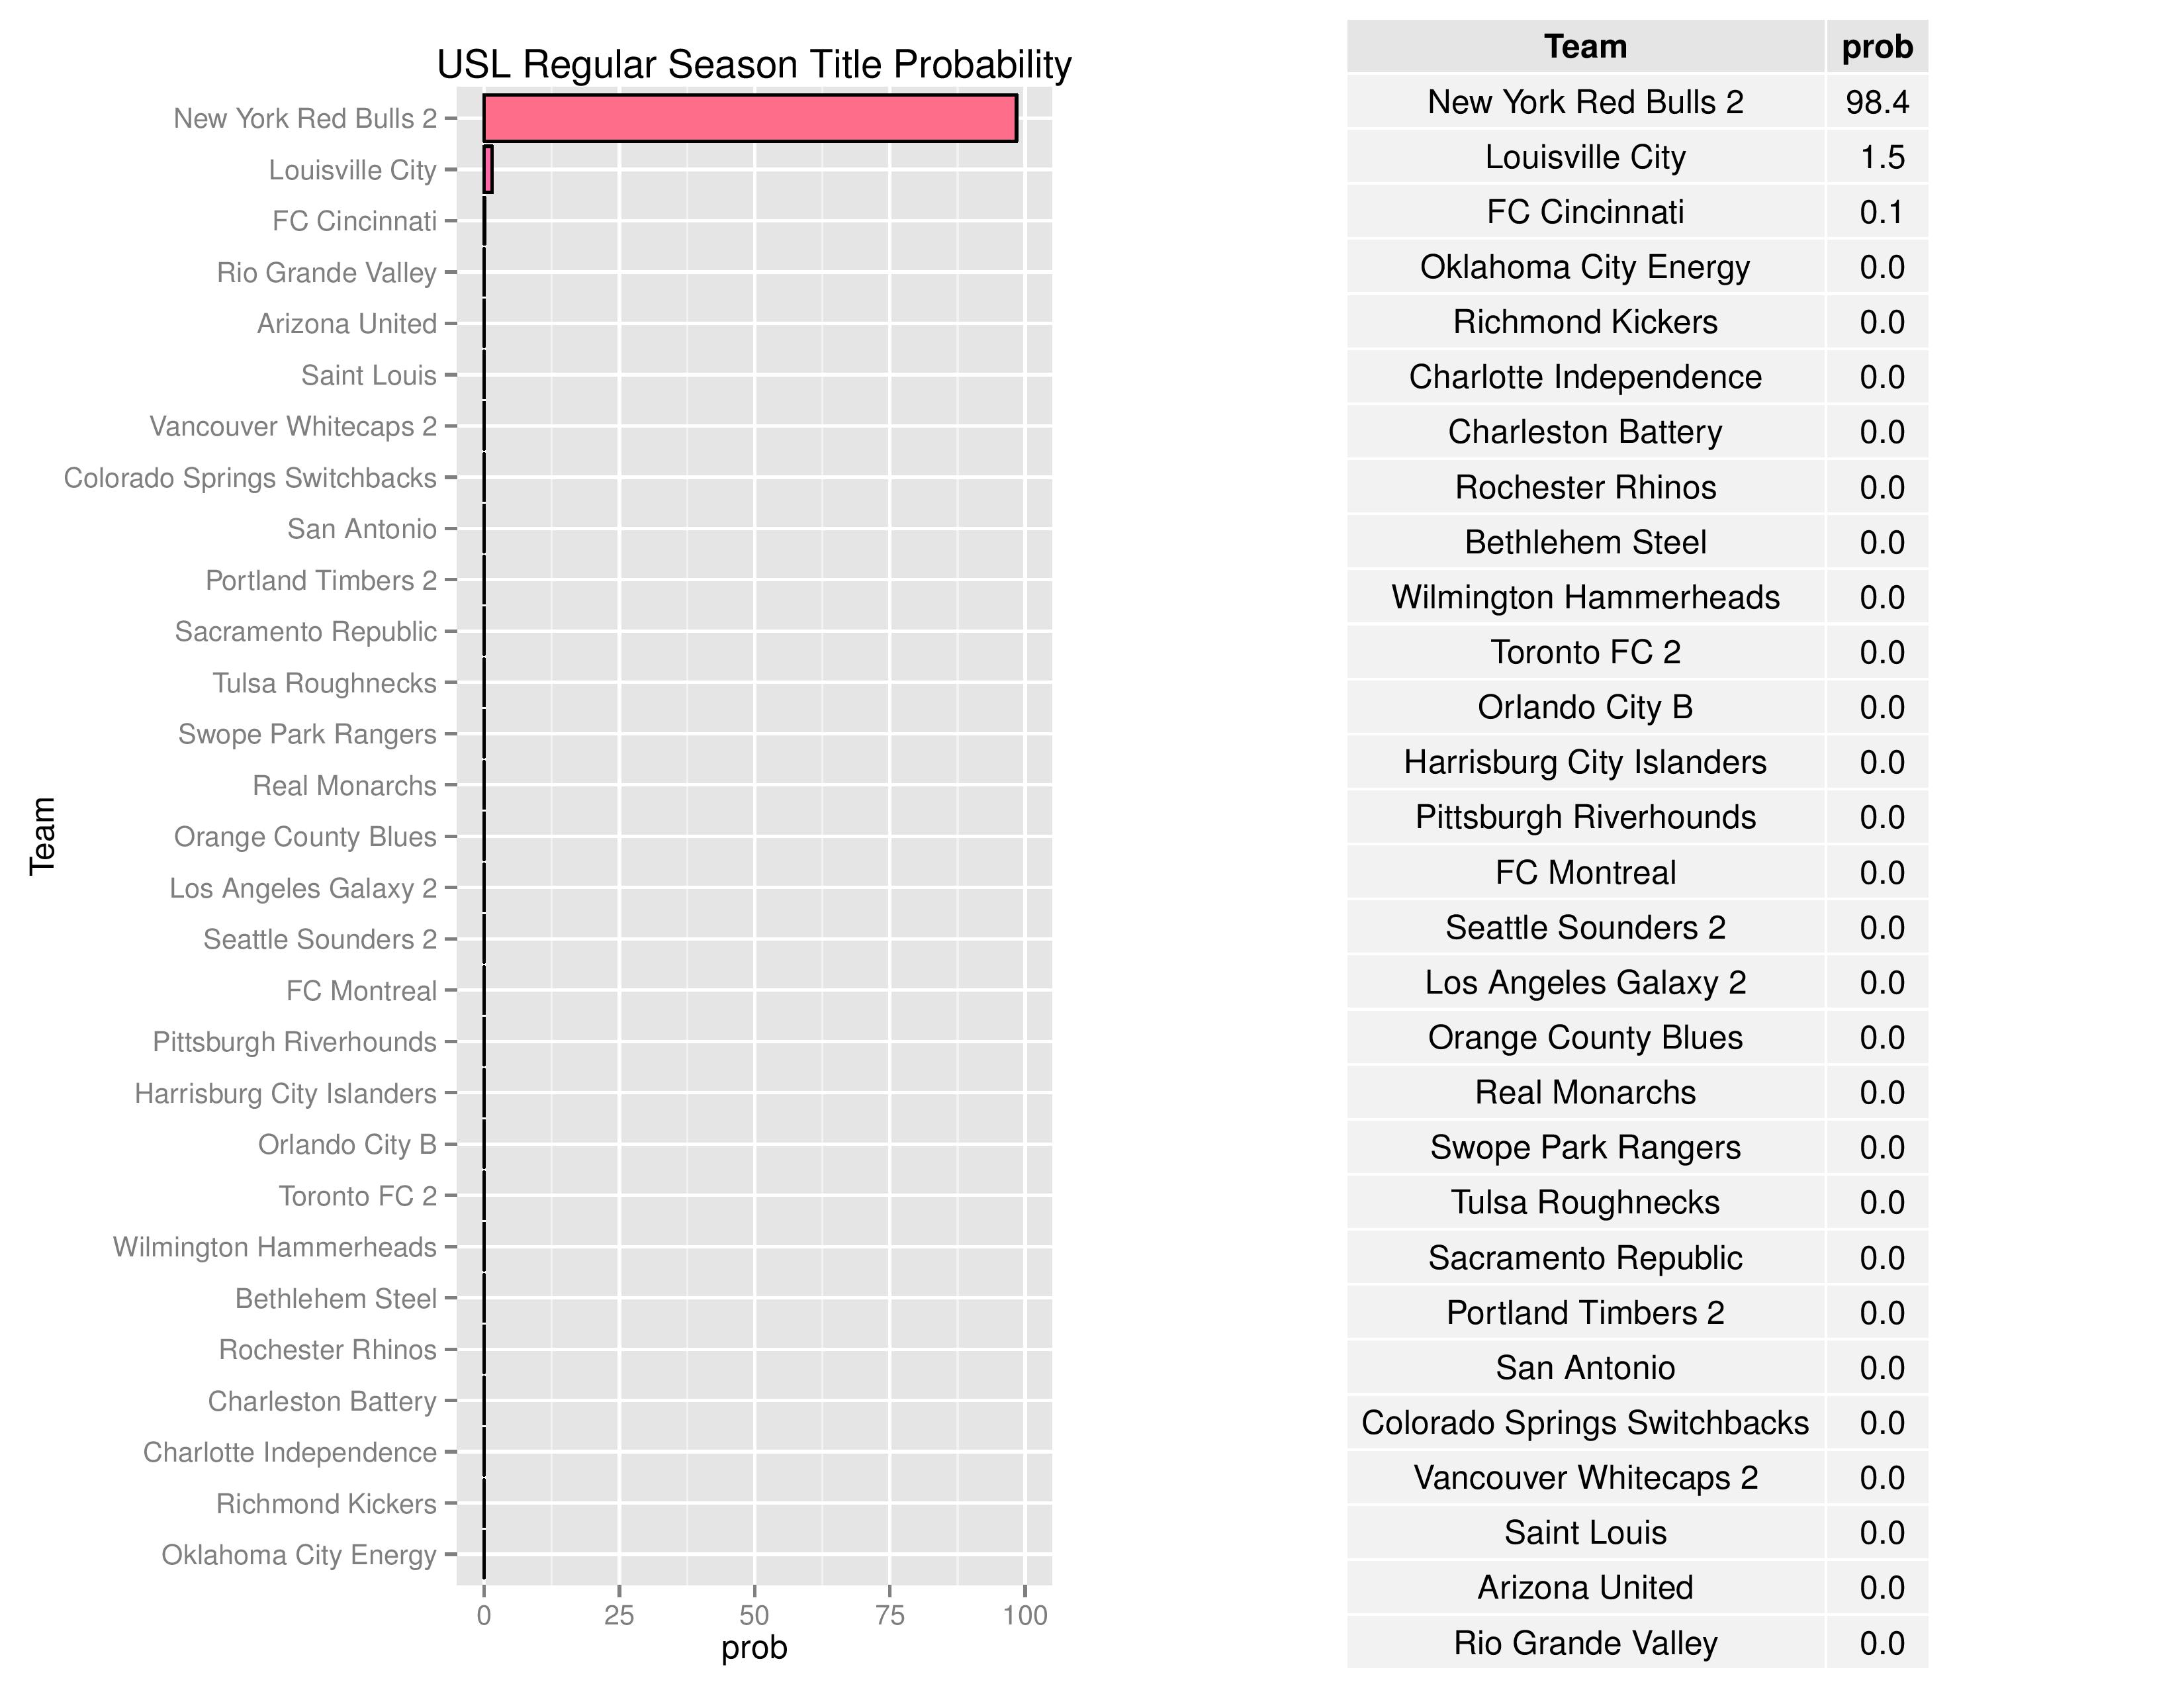
Both Bethlehem and Harrisburg City have no chance of winning the USL regular season title. NYRB 2 has nearly locked it up.
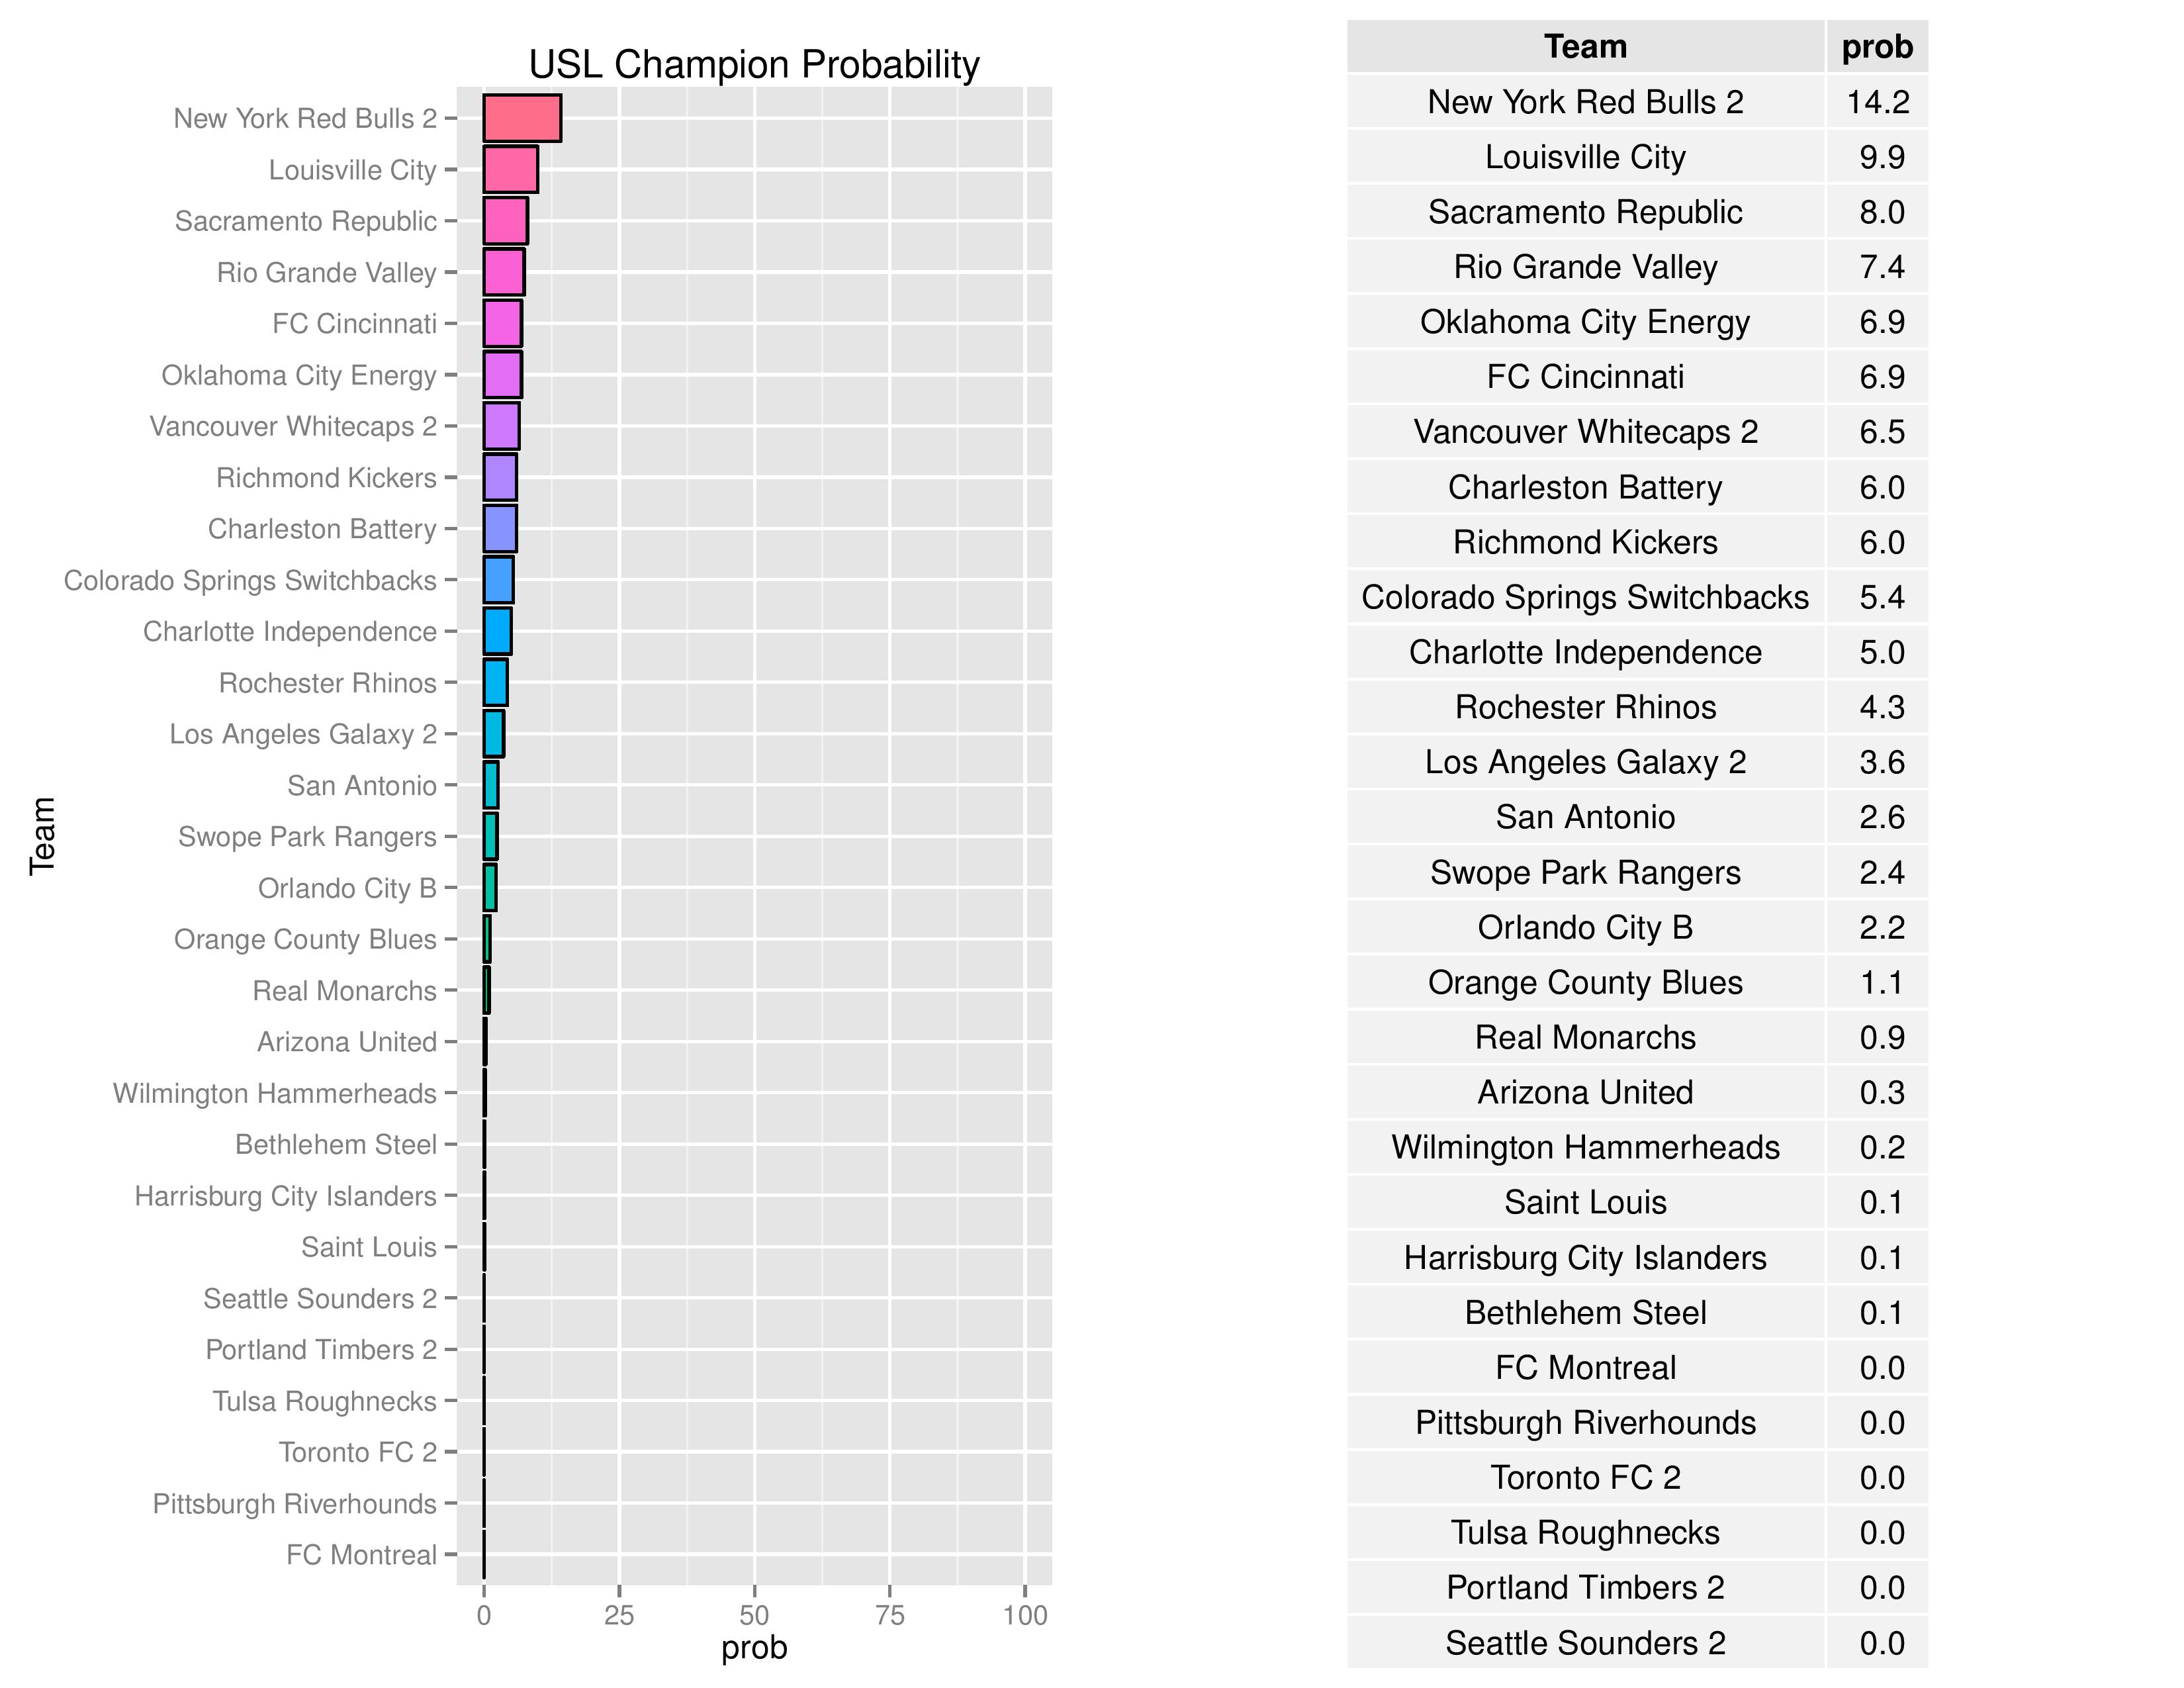
Bethlehem’s probability of winning the USL Championship decreased from 0.2% to 0.1%. Harrisburg City’s chances remained at 0.1%.
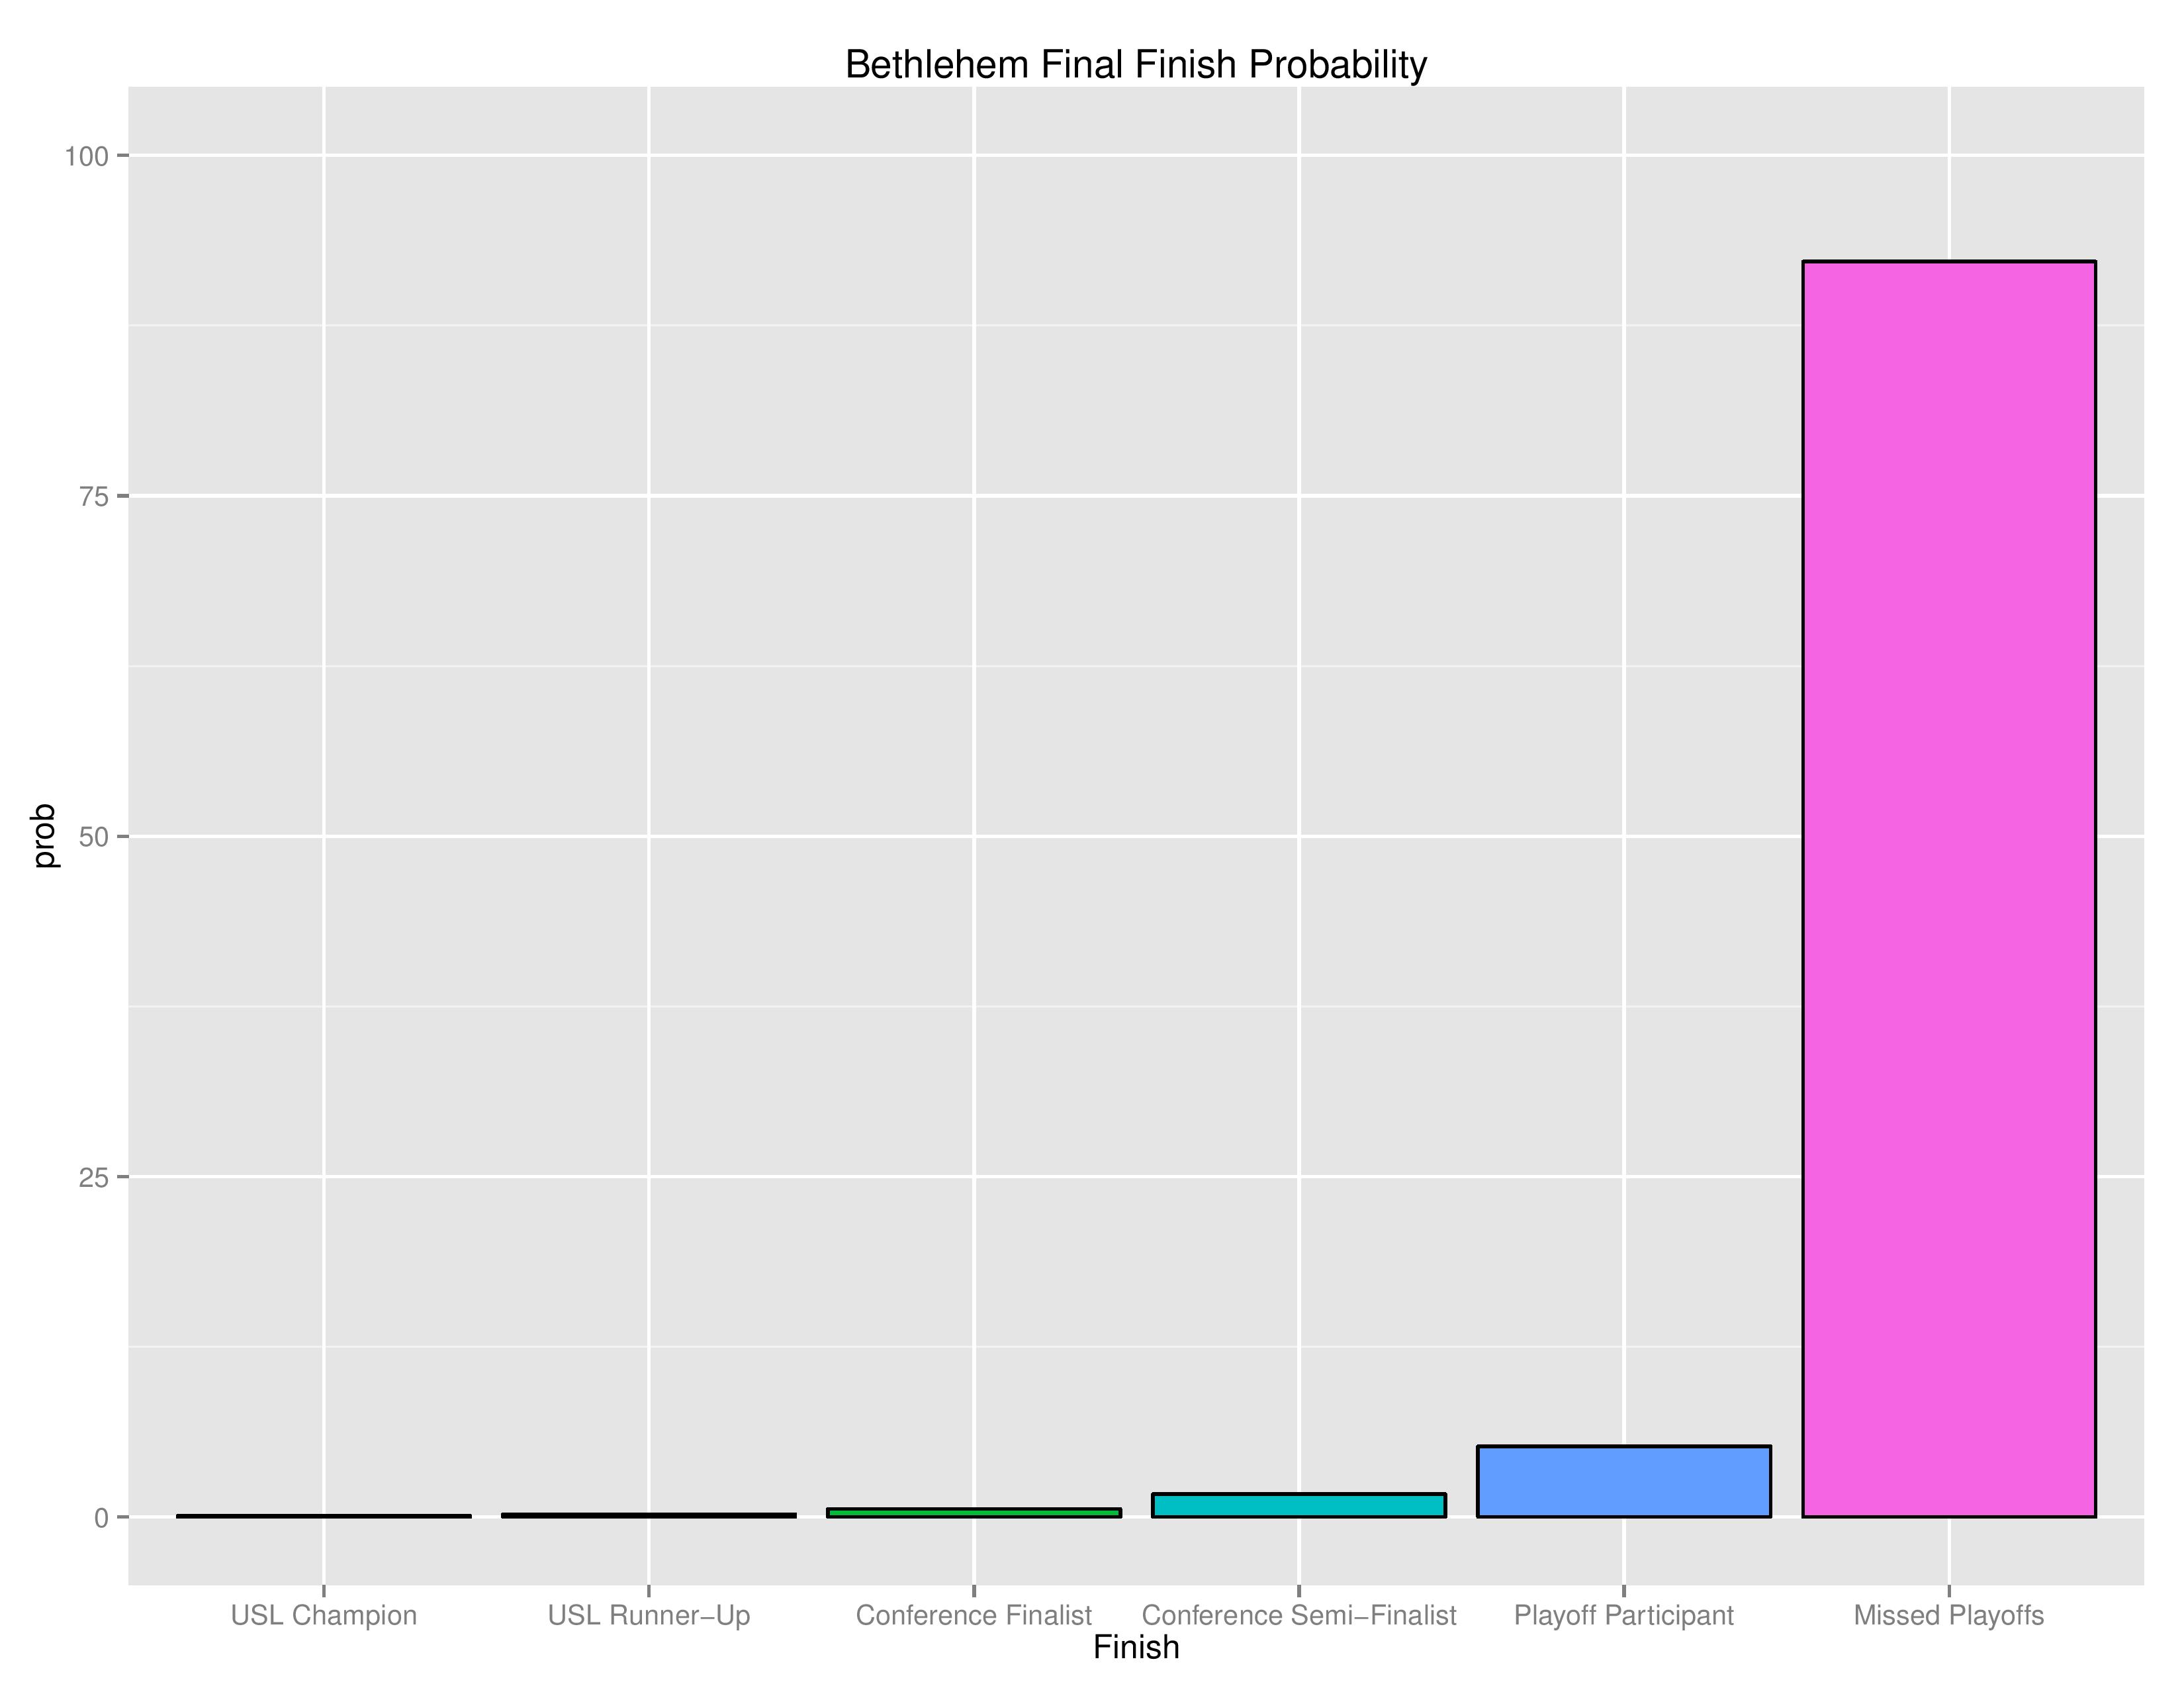
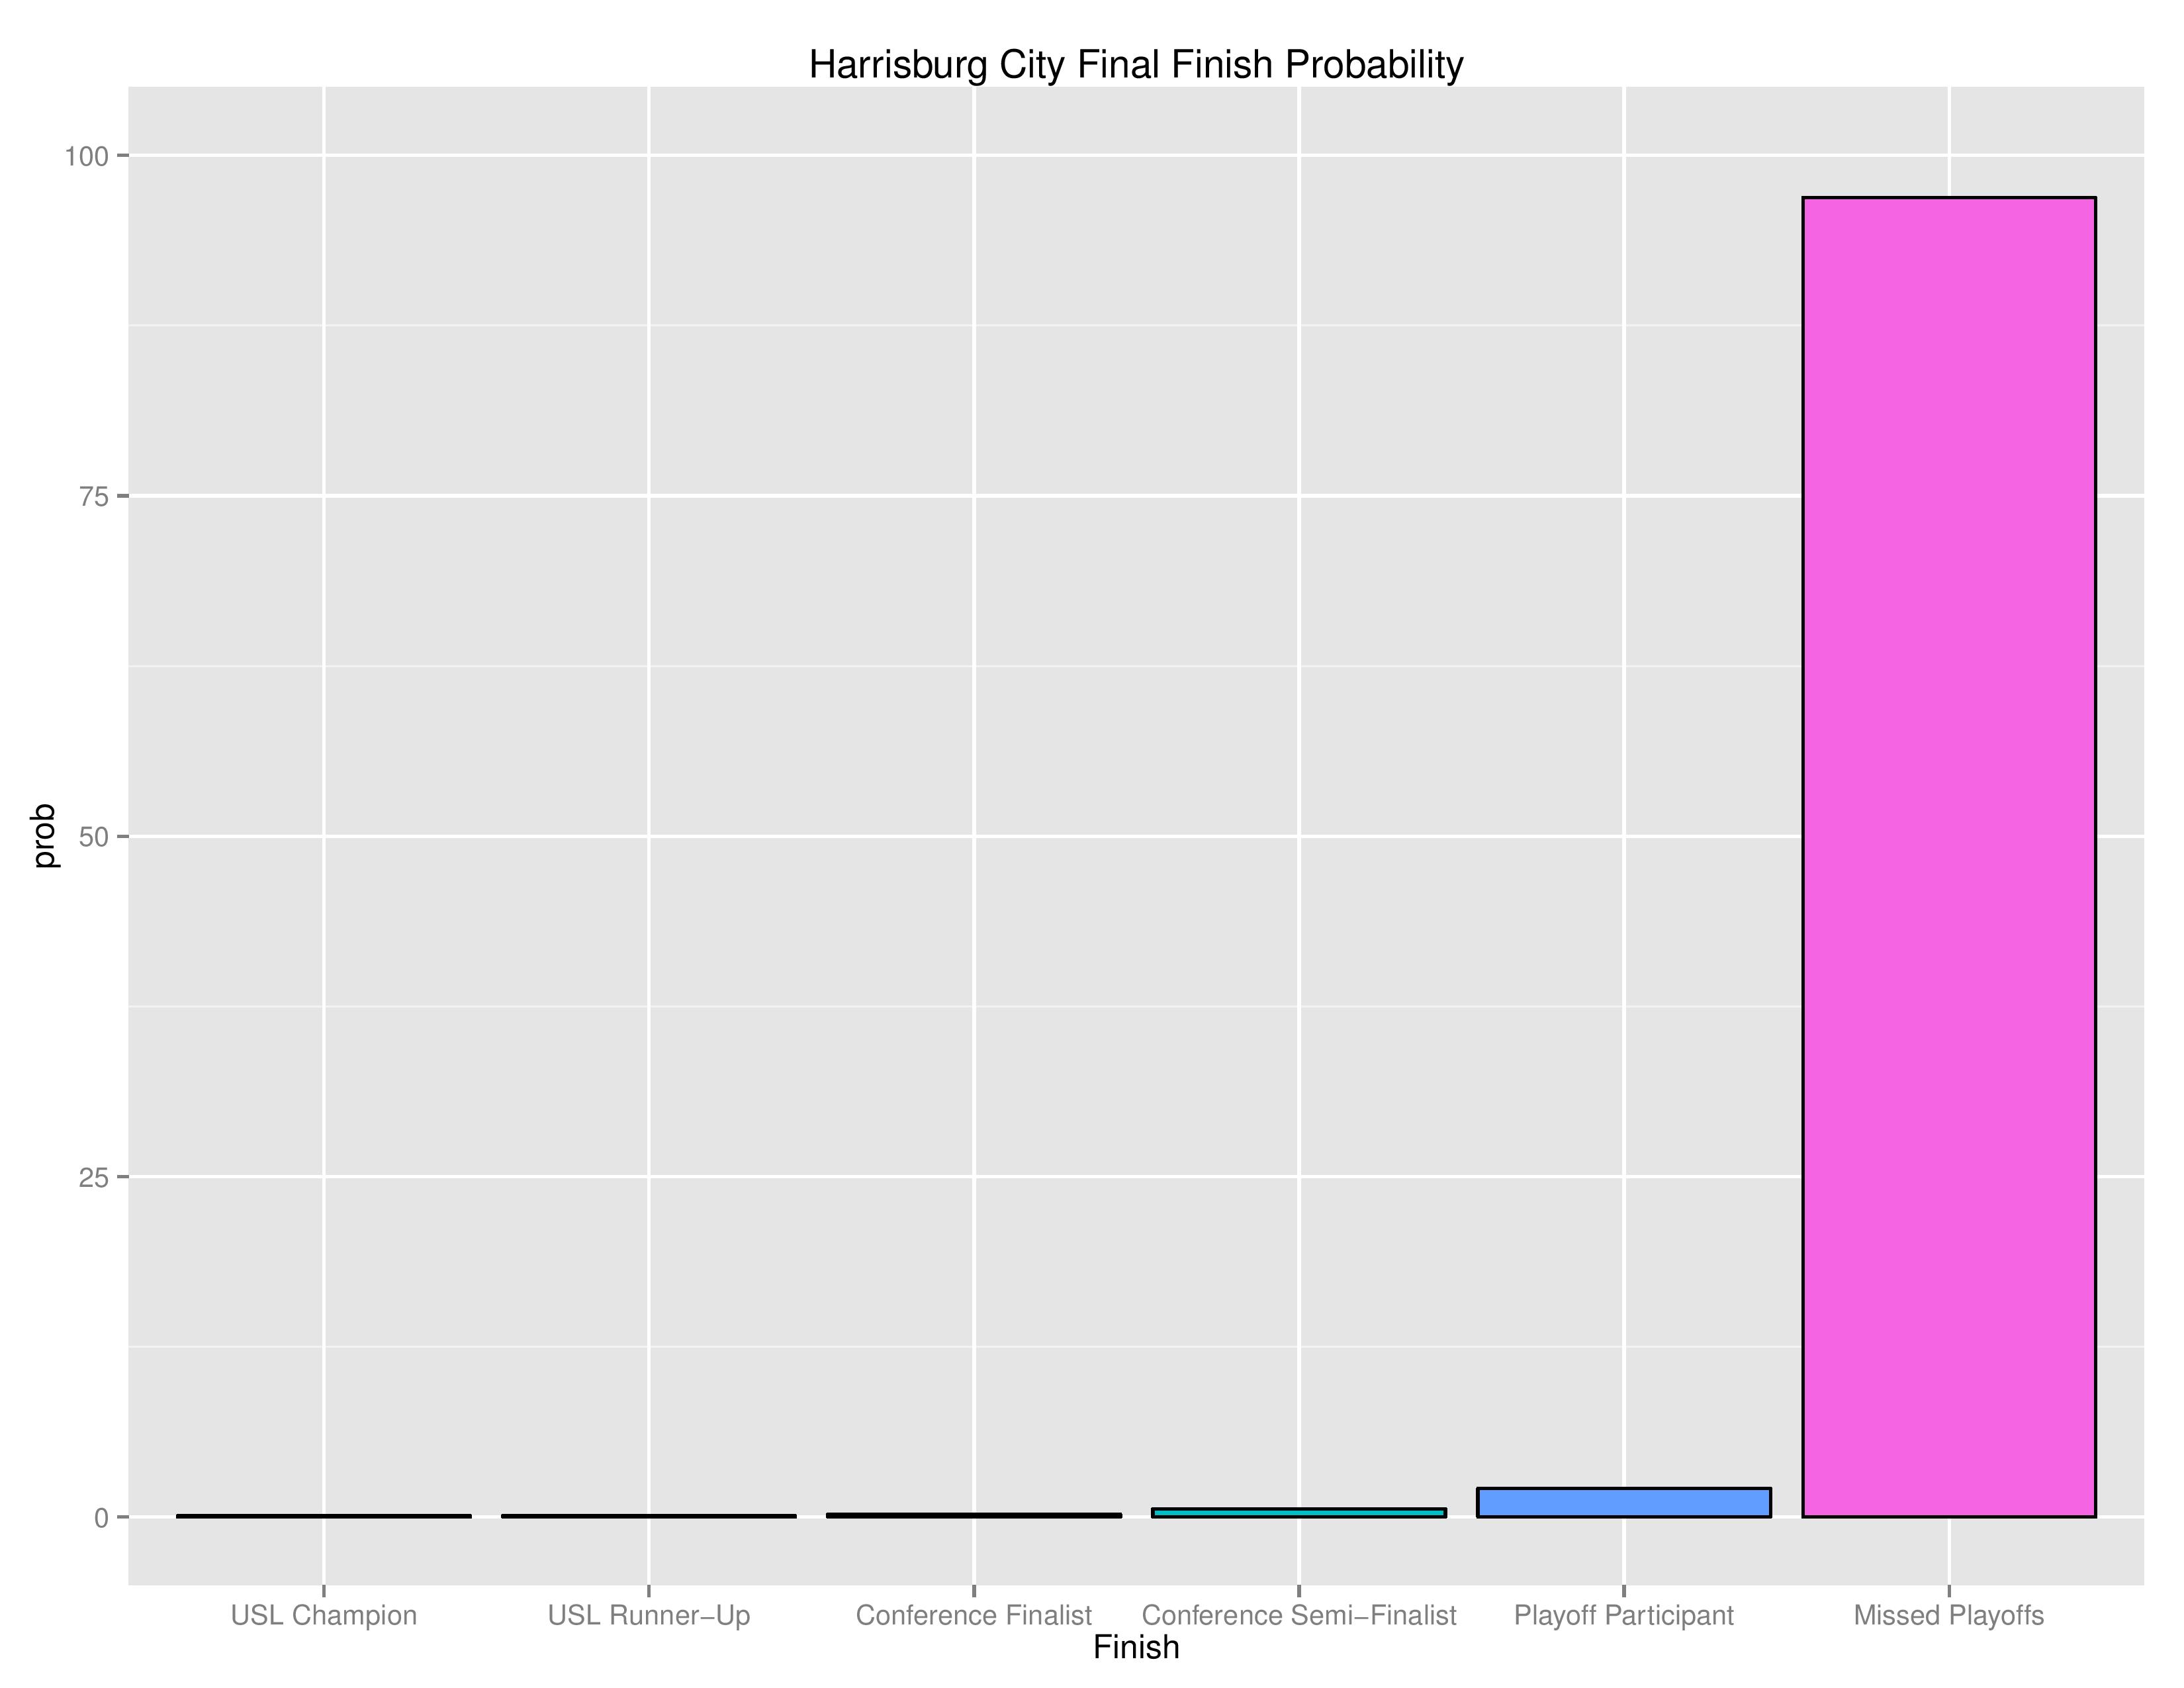
As with MLS, the below density charts show the relative probabilities of Bethlehem and Harrisburg finishing for their final playoff-rank.
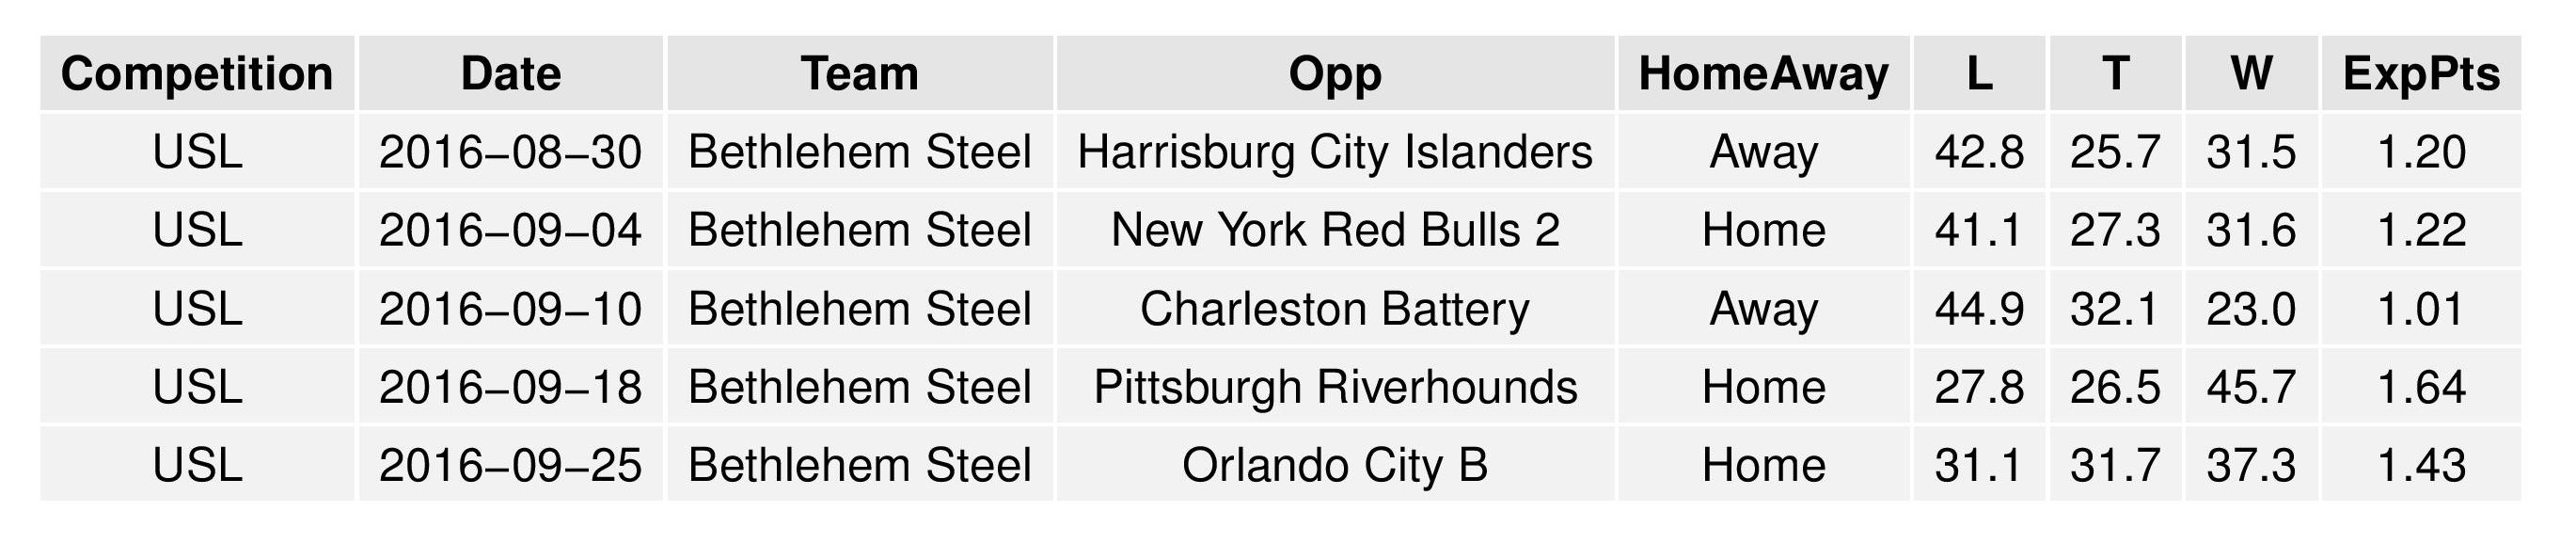
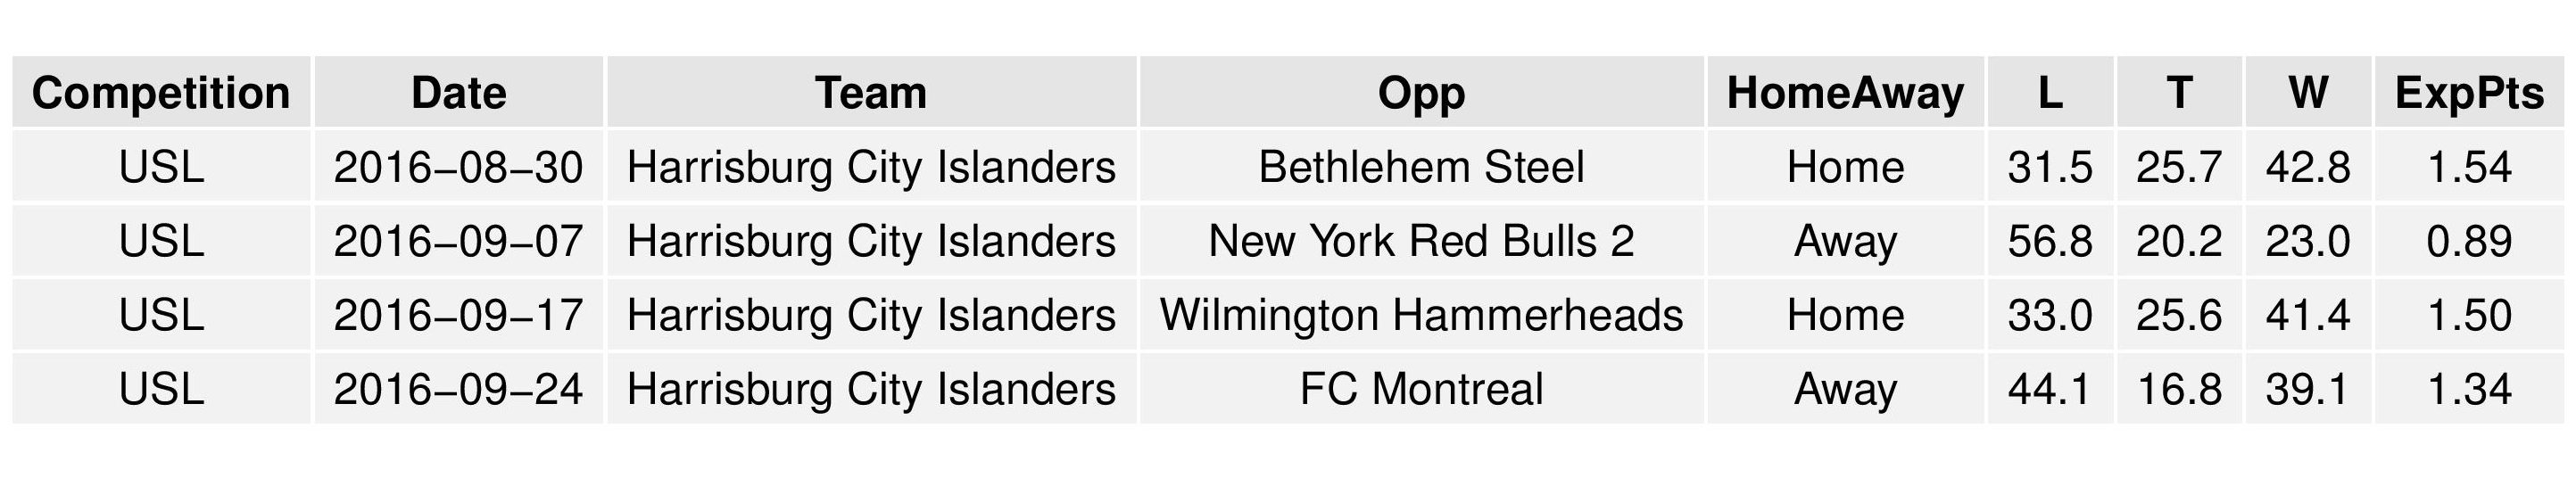
The following are the upcoming matches and associated probabilities for Bethlehem and Harrisburg City.
The following tables show the average simulation results. They are divided into two tables to present better to your screen.
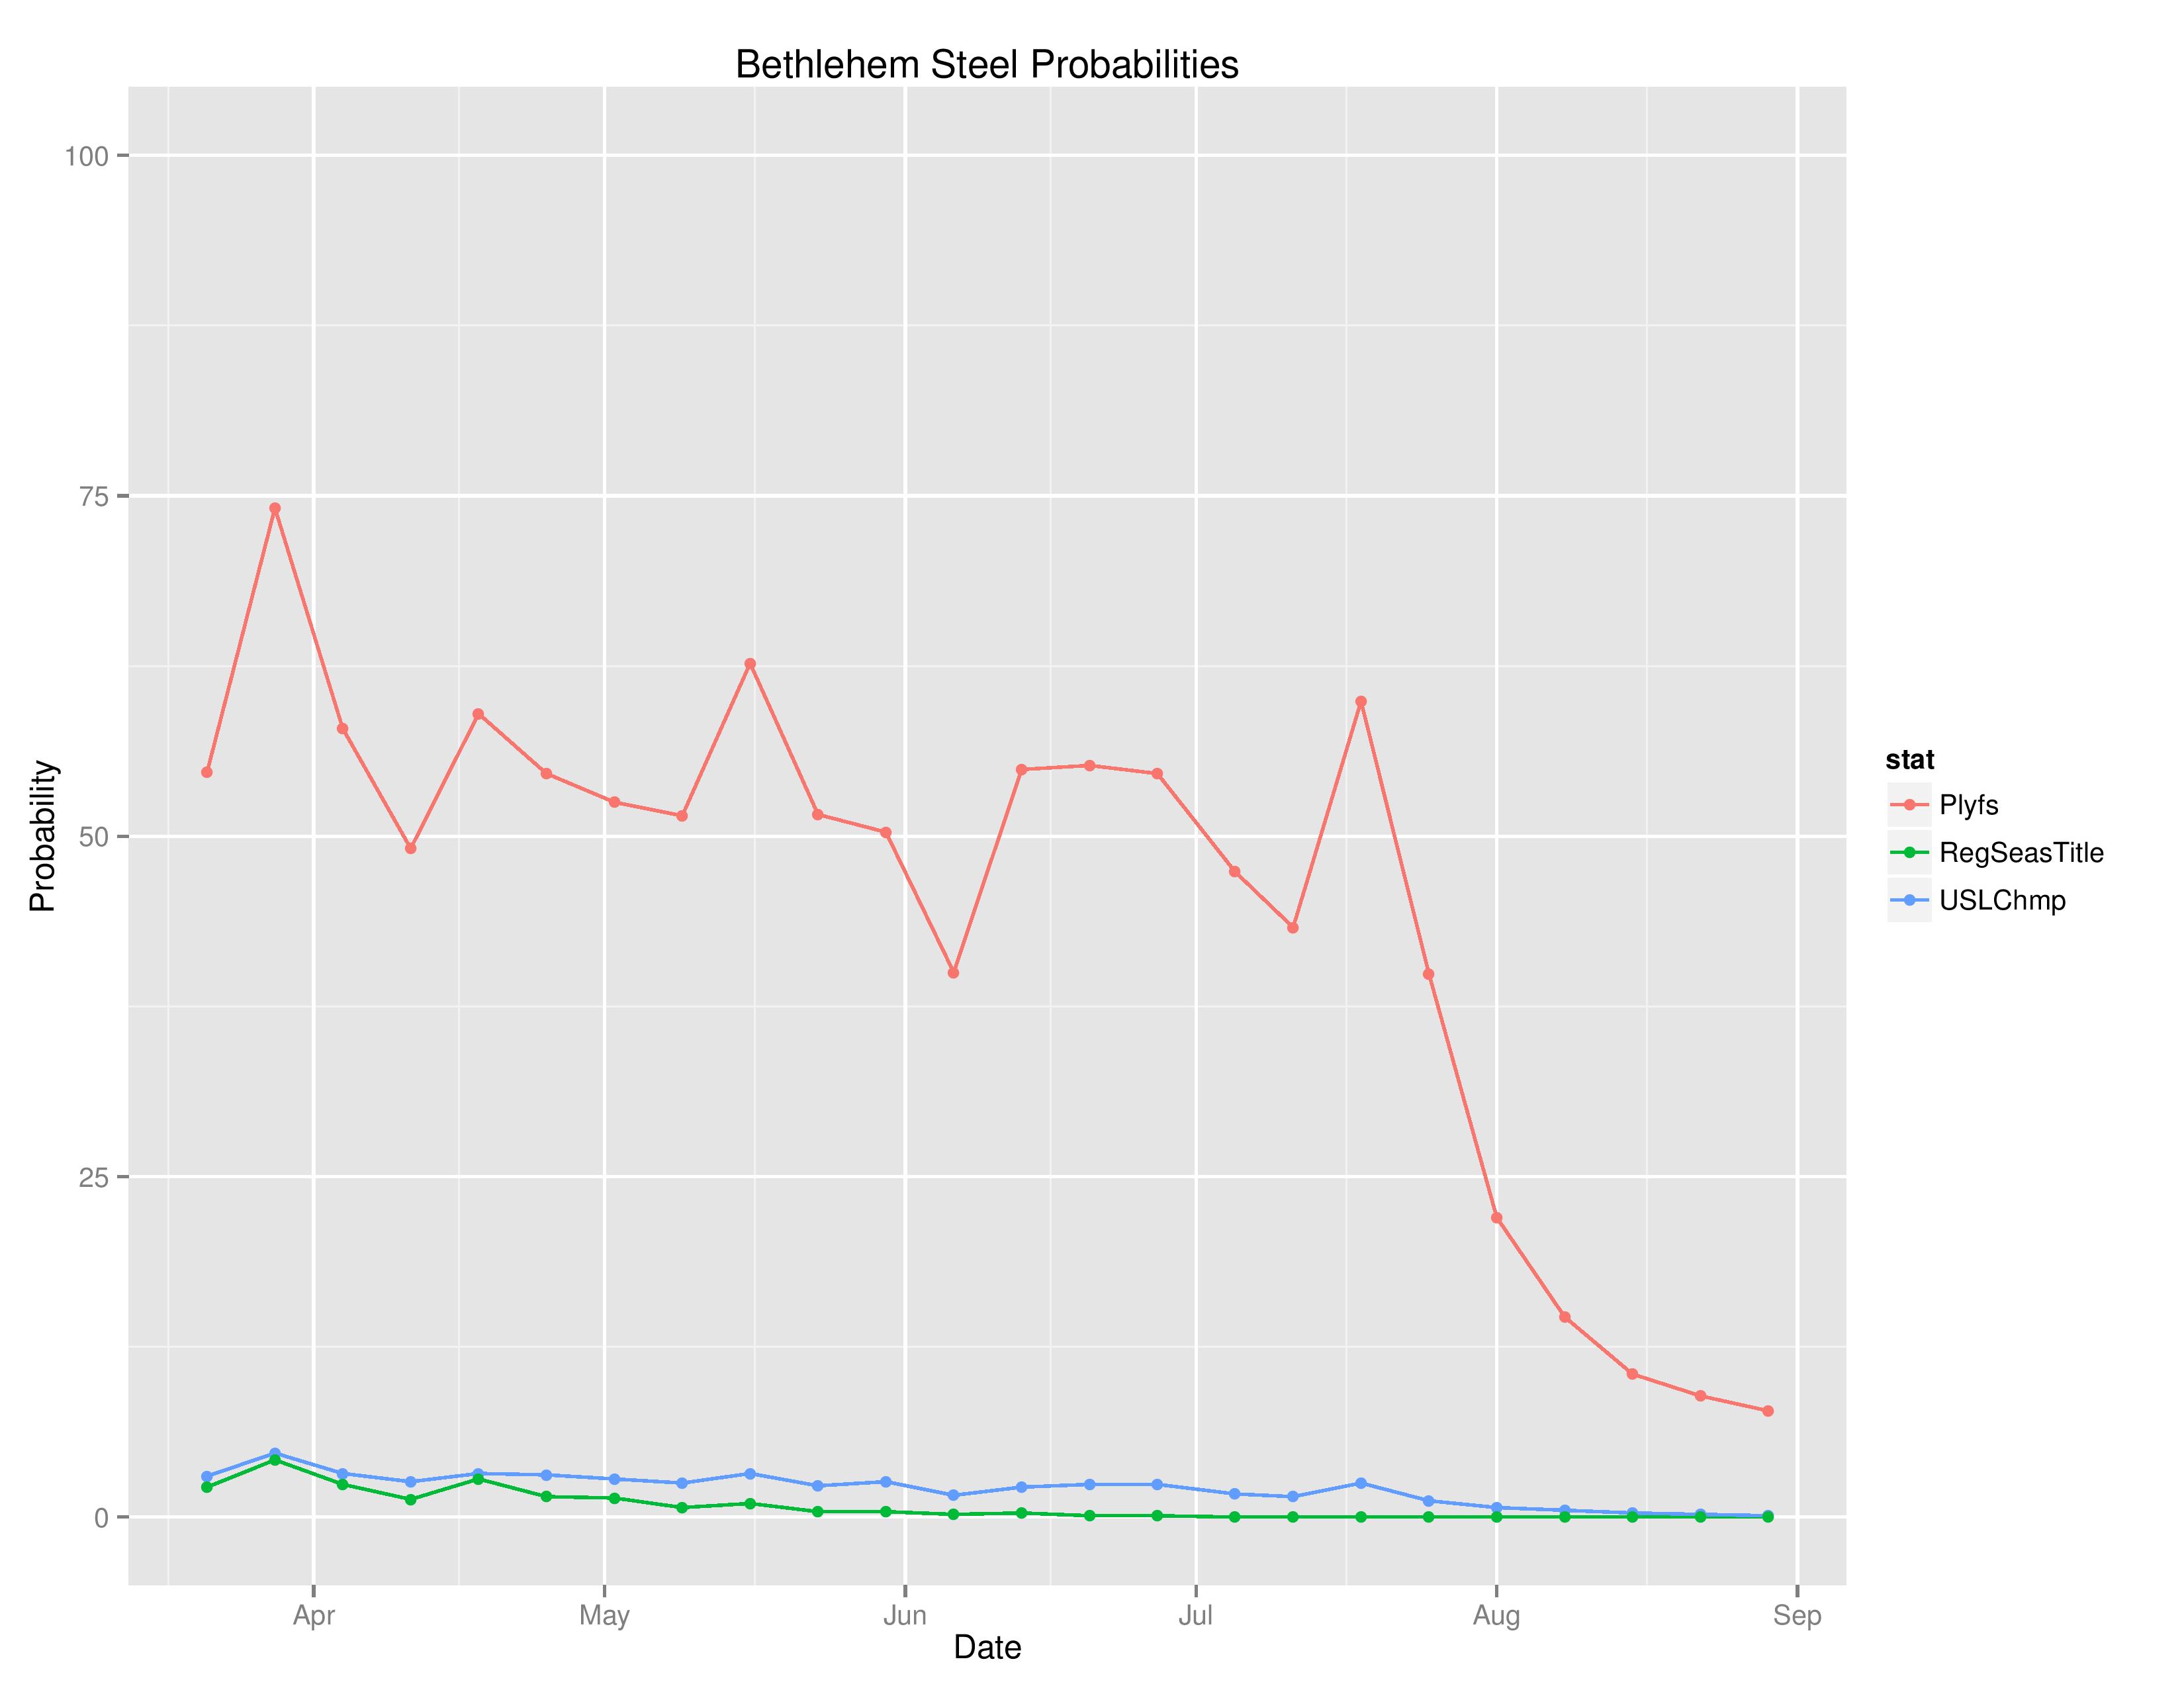
Changes over time
Below shows the probabilities of various outcomes for Bethlehem over the course of the season.
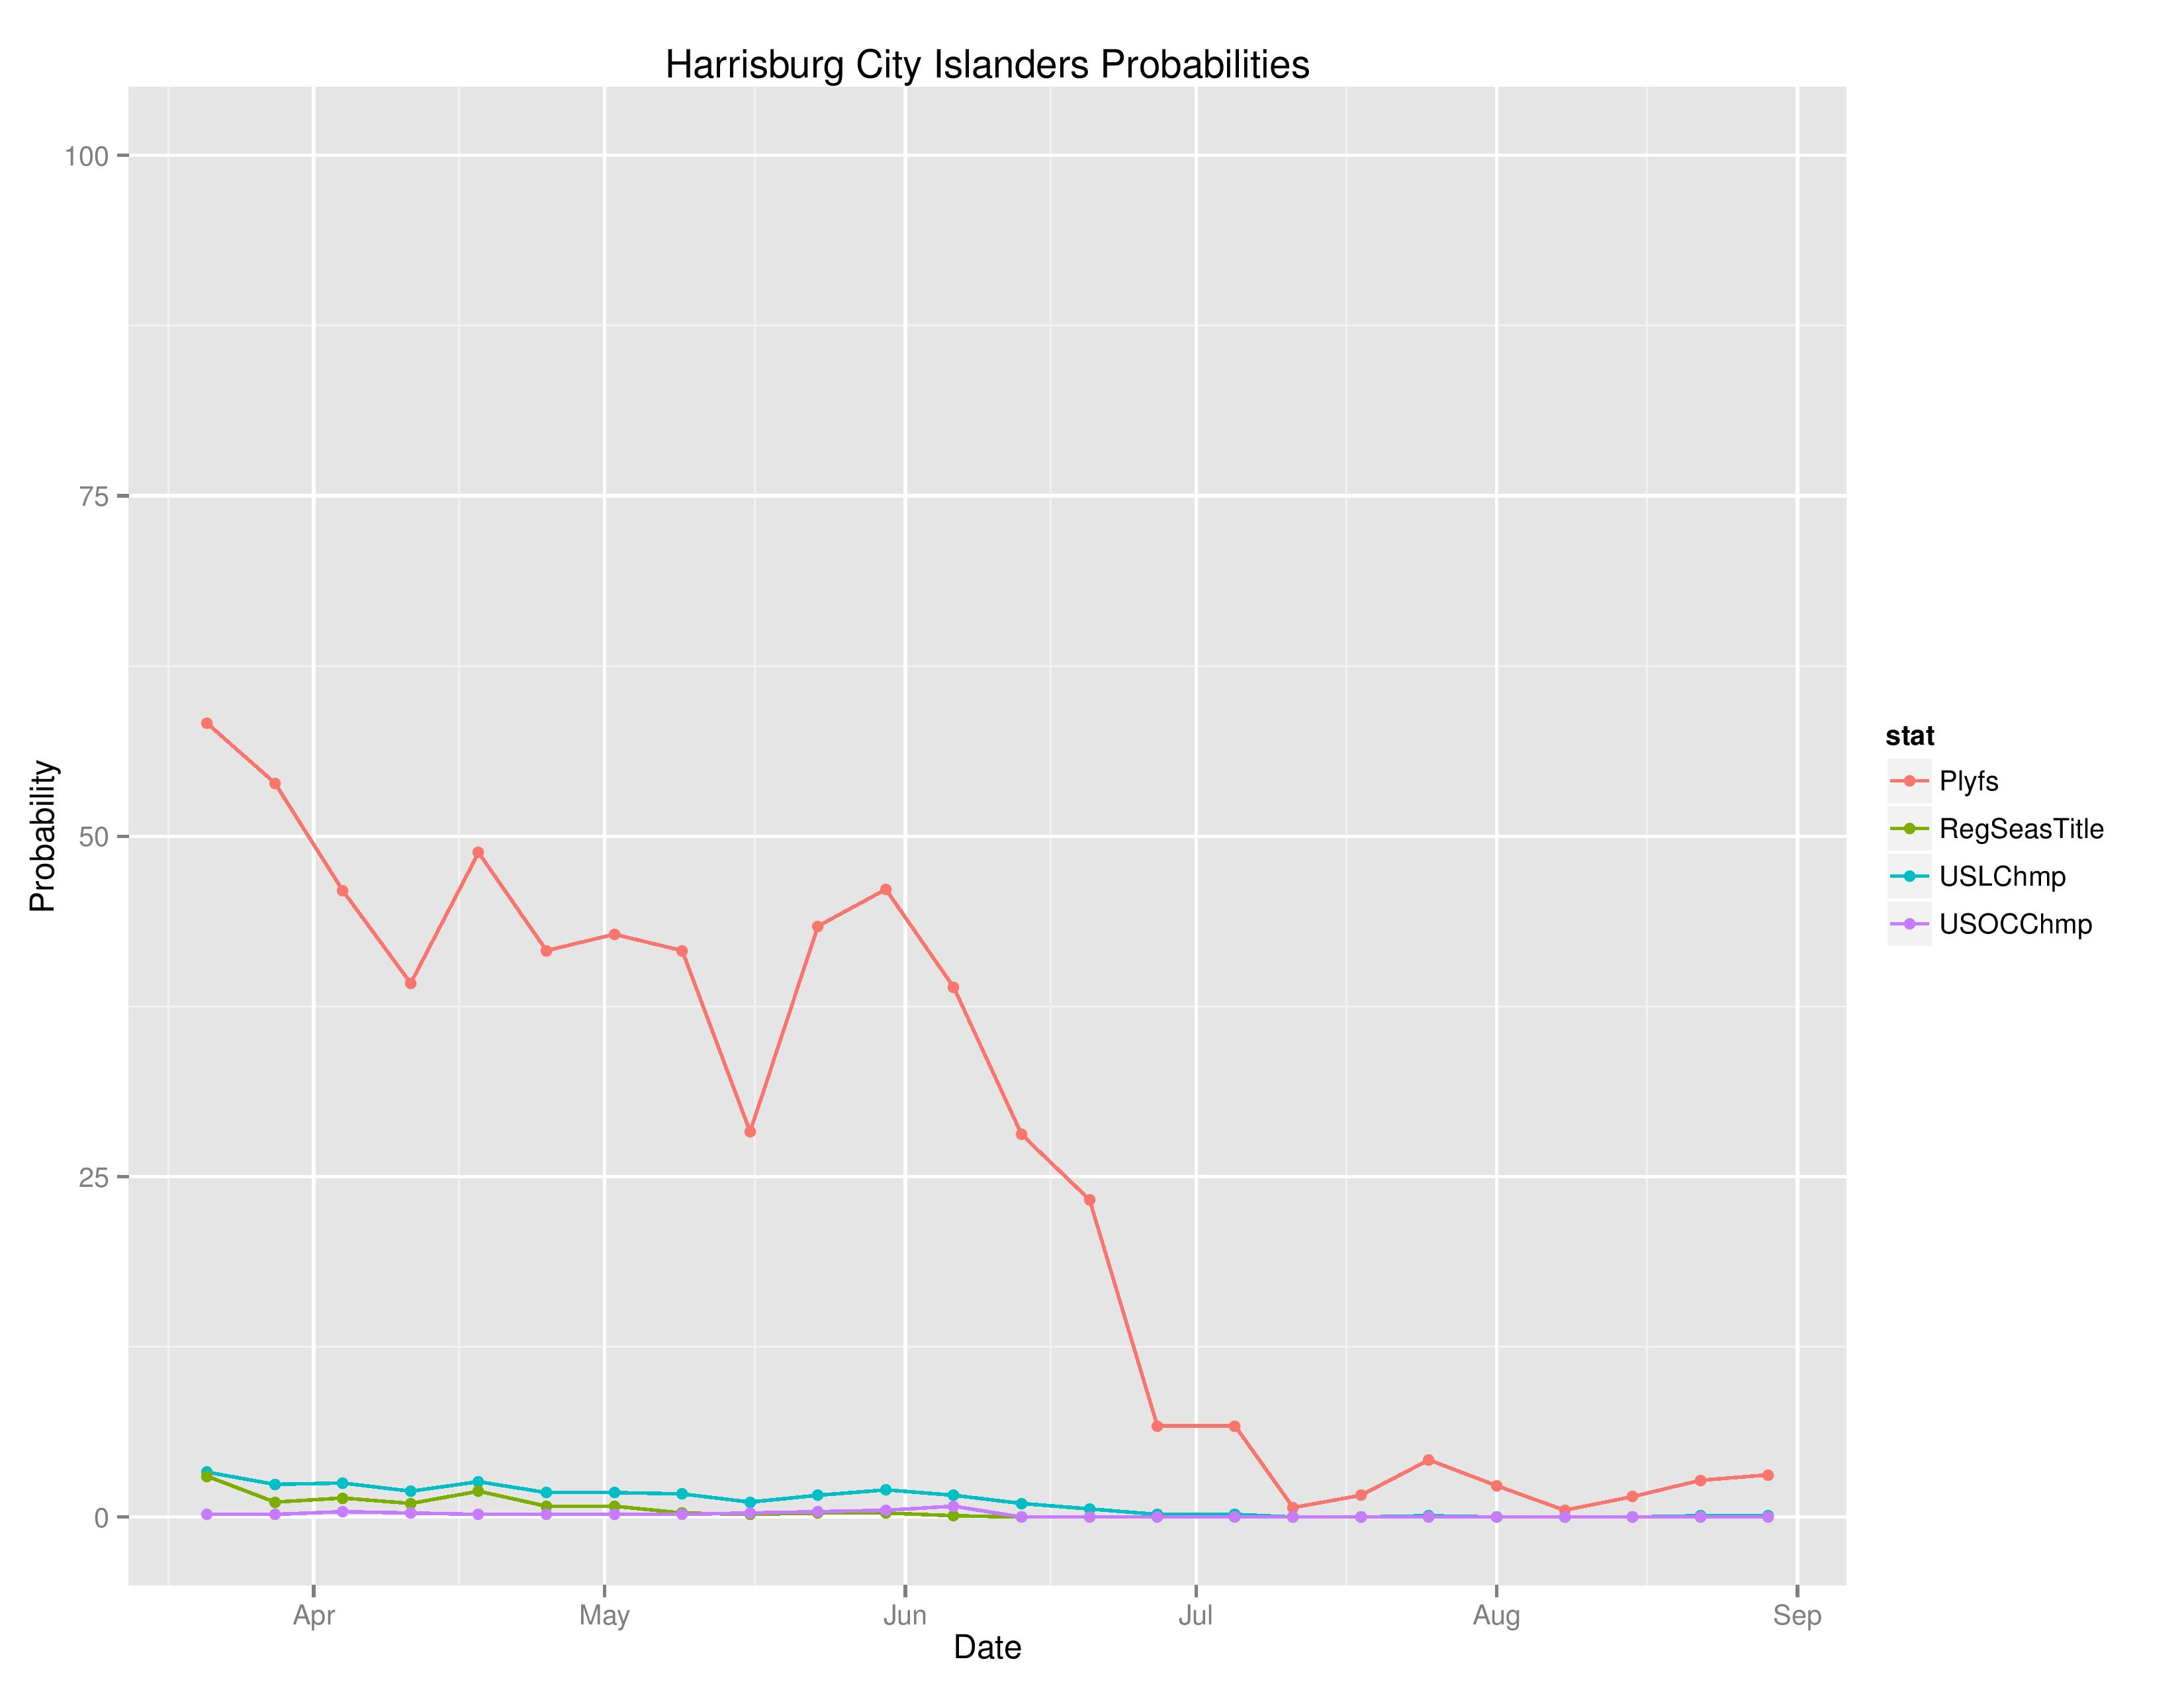
Below shows the probabilities of various outcomes for Harrisburg over the course of the season.
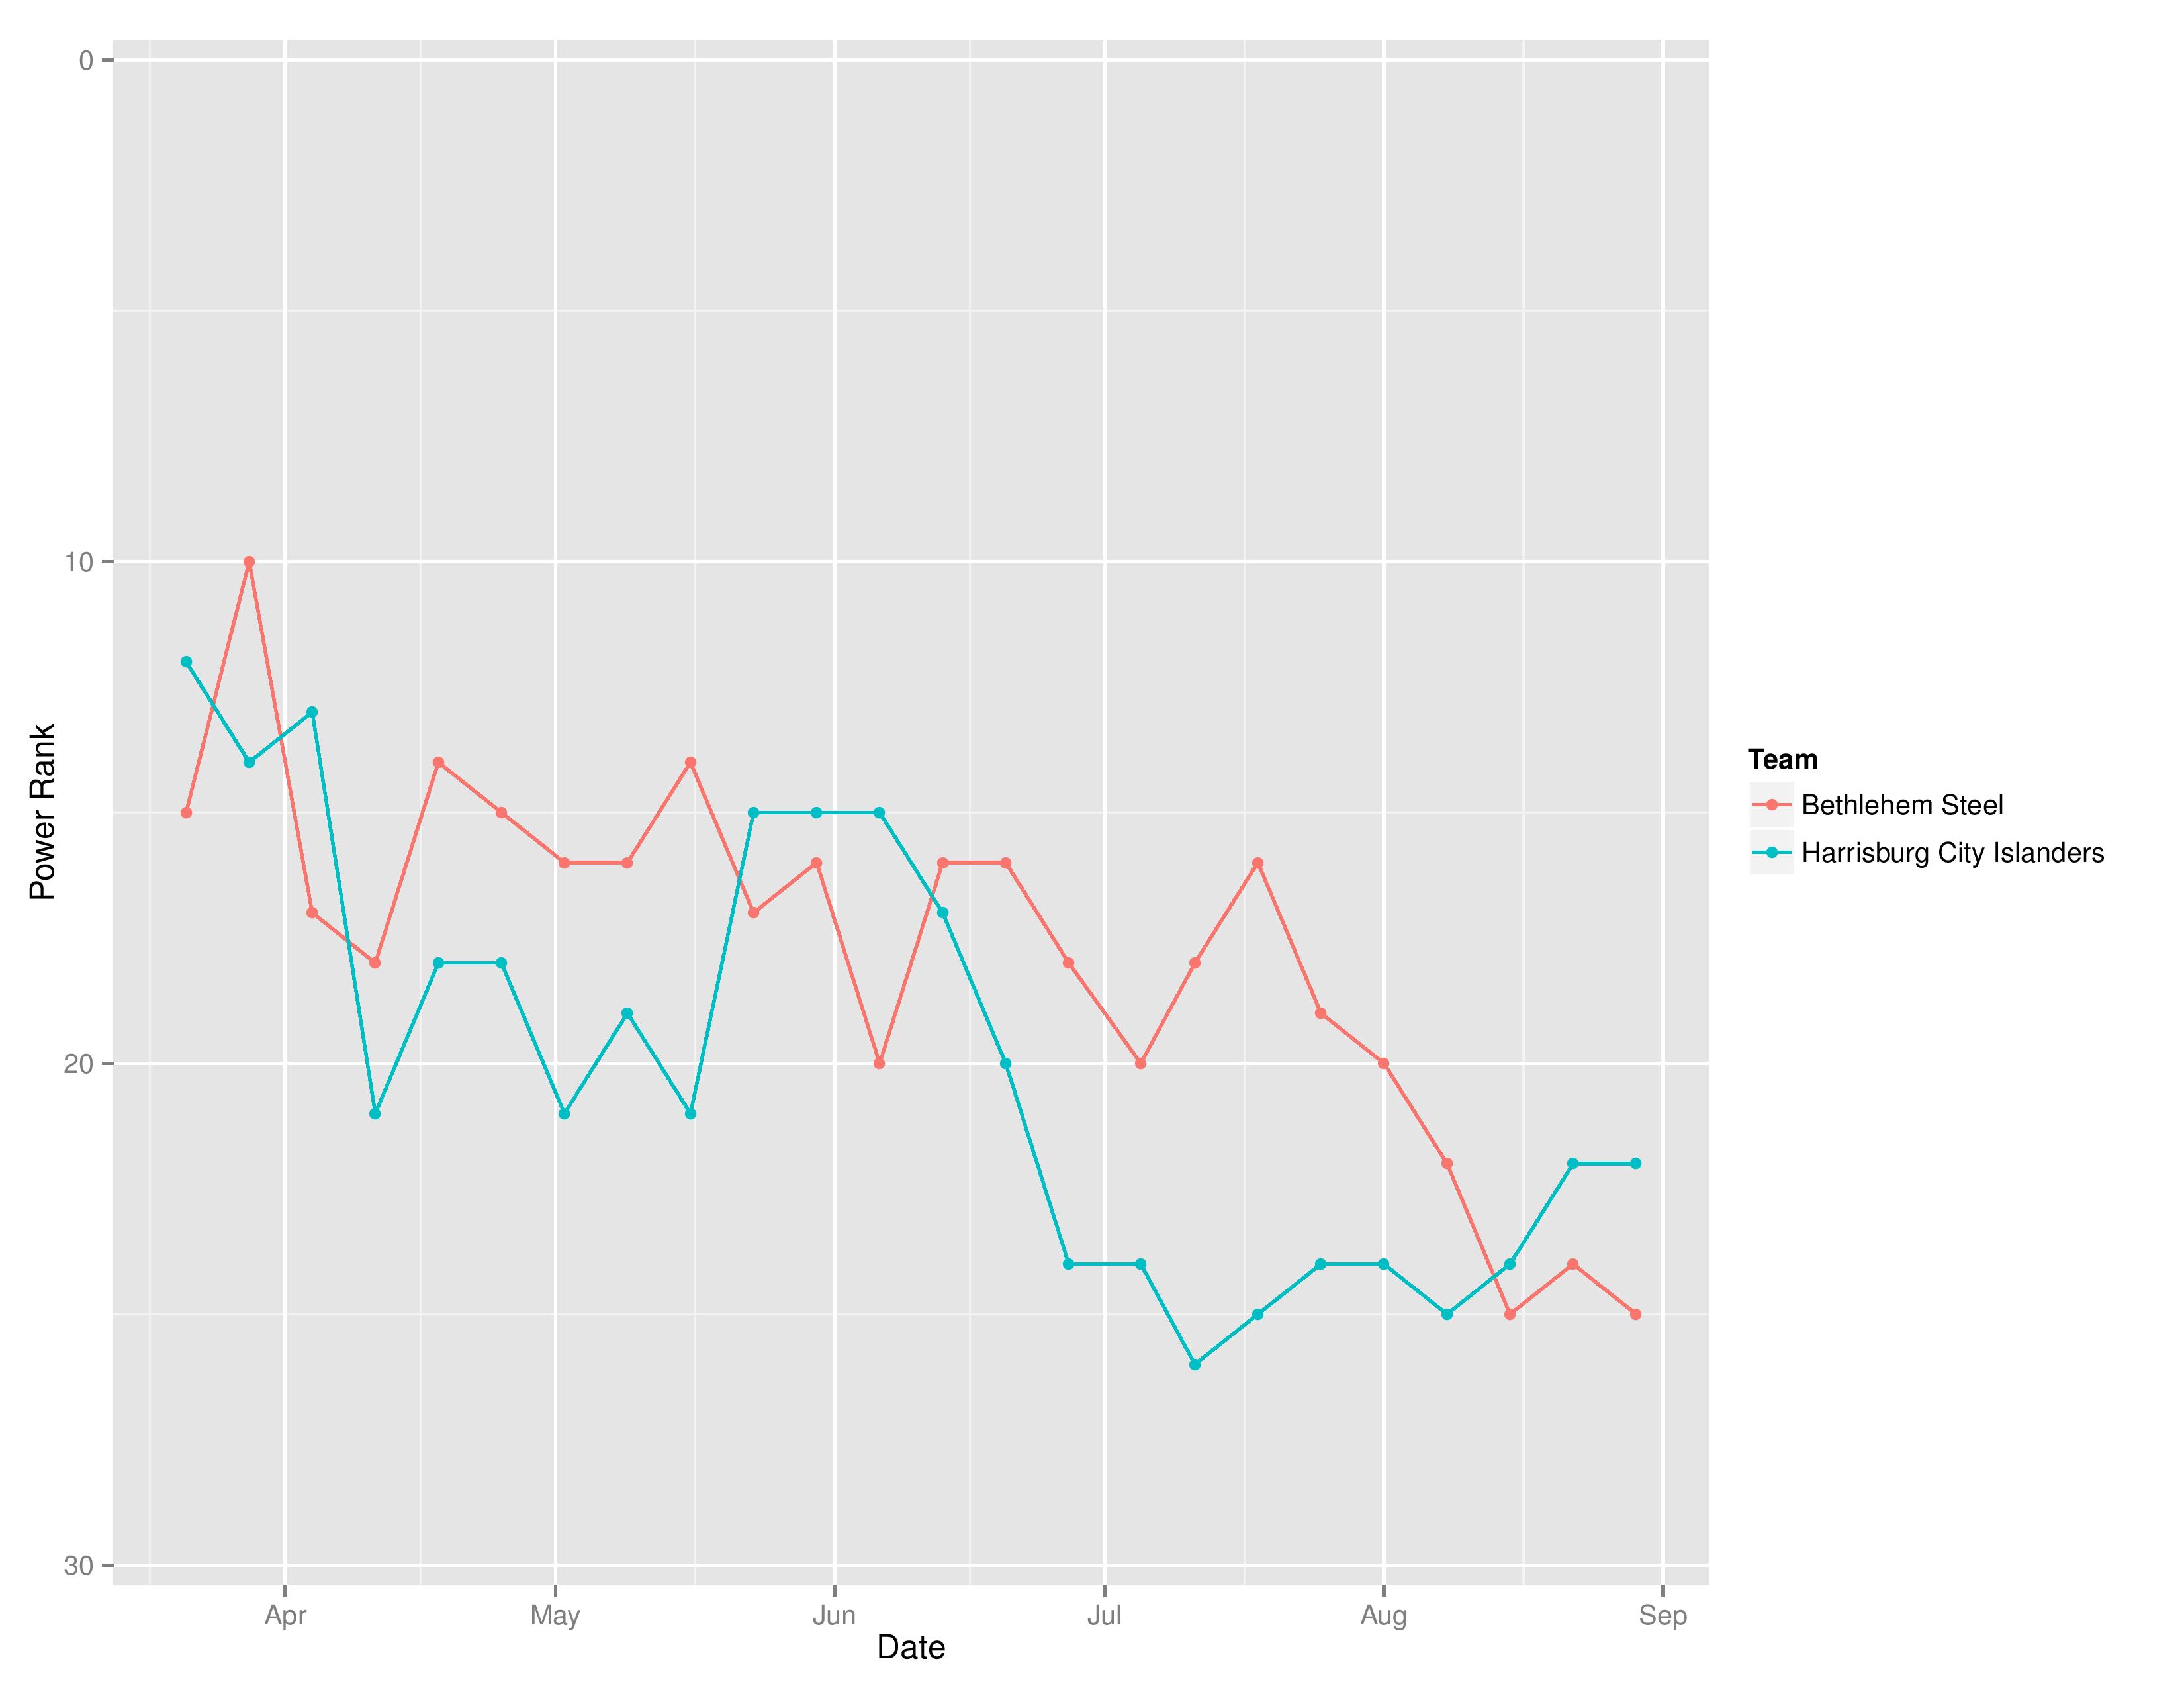
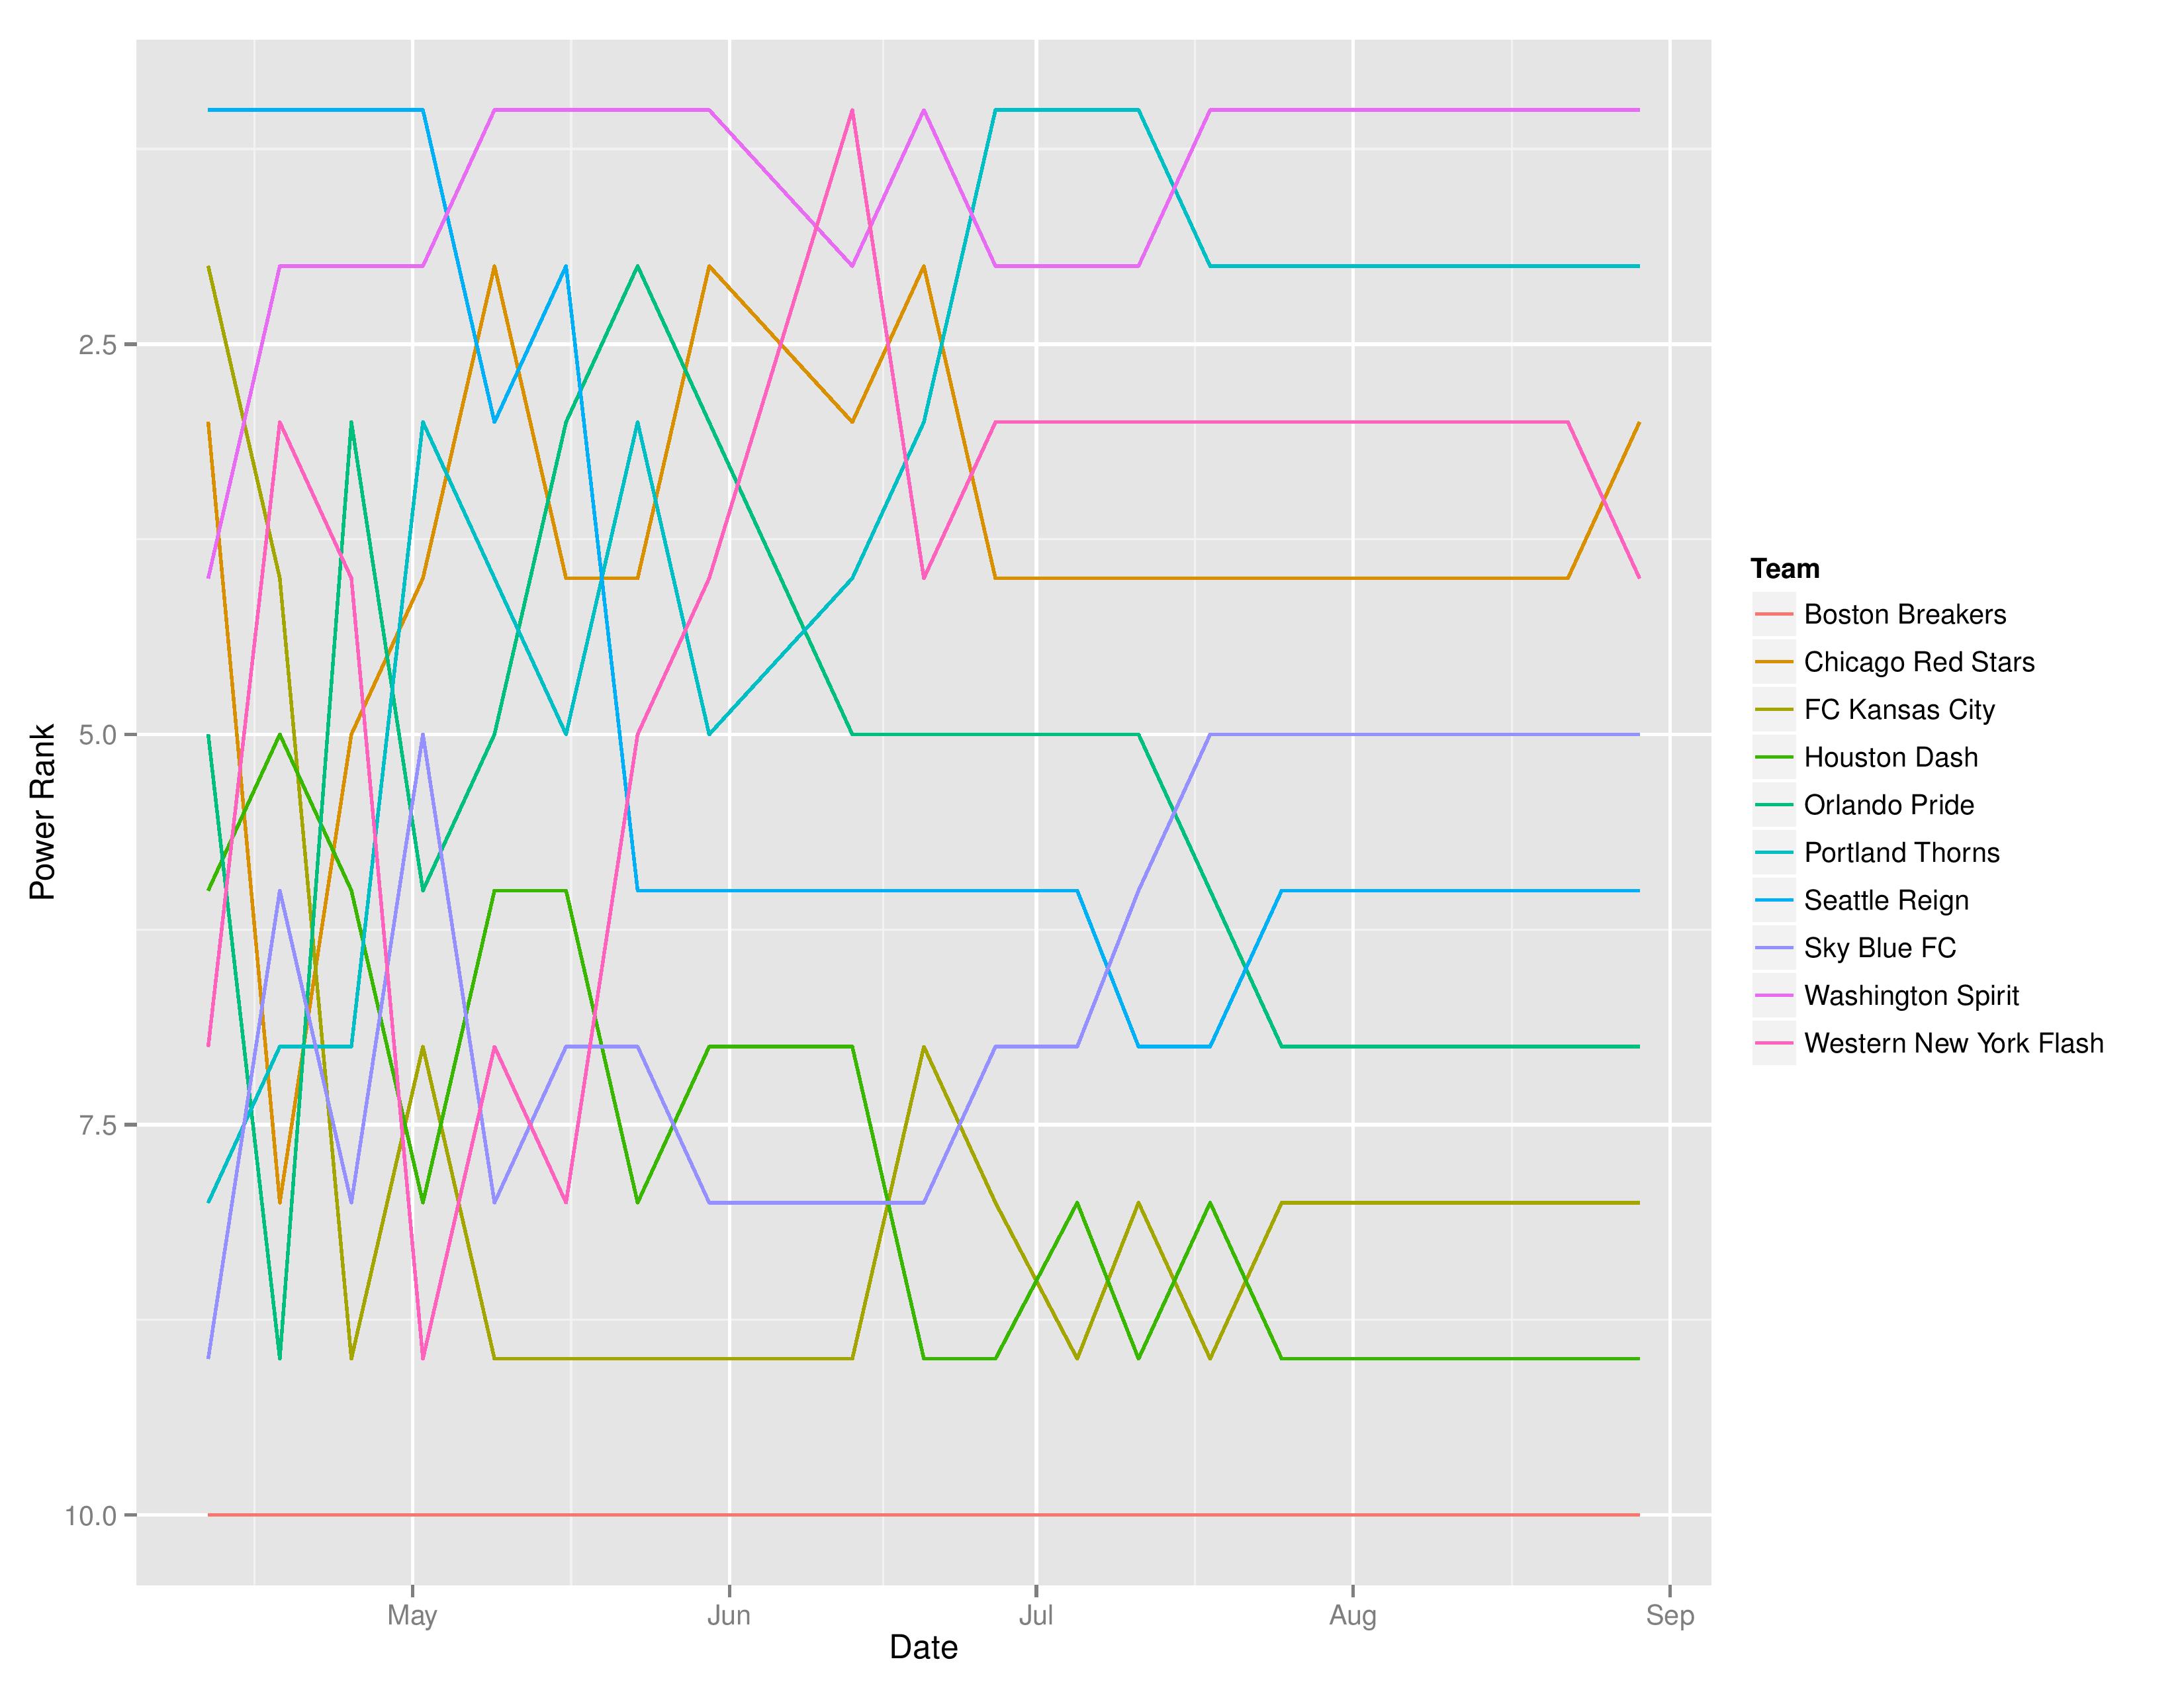
Below shows the evolution of SEBA’s power rankings for Bethlehem Steel FC and the Harrisburg City Islanders.
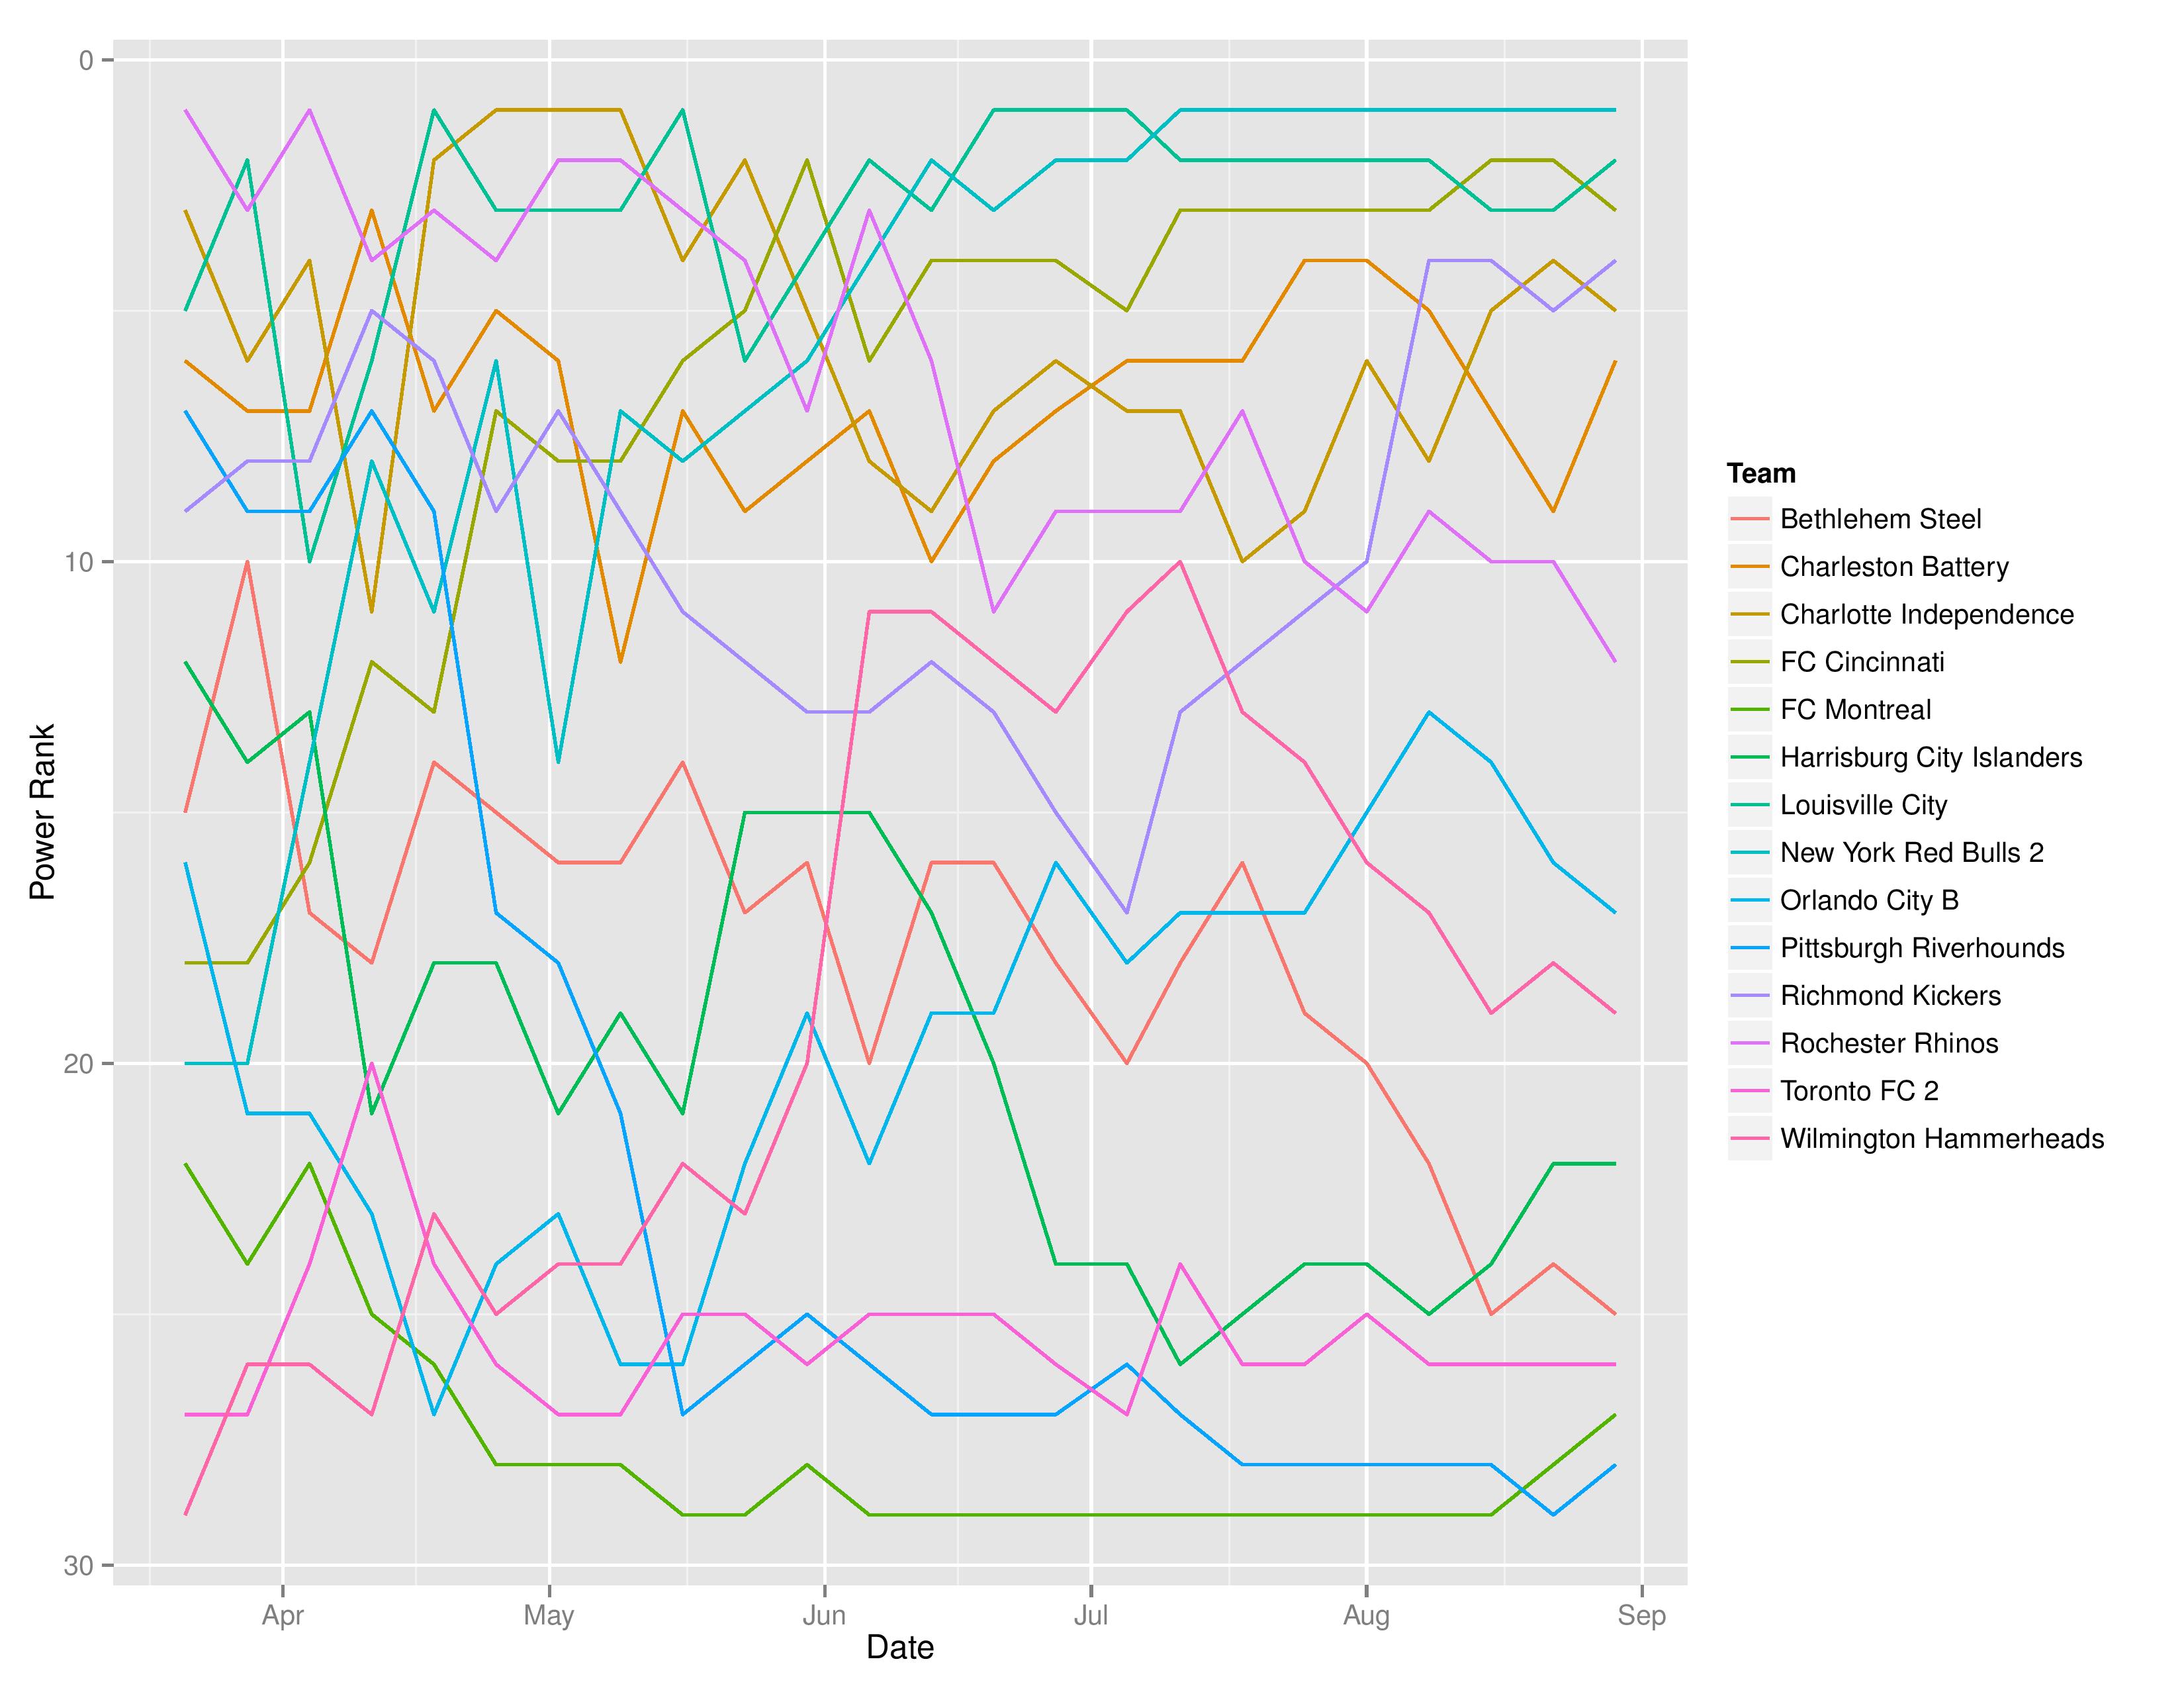
Below shows SEBA’s power rankings evolution for the USL East over the course of the season
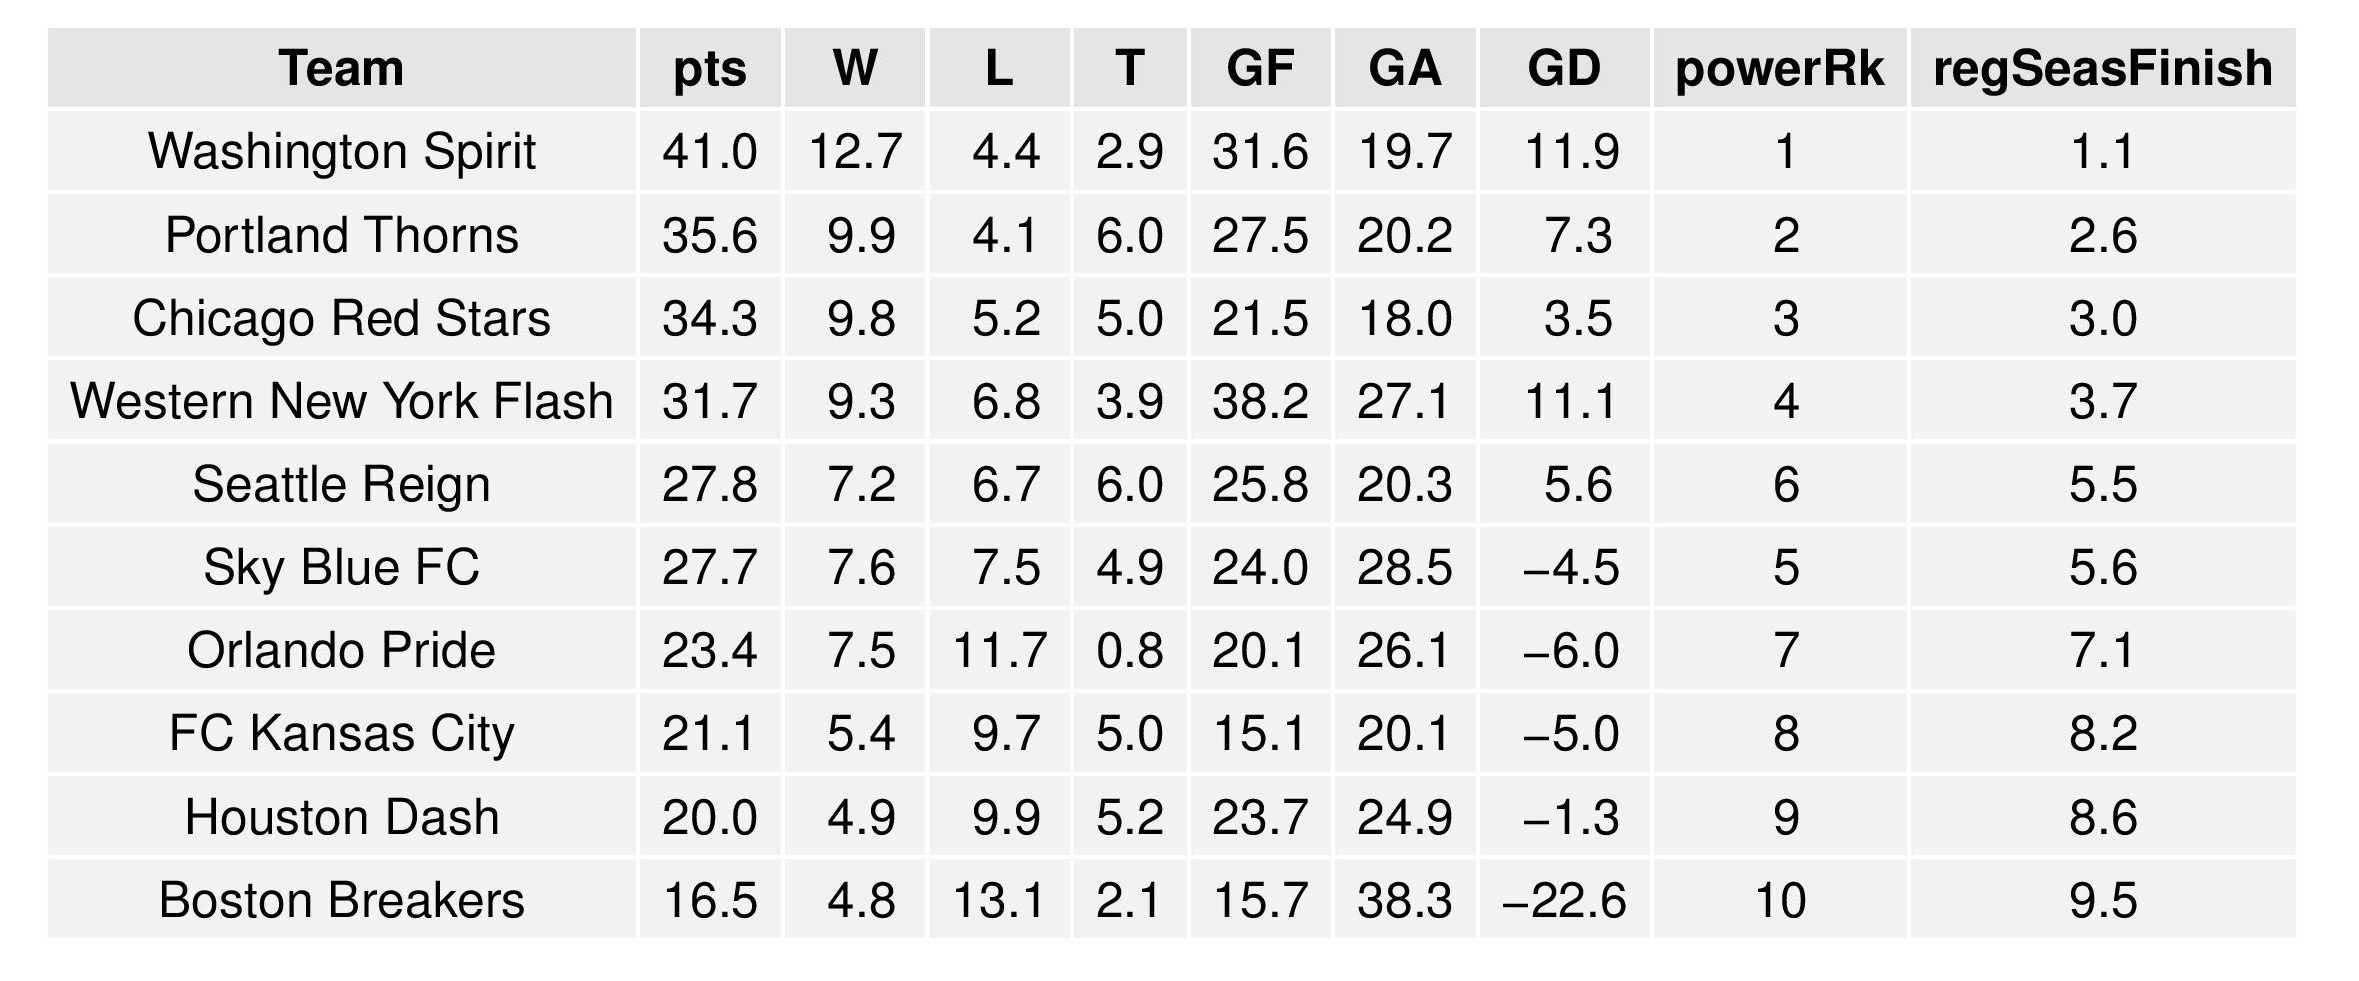
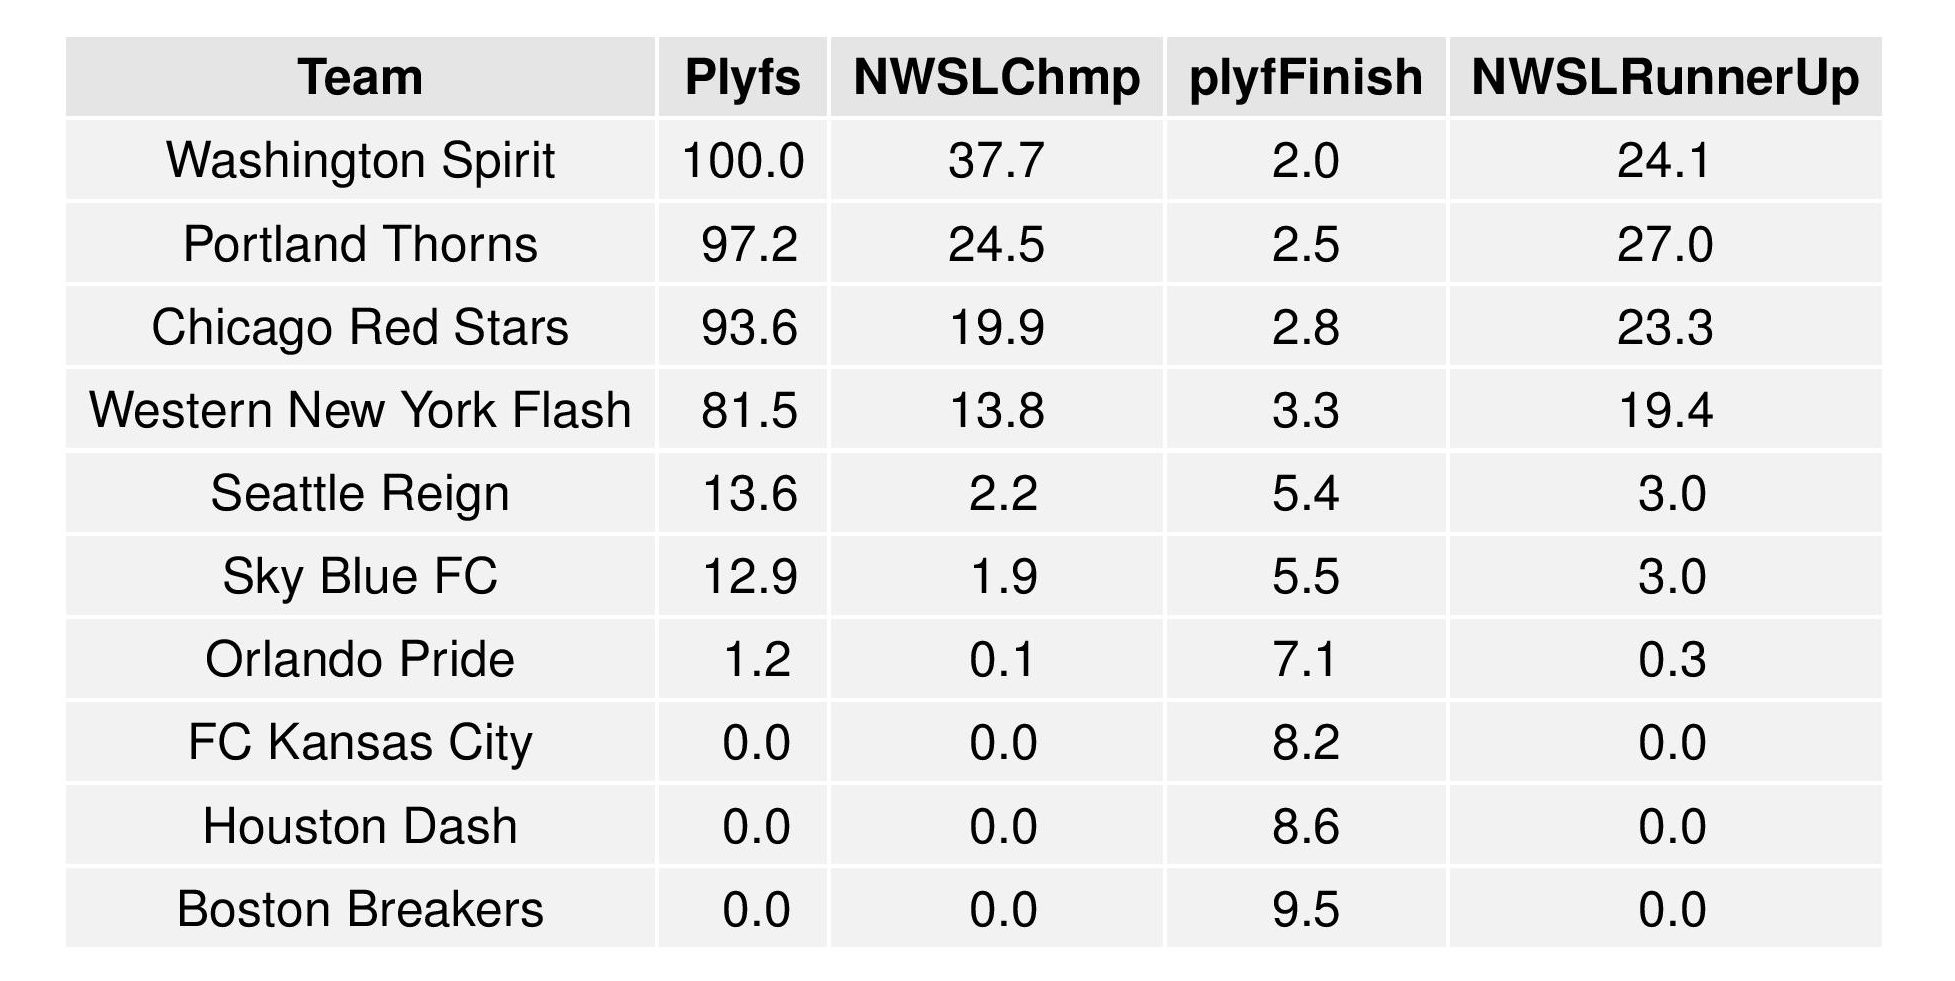
NWSL Projections
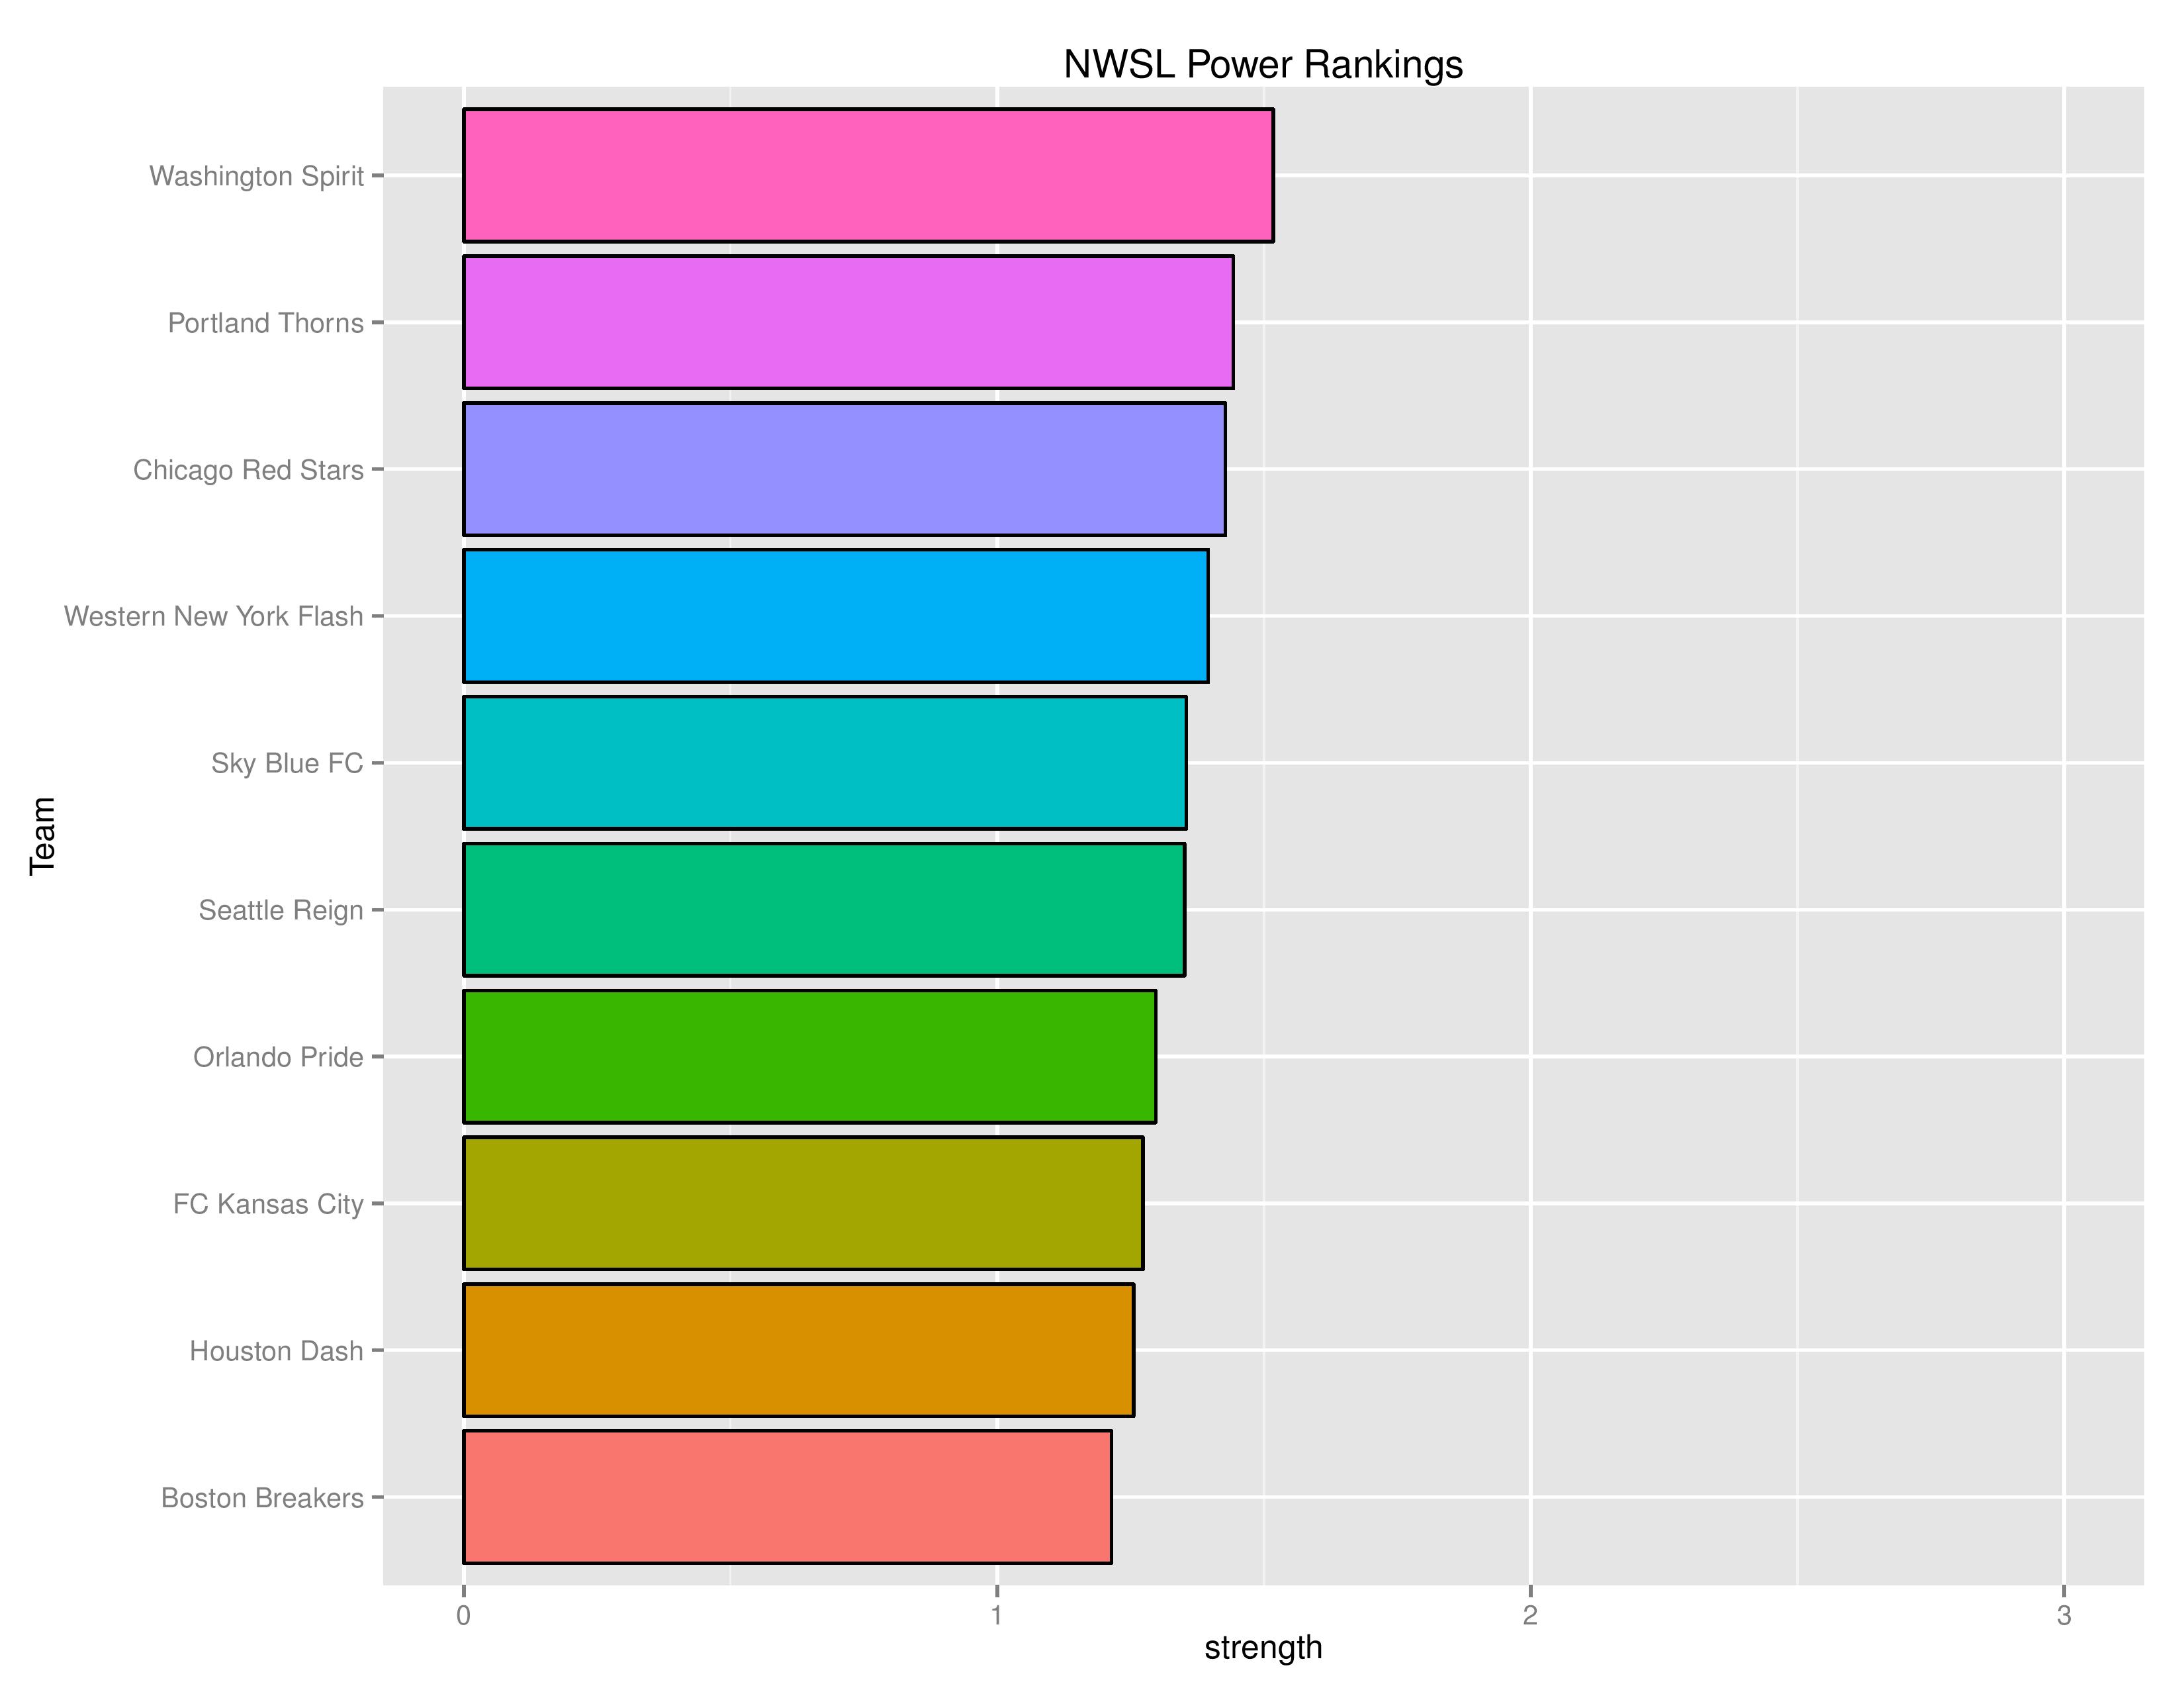
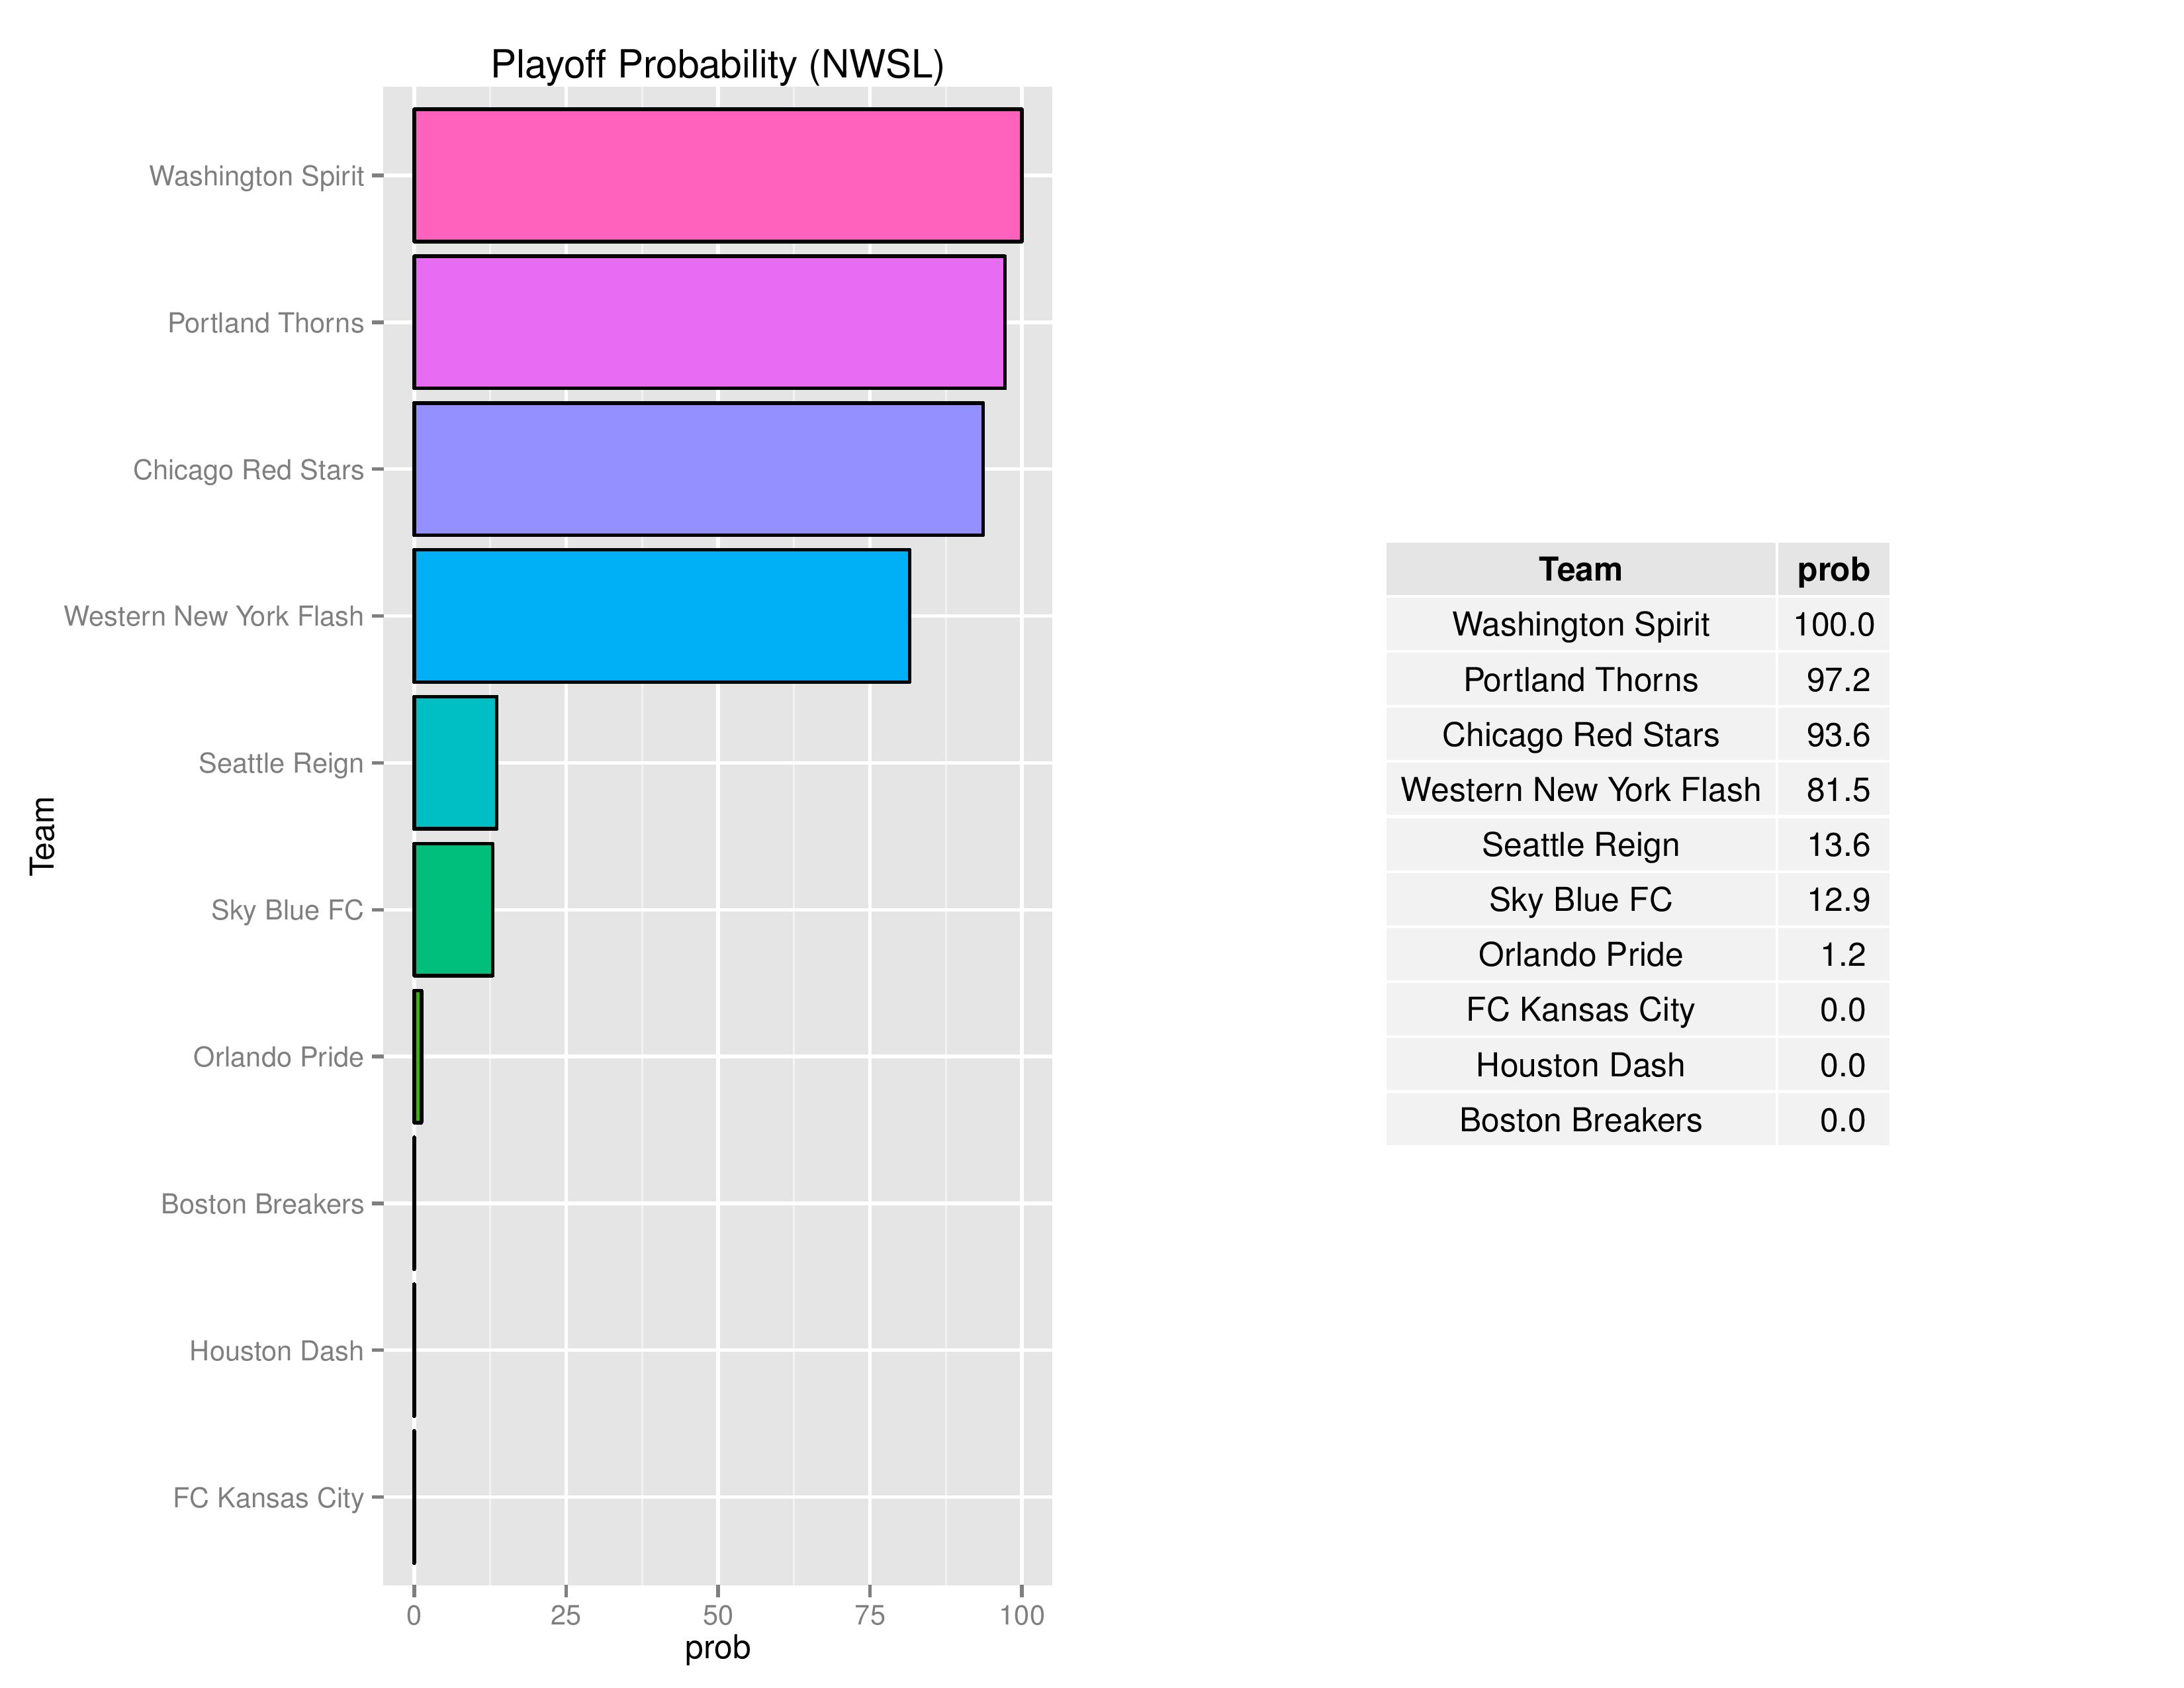
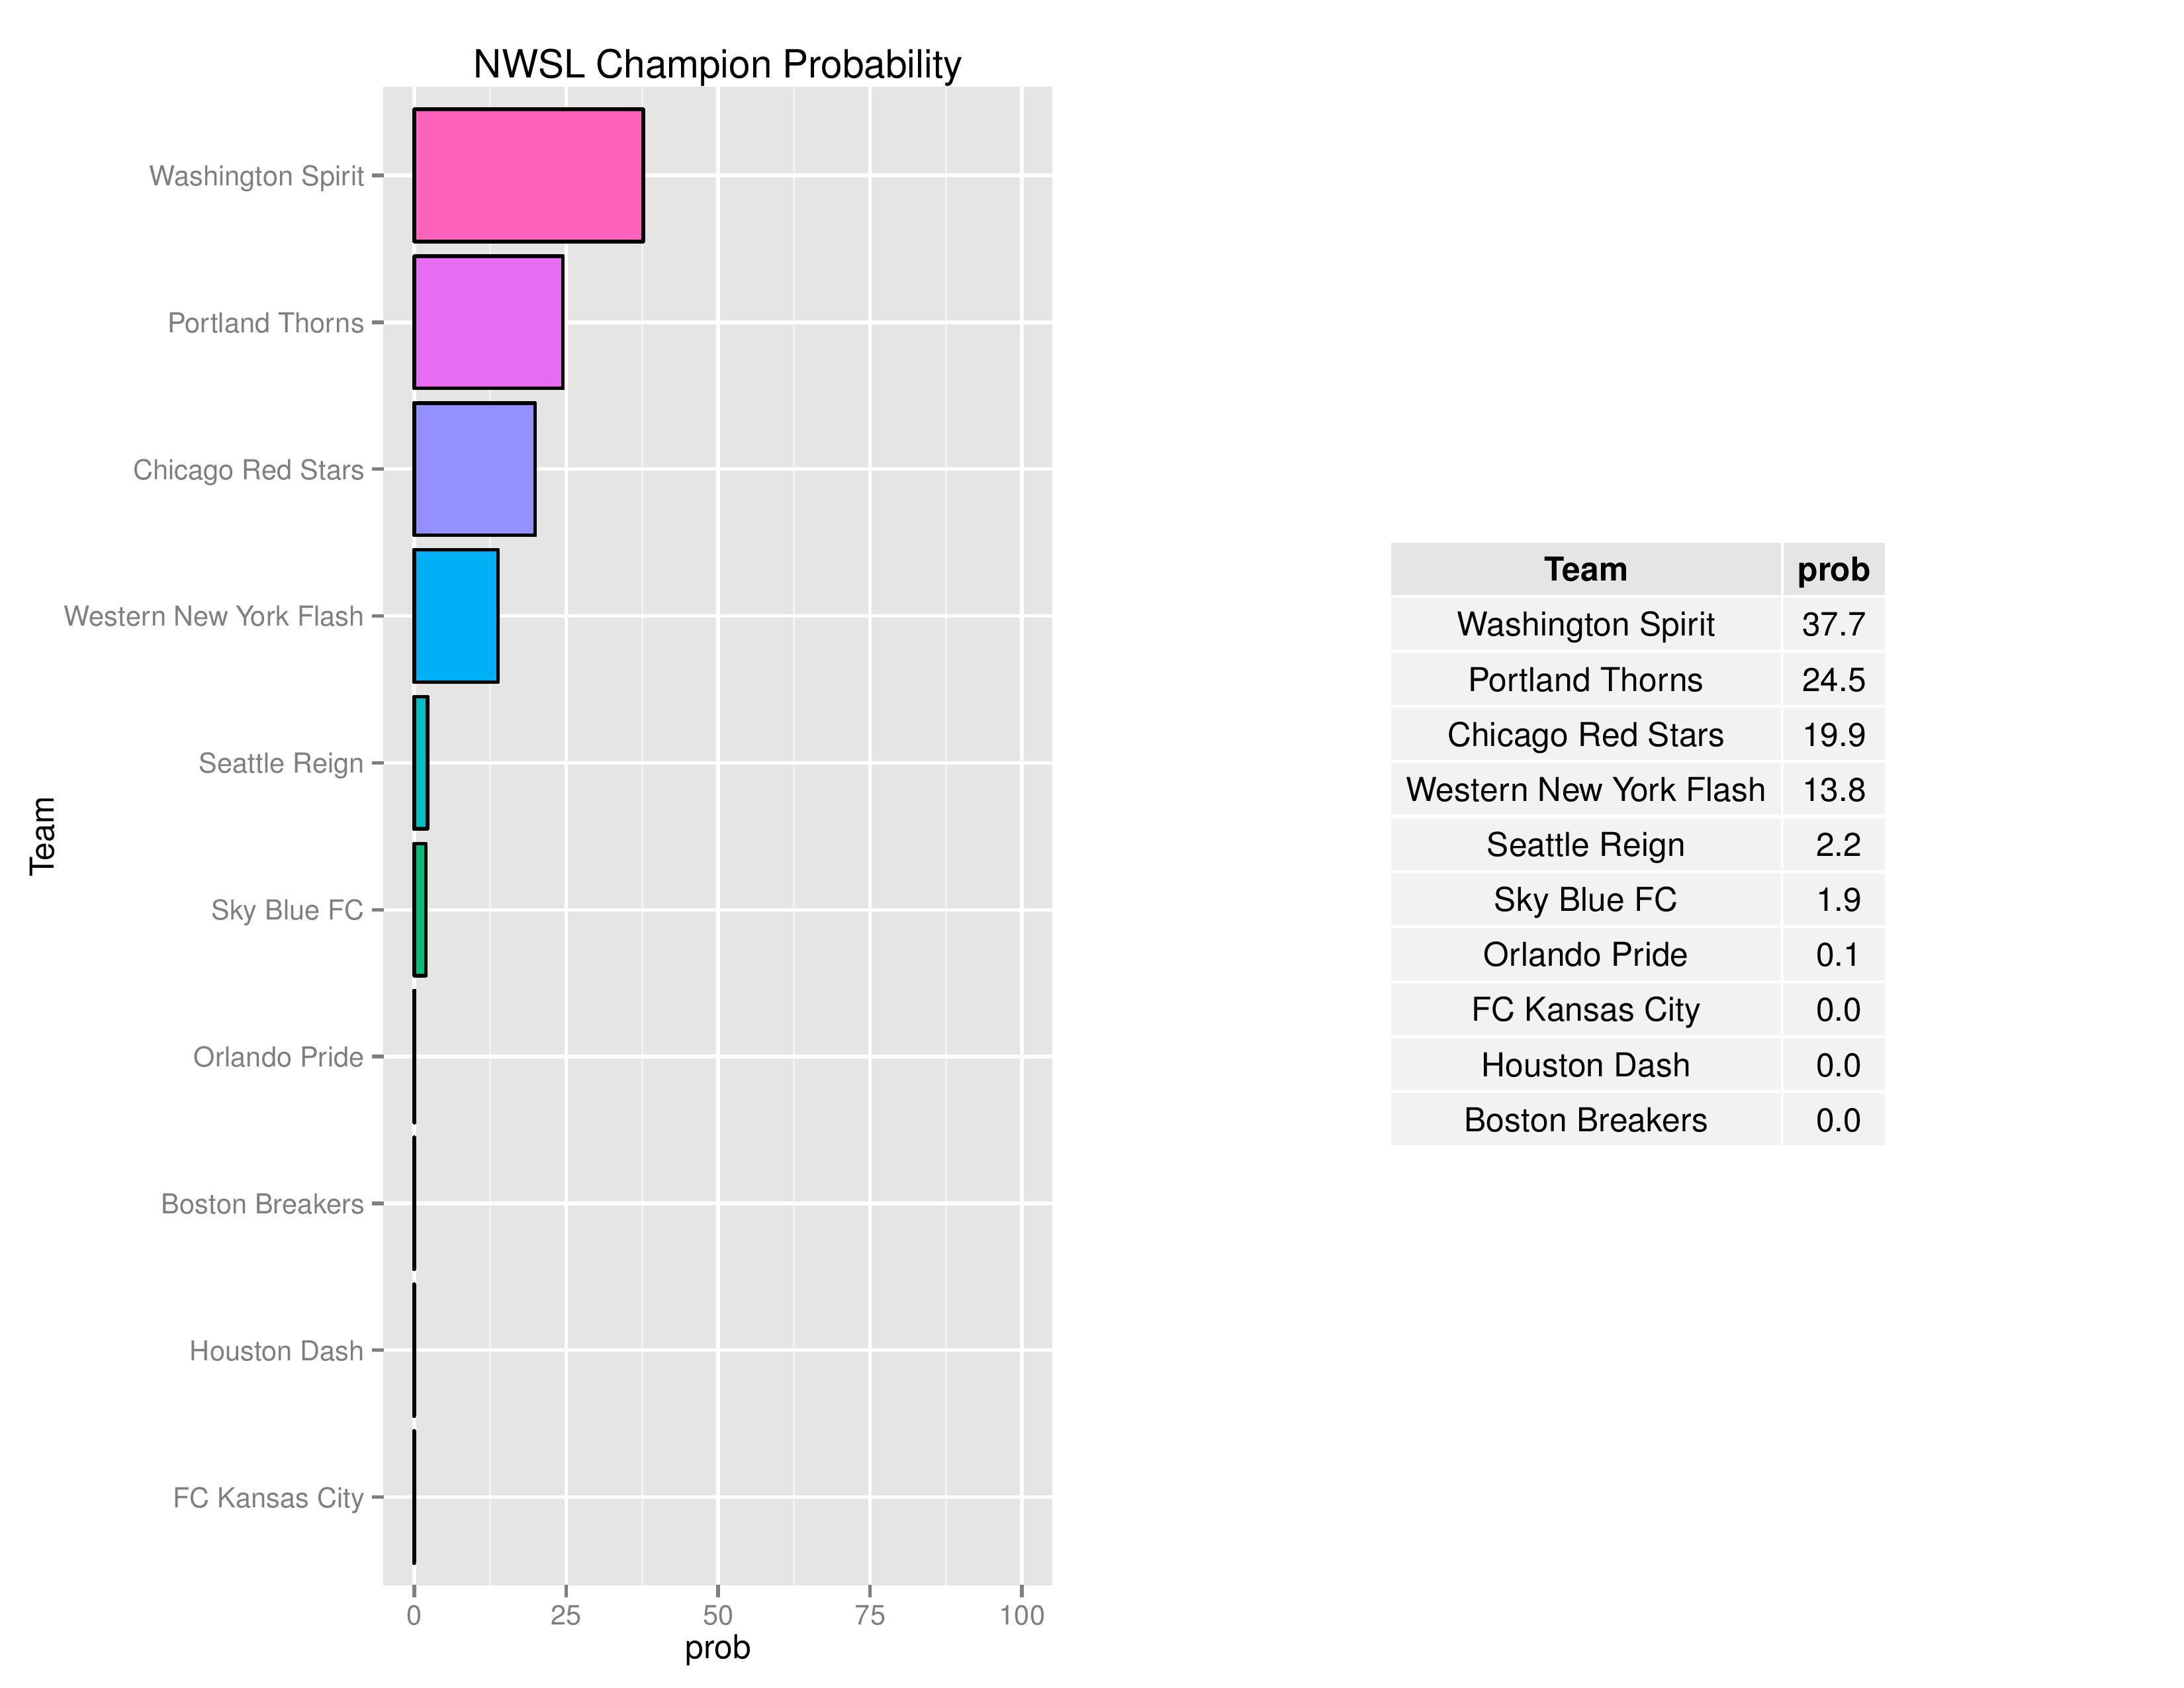
The following tables are the average simulation results produced by SEBA.

To clarify, are we predicted to loose to Chicago on Saturday? Not sure if I’m reading the numbers right.
I think the simulations show that a loss is the most likely outcome (45%) but the weighted probabilities of a win or a tie mean that on average the Union will earn just over an average of 1 point if the game were played 1000 times (250 wins, 295 ties, 454 losses, and 1 game lost to rounding differences) = 1045 points or 1.05 points per game.
Yeah, Andy has a good summary of the meaning.
.
It may be surprising to see a model predict its 5th-best-team lose to its worst team, but home field advantage has enormous impact in this league for whatever reason.
thank you Andy and Chris. As someone impartial to predictive analytics, I find SEBA fascinating. Out of curiosity, what has been the running accuracy of previous predictions?
So I’m planning a more comprehensive performance evaluation piece towards the end of the season when I can pull everything together into visuals. Stay tuned!
Chris, I have noticed in other articles you have posted that you rate the USL as slightly higher in quality than the NASL. That challenges USSF revealed wisdom that NASL is the second division and the USL is the third, granted that USSF’s Mt Sinai-like decrees include several “off-the-pitch” considerations like seating capacity.
.
At some point in the future might you discuss how you arrive at that representation and whether or not the differences your graph presents are statistically significant?
.
much obliged.
Not Chris, but if I remember correctly, the USL fares much better in the US Open Cup than the NASL (other than the Cosmos). For whatever that is worth.
Yeah, I removed it temporarily since it wasn’t really changing.
.
With so little crossover play between leagues, I don’t know if we can conclude that USL is better than NASL, however, I think there is plenty of evidence to reject the conclusion that NASL is better than USL (and certainly rejecting the idea that NASL is level with MLS).
.
Another nuance to point out is that my analysis is based on All vs. All while many analysts only look at the best teams in both leagues. I reason that just because one team is really good doesn’t make the league good if it contains bottom-feeders. So even if the NY Cosmos manage to win the USOC next year, my analysis may not have the NASL level with USL let alone MLS.
I find the juxtaposition of the Harrisburg City Islander expected points number for tonight’s match (1.54) to that for the Steel (1.24) quite helpful in trying to figure out what your data sets may mean.
.
Non-data competent person that I am, the comparison feels similar to Odds of whose likely to secure a more favorable outcome. Please correct that impression as needed, should you happen to notice this inquiry.
.
Many thanks.
They’re not quite odds but actually an average of the amount of points they will get if they played many many times. If you want Win/Lose odds, the W/L/T columns show the percentages of each of those outcomes which you can then divide.
I have never bothered to look at these posts before and now I am sorry I did.
.
Totally. Hooked.
I have never bothered to look at these posts before and now I am sorry I did.
.
Totally. Hooked.