Welcome to the Statistical Extrapolation Bayesian Analyzer Projection System, which is, of course, a tortured gathering of words used to form the SEBA Projection System.
The system consists of a model projecting the probabilities of game results and then a barrage of simulations which account for the remaining luck. So the probabilities you see below show, essentially, what the odds are of an outcome if the team continues to play like it has been.
Below are the current season forecasts using data from MLS games through June 26, 2016.
Power Rankings
The “Power Rankings” we concoct are the actual “strength” of the team according to competitive expectations. They are computed showing average expected points result if every team in MLS played every team both home and away:
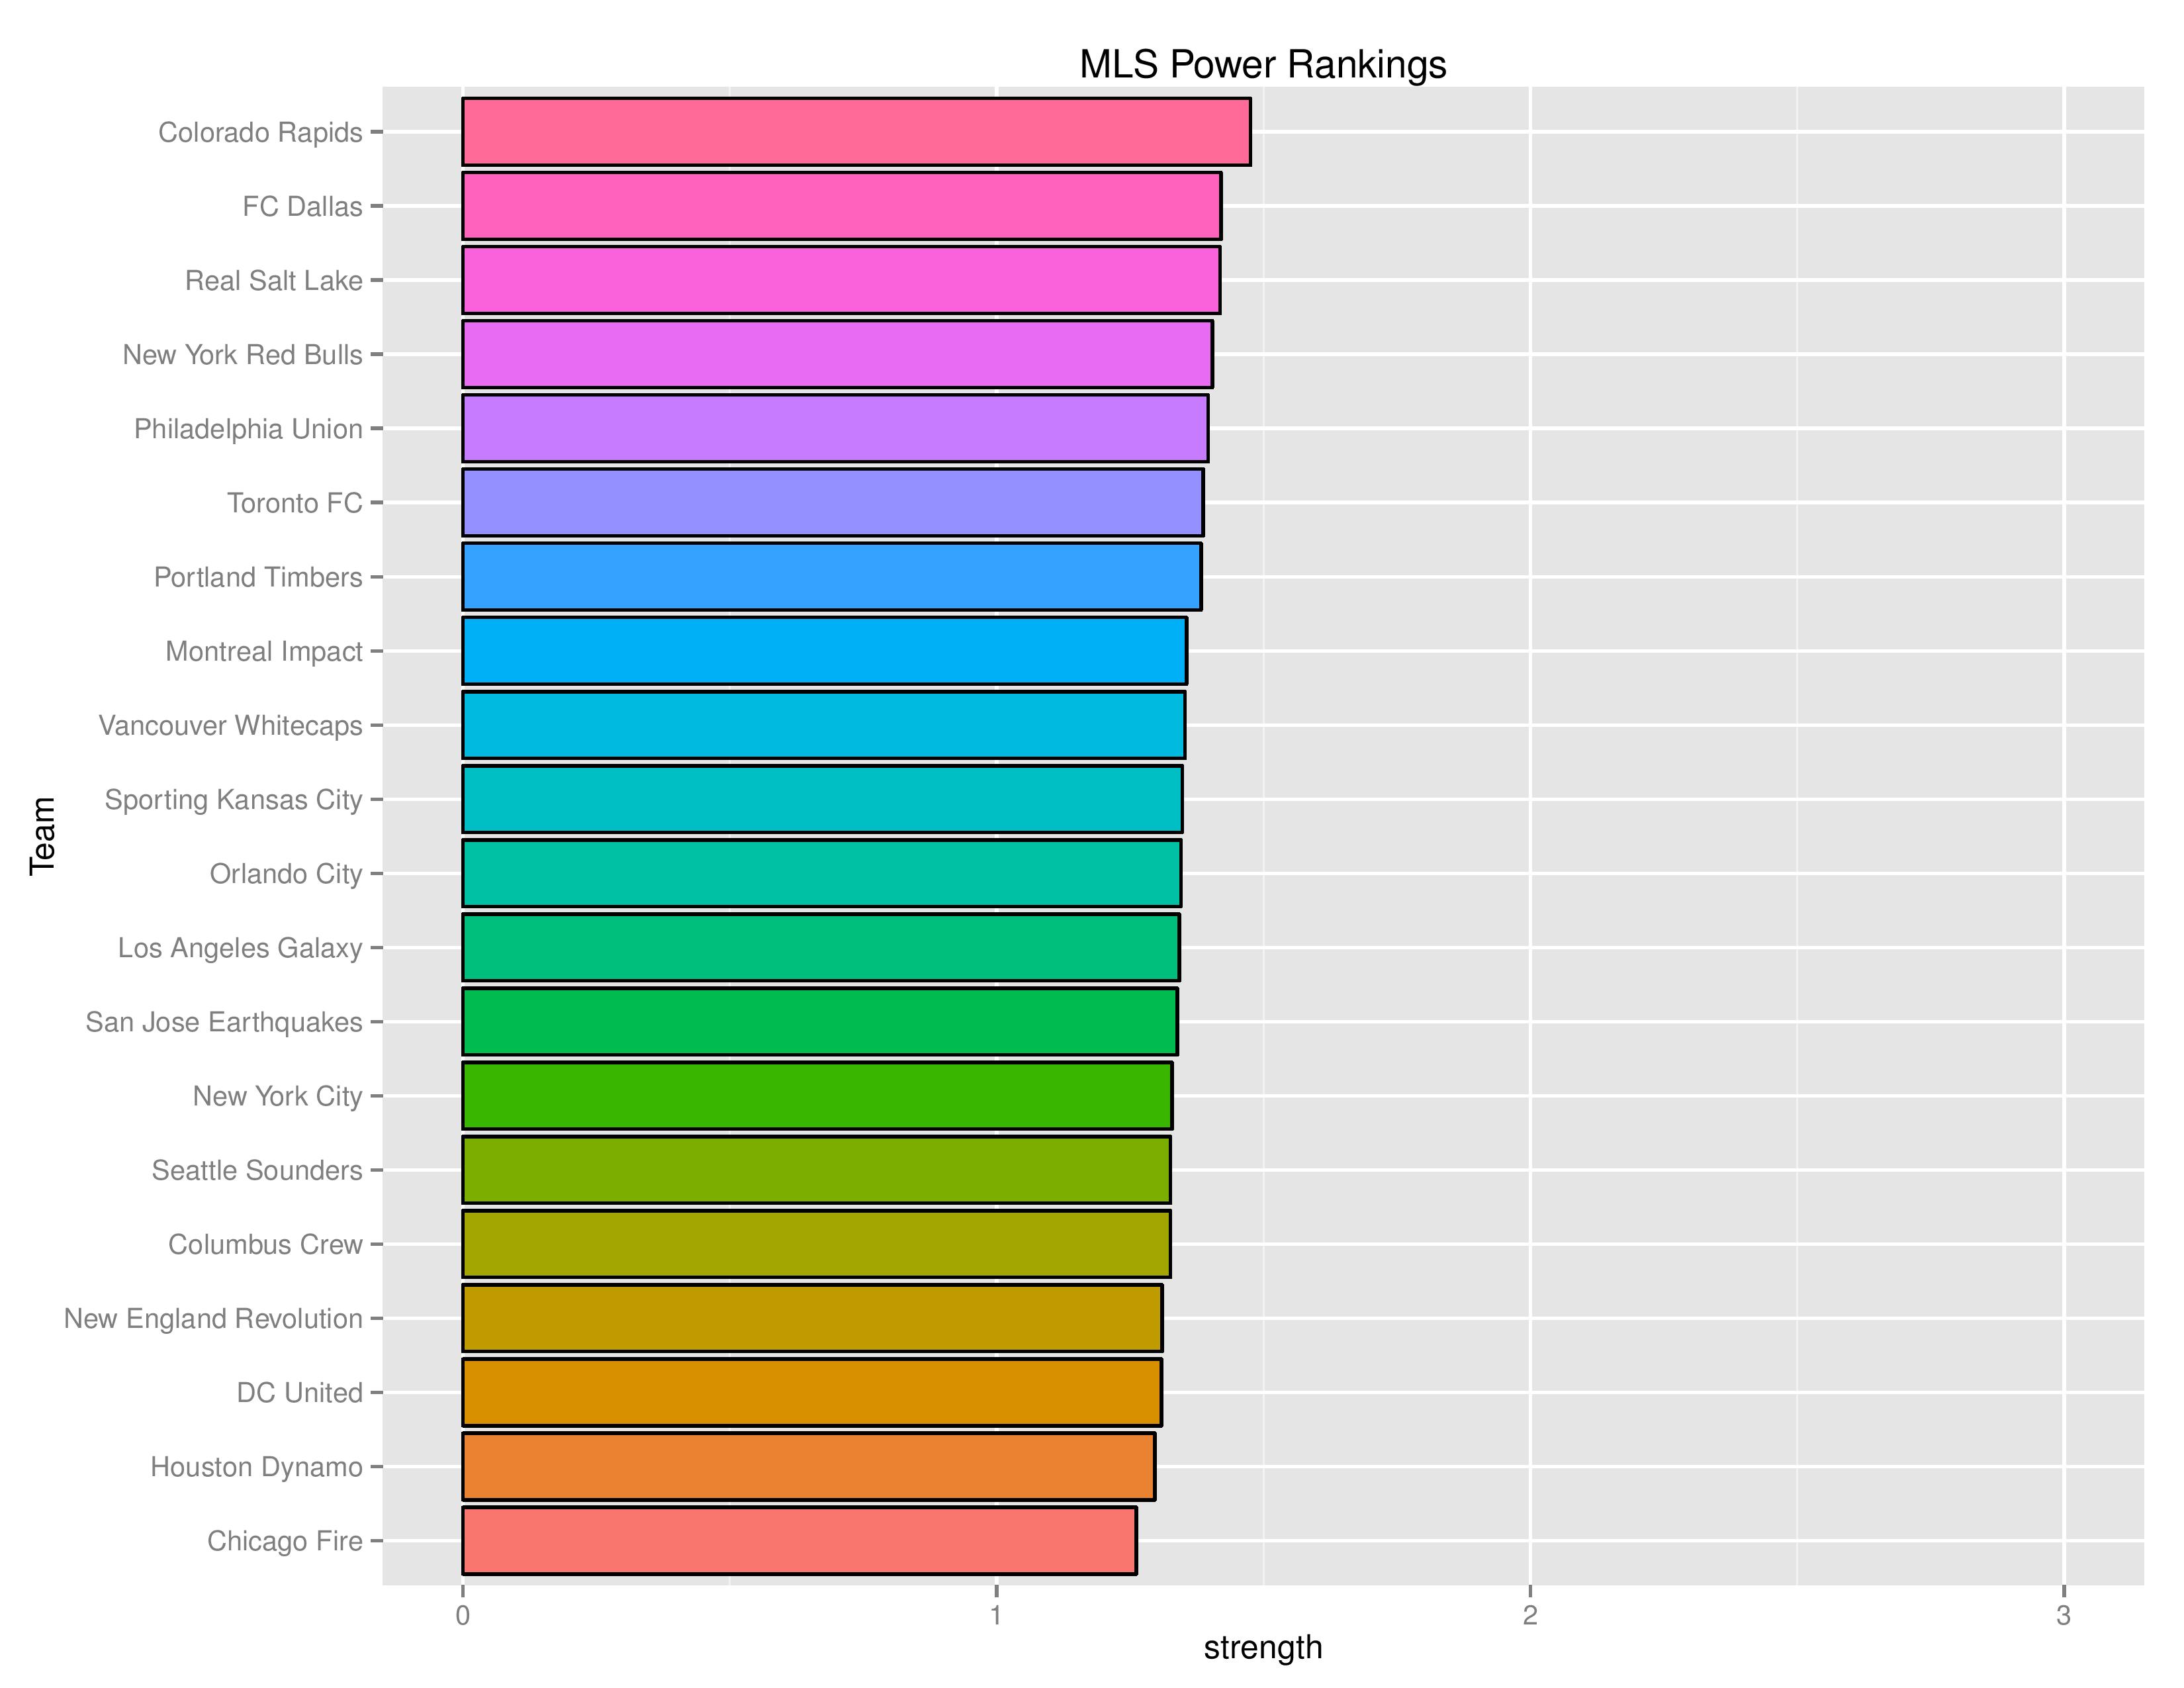
SEBA has the Union remaining at No. 5 this week. ESPN has the Union at No. 9. Soccer America has the Union at No. 3.
Playoffs probability and more
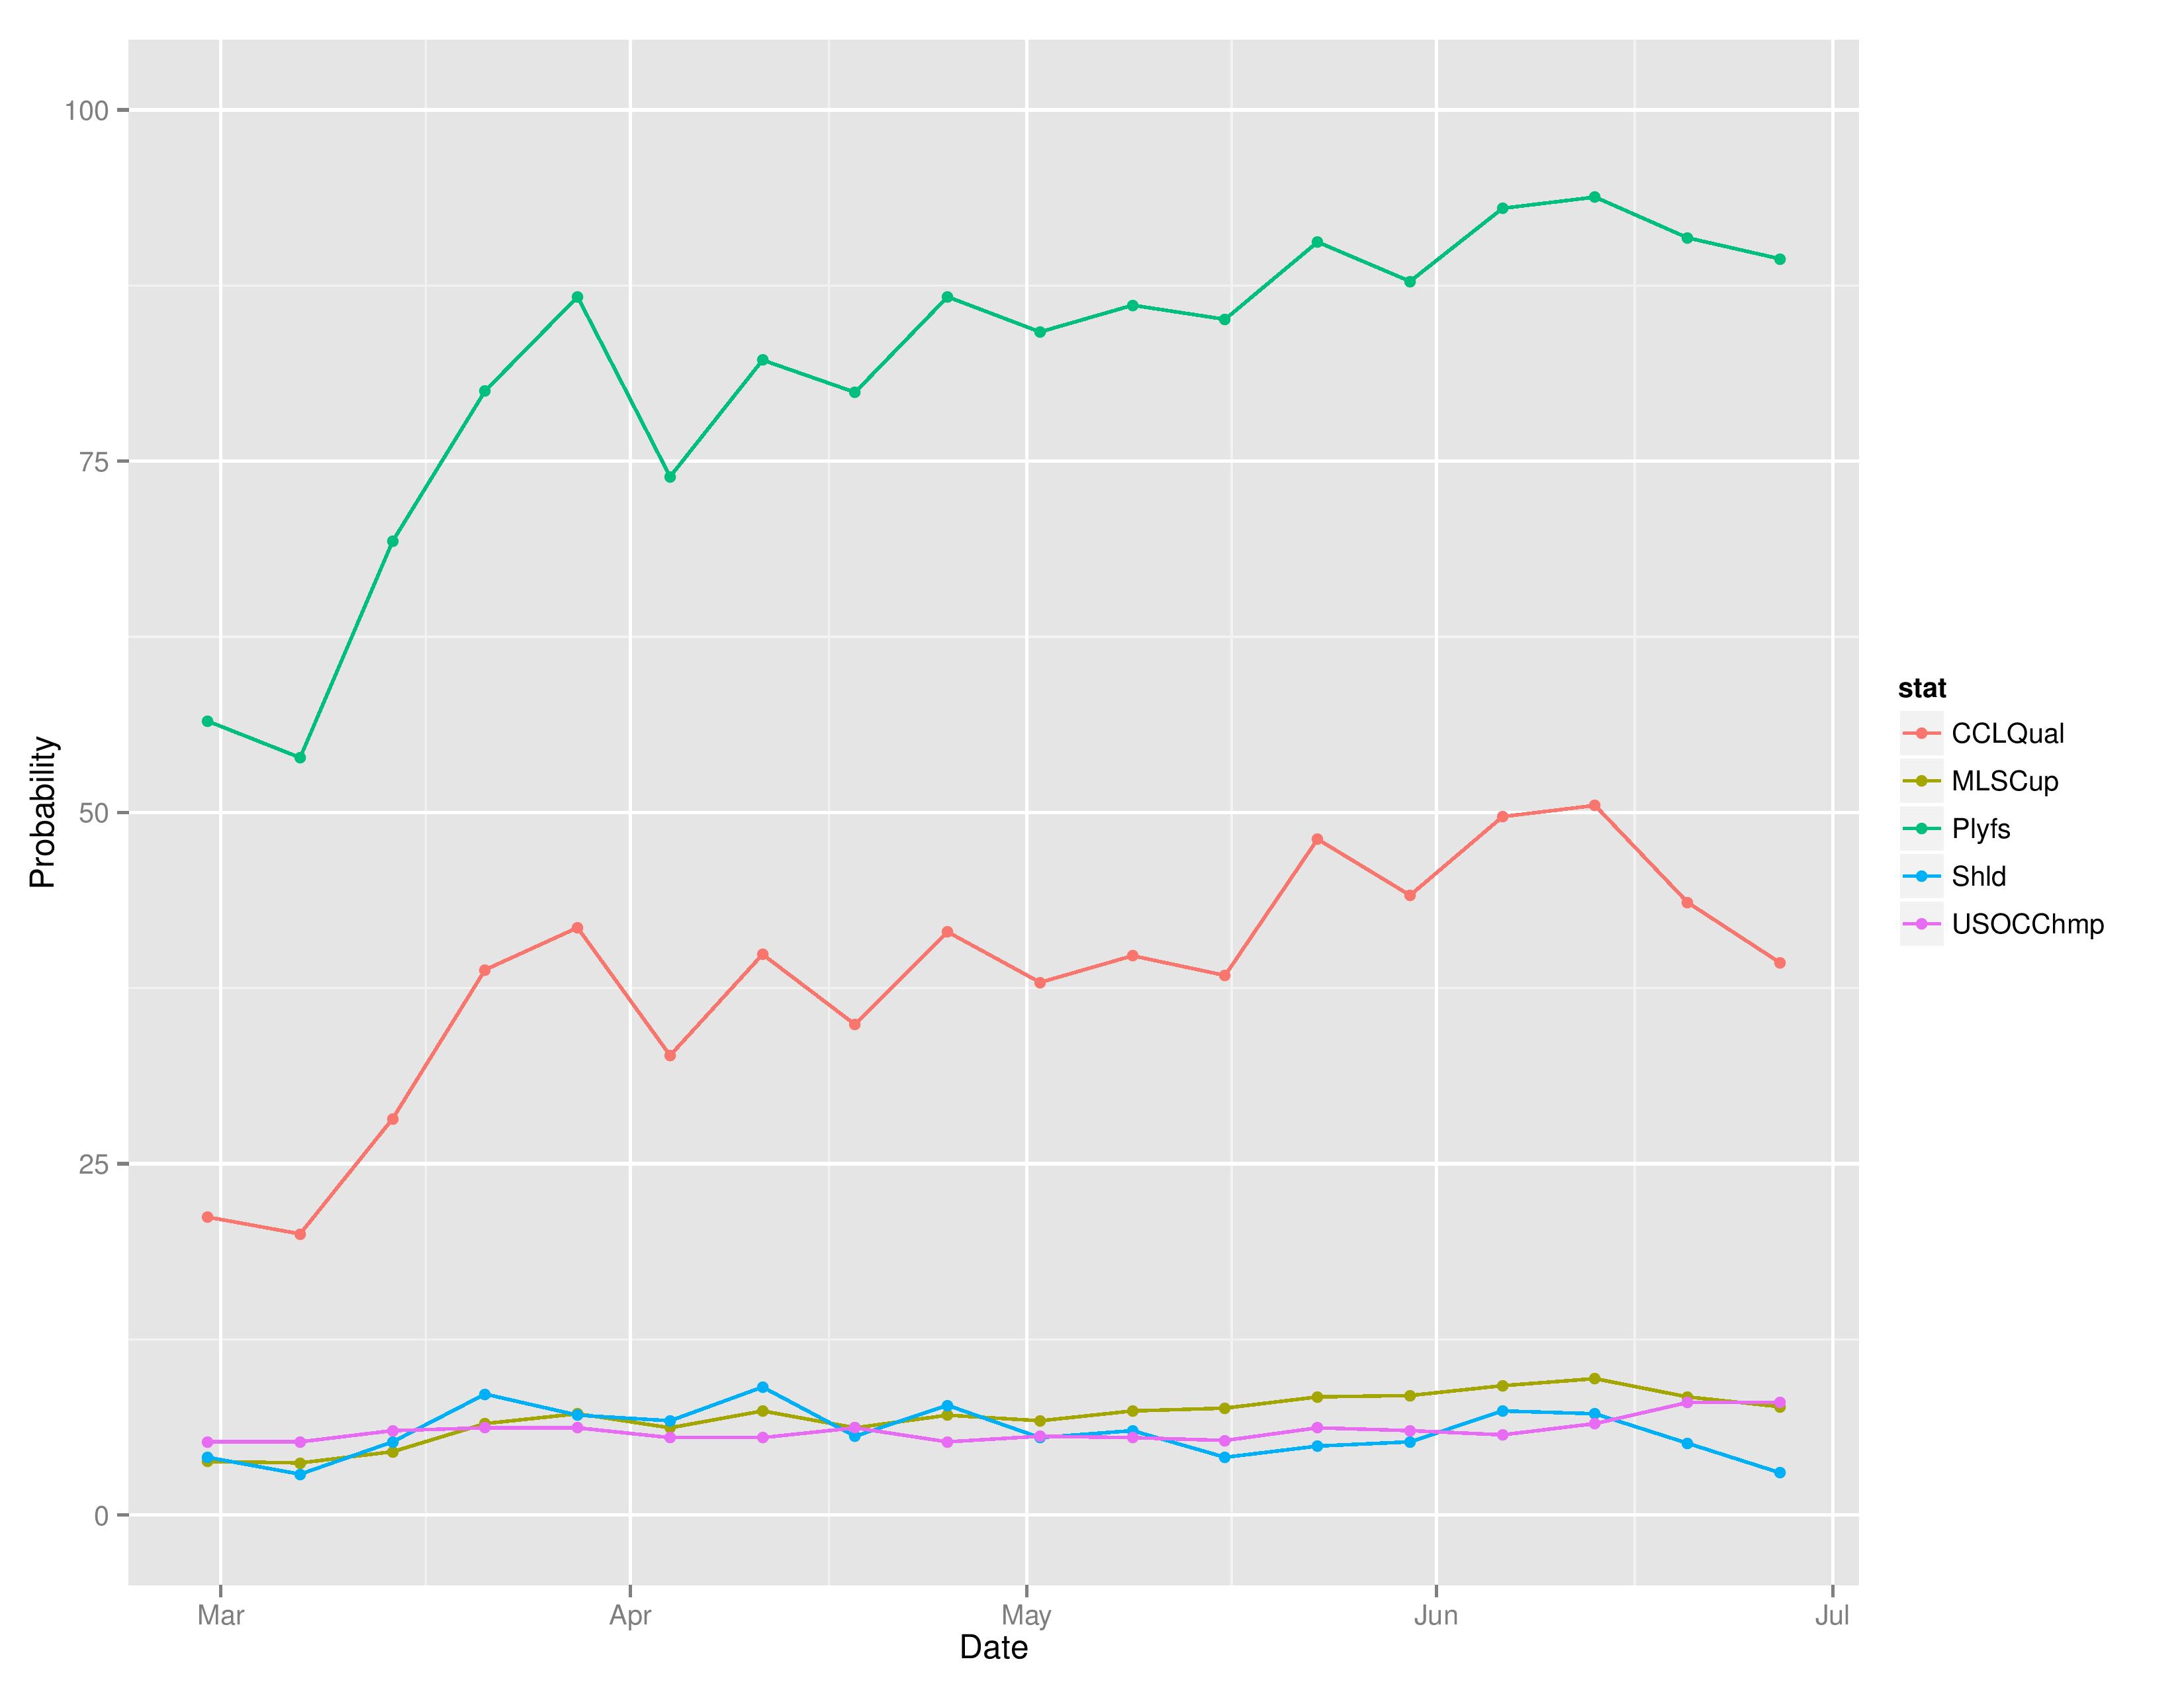
The following charts show the probabilities for making the playoffs, winning the Supporters’ Shield, winning the MLS Cup, winning the USOC Cup, and qualification for CONCACAF Champions League.
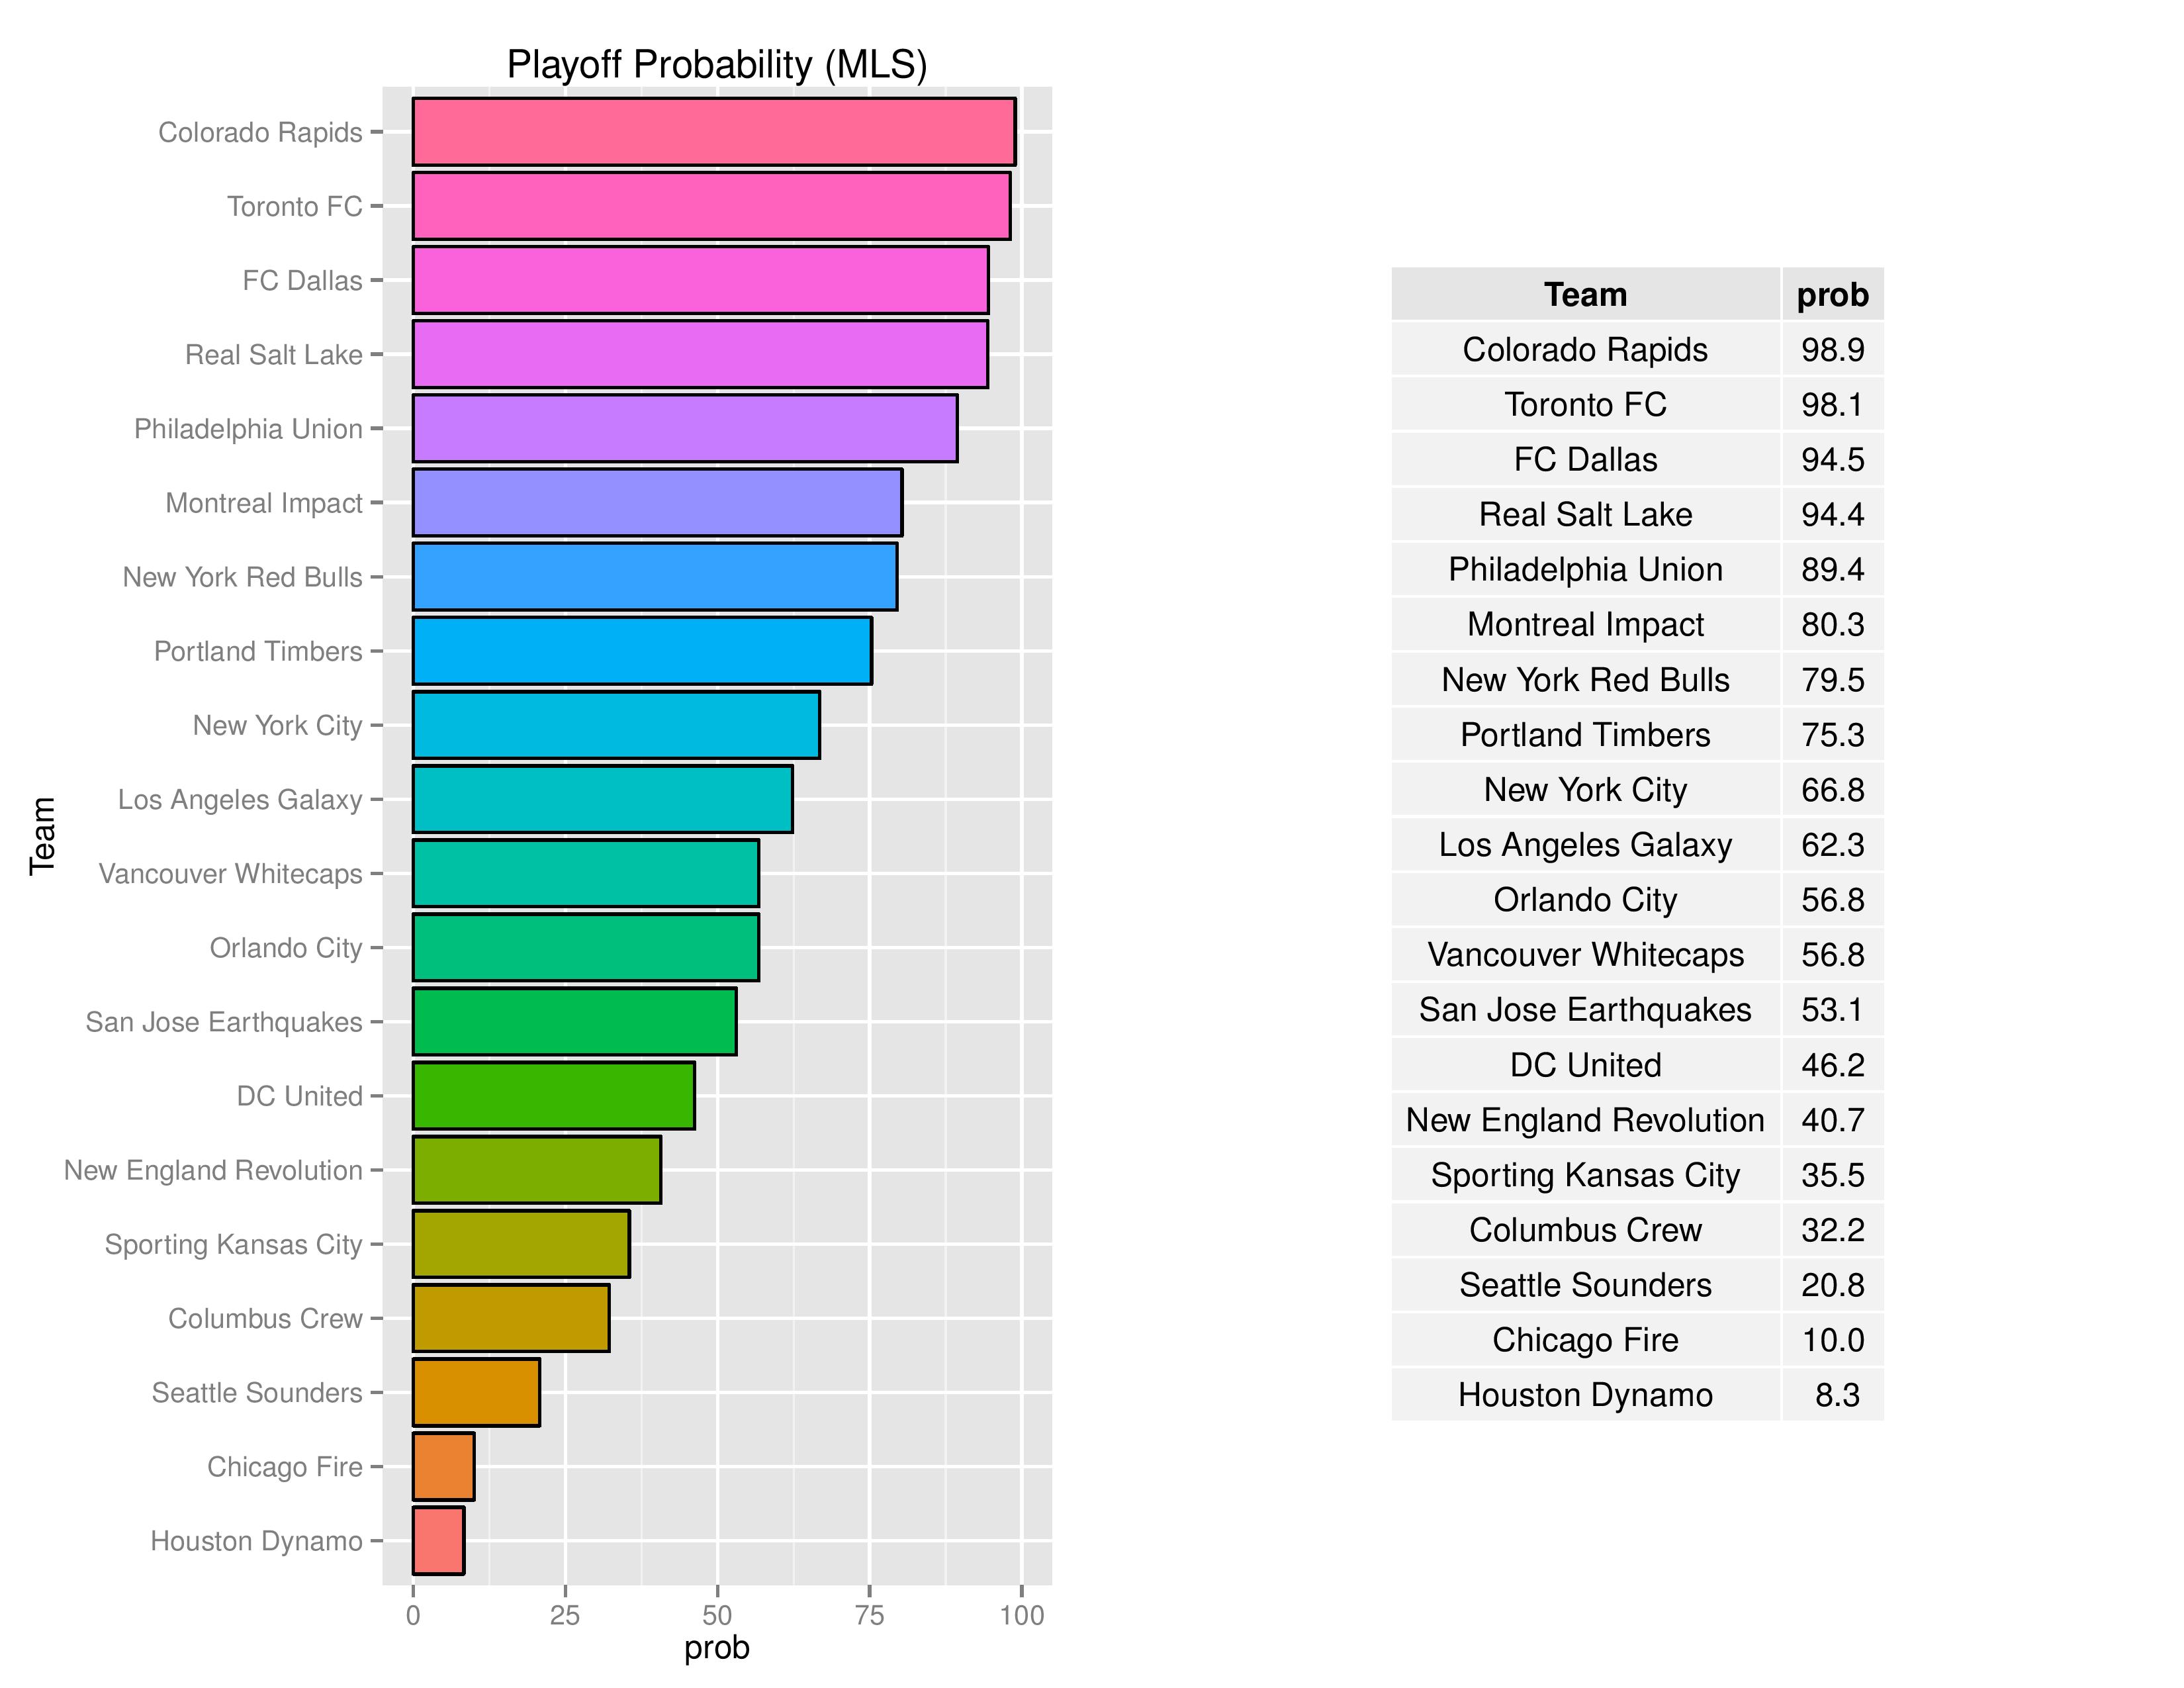
The Union took another dip going from 90.9% to 89.4%. SEBA was, probabilistically, expecting Philadelphia to pick up 3.65 pts in the two matches and they picked up 3 leading to the slight decline in playoff odds.
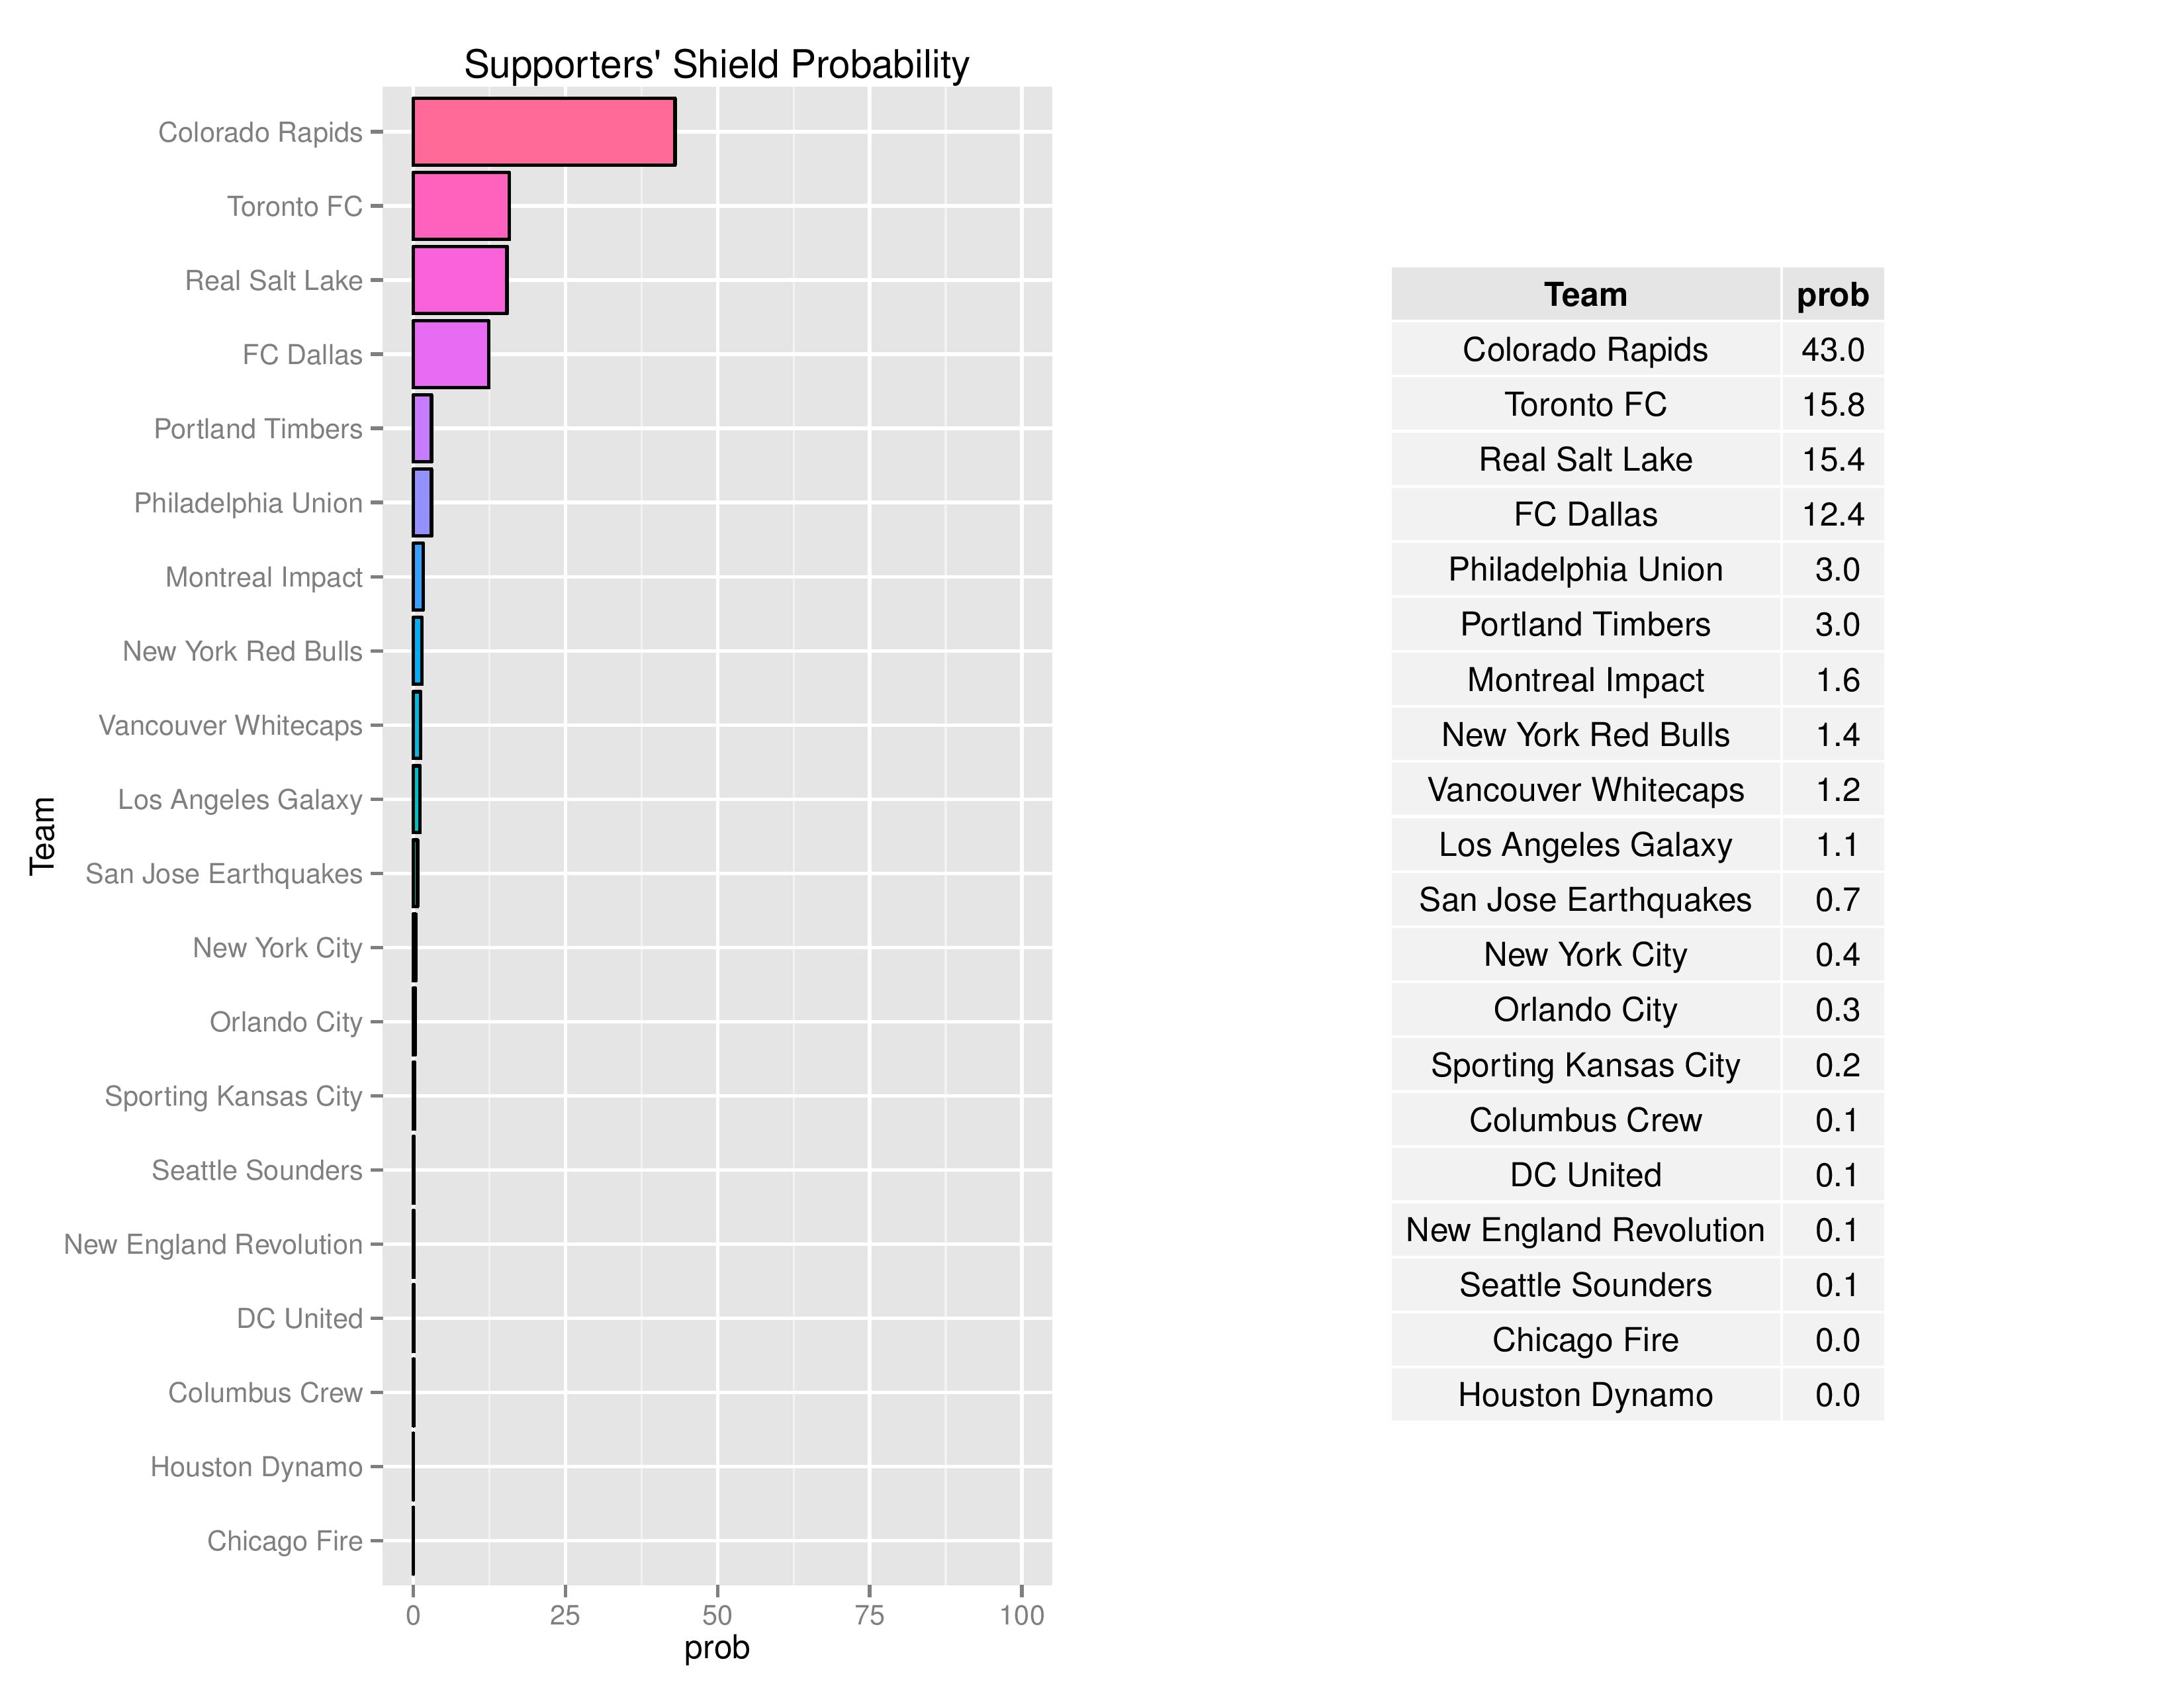
Philadelphia tumbled to 3.0% from 5.1% in their odds of claiming the Shield. With the upcoming schedules, it becomes increasingly unlikely that the Union will manage to pass all of the teams ahead of them.
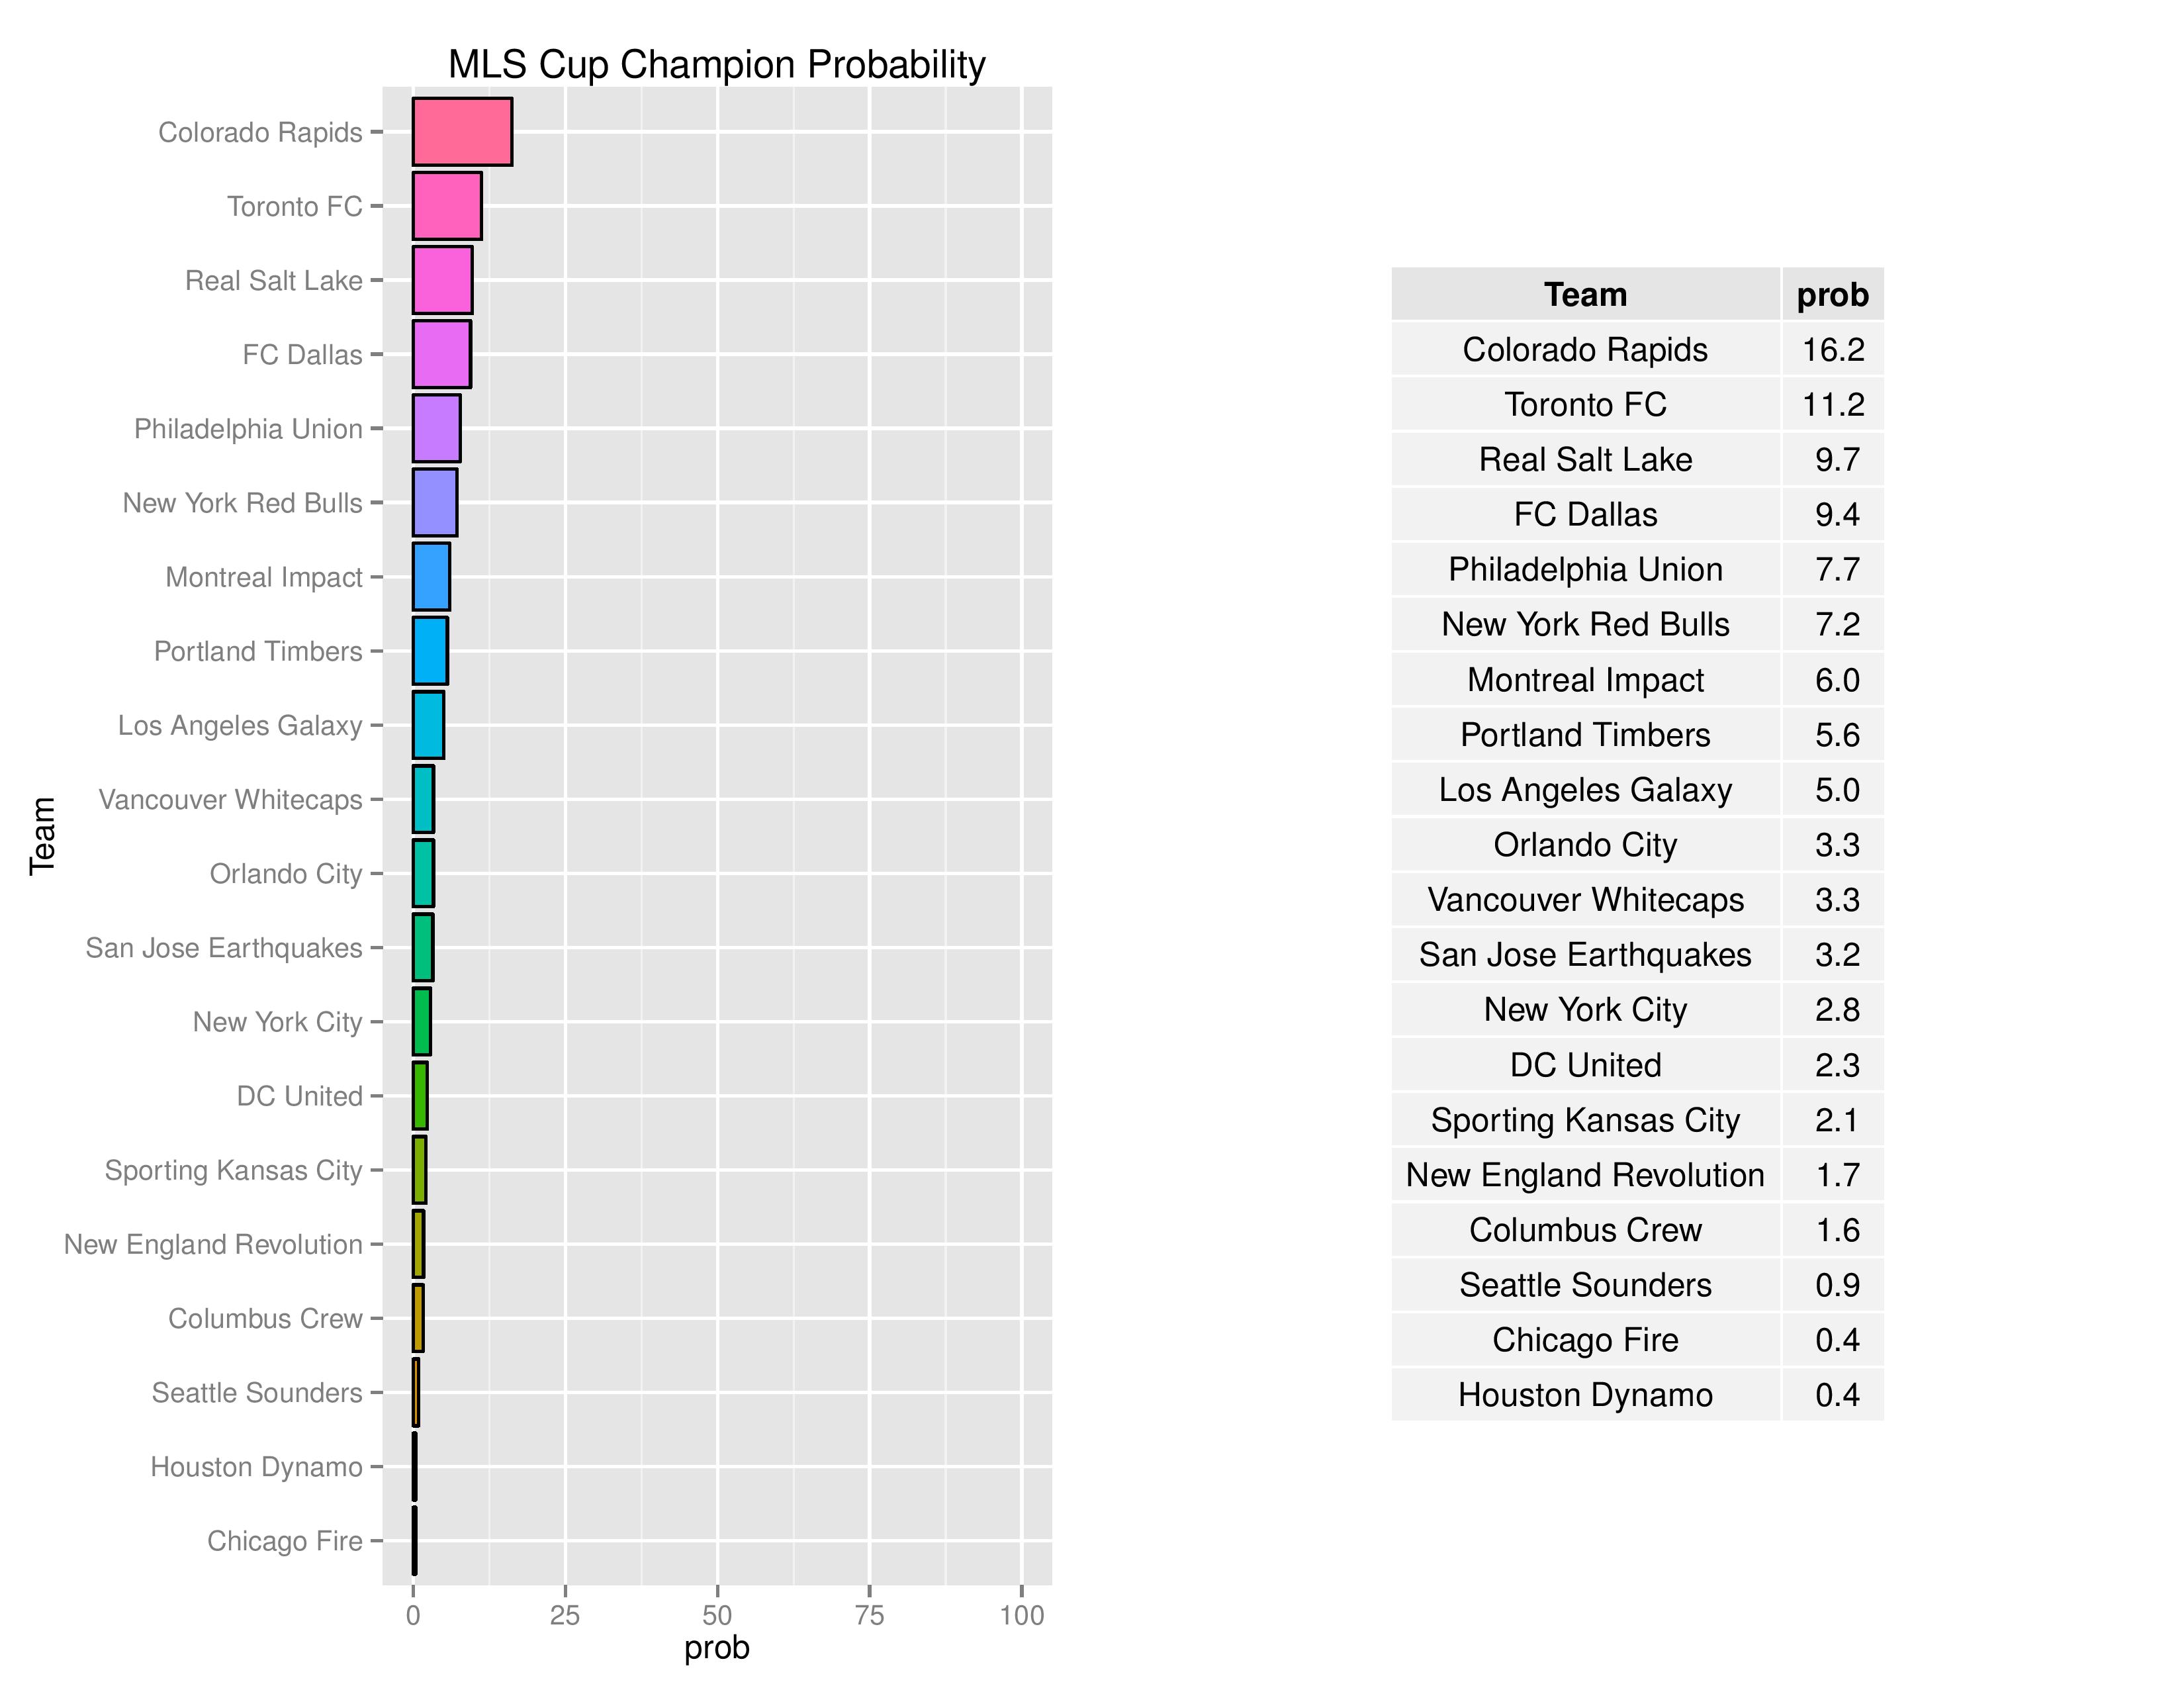
The Union decreased their odds from 8.4% last week to 7.7%. Toronto’s edge on obtaining a first-round-bye is increasing and so is the competition for the other Eastern Conference first-round-bye.
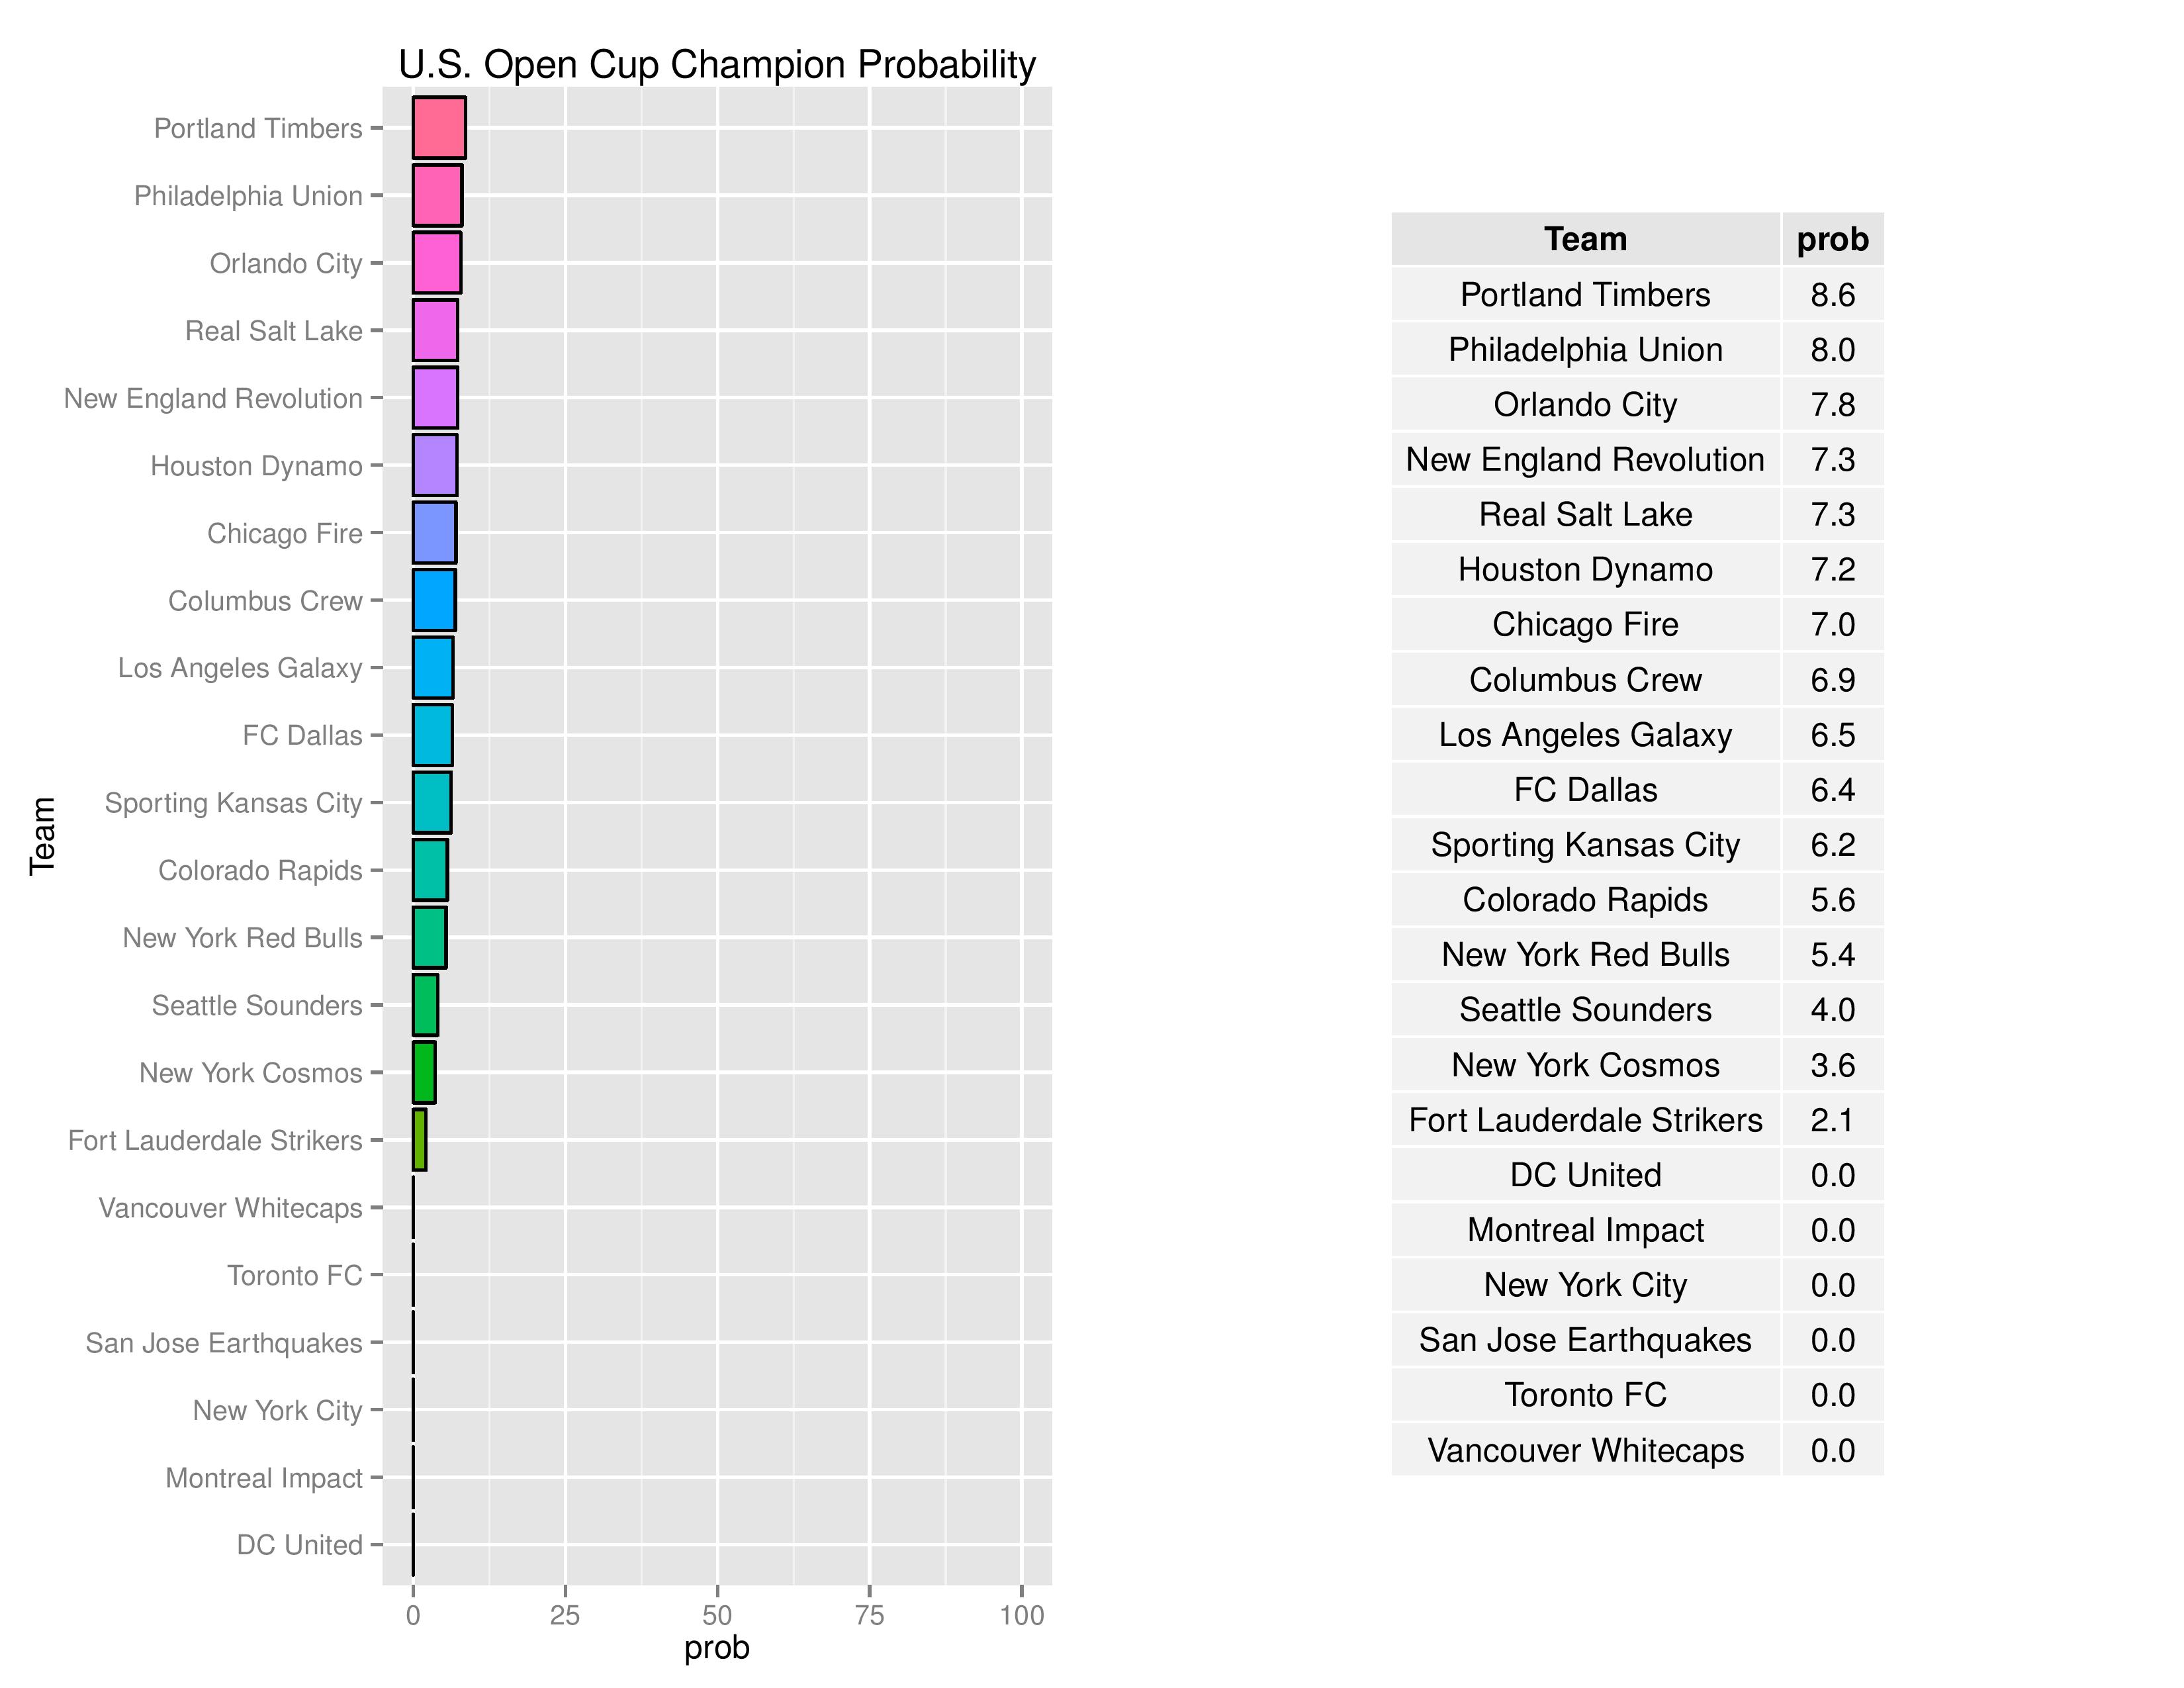
Philadelphia remained at 8.0% in their probability to win the US Open Cup. The draw (Home against NYRB, Away against Revolution/Cosmos, and then against Chicago/Columbus/Orlando/Fort Lauderdale) is more immediately favorable to the Union than other teams, especially Western conference teams, will have.
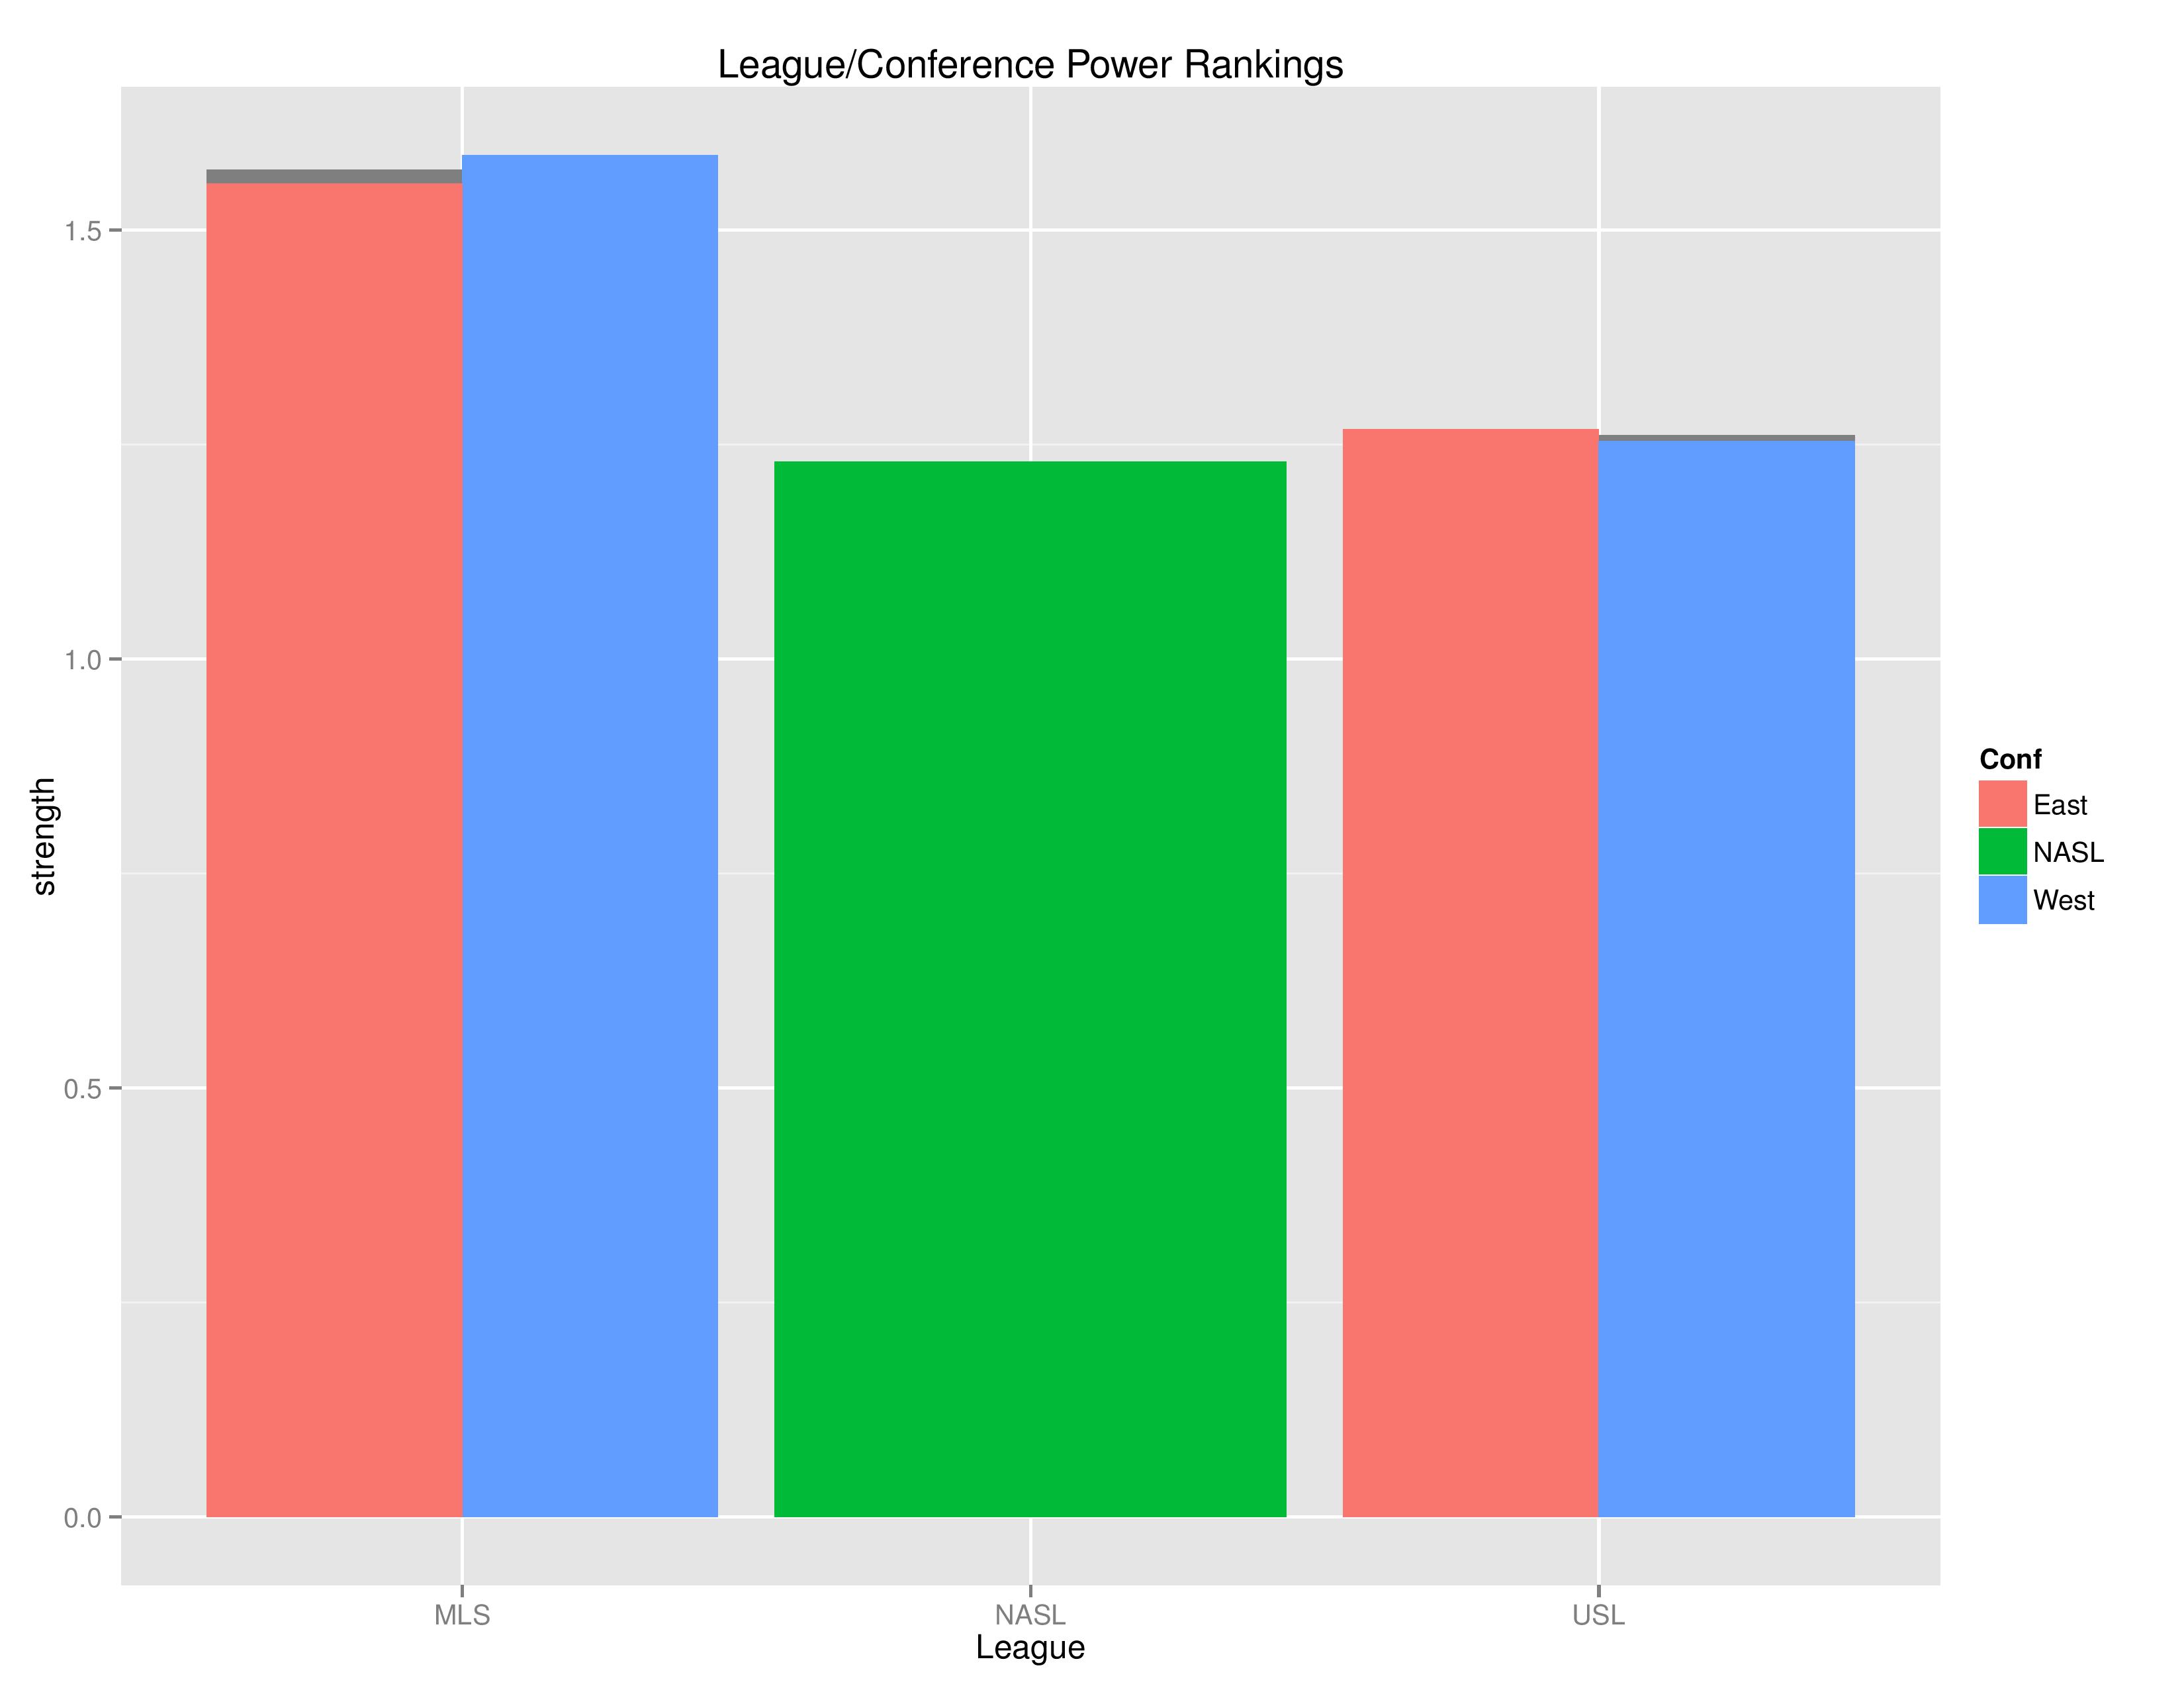
The above shows how the model rates each U.S. league & conference compared to one another. This is based on an all vs. all assessment rather than a top vs. top assessment. MLS is clearly rated as superior to either NASL or USL. USL has a slight edge over NASL though despite NASL still having two teams available in the USOC. This also shows the MLS-West outperforming MLS-East and USL-East slightly outperforming USL-West.
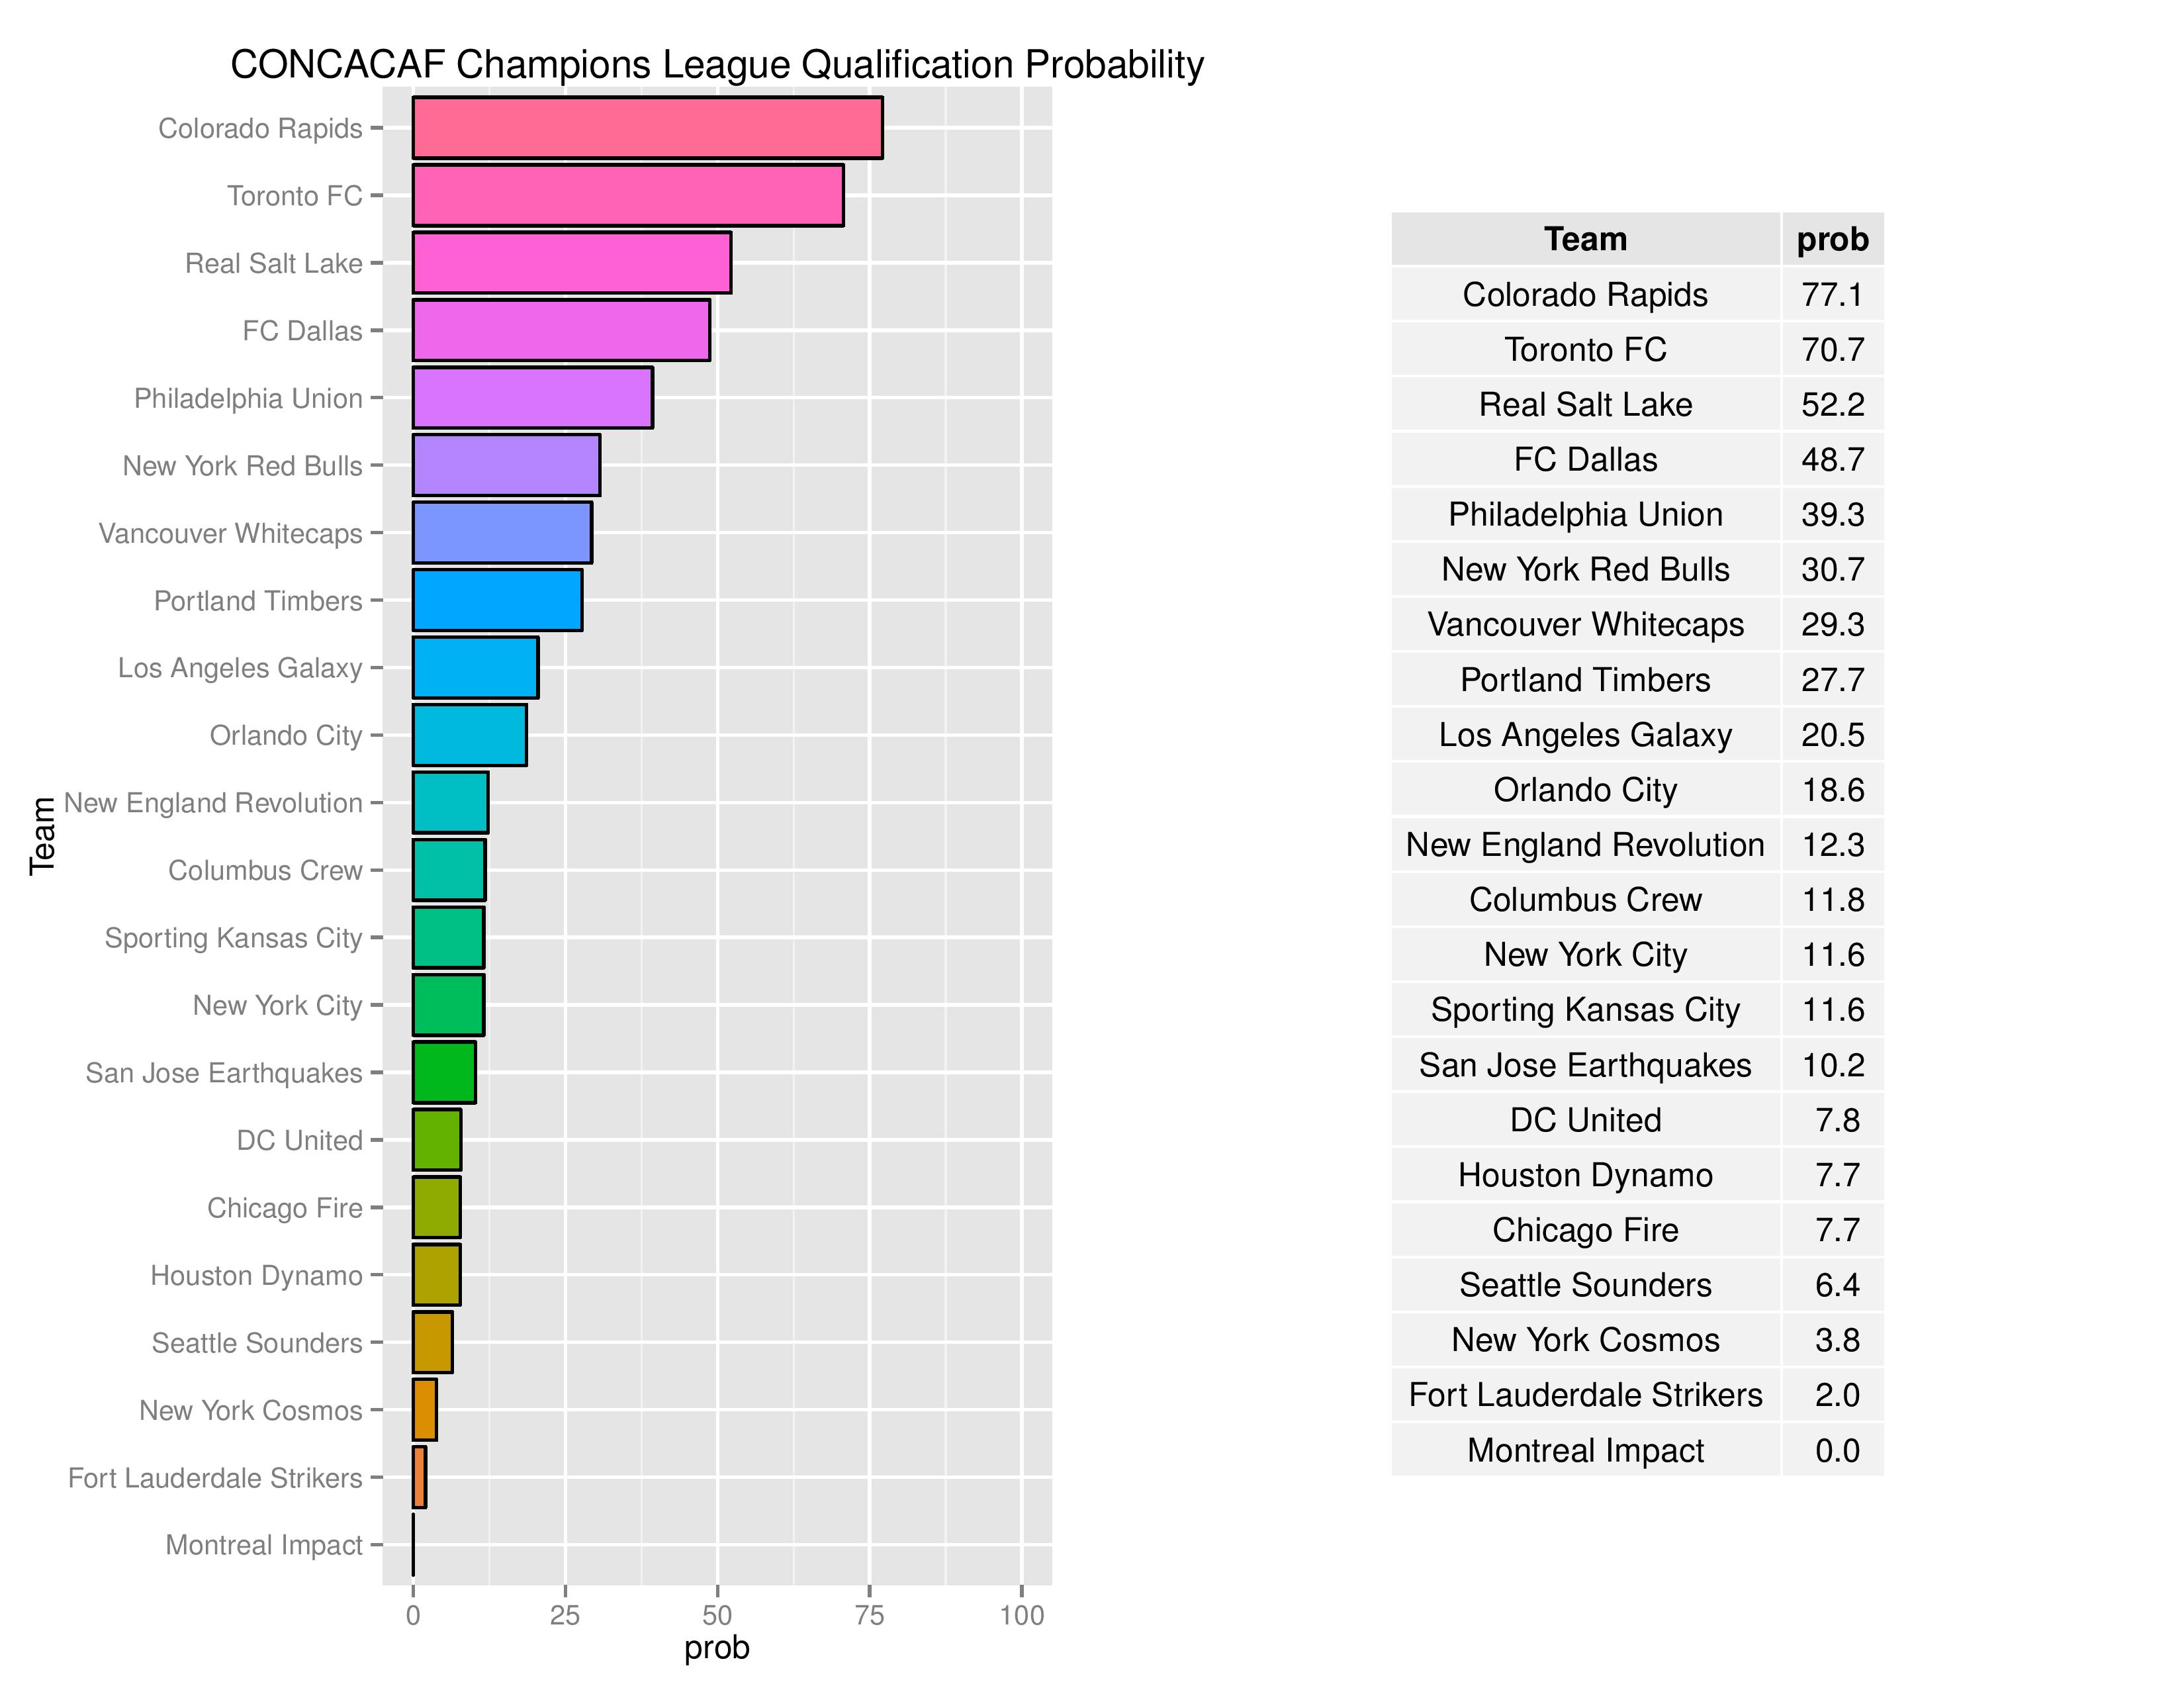
Philadelphia’s probability of qualifying for the CCL reduced from 43.6% to 39.3%. As a reminder, U.S. teams qualify for the CCL by winning the MLS Cup, winning a conference in the regular season (including Supporters’ Shield), and by winning the U.S. Open Cup (or being a top single-table-performer if the former qualifications don’t count for 4 slots). Canadian teams qualify by winning the Canadian Championship.
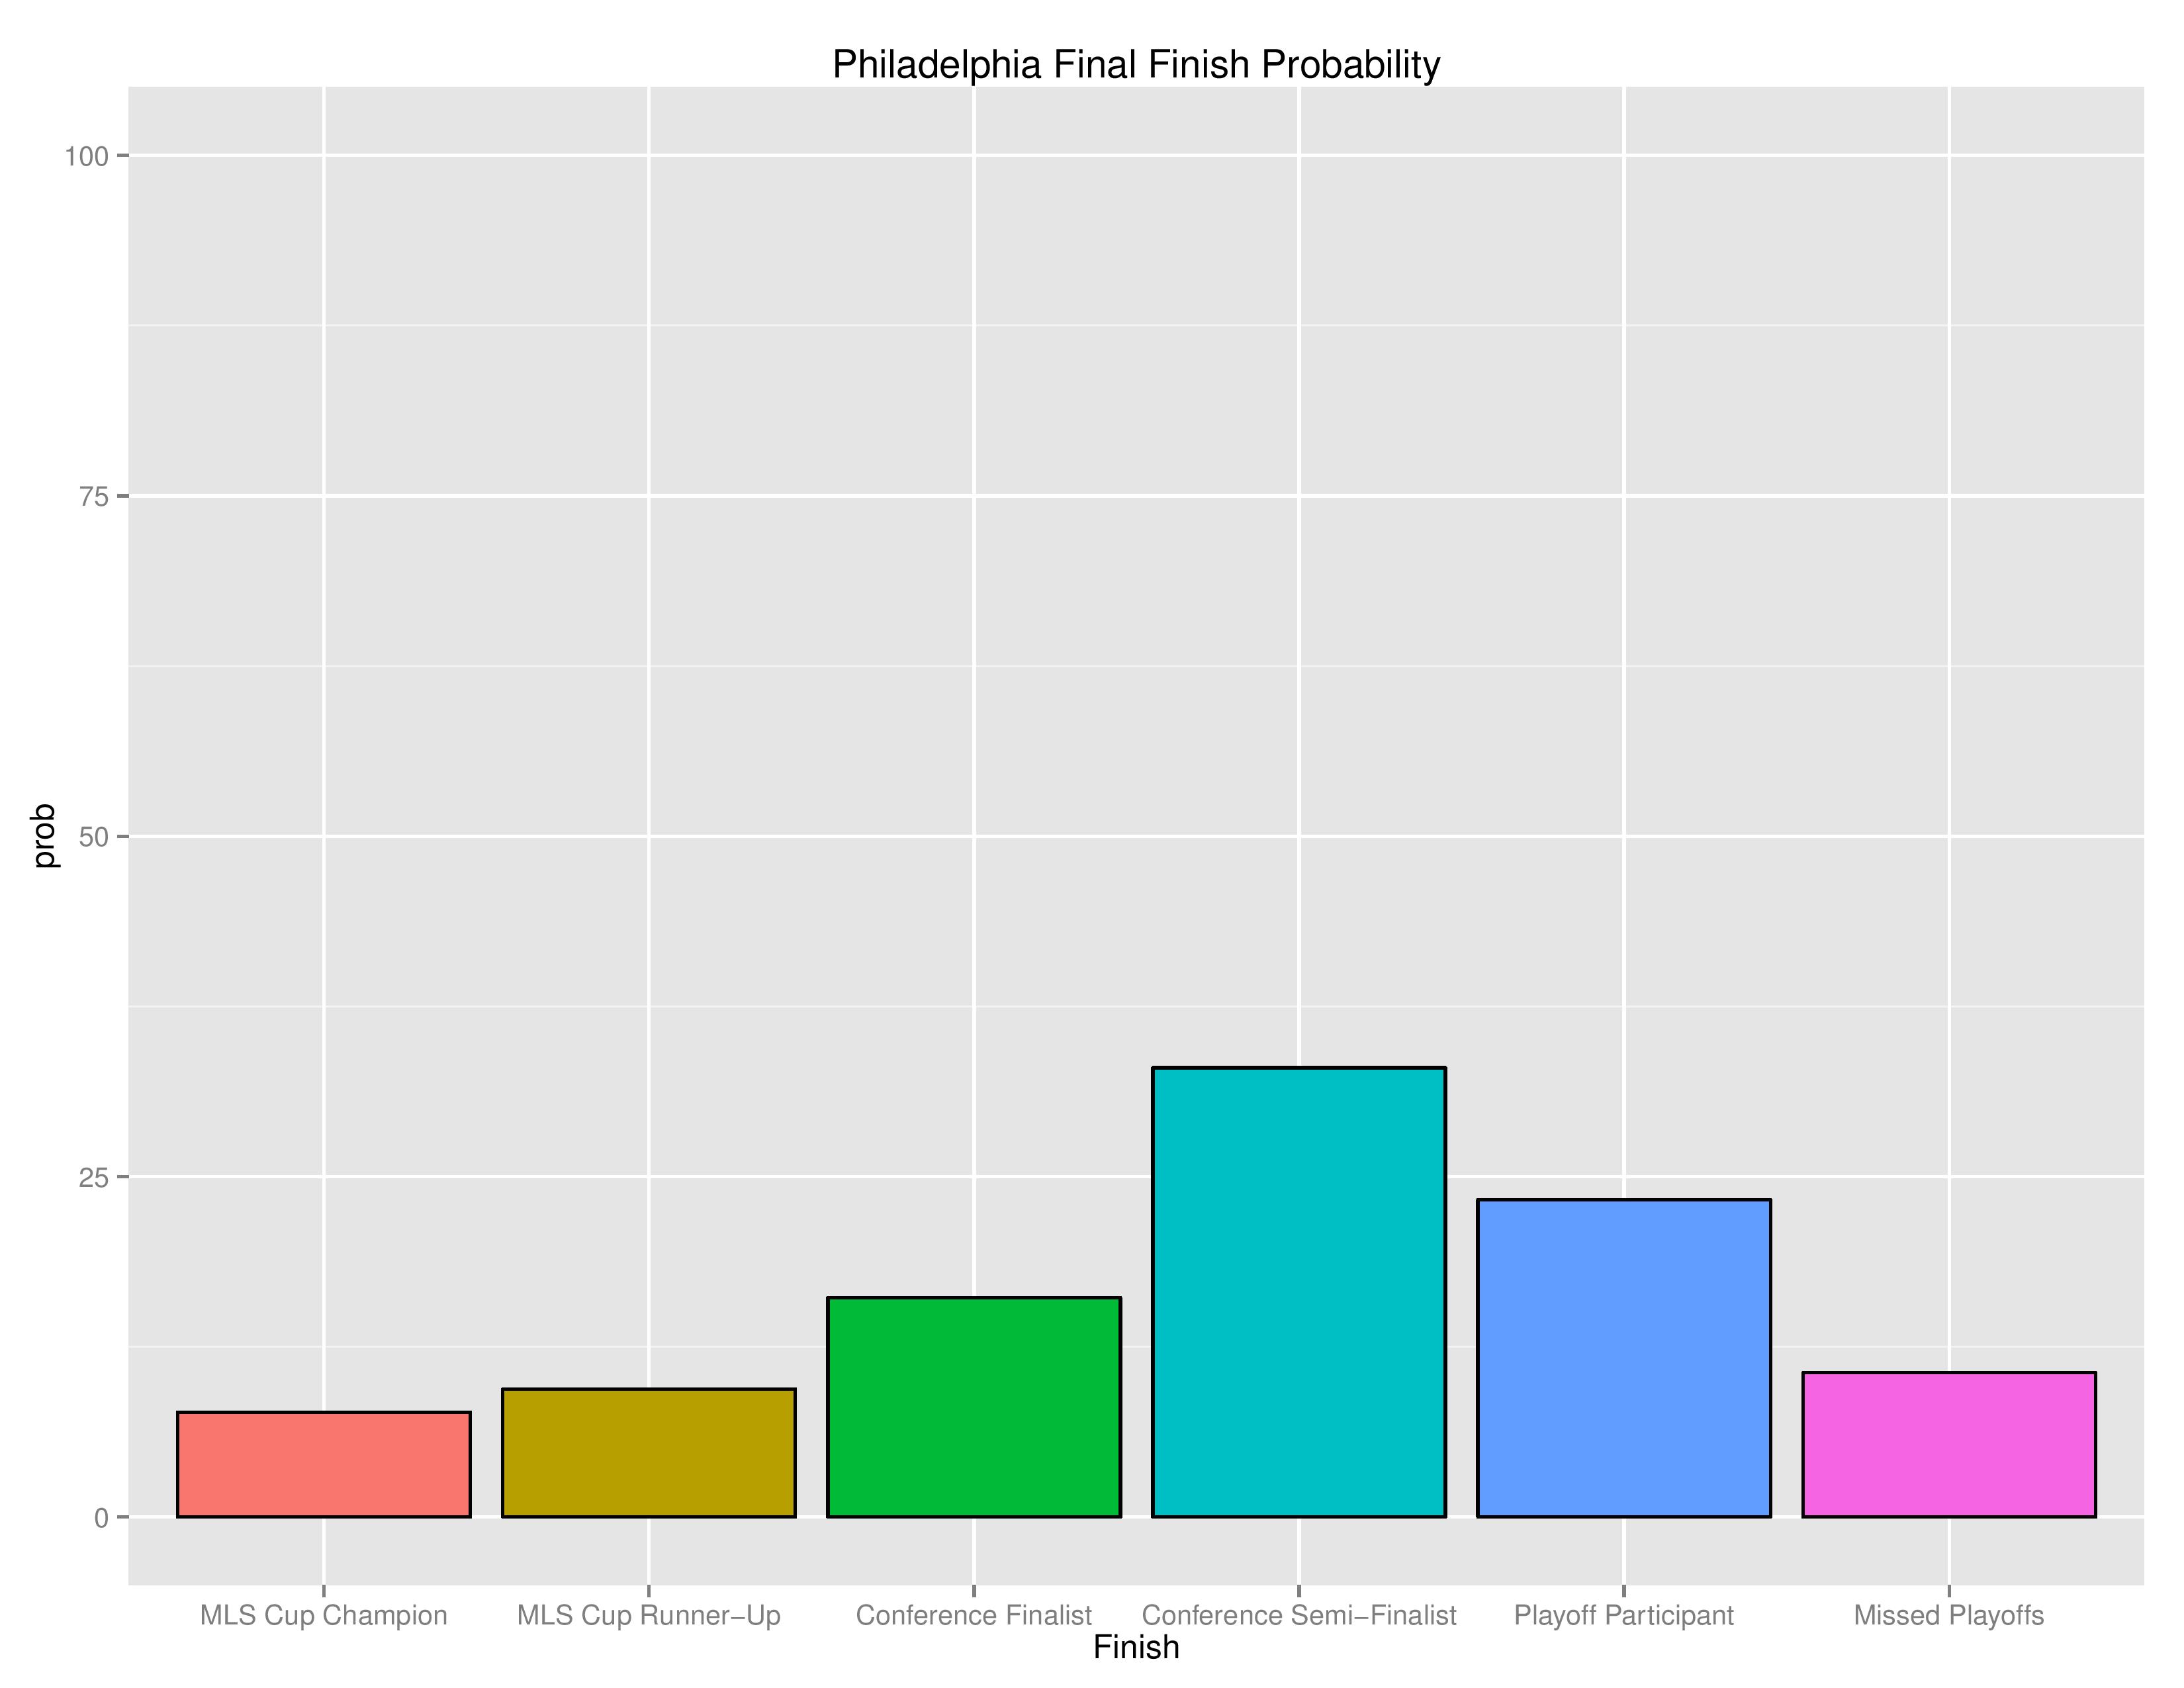
Philadelphia finishing
The following shows the probability of various Playoff categories and Philadelphia’s probability of each of them.
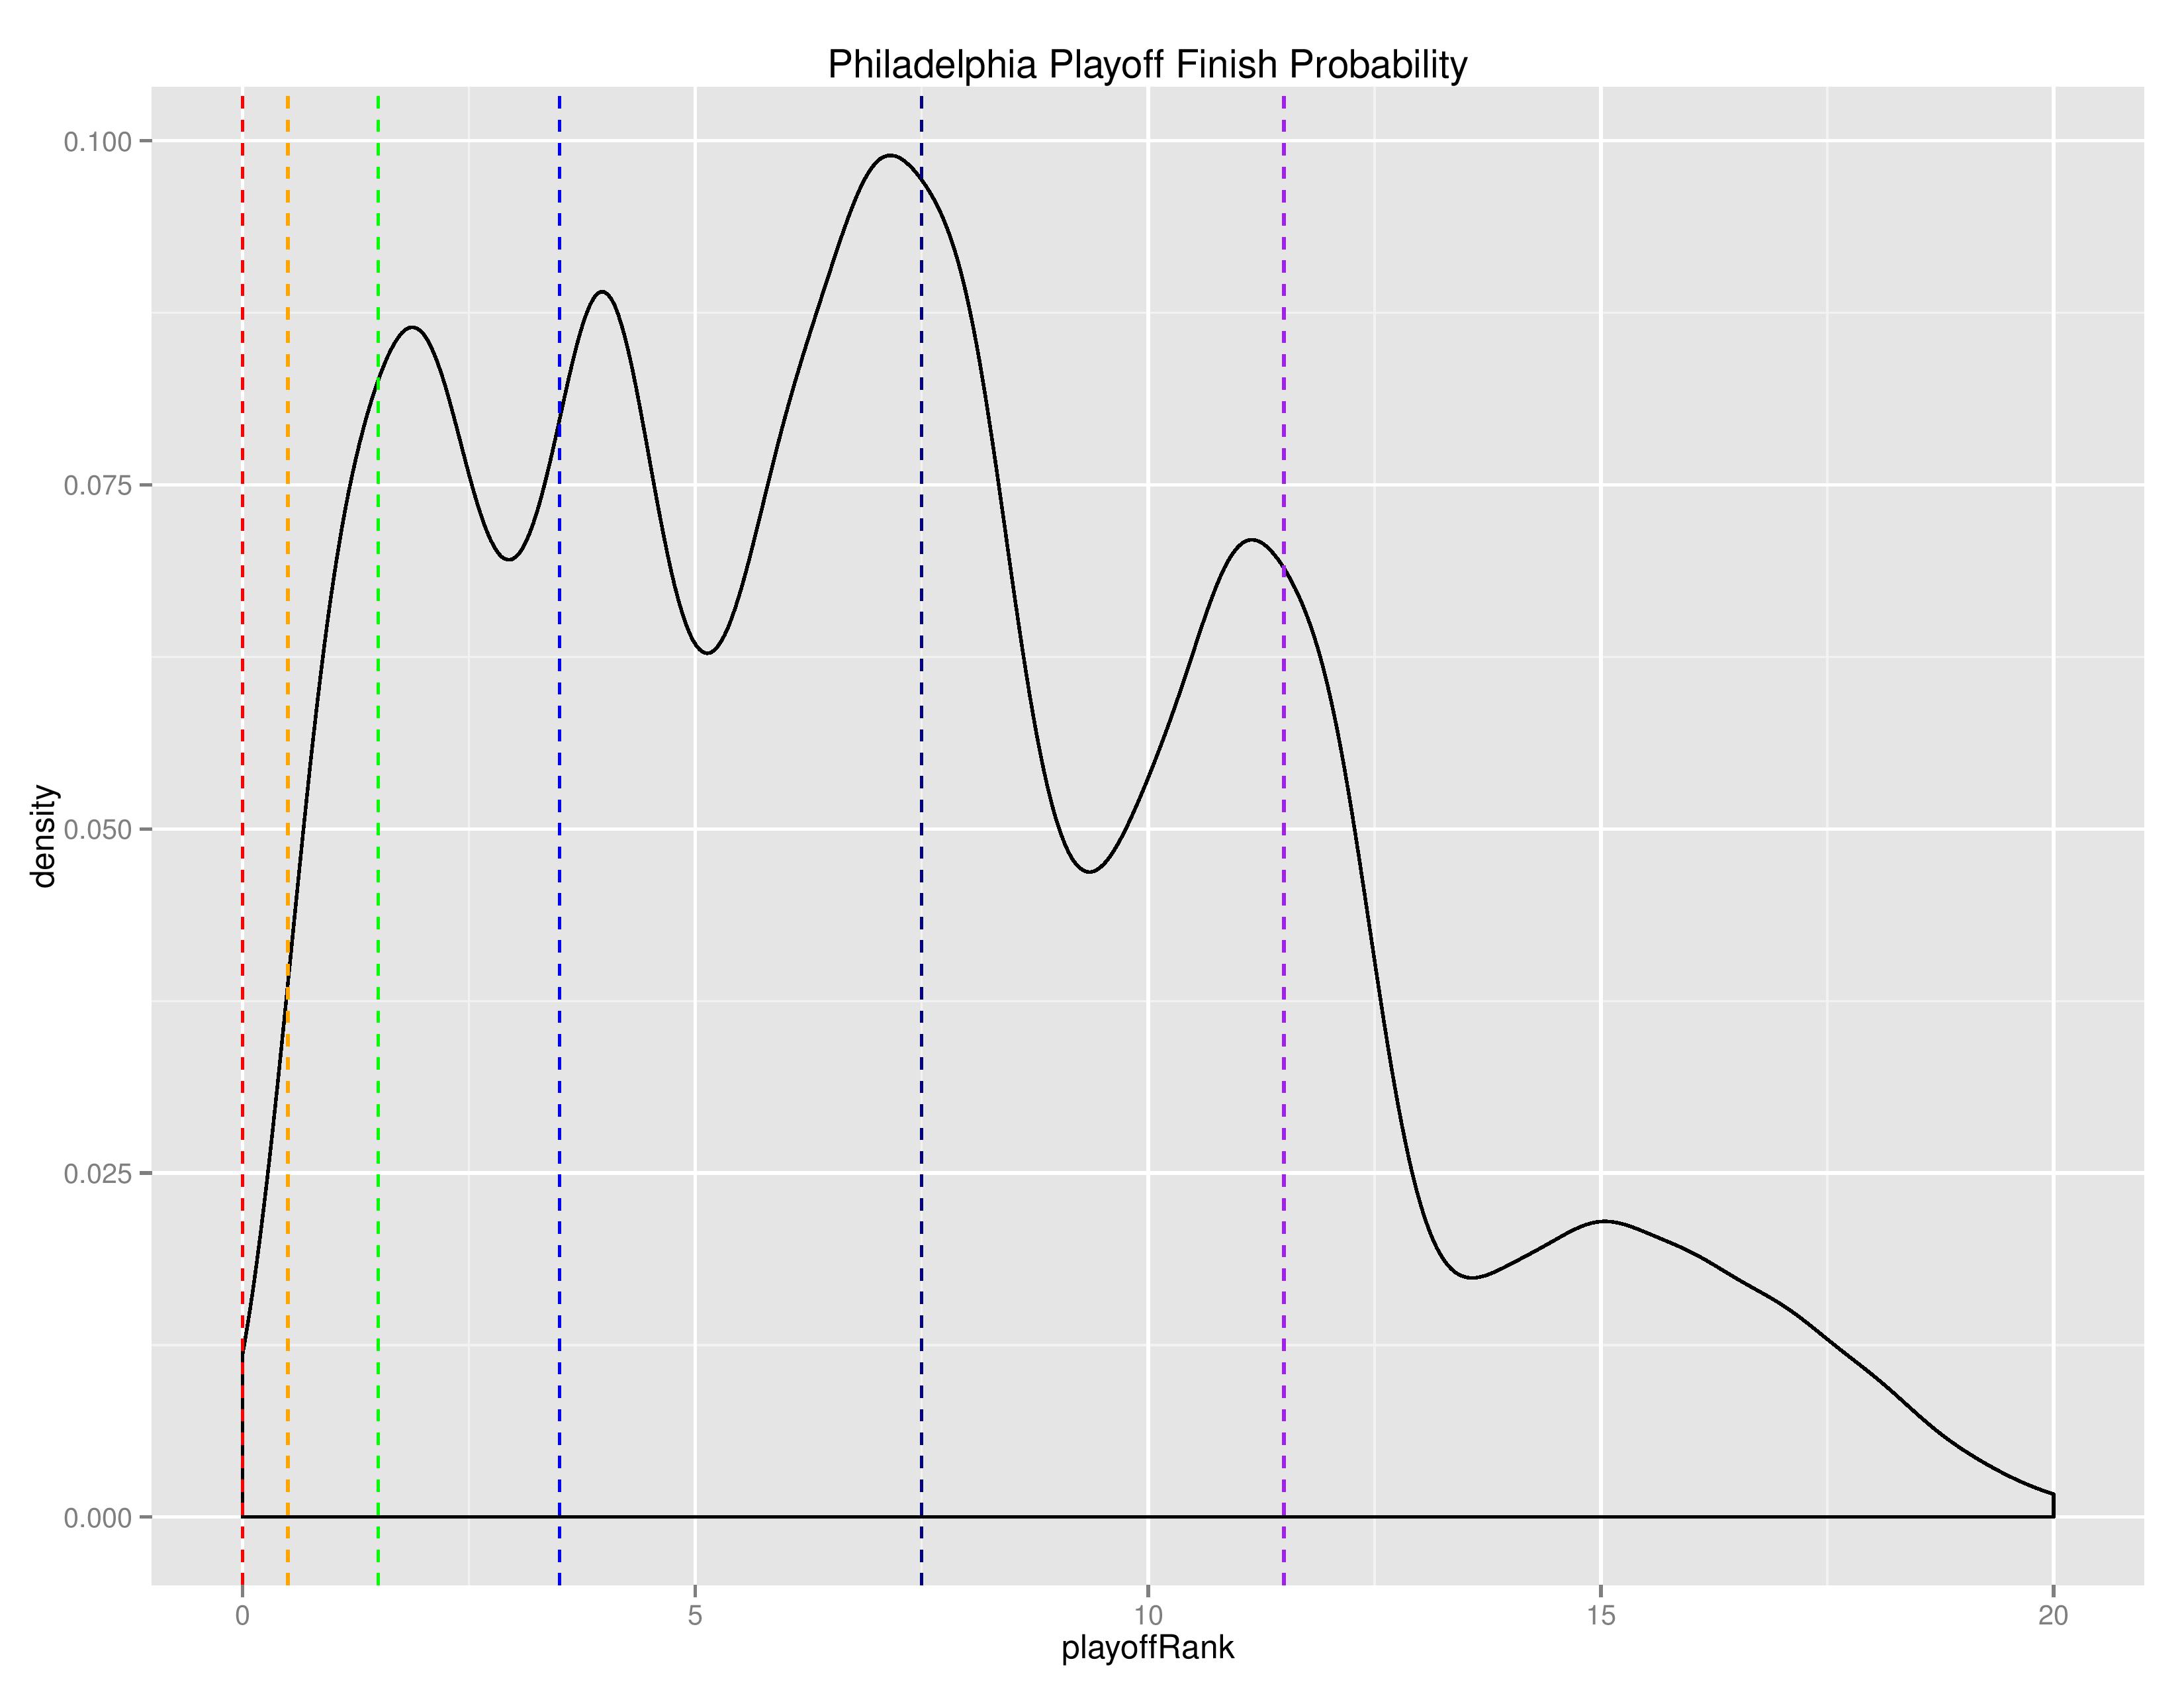
The following is a “density” chart showing the relative probability of Philadelphia finishing at the different after-playoffs rankings from 1 to 20.
To repeat myself, the loopy-ness you see in the higher ranks is likely due to the disparity in conference strength. If Philadelphia finishes in a higher round than a Western team, they are automatically ranked higher, but if they finish in the same round, Philadelphia will often be ranked lower (based on regular season single-table finishing).
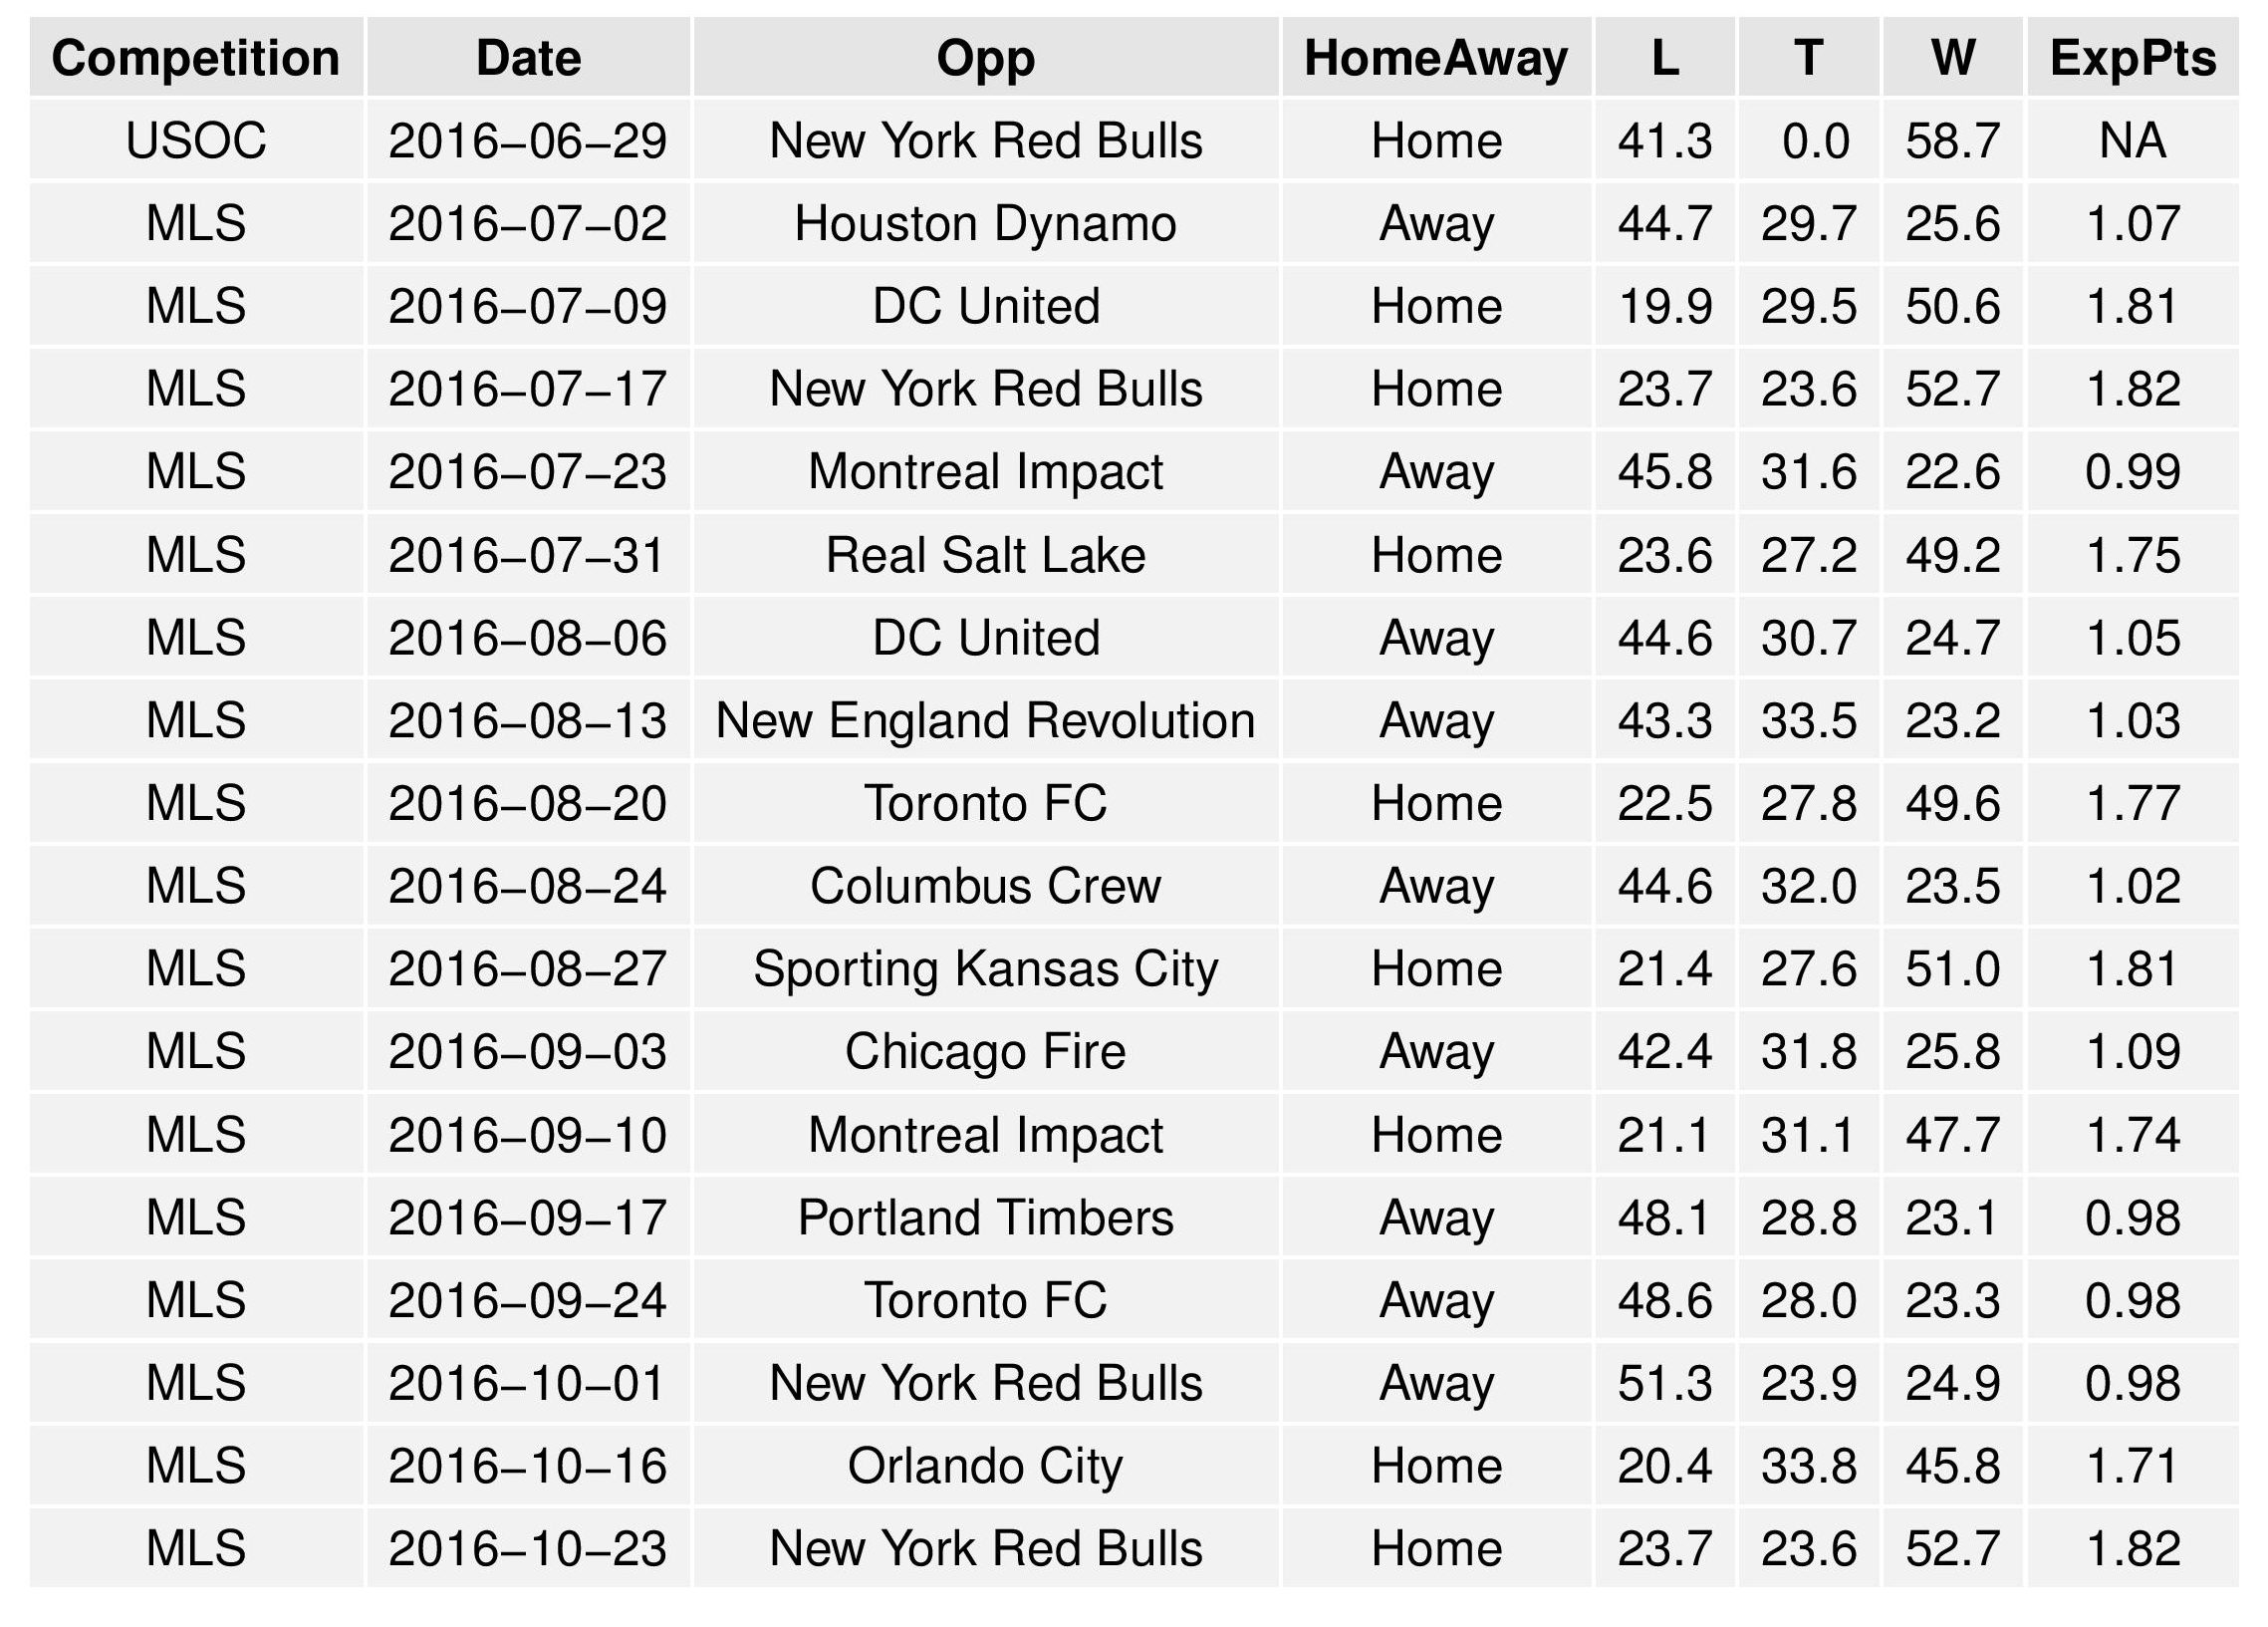
The following is the list of Philadelphia’s remaining scheduled matches accompanied by result probabilities as predicted by SEBA.
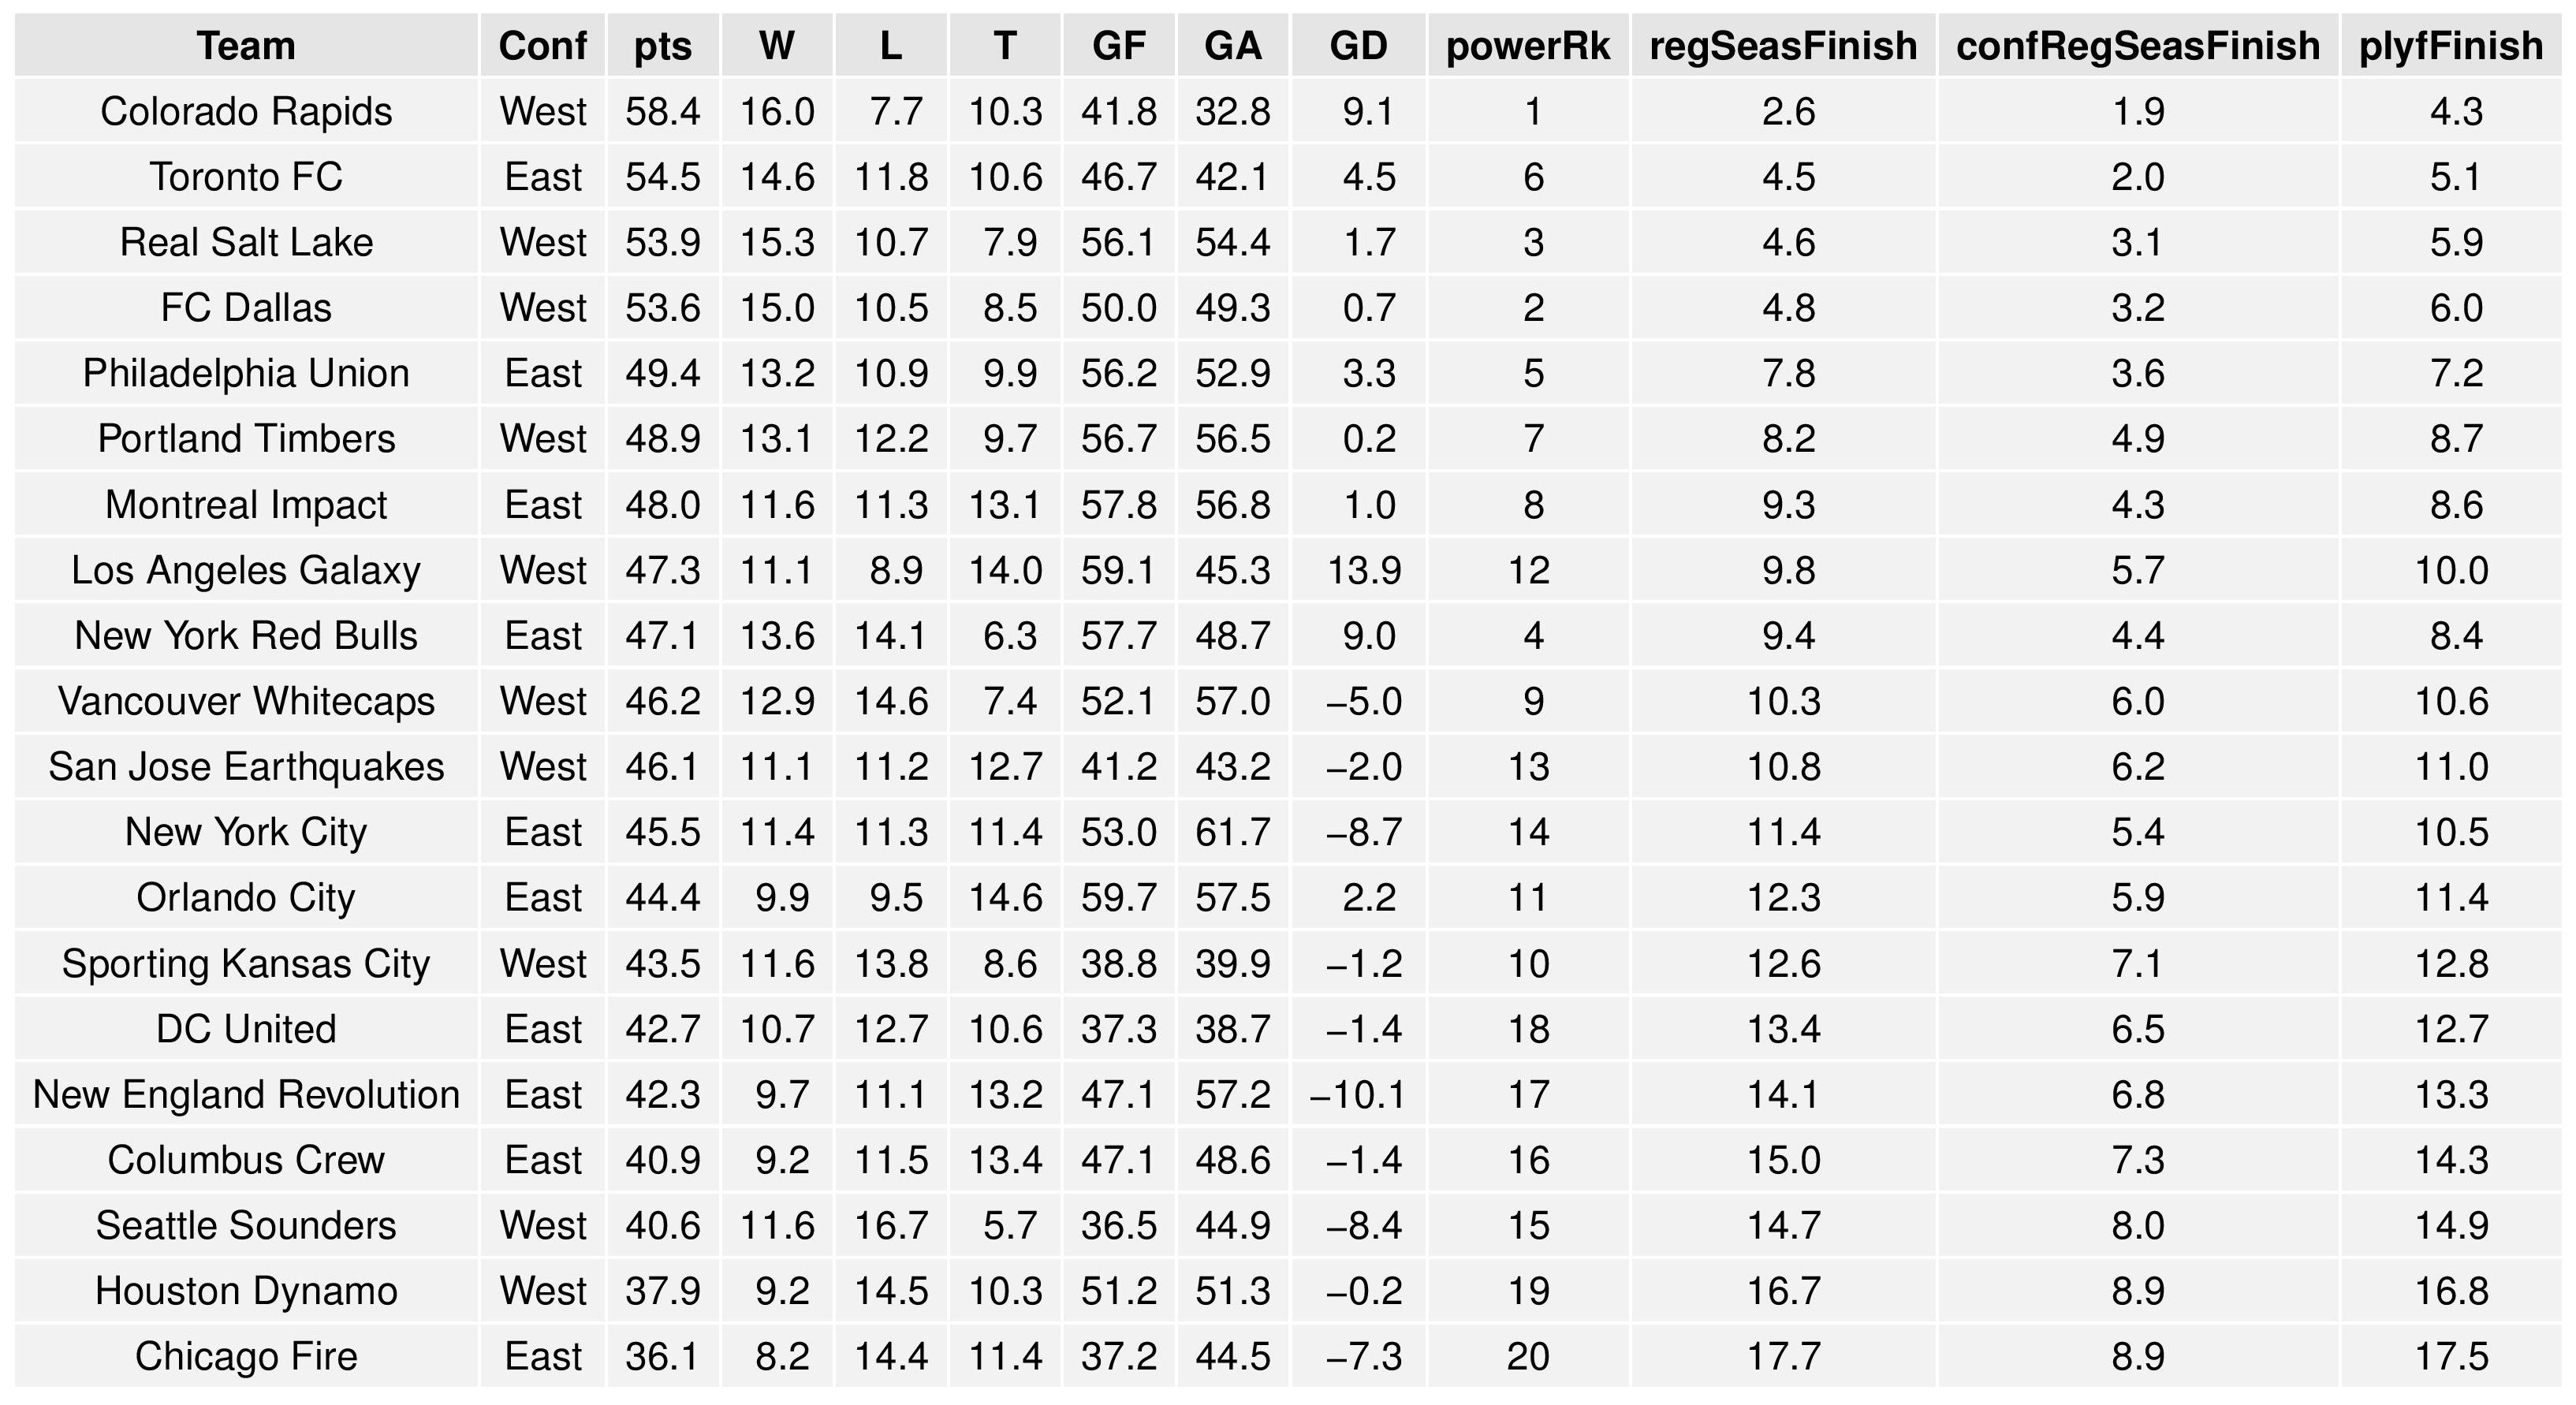
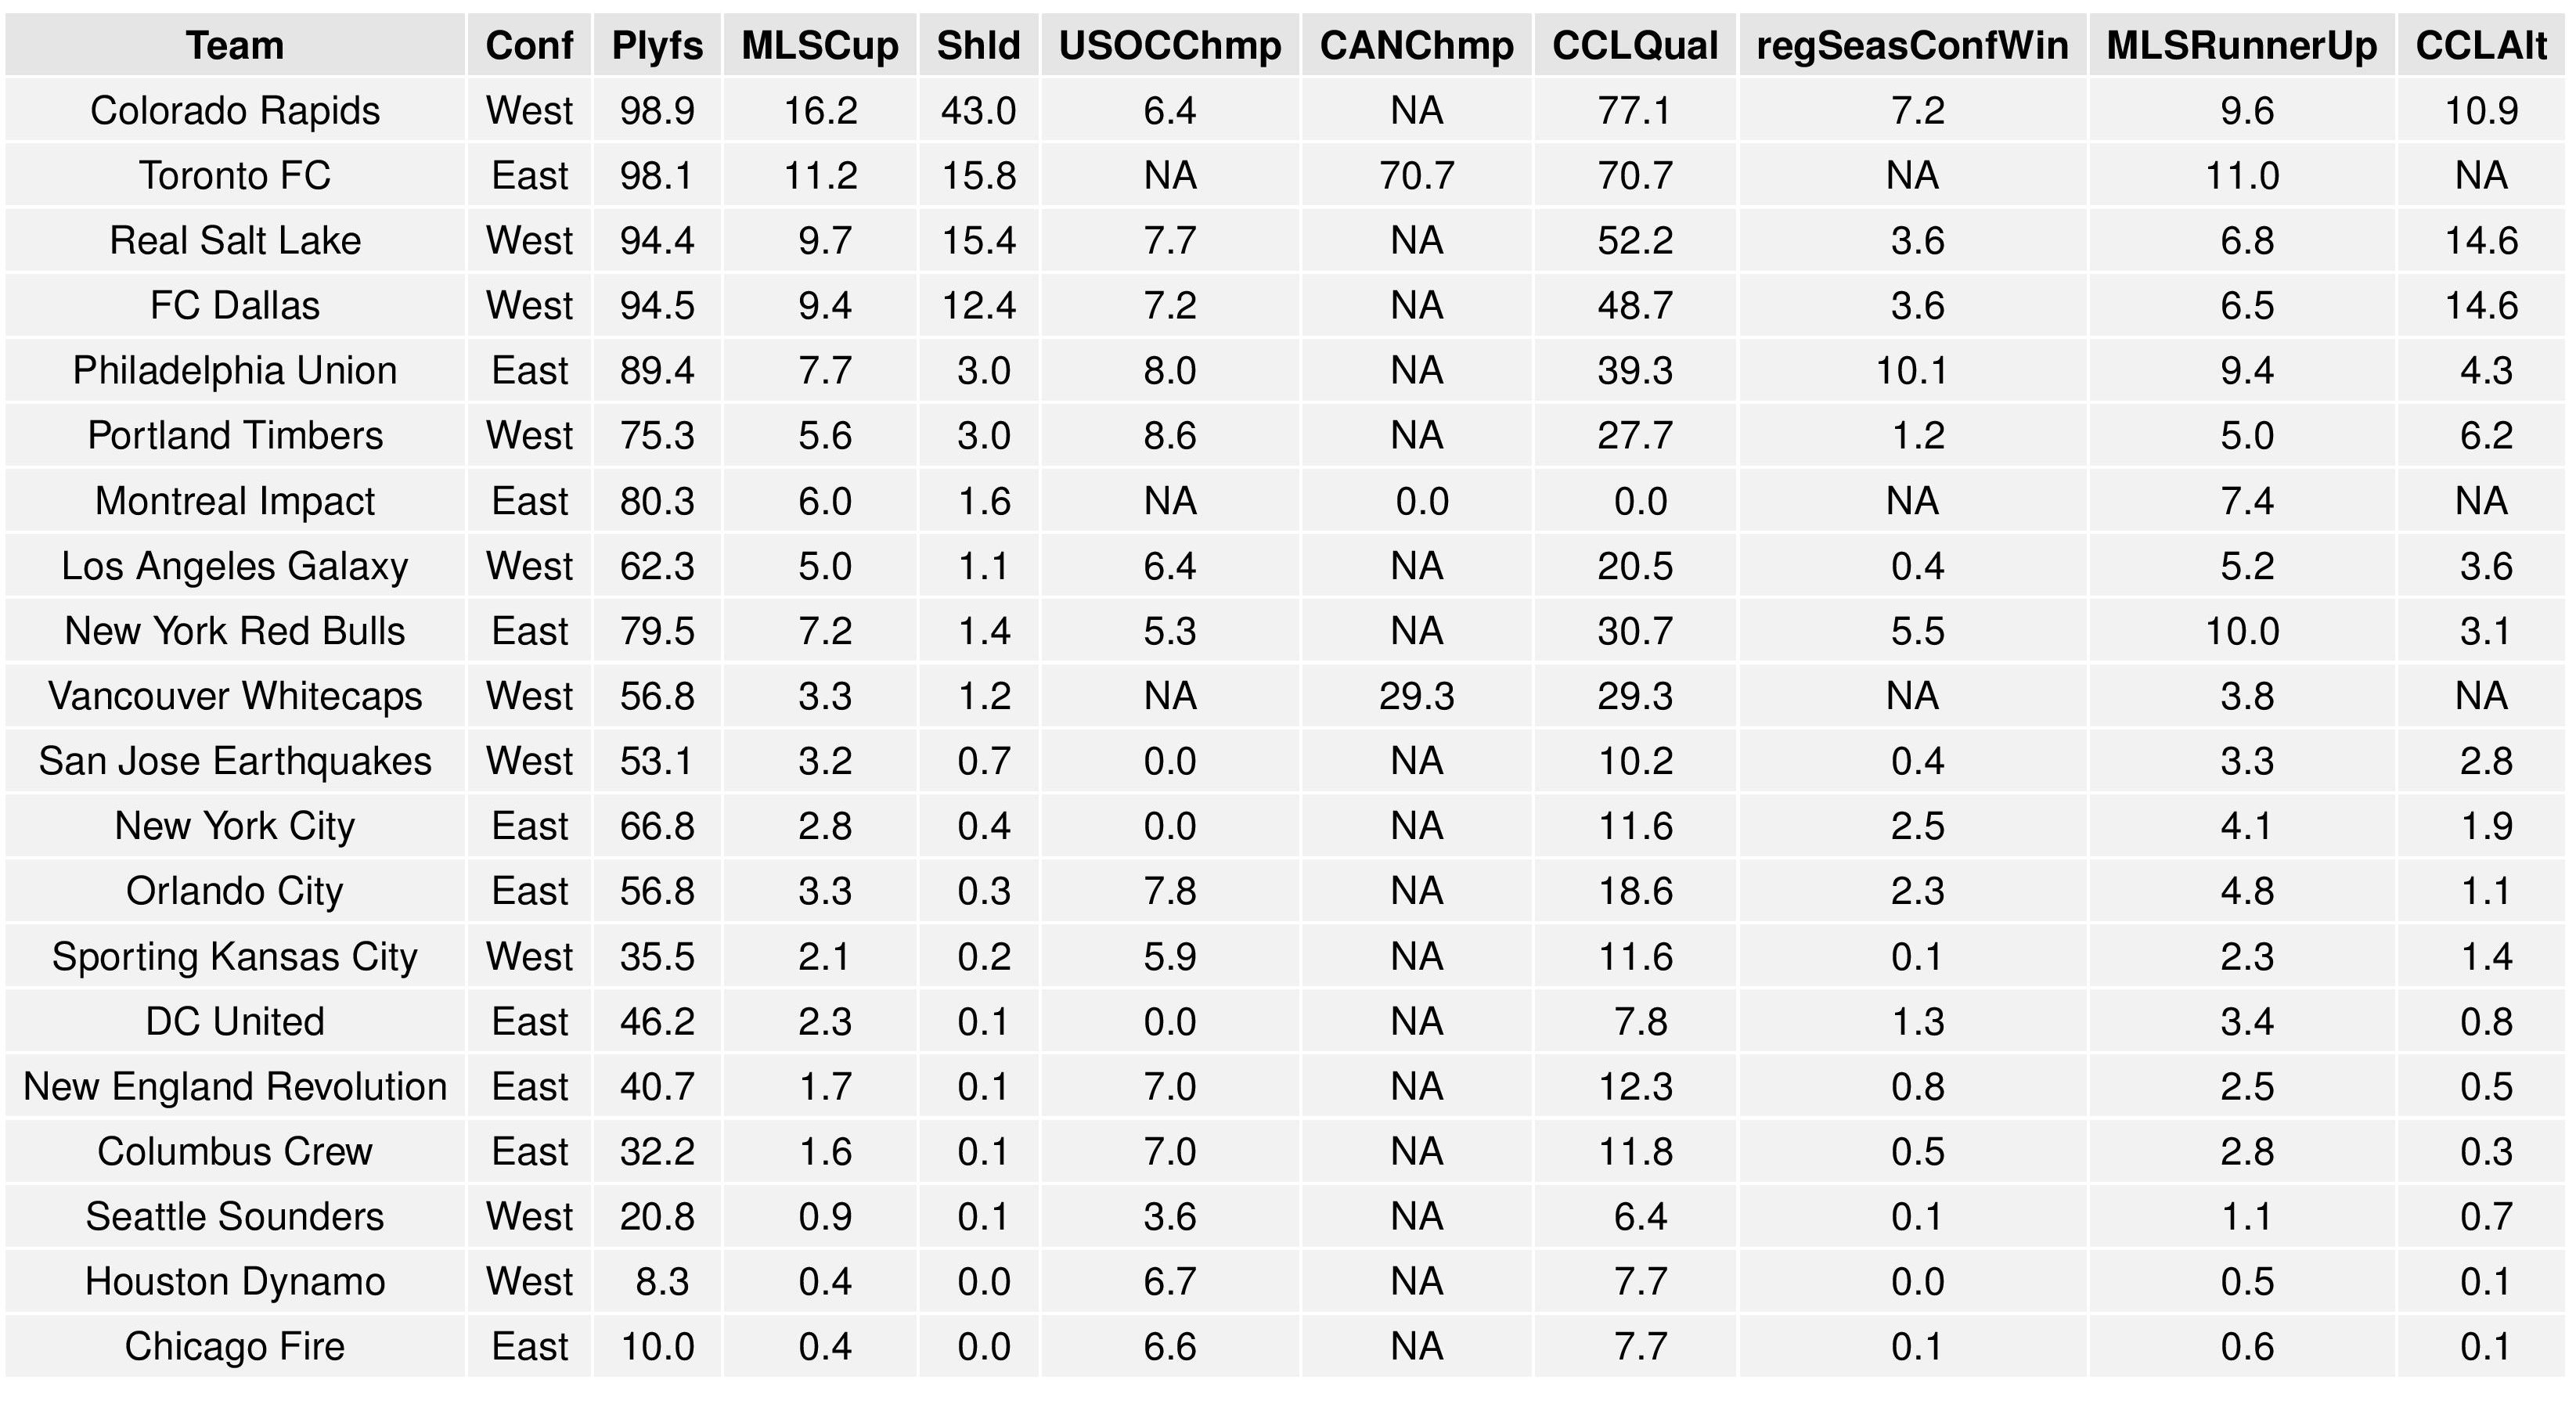
Finally, the charts below shows the average results of all the simulations and the probabilities associated with all of the above. The chart is broken up into two parts in order to better fit on your screen.
(Note: CCLAlternate refers to qualifying for CONCACAF Champions League non-traditionally. U.S. teams qualify by winning the MLS Cup, winning the Supporters’ Shield, winning the Conference in the regular season, and by winning the U.S. Open Cup. If a Canadian team wins any of these or a U.S. team wins more than one, the extra slots are filled by top regular season performers.)
Changes Over Time
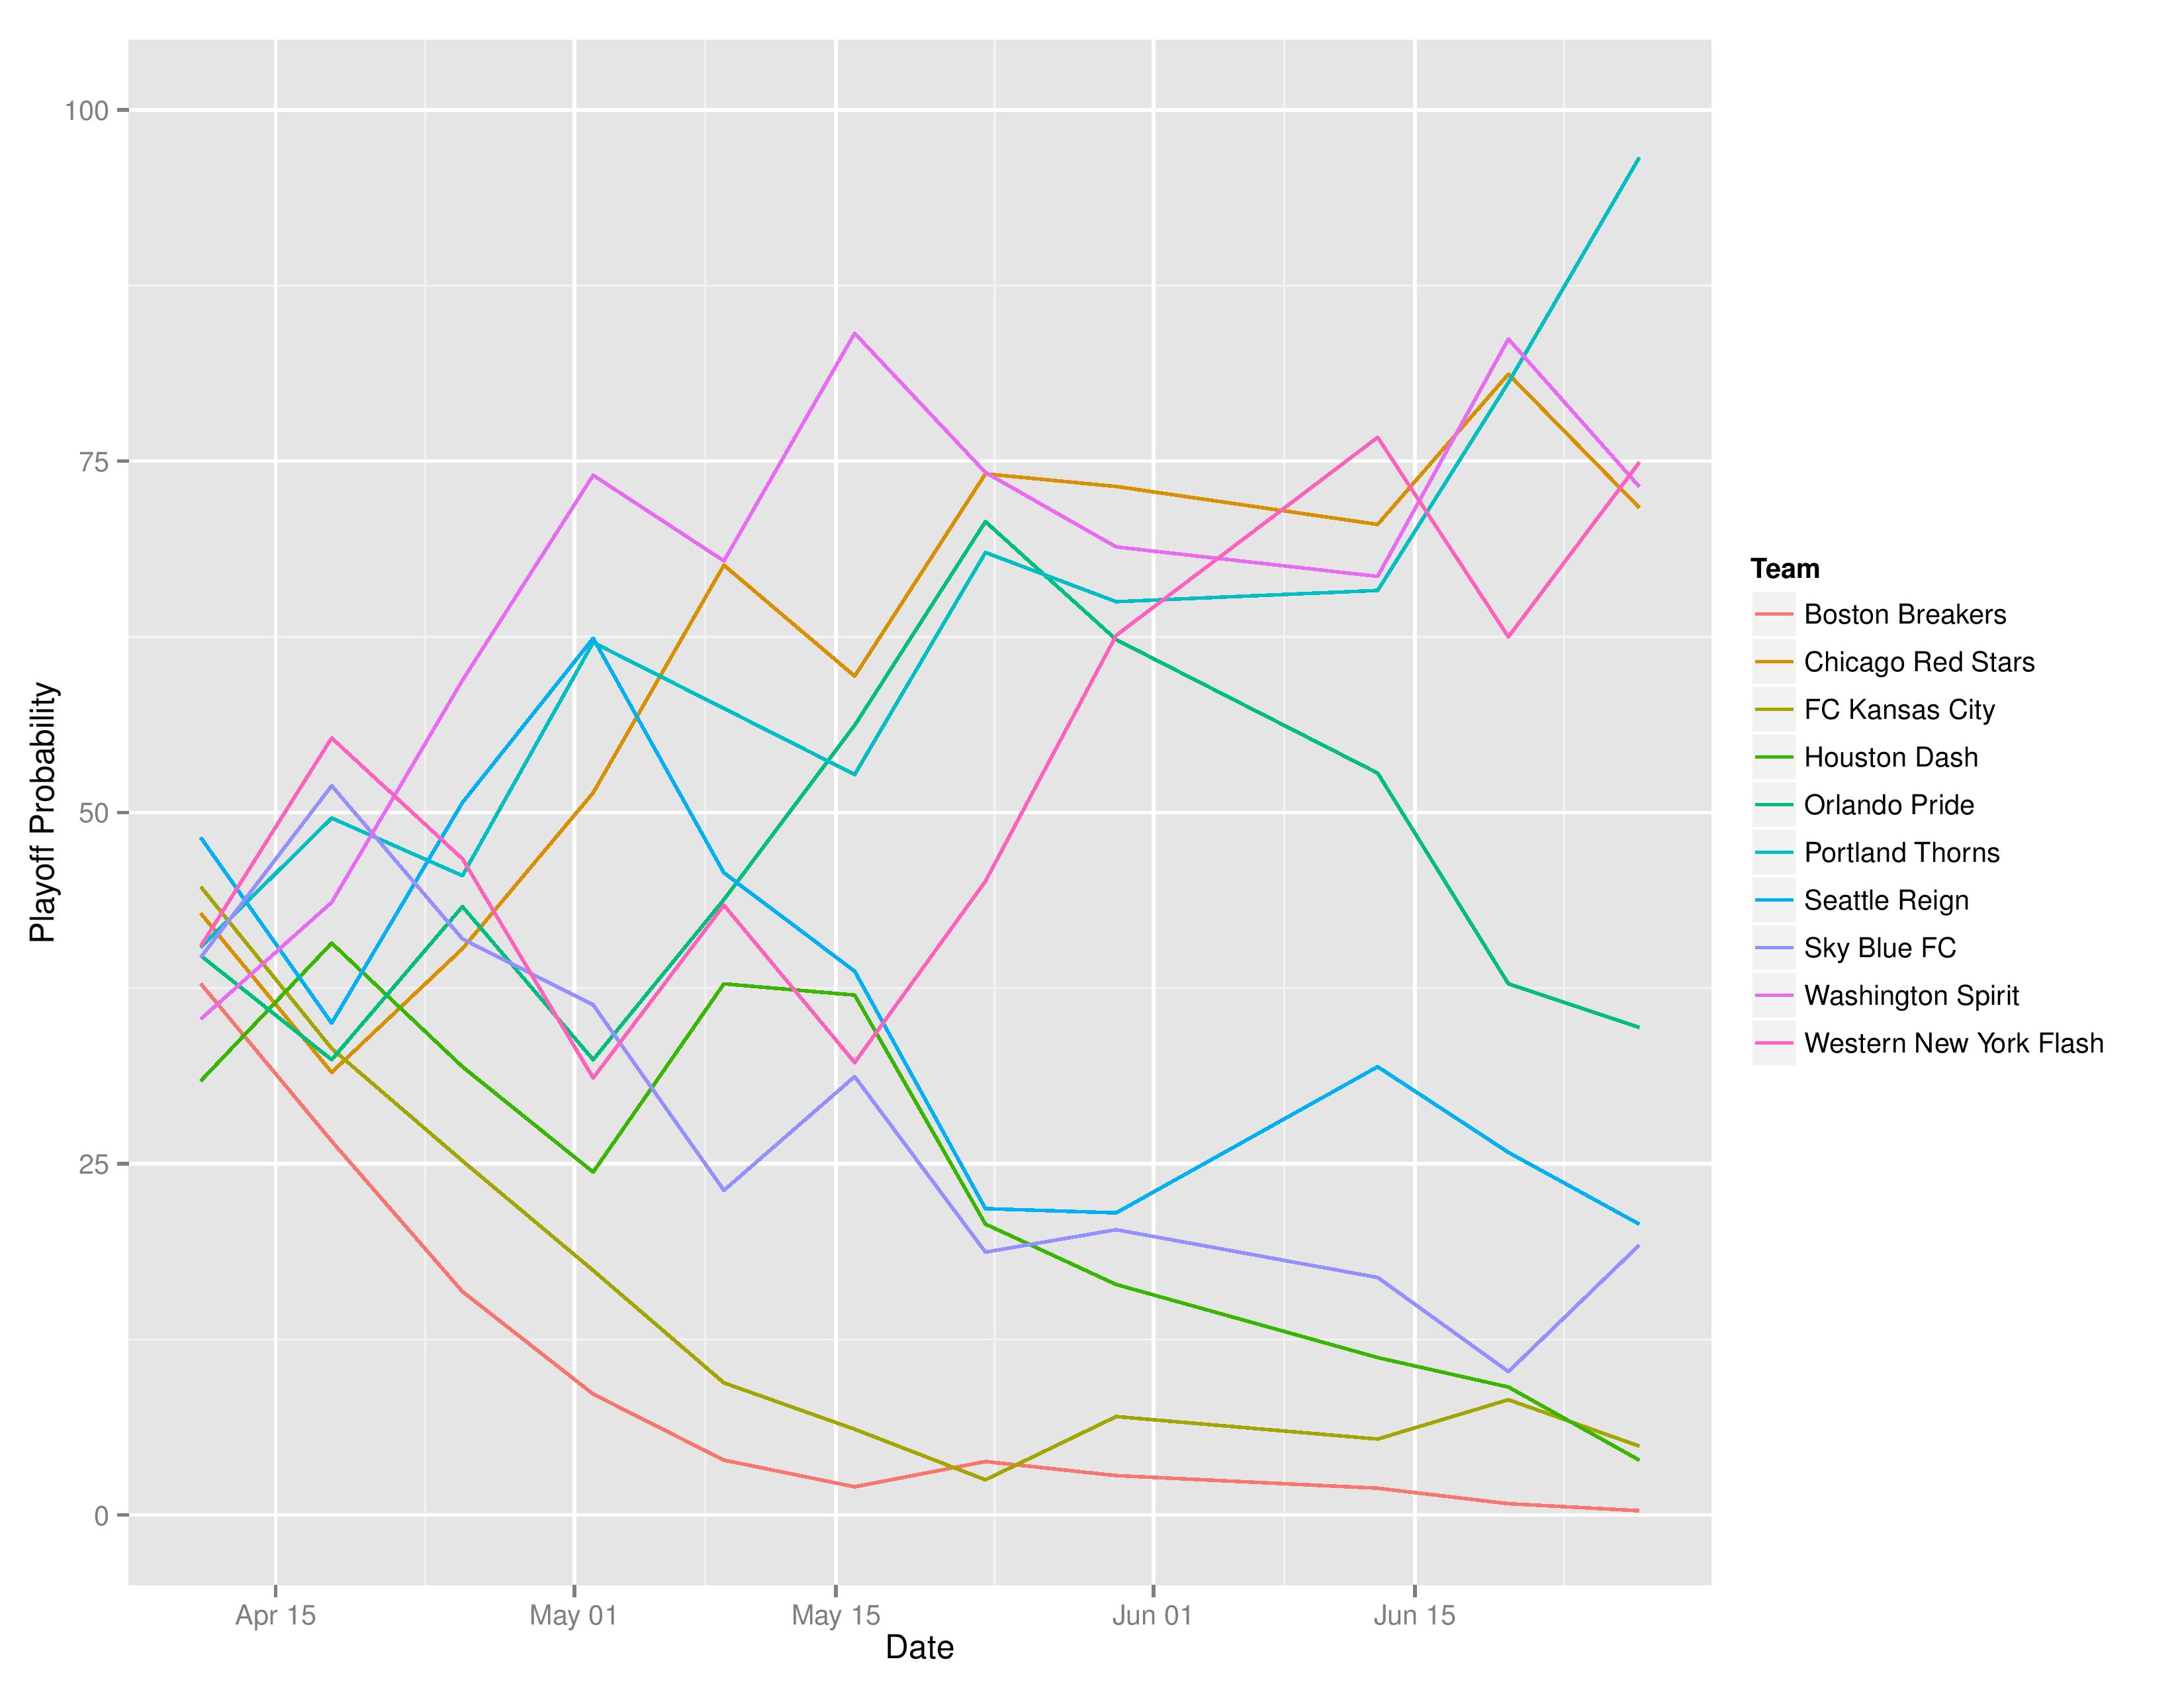
This chart shows how Philadelphia’s chances at each of the outcomes has evolved over the course of the season. These probabilities were calculated weekly, always through Sunday’s matches.
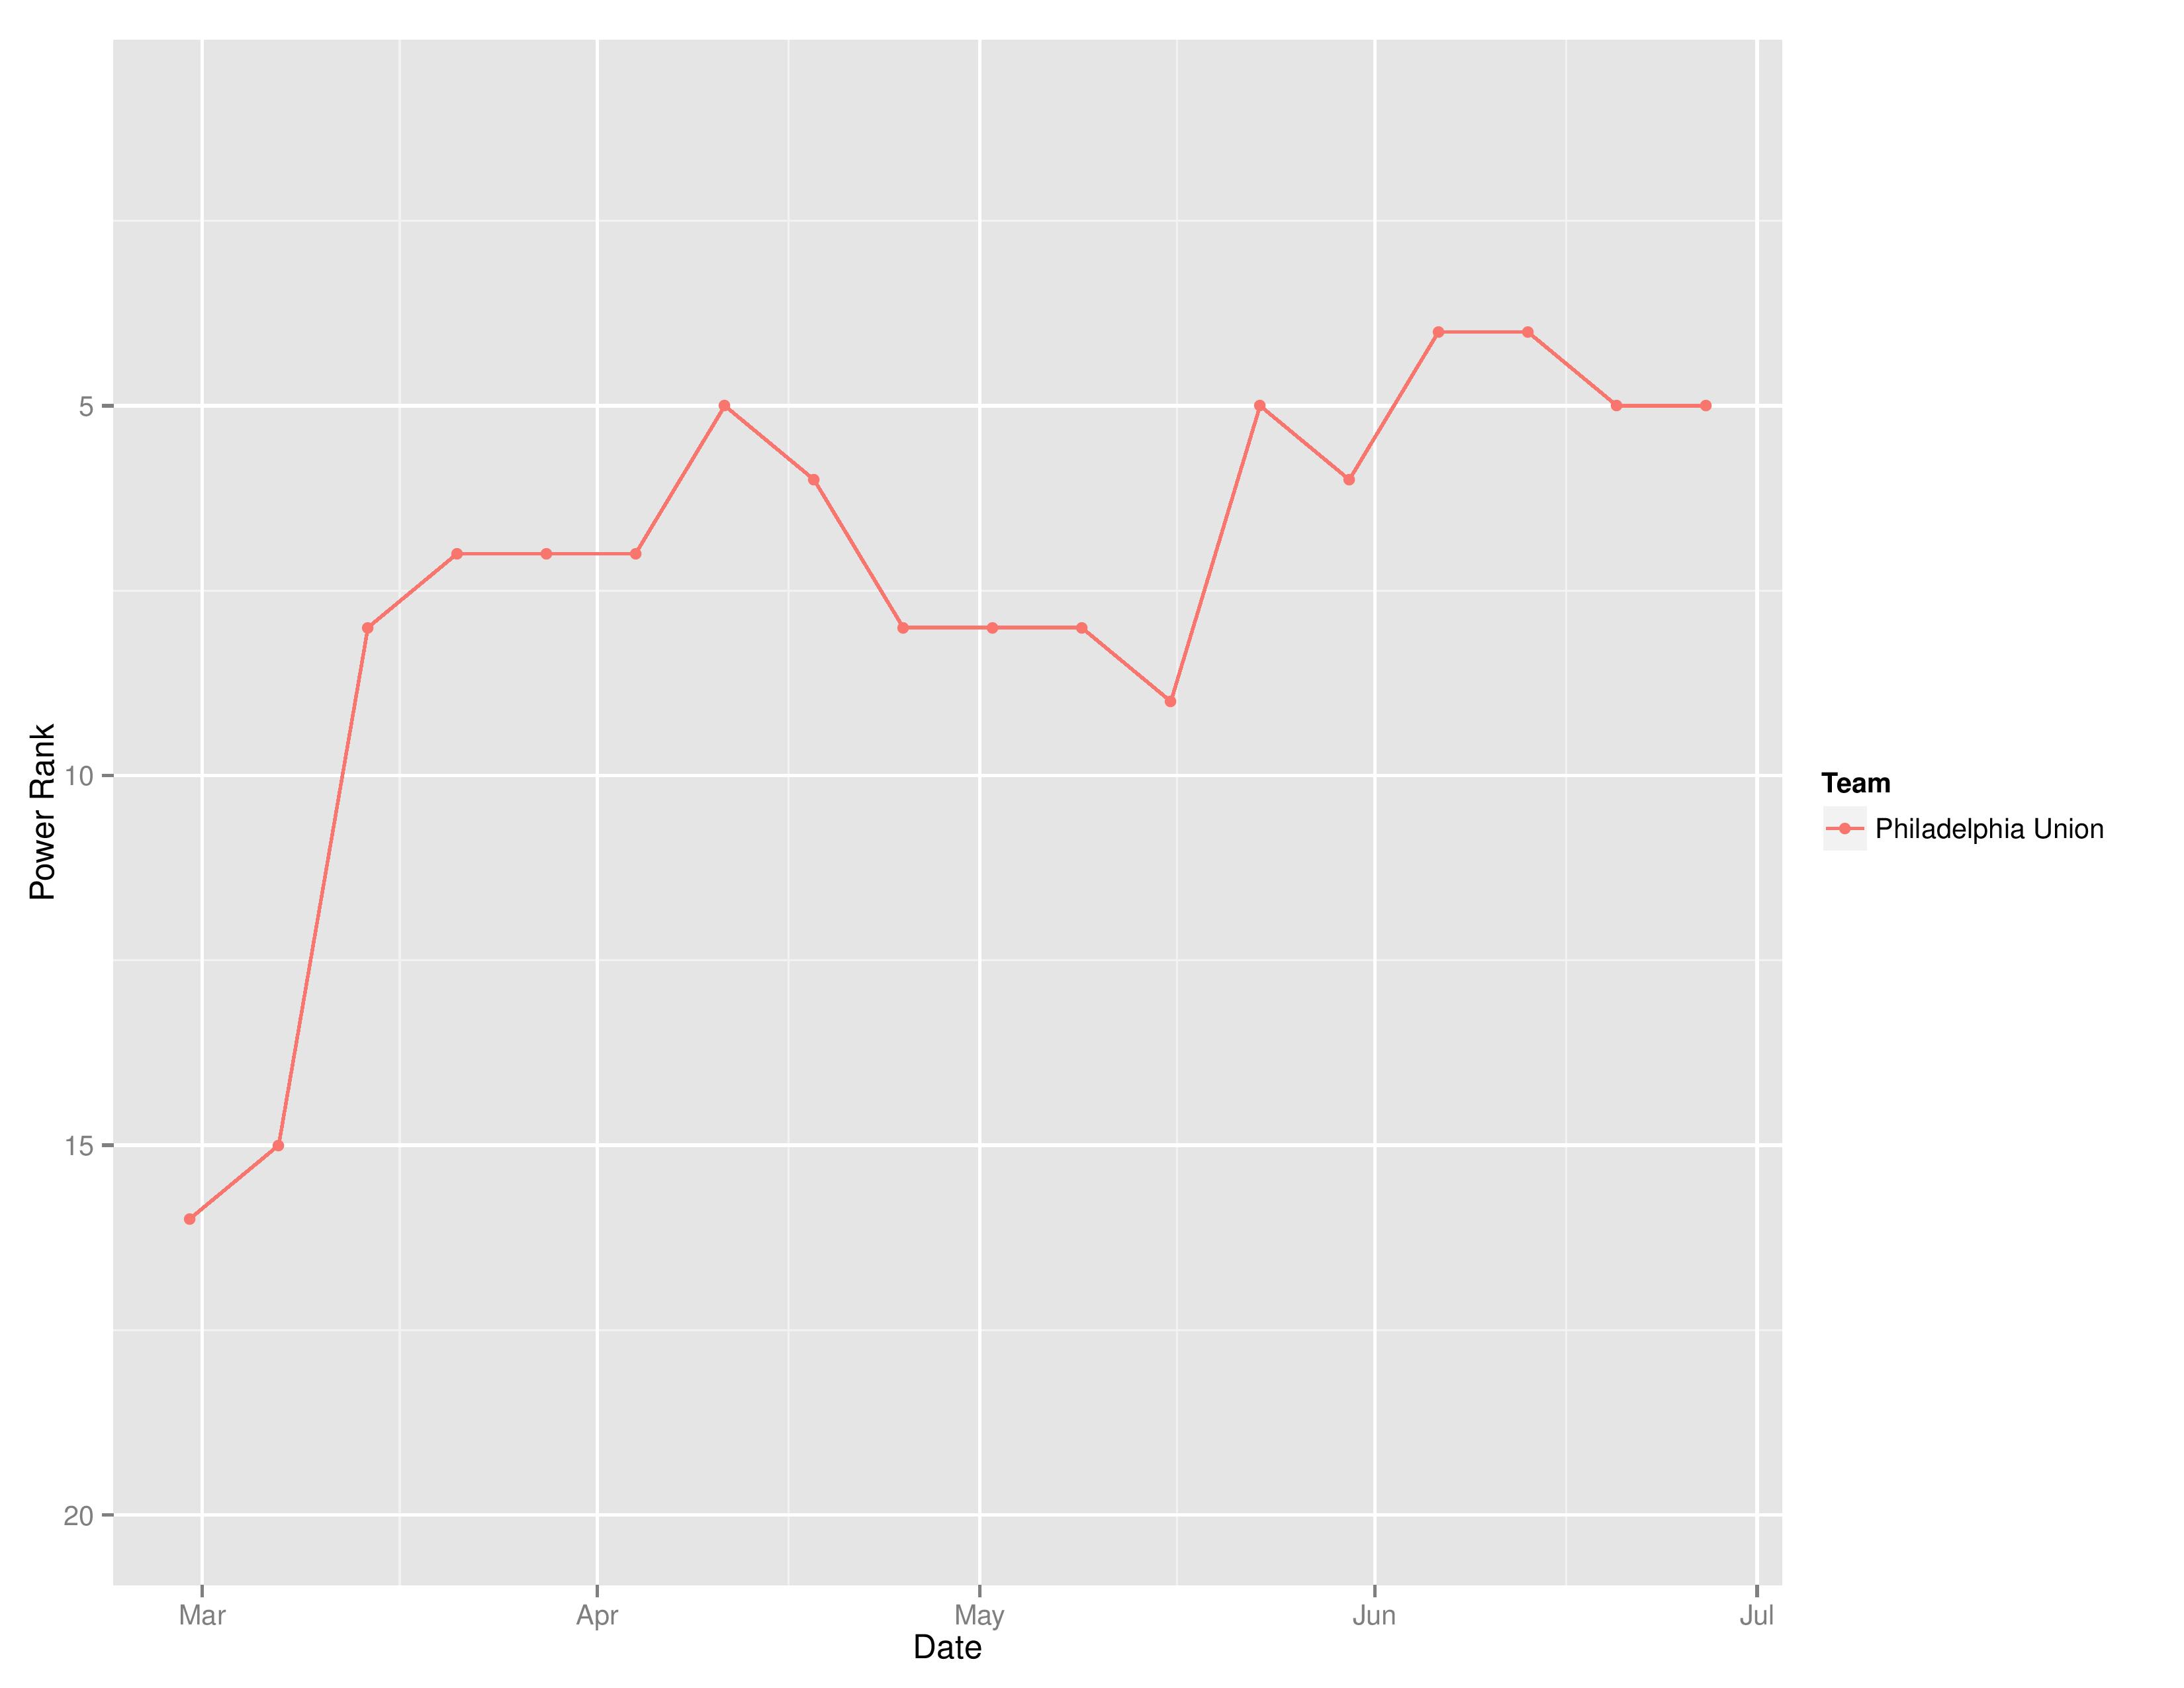
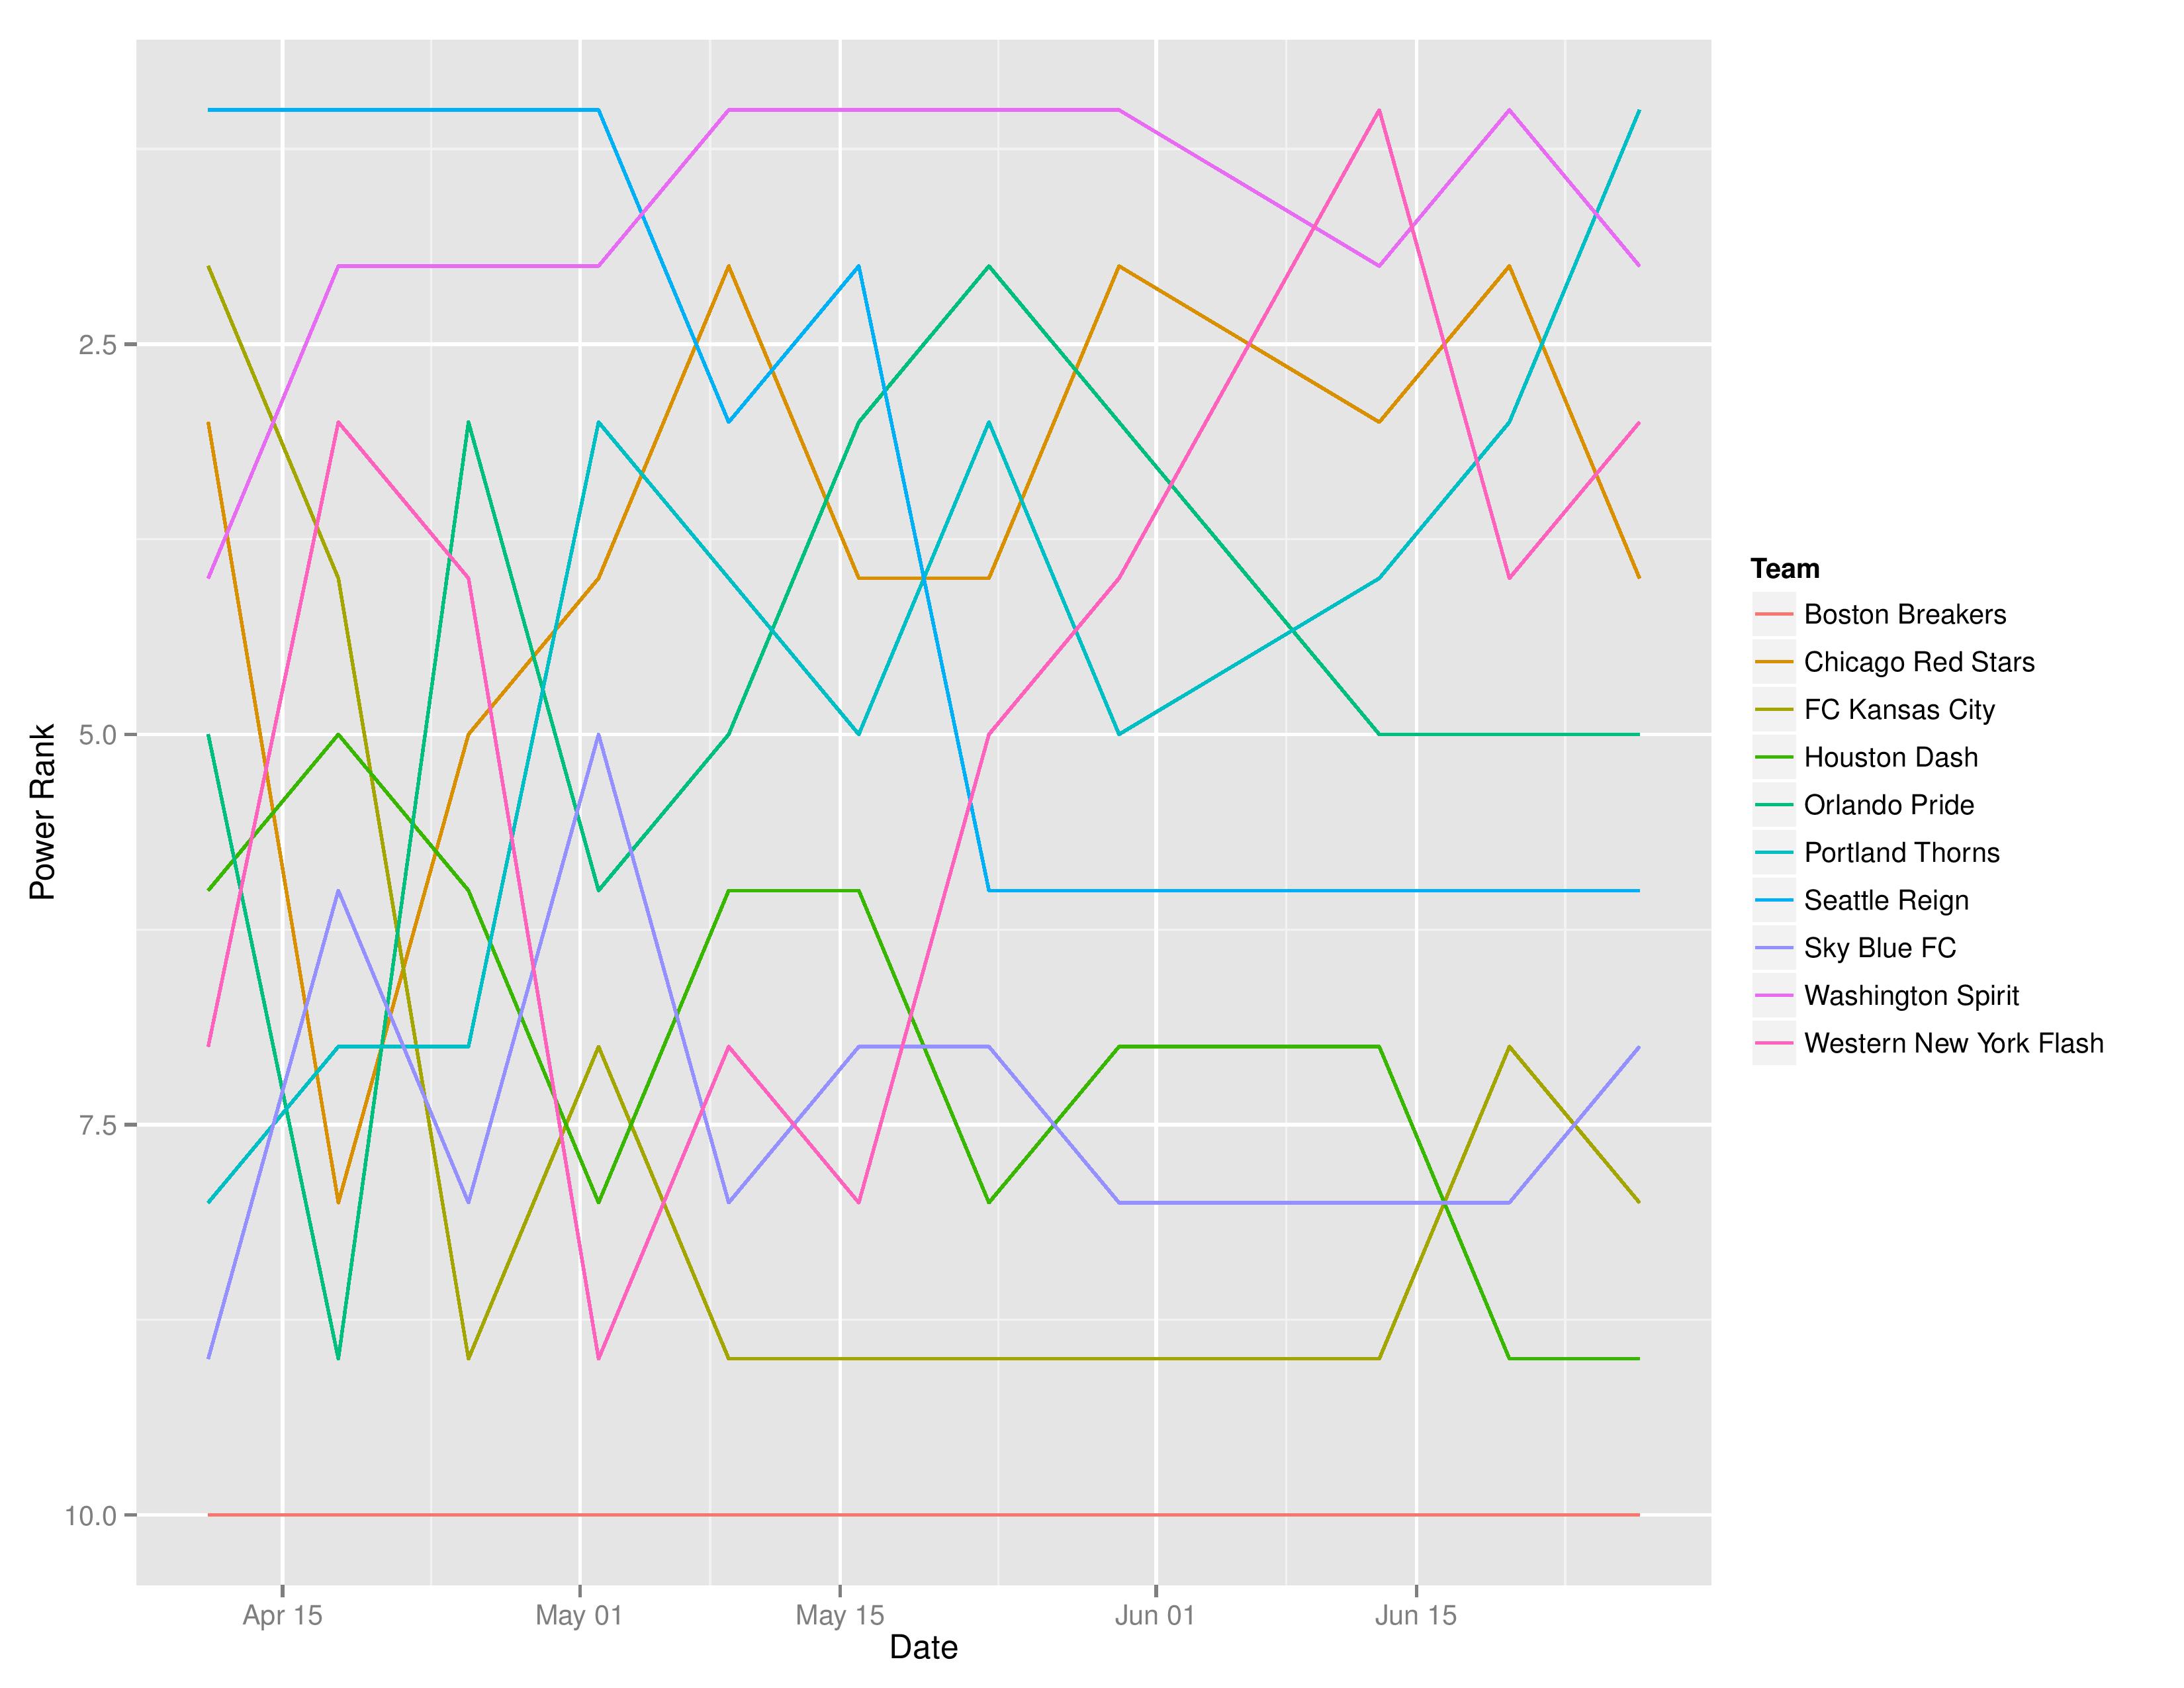
This shows the evolution of Philadelphia’s movement within SEBA’s power rankings.
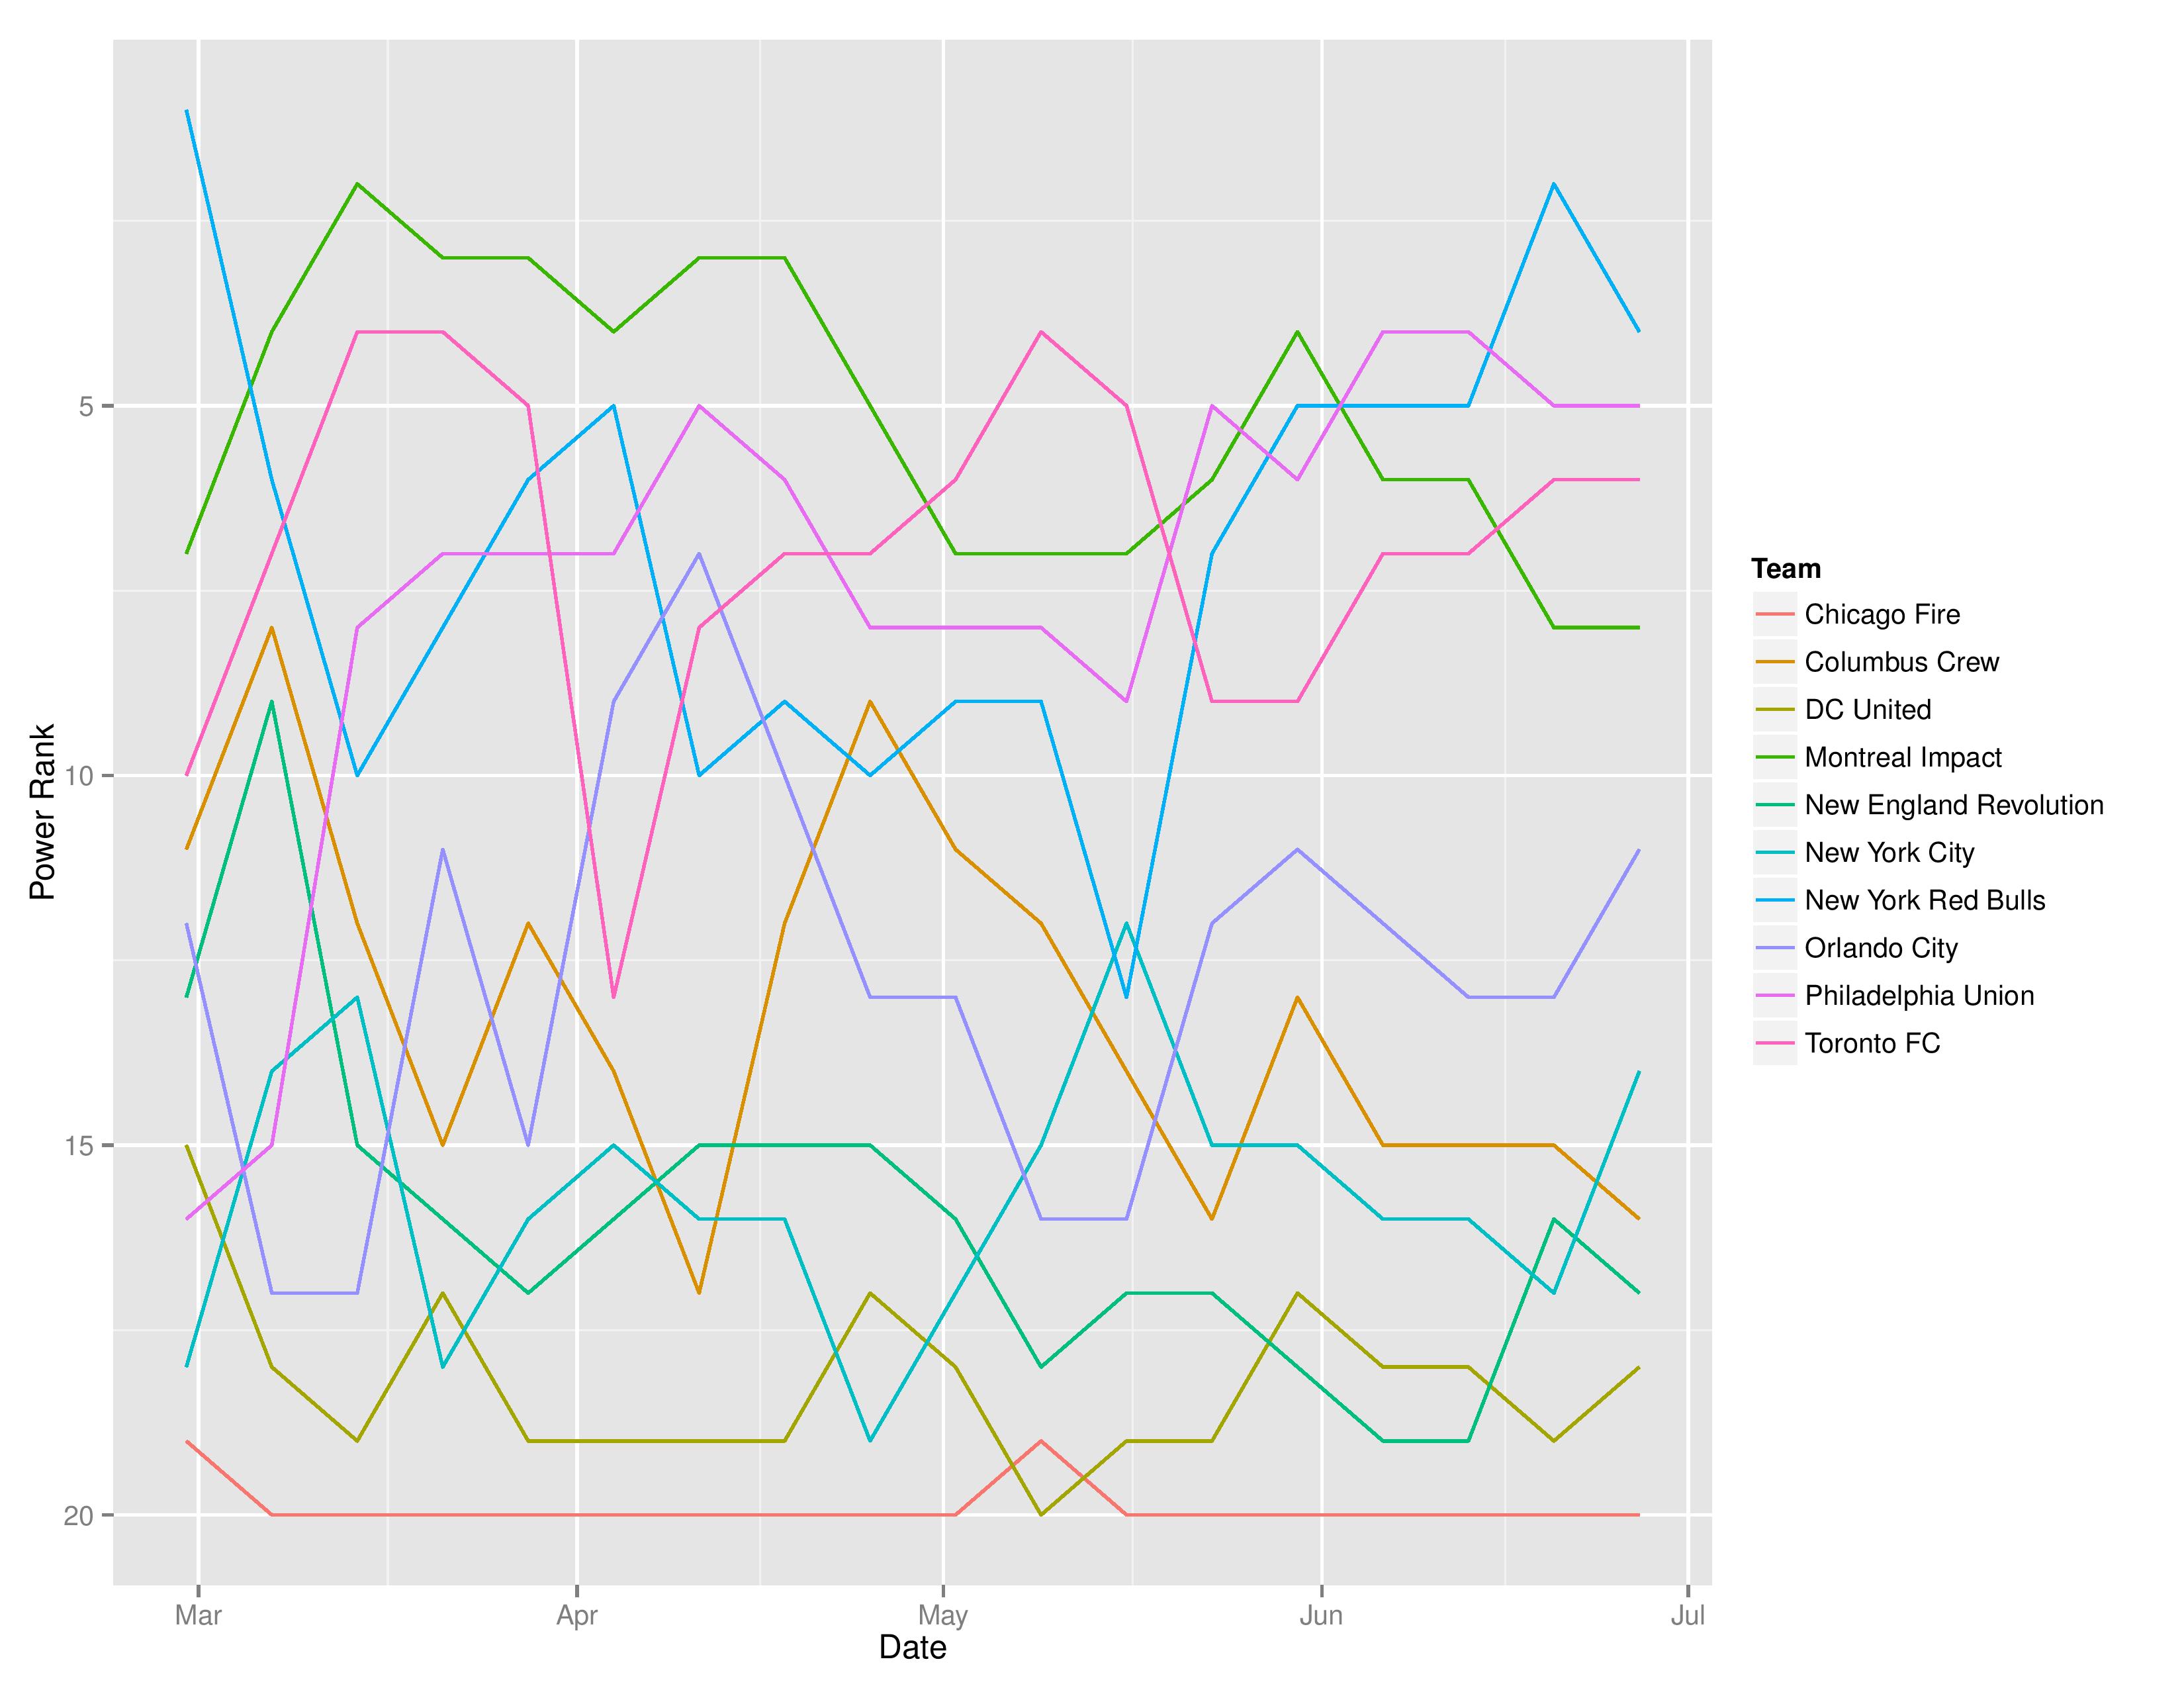
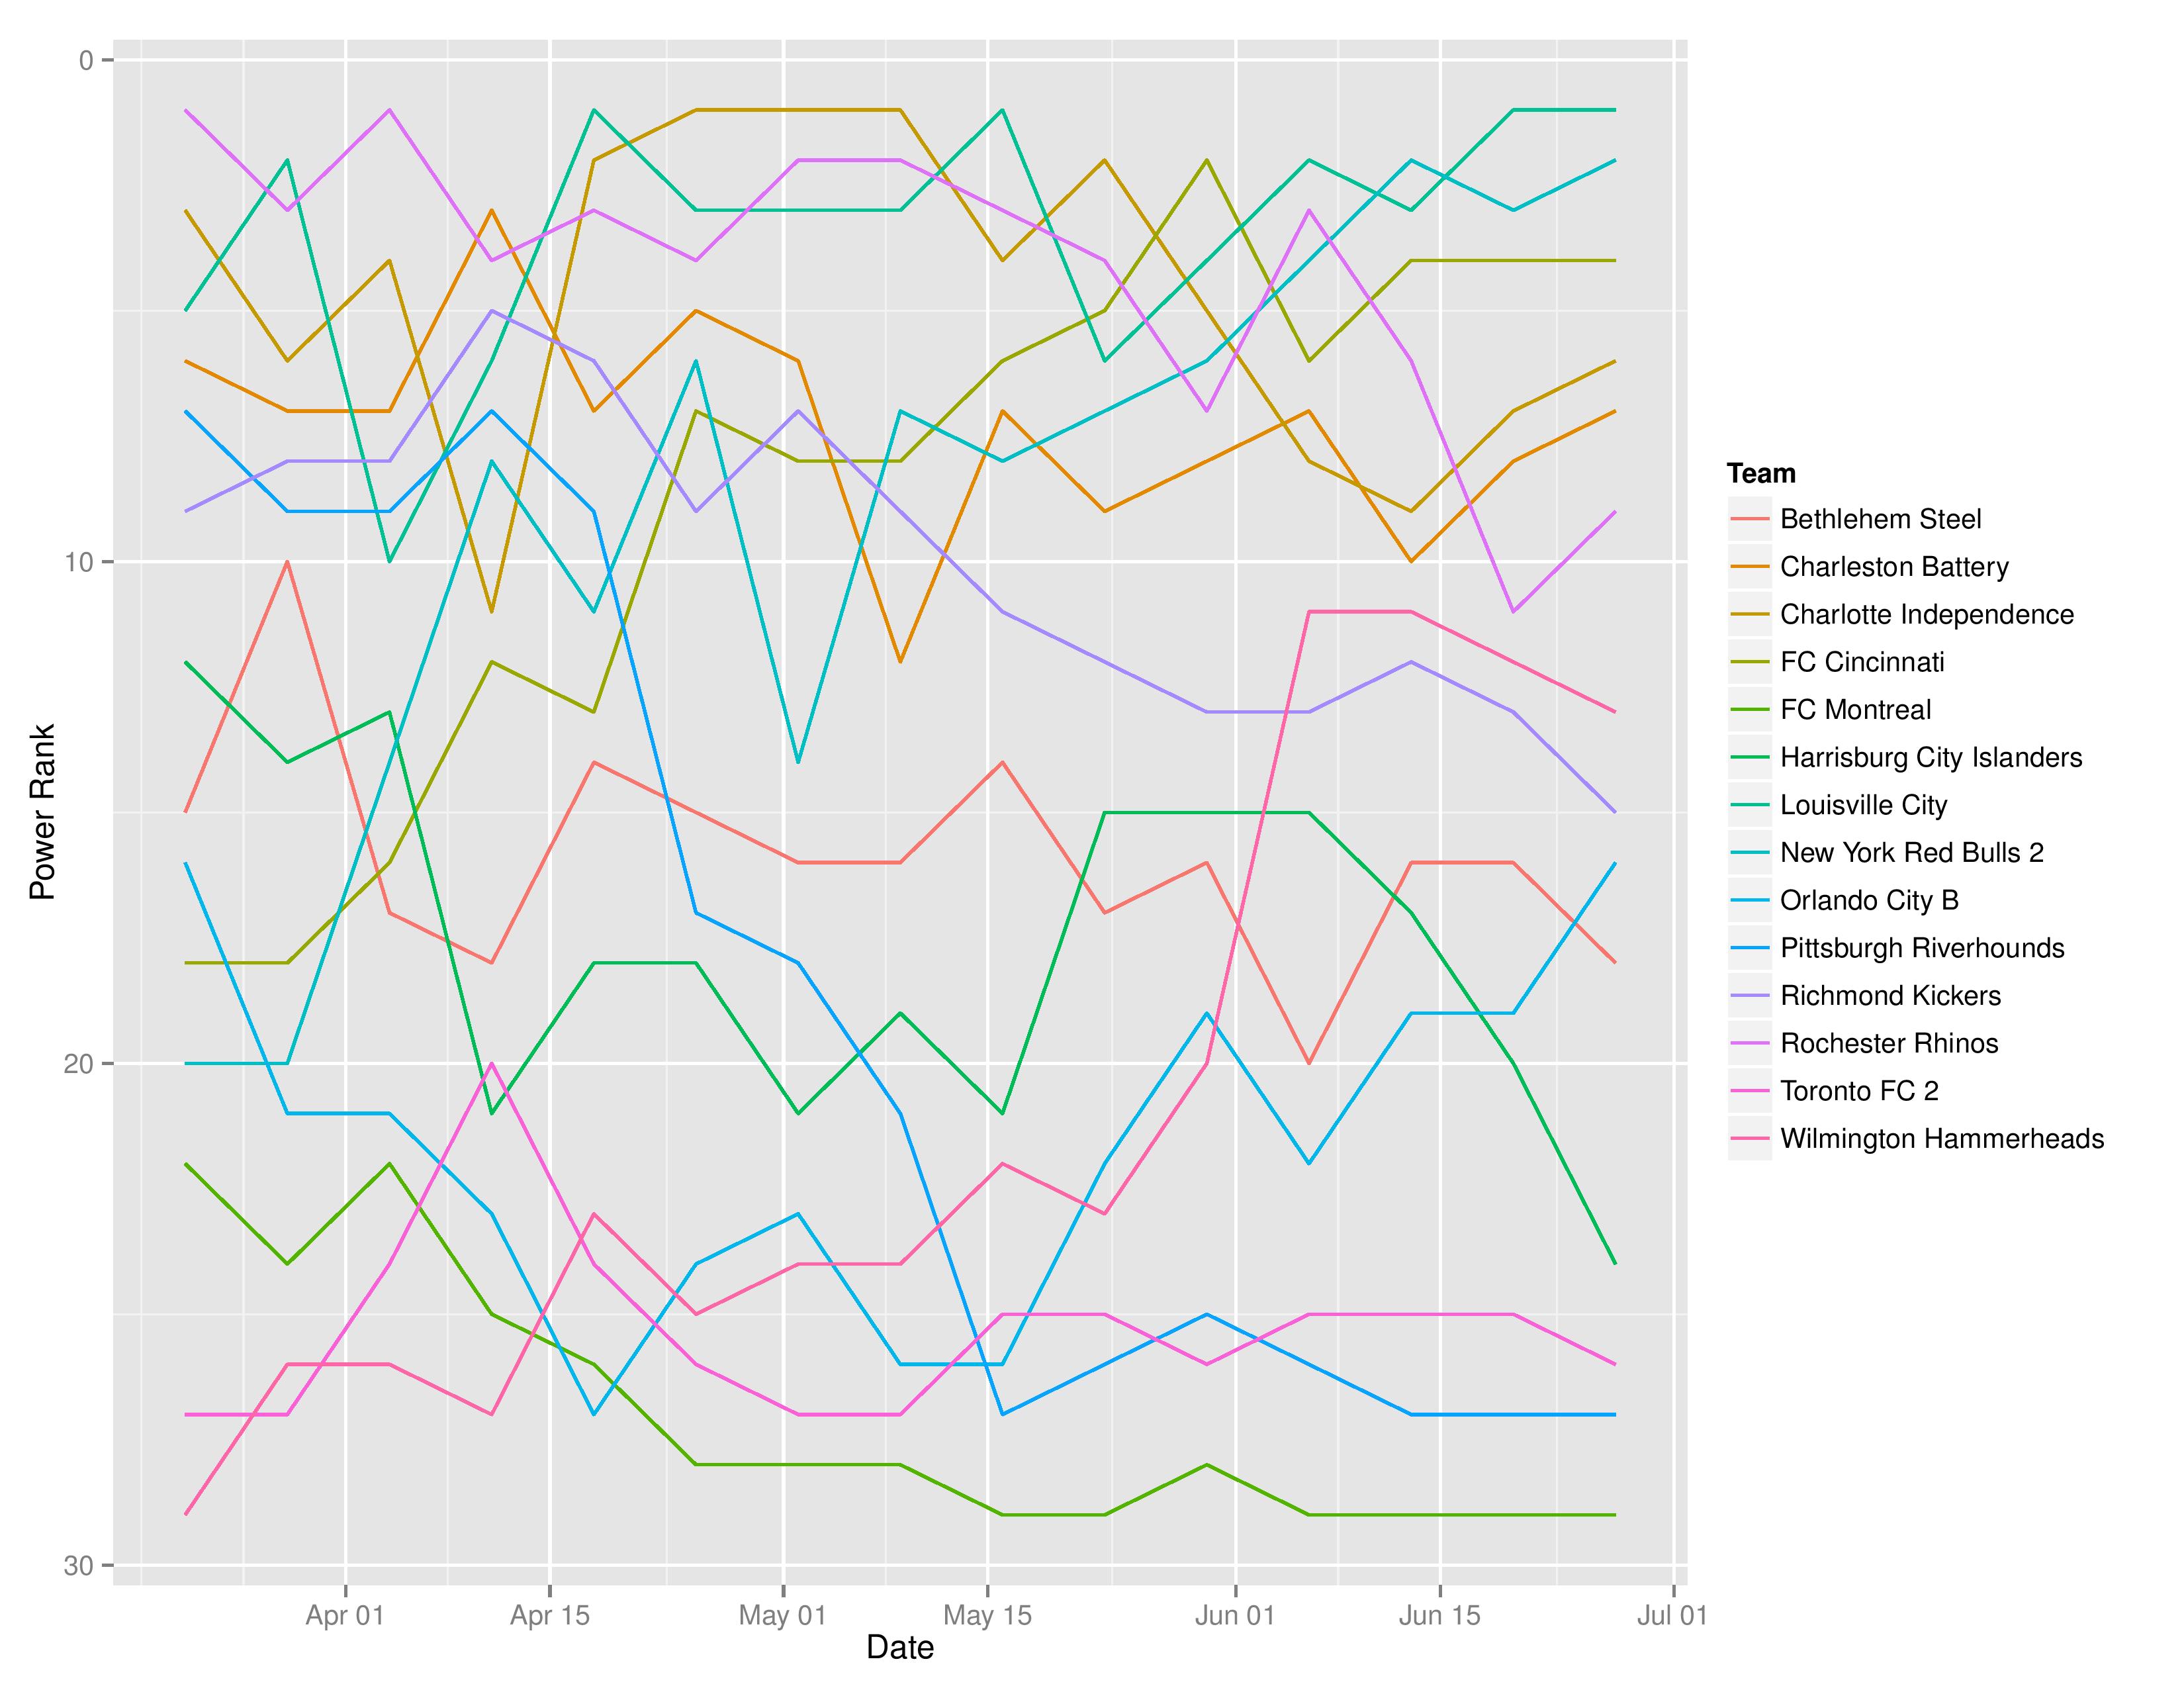
This shows the MLS Eastern Conference’s evolution of power rankings throughout the season.
USL Projections
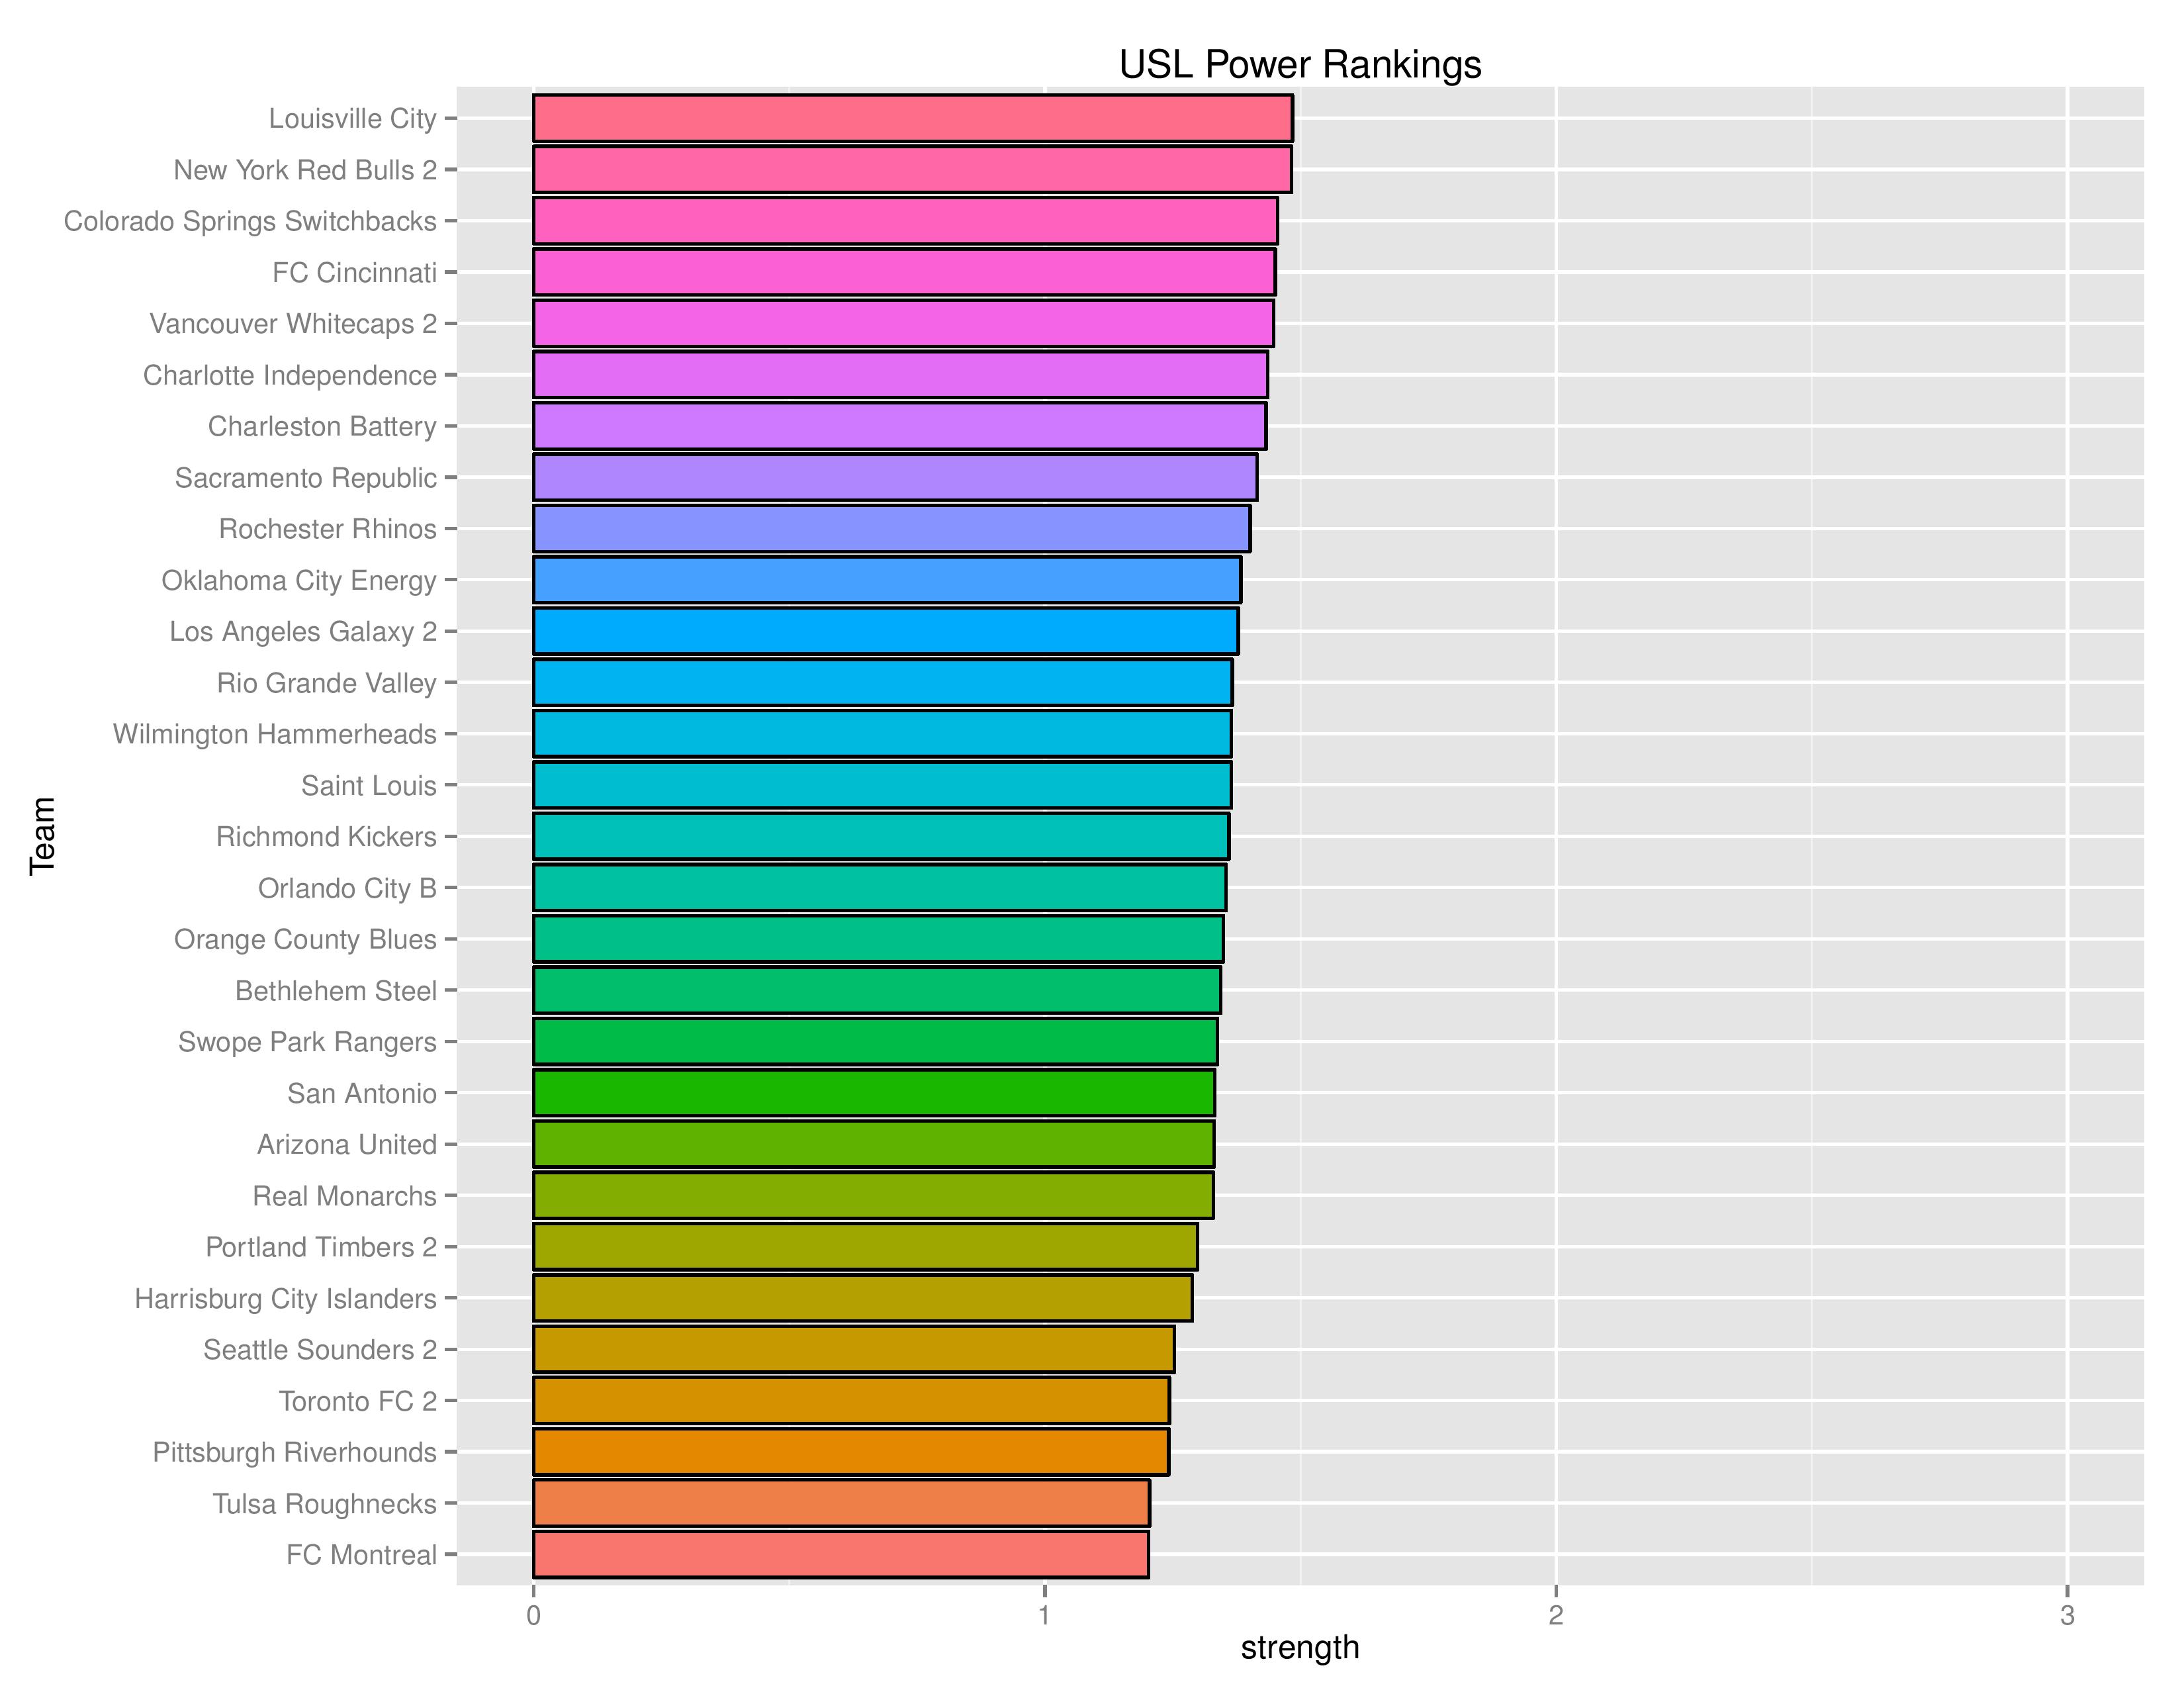
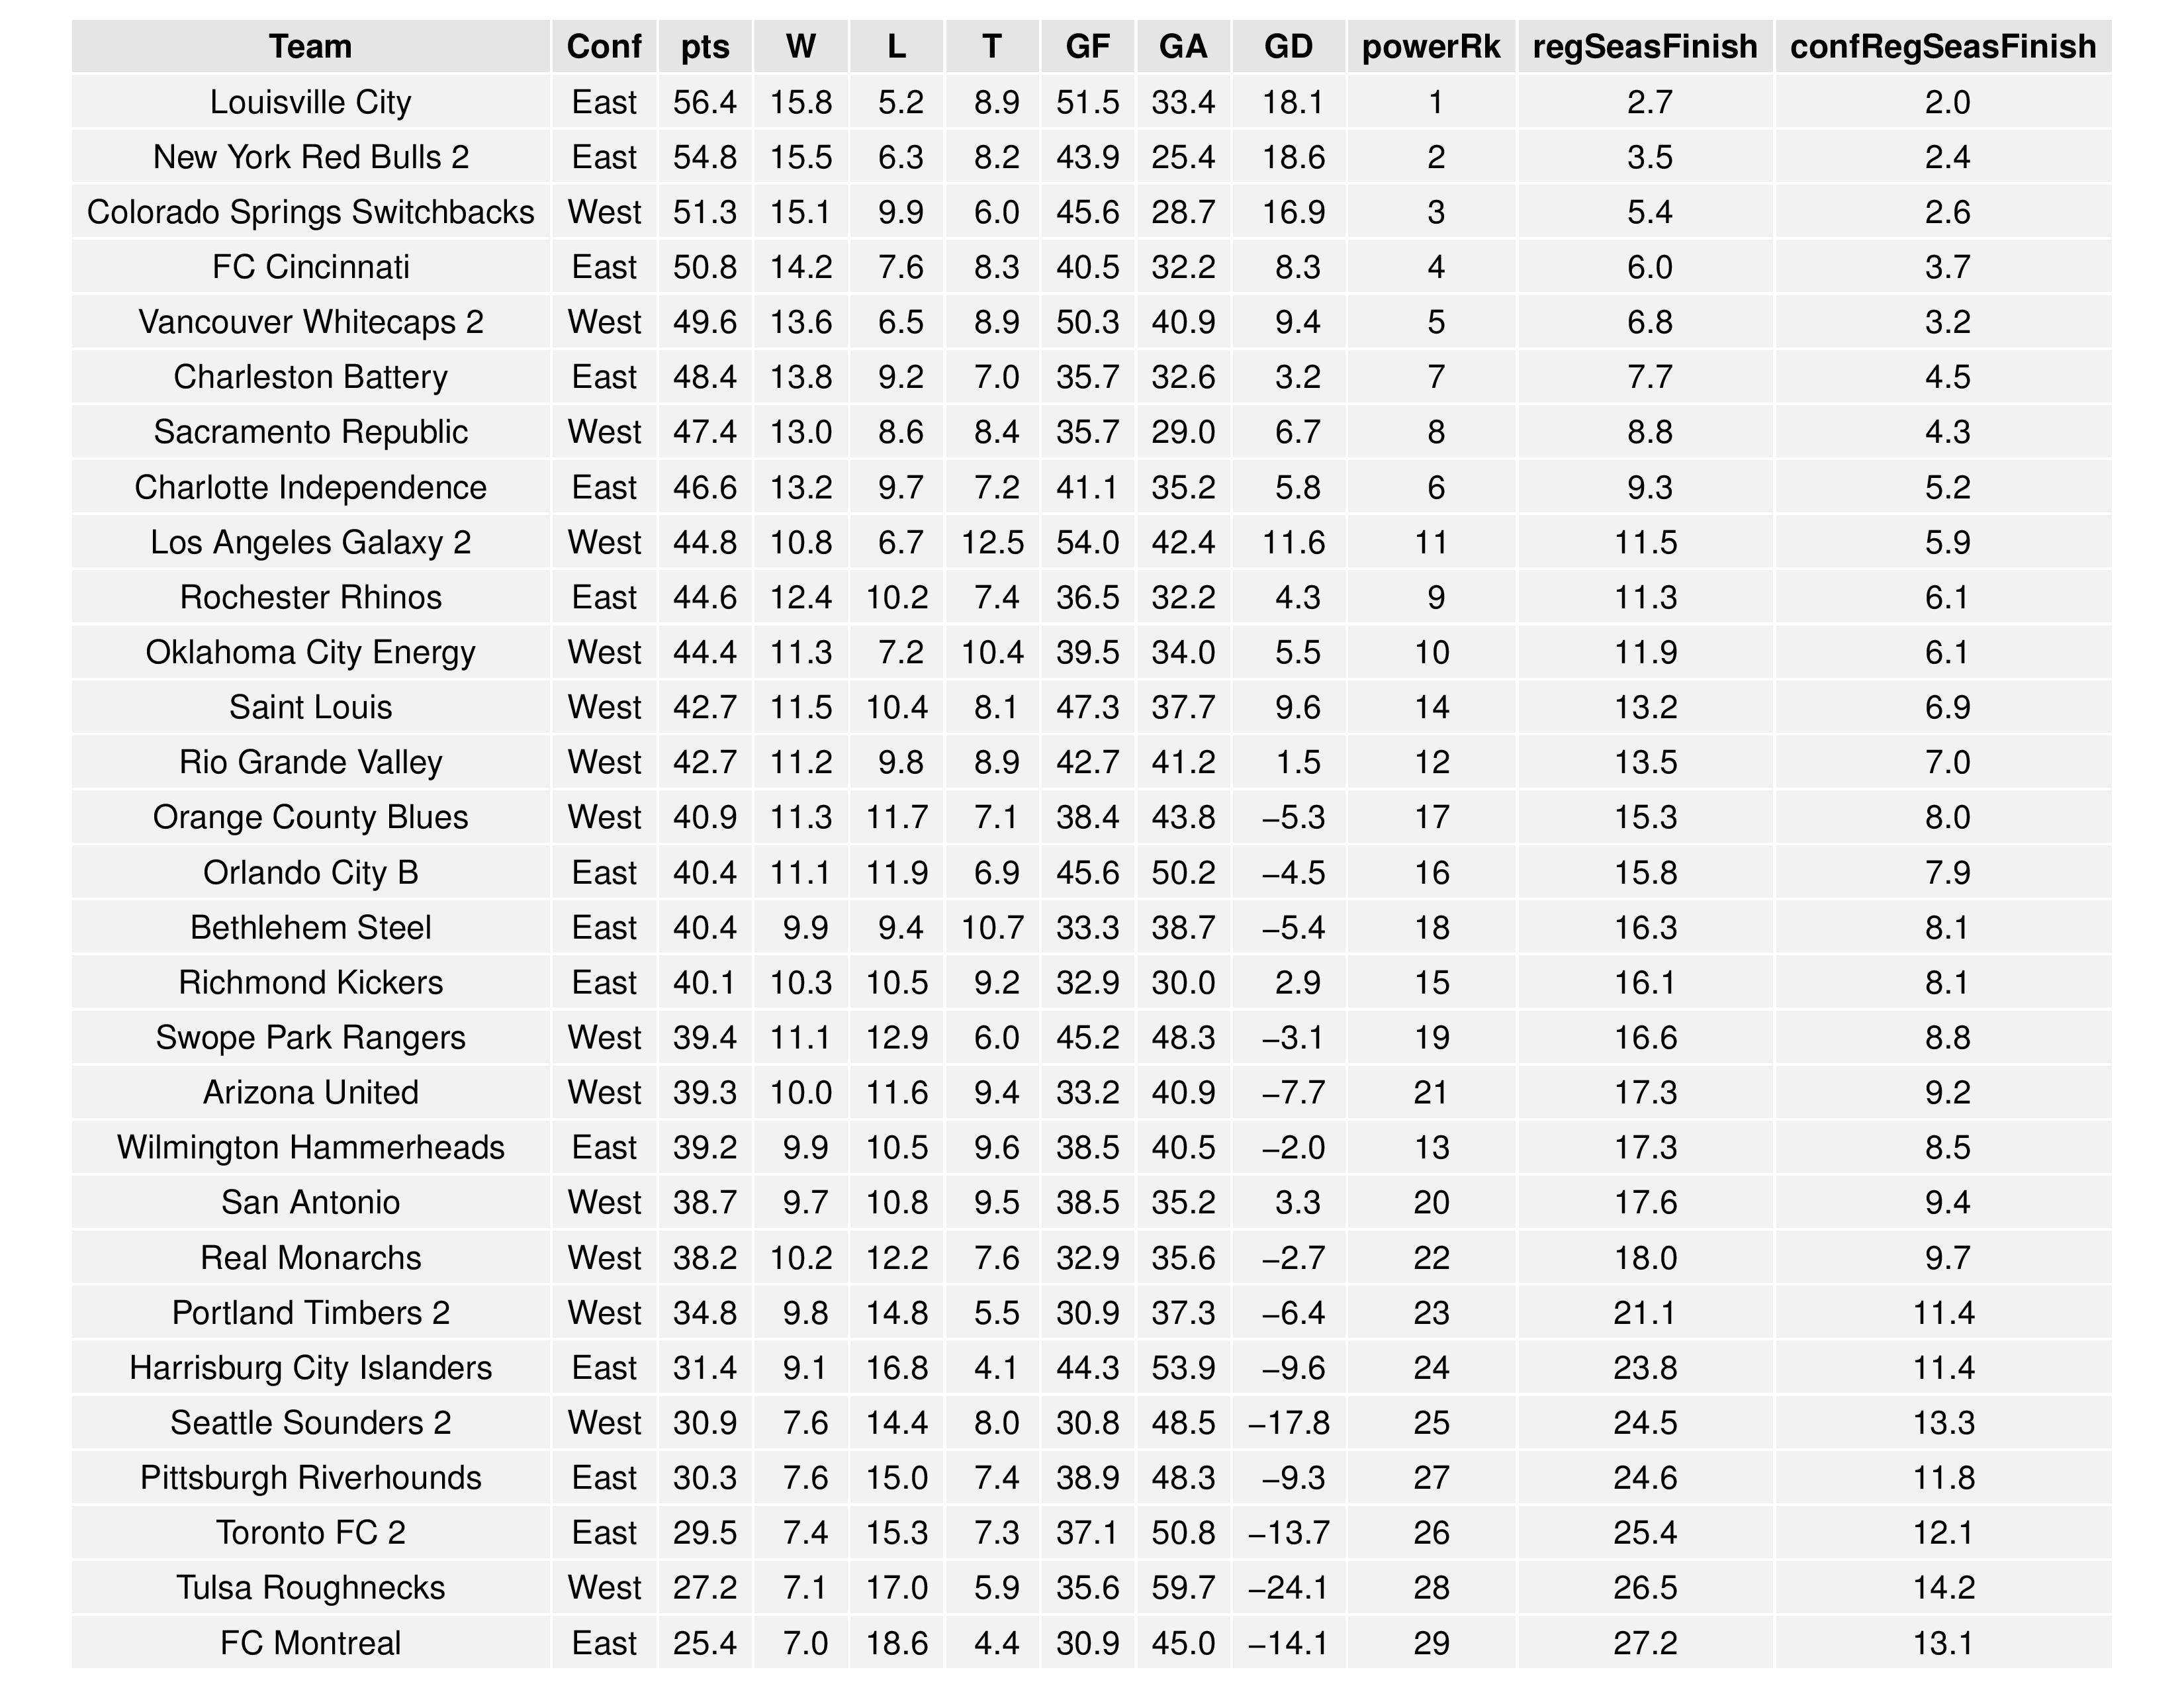
Bethlehem drops to 18th from 16th and Harrisburg City Islanders continues to slide down from 20th to 24th. USLSoccer.com‘s top 10 rankings do not include either team.
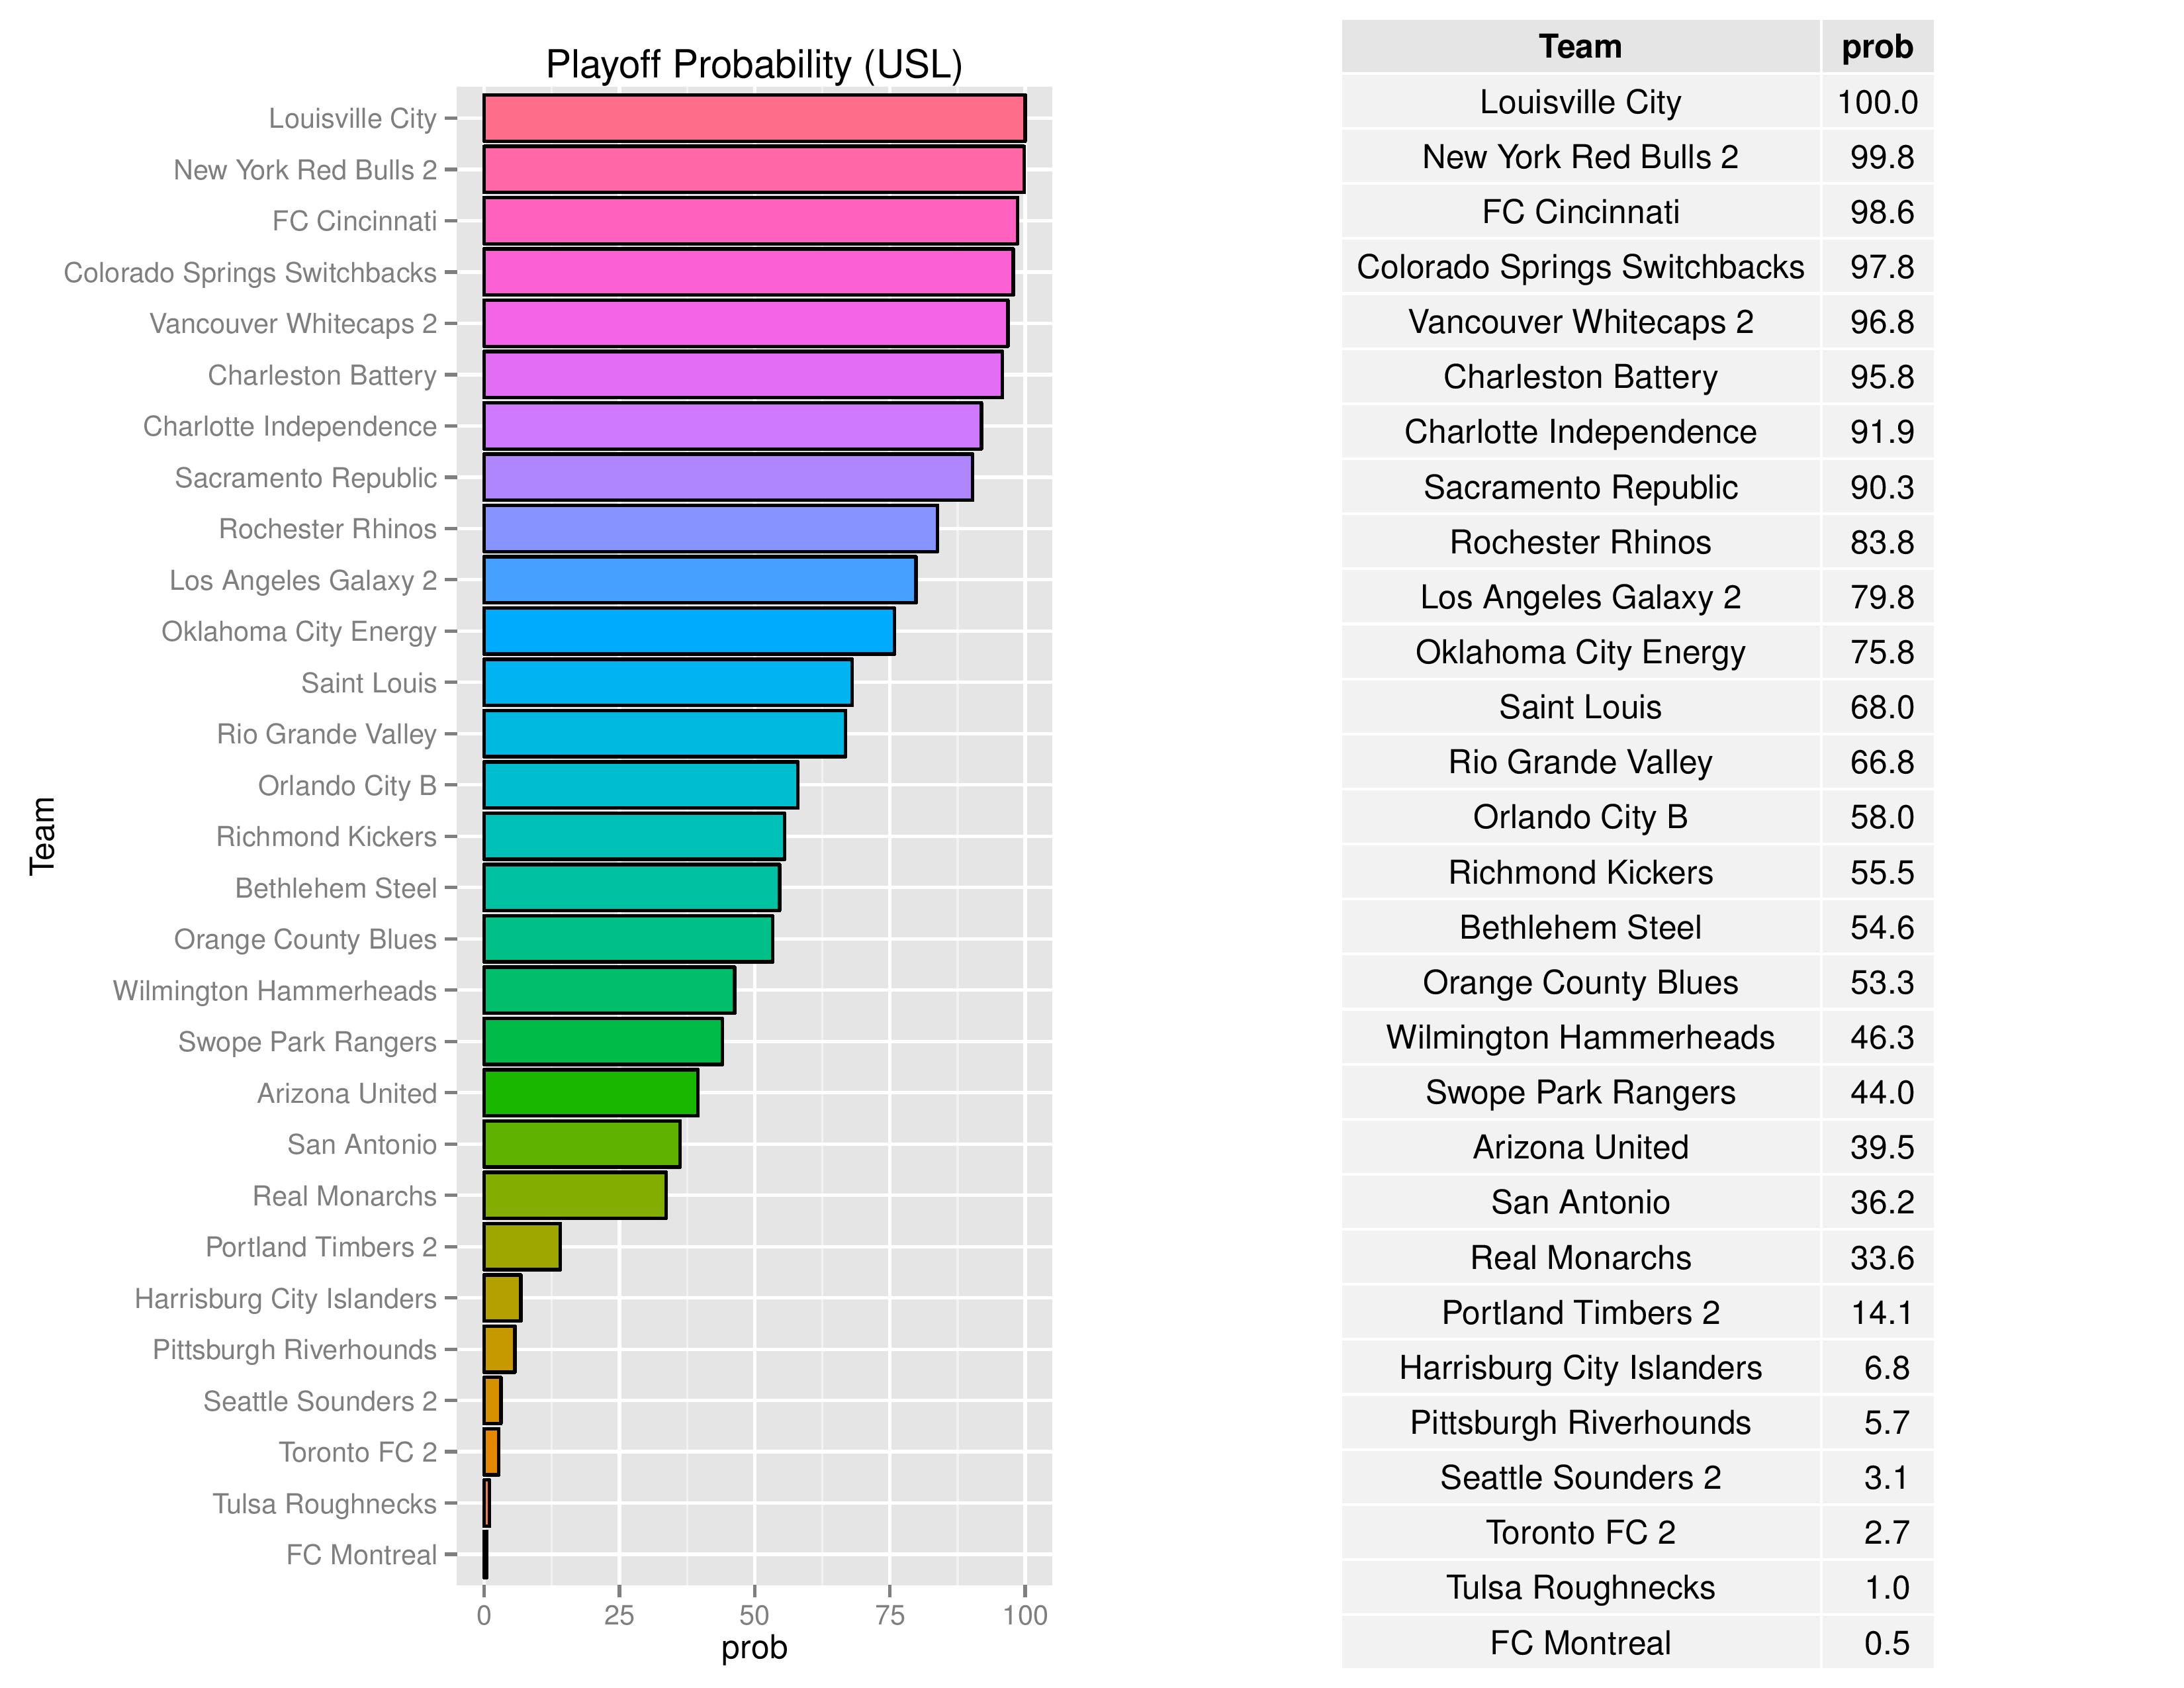
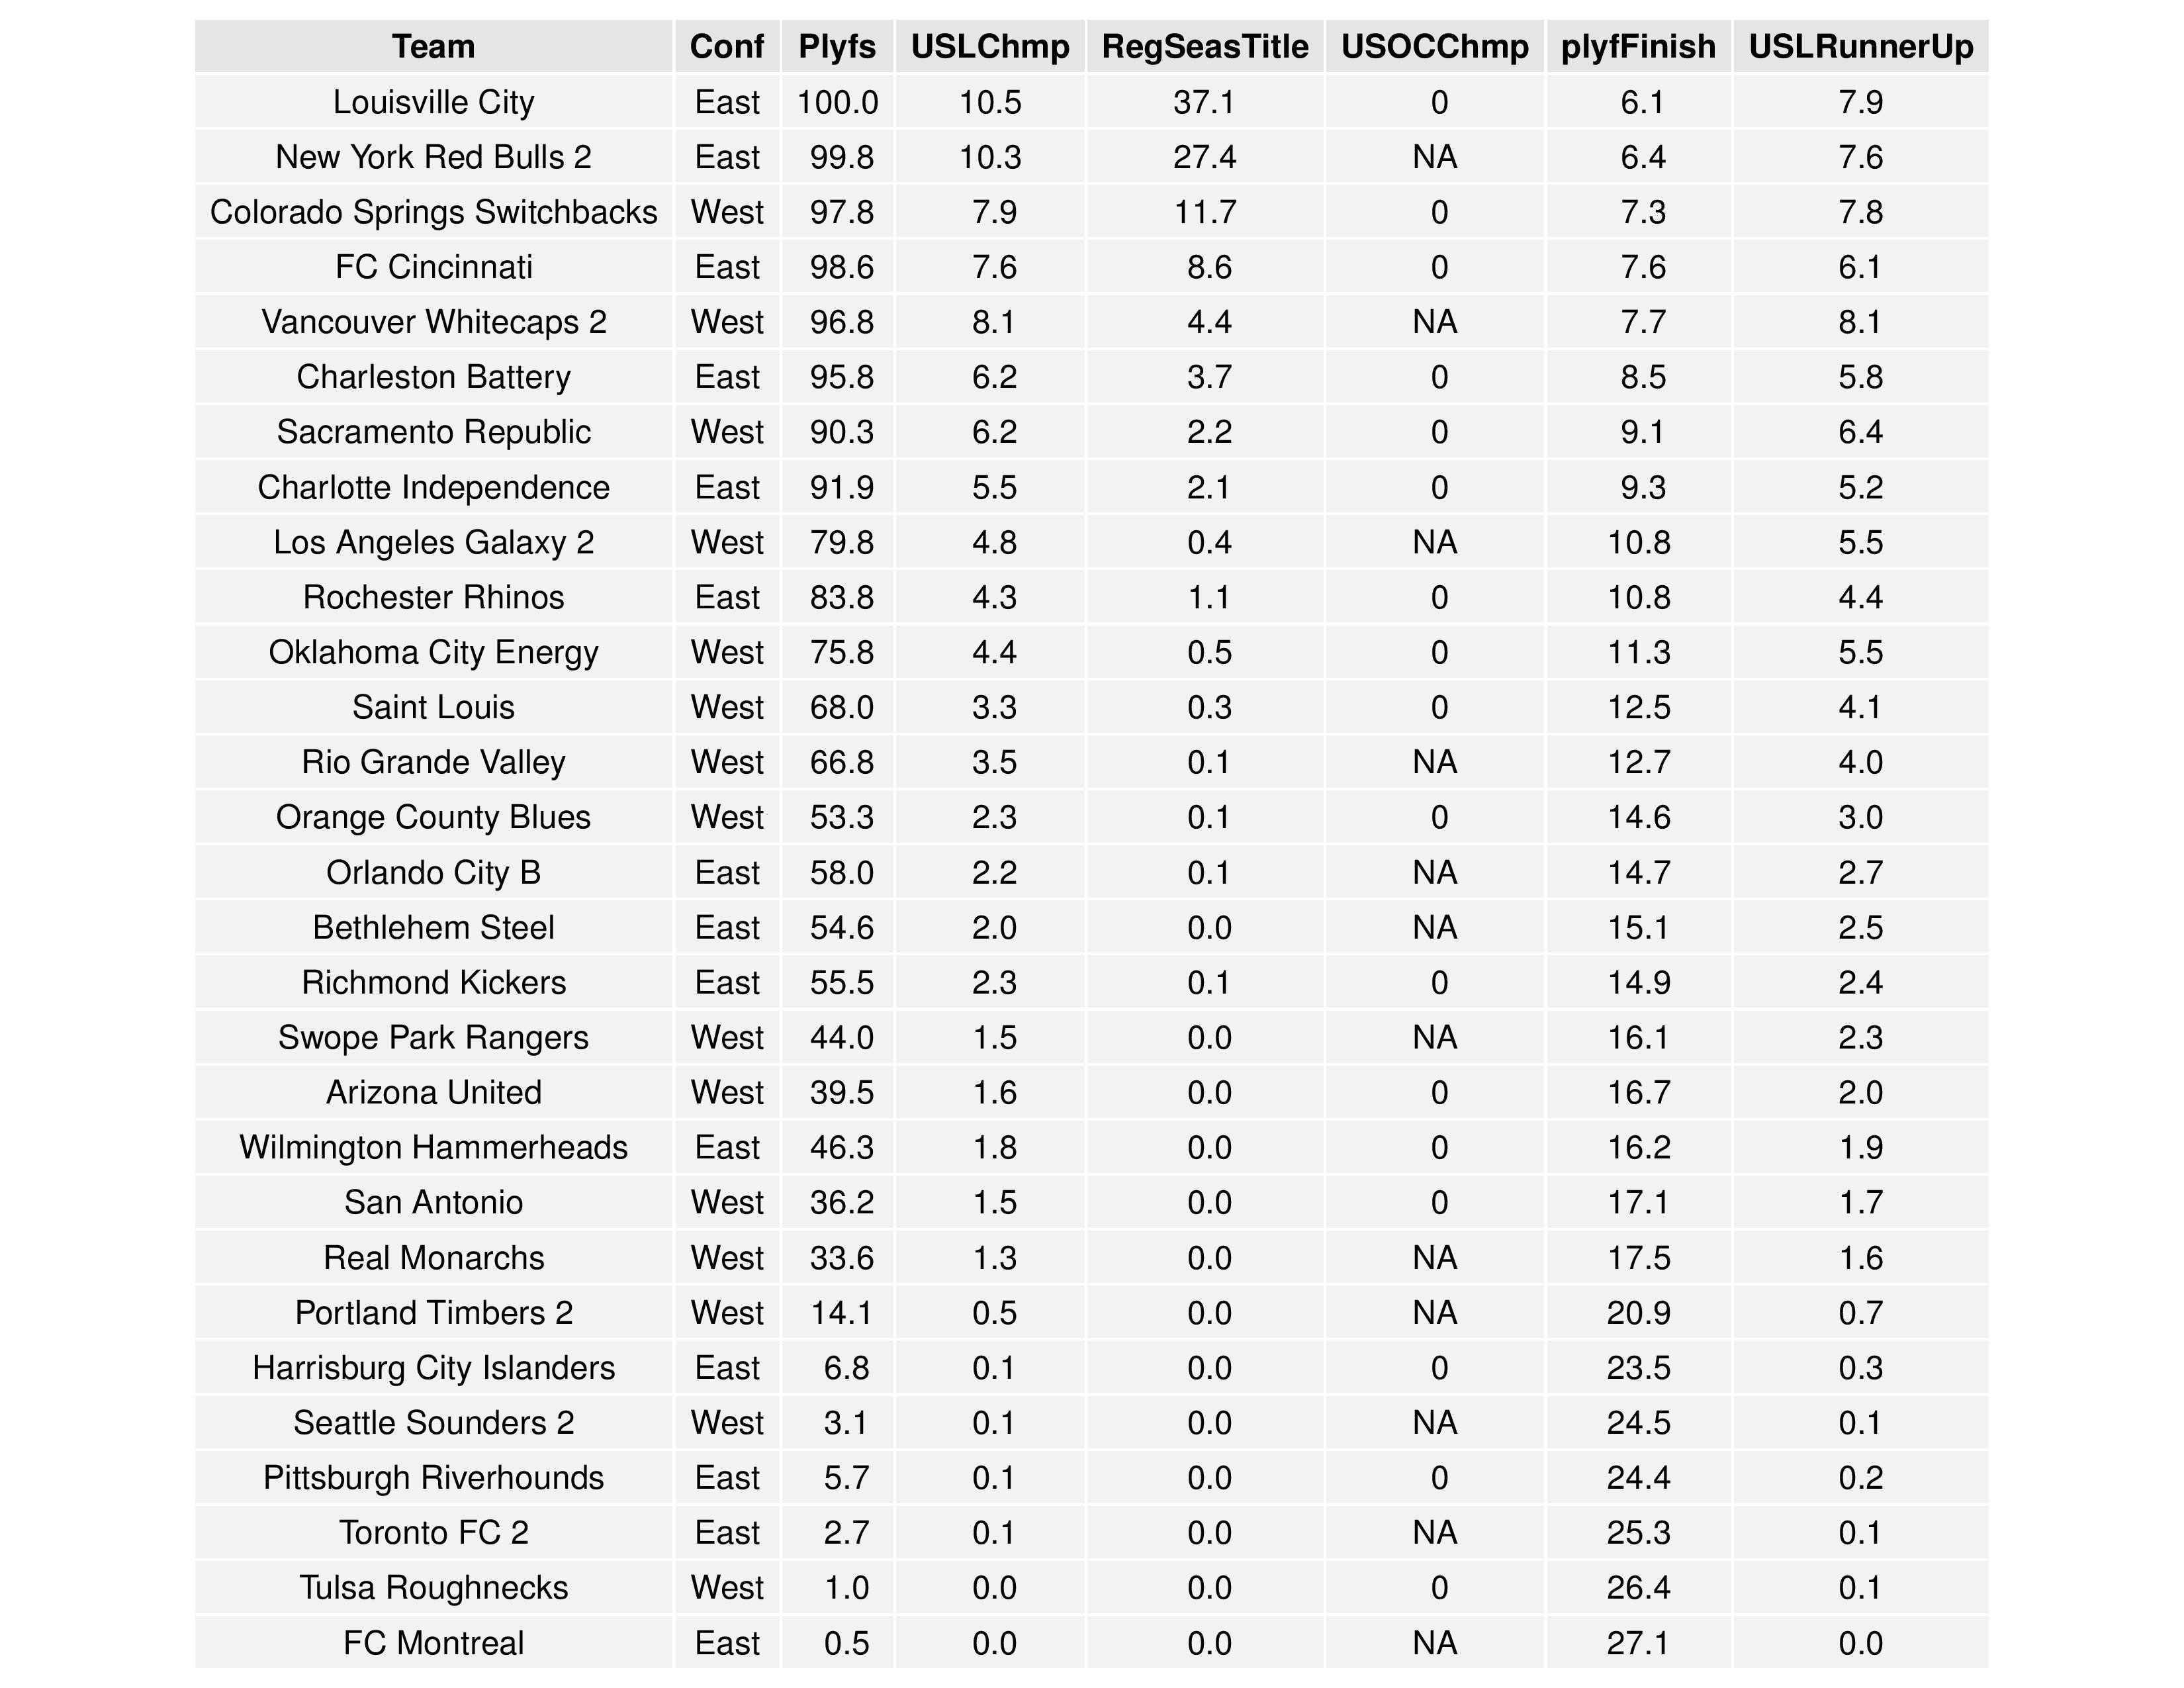
Bethlehem’s probability of making the playoffs declined slightly from 55.6% to 54.6%. Harrisburg City’s chances plummeted from 22.7% to 6.8% and really need to put in a string a wins over the next few matches to have a realistic chance of making the playoffs. Louisville City may not have mathematically clinched playoffs this early, but SEBA implies that their chances of missing the playoffs are now likely less than 1/15000
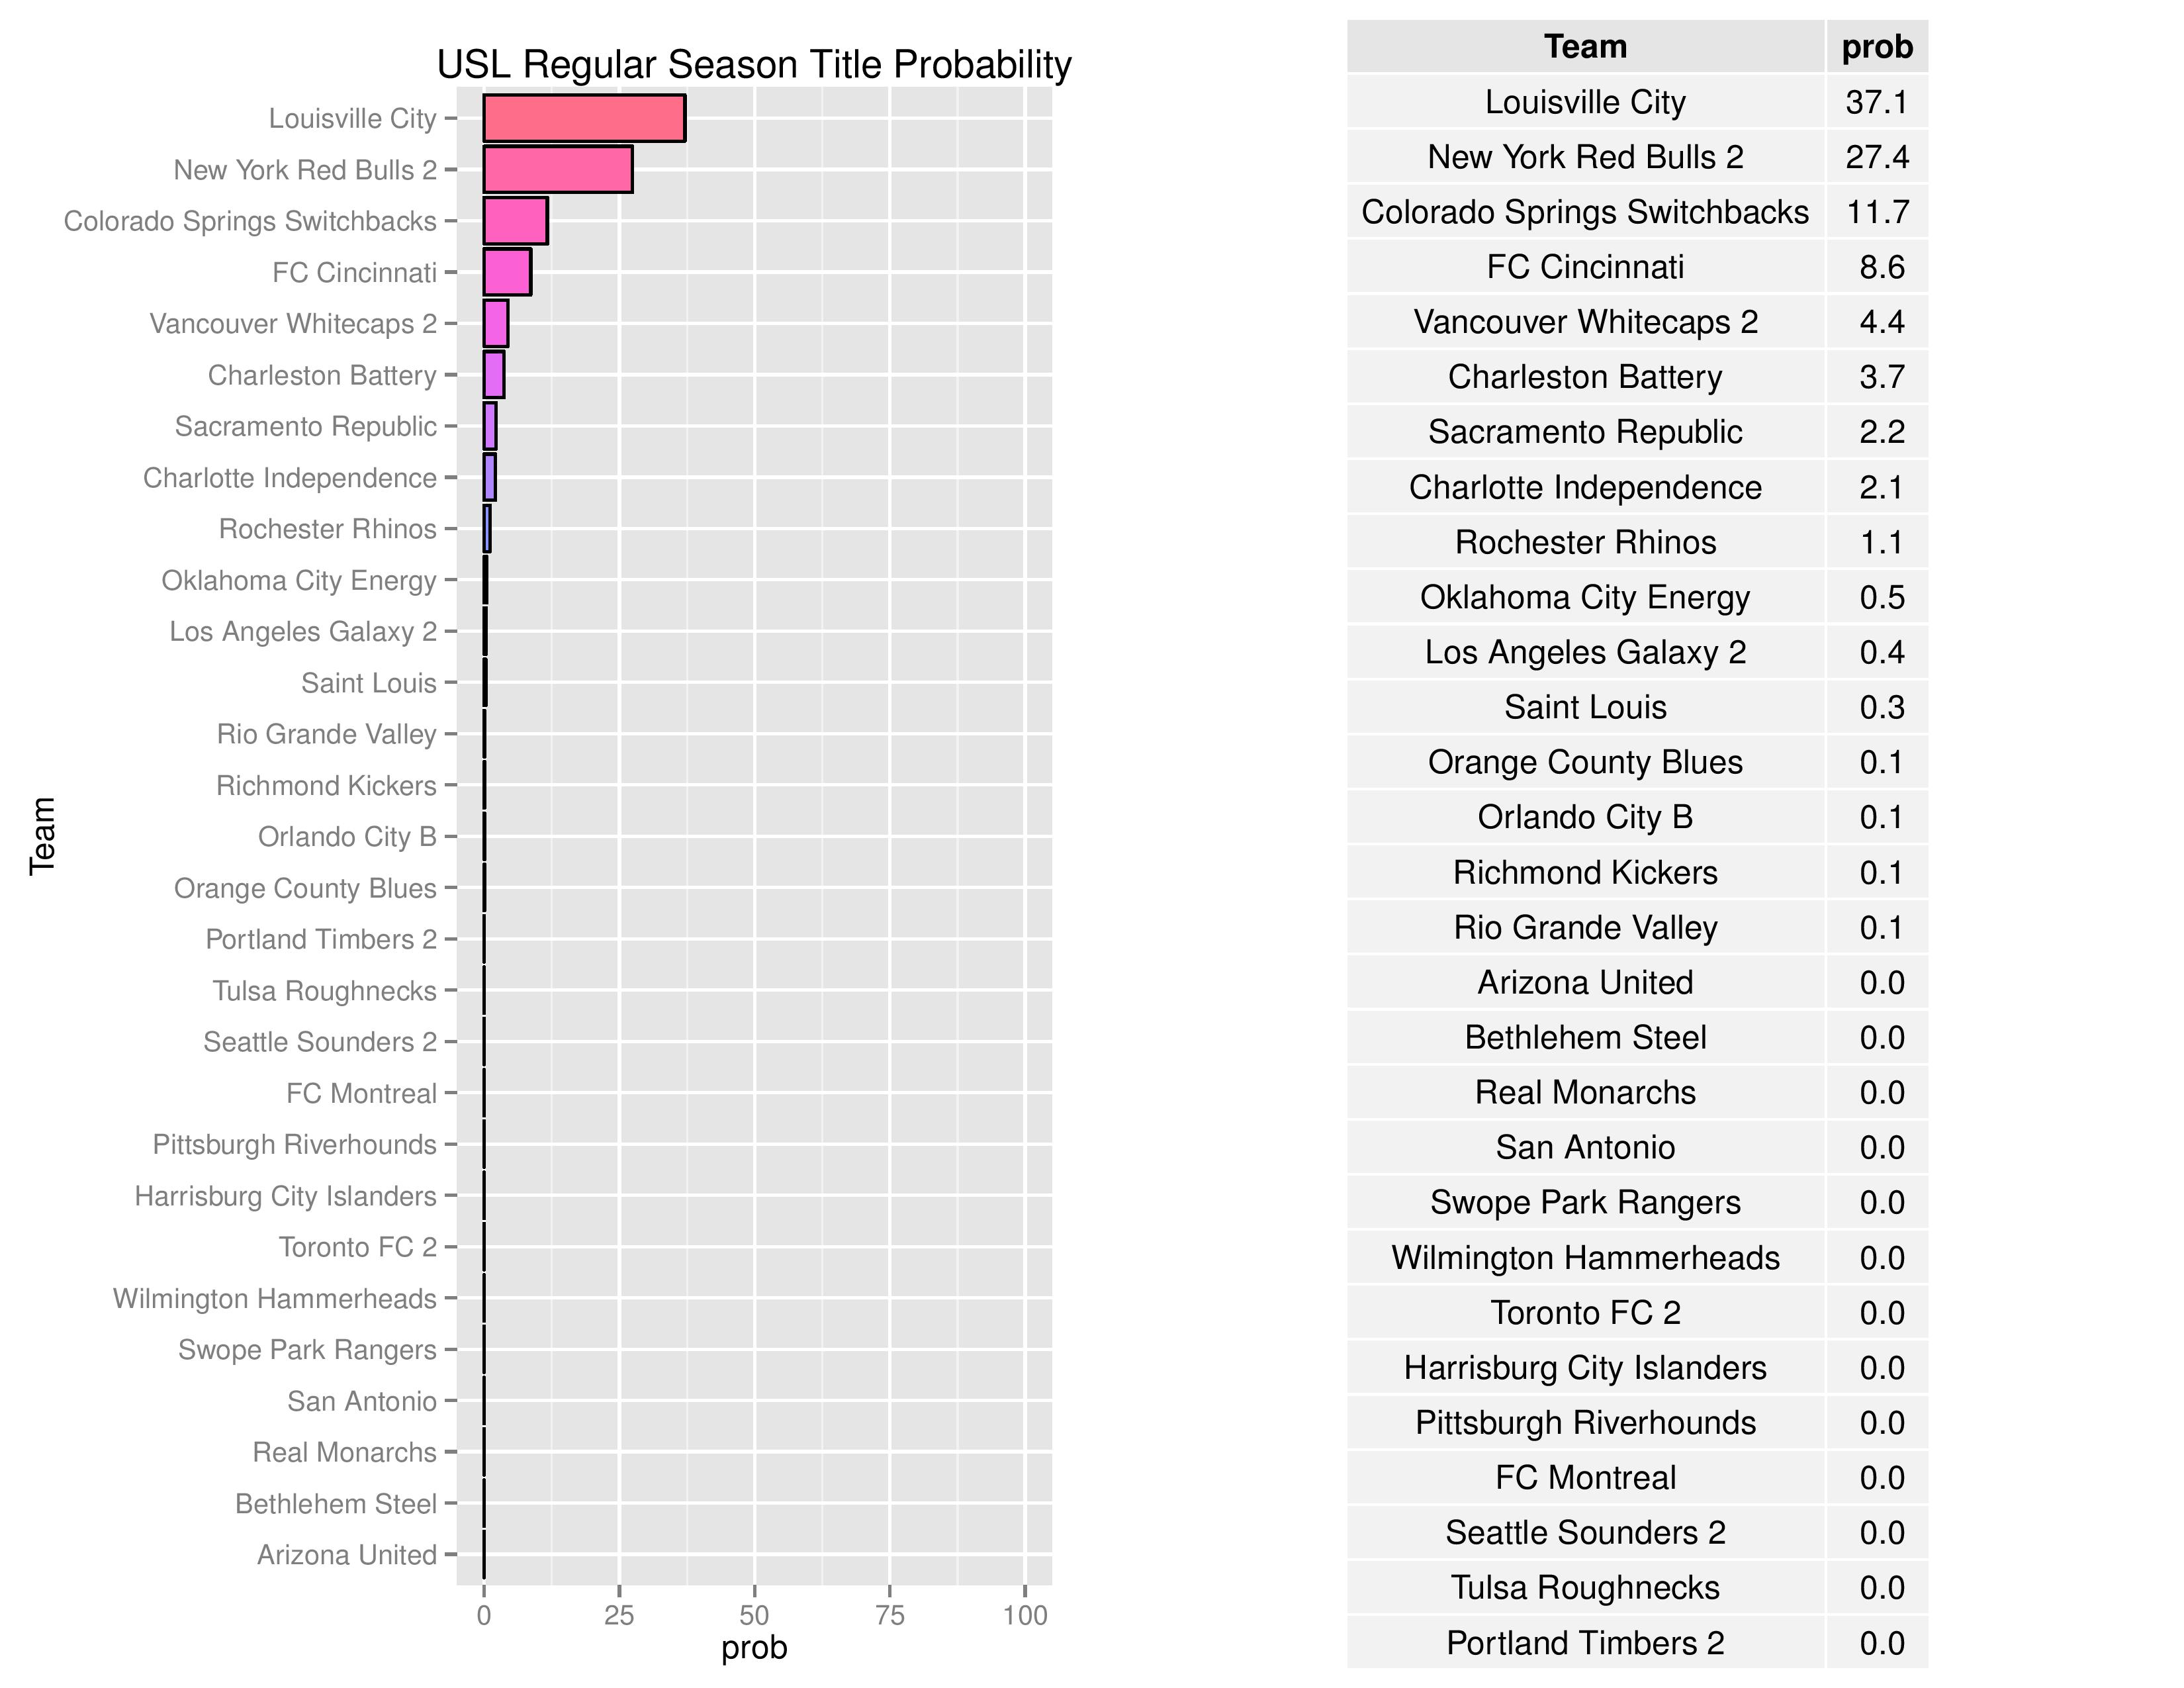
Both Bethlehem and Harrisburg City have effectively no chance of winning the USL regular season title.
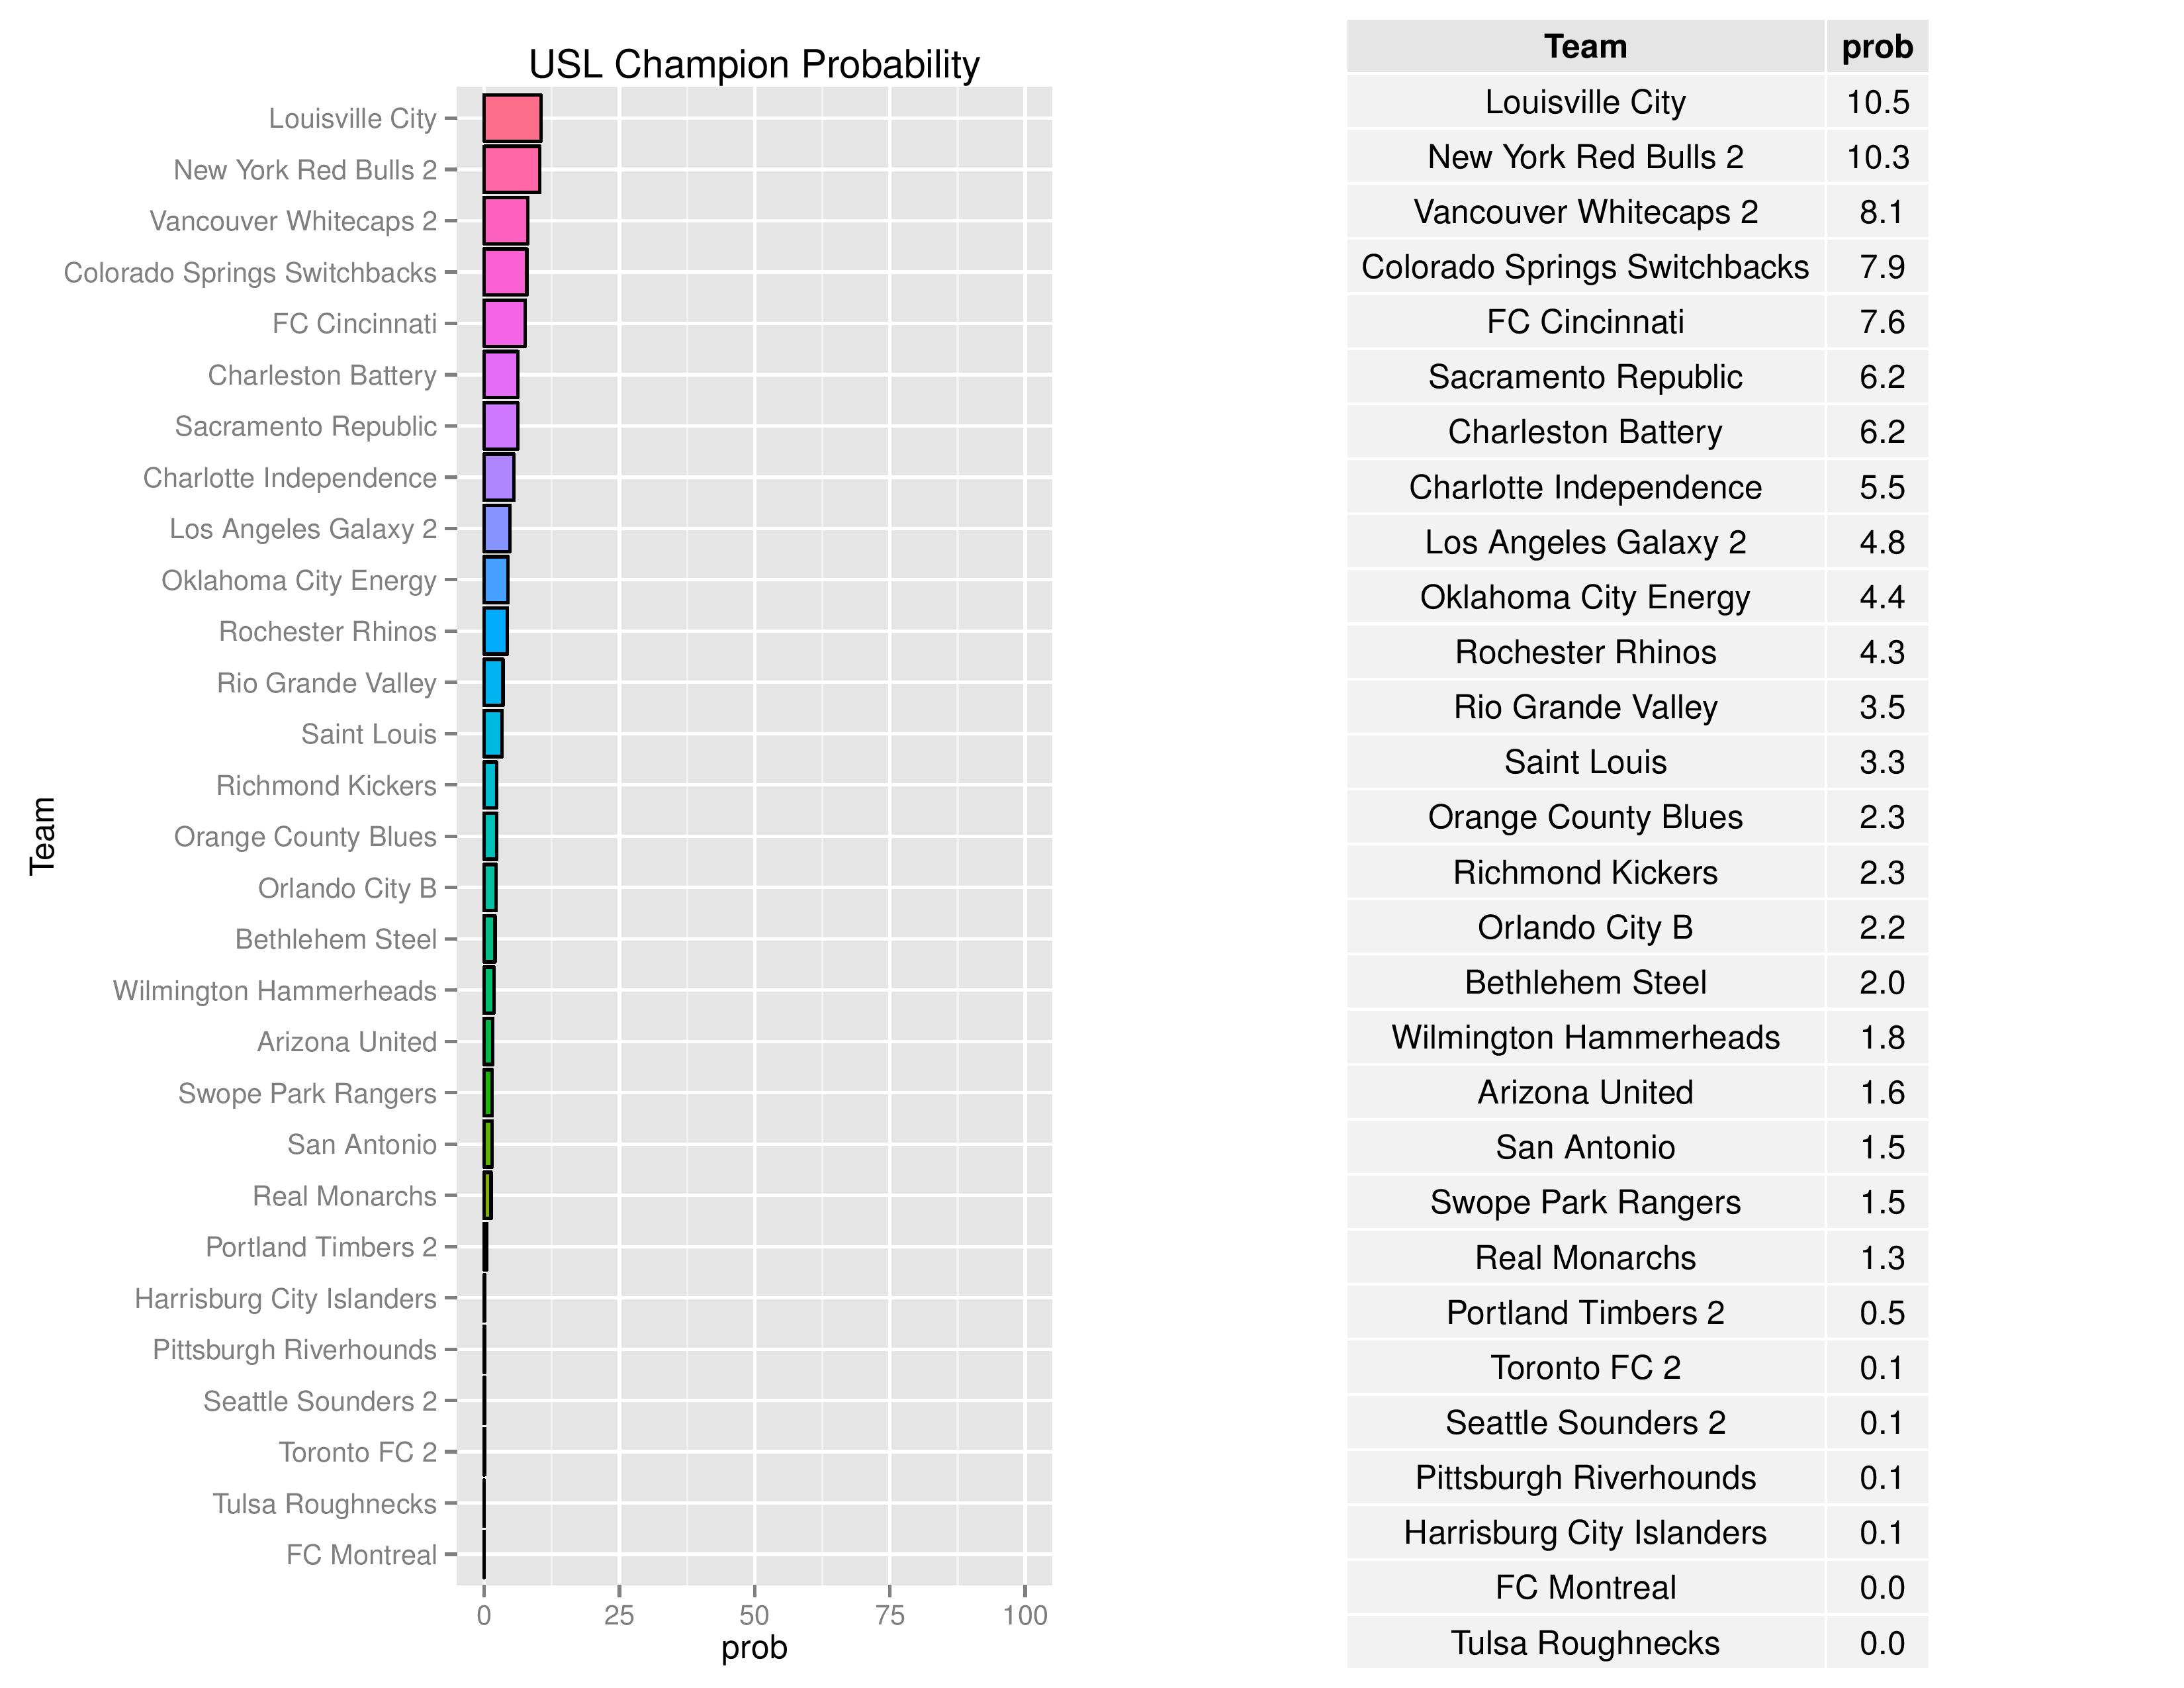
Bethlehem’s probability of winning the USL Championship declined from 2.4% to 2.0%. Harrisburg City’s chances have nearly extinguished going from 0.6% to 0.1%.
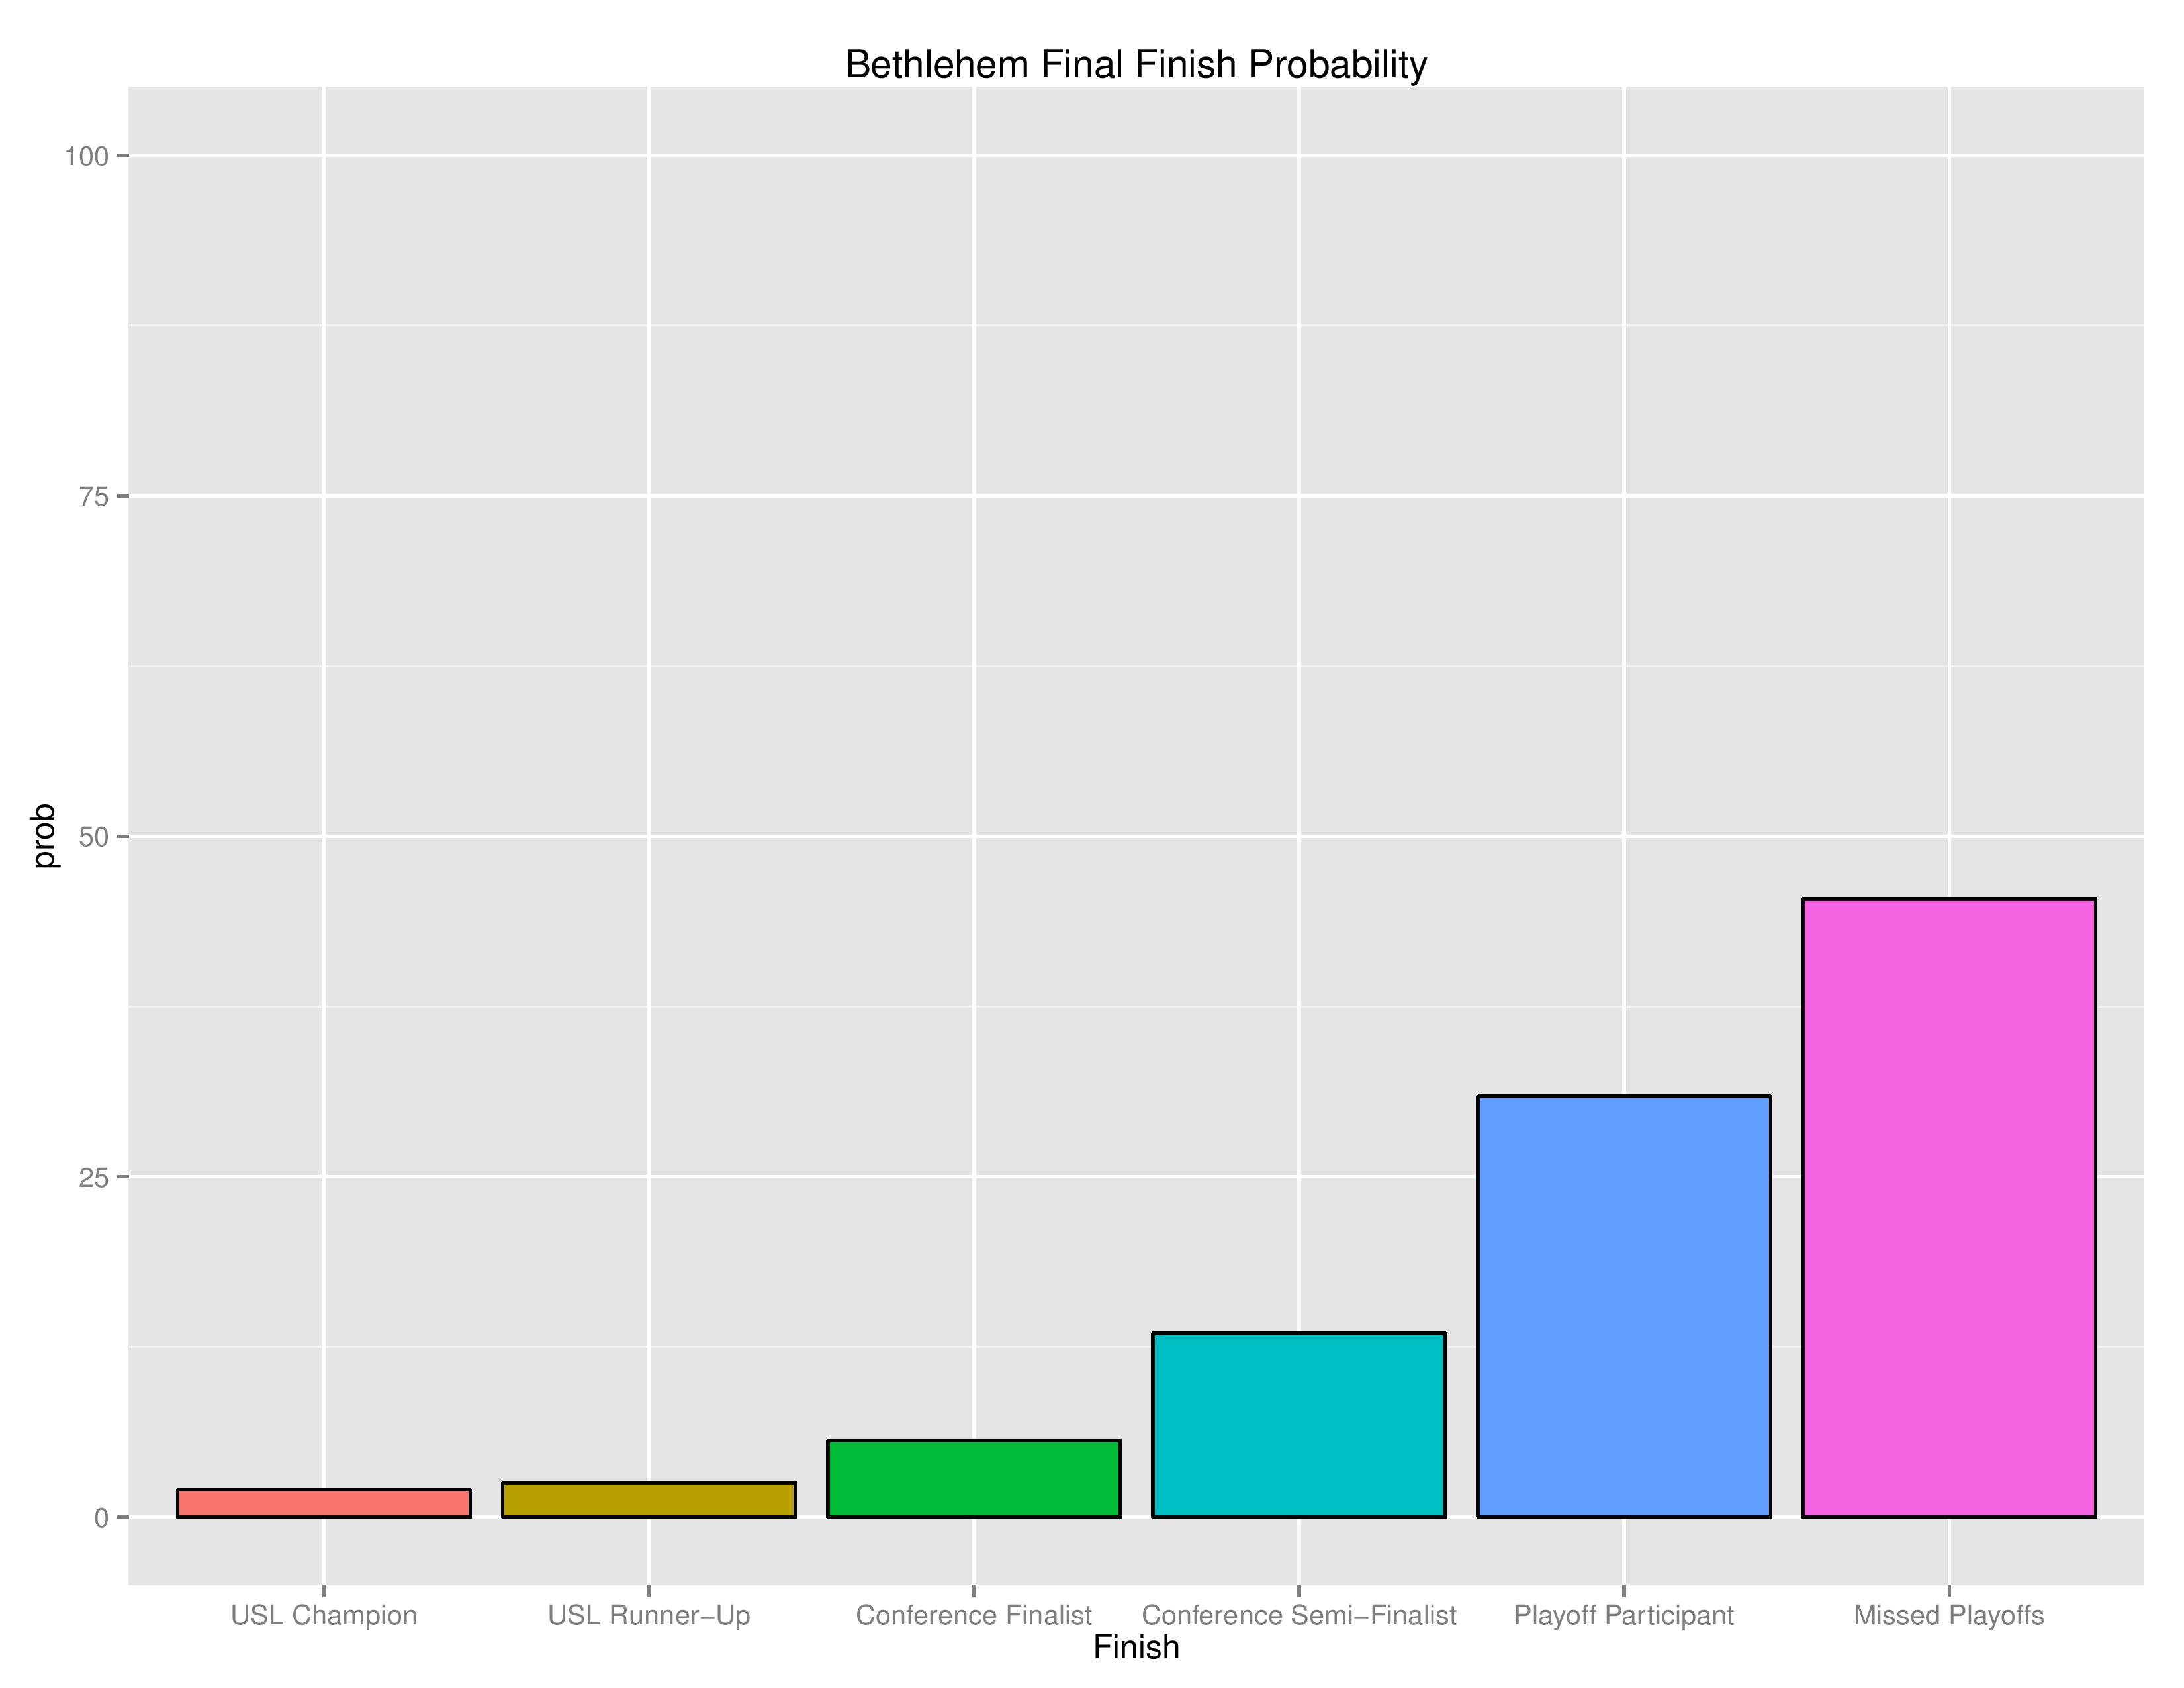
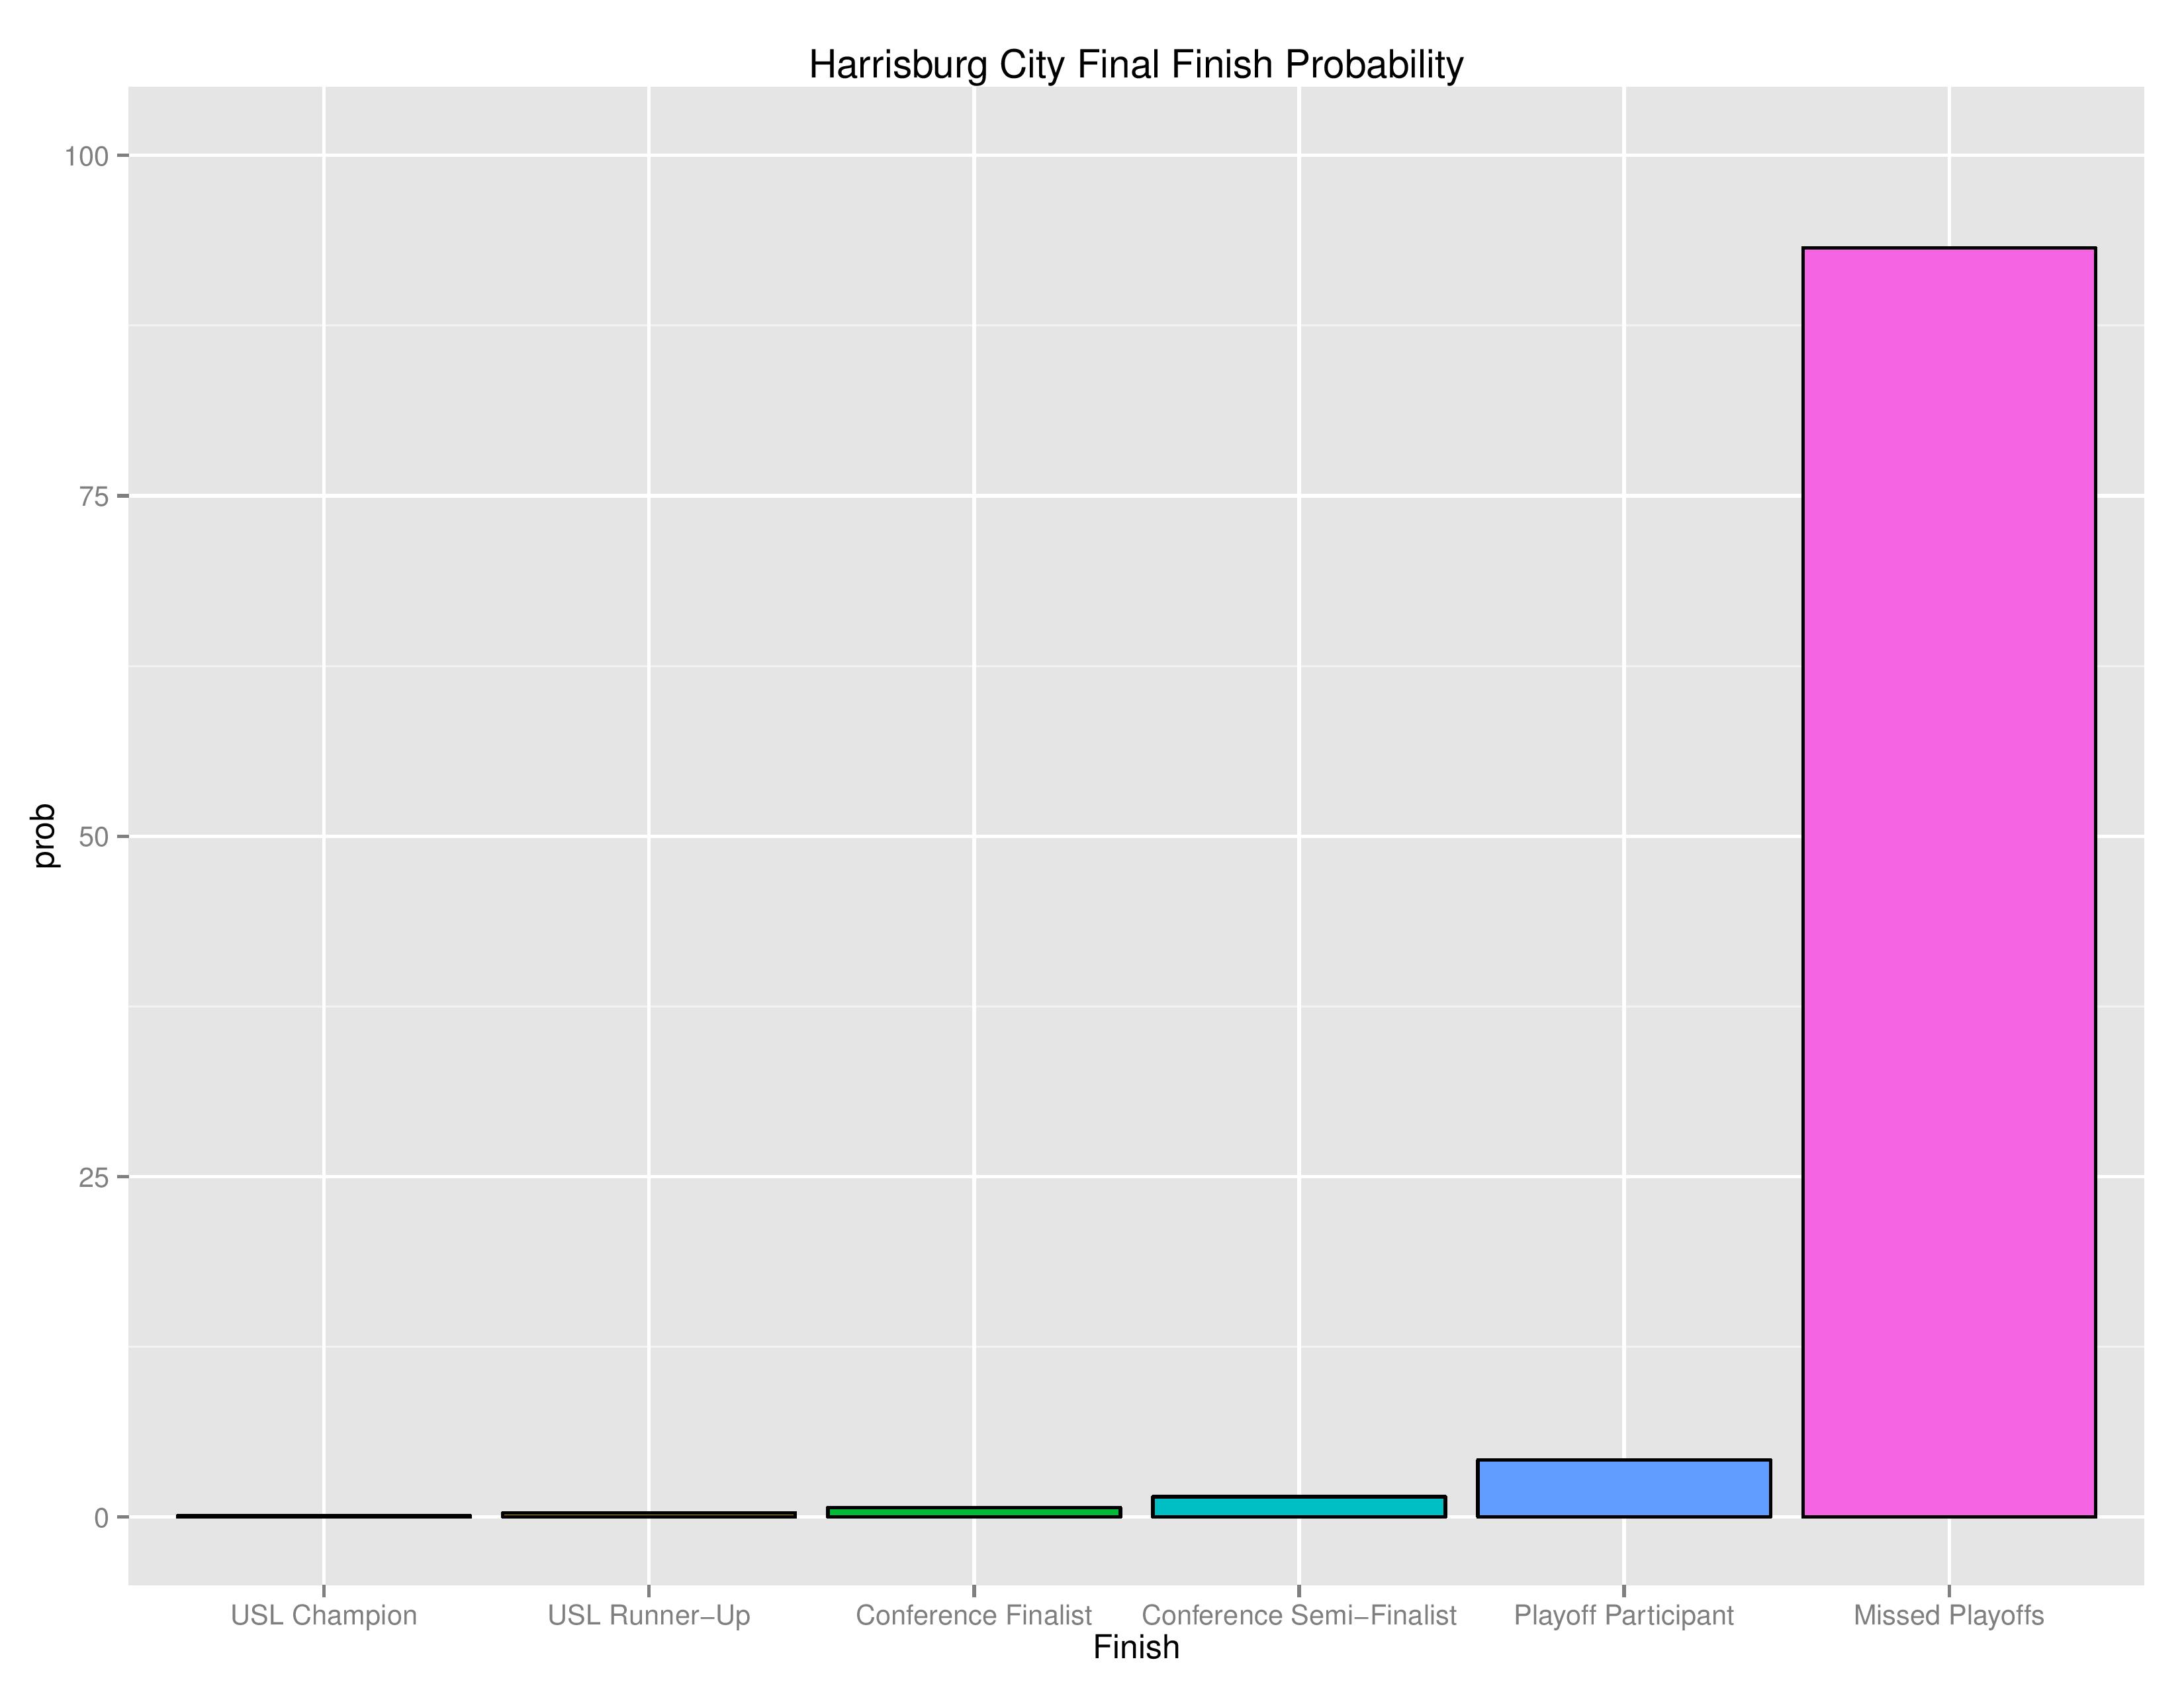
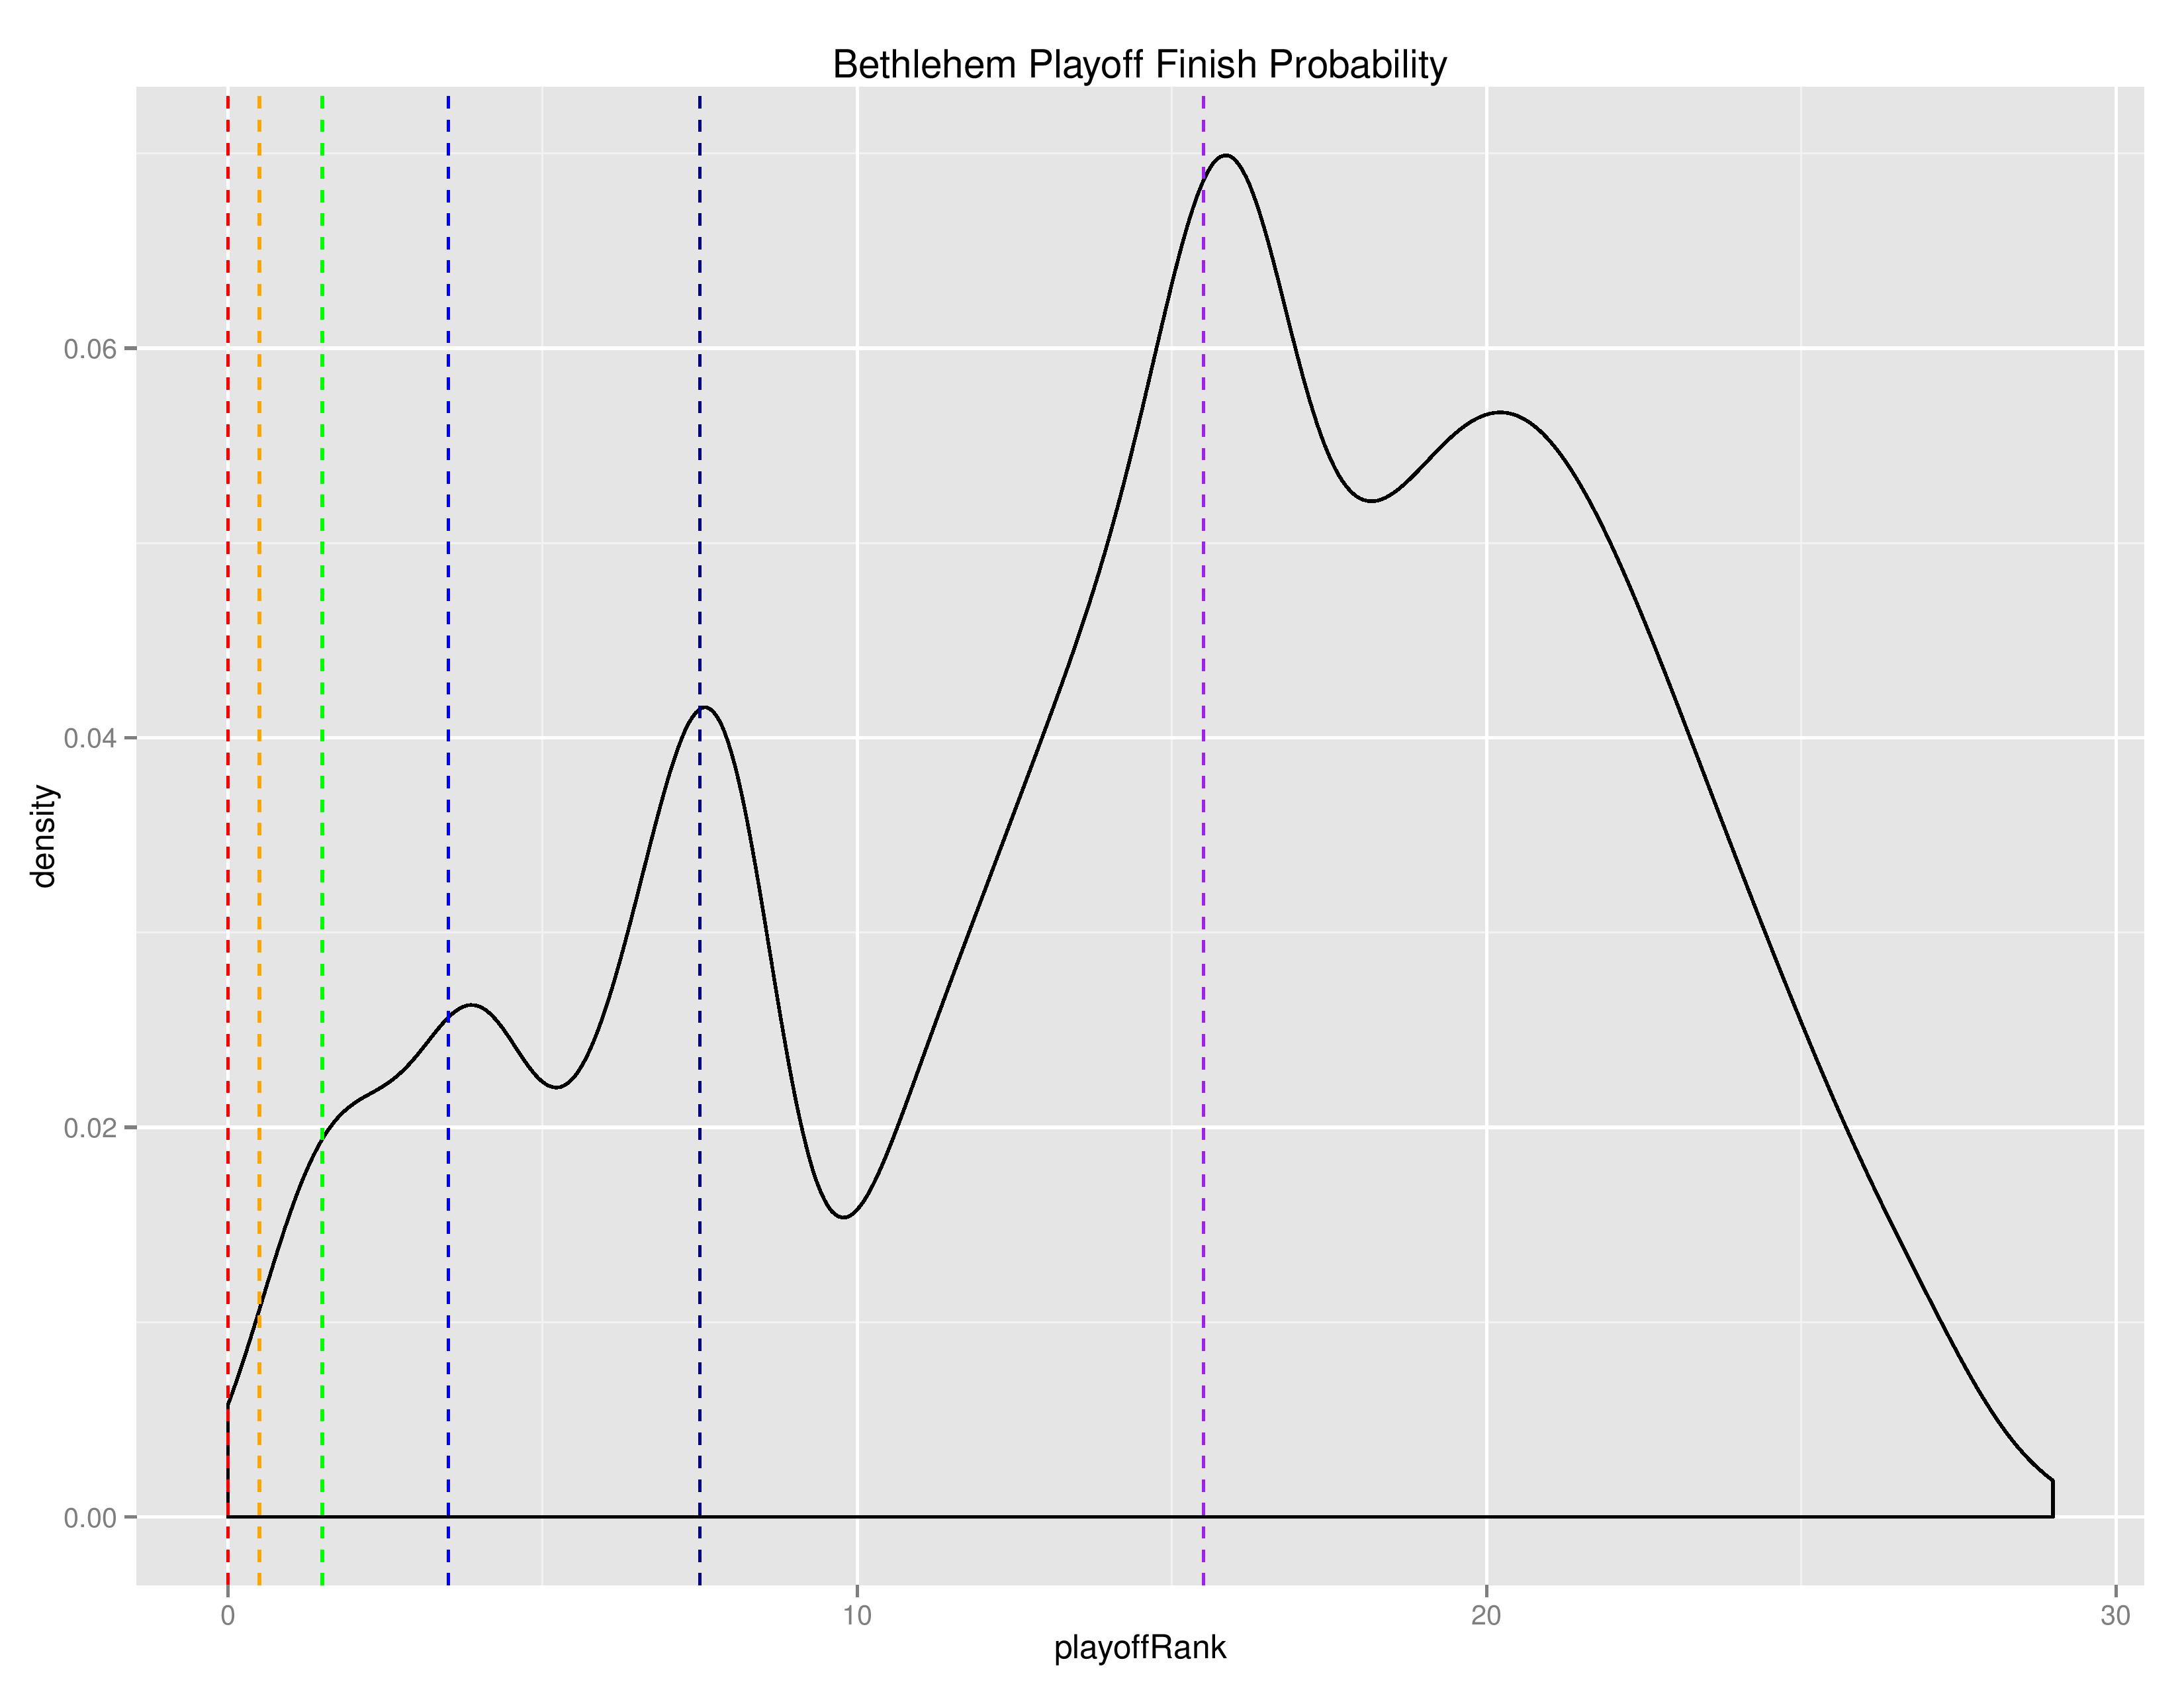
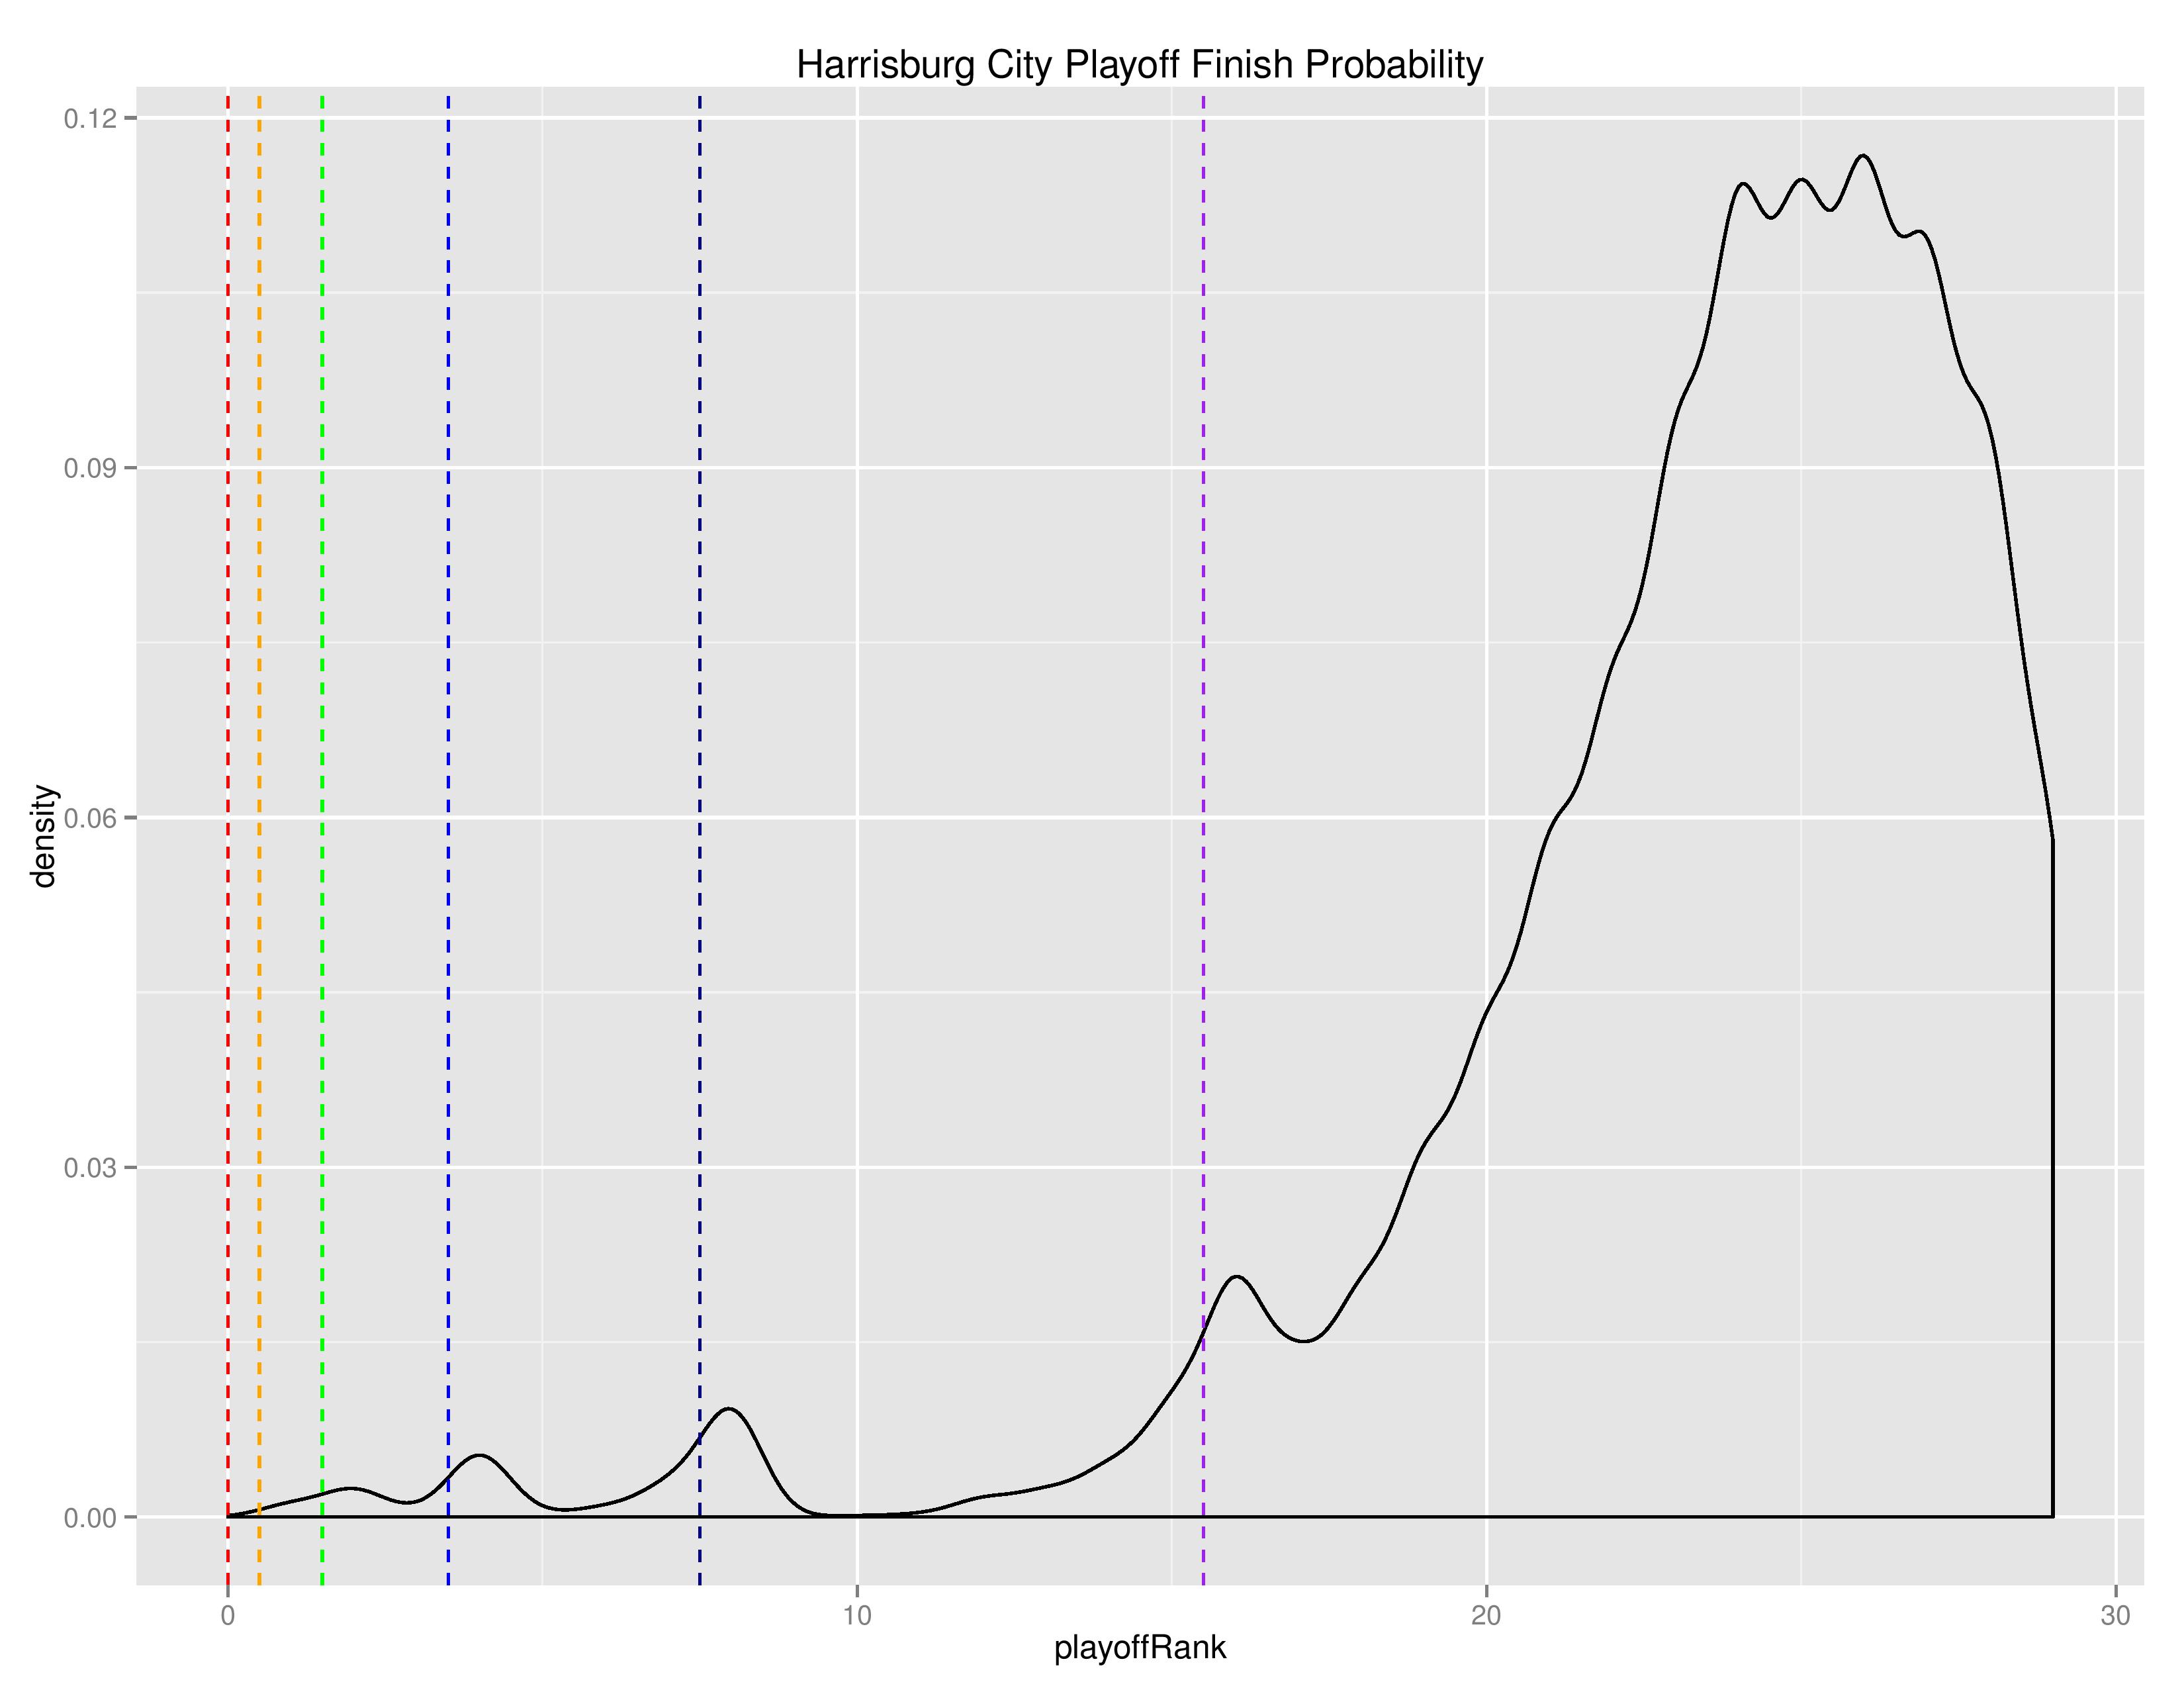
As with MLS, the below density charts show the relative probabilities of Bethlehem and Harrisburg finishing for their final playoff-rank.
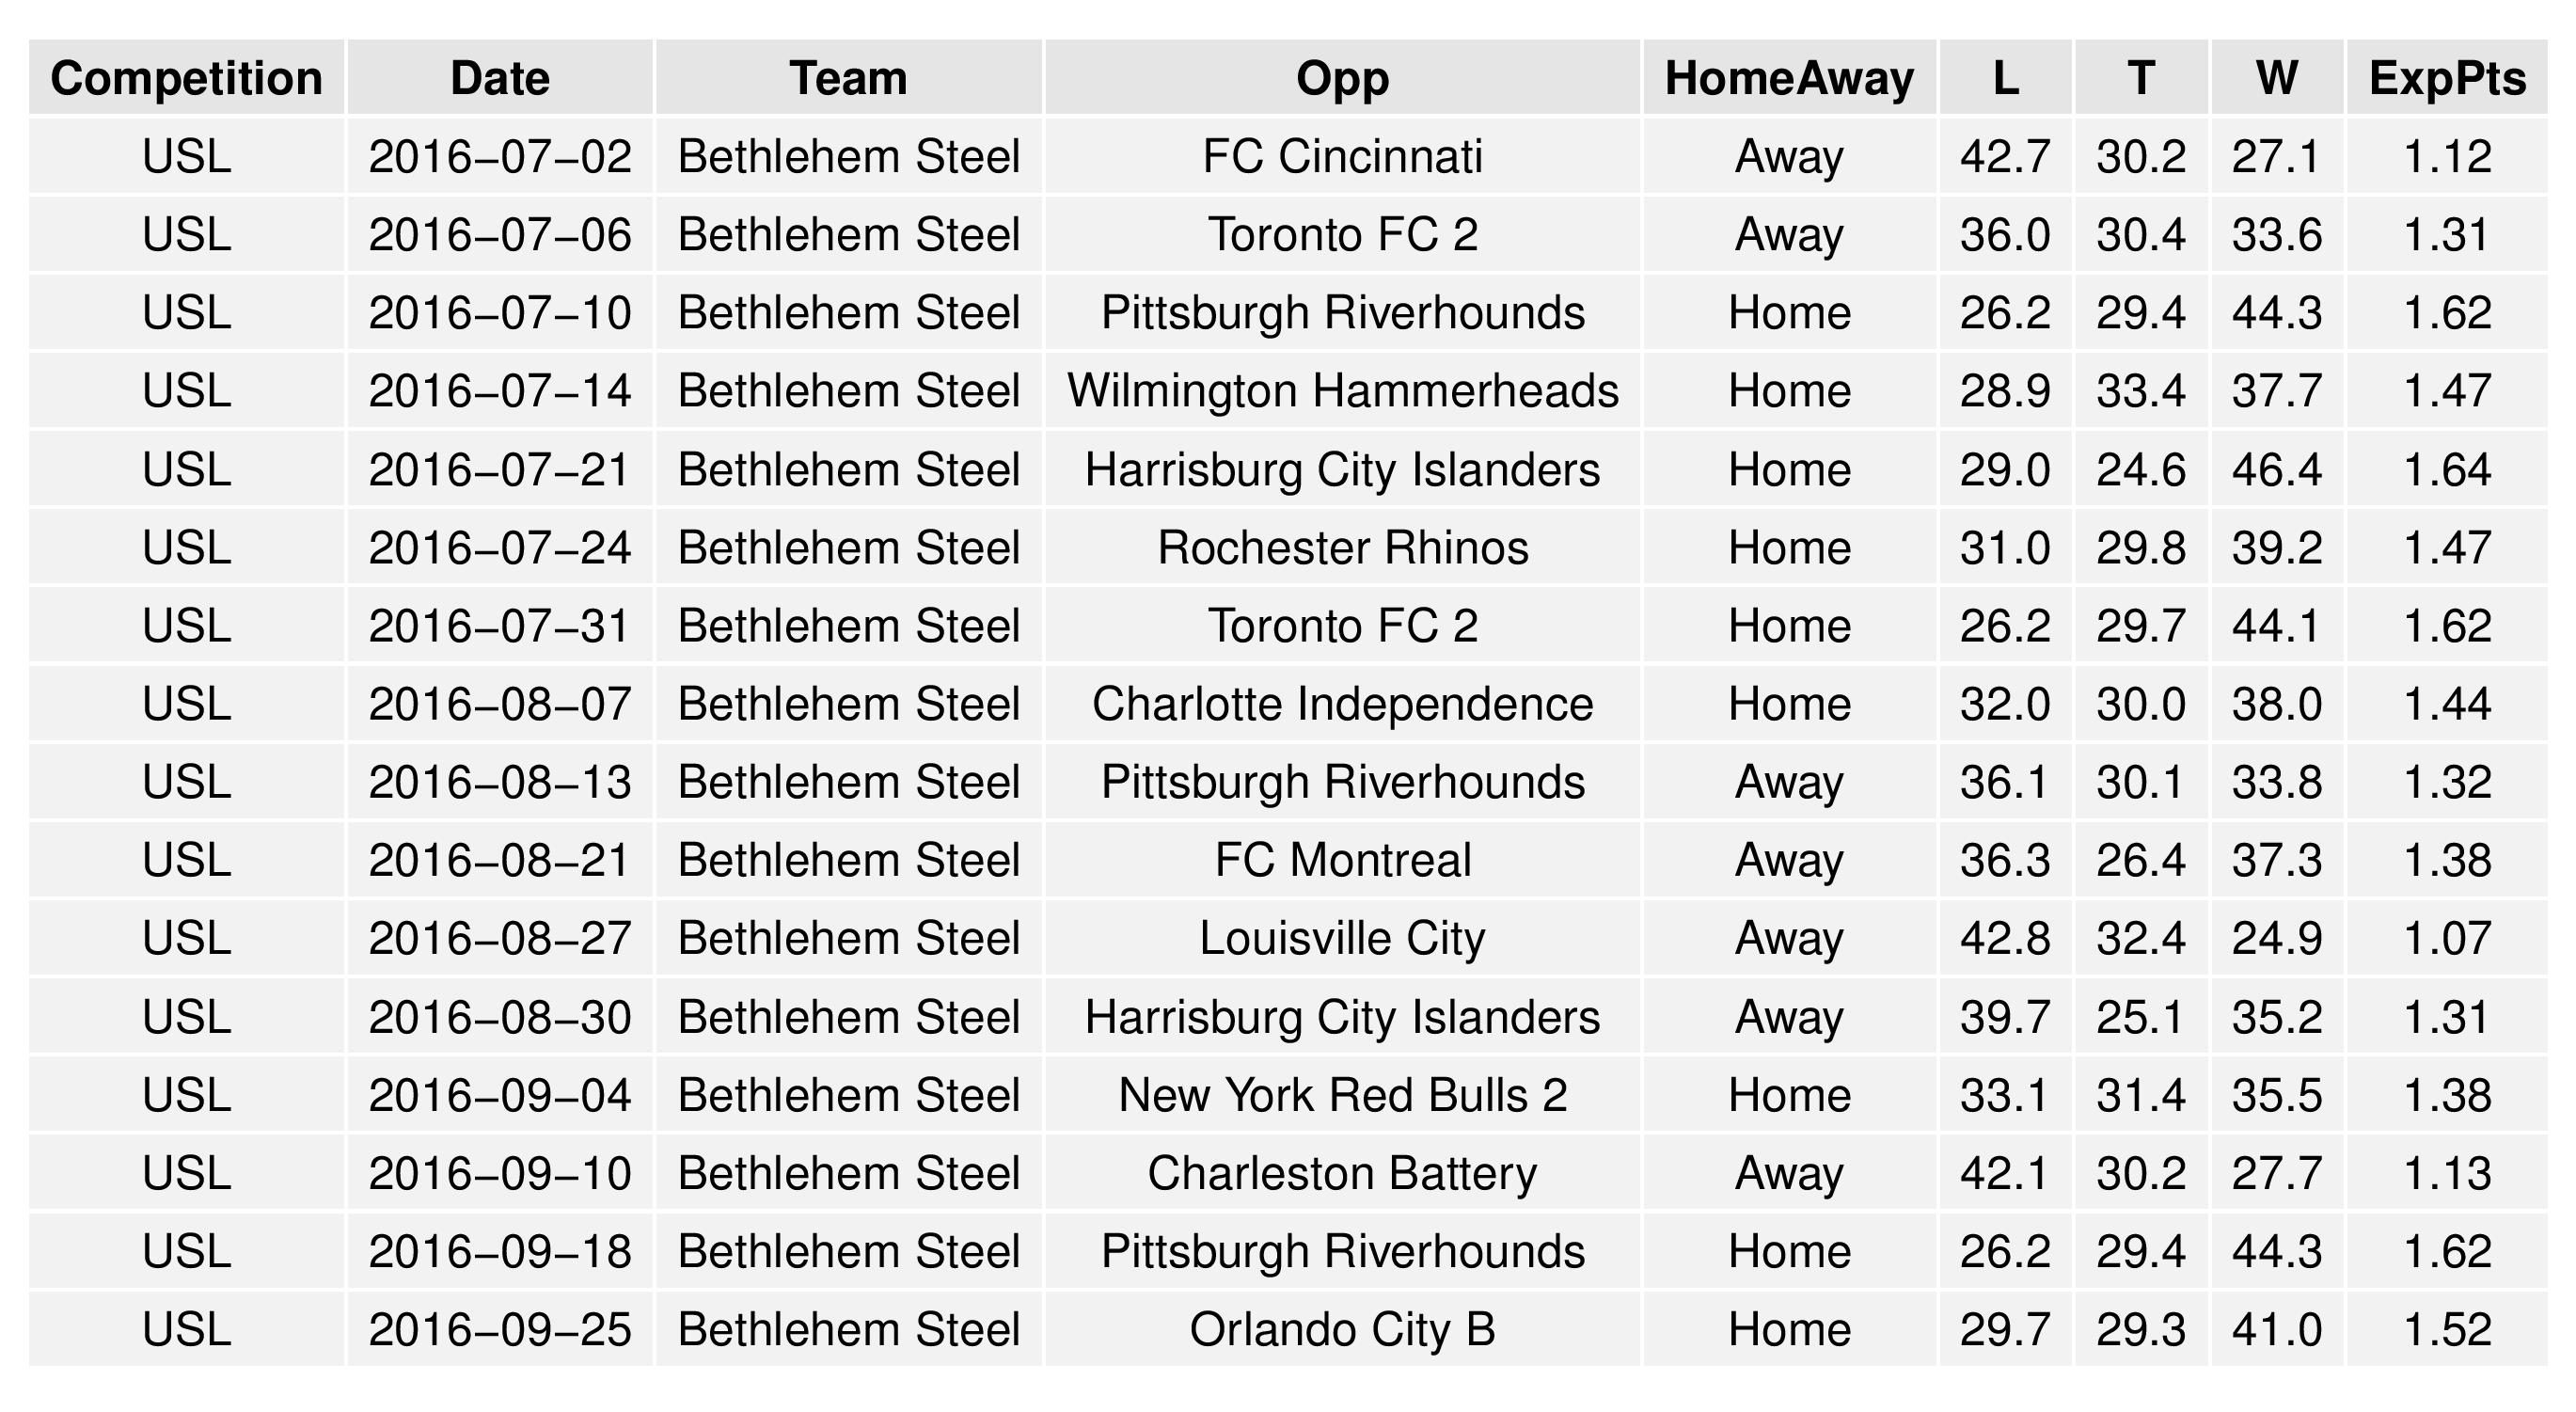
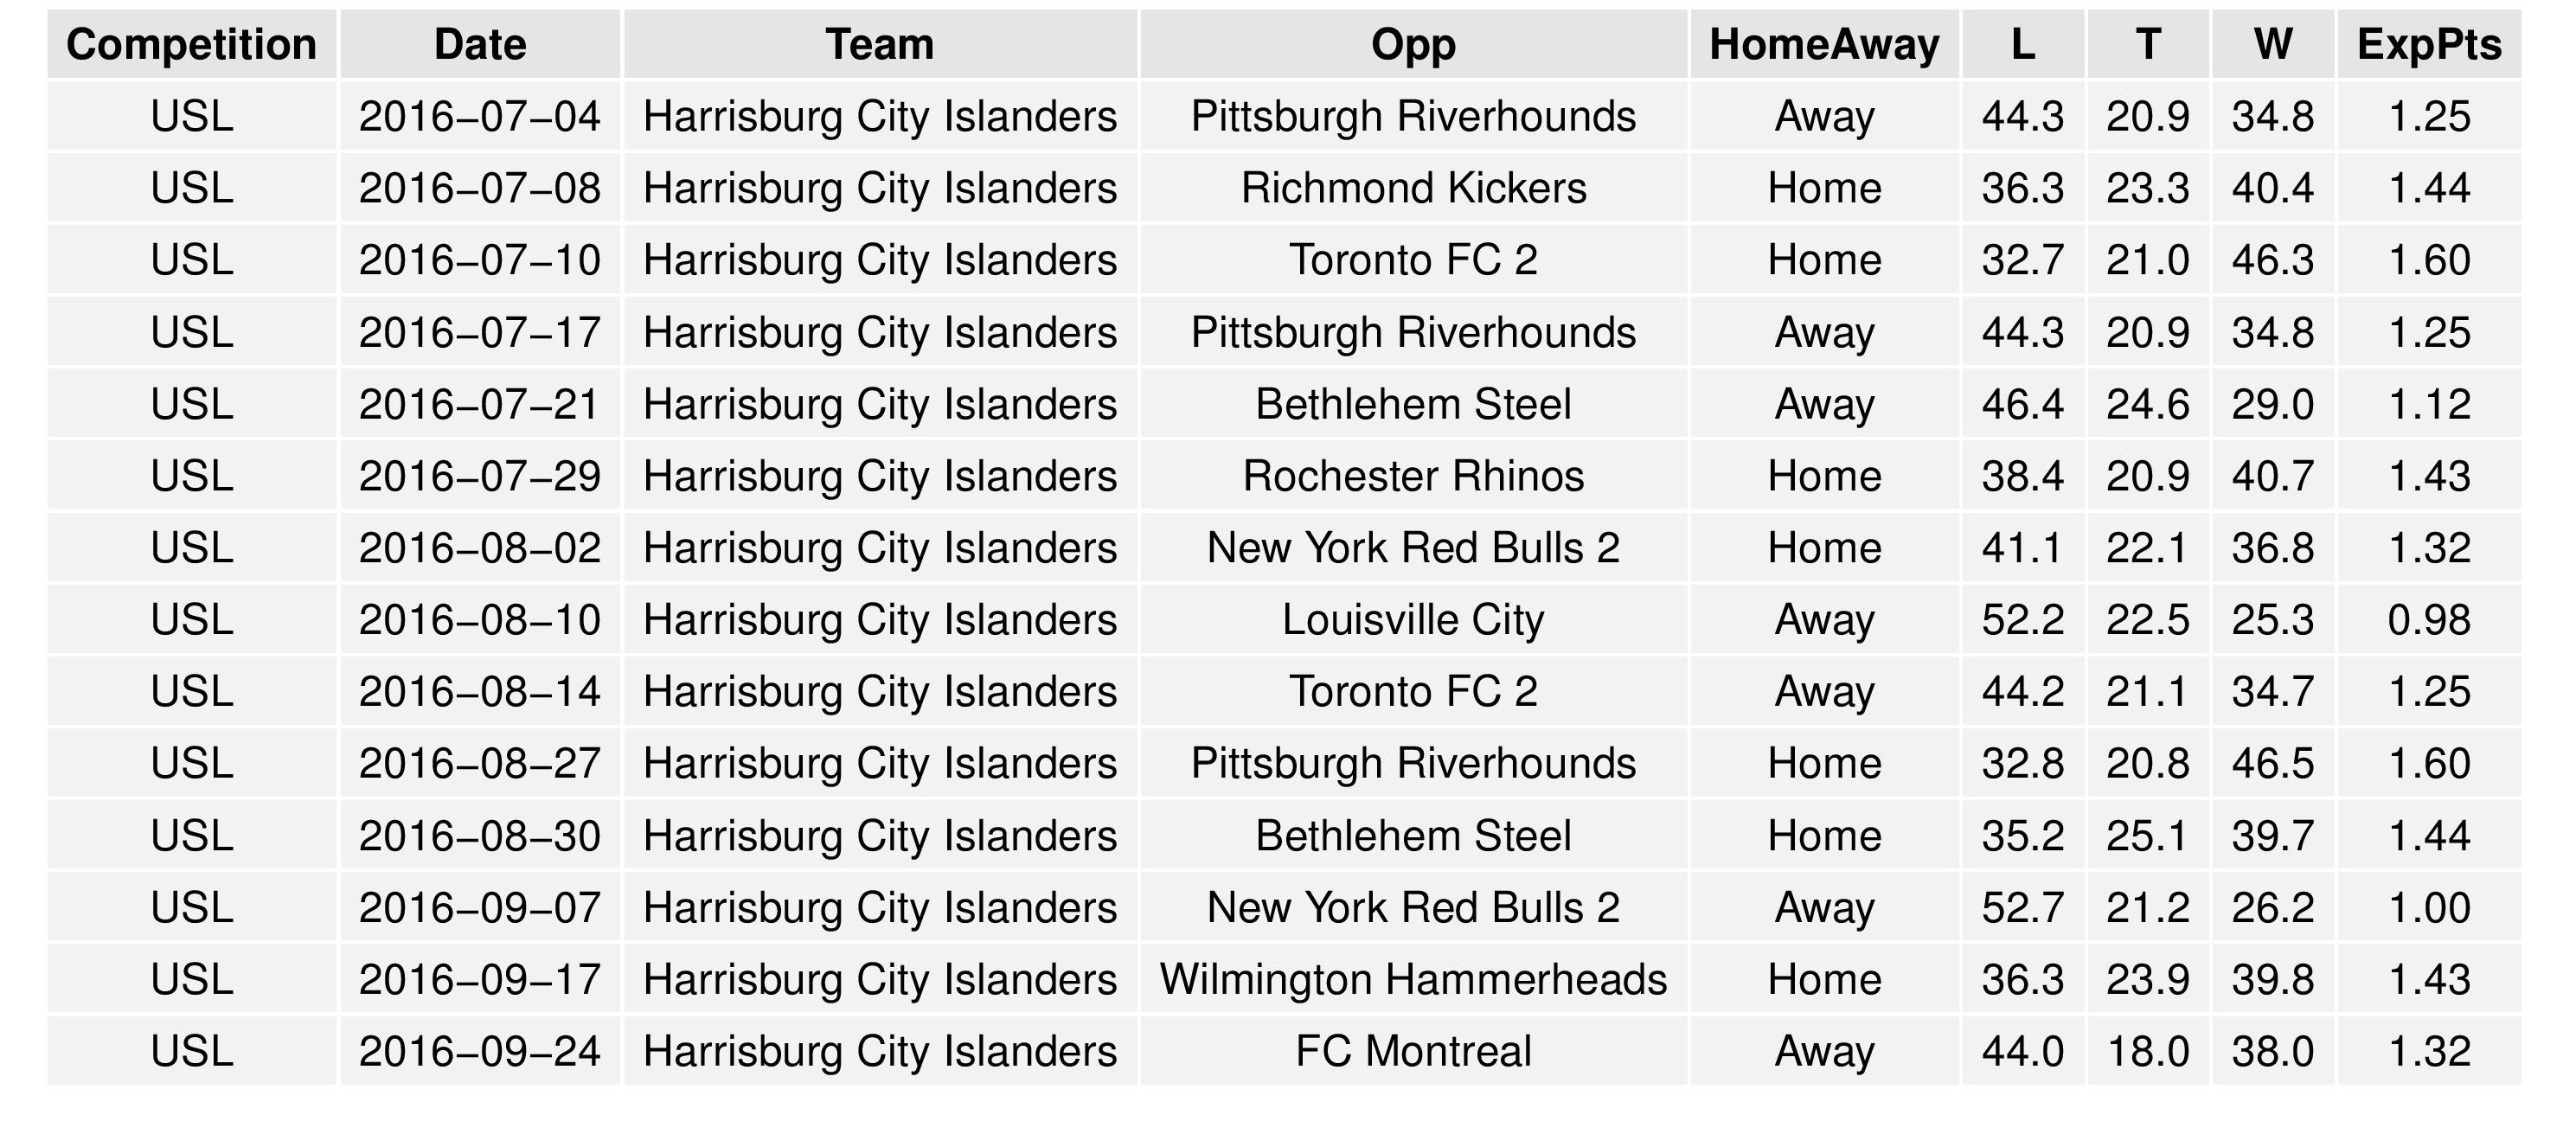
The following are the upcoming matches and associated probabilities for Bethlehem and Harrisburg City.
The following tables show the average simulation results. They are divided into two tables to present better to your screen.
Changes Over Time
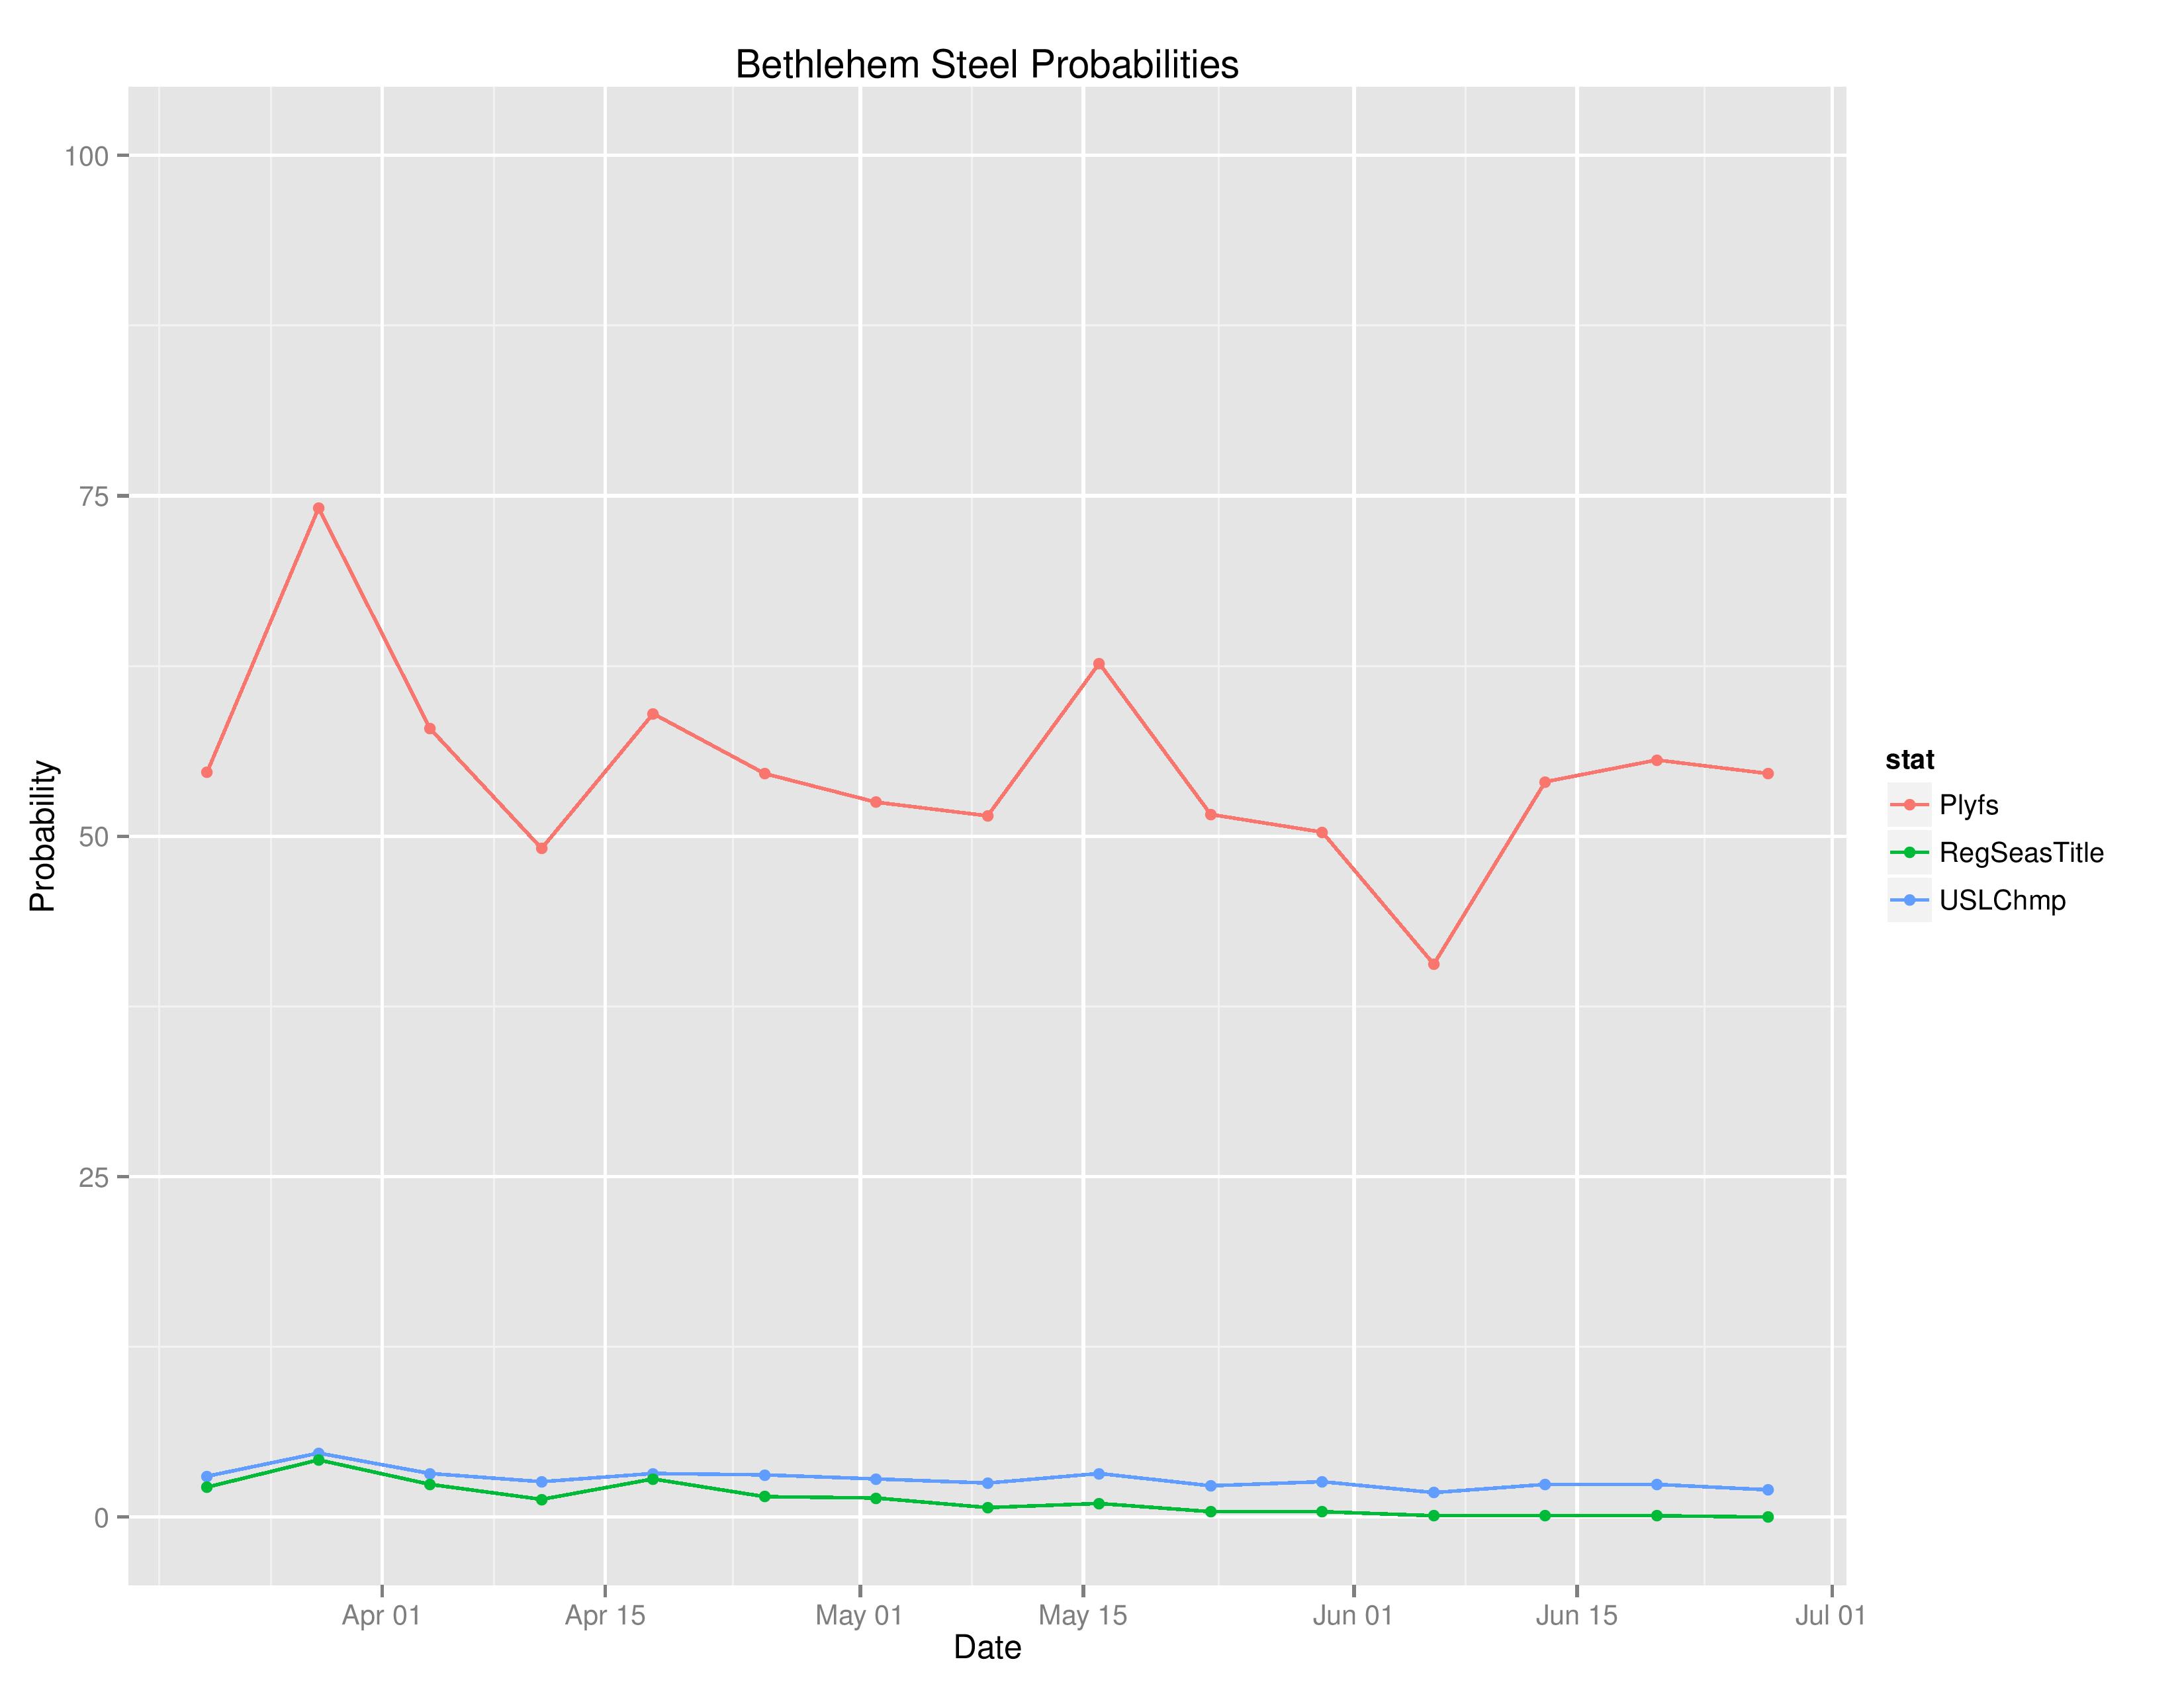
Above shows the probabilities of various outcomes for Bethlehem over the course of the season.
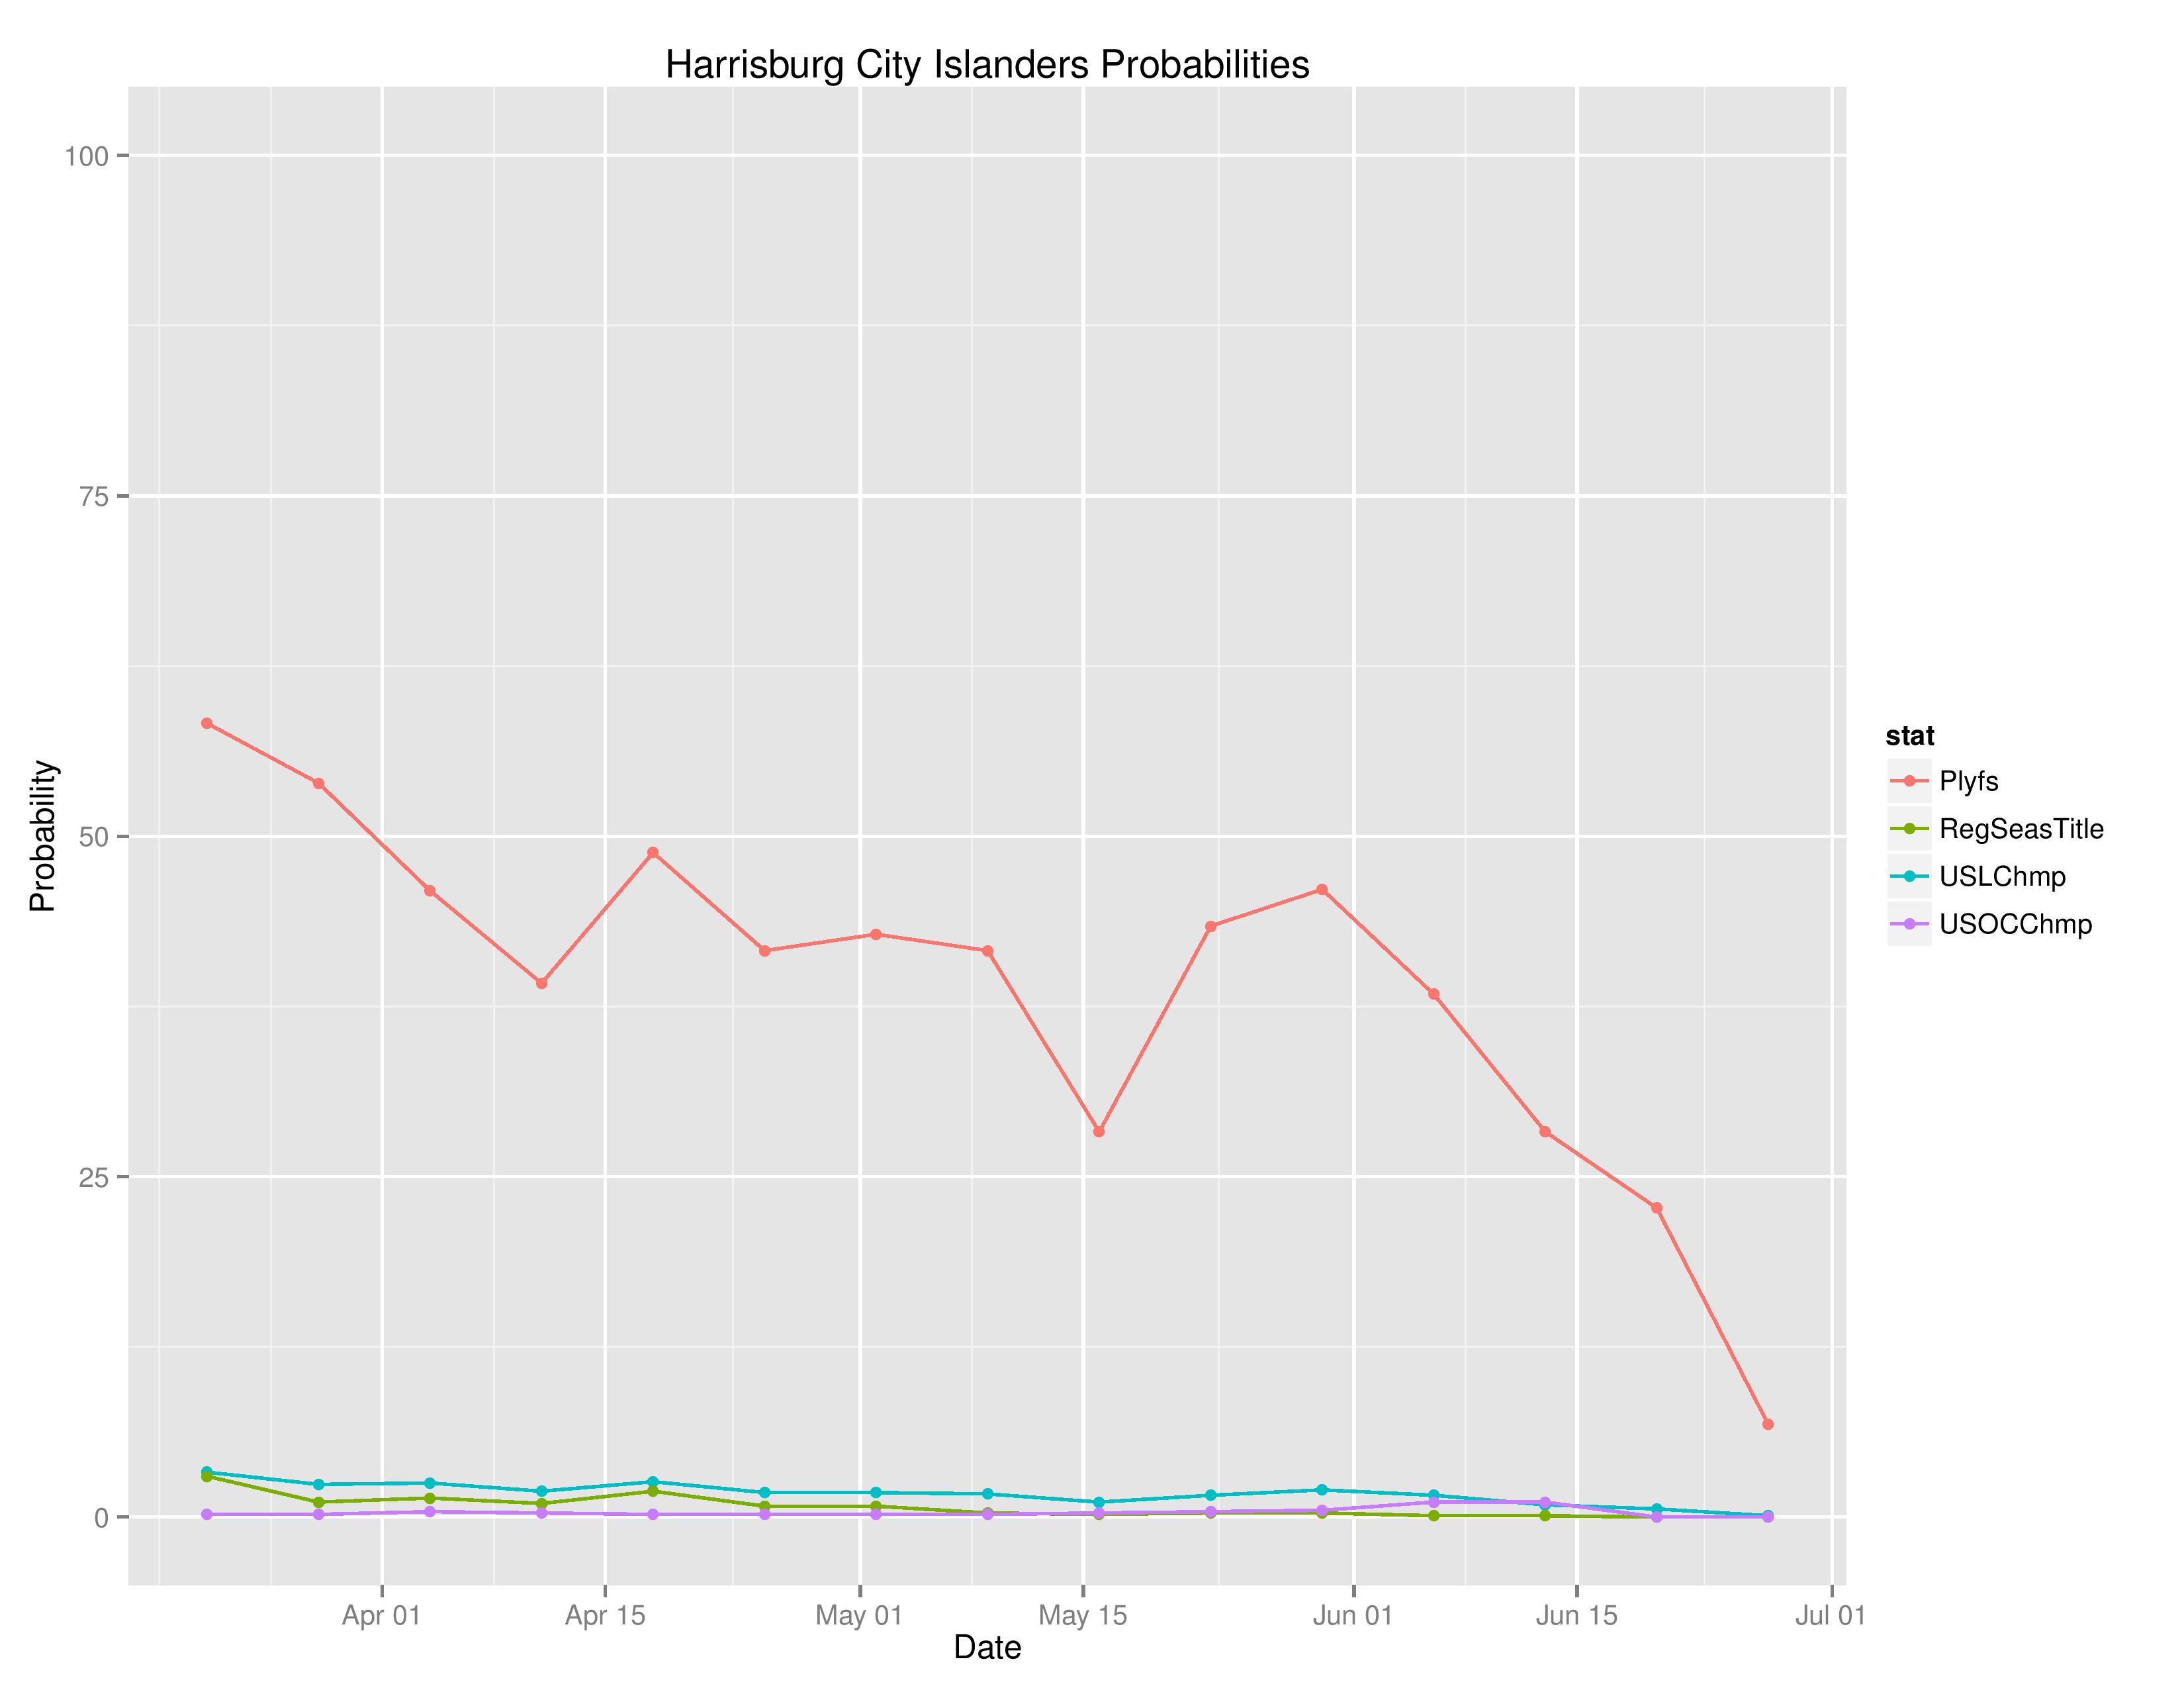
Above shows the probabilities of various outcomes for Harrisburg over the course of the season.
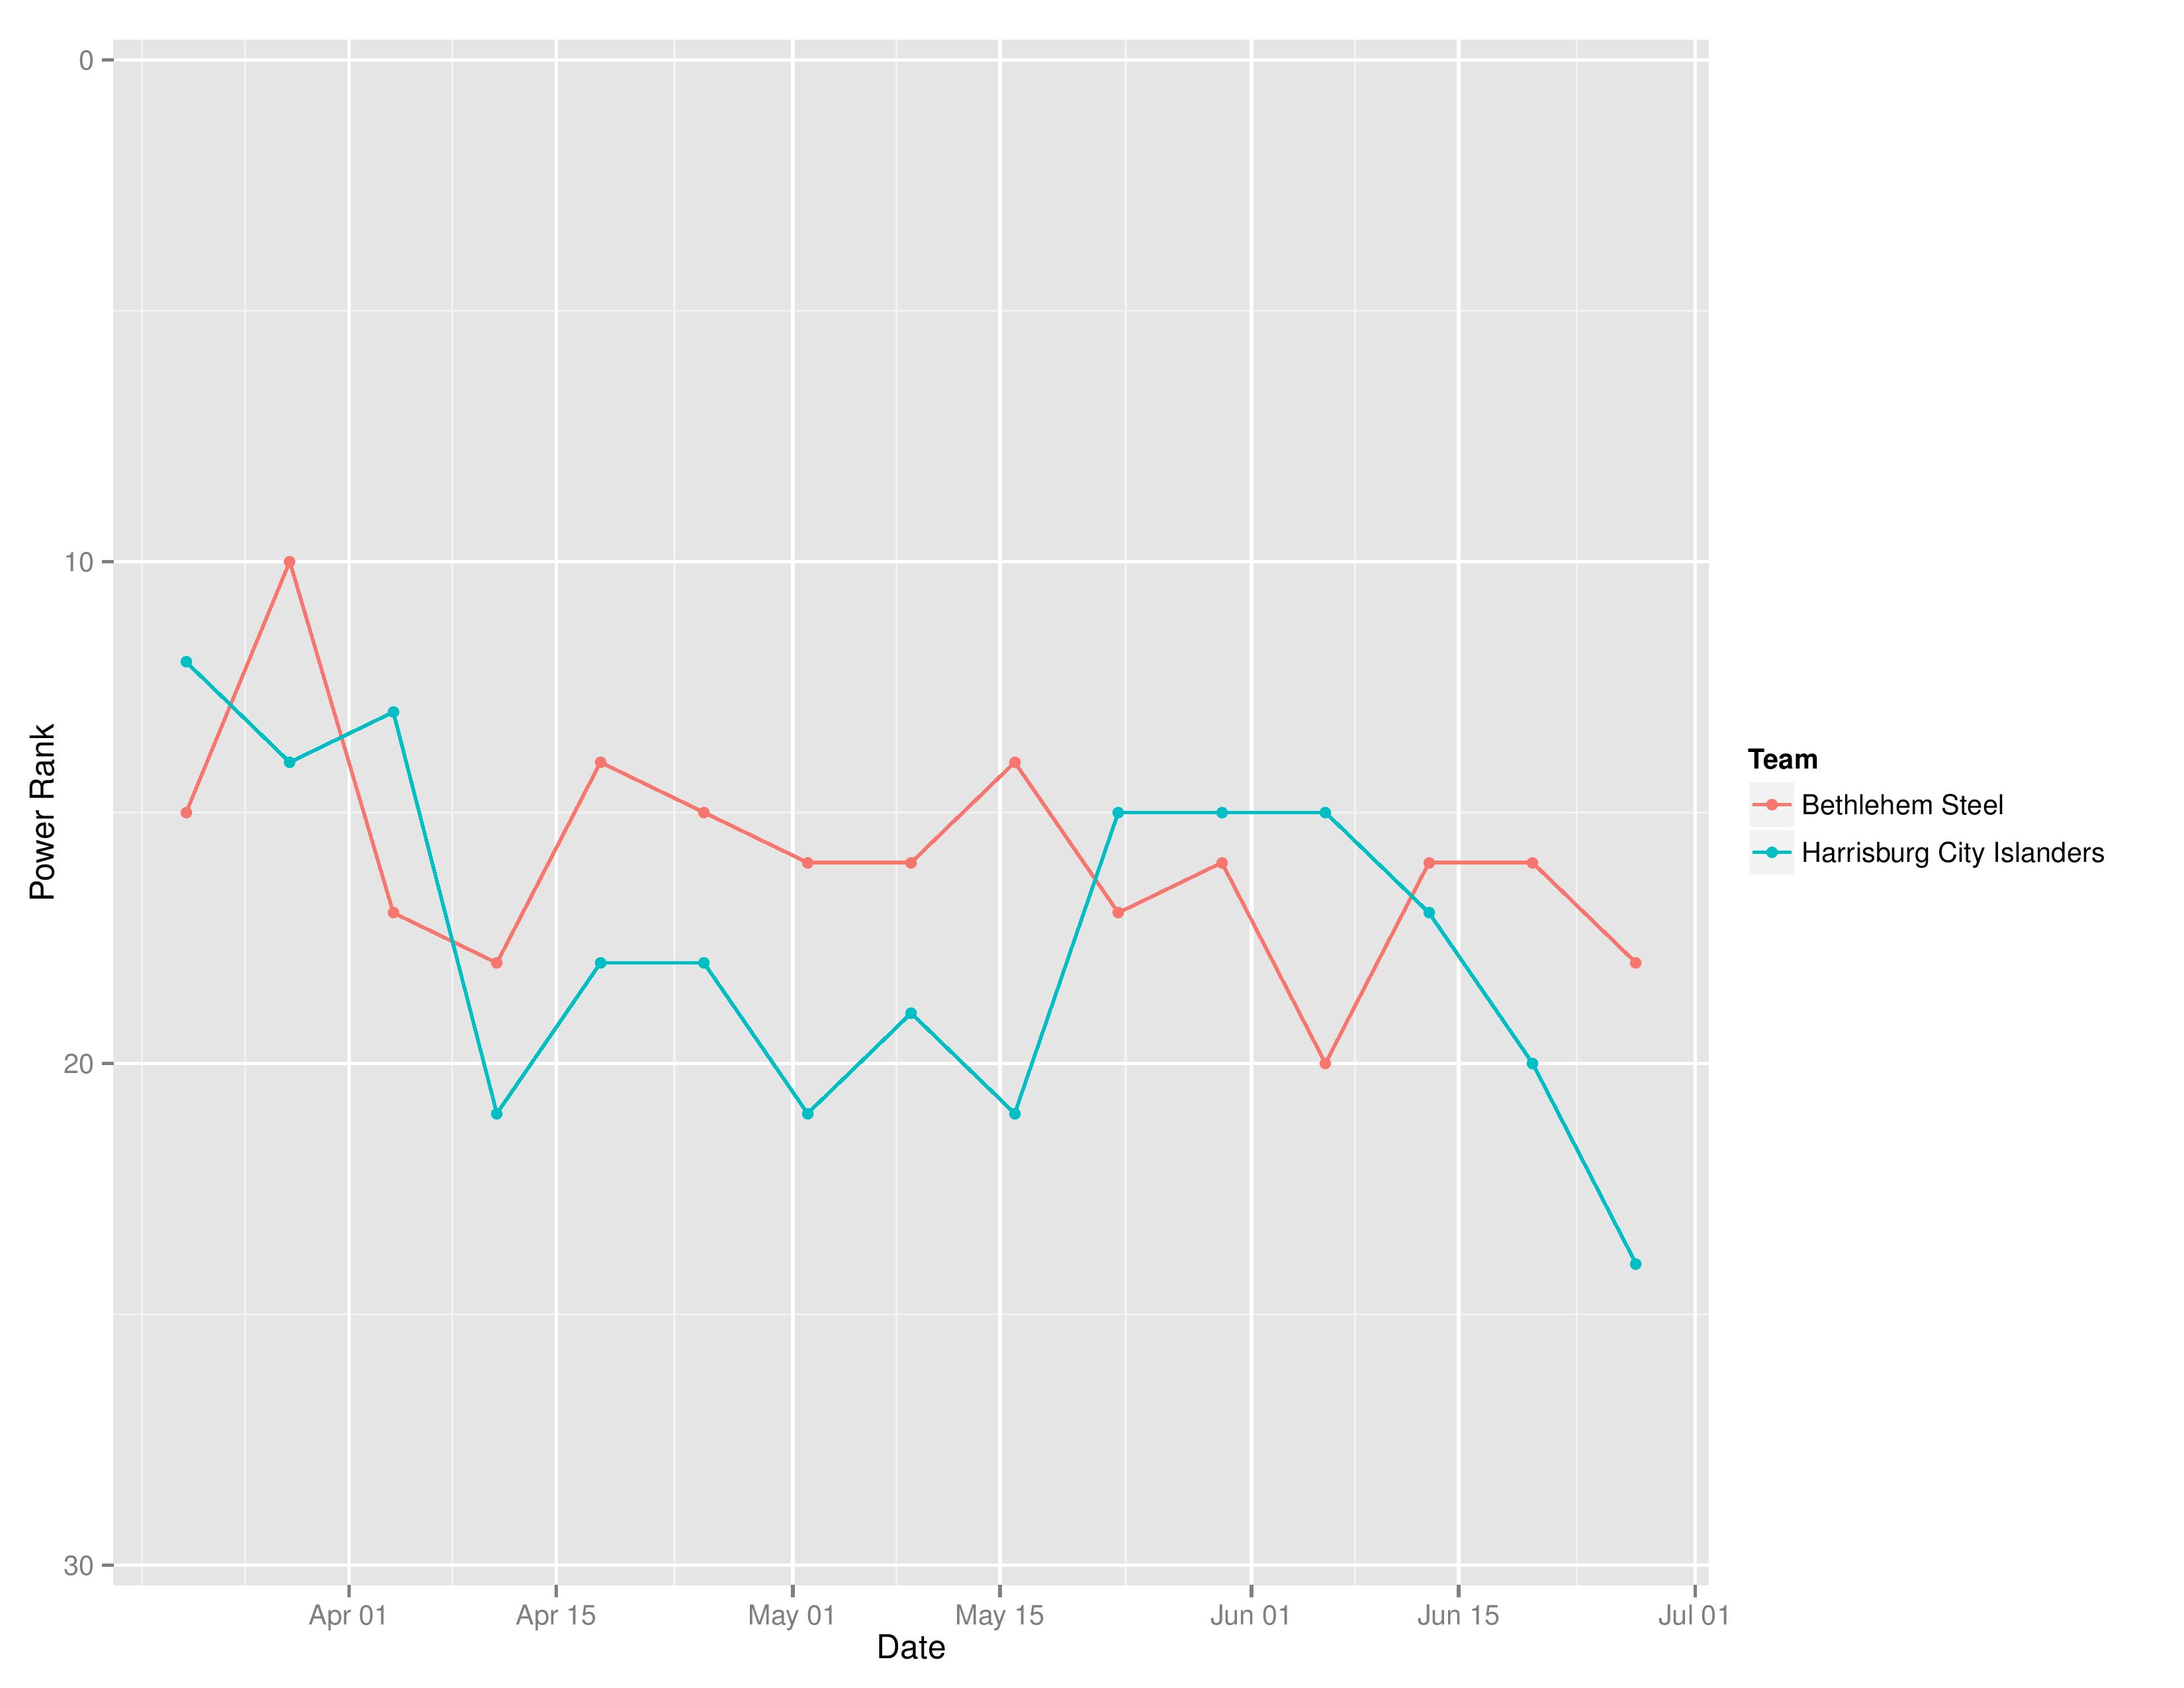
Above shows the evolution of SEBA’s power rankings for Bethlehem Steel FC and the Harrisburg City Islanders.
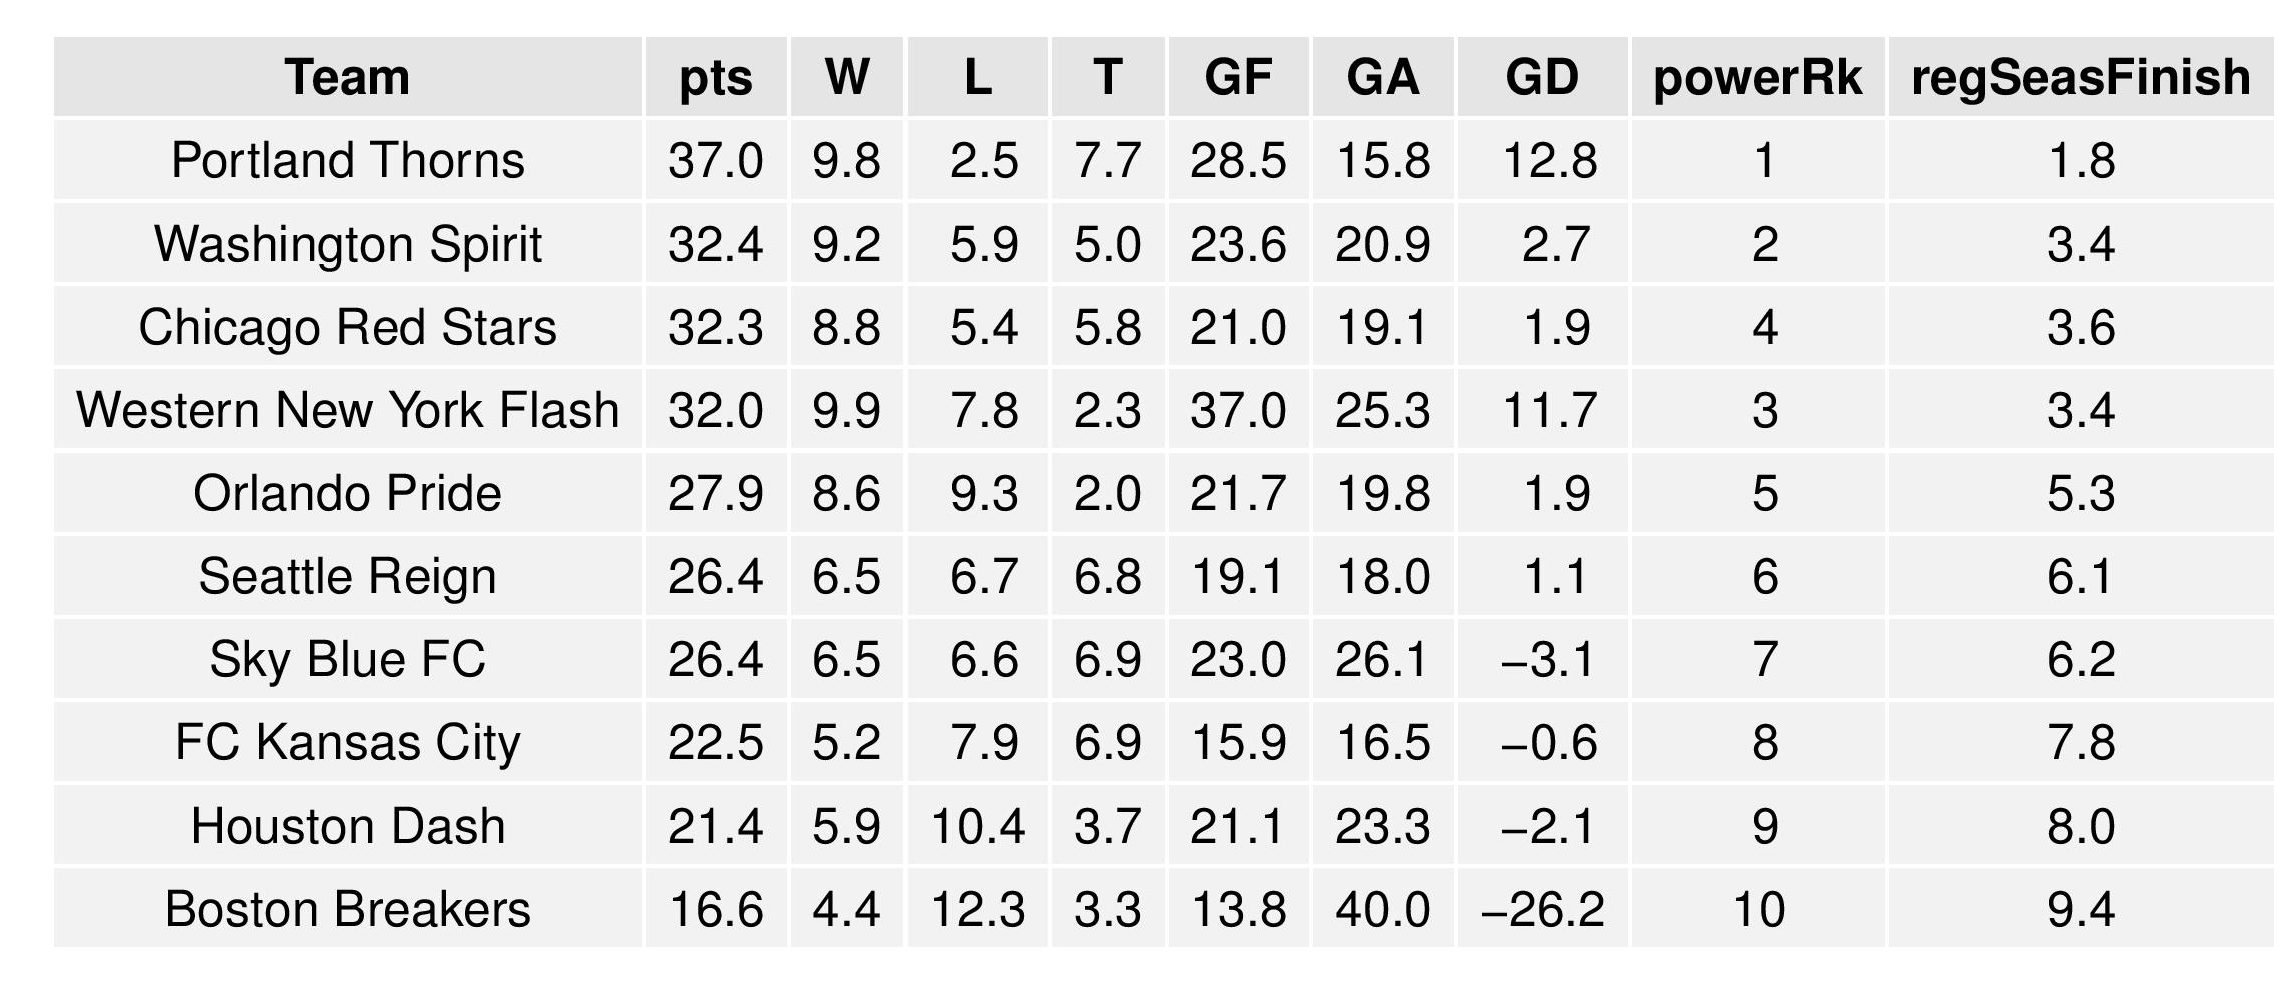
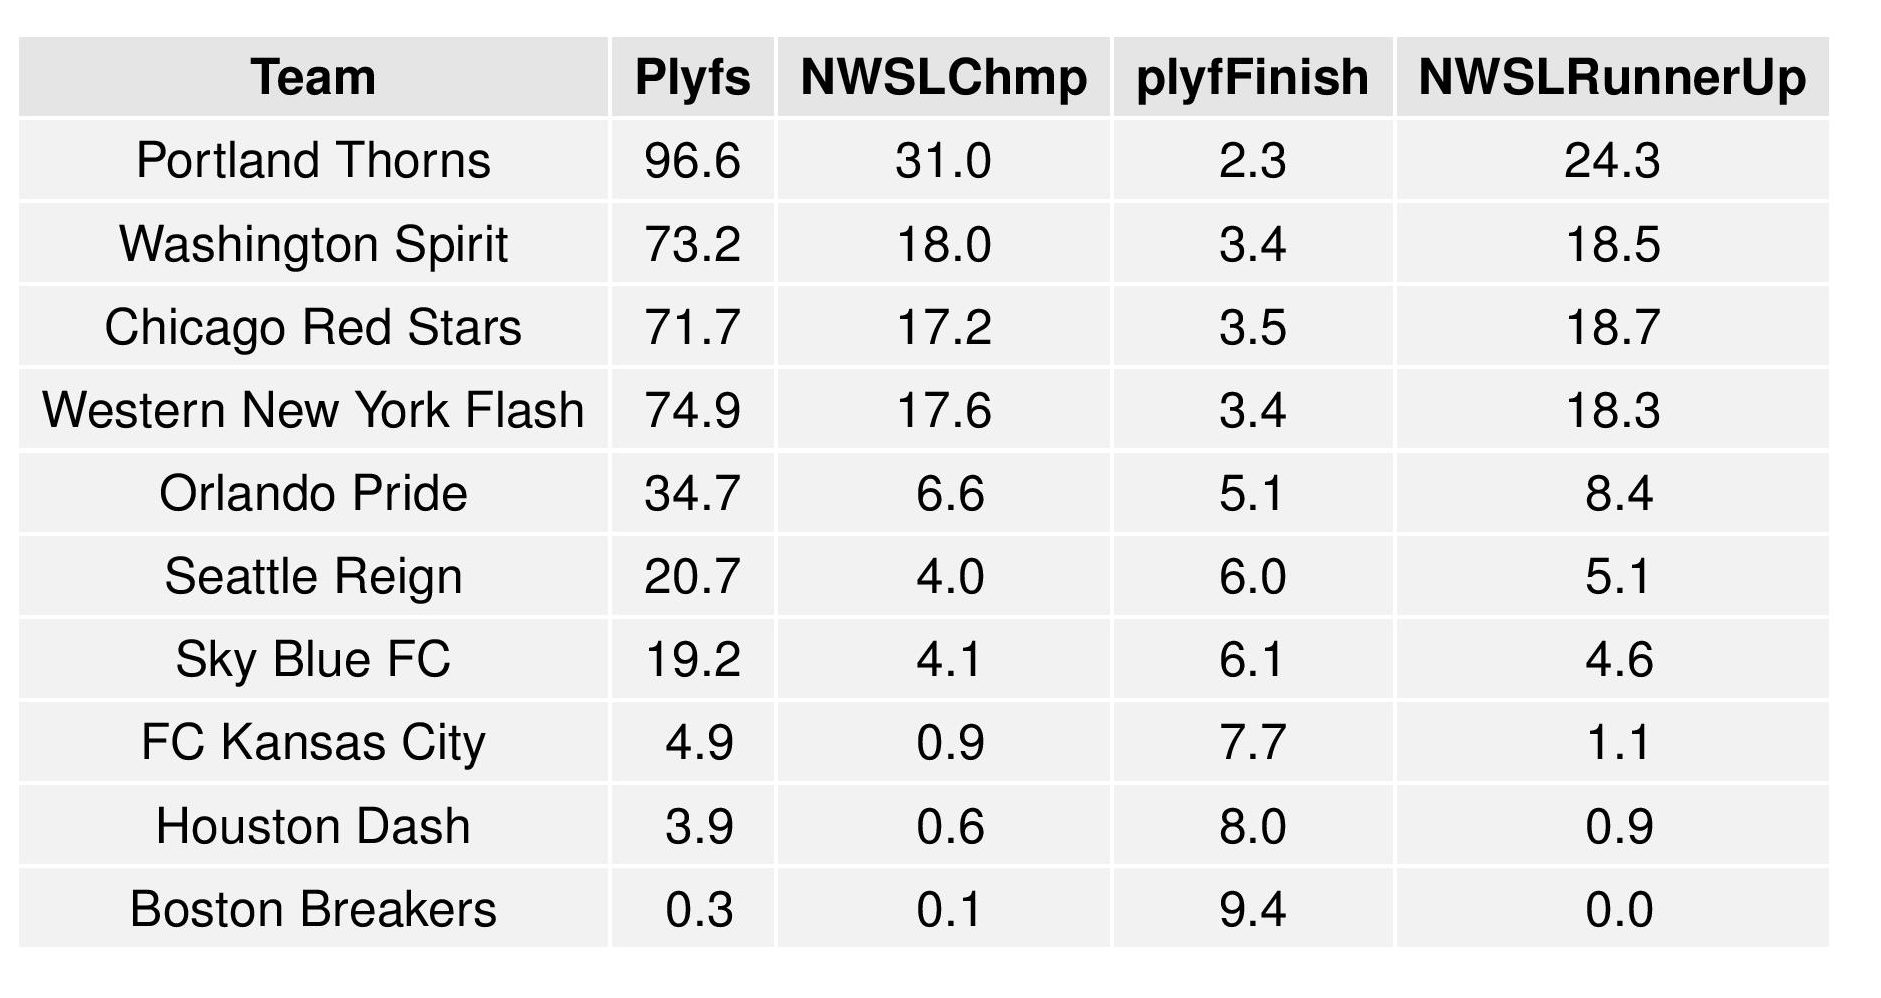
NWSL Projections
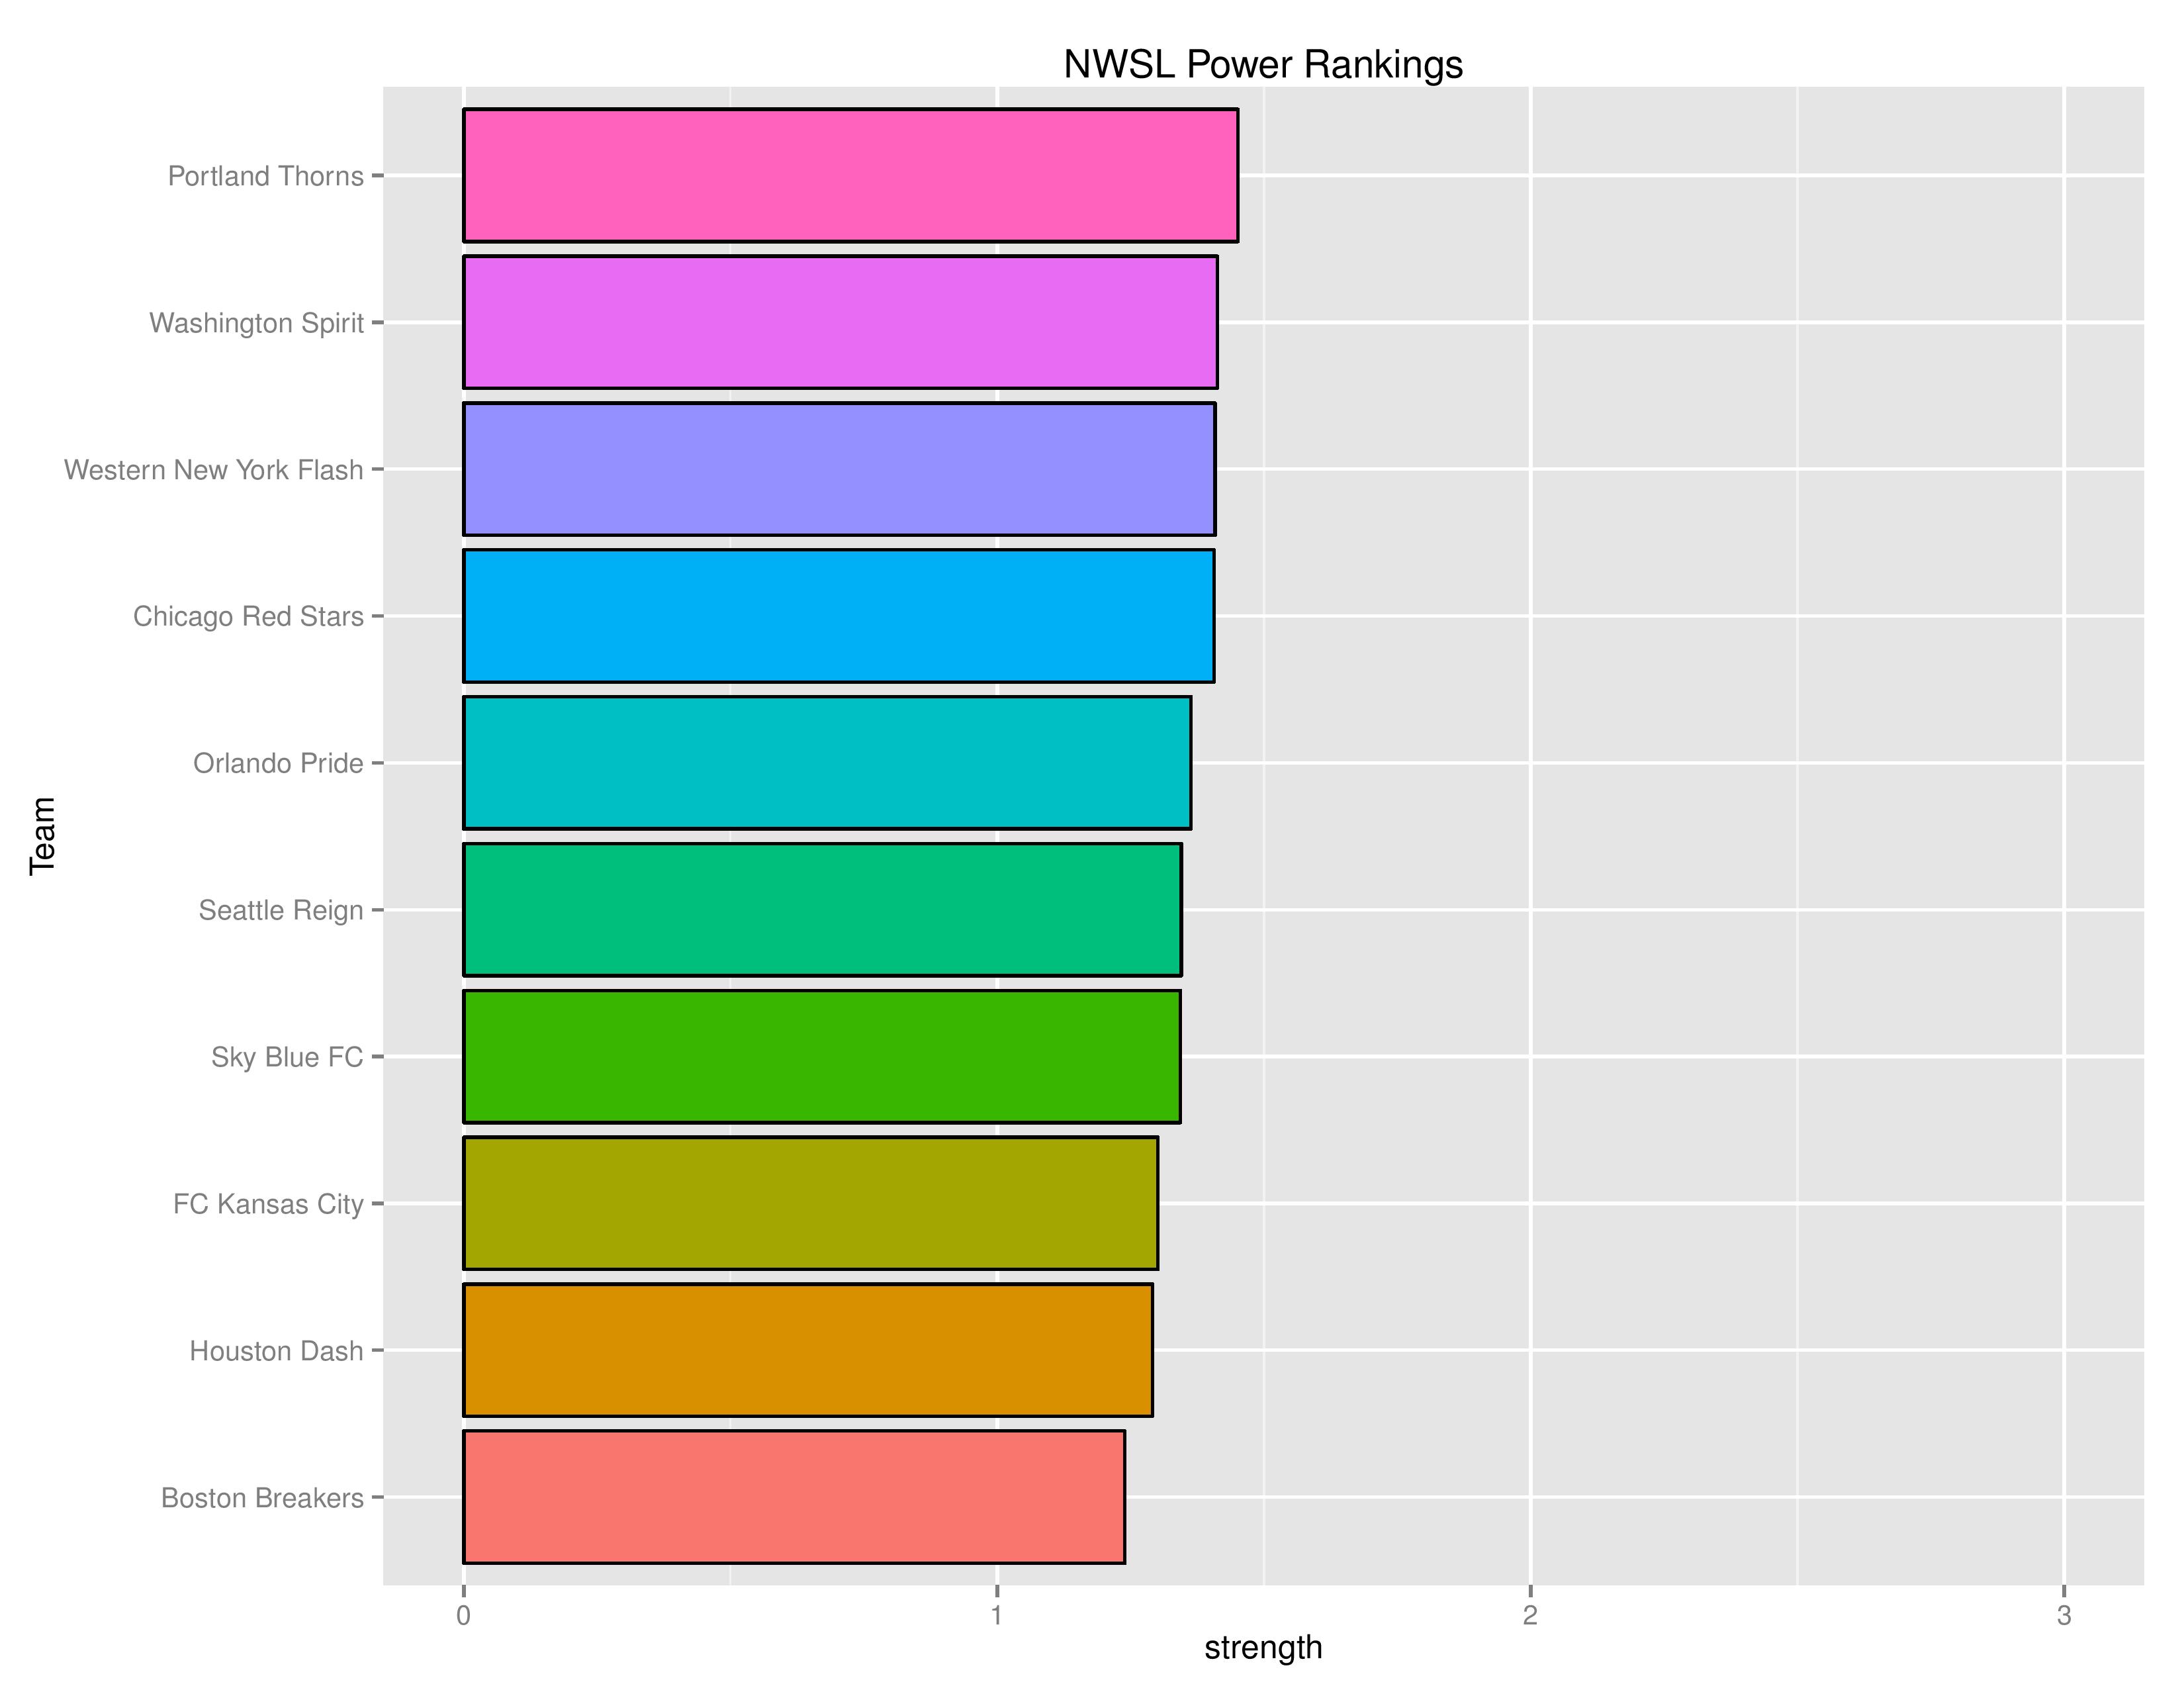
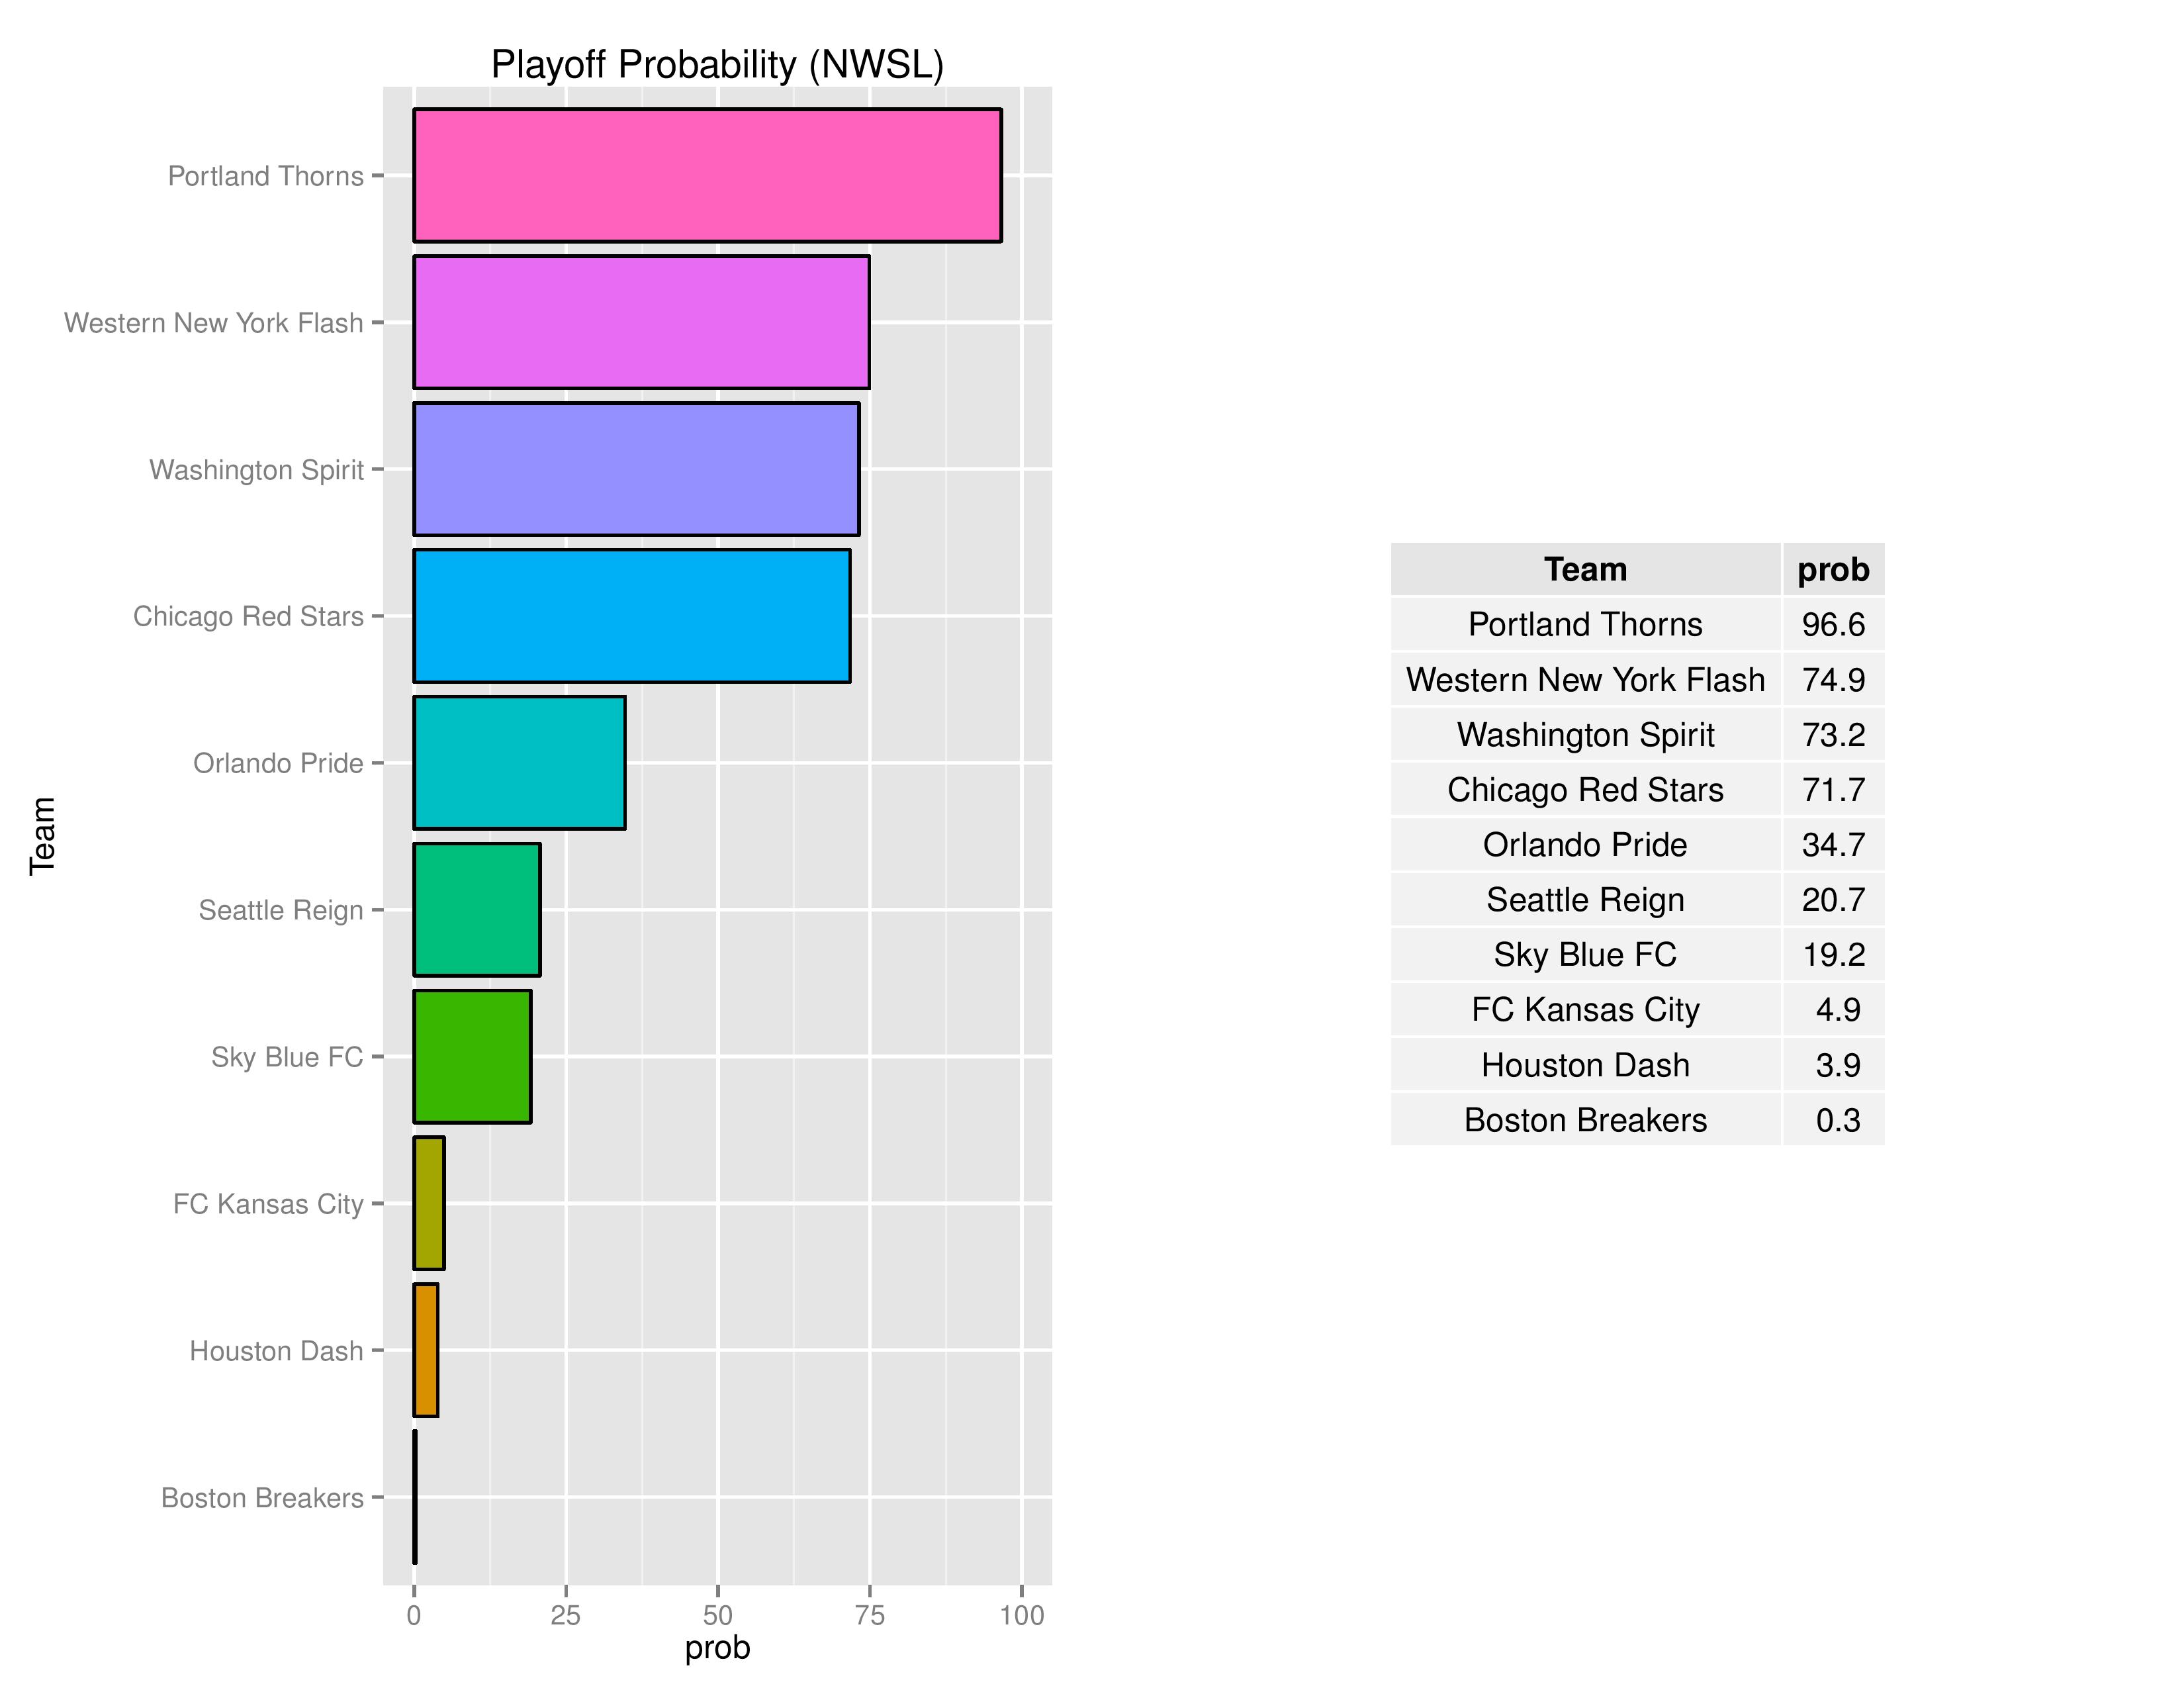
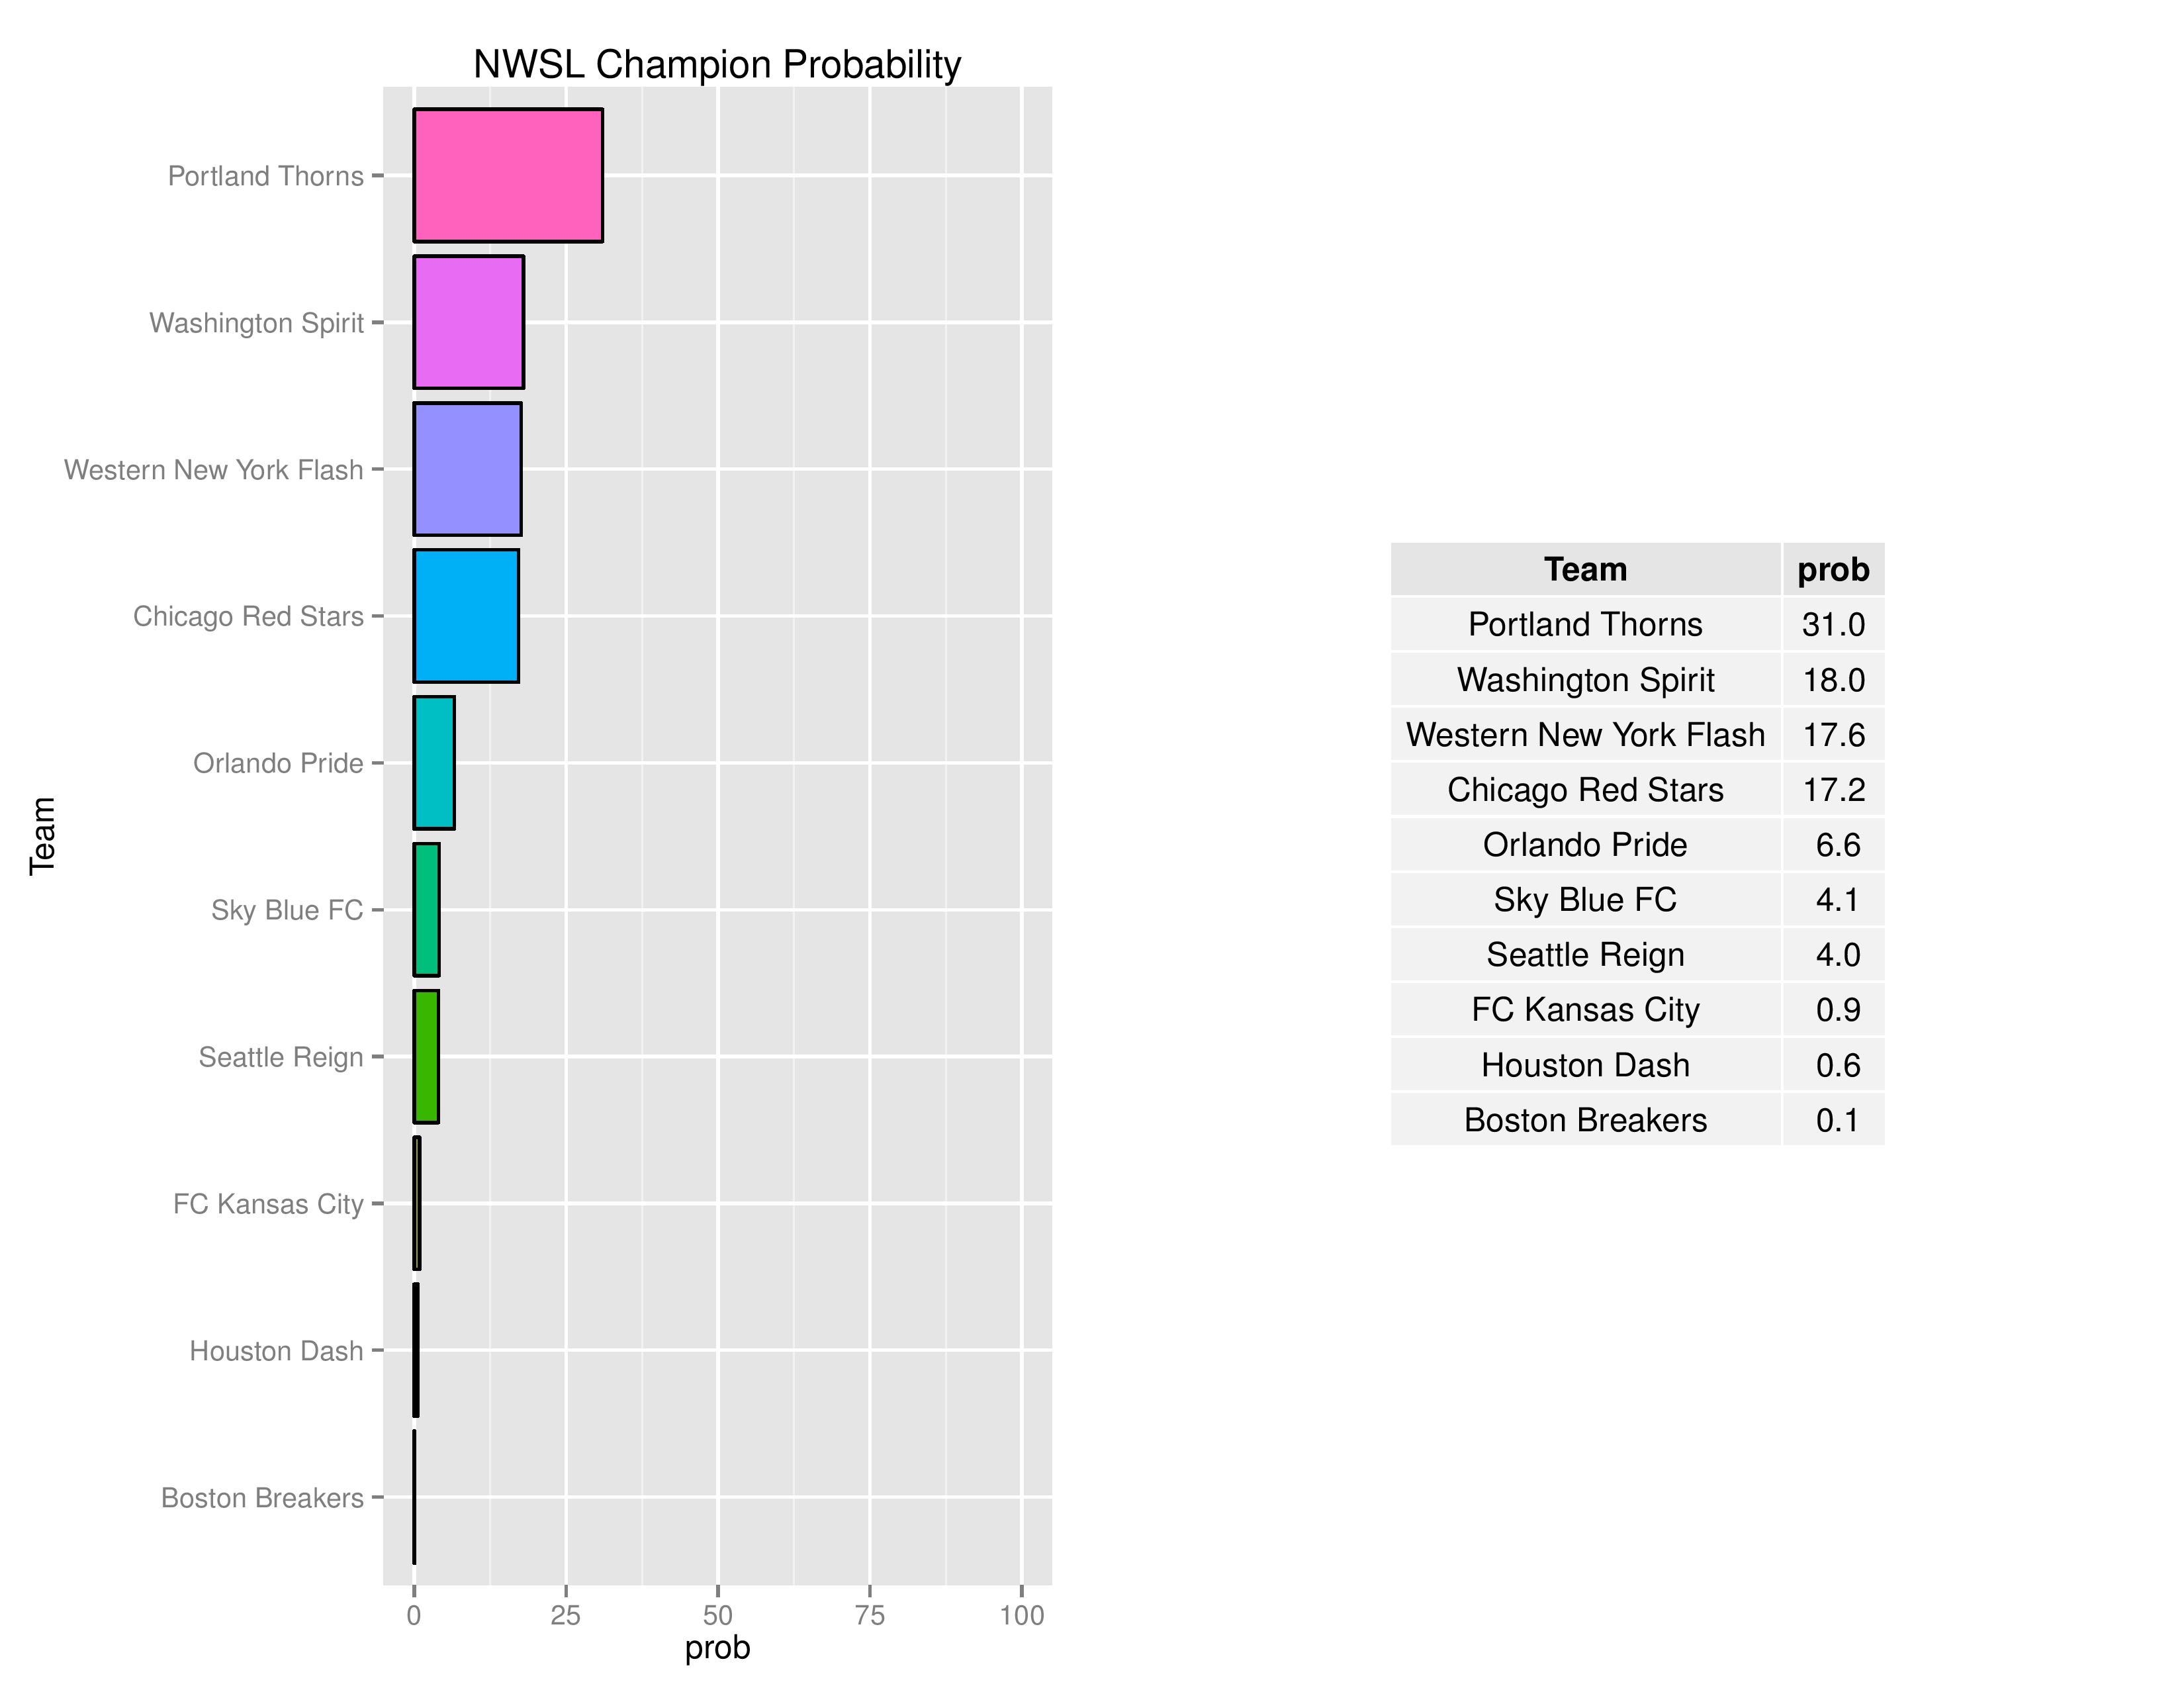
The following tables are the average simulation results produced by SEBA.


Why are the Union ahead of Toronto in the power ranking, but Toronto has better chances for MLS Cup, conference title, etc going forward? Is it because of remaining “strength of schedule” or is it some other factor?
.
Also, on the game predictions, are the “projected points” proportional? For example, against Houston on Saturday, the system predicts the Union will gain 1.07 points. Does that mean it predicts Houston will gain 1.93? Or is there no real relationship that way?
.
Because… if that relationship exists, it’s interesting because the highest the Union have any of their home games is 1.82 (which they have 3 times). So it would be interesting to know why Houston – a team that’s clearly worse than the Union – would have such a high “expected points” number for Saturday. (And that relationship seems true for a lot of other Union road games, too; for example, on July 23rd the Union are projected to get 0.99 points in Montreal, giving the Impact a whopping 2.01 points.)
.
Thanks for the interesting statistical analysis, Chris.
I don’t believe the points would add up to 3pts. As both teams would get 1pt for a tie.
Possible. That’s why I asked. I’m never afraid to admit I’m a dumbass who doesn’t know something. 🙂
These are great questions.
–
As to Toronto, yes it is because they have an easier upcoming schedule. Philadelphia’s remaining games are 47% at home while Toronto’s remaining games are 63% at home. Additionally, the Union still have to play NYRB 3 times whereas Toronto will be playing Chicago 3 times.
–
Additionally, while ‘remaining strength of schedule’ is the cause for Toronto’s projected higher standings (since the Union are currently higher than them in points/points-per-game), a mismatch of Power Rankings to Expectations could also be due to past strength of schedule (as MLS does not have a balanced schedule) or blind luck with previous results (aka if a team loses every match except an away win against Colorado, SEBA would likely attribute that win as luck)
–
As Mcb pointed out, this isn’t a zero-sum-game as W/L matches distribute 3 points but Draws only distribute 2 points. Houston’s Expected points for their match with Philadelphia is 1.64 (3*0.447 for Win + 1*0.297 for Tie)
“(3*0.447 for Win + 1*0.297 for Tie)”
.
Aha! That makes sense! Math for the win!
One thing that seems strange is that if a Canadian team wins the MLS Cup or the Supporters Shield, they would not qualify for Champions League unless they also won the Canadian championship. I guess that’s why Toronto and Vancouver add up to exactly 100% while Montreal is at 0%. Tomorrow night we’ll know one of the CCL entries.
Yes, that is how the calculations are functioning. I think that is strange too that the rules are such. If I were in charge, the Canadian Championship would only determine Canada’s CCL entry if no Canadian teams won the Shield/MLS-Cup.
My thought would be that if a Canadian team wins one of the other entries but not the Canadian Championship, then there should be 2 Canadian teams and 3 US teams.
.
But if this is the way it is…(If Toronto wins the East, would their slot go to the second place team in the east or to the highest placed team not already qualified. My guess is the latter.)
I like my data qualitative and phenomenologic.
.
Cool charts appreciate the effort though.