Welcome to the Statistical Extrapolation Bayesian Analyzer Projection System, which is, of course, a tortured gathering of words used to form the SEBA Projection System.
The system consists of a model projecting the probabilities of game results and then a barrage of simulations which account for the remaining luck. So the probabilities you see below show, essentially, what the odds are of an outcome if the team continues to play like it has been.
Below are the current season forecasts using data from games through May 29, 2016.
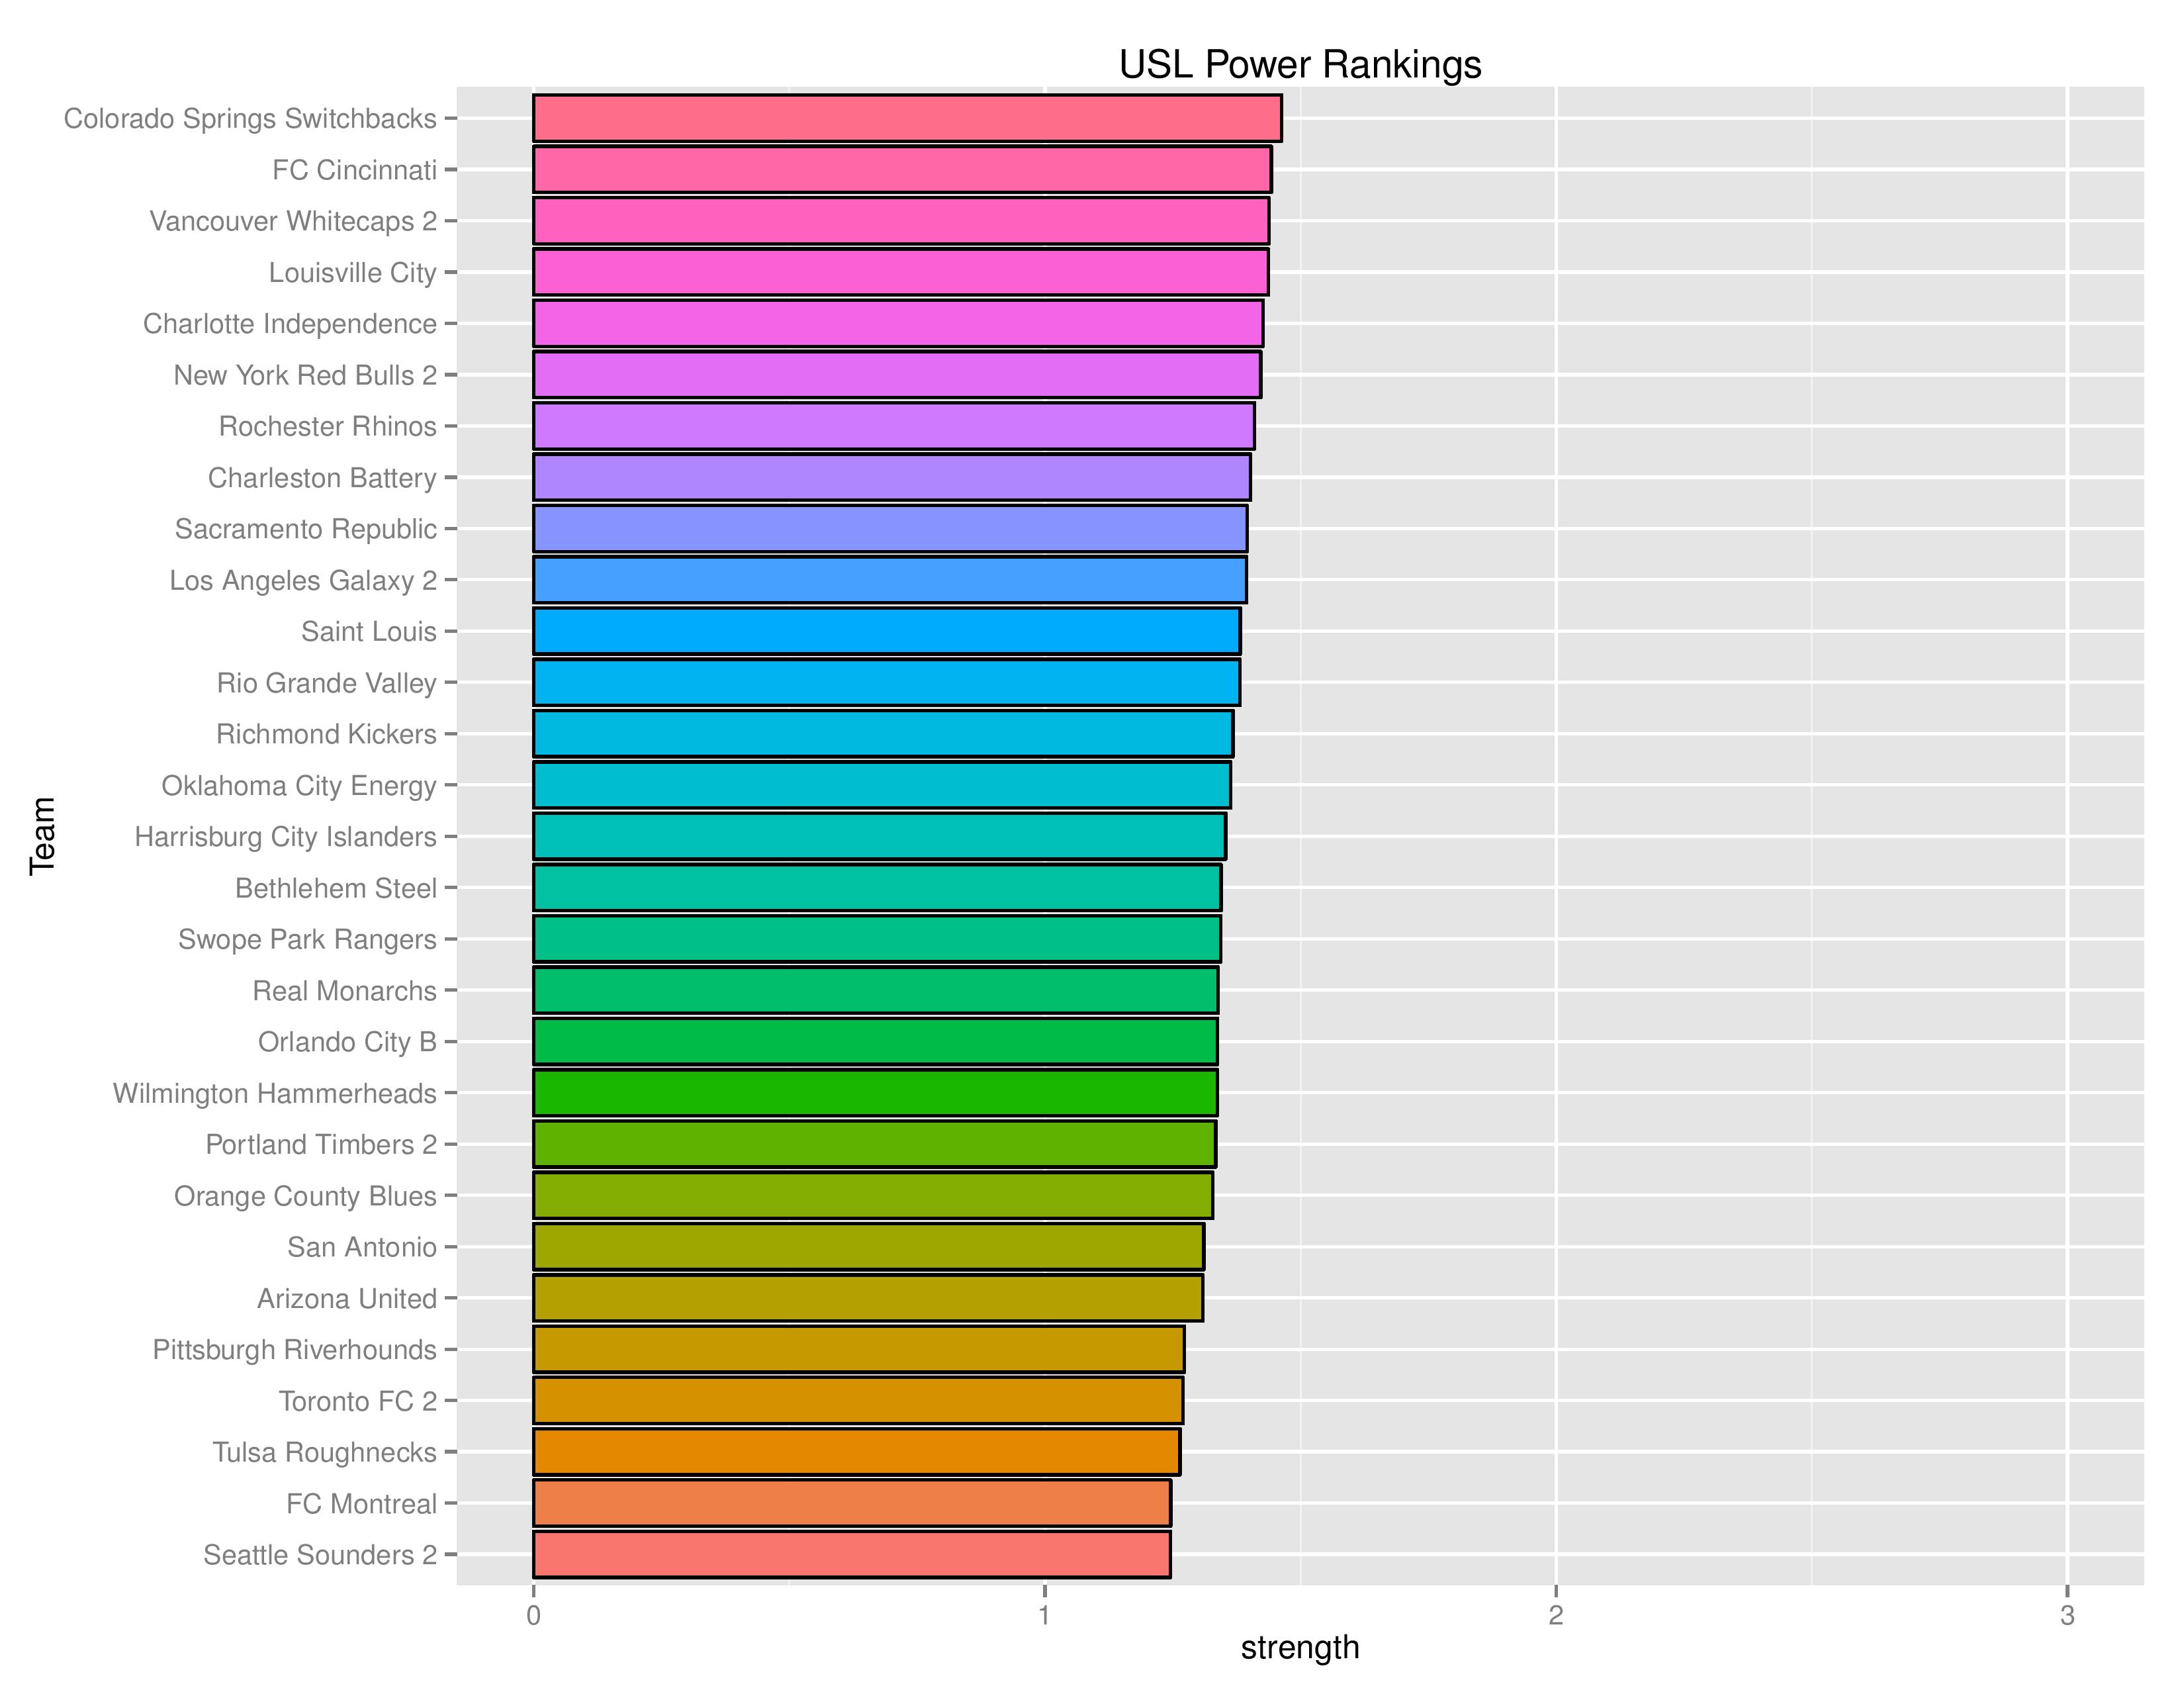
Power Rankings
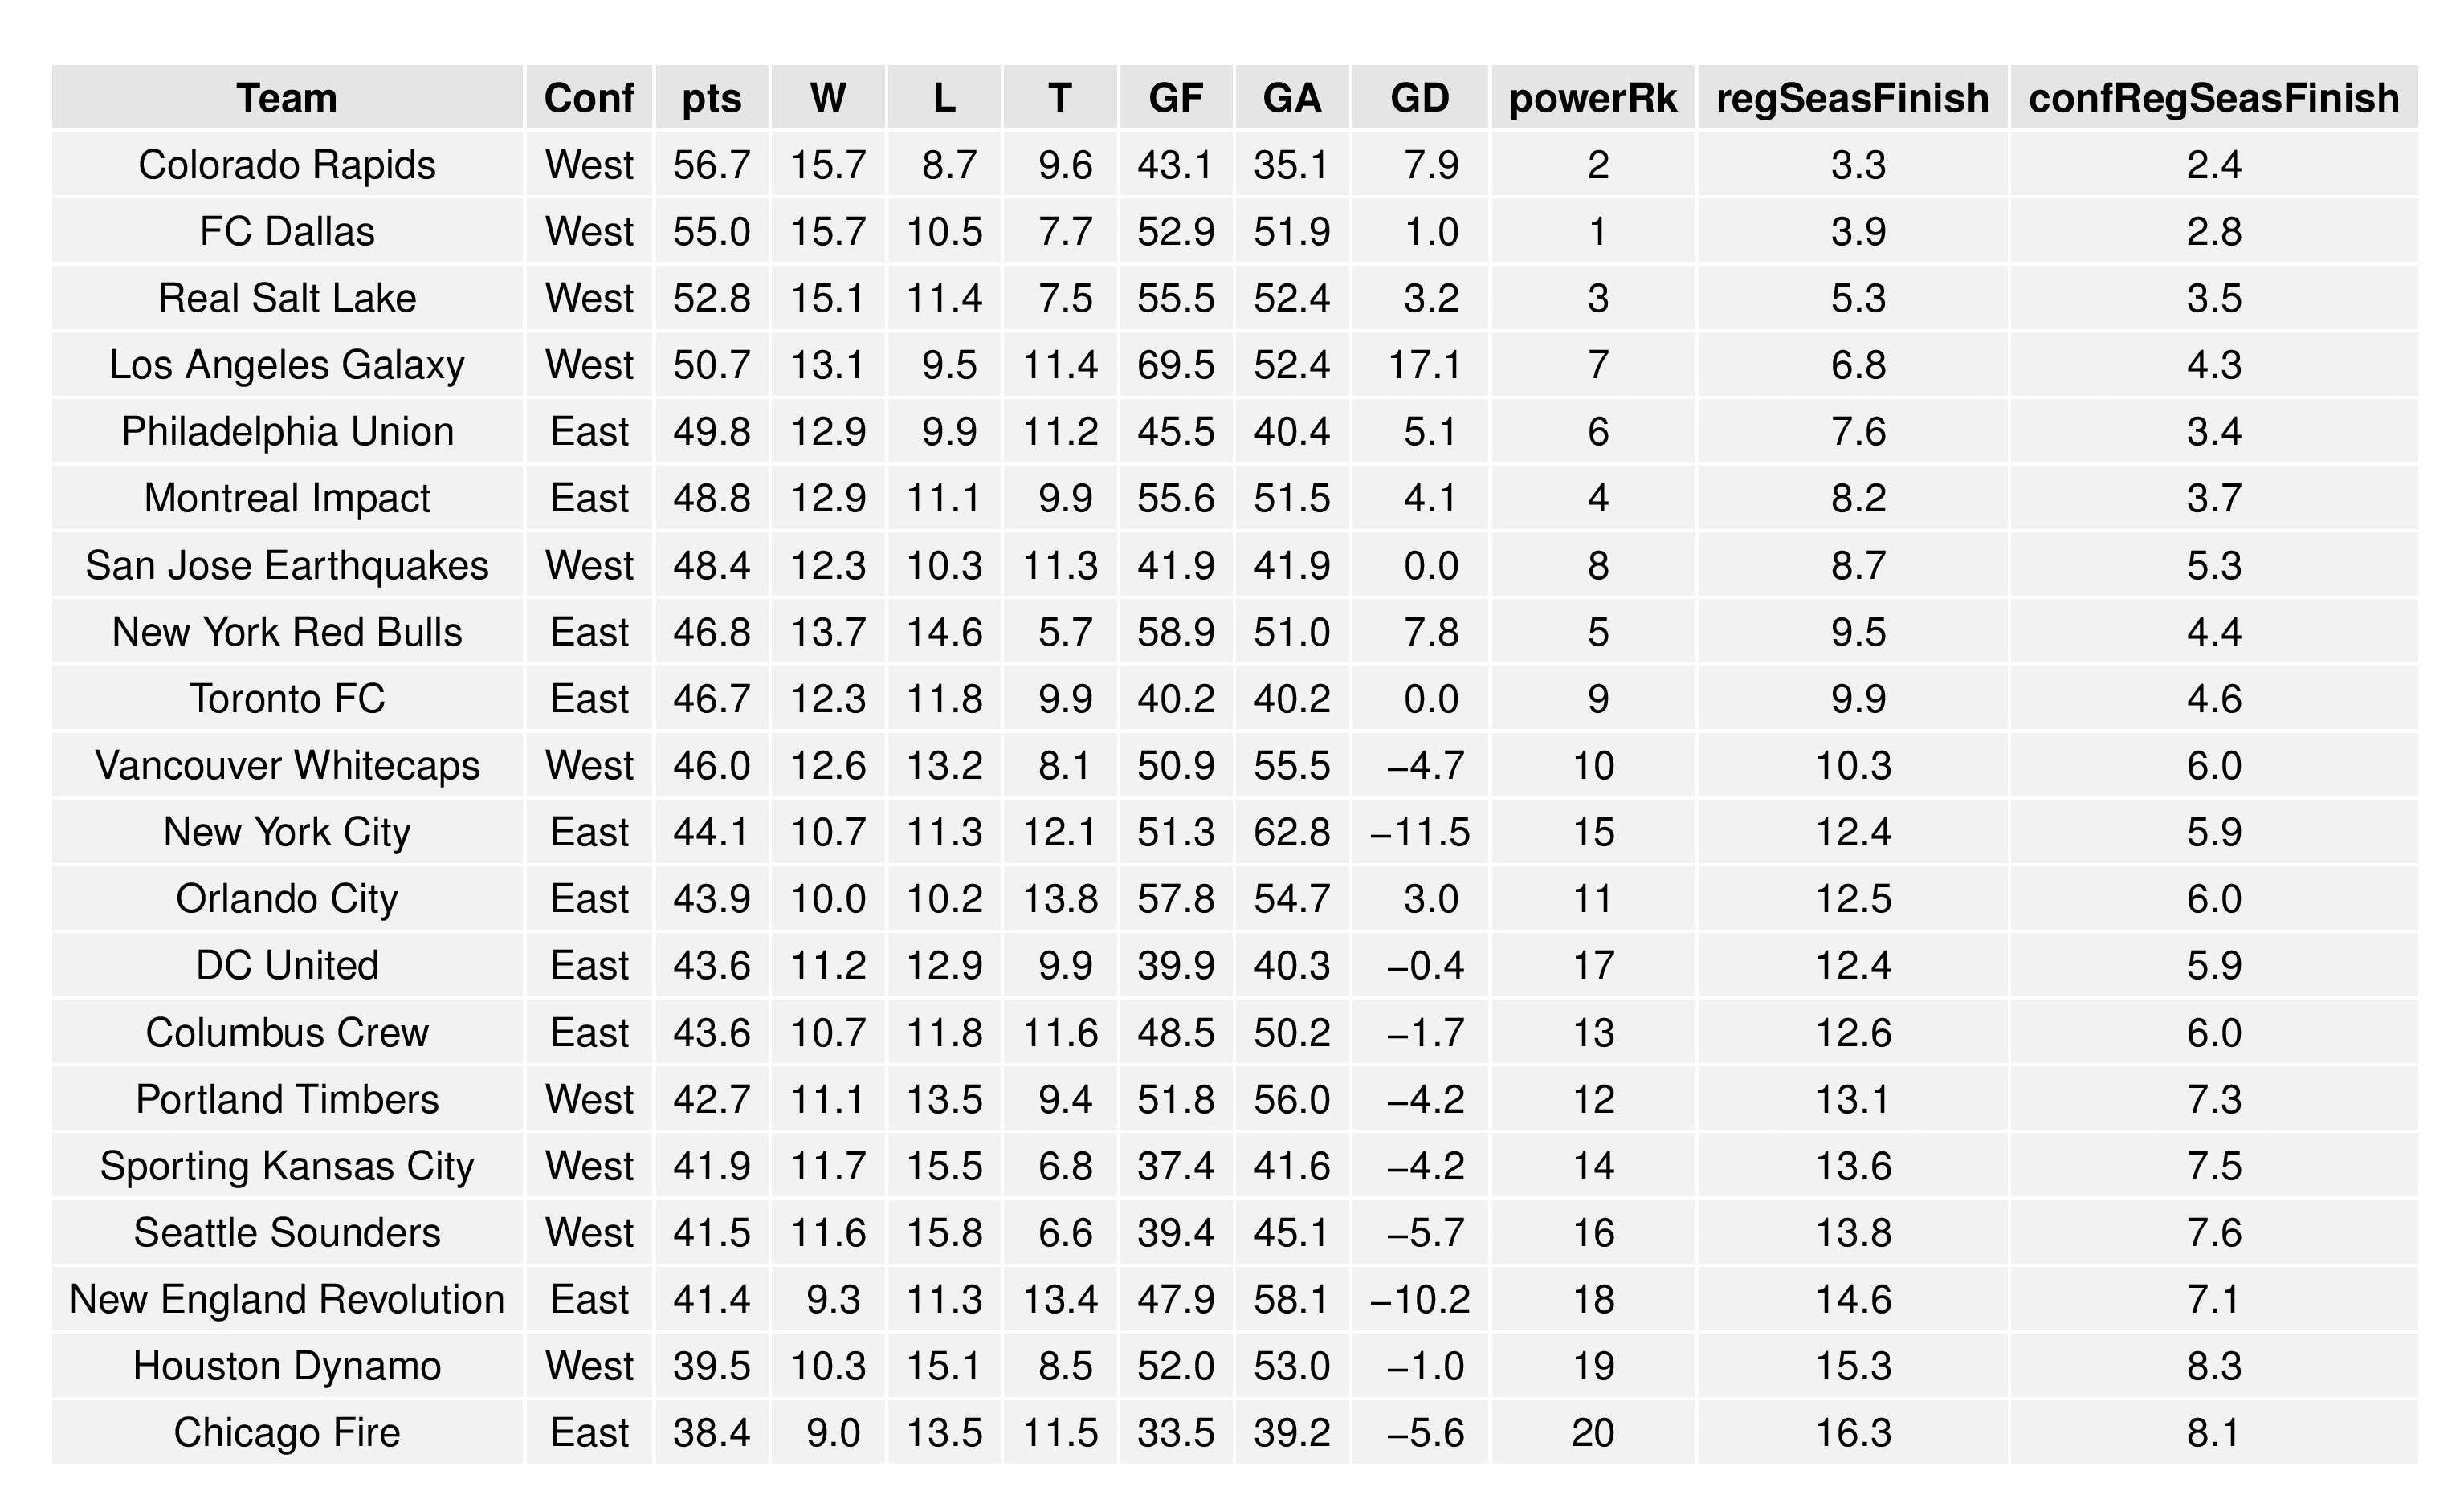
The “Power Rankings” we concoct are the actual “strength” of the team according to competitive expectations. They are computed showing average expected points result if every team in MLS played every team both home and away:
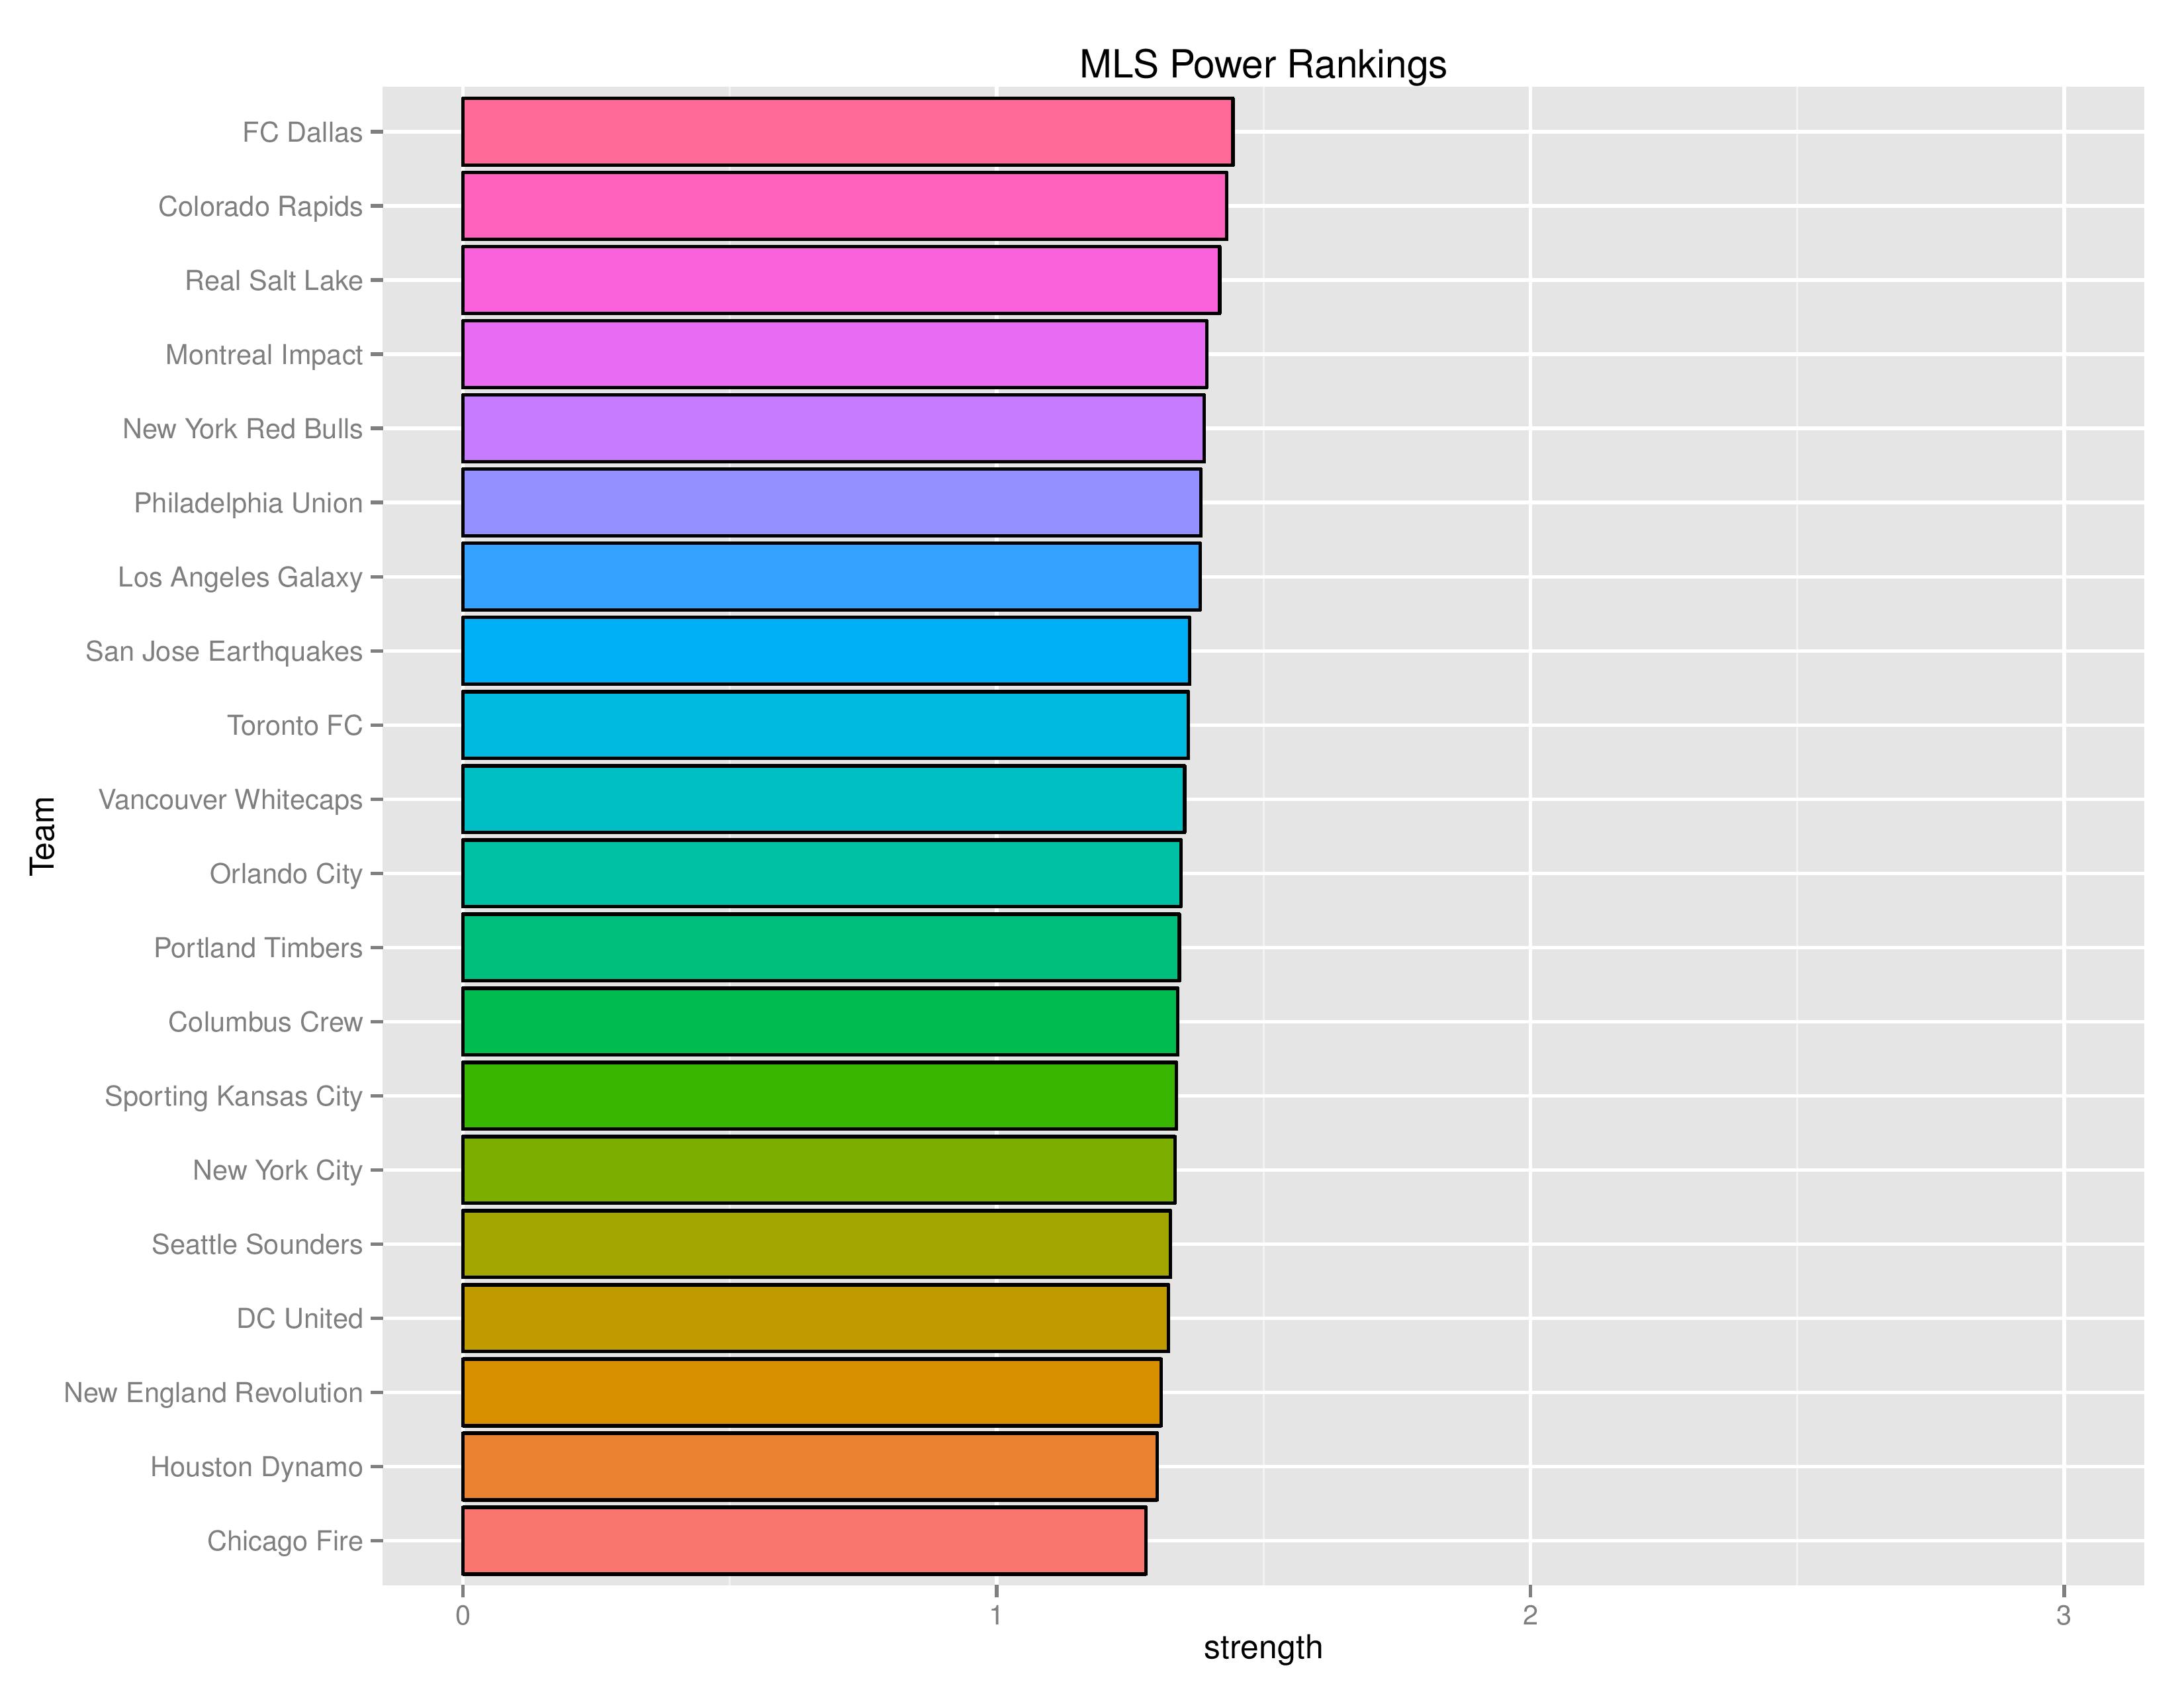
SEBA has the Union moving from No. 5 to No. 6 this week, moving ahead of the Galaxy but behind Montreal and NYRB. This wasn’t so much a demotion for the Union as it was a promotion for Montreal’s home win against L.A. and NYRB’s home crushing of Toronto. ESPN, MLSsoccer.com, and SI have Philadelphia in No. 2, and Soccer America has the Union at No. 3
Playoffs probability and more
The following charts show the probabilities for making the playoffs, winning the Supporters’ Shield, winning the MLS Cup, winning the USOC Cup, and qualification for CONCACAF Champions League.
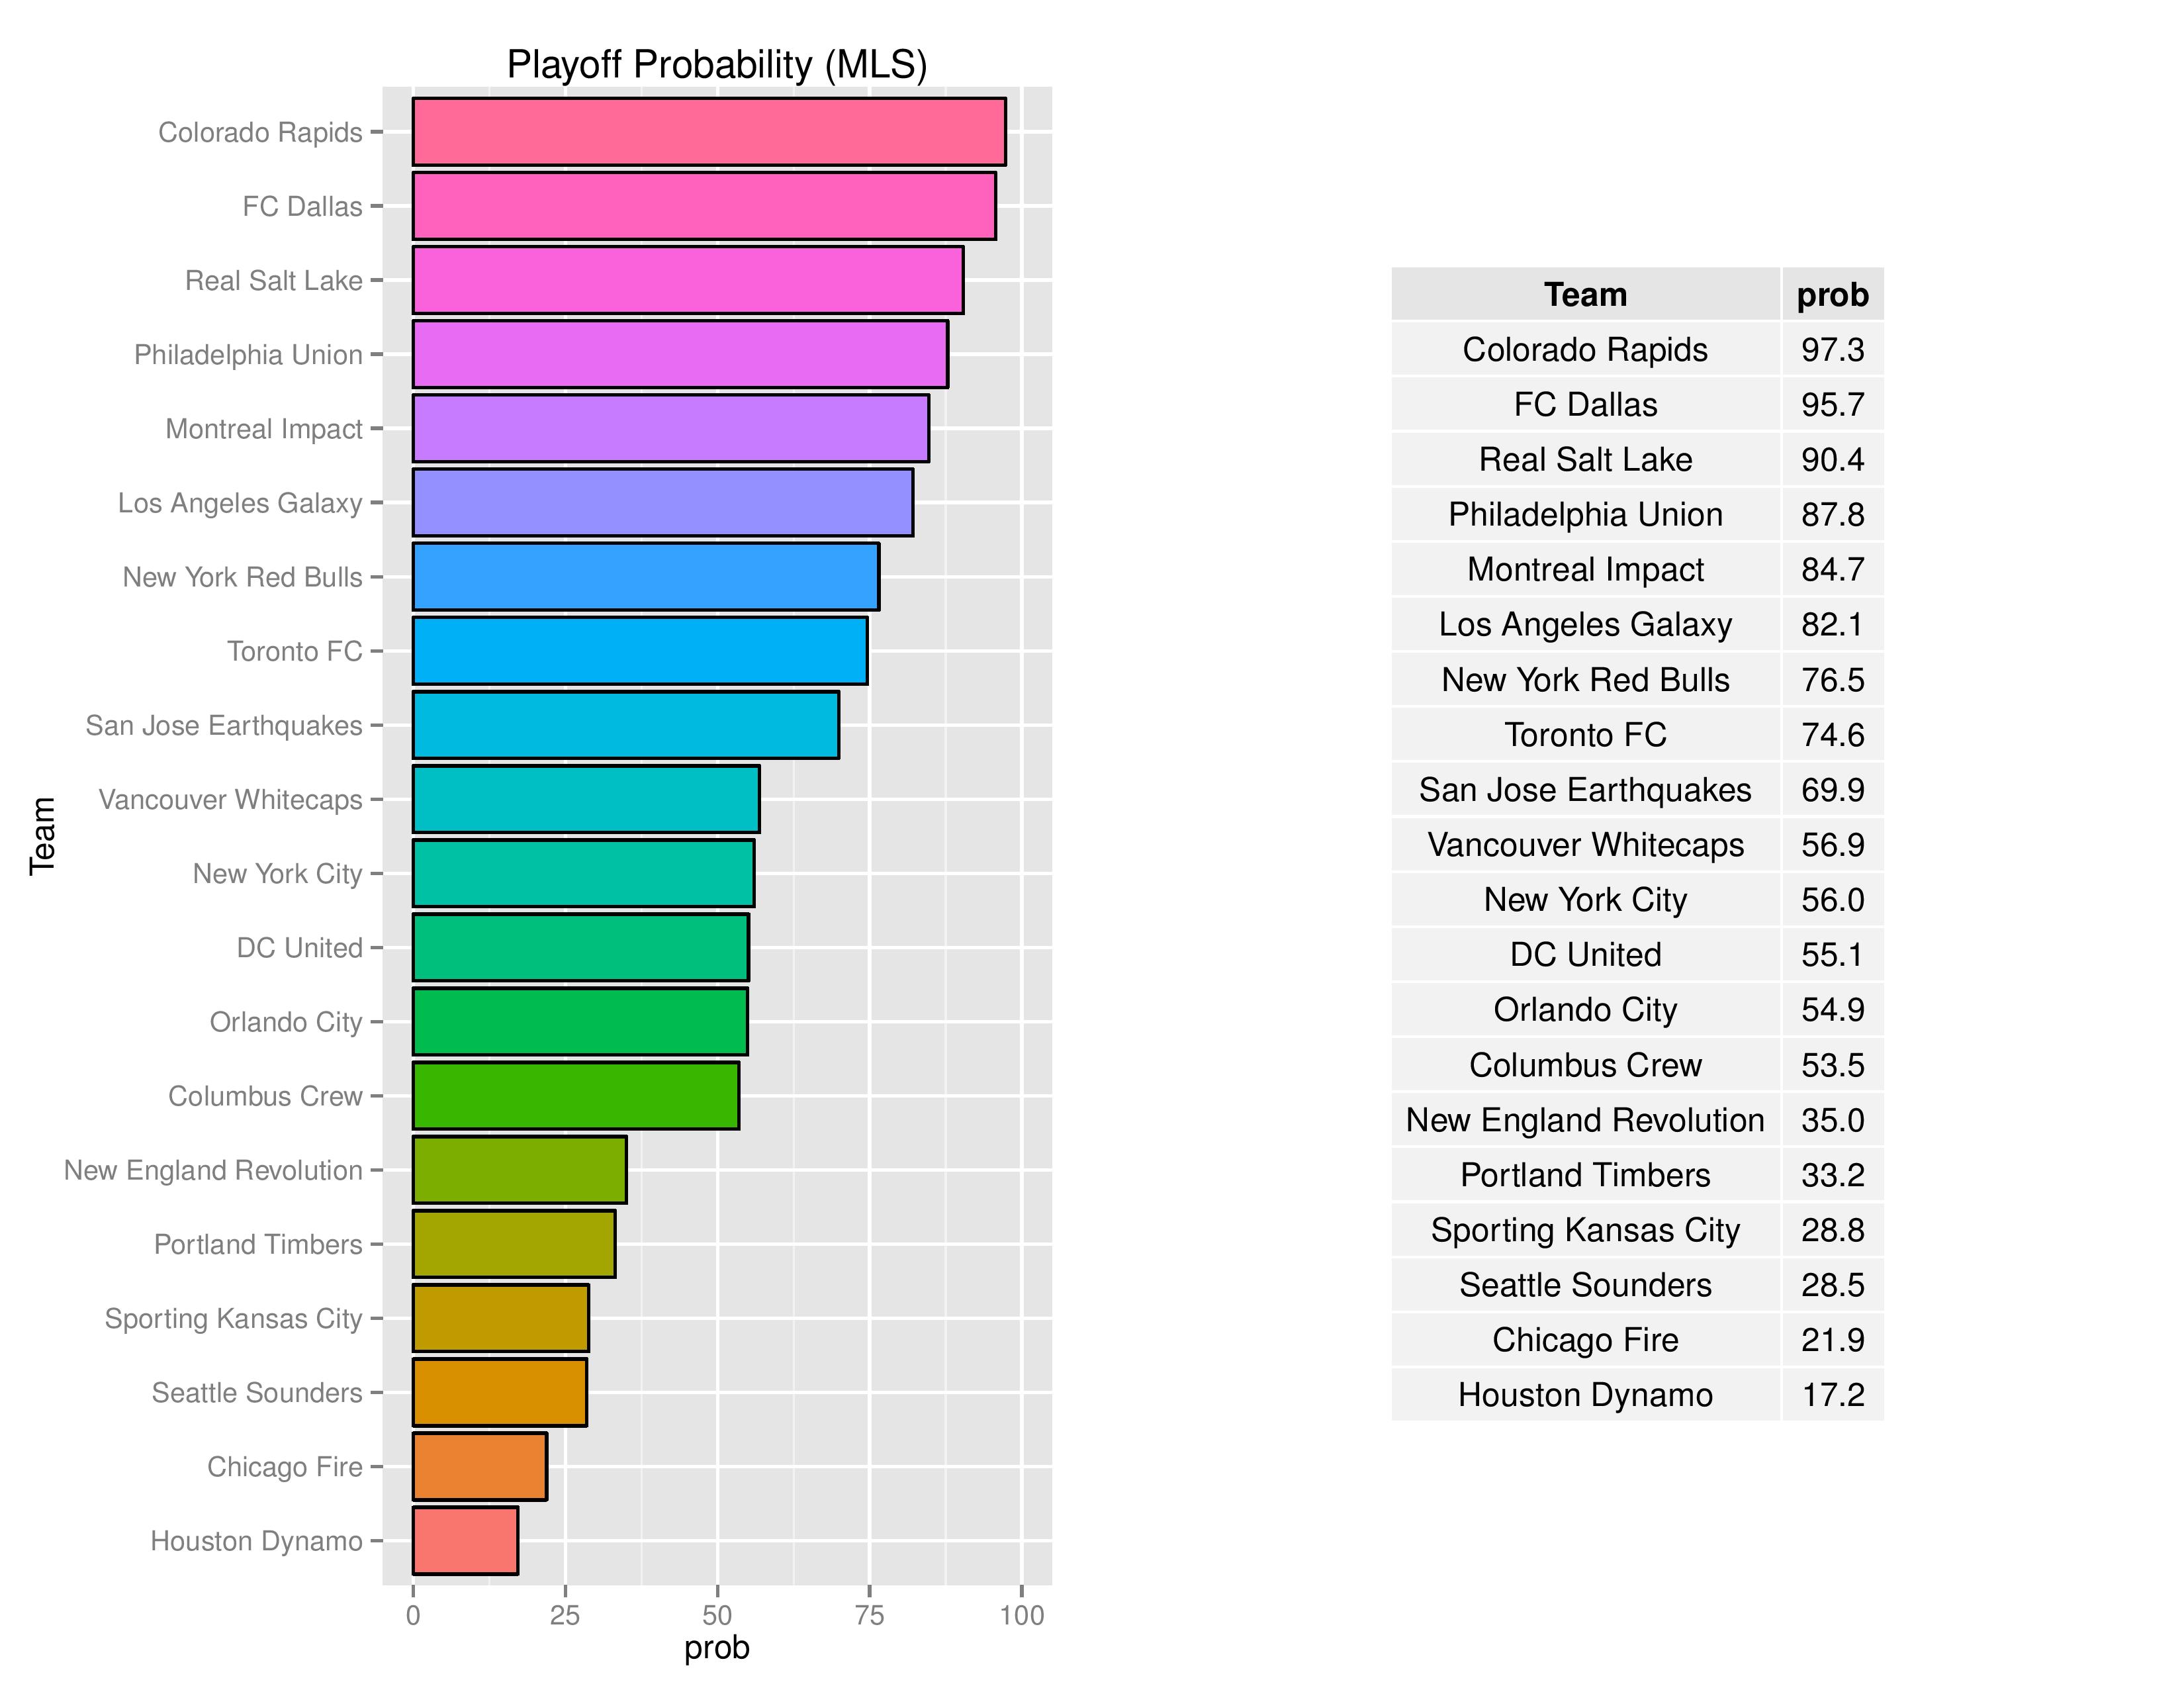
The Union moved down to 87.8% from 90.6% last week. While I’m fairly optimistic about the Union’s two road draws, the resulting points were about par from SEBA’s perspective while the Eastern conference generally had a stronger showing this week to make the playoff race a little more contentious.
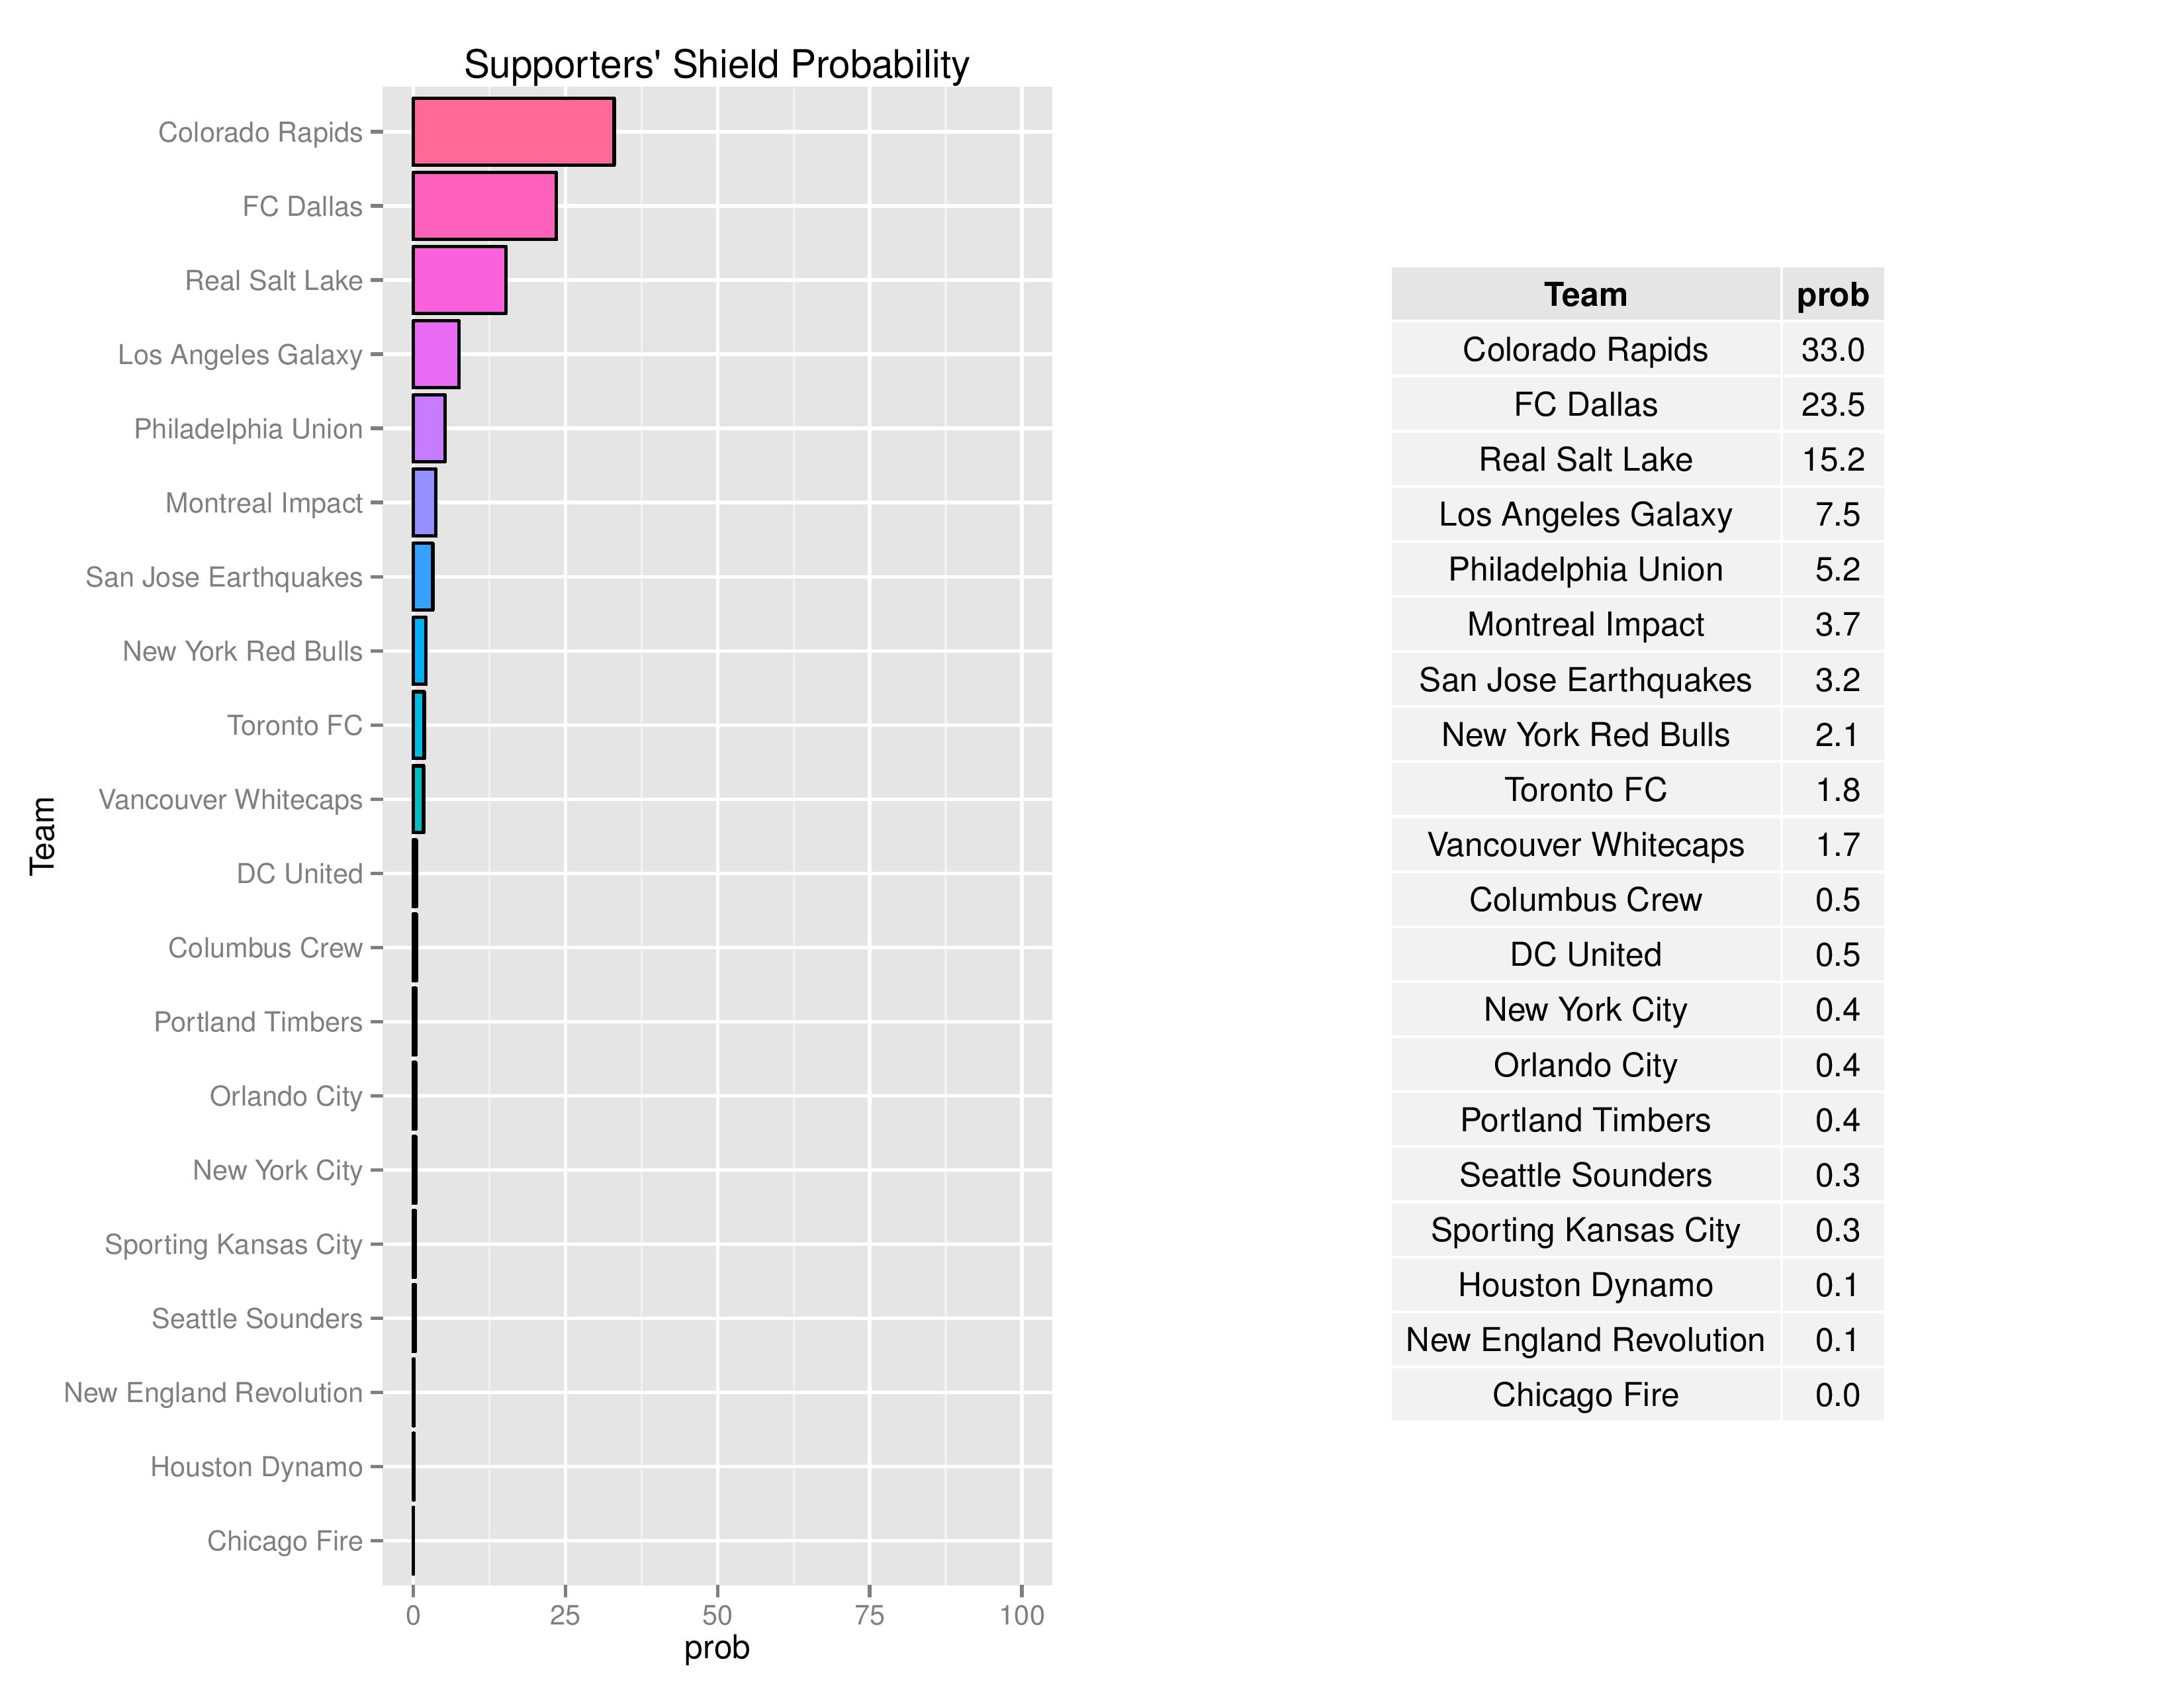
Philadelphia, again, slightly enhanced their unlikely chances at the Supporters’ Shield, moving from 4.9% last week to 5.2%. The increase is likely due to the Union’s slowing of Colorado’s lead on the Shield. Dallas benefited the most with nearly a 4% bump from last week.
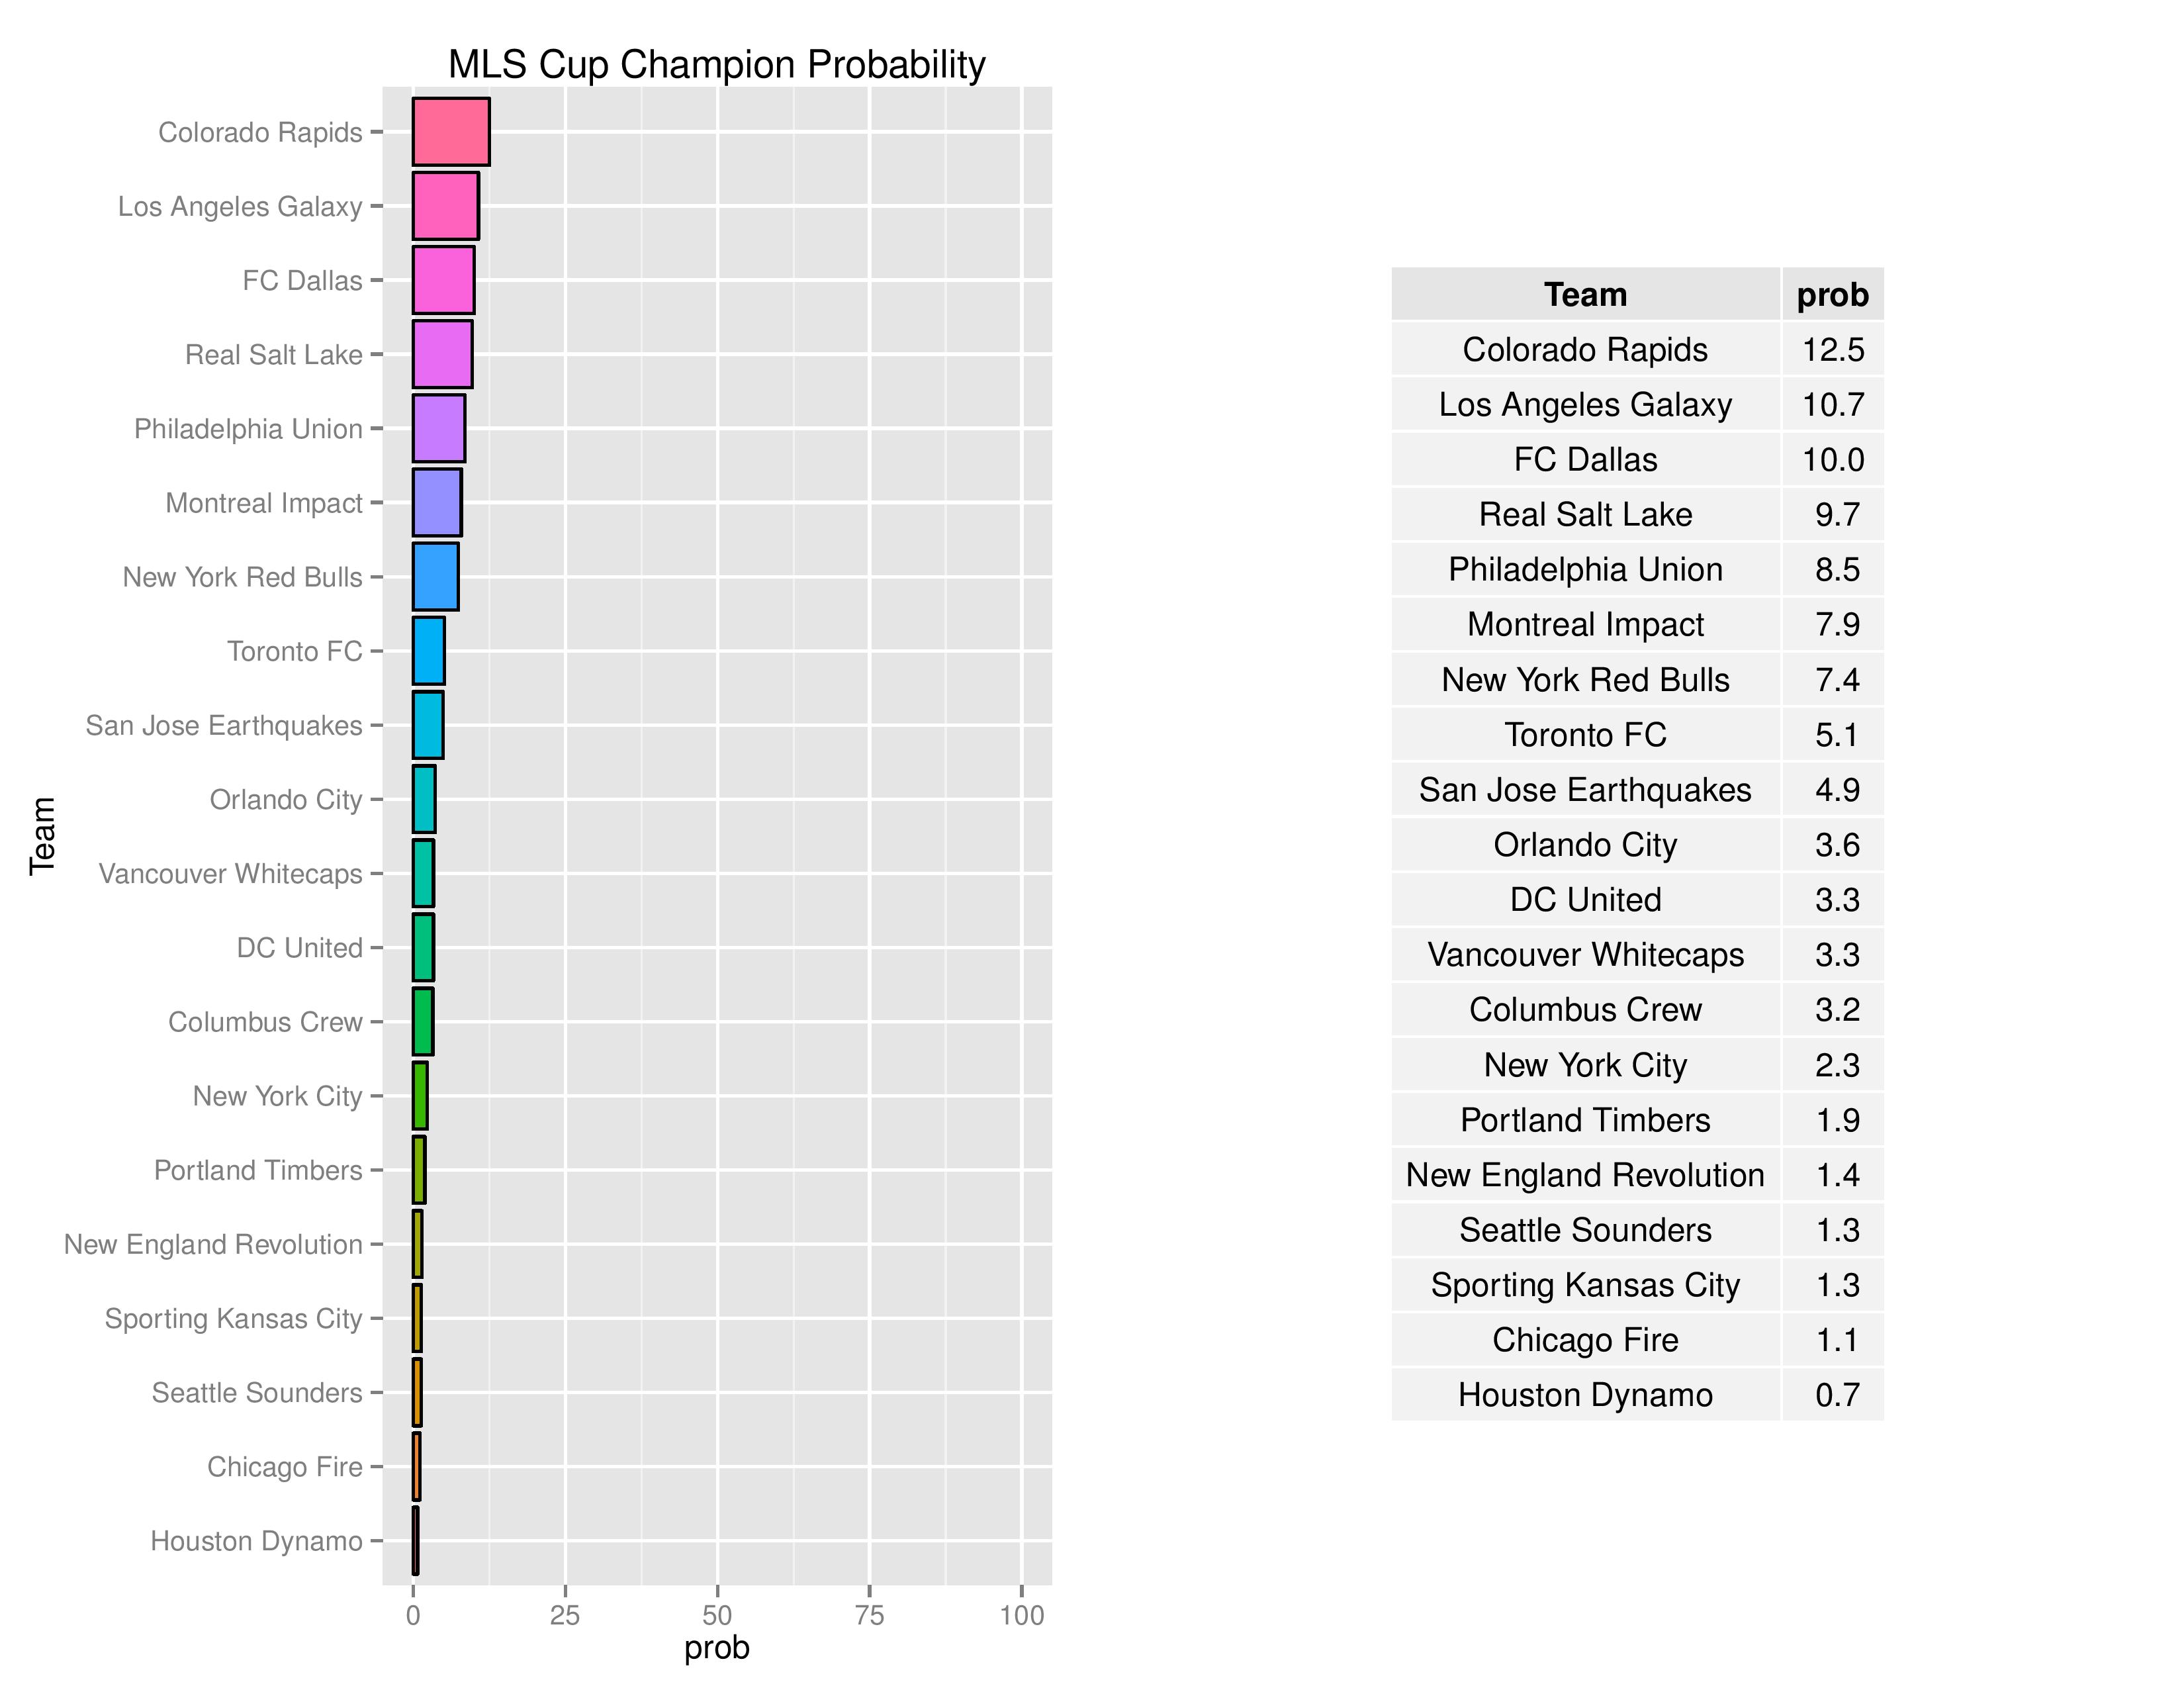
The Union mildly increased their odds at the MLS Cup, moving from 8.4% to 8.5%.
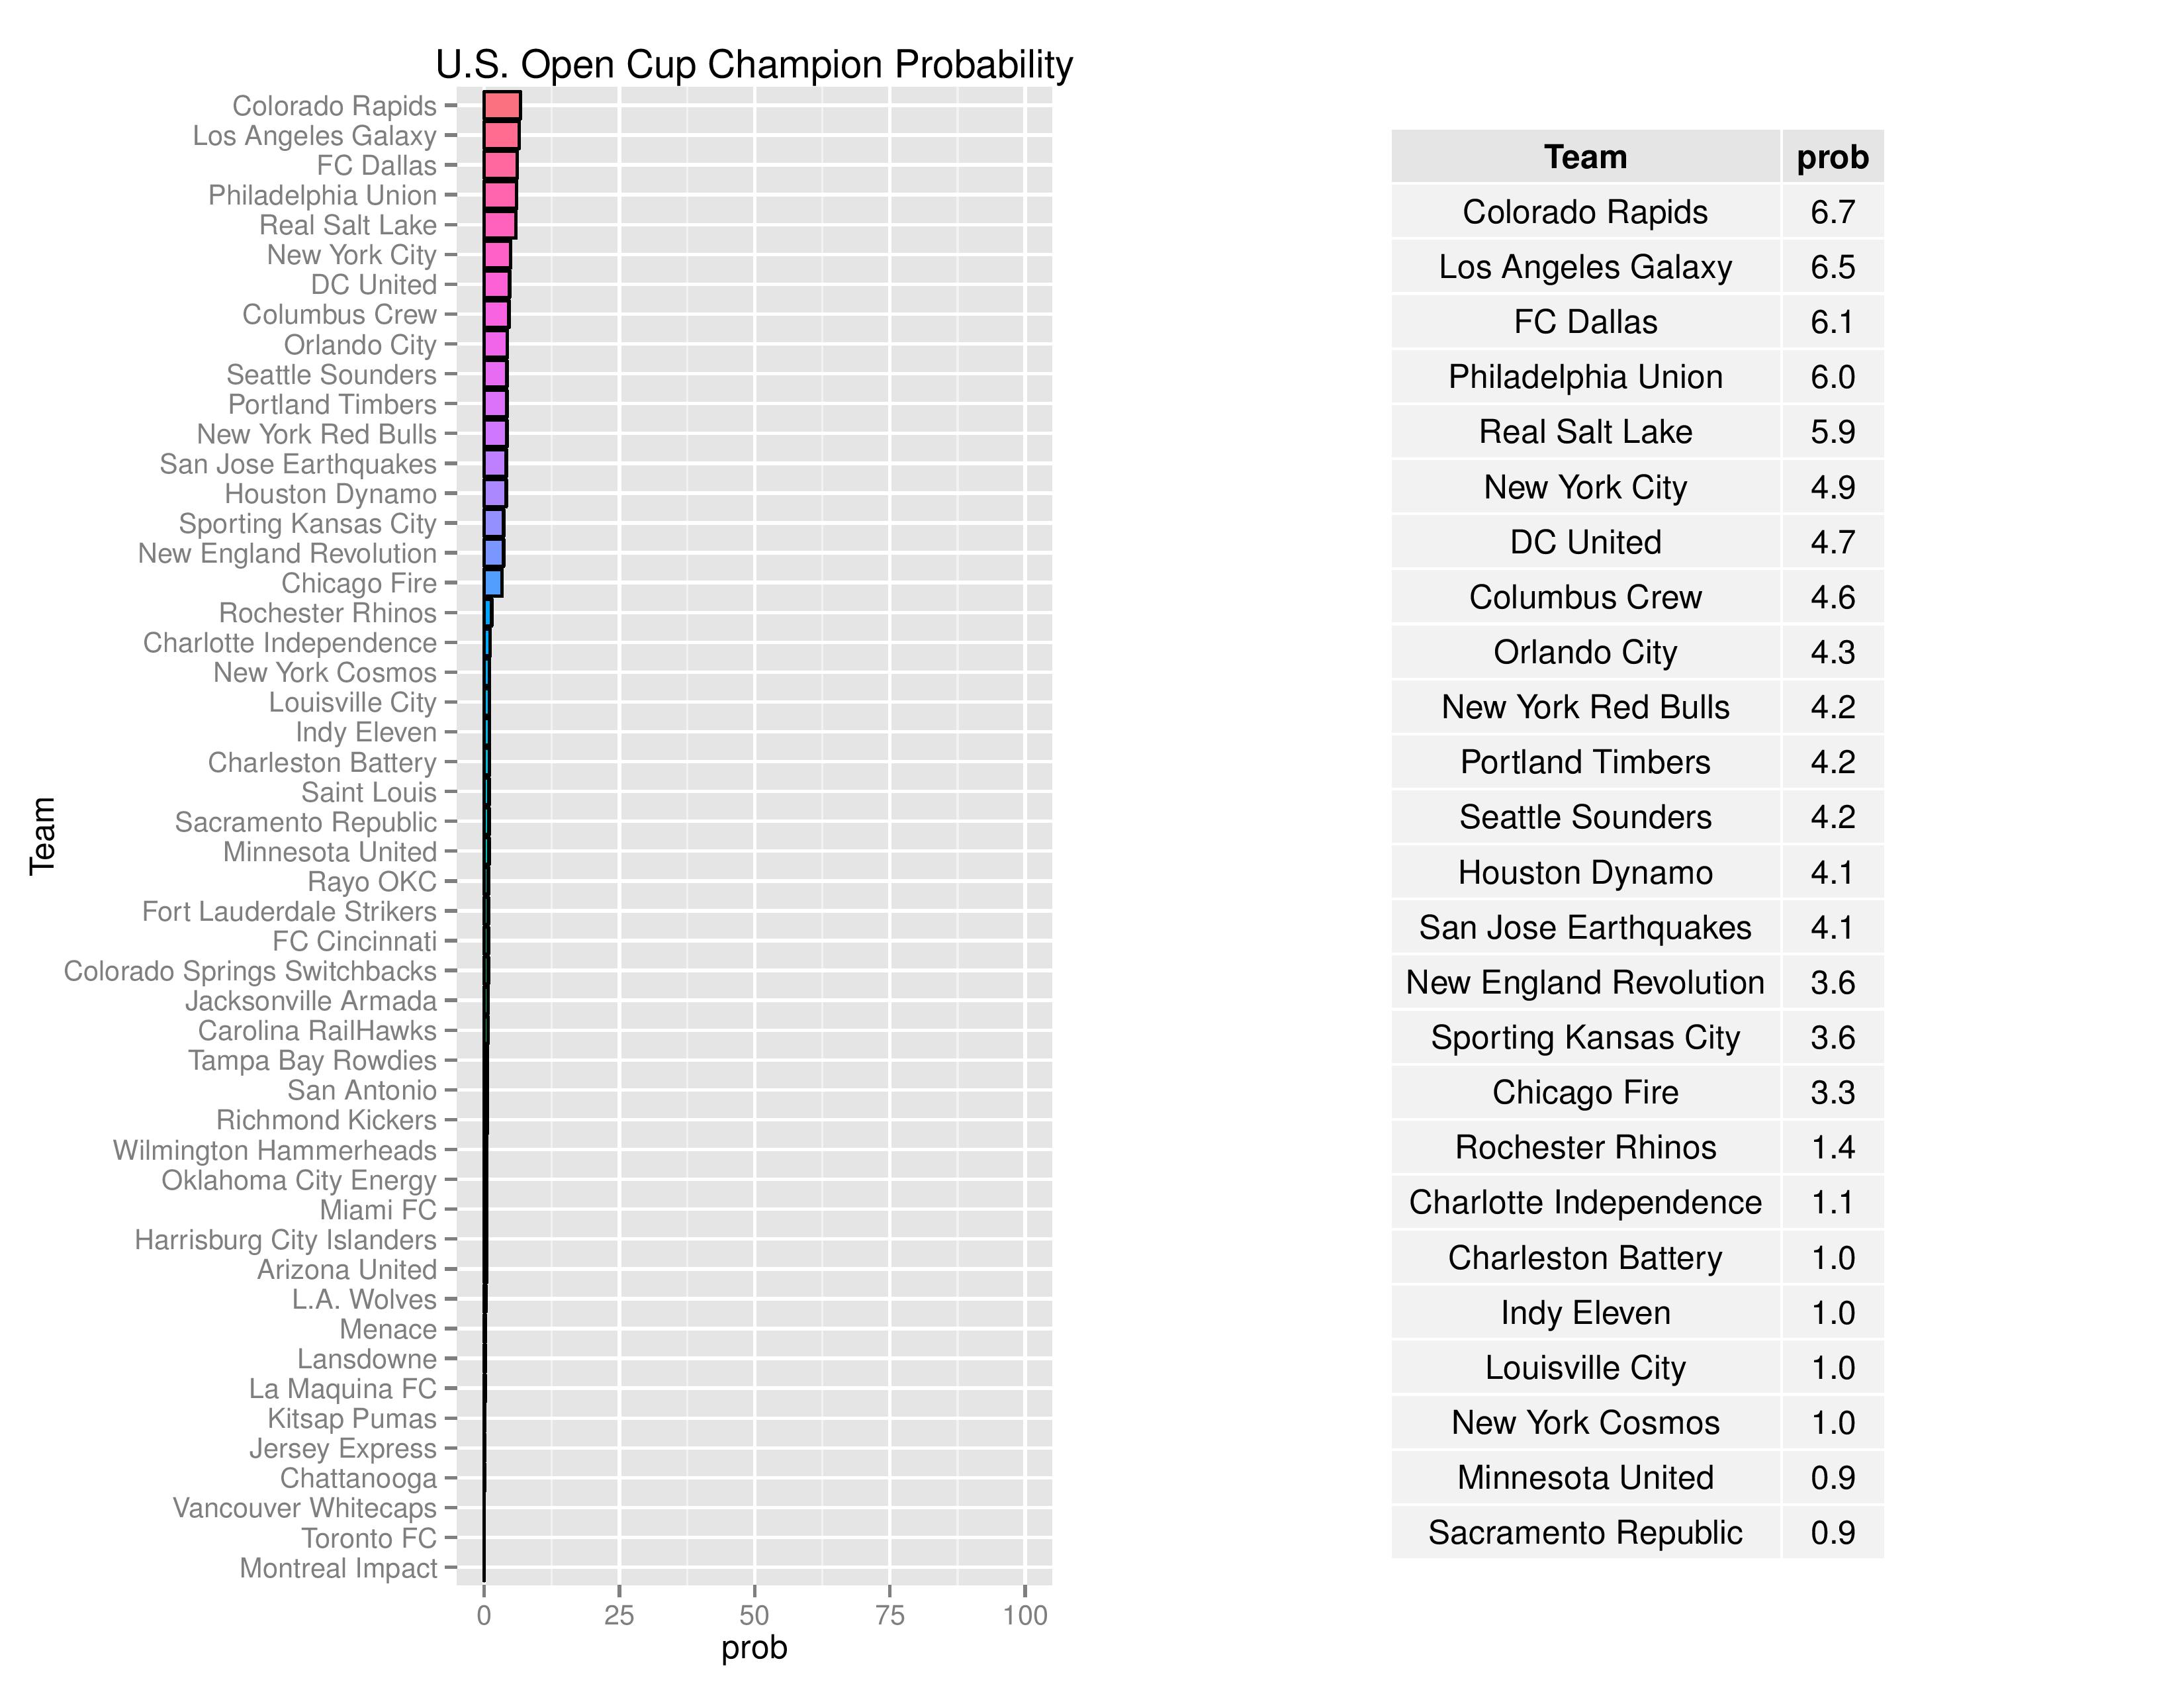
Philadelphia moved down slightly from 6.2% last week to 6.0% in the probability to win the US Open Cup. They did move up in rank from 5th to 4th as a result of RSL’s defeat to Columbus on the road. Philadelphia’s increasing expectations to draw can also hurt a team in a knockout format tournament such as the USOC, as this increases the likelihood of a penalty shootout which can largely mitigate the skill gap between two teams.
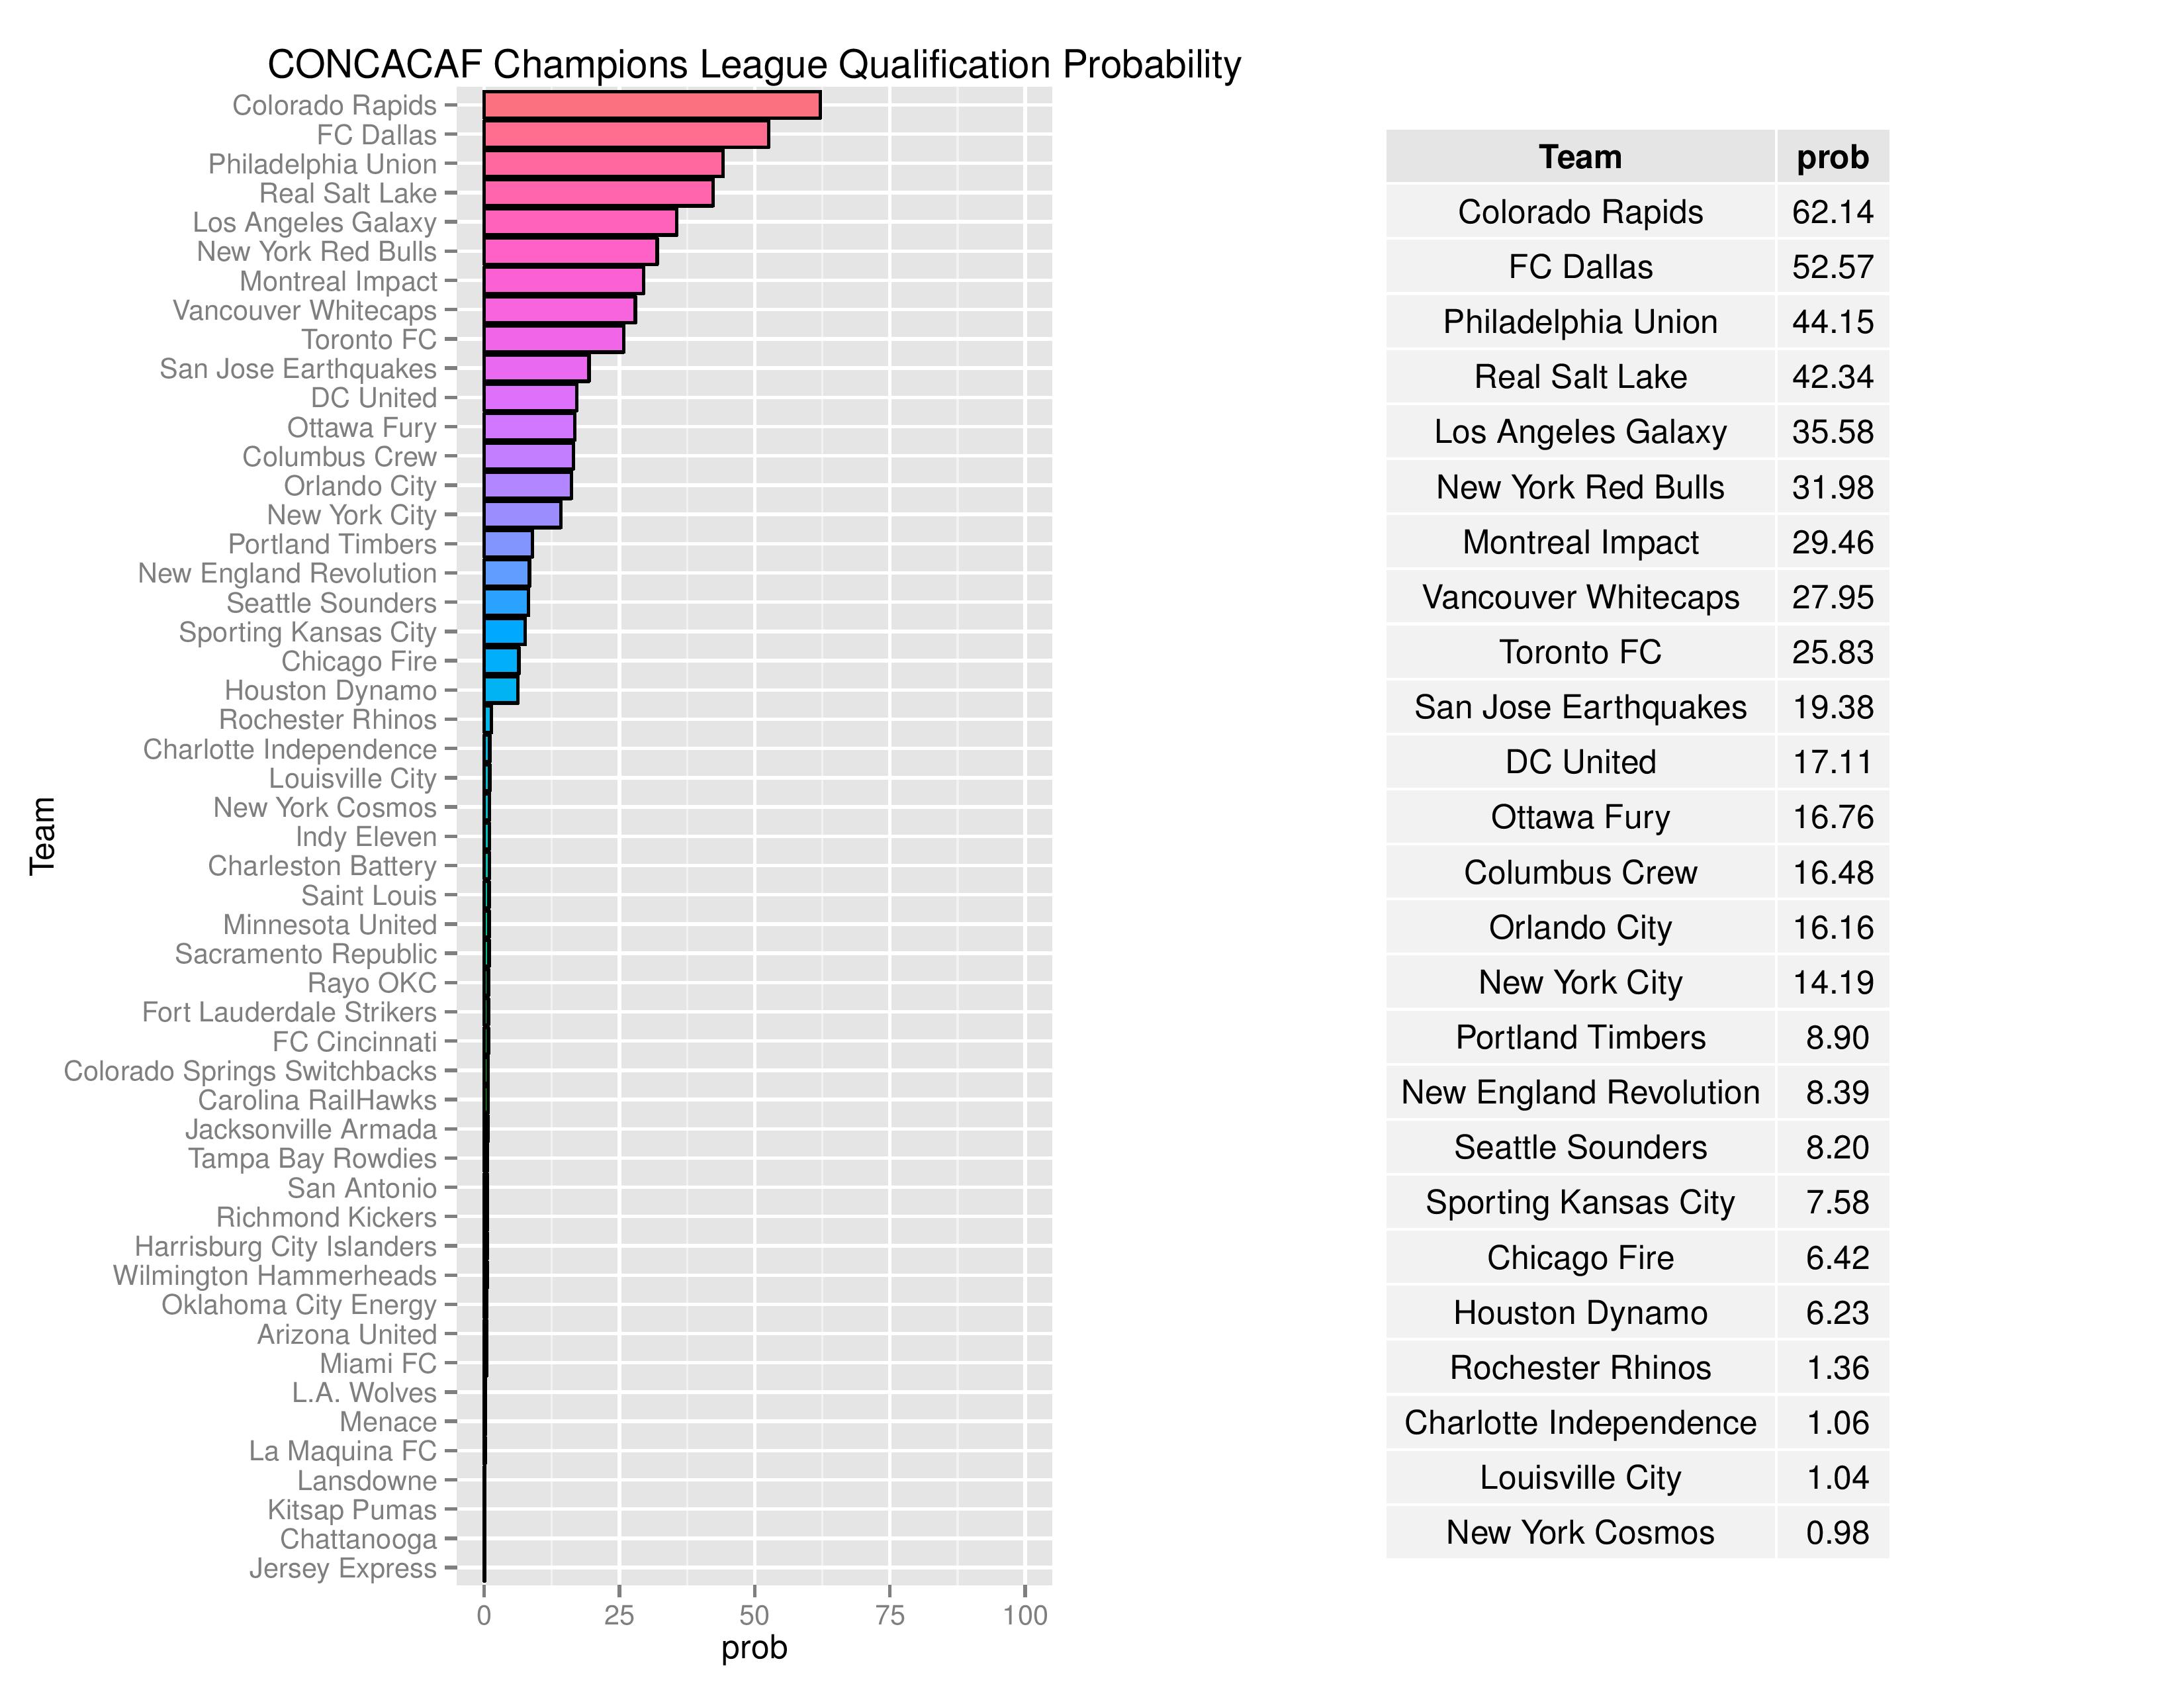
Philadelphia’s probability of qualifying for the CCL moved down from 48.13% to 44.15%. The downswing is likely due primarily to the increased competitiveness shown by the Eastern conference this week. As a reminder, U.S. teams qualify for the CCL by winning the MLS Cup, winning a conference in the regular season (including Supporters’ Shield), and by winning the U.S. Open Cup (or being a top single-table-performer if the former qualifications don’t count for 4 slots). Canadian teams qualify by winning the Canadian Championship.
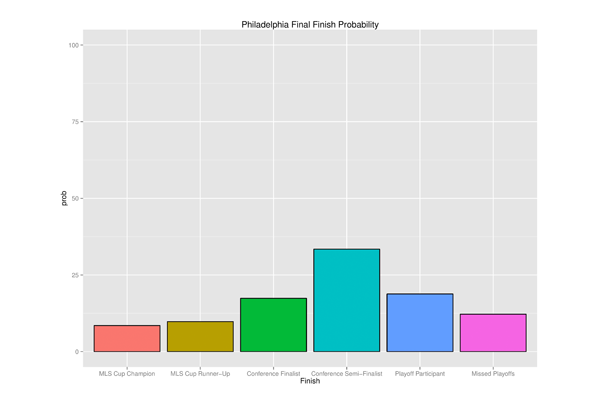
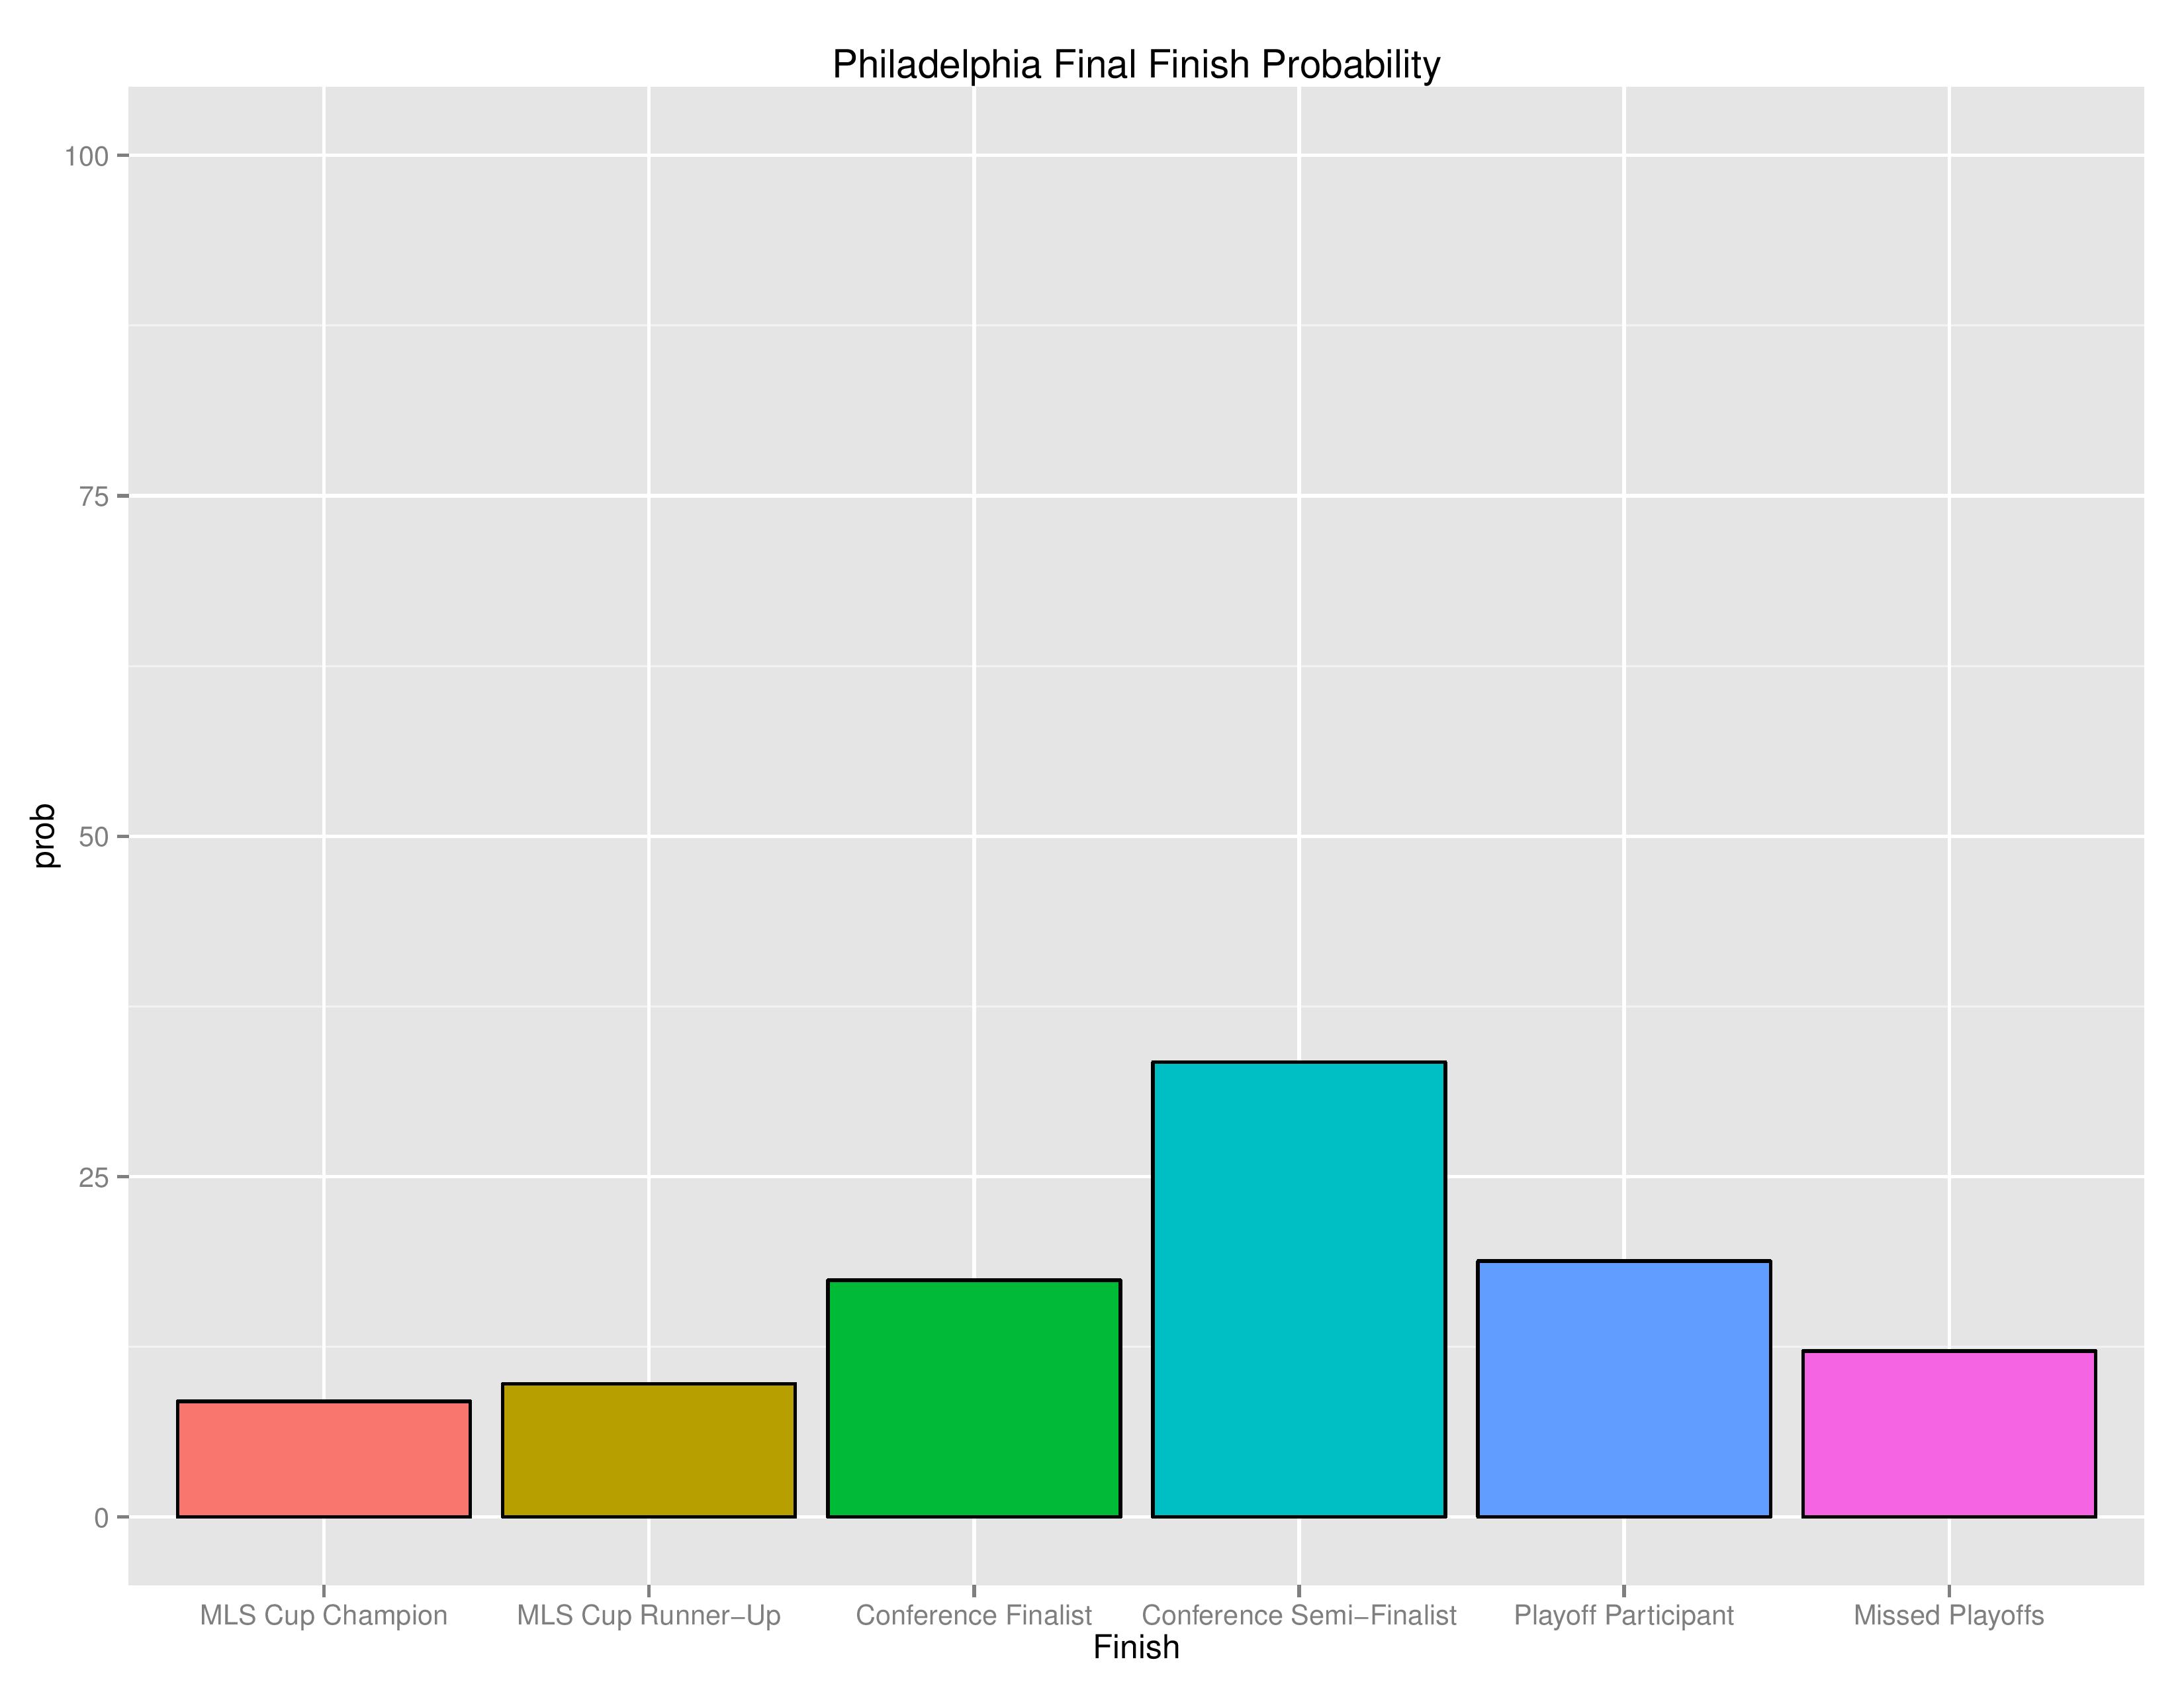
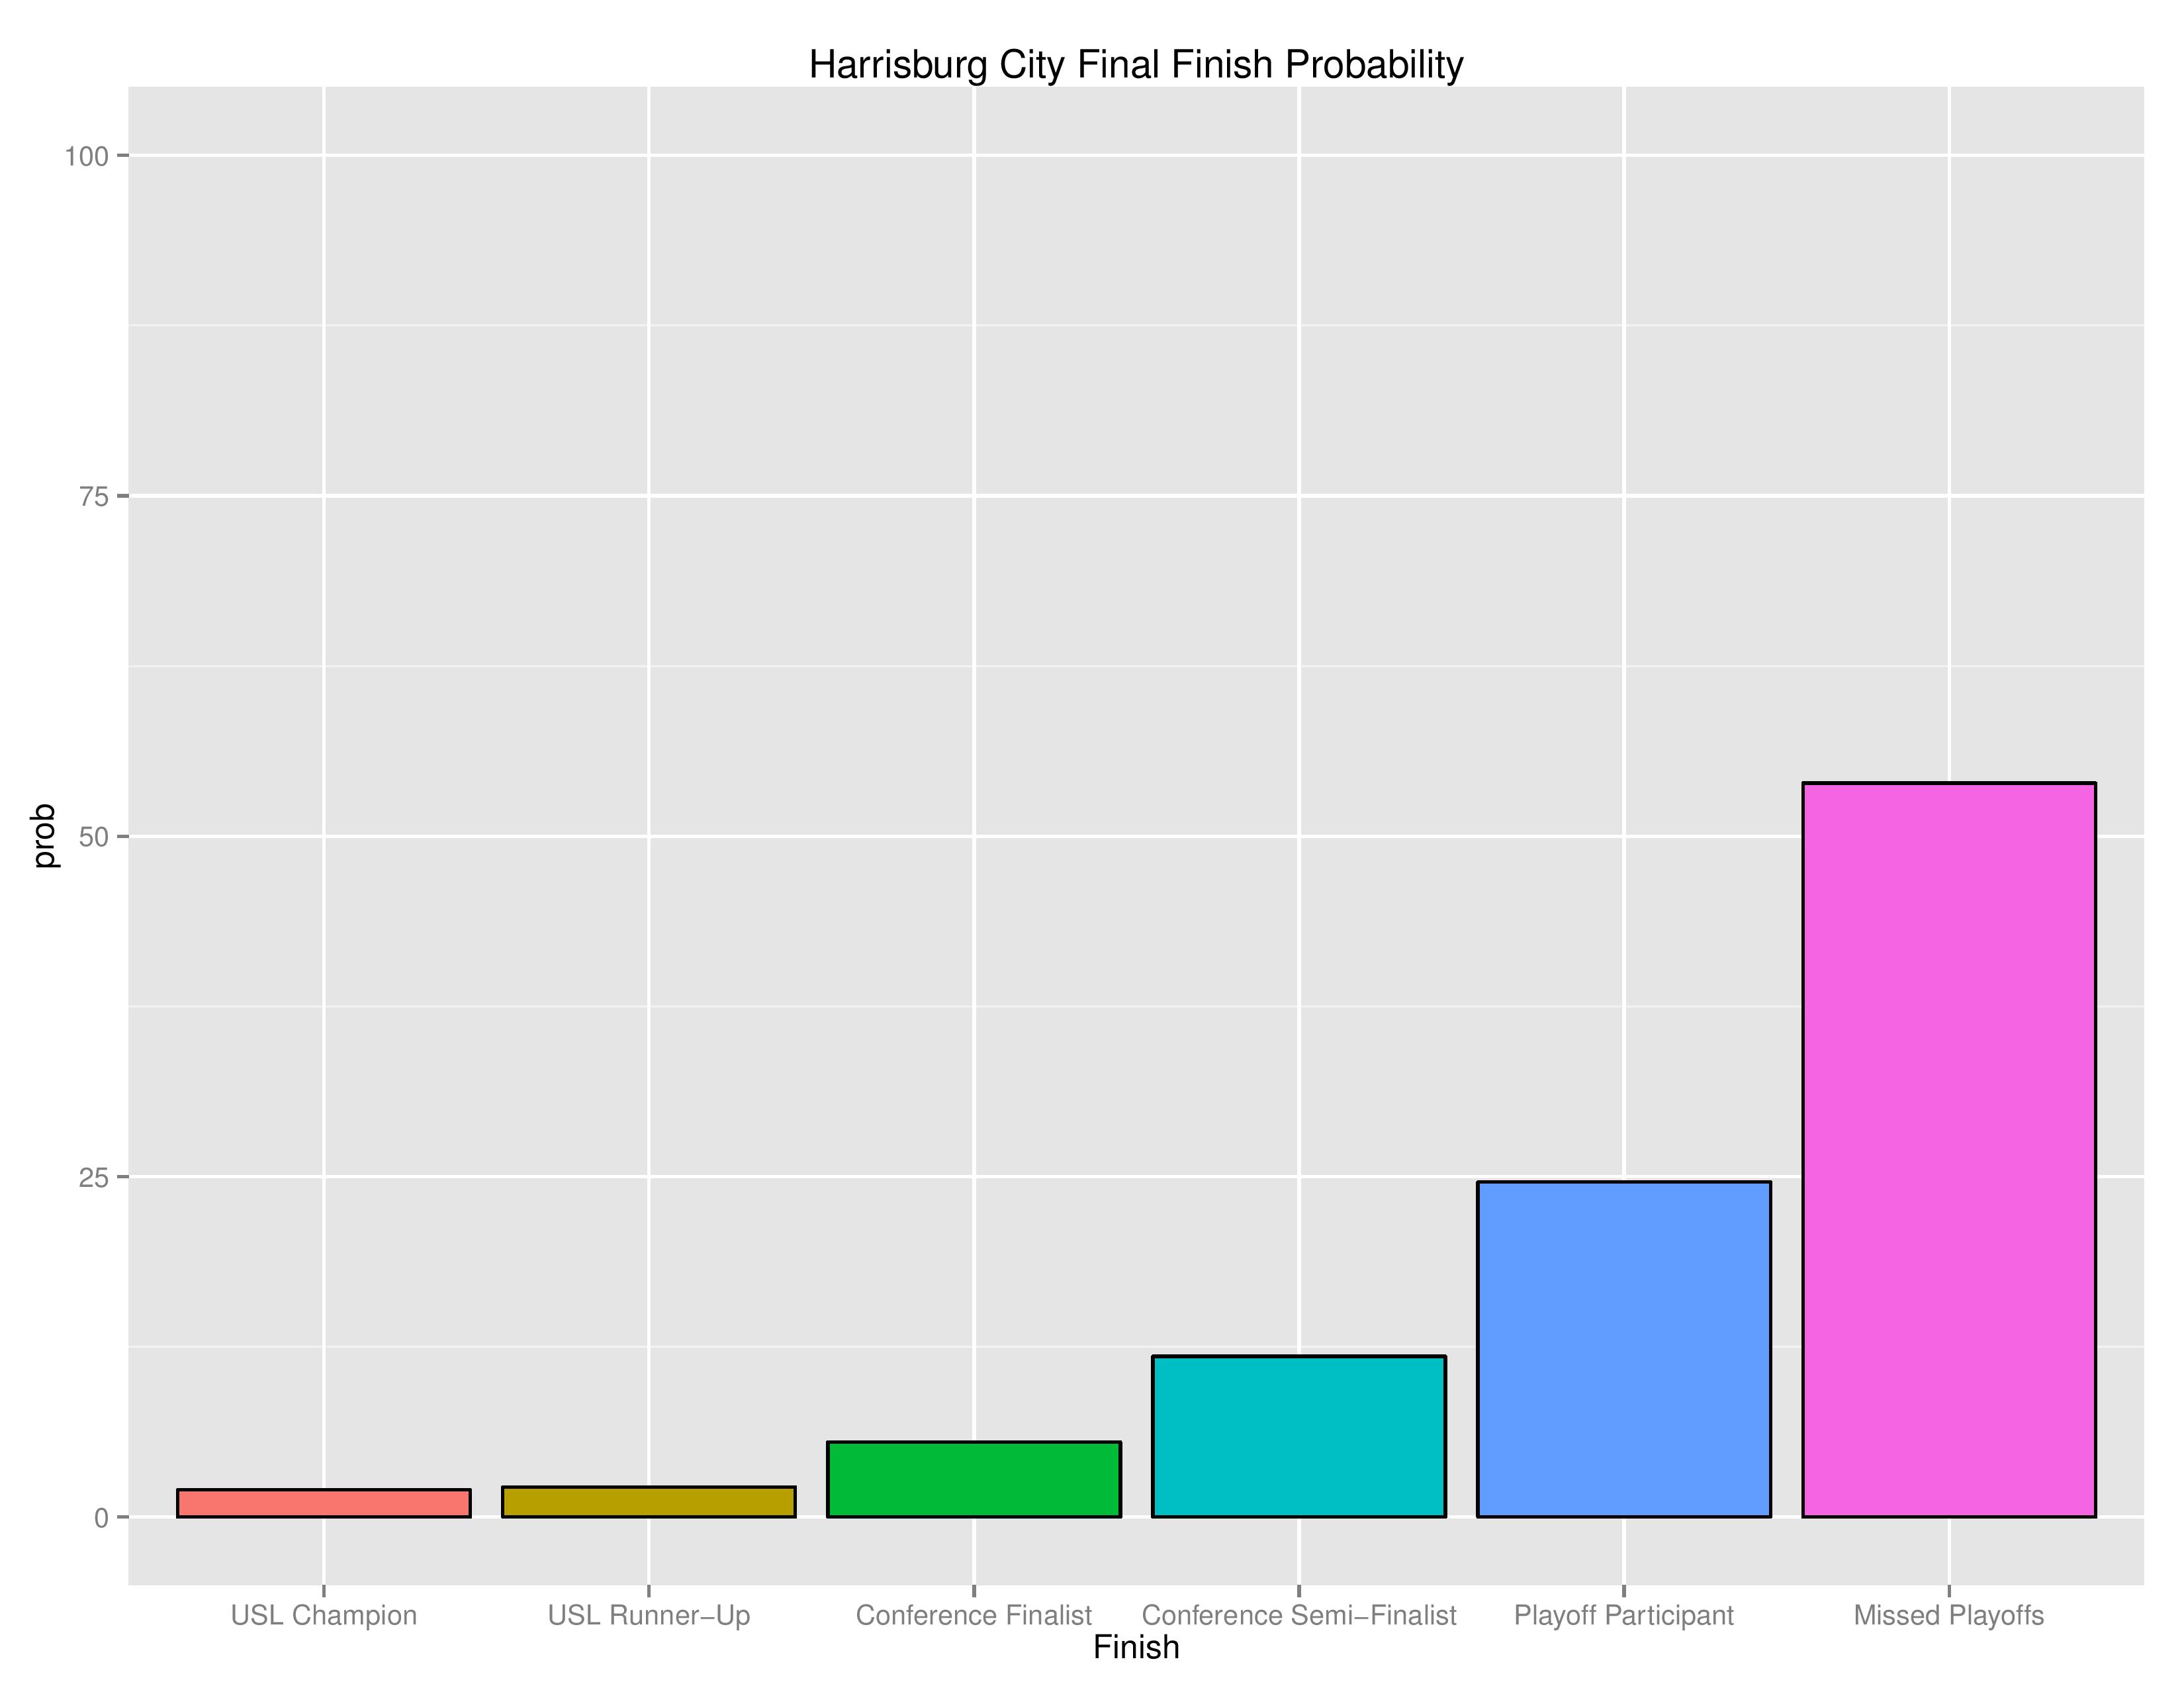
Philadelphia finishing
The following shows the probability of various Playoff categories and Philadelphia’s probability of each of them. Keep in mind that “Missed Playoffs” is, by default, 8 times as likely as “MLS Cup Champion.”
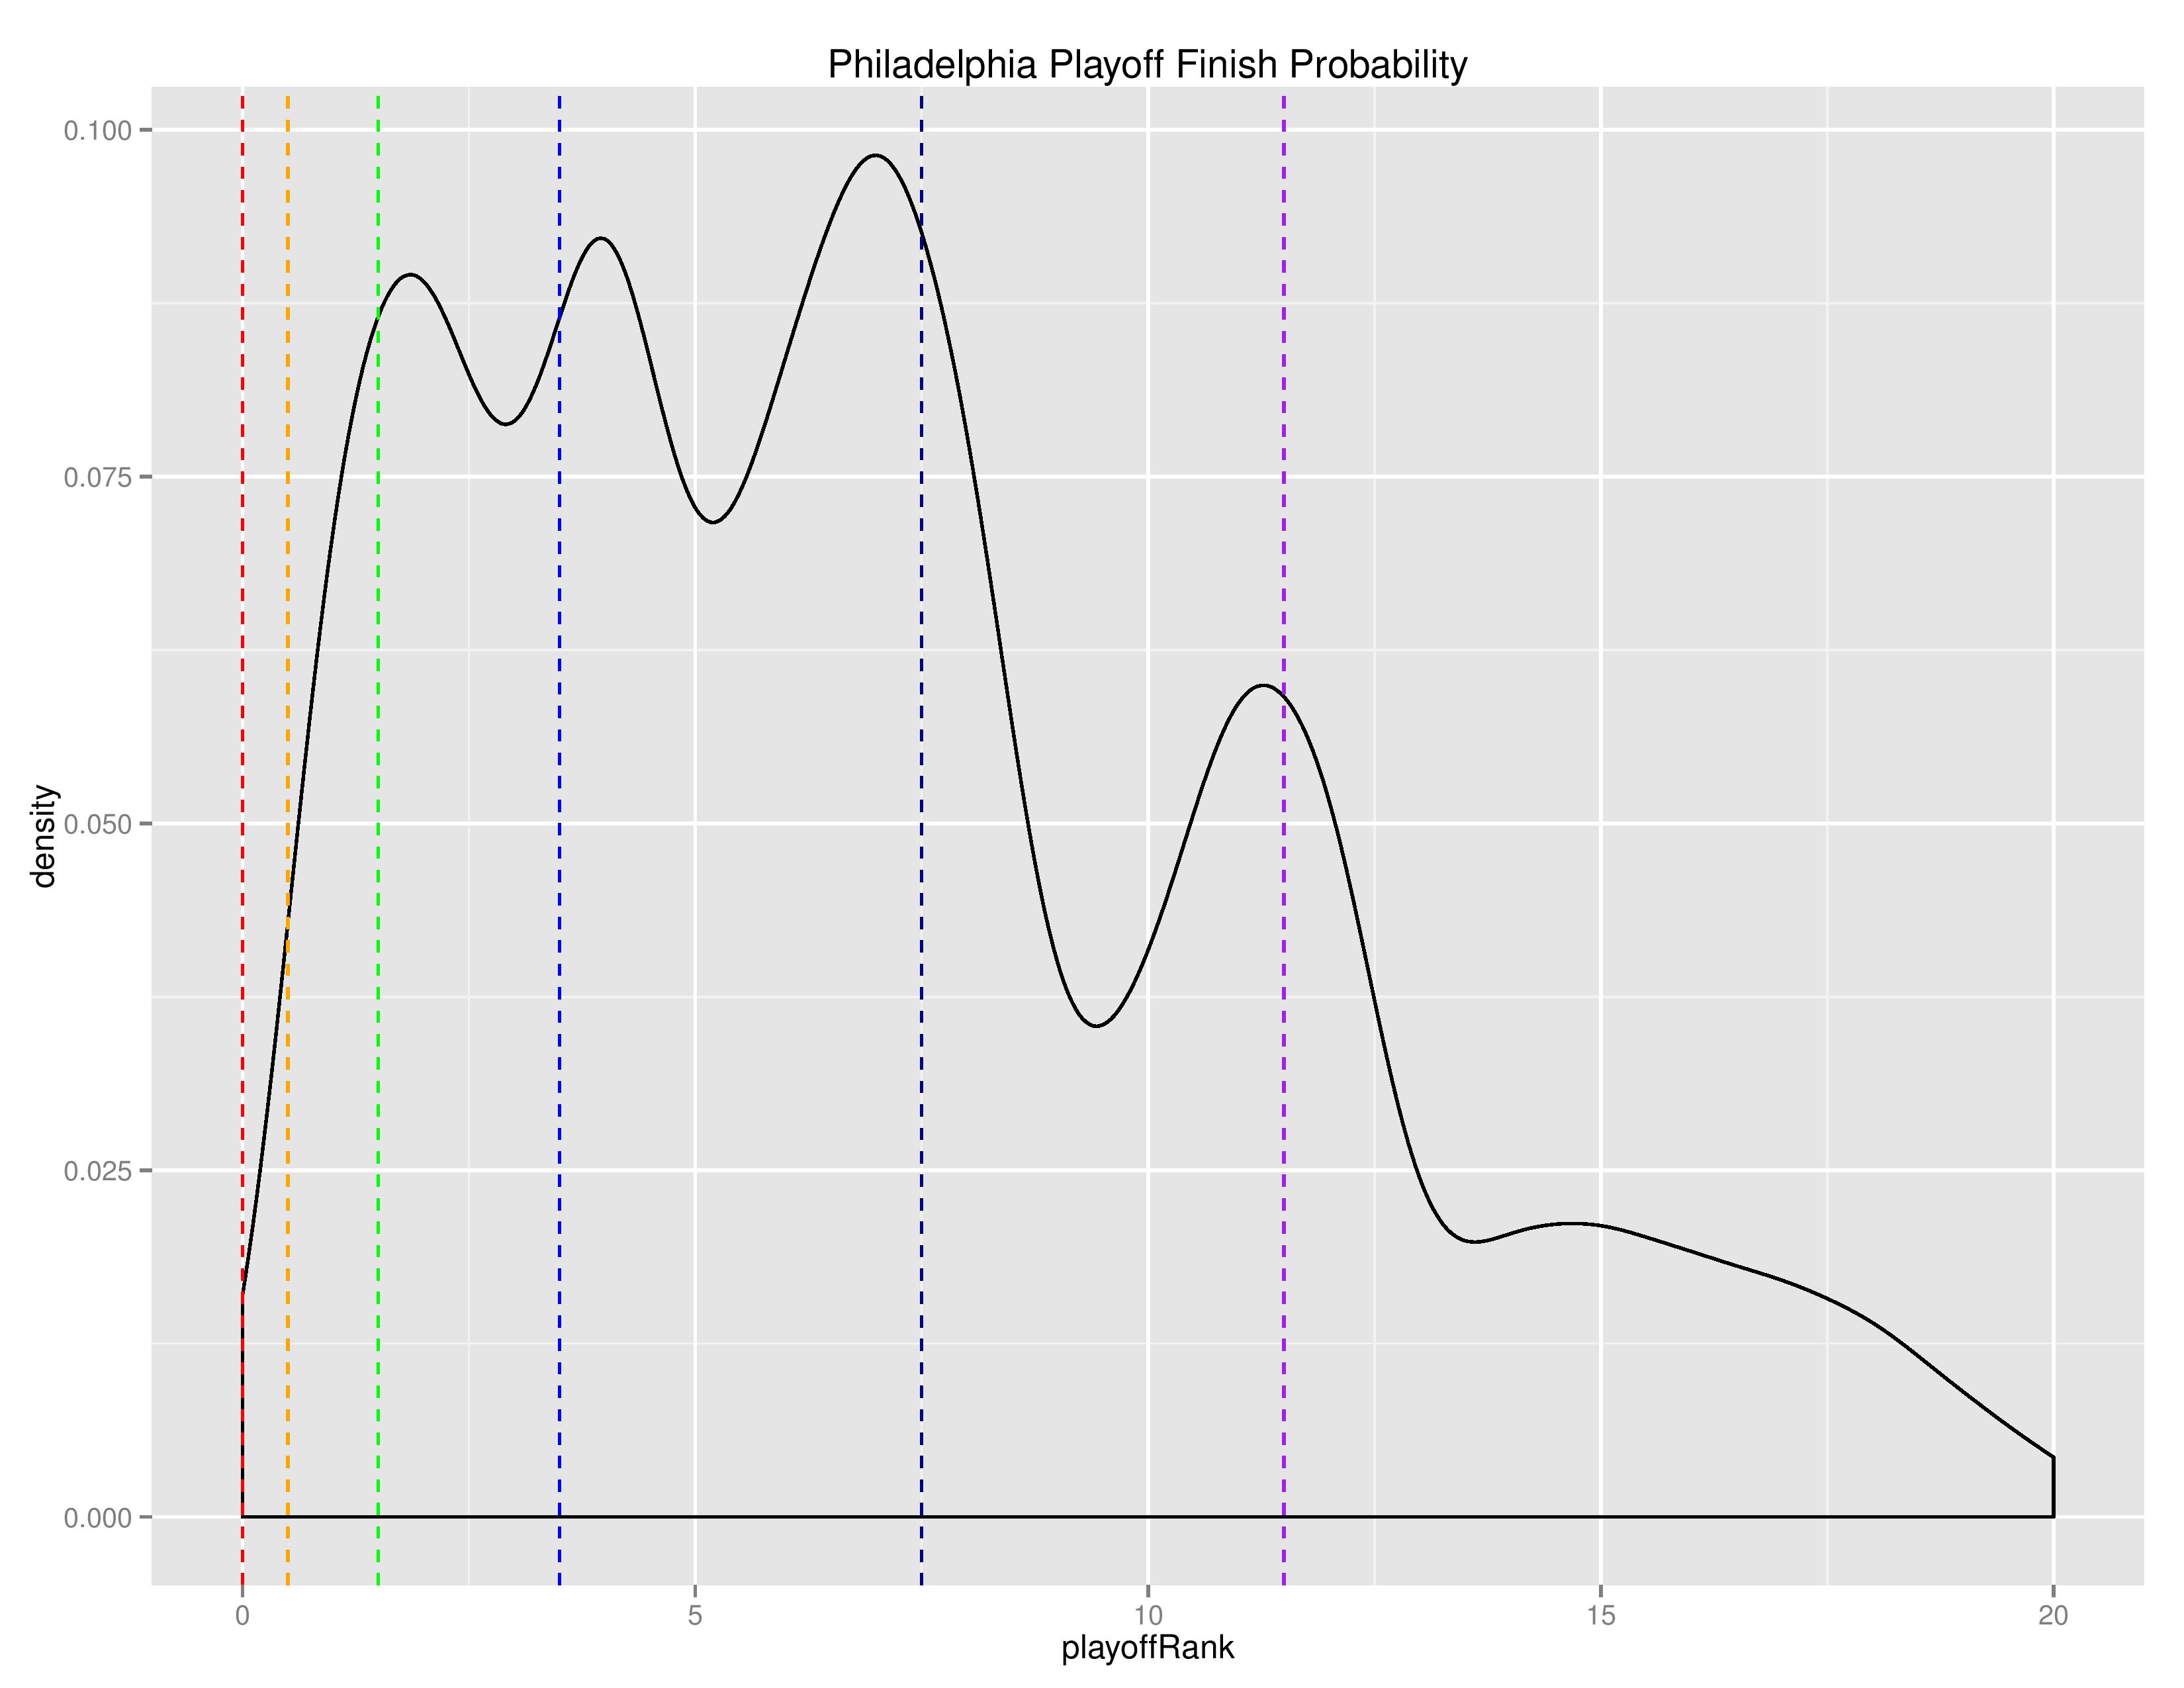
The following is a “density” chart showing the relative probability of Philadelphia finishing at the different after-playoffs rankings from 1 to 20.
To repeat myself, the loopy-ness you see in the higher ranks is likely due to the disparity in conference strength. If Philadelphia finishes in a higher round than a Western team, they are automatically ranked higher, but if they finish in the same round, Philadelphia will often be ranked lower (based on regular season single-table finishing).
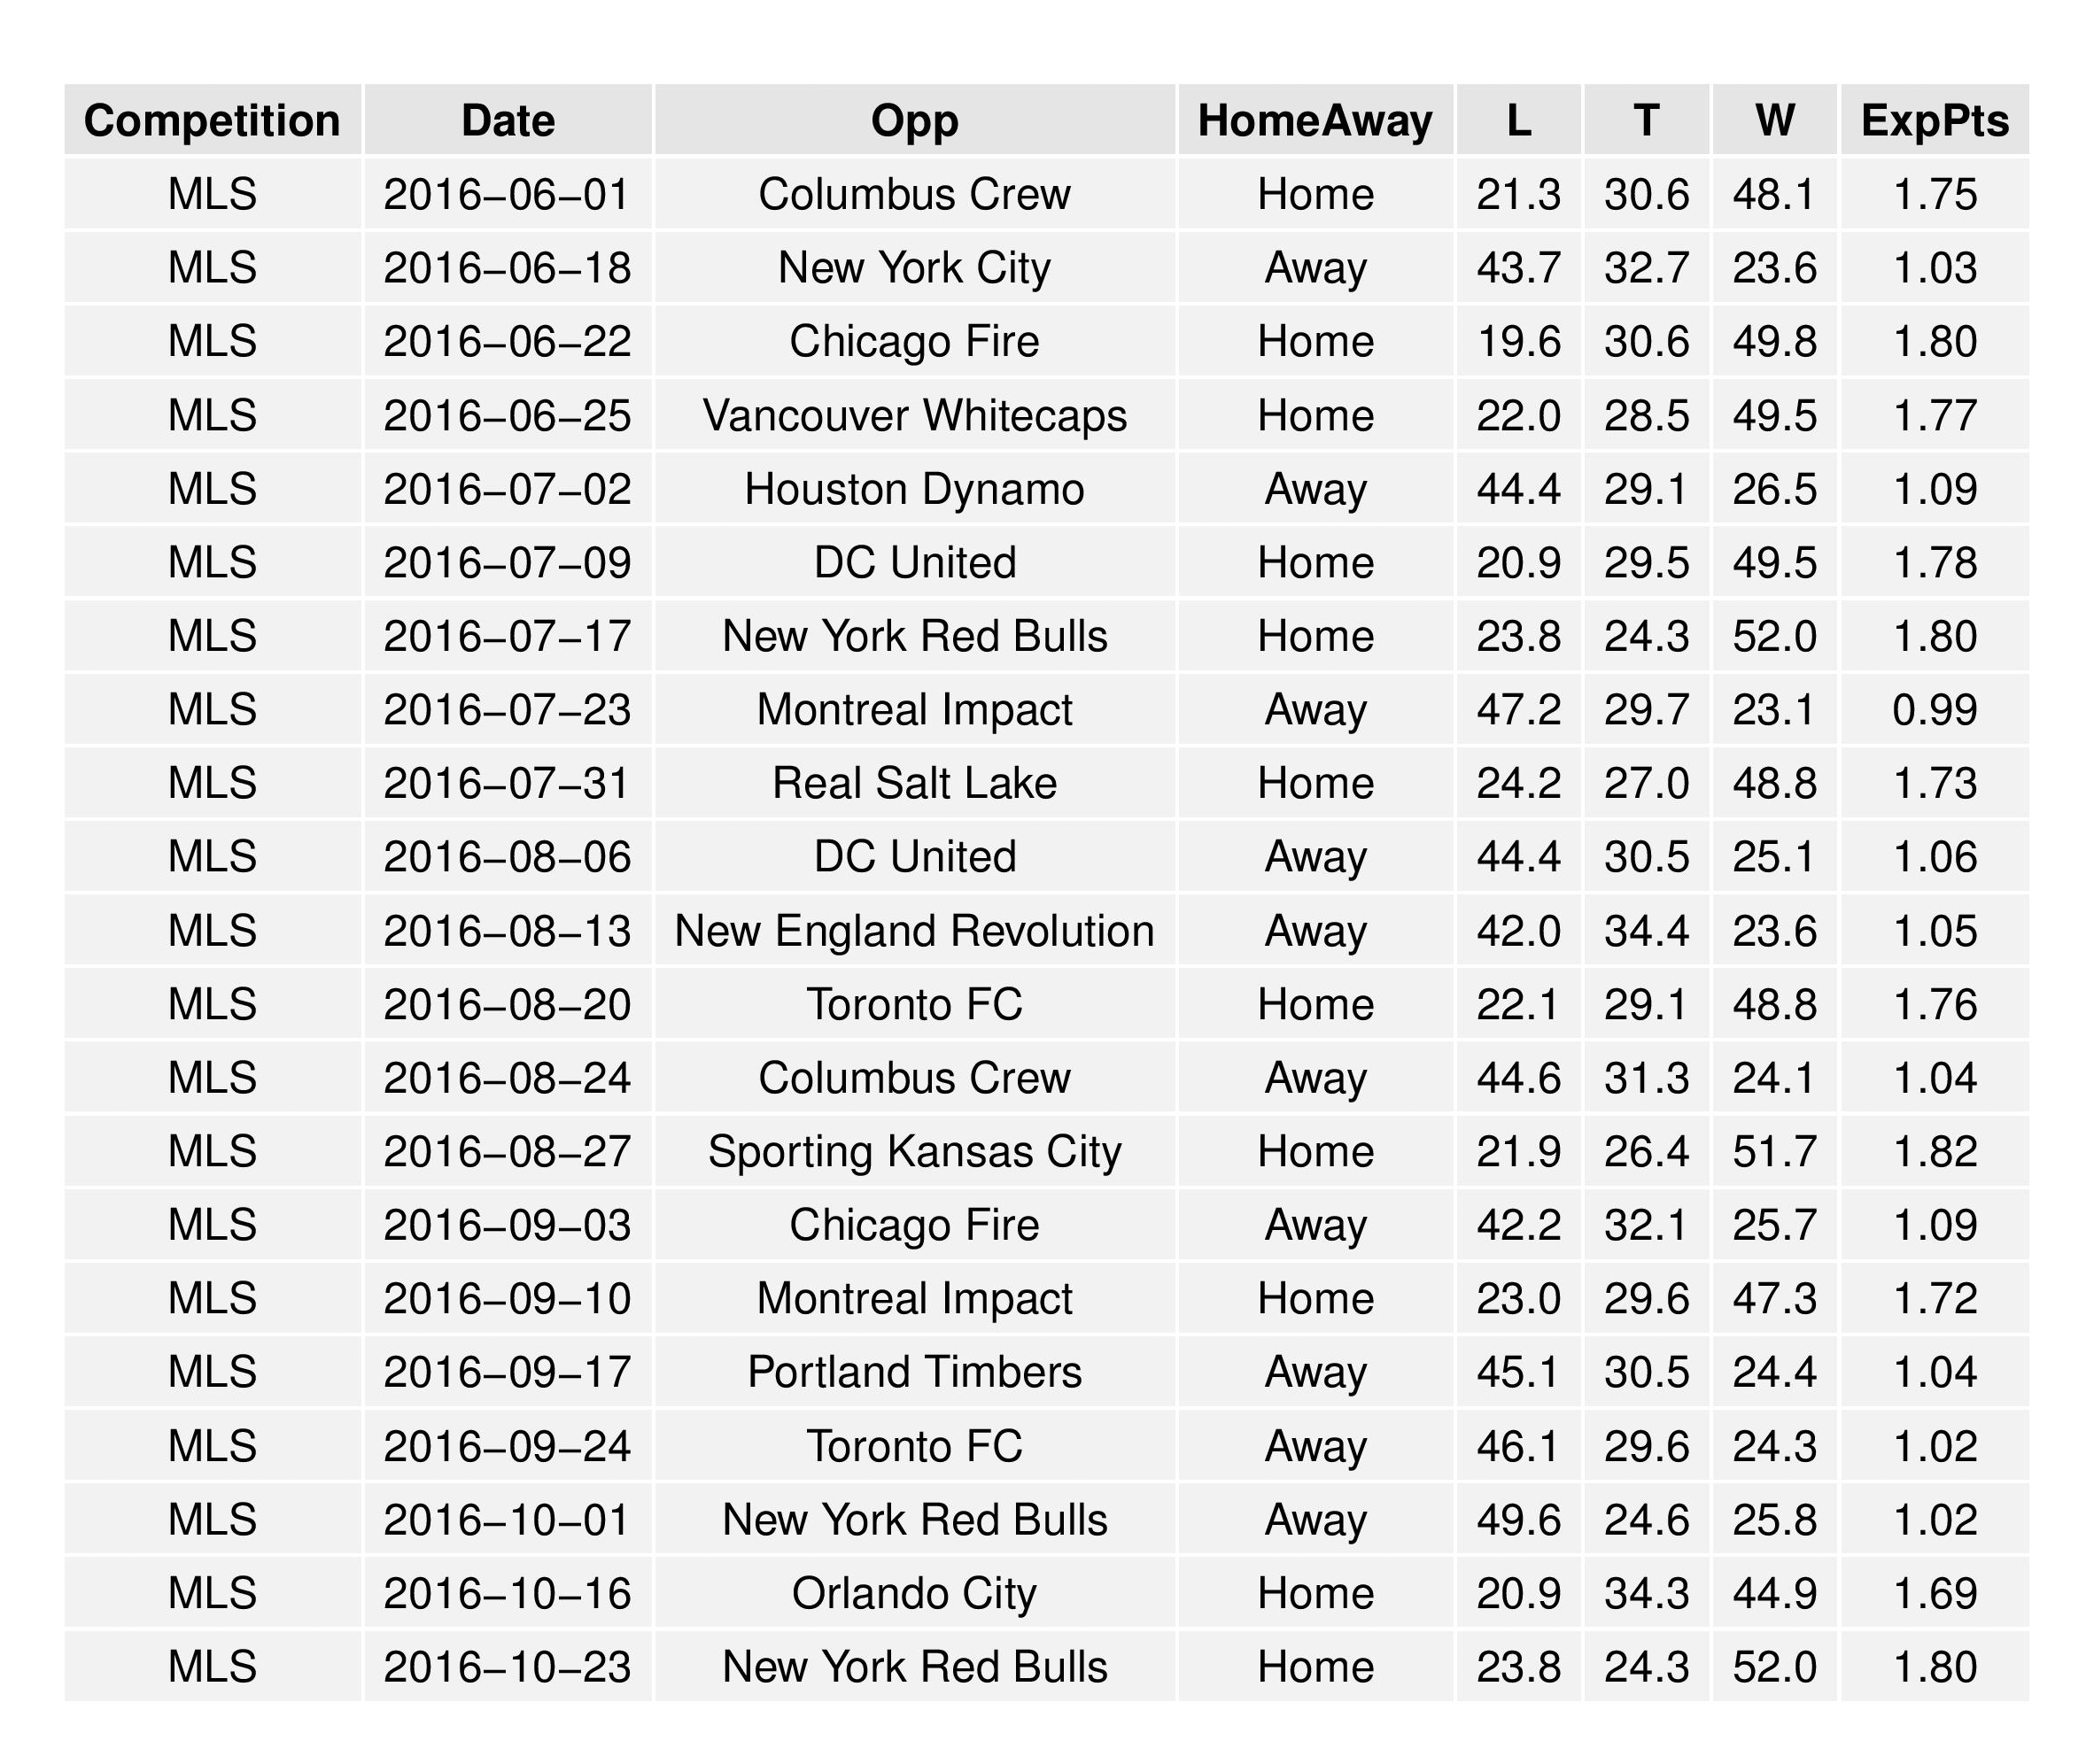
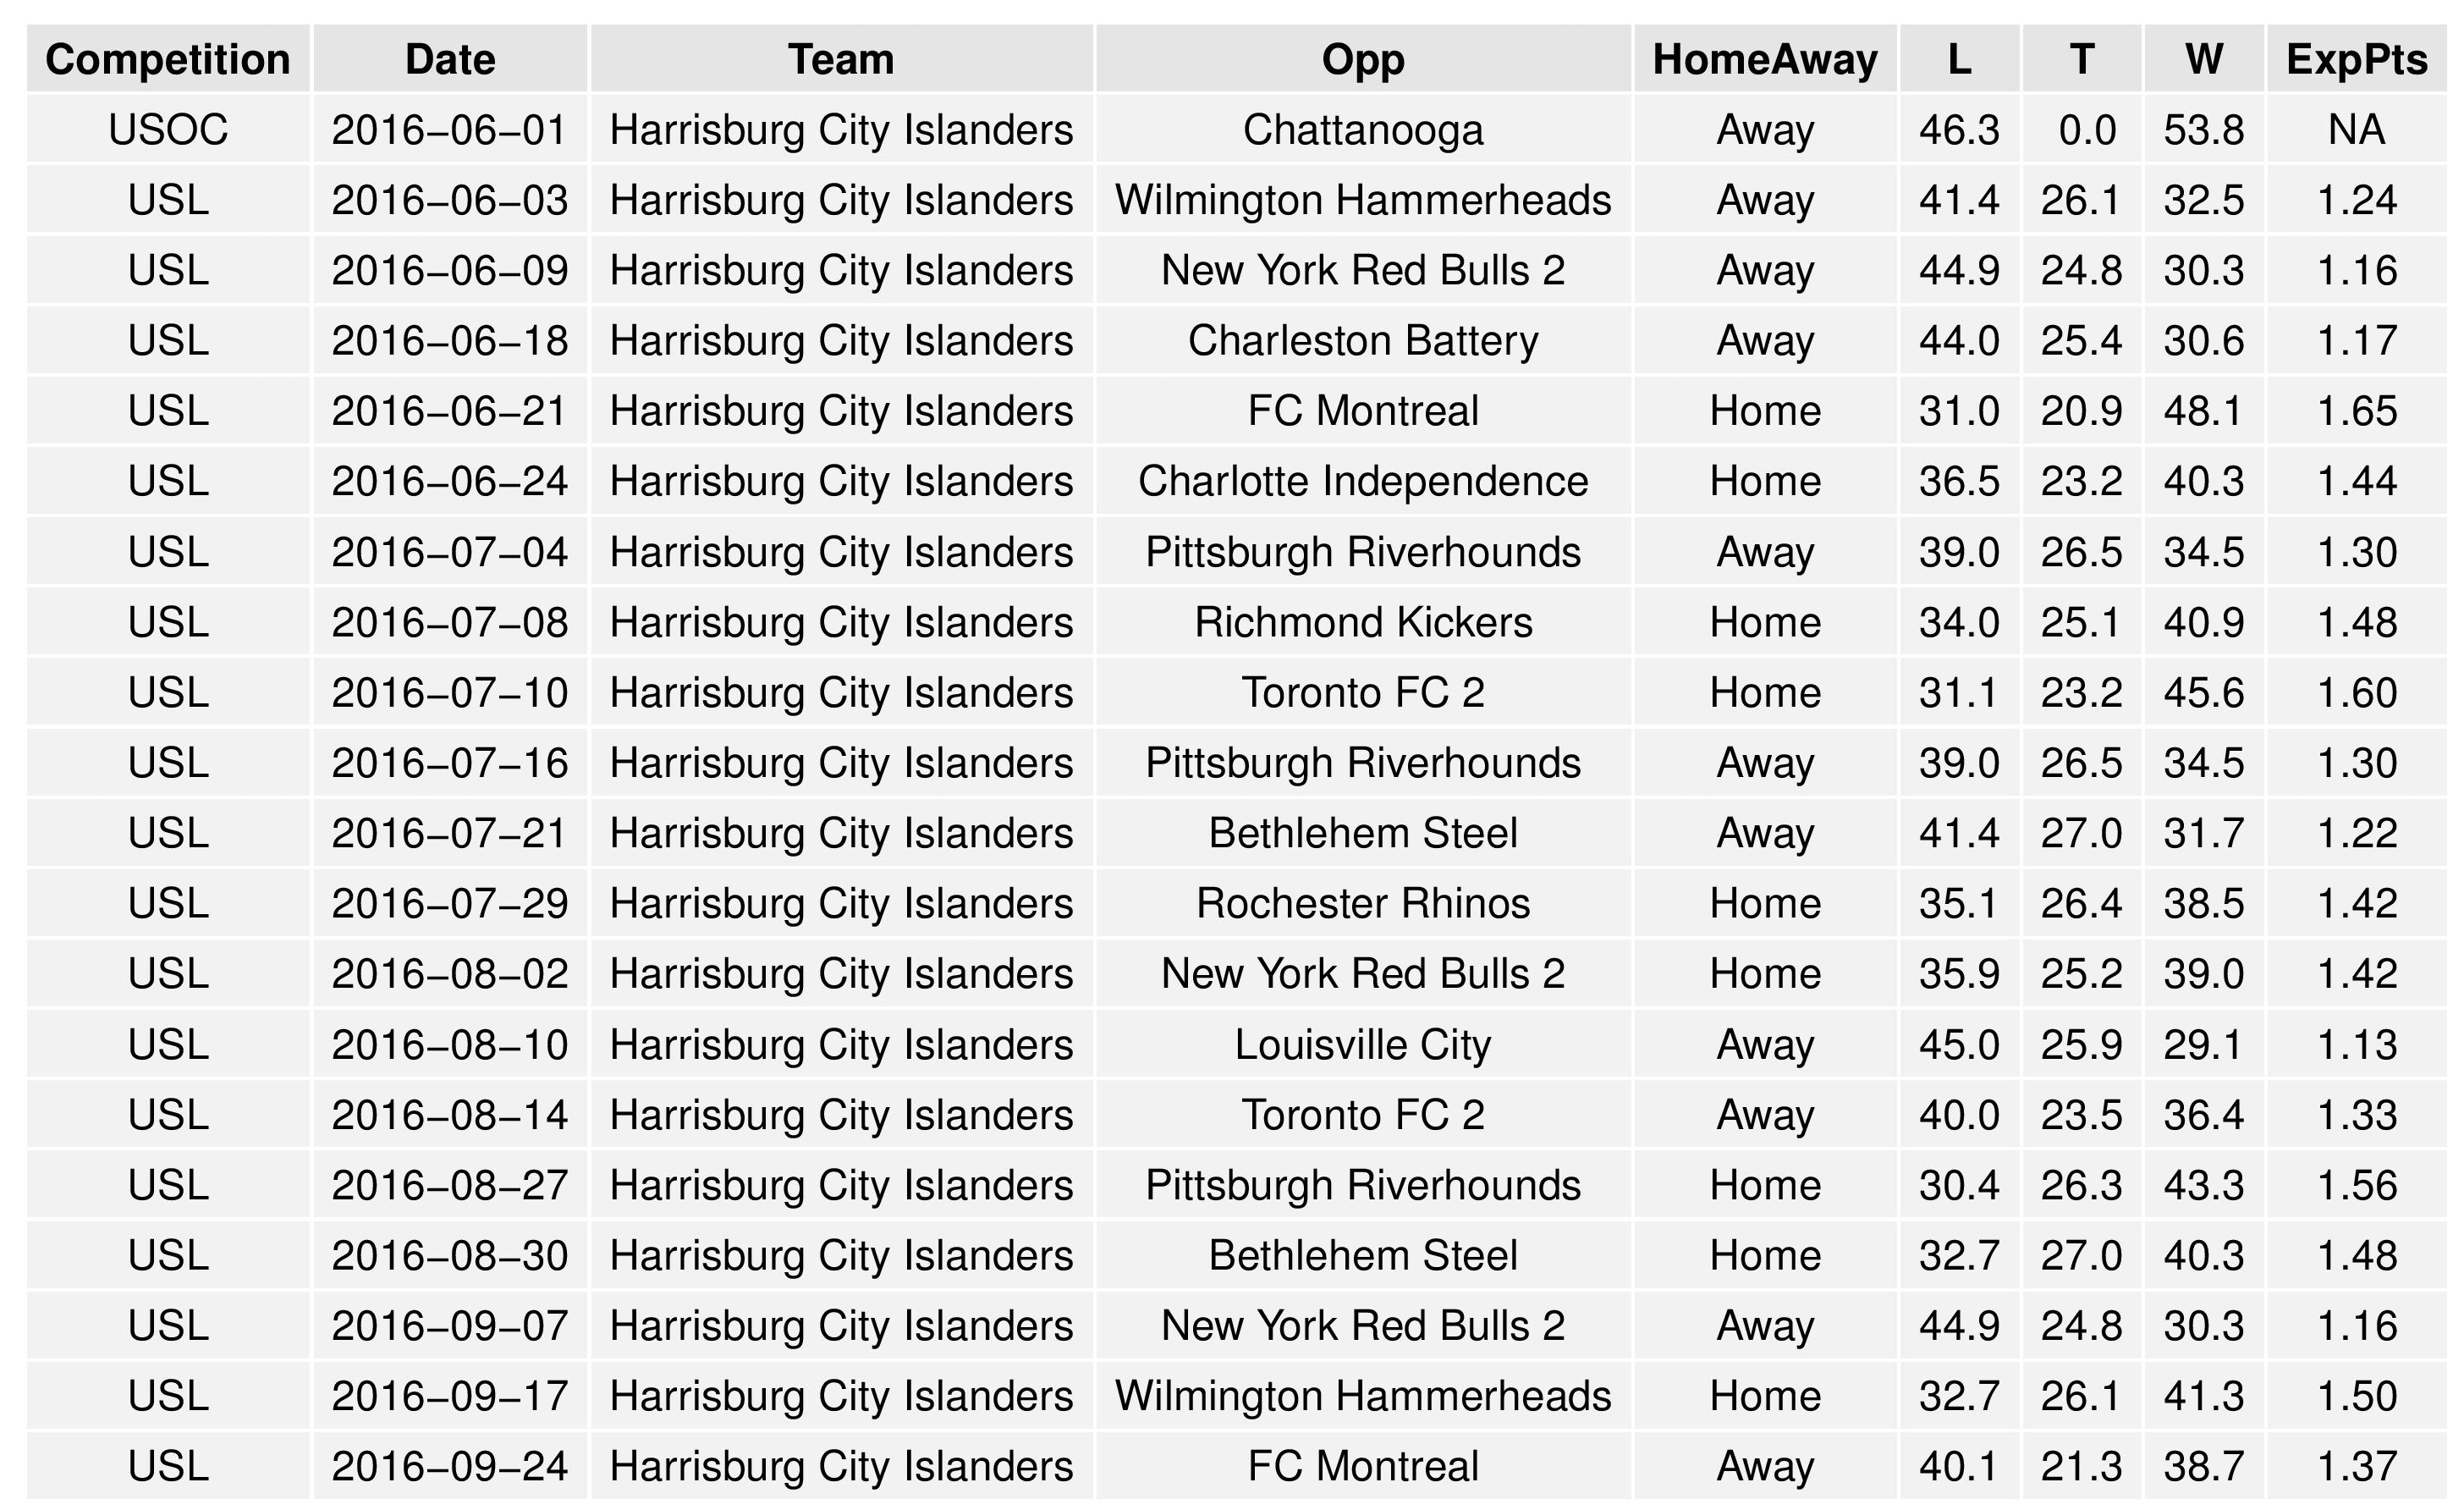
The following is the list of Philadelphia’s remaining scheduled matches accompanied by result probabilities as predicted by SEBA.
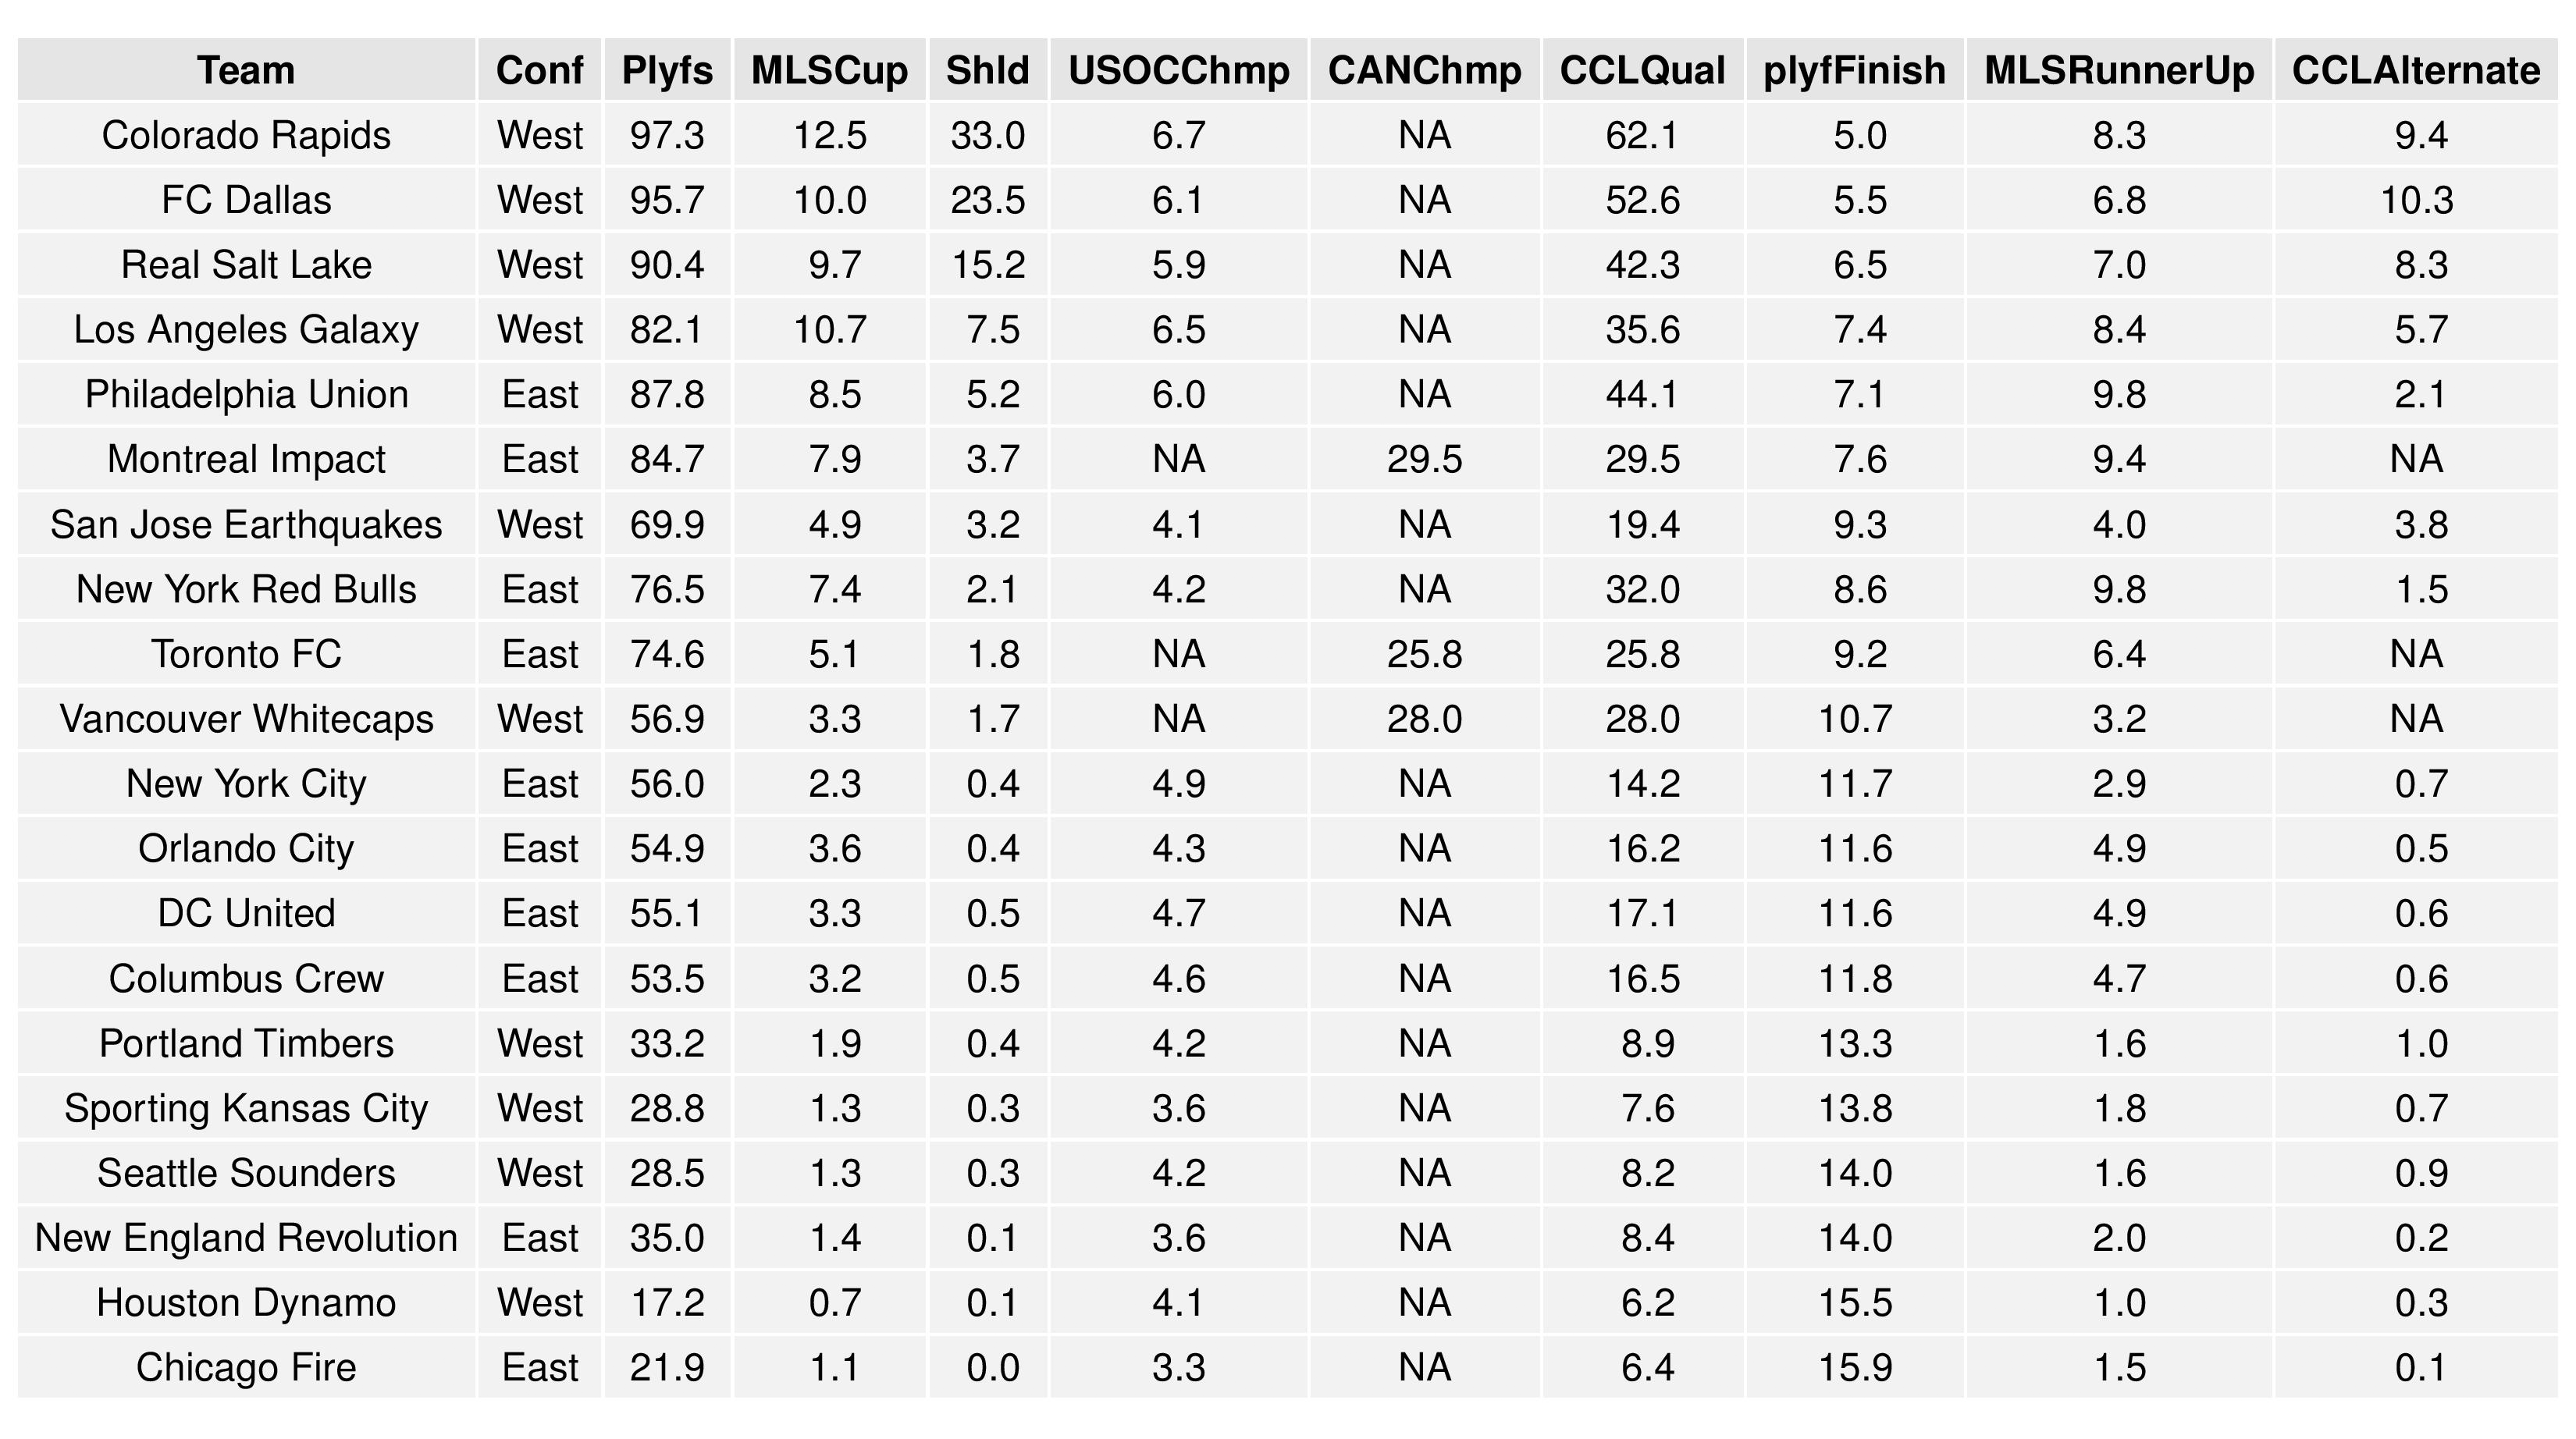
Finally, the charts below shows the average results of all the simulations and the probabilities associated with all of the above. The chart is broken up into two parts in order to better fit on your screen.
(Note: CCLAlternate refers to qualifying for CONCACAF Champions League non-traditionally. U.S. teams qualify by winning the MLS Cup, winning the Supporters’ Shield, winning the Conference in the regular season, and by winning the U.S. Open Cup. If a Canadian team wins any of these or a U.S. team wins more than one, the extra slots are filled by top regular season performers.)
USL Projections (through May 29)
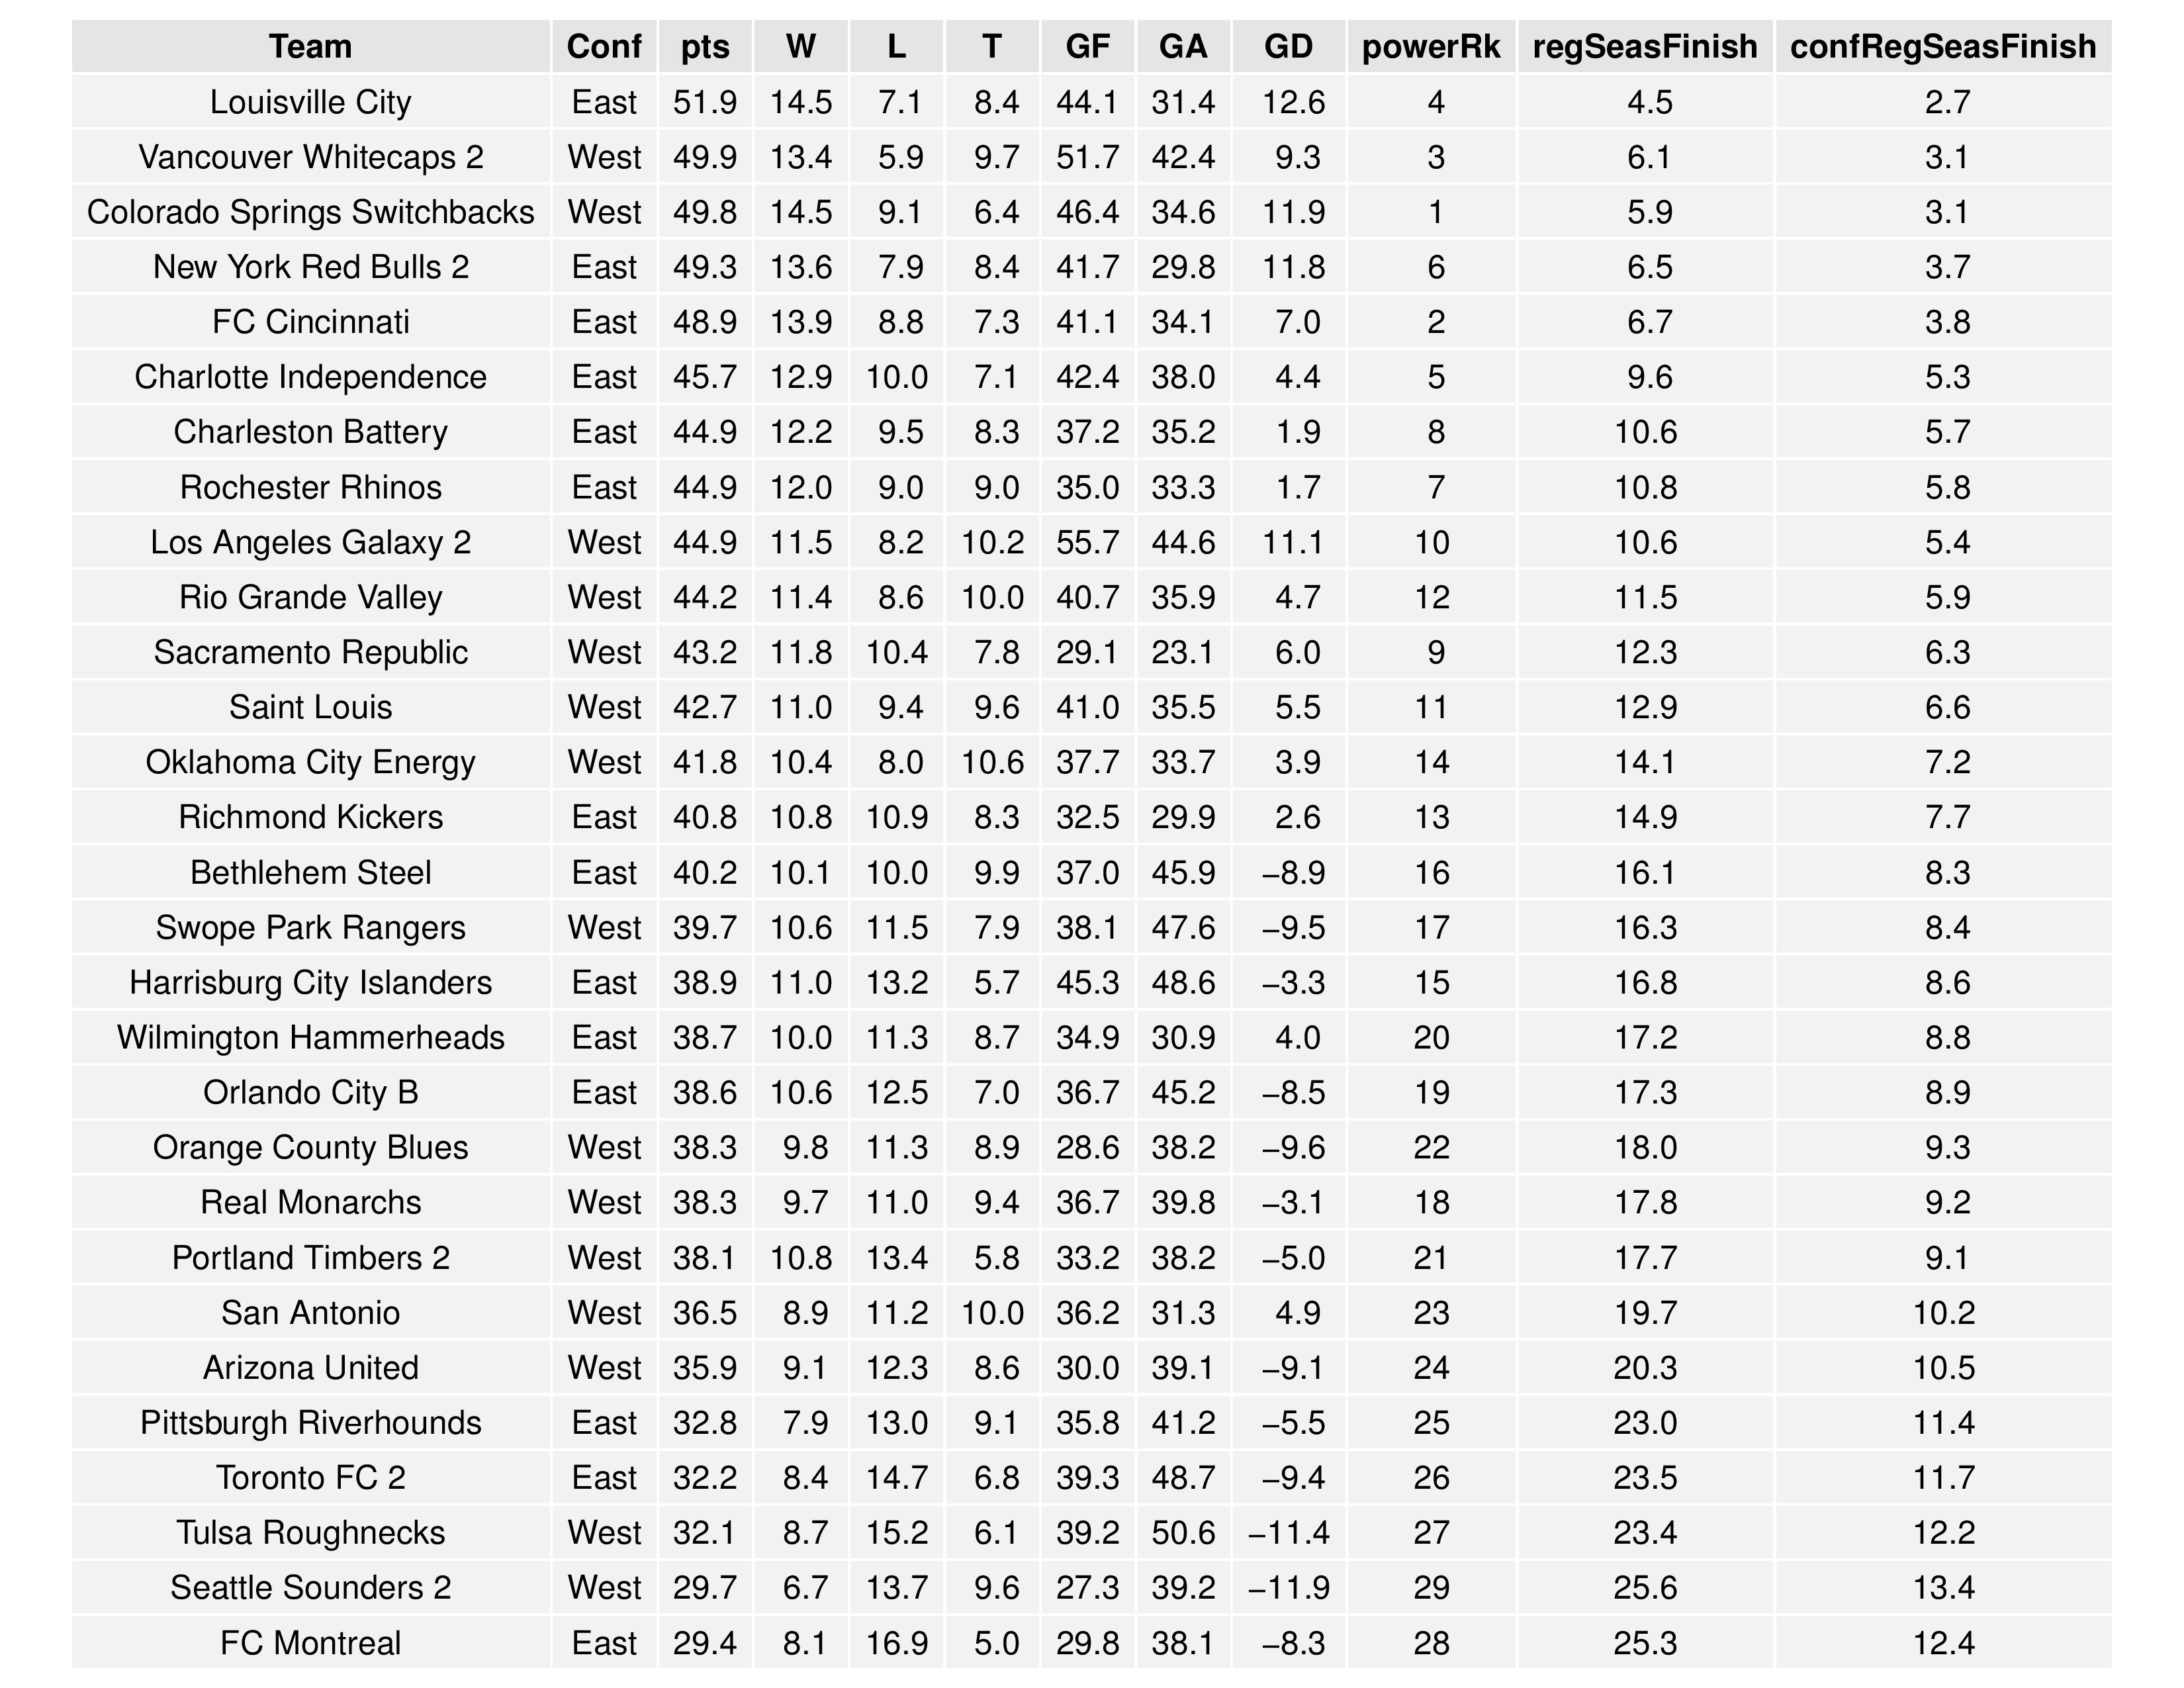
Bethlehem moves up from 17th to 16th and Harrisburg City remains at 15th.
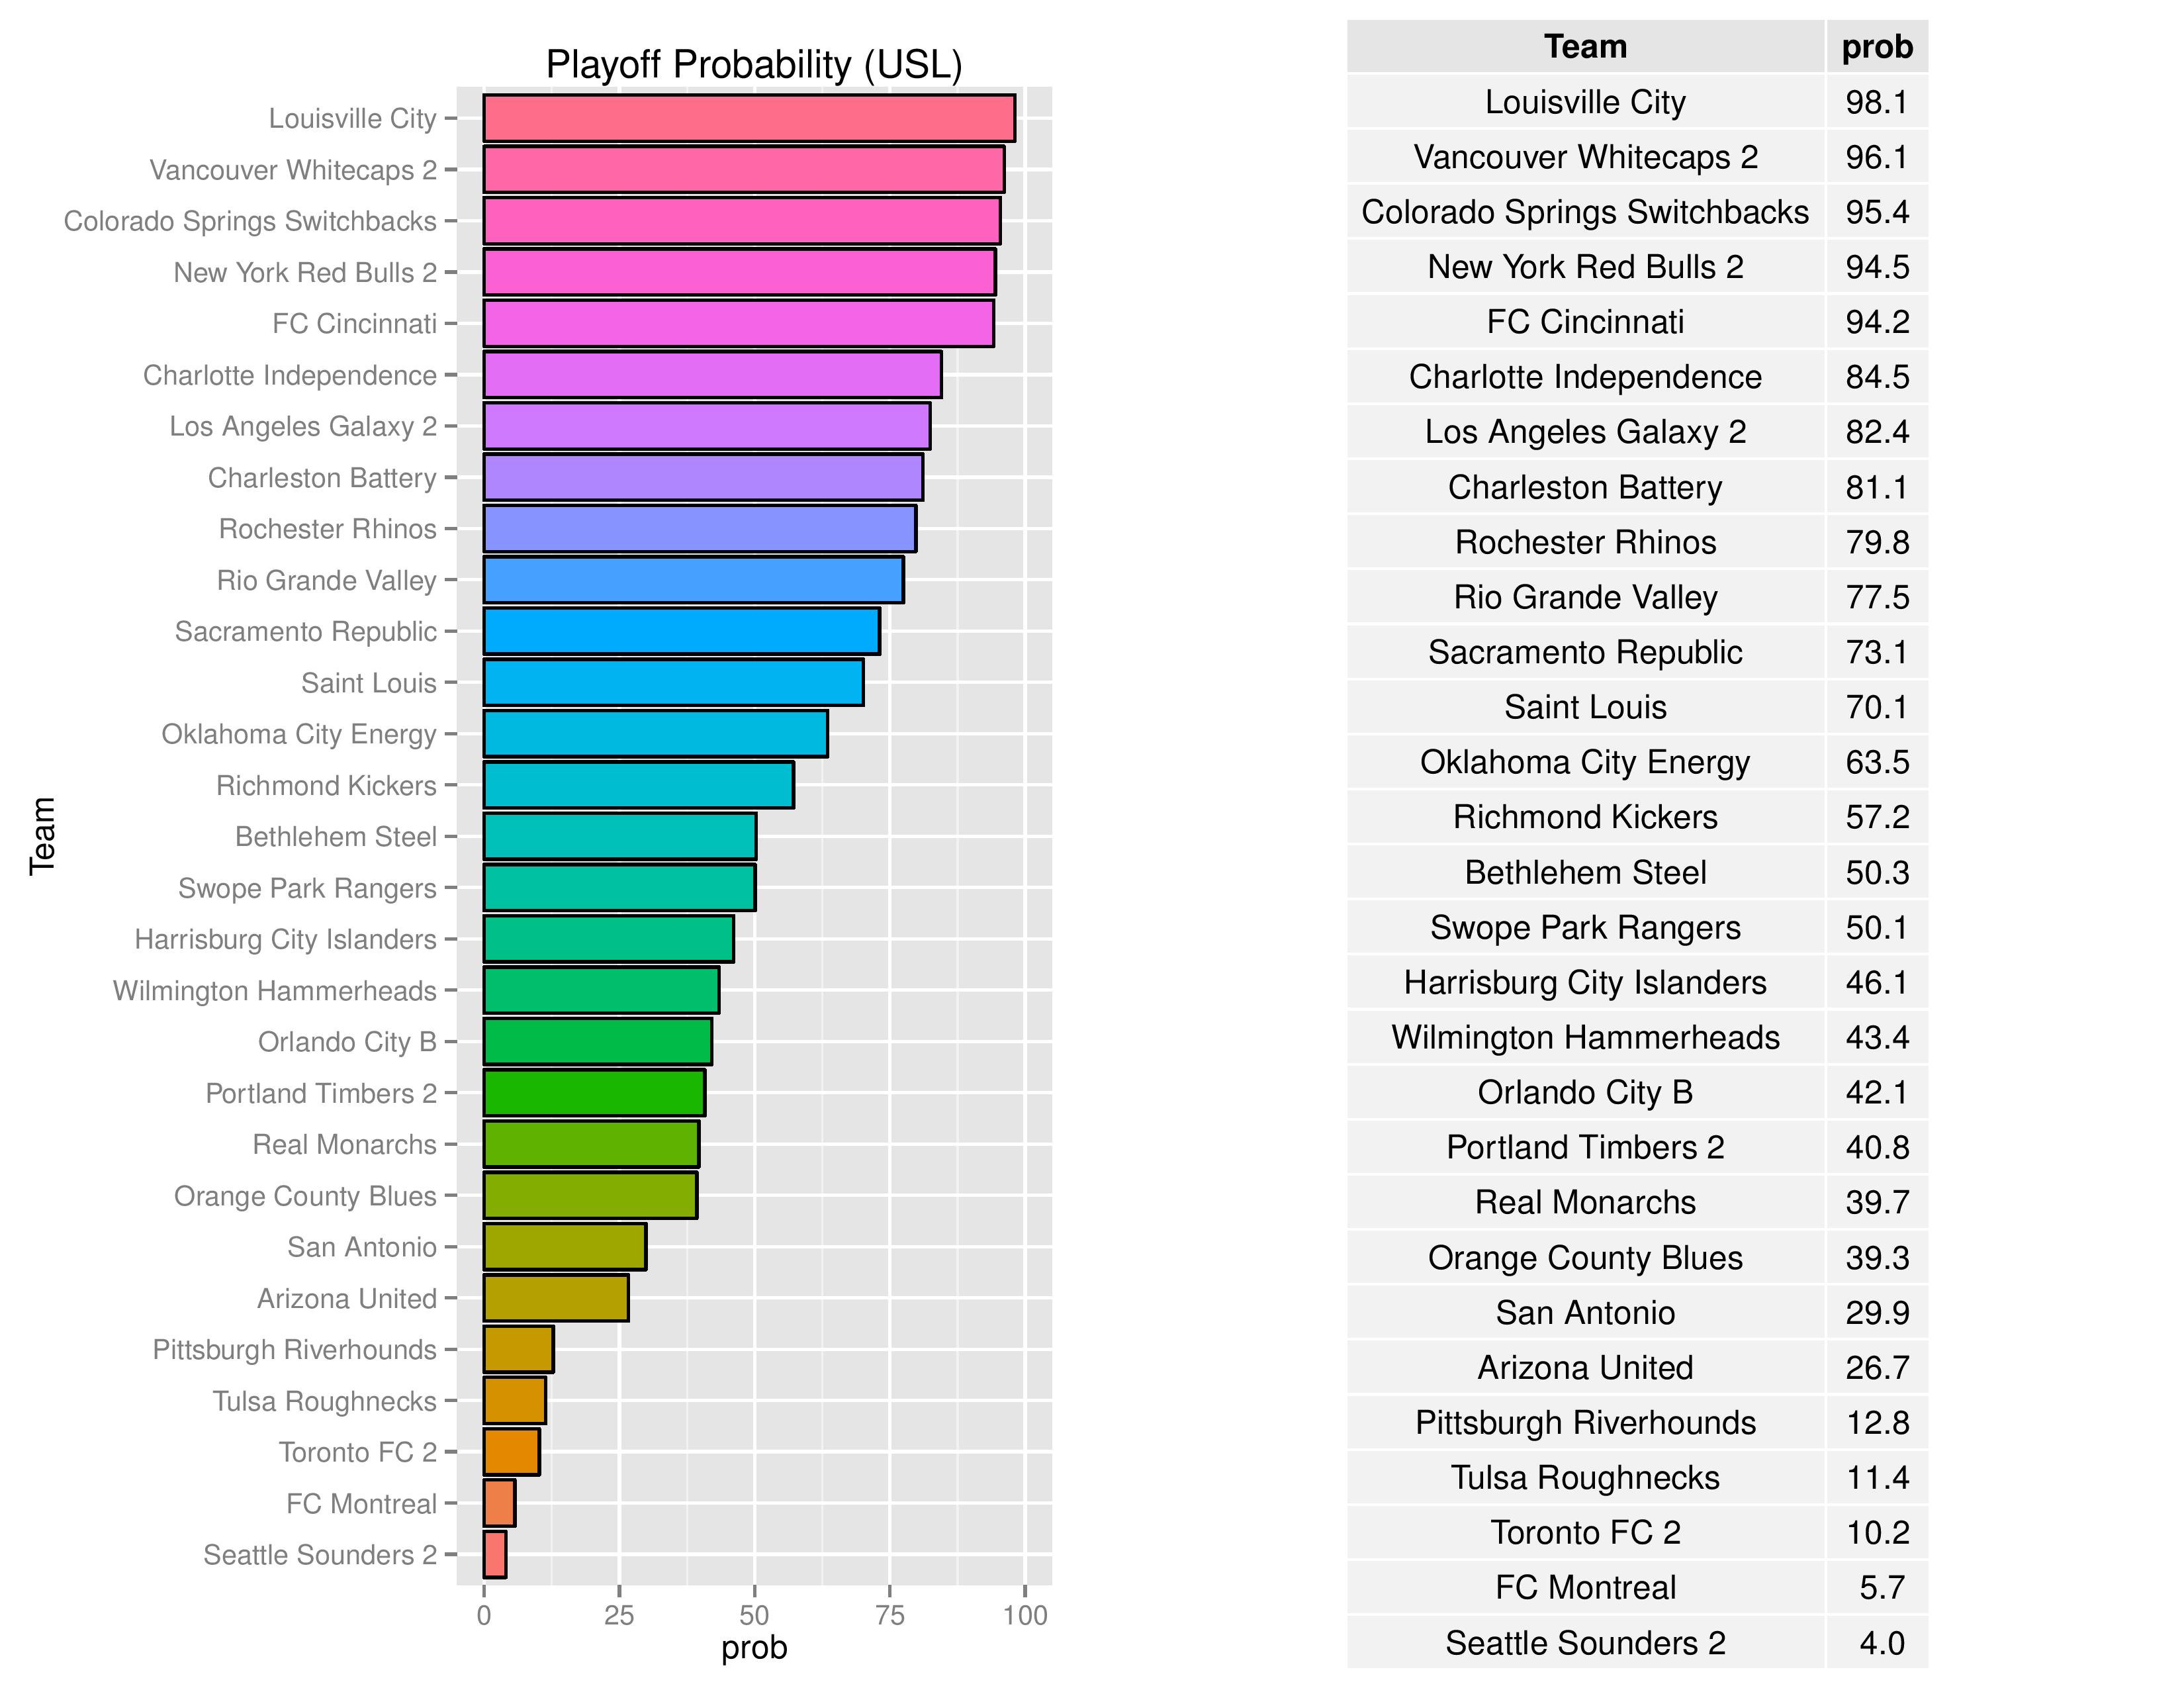
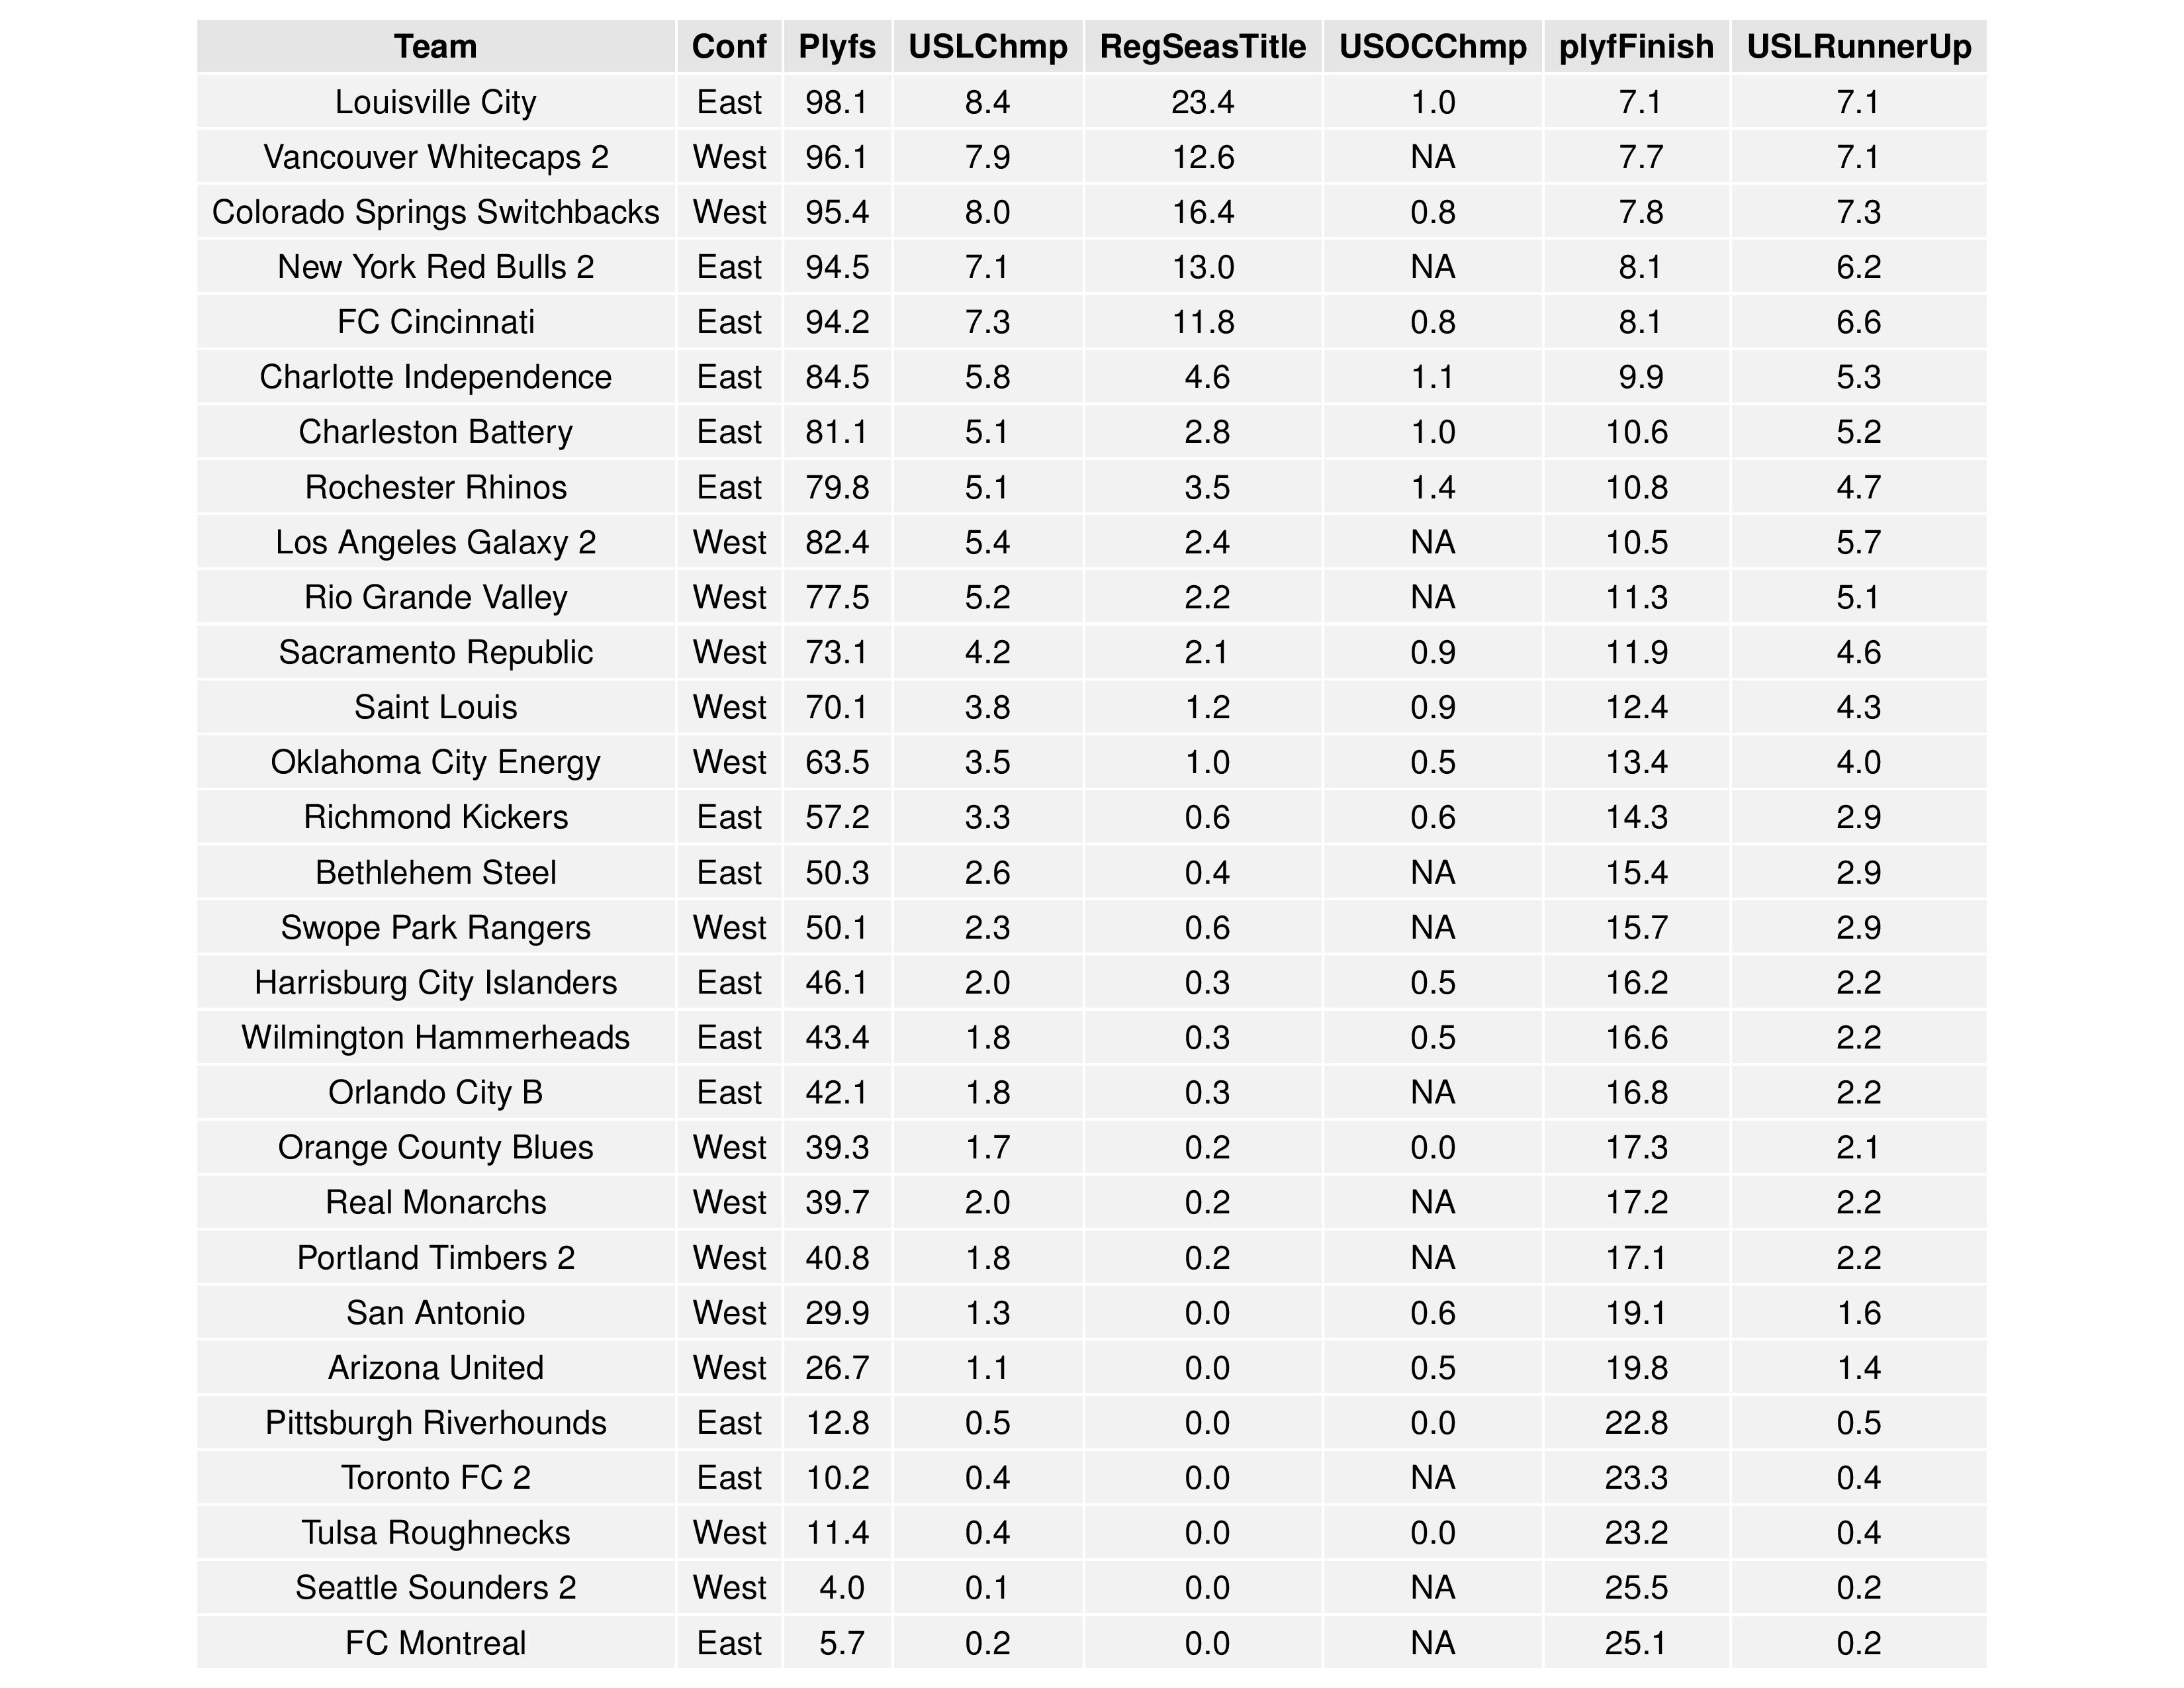
Bethlehem’s probability went down slightly from 51.6% to 50.3% Harrisburg’s chances went up from 43.4% to 46.1%.
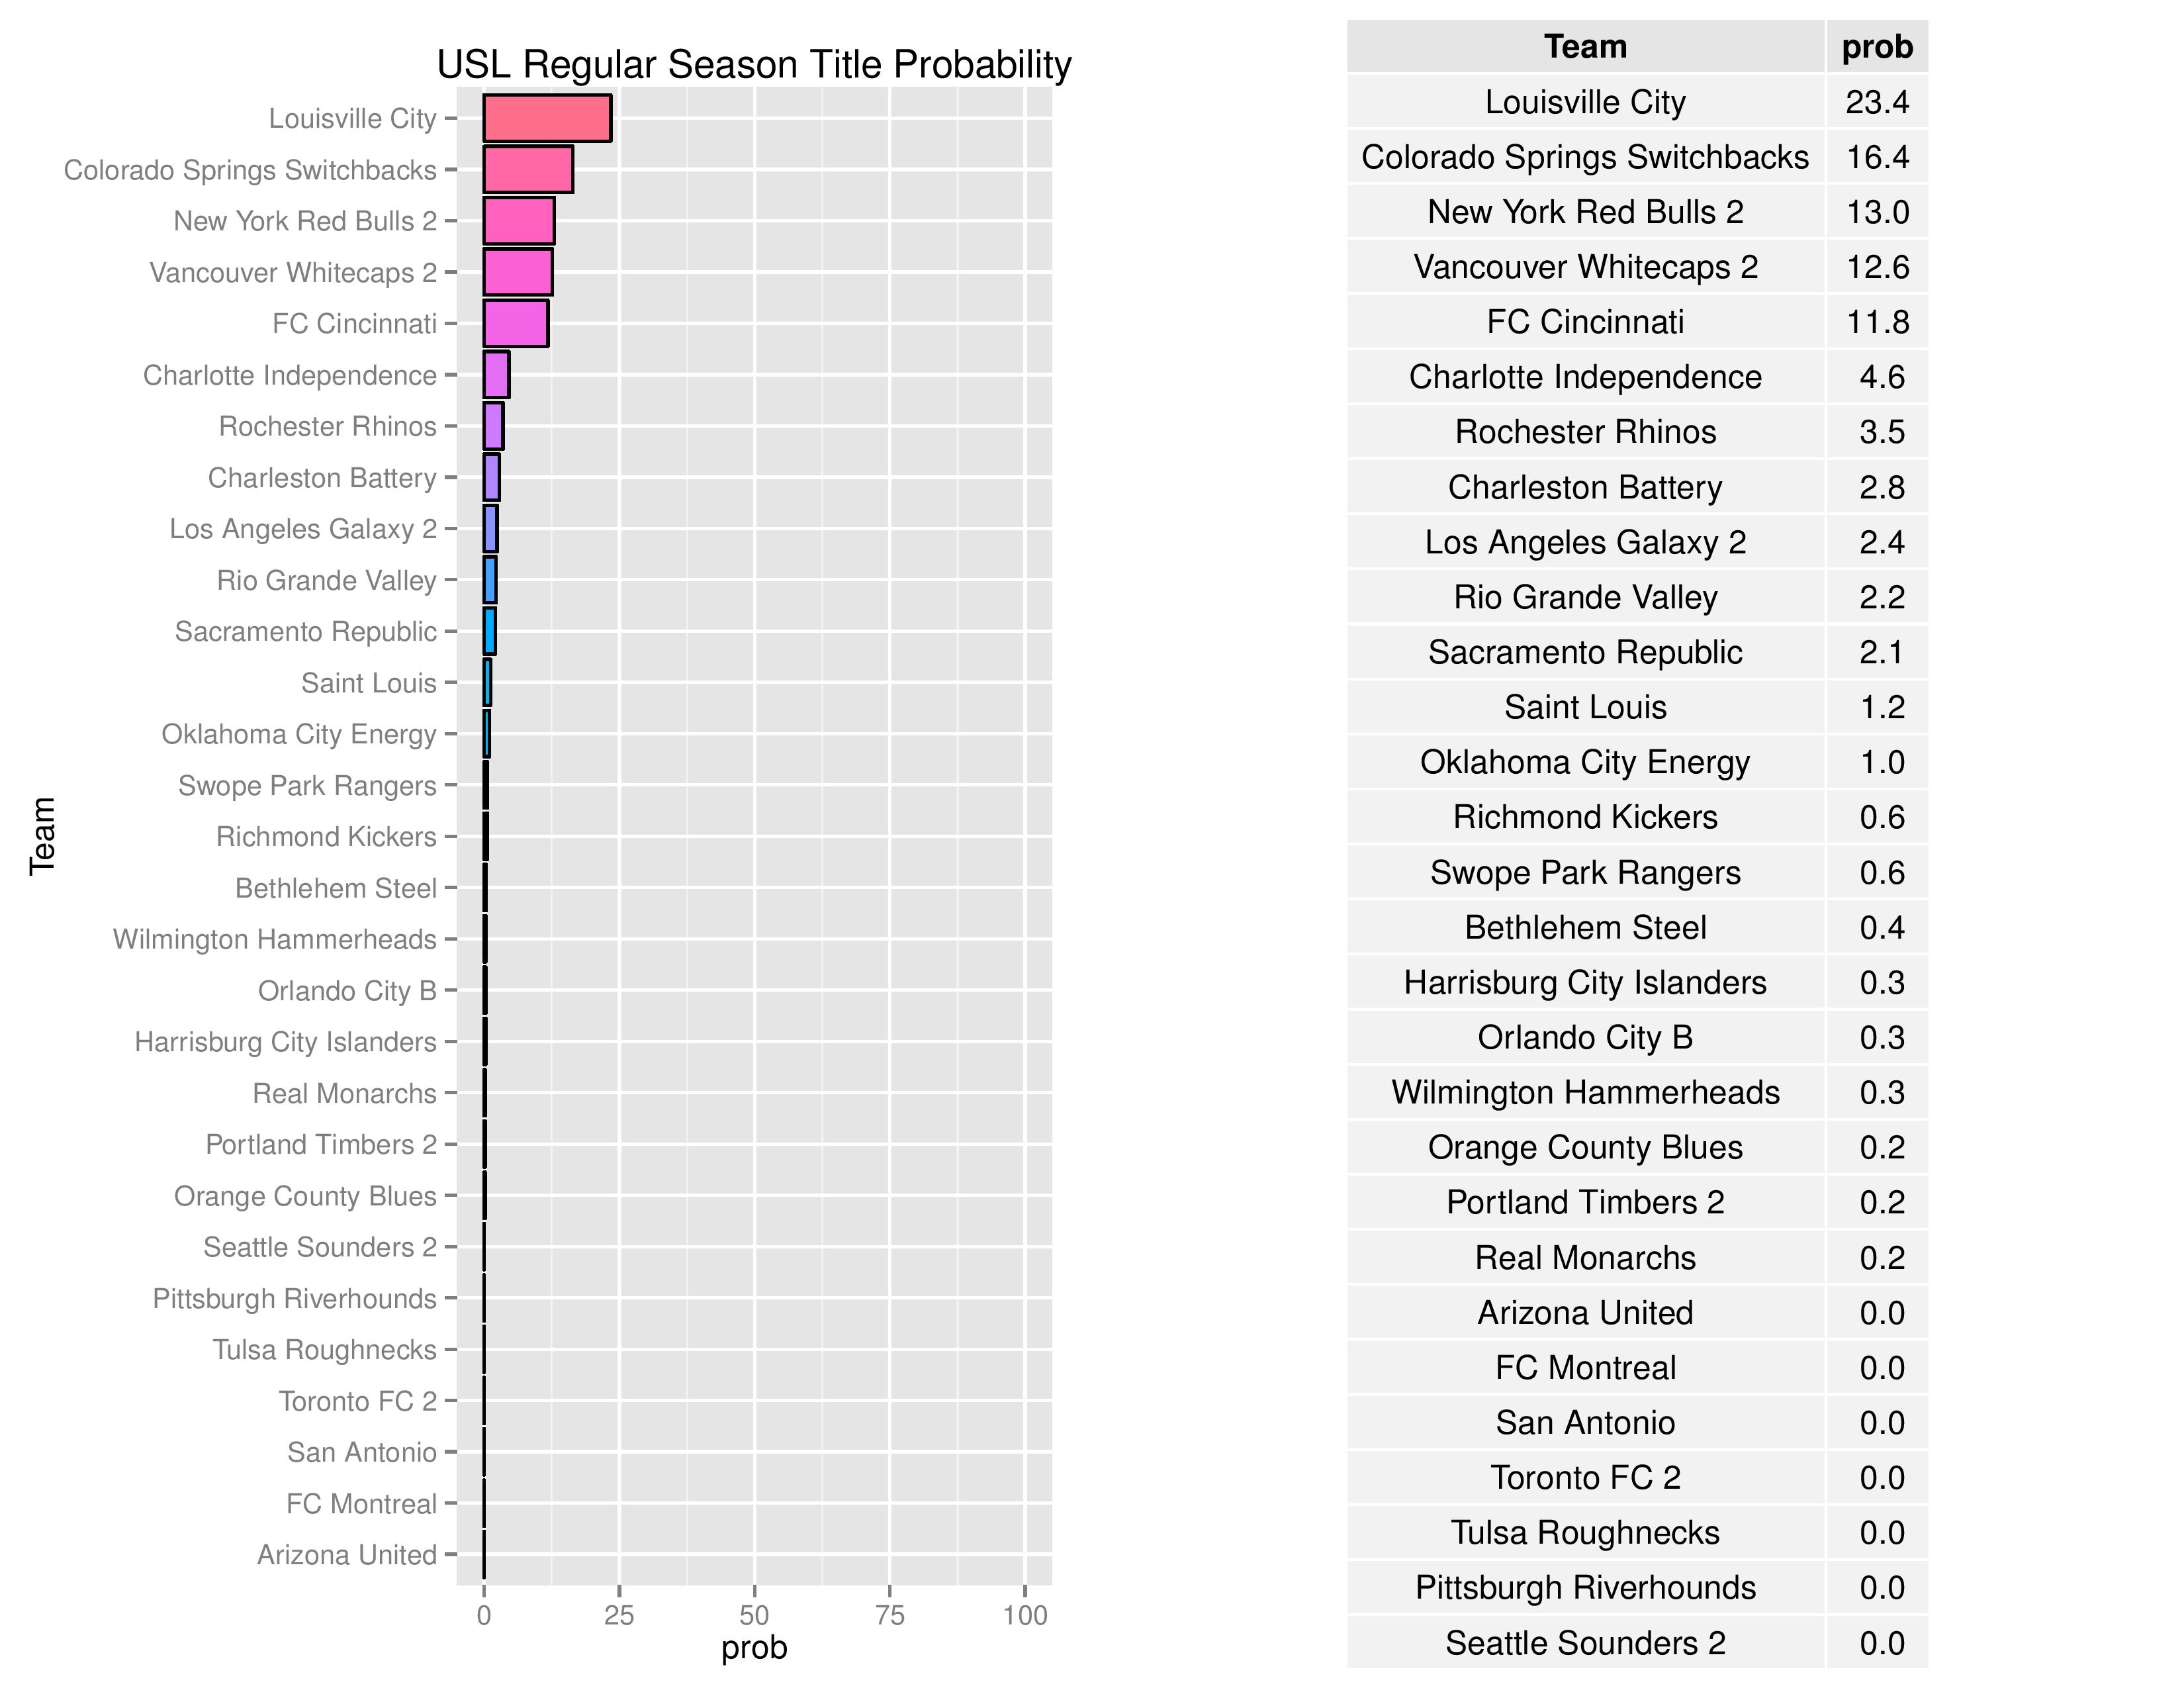
Neither Bethlehem nor Harrisburg changed significantly from last week in their Title chances.

USL’s single-game playoff format (with no byes) definitely allows luck to play a greater role in determining the USL Cup victor. Bethlehem’s chances improved from 2.3% to 2.6%. Harrisburg’s chances improved from 1.6% to 2.0%.
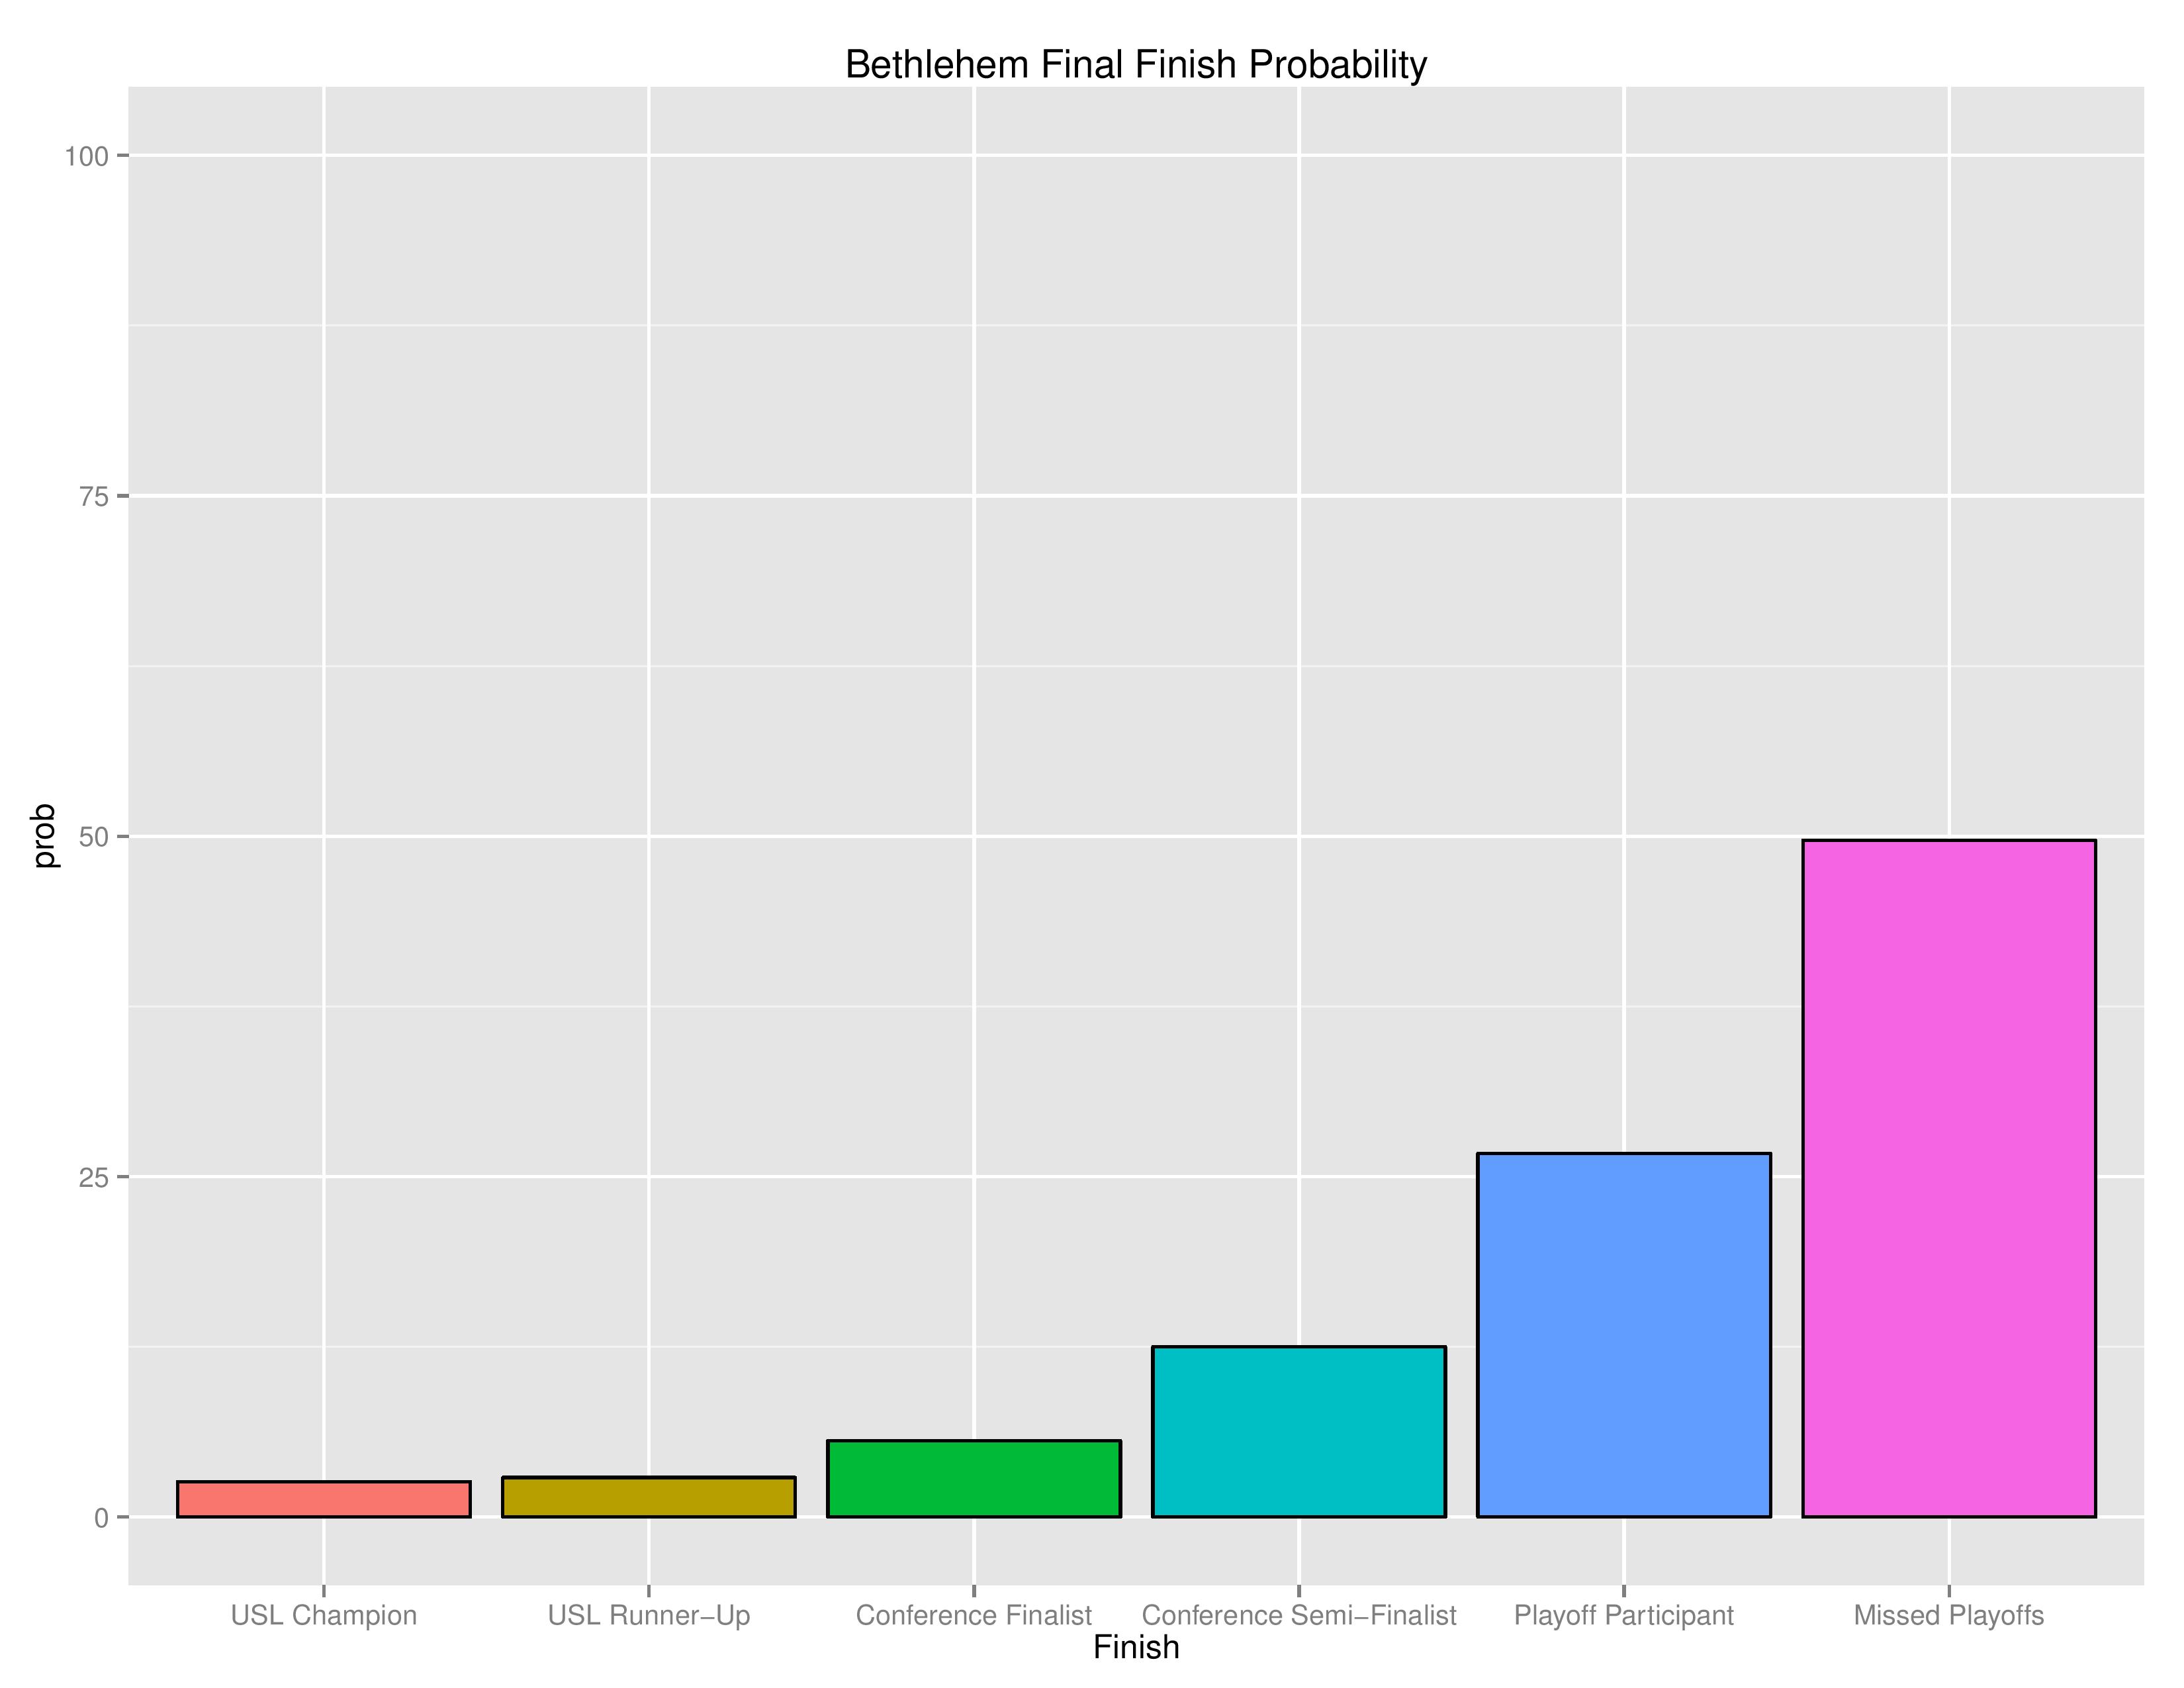
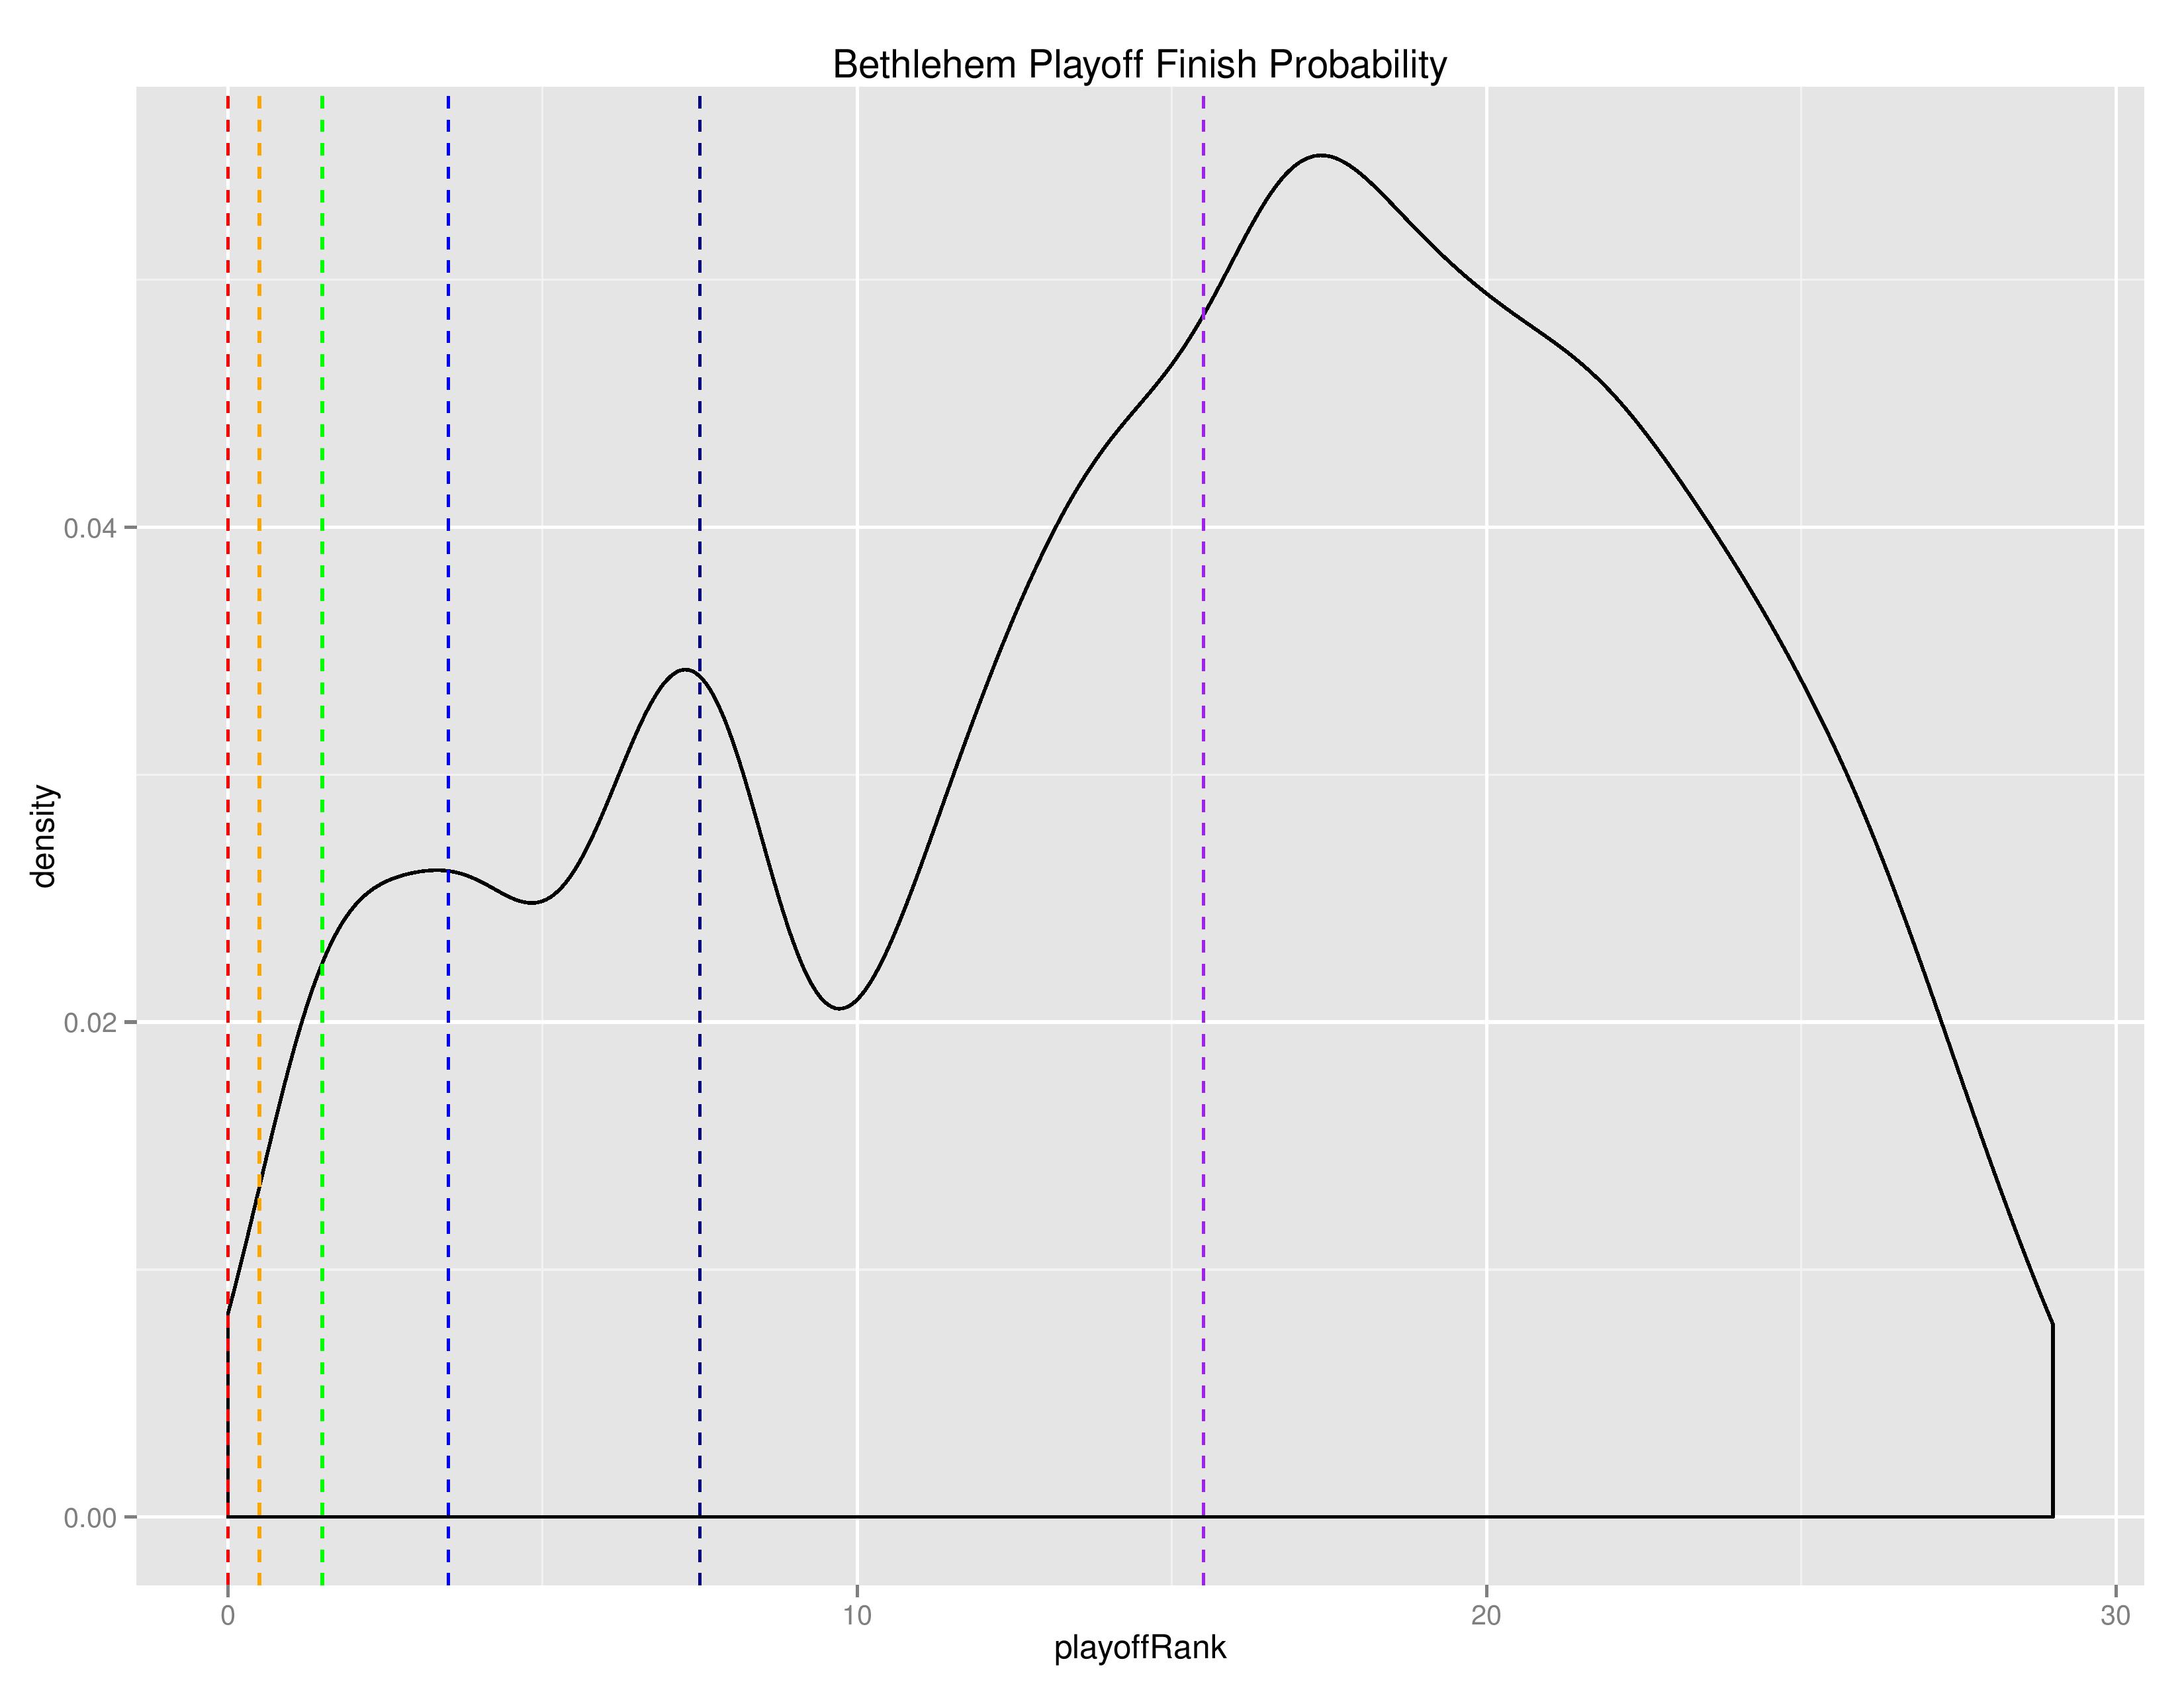
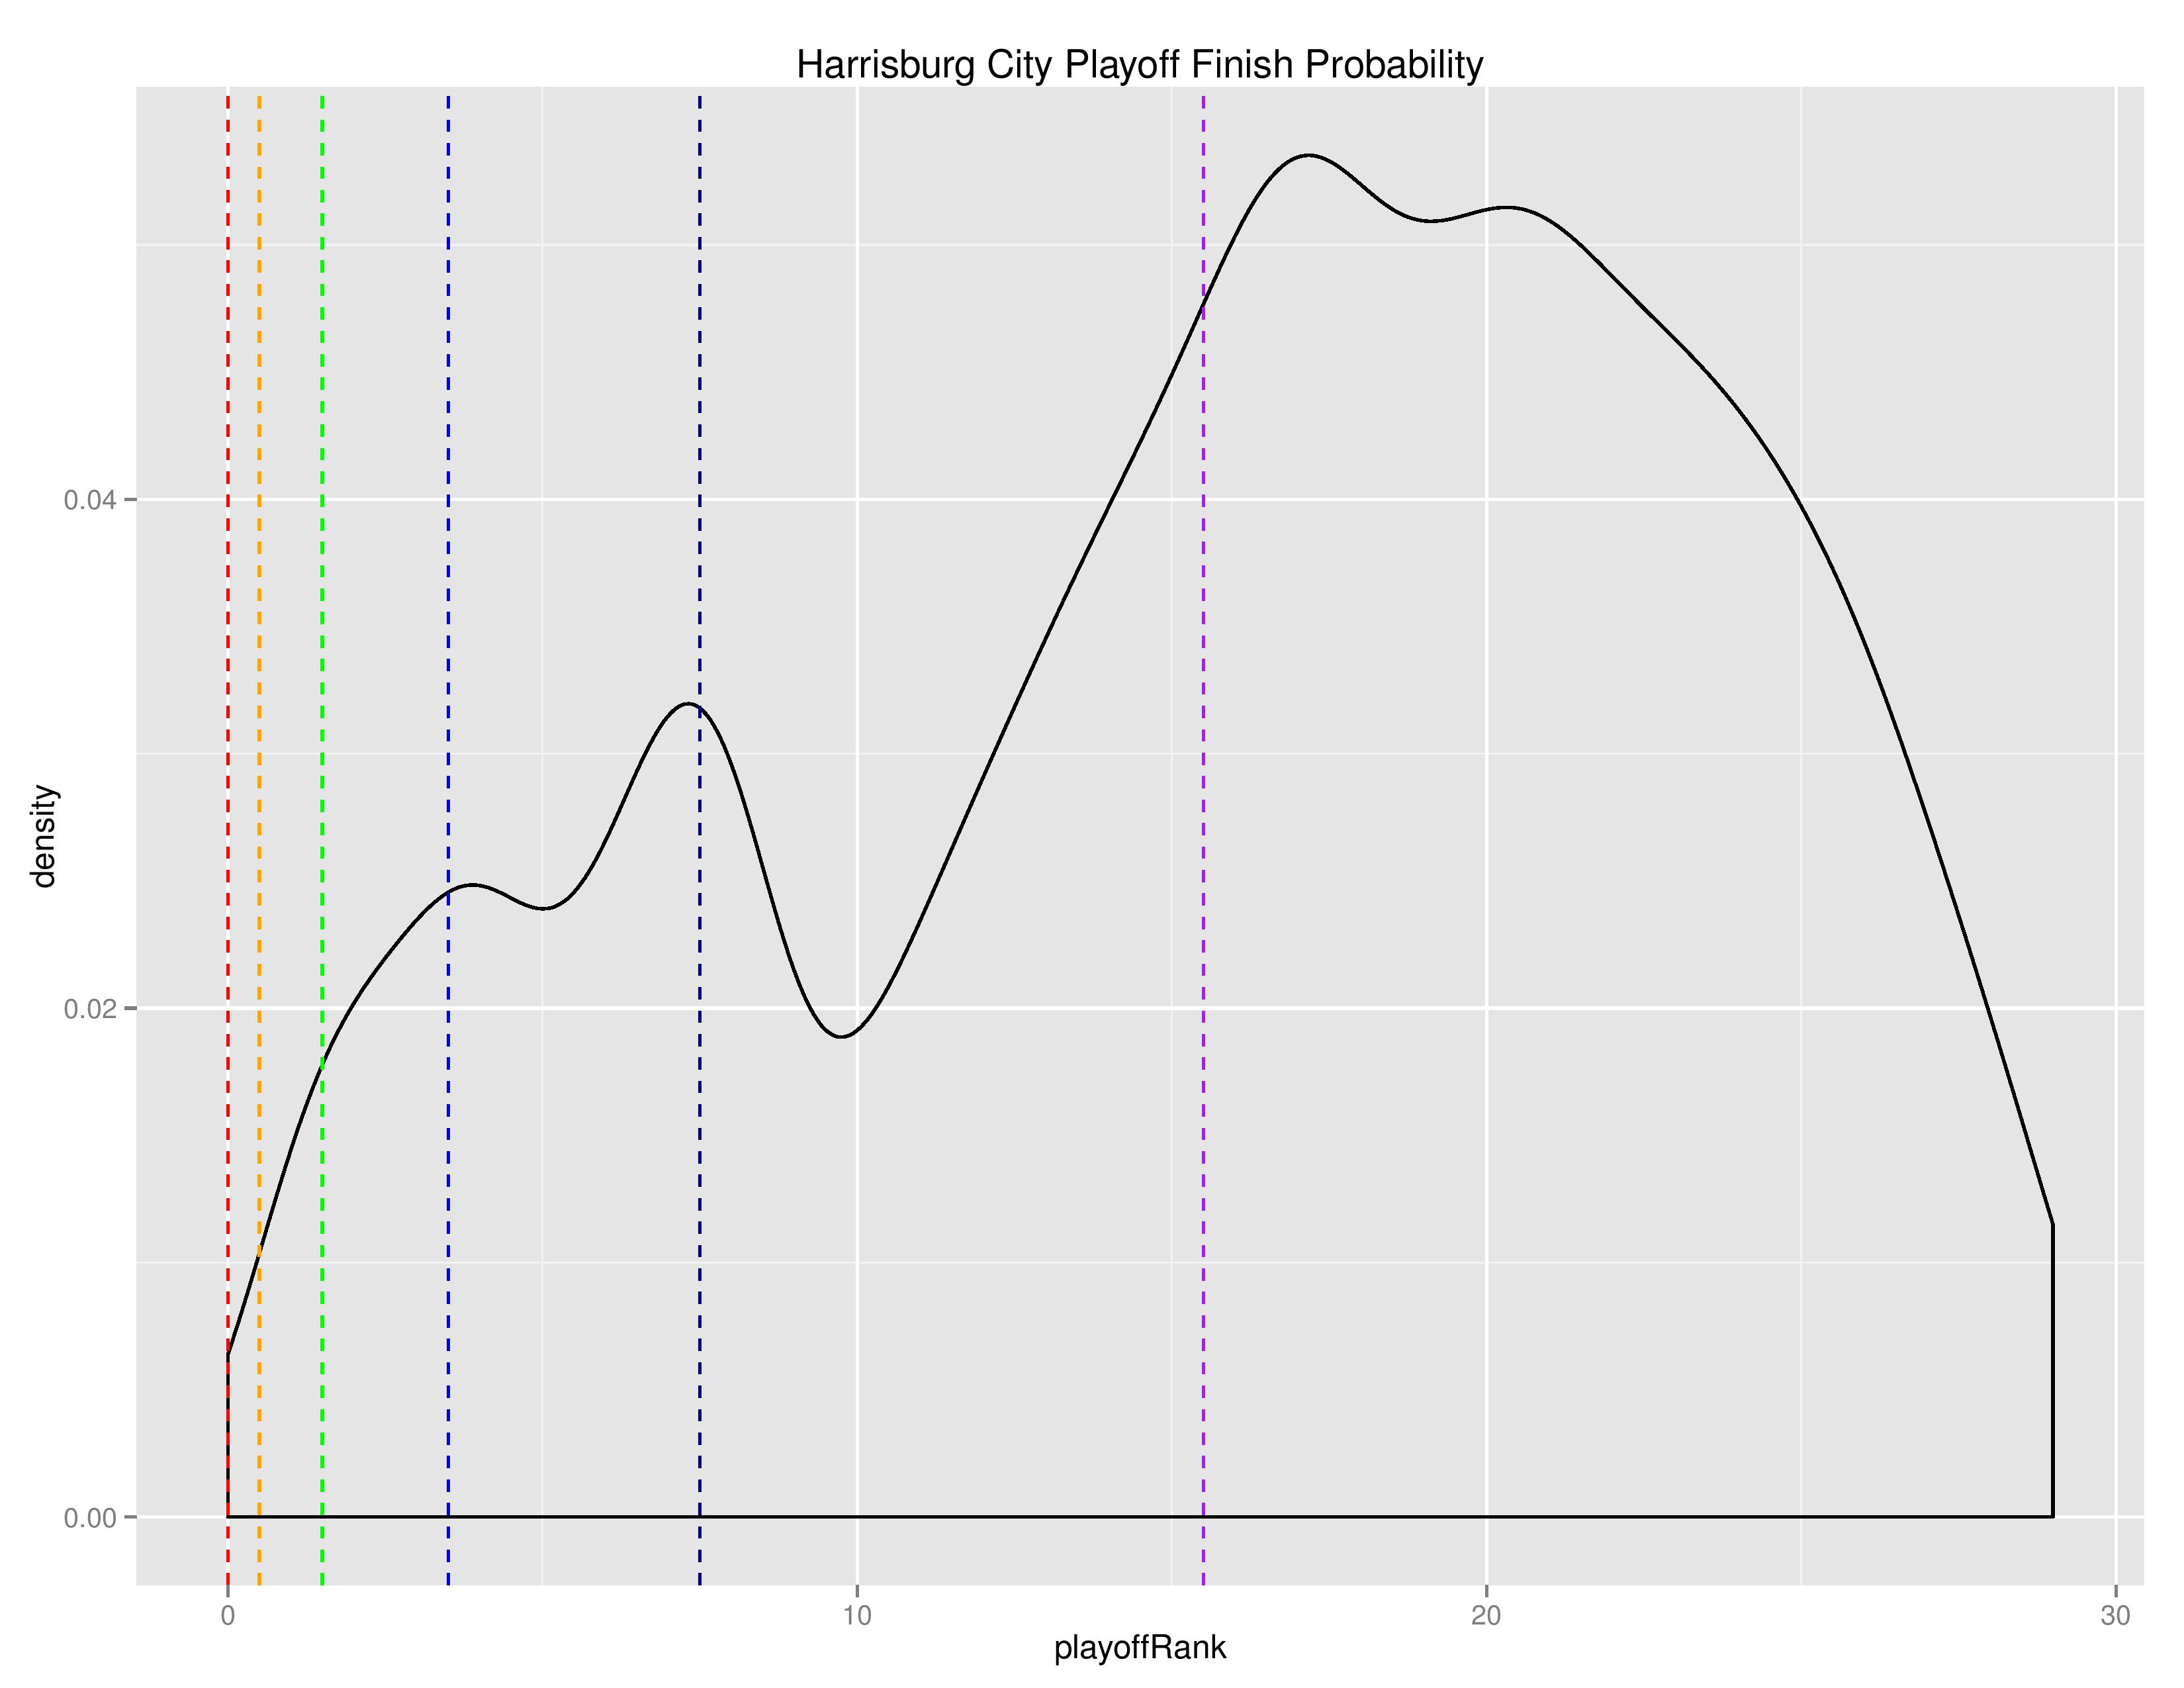
As with MLS, the below density charts show the relative probabilities of Bethlehem and Harrisburg finishing for their final playoff-rank.
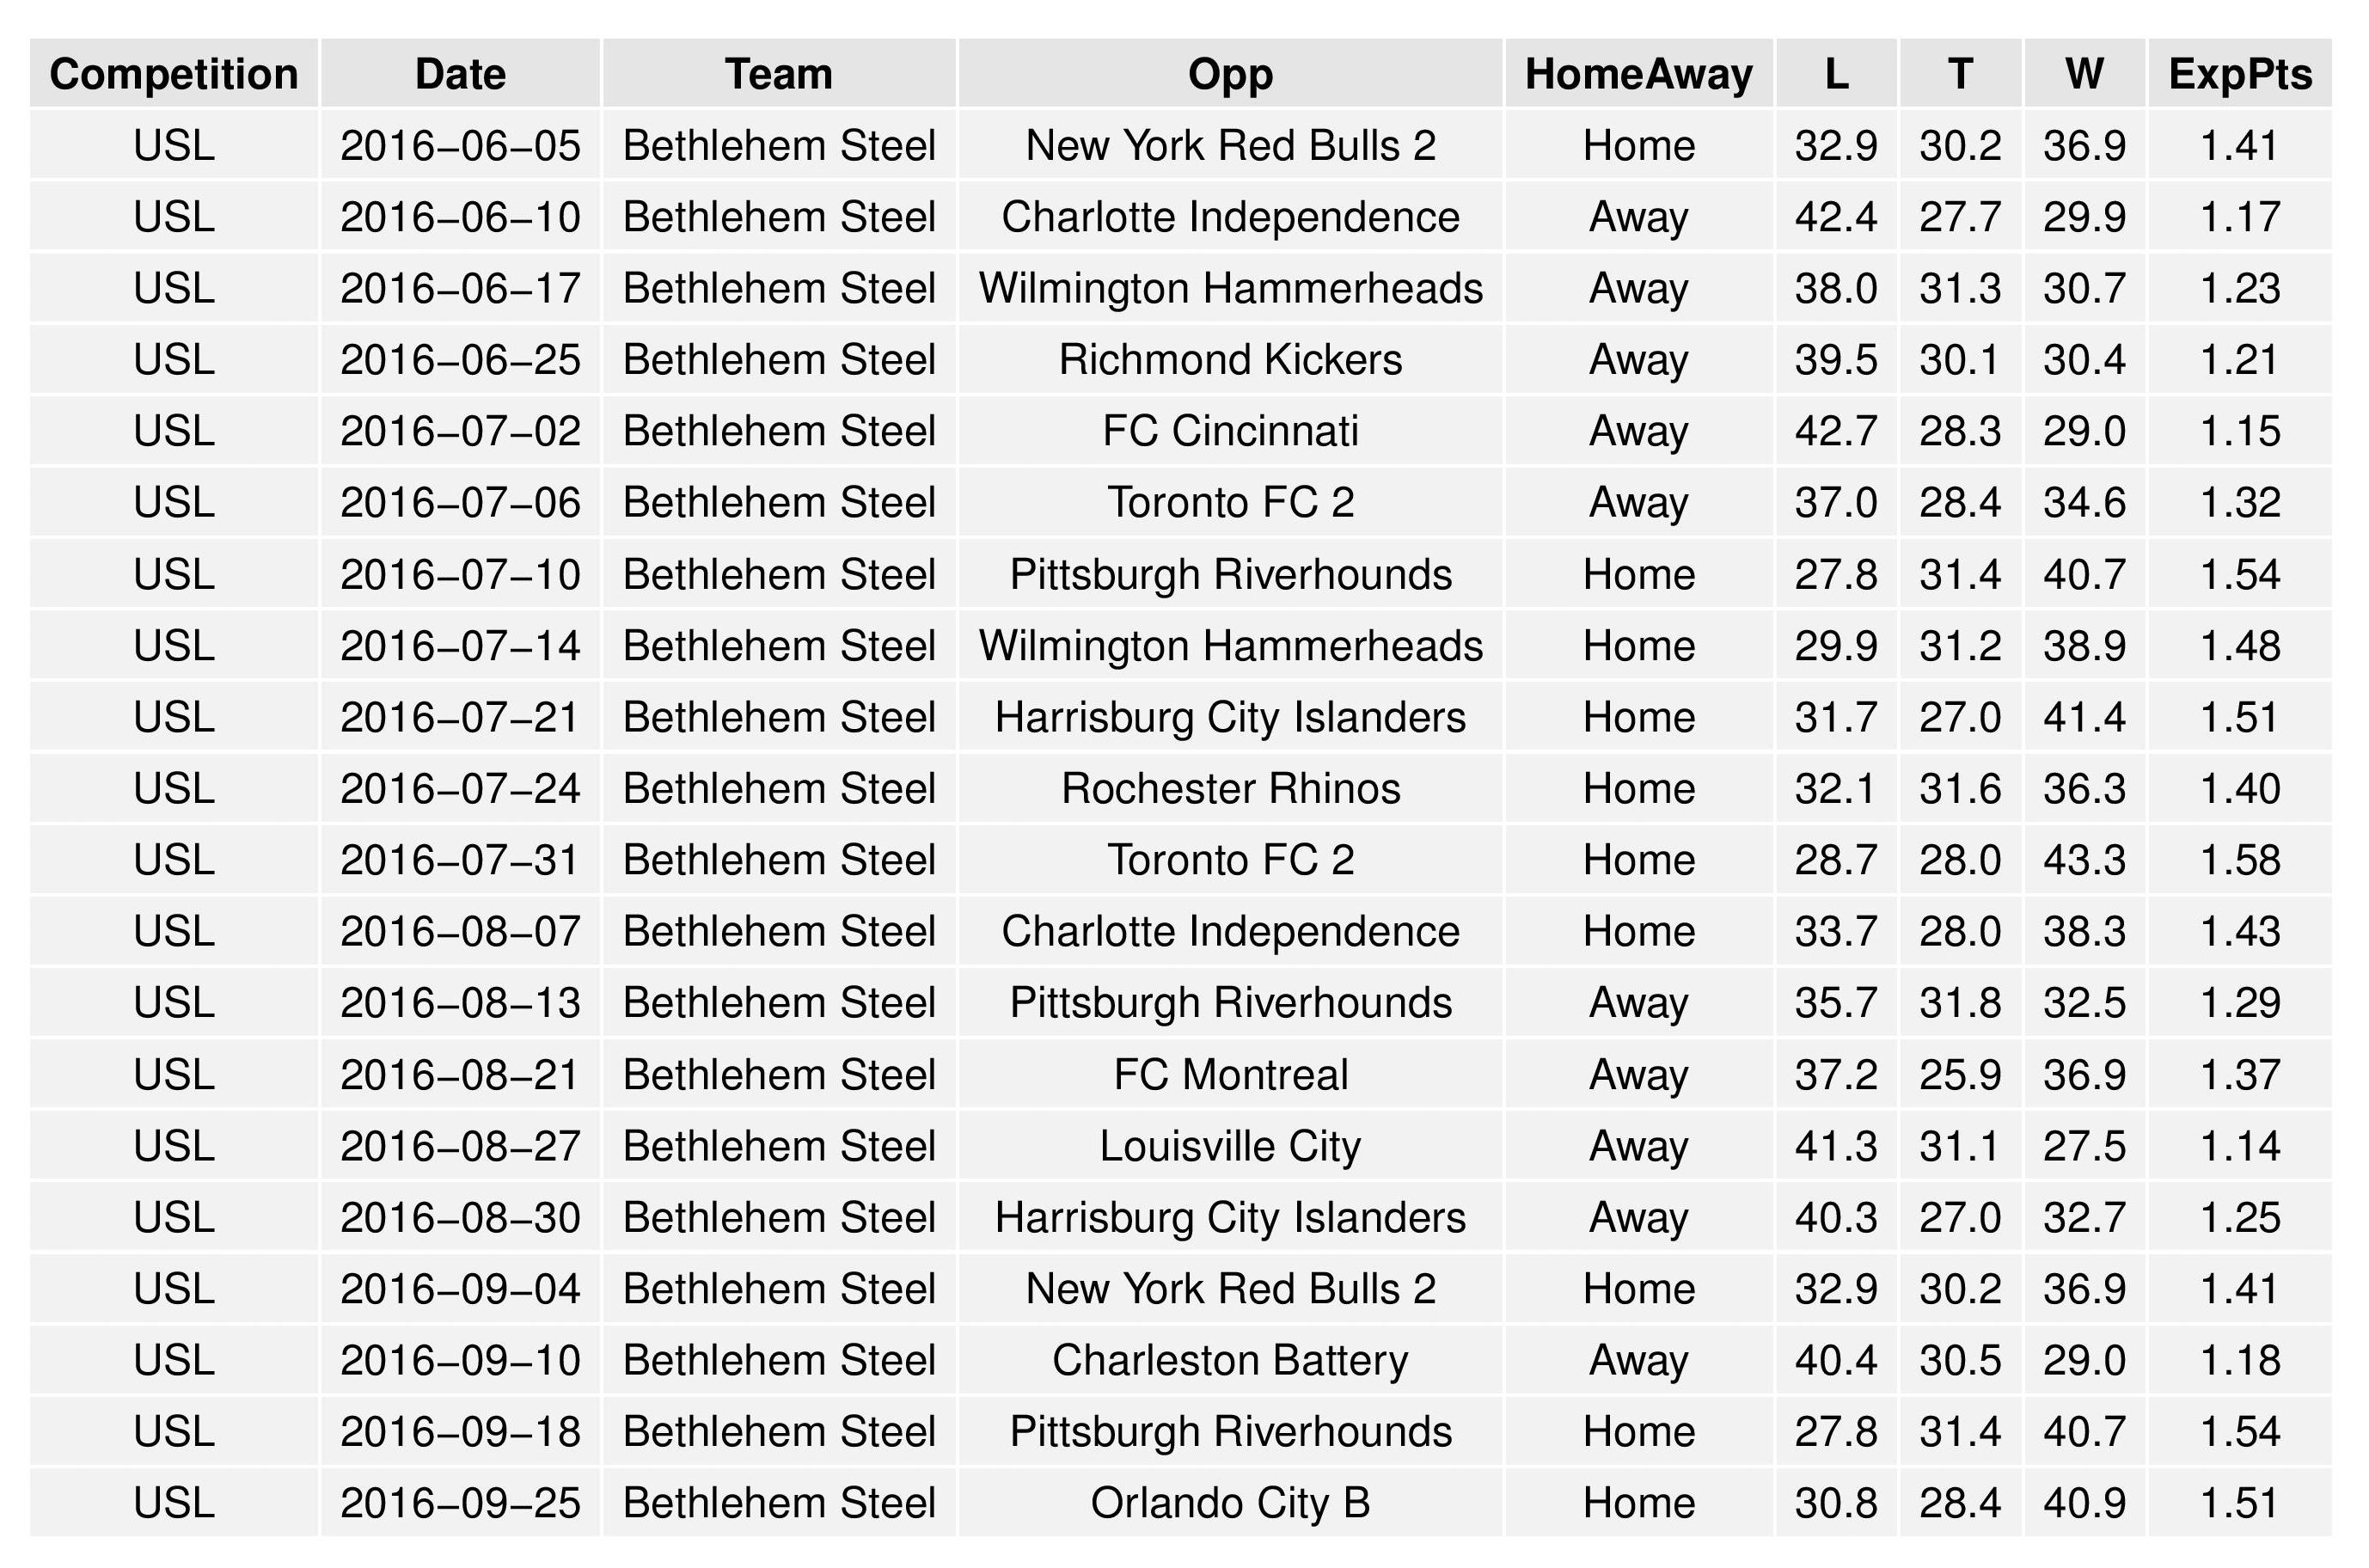
The following are the upcoming matches and associated probabilities for Bethlehem and Harrisburg.
As with the MLS post above, the following tables show the average simulation results. They are divided into two tables to present better to your screen.
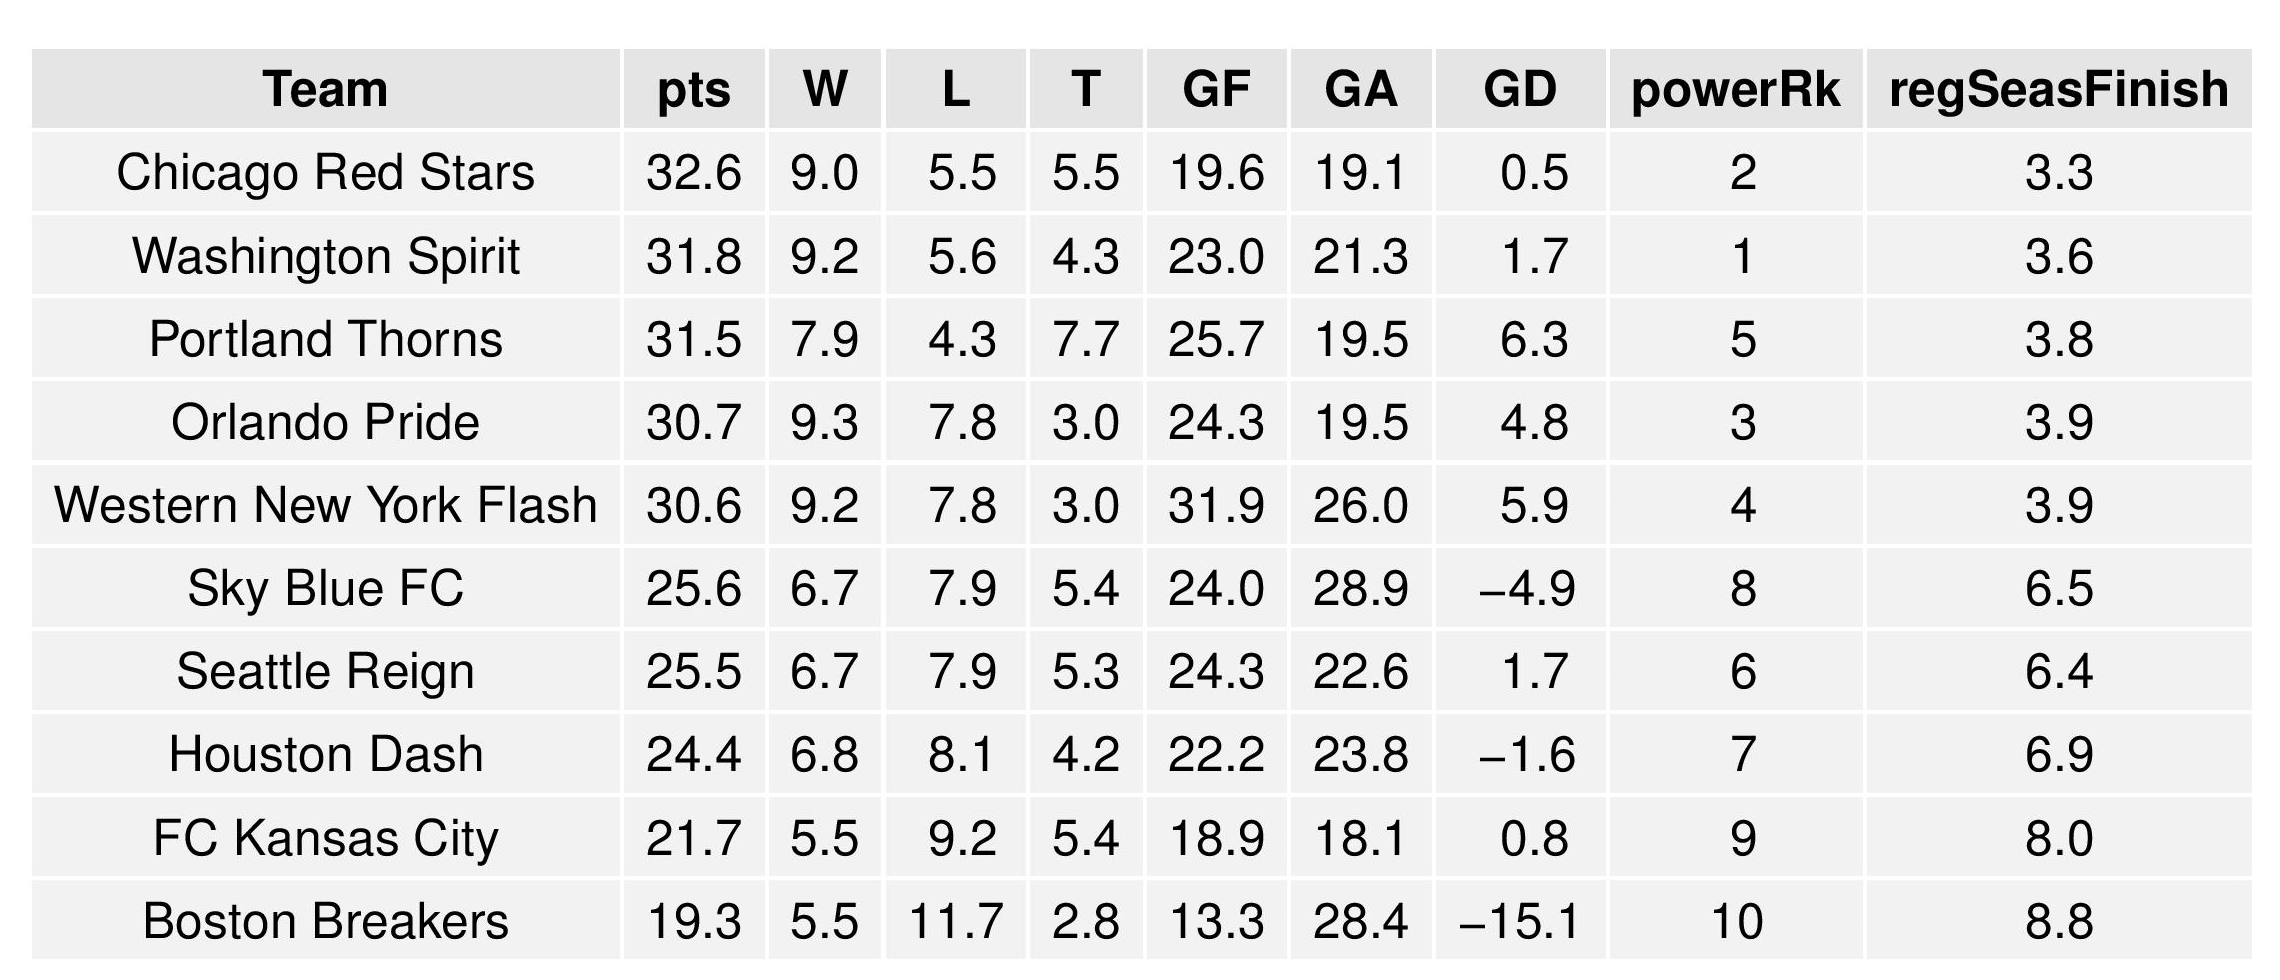
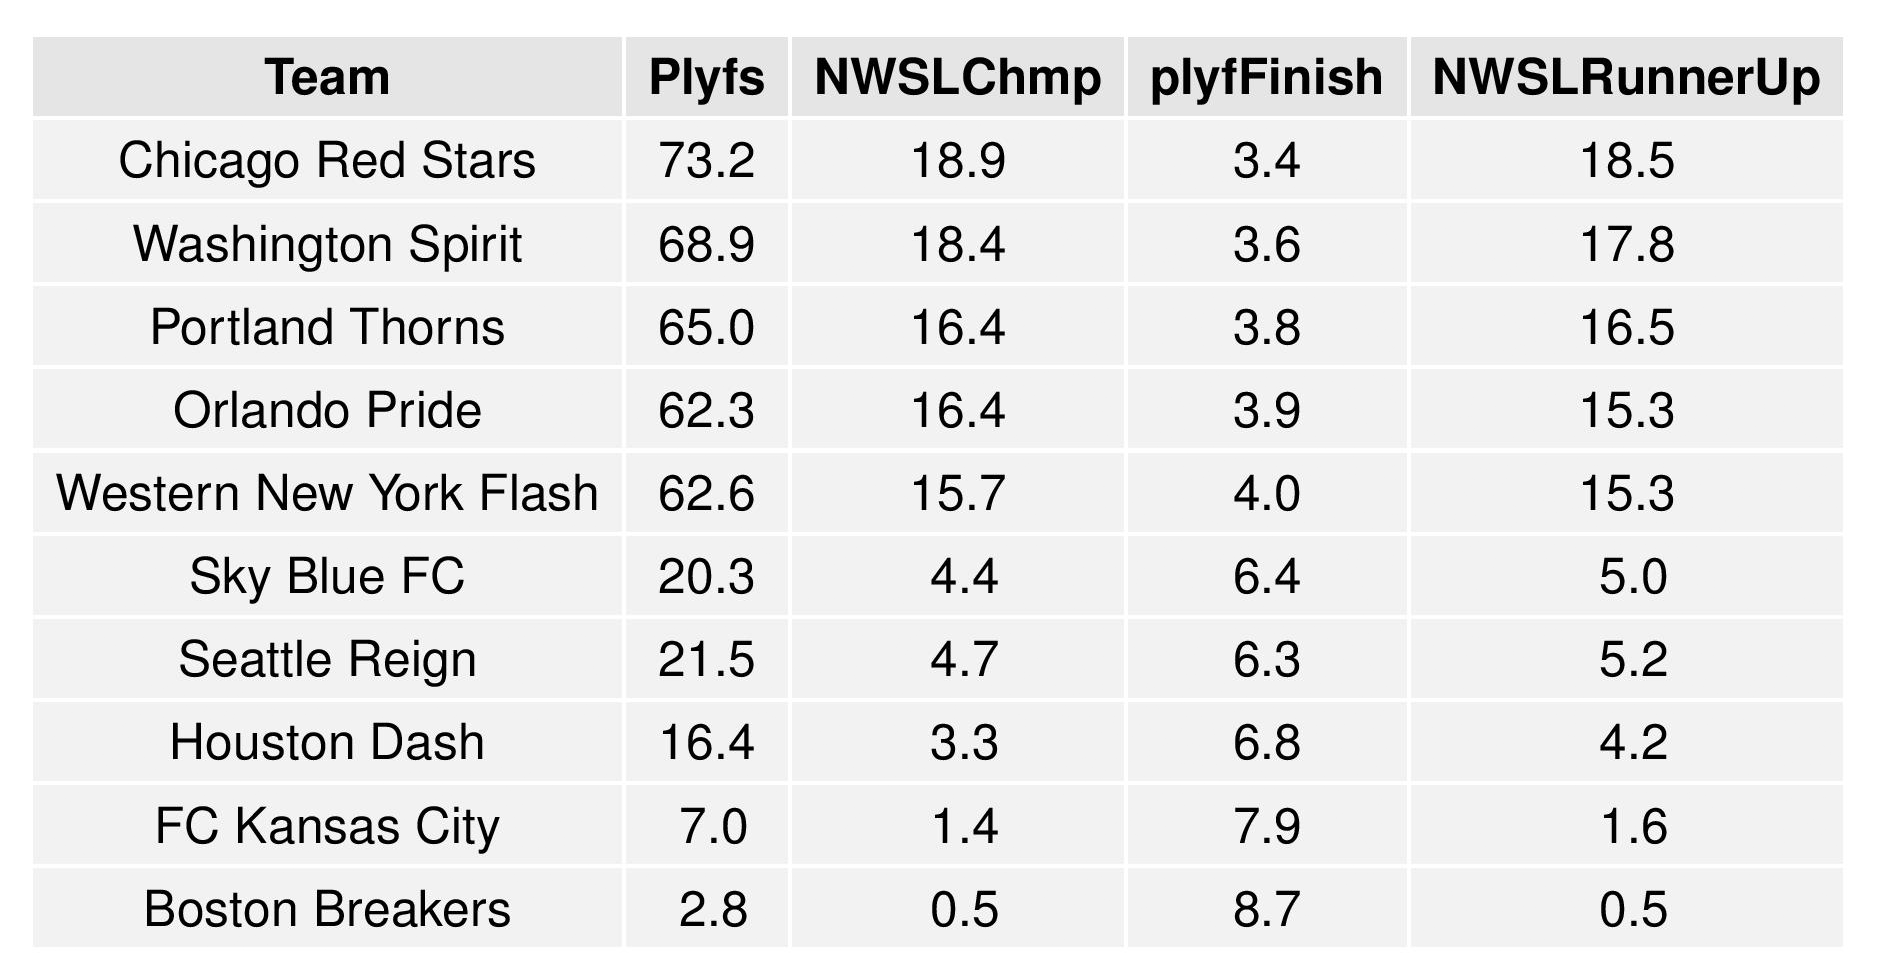
NWSL Projections (through May 22)
While Philadelphia does not currently have a team, I do very much hope that the league expands to Philadelphia as WPS did before it fell apart. I’ve gone to some Washington Spirit games and enjoyed myself very much (except for having to root for a Washington team).
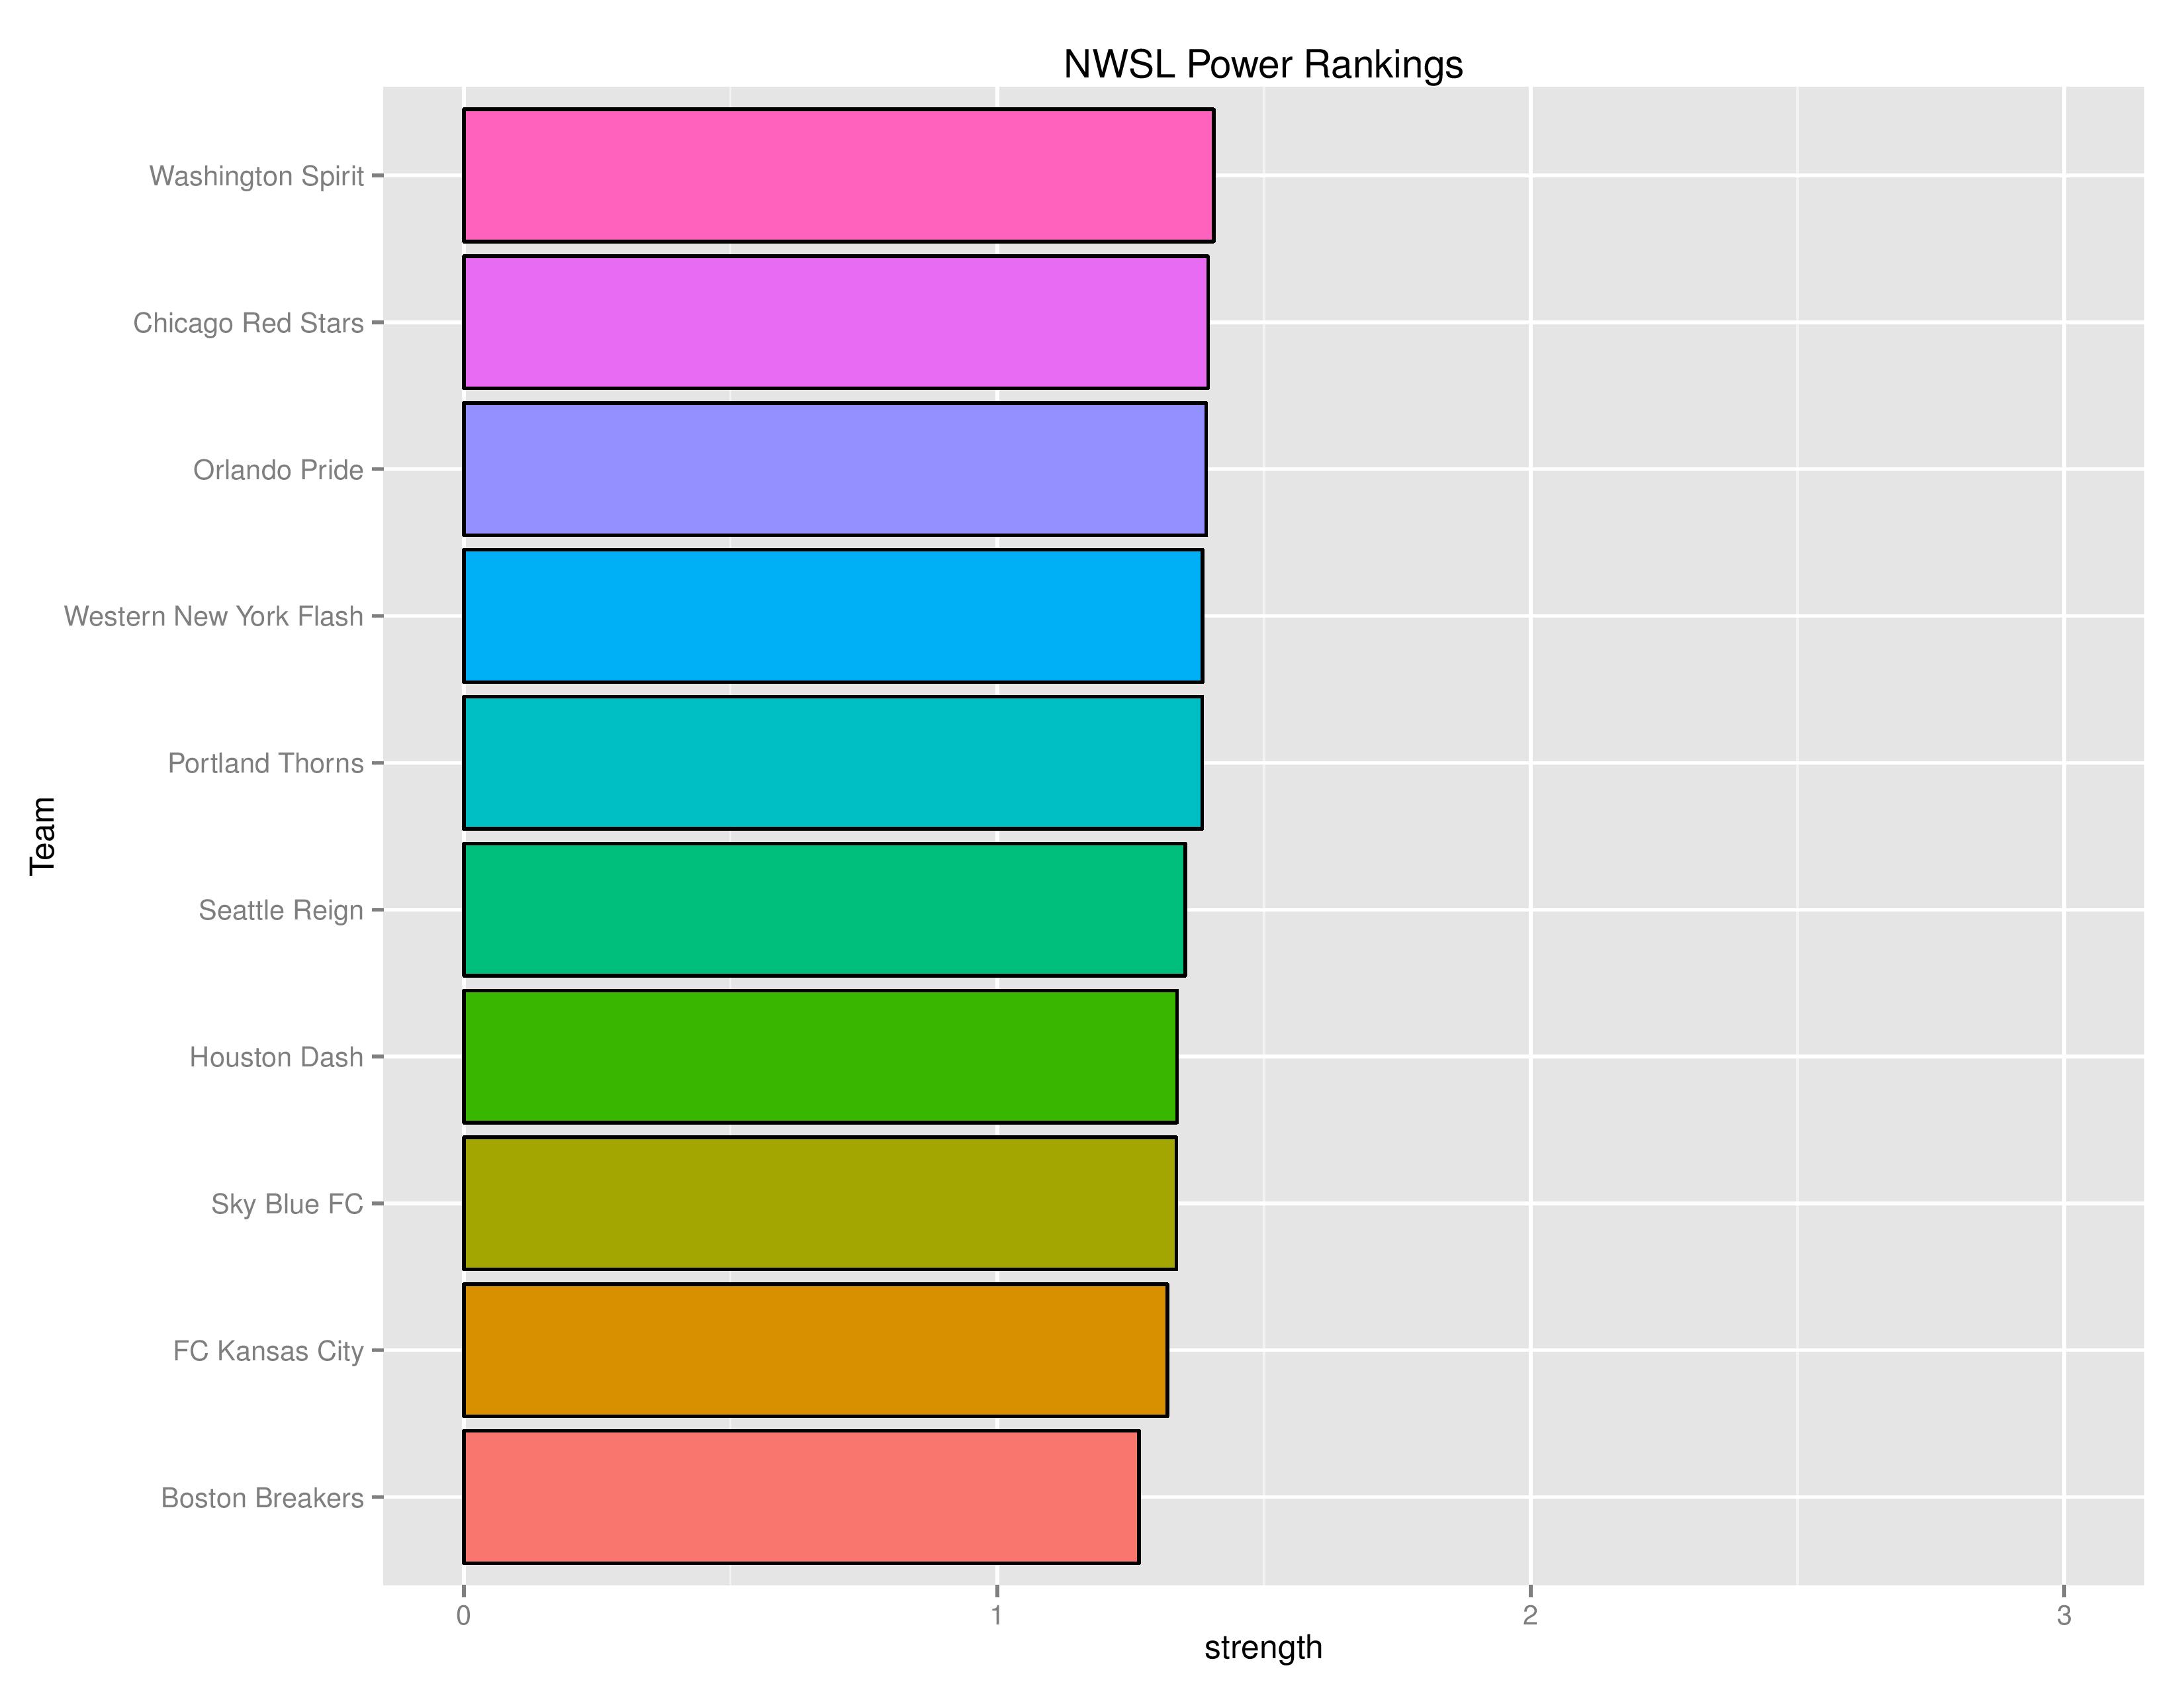
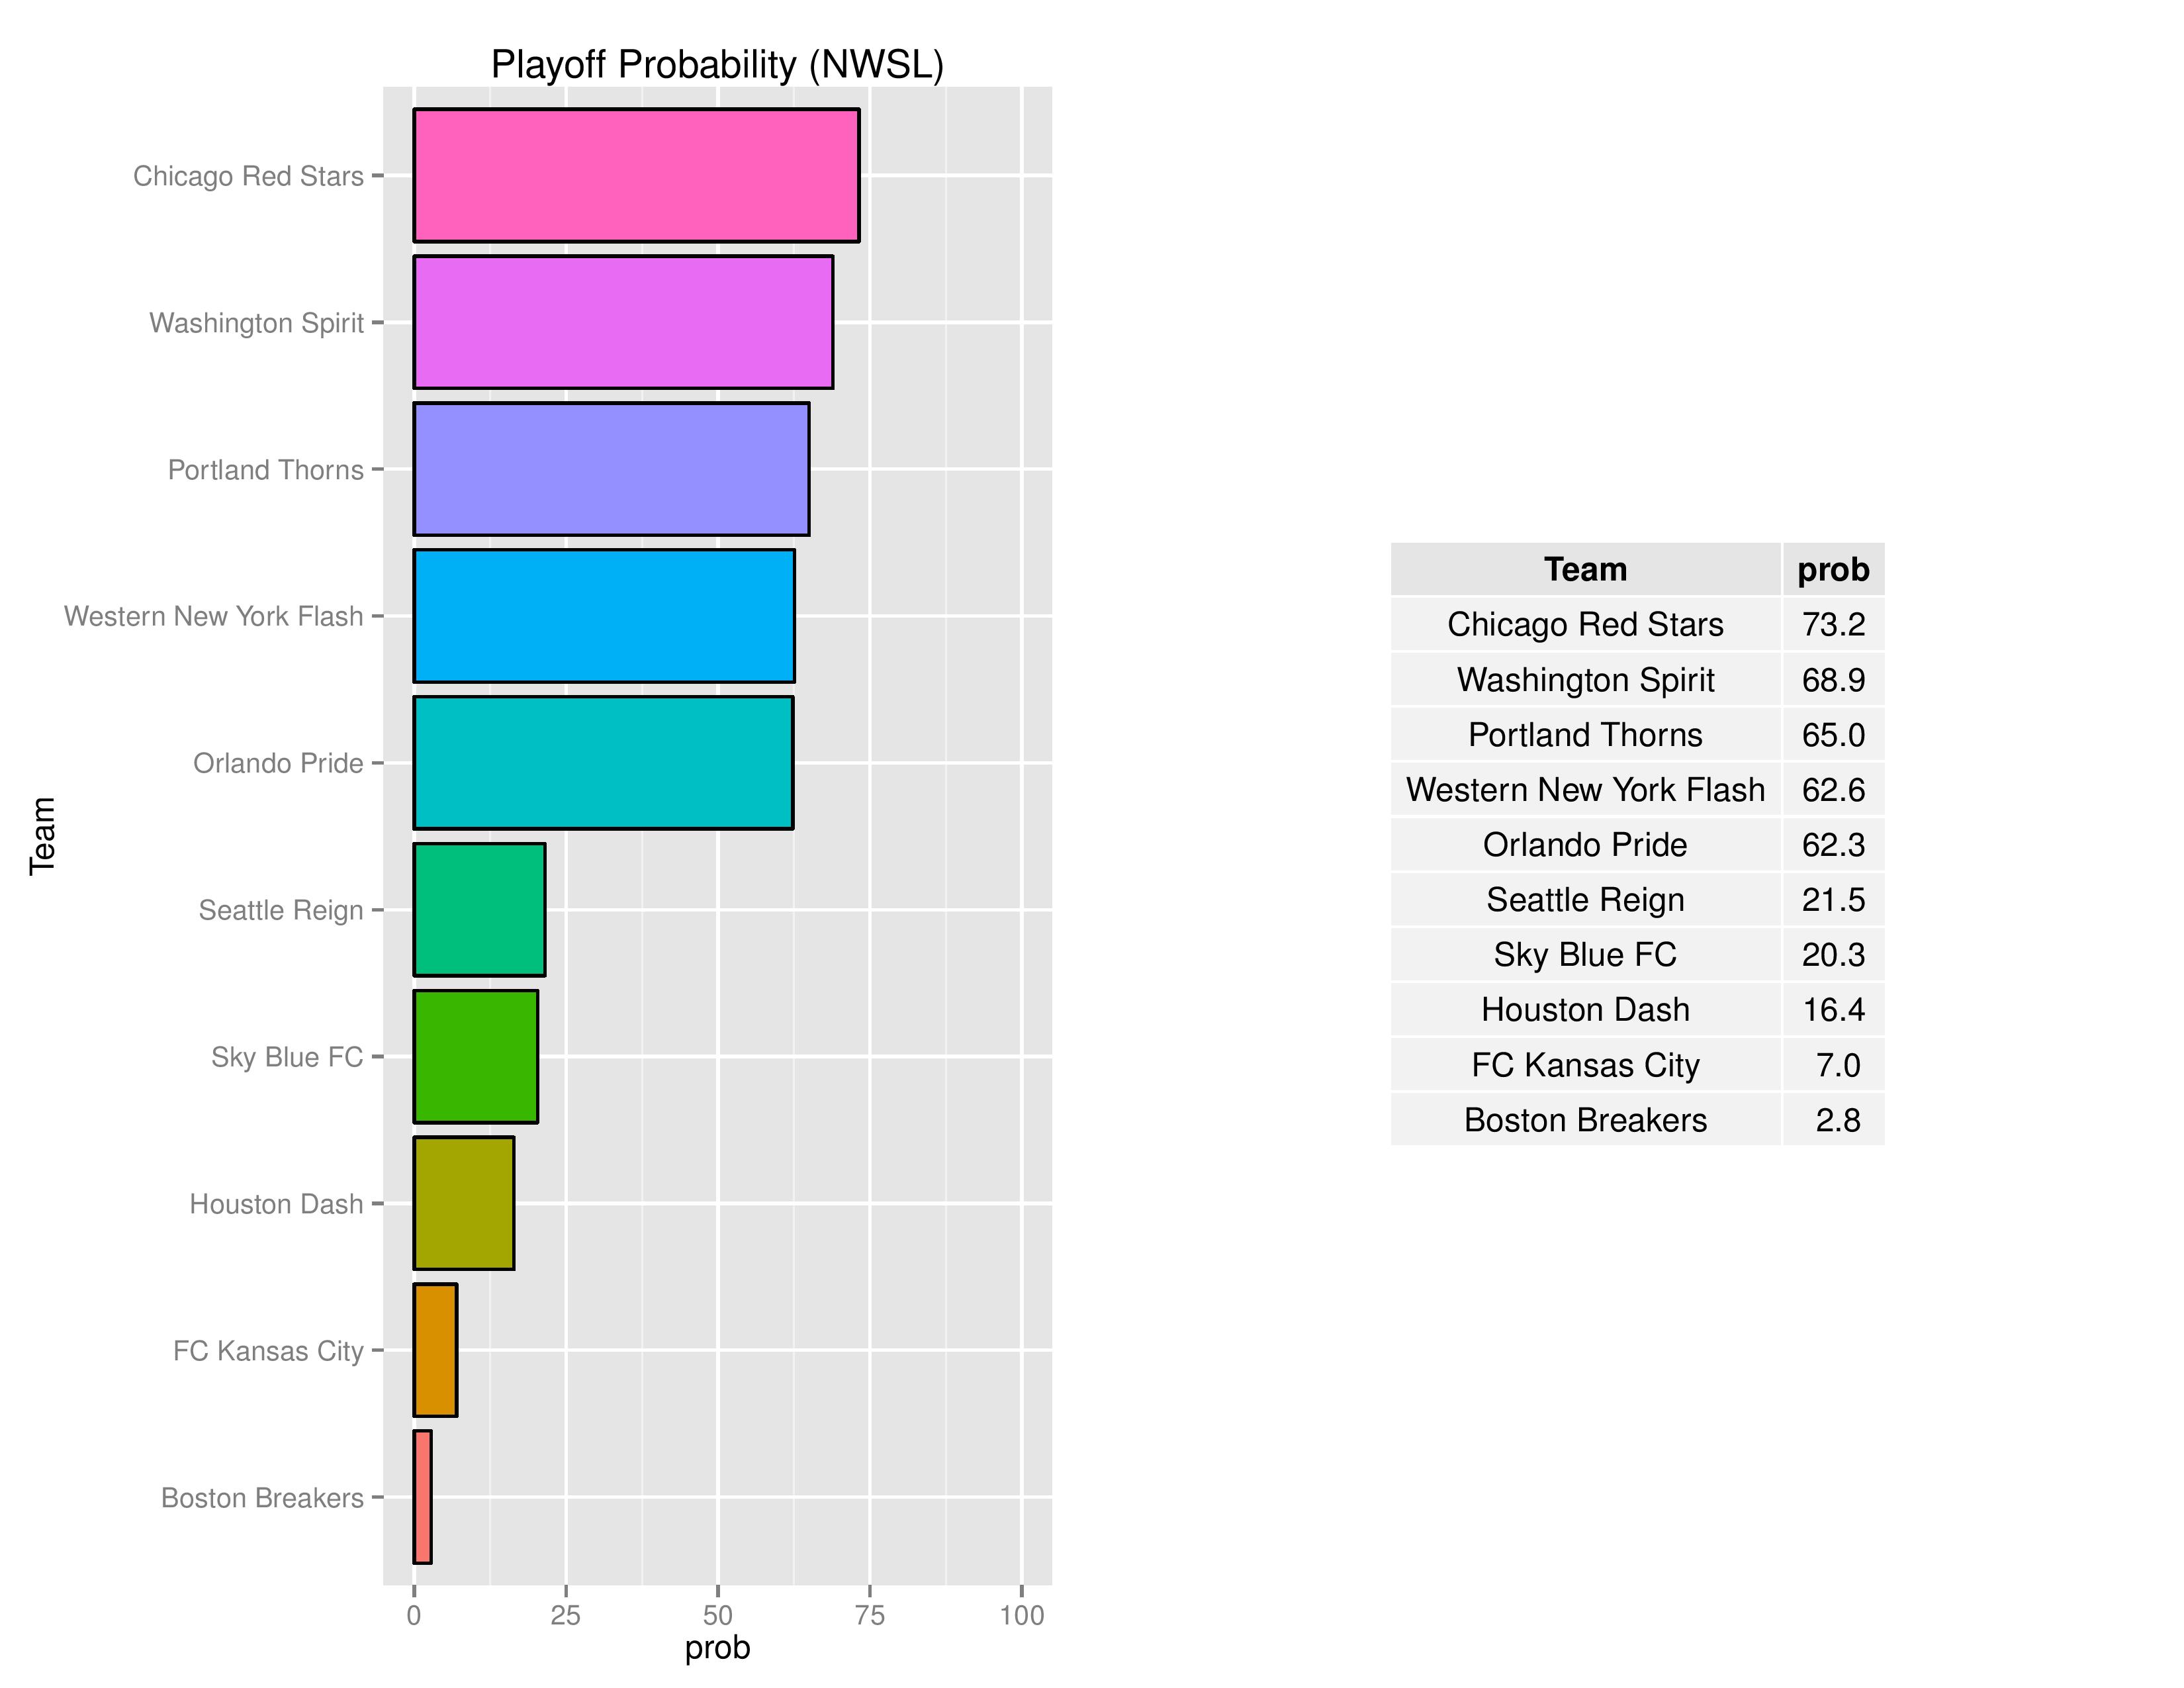
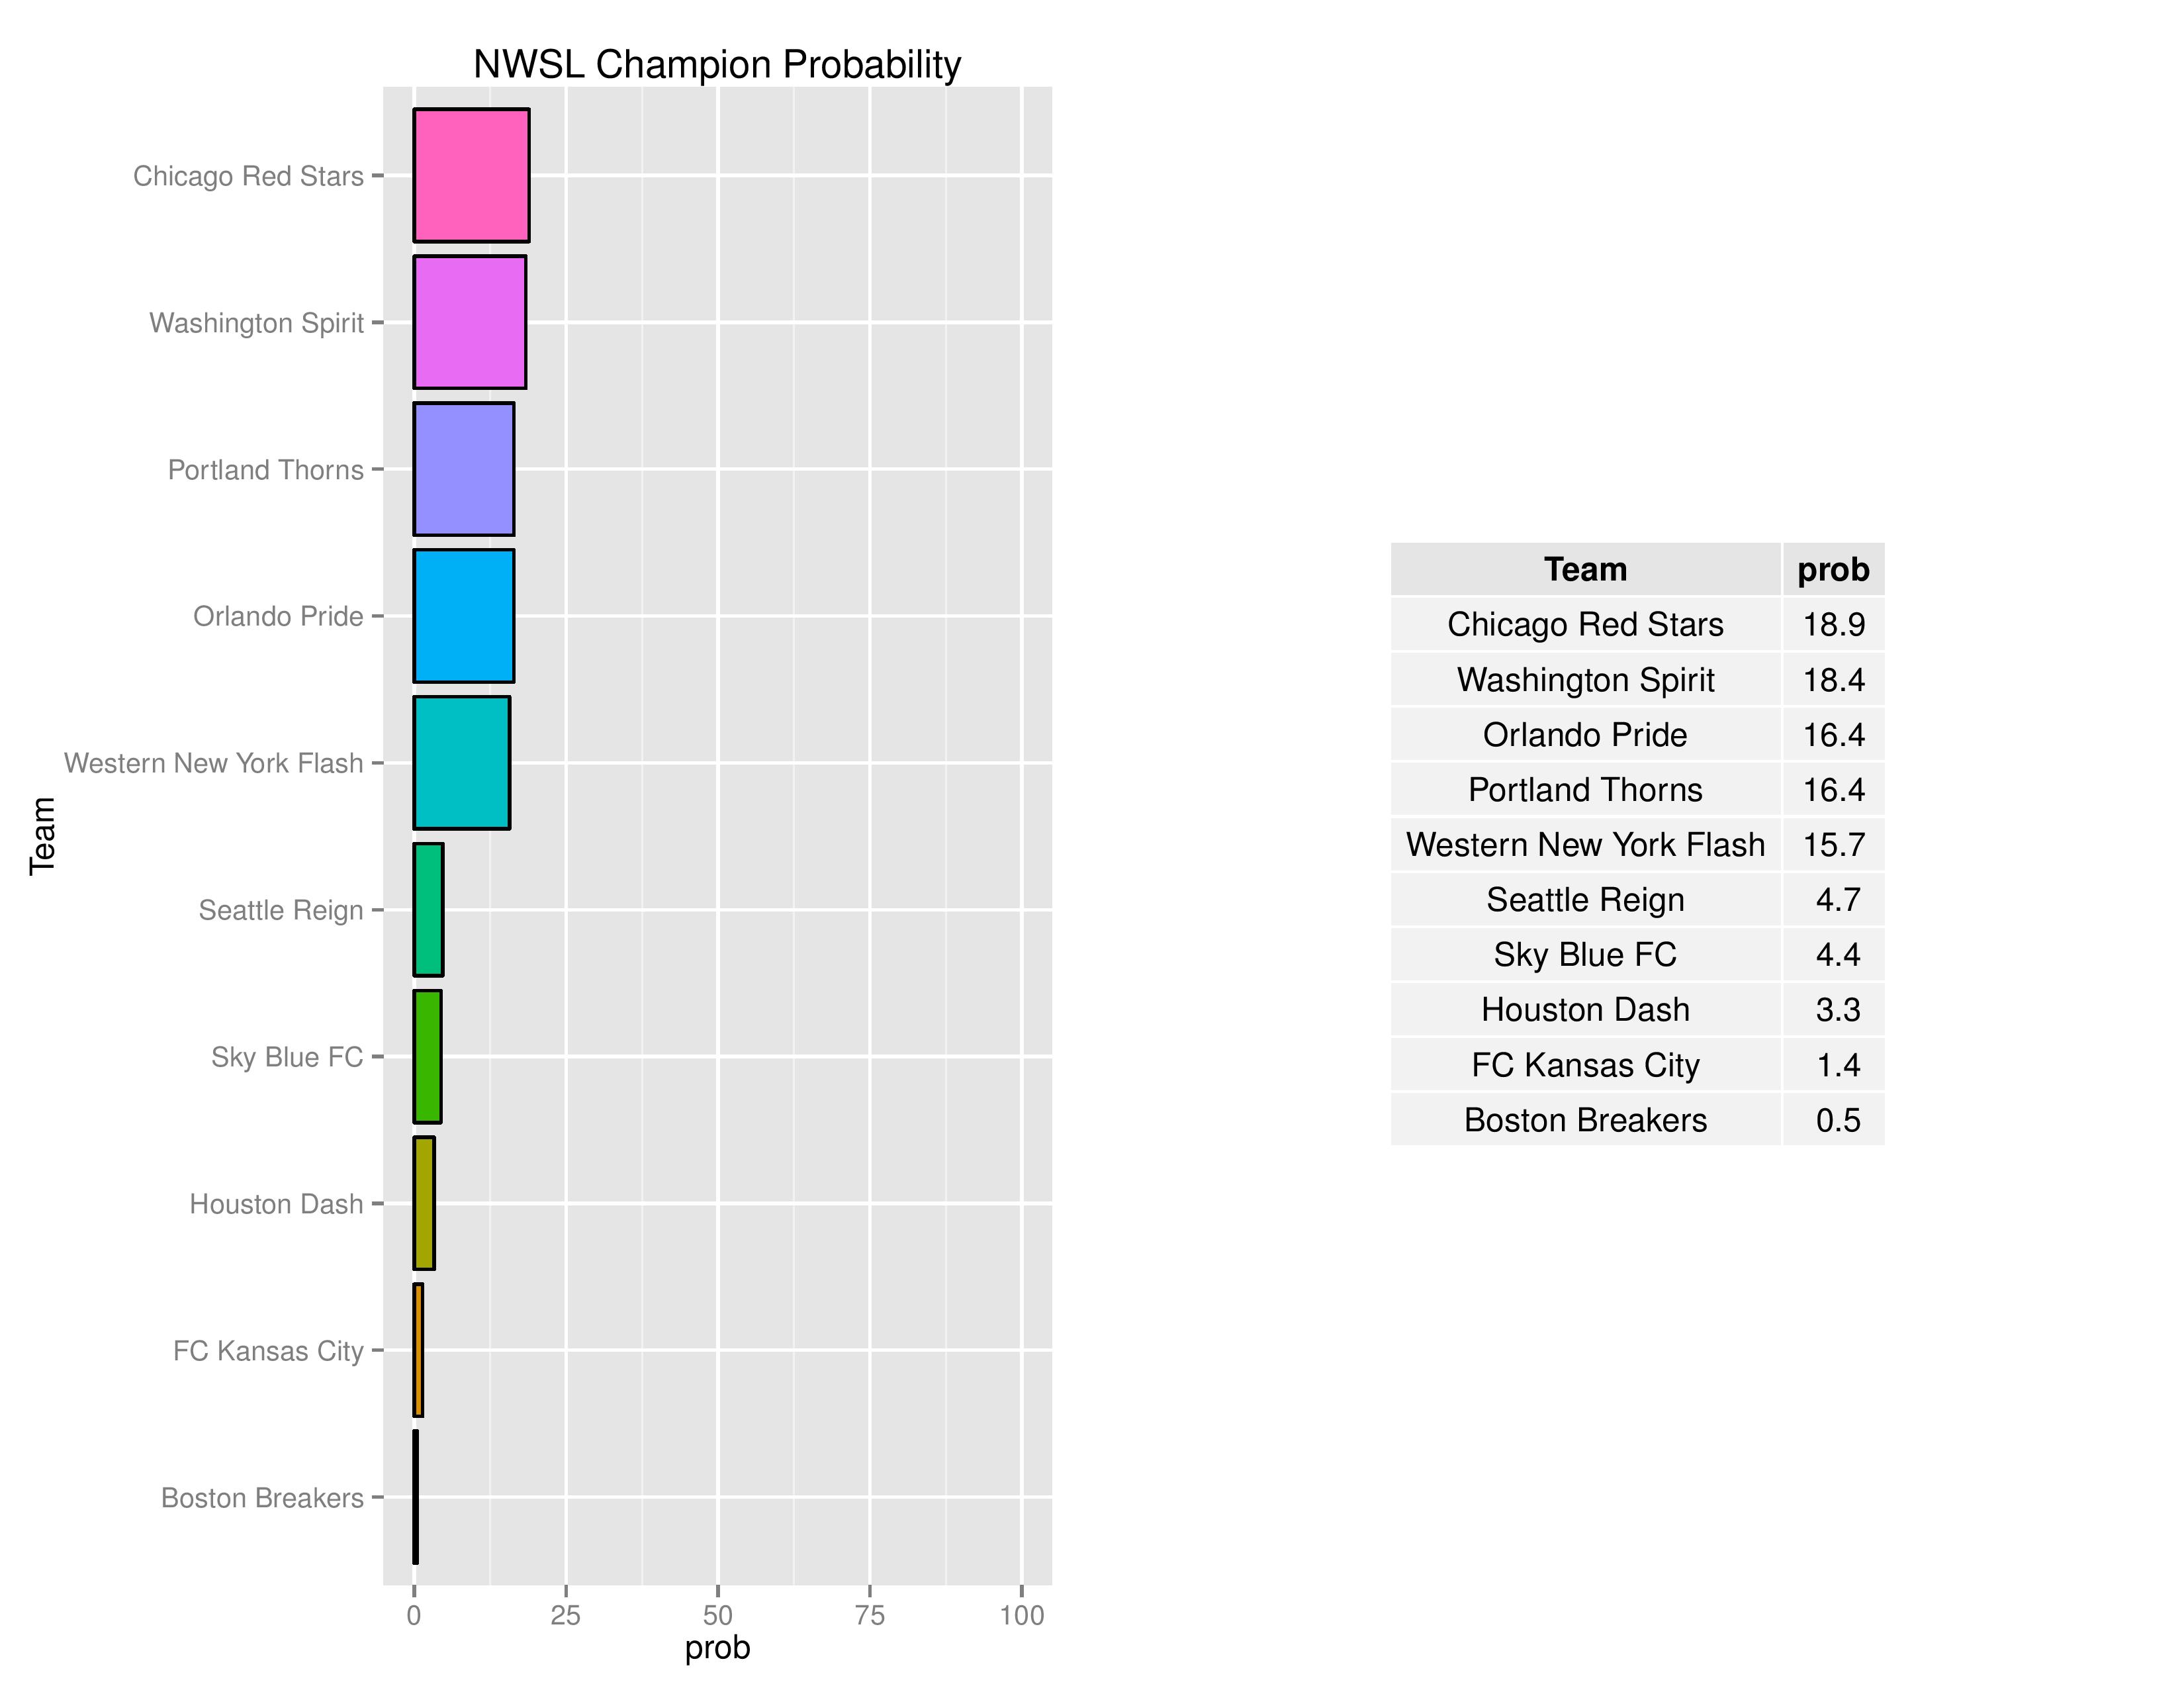
The following tables are the average simulation results produced by SEBA.

Good stuff, Chris. It will be interesting to track this throughout the season. Any thoughts on measuring the model’s accuracy over time?
Thanks Dave. Yes, I’ll definitely put an over-time feature in as I think it will be helpful. Just haven’t gotten to it yet (hopefully soon, it could take a while to simply back-run so many simulations)
I am inferring from these data that you have the Union’s chance at winning the Eastern Conference at around 34%. Is that right?
So, you can’t directly infer the Regular-Season conference winner from these statistics as we don’t know how much overlap in the categories are. From these tables, you can know that the probability of winning the Eastern Conference in the Regular-Season is between 27.5% (if the Union only won the conference but lost the MLSCup and the USOC) and 42.0% (if the Union win the MLSCup, USOC, and the Eastern conference). I can’t tell you right now what the percentage is because I save the summation, not the simulations (it’s over 2 million records per run), but going forward I’ll add the probability of winning the conference in the tables to show its contribution to CCL qualification
the labelling on your x and y axes is hard to read, quite hard.
Have you tried zooming in on your browser? It helps me