Welcome to the Statistical Extrapolation Bayesian Analyzer Projection System, which is, of course, a tortured gathering of words used to create the SEBA Projection System.
The system consists of a model projecting the probabilities of game results and then a barrage of simulations which account for the remaining luck. So the probabilities you see below show, essentially, what the odds are of an outcome if the team continues to play like it has been.
Below are the current season forecasts using data from games through May 22, 2016.
Power Rankings
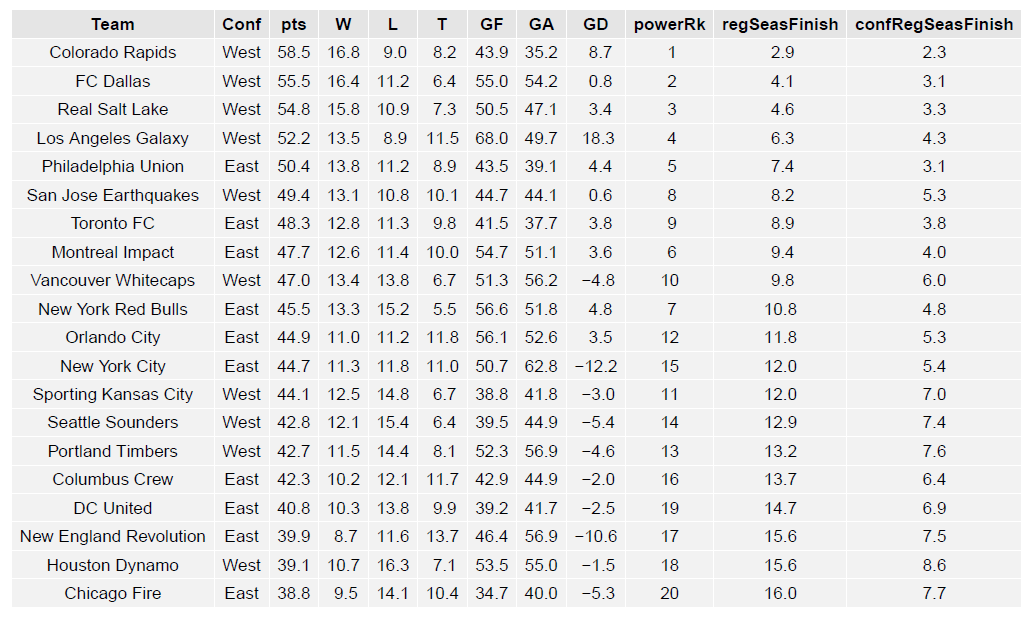
The “Power Rankings” we concoct are the actual “strength” of the team according to competitive expectations:
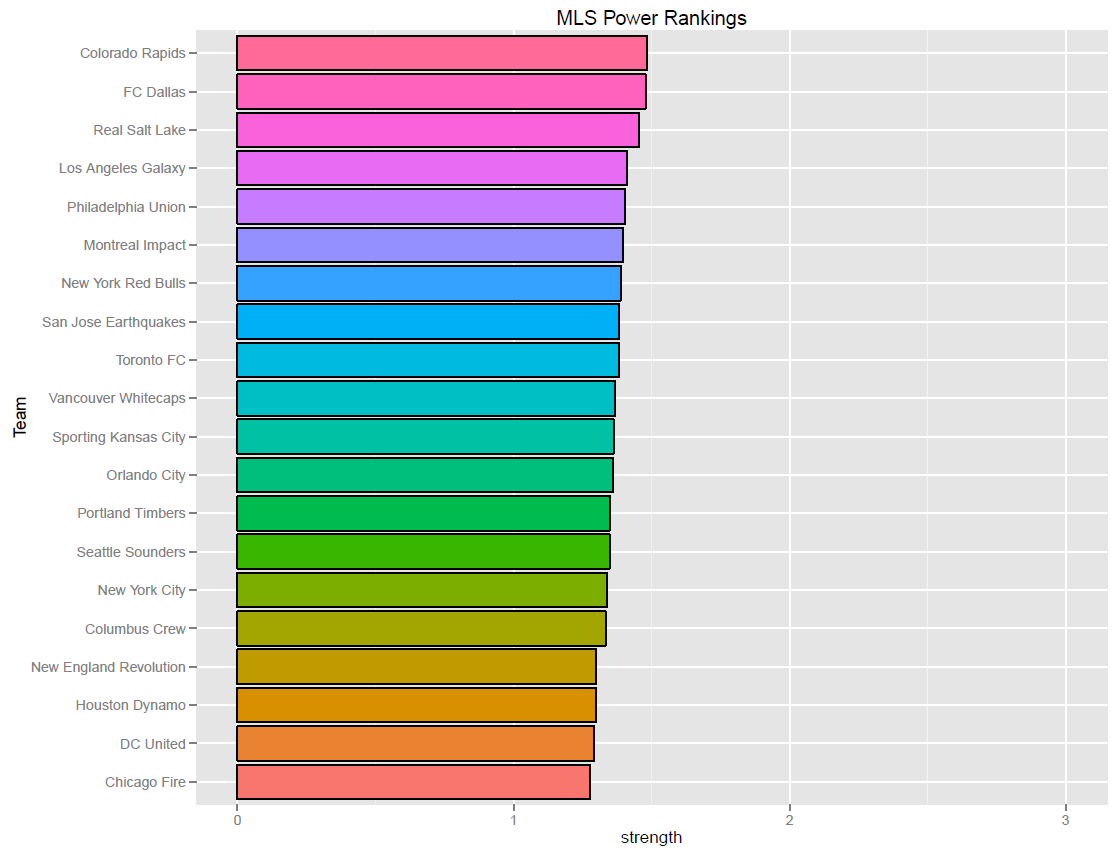
SEBA has the Union moving from No. 6 to No. 5 this week. SI and SBI also have Philadelphia at No. 5 compared with No. 4 at Soccer America and No. 2 at ESPN and MLSsoccer.com.
Playoffs probability and more
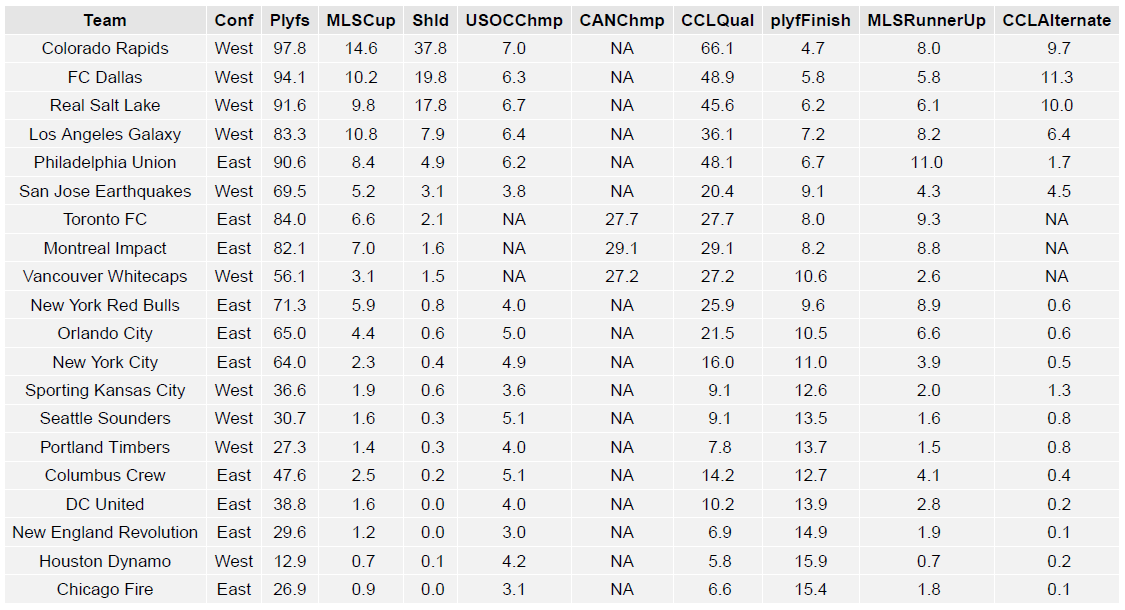
The following charts show the probabilities for making the playoffs, winning the Supporters’ Shield, winning the MLS Cup, winning the USOC Cup, and qualification for CONCACAF Champions League.
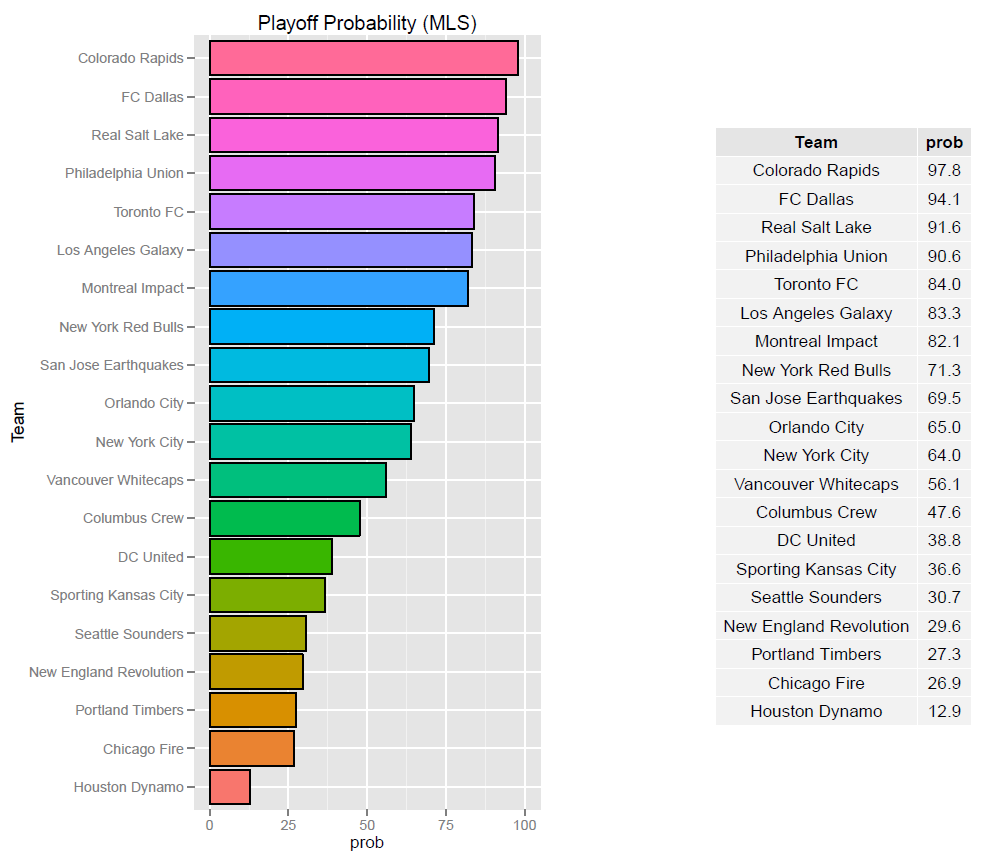
The Union moved up to 90.6% from 85.5% last week. While home wins don’t often influence SEBA’s expectations of a team’s strength, continuing to bank a full 3 points makes a heavy influence in playoff likelihood, particularly in such a weak Eastern conference.
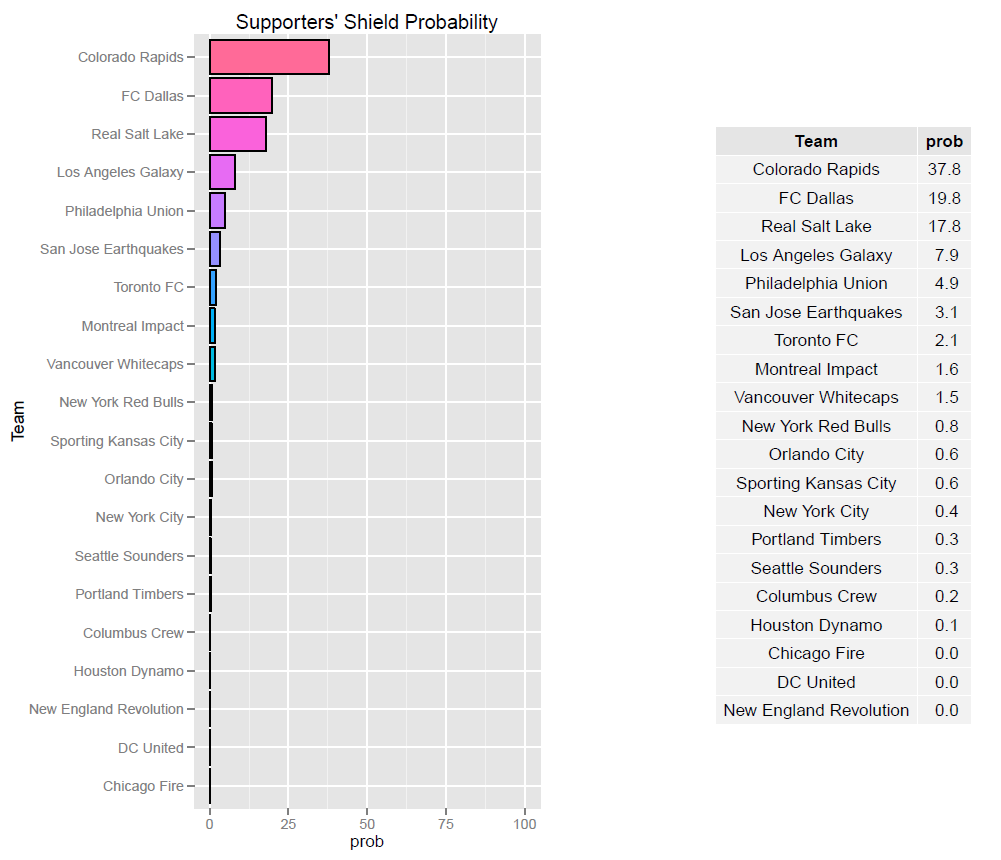
Philadelphia slightly enhanced their unlikely chances at the Supporters’ Shield, moving from 4.3% last week to 4.9%. This also moved the Union from the 7th most likely team to the 5th.
You may have noticed three teams, Chicago, D.C., and New England at 0%. I do want to point out that these aren’t necessarily “true zero percent” numbers. What that represents is that their odds are likely less than 1/10000 due to the number of simulations used.
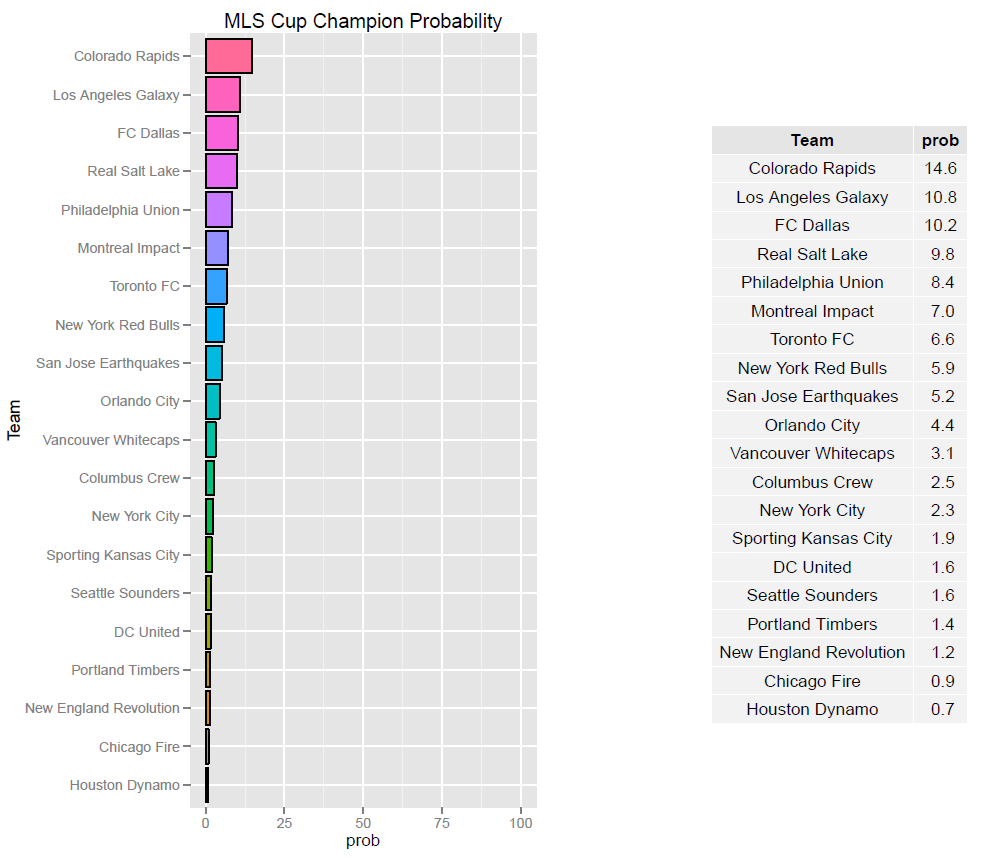
The Union increased their odds at the MLS Cup, moving from 7.7% to 8.4%. They did, however, move from the 4th best odds down to 5th. This is due to the top Western conference teams starting to cement their odds of making the playoffs. Even if other teams are better than Philadelphia, they can’t have better odds if there is a lack of certainty that they’ll even make the playoffs. Even in a tough conference, Colorado, Real Salt Lake, and Dallas are all in 90’s with respect to playoff probability while the Galaxy’s high-scoring nature gives them an edge in the Home/Away aggregate goal series that occur in the playoffs.
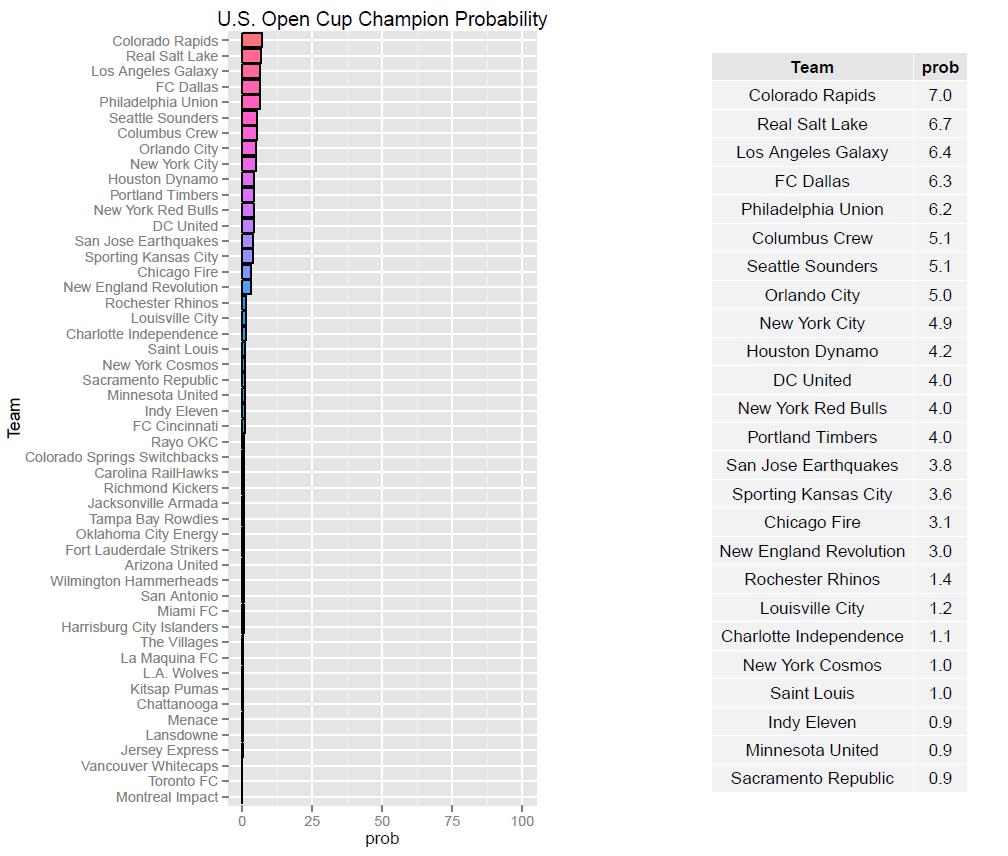
Philadelphia moved from 5.1% last week to 6.2% in the probability to win the US Open Cup. It definitely helped that the USOC Fourth Round draw has Philadelphia at home. Likewise, FC Dallas got bumped to 4th-most-likely (when, otherwise, they would likely be second) because it isn’t yet certain whether they will be Home or Away. Finally, San Jose get’s the shortest end of the stick because they have to play MLS-side Portland Timbers Away in Round 4.
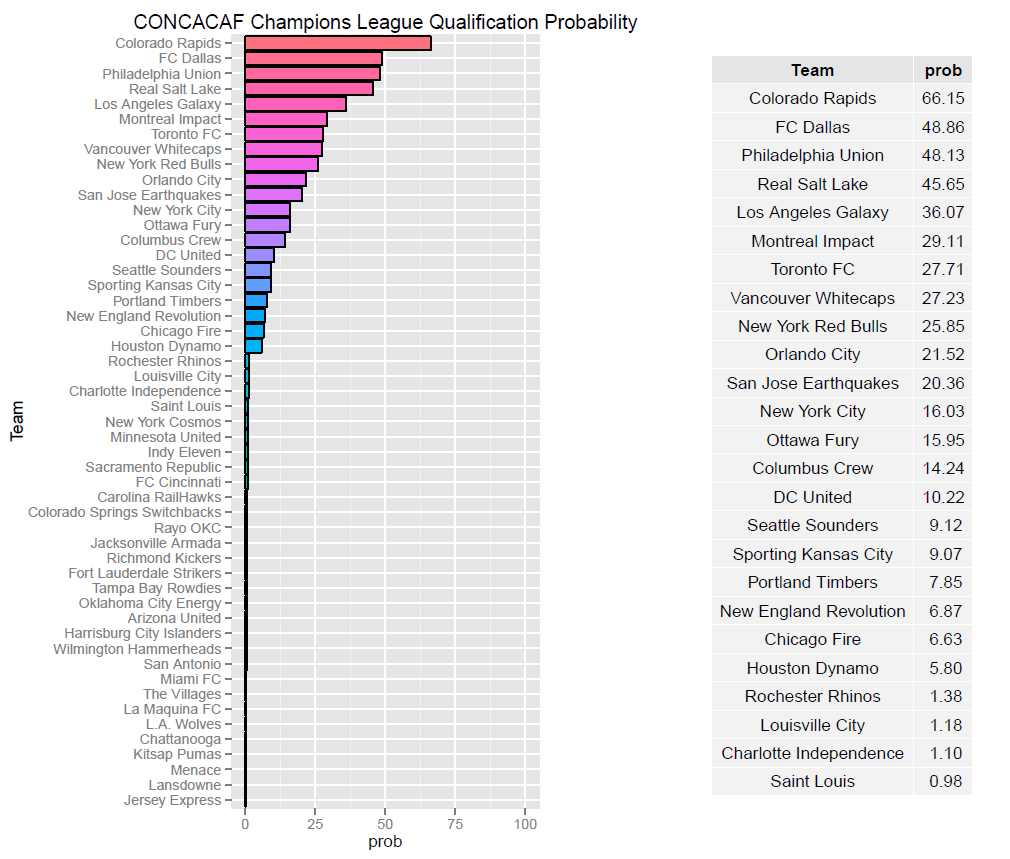
Philadelphia’s 48.13% chance of qualifying for the CCL makes them the 3rd-most-likely team to do so. Again, the weak Eastern conference boosts this probability due to their plausible position of winning it for the regular season. The weak Eastern conference also boosts the team’s chance at the MLS Cup.
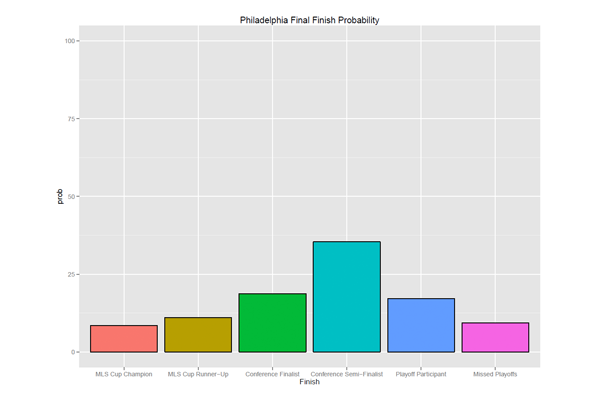
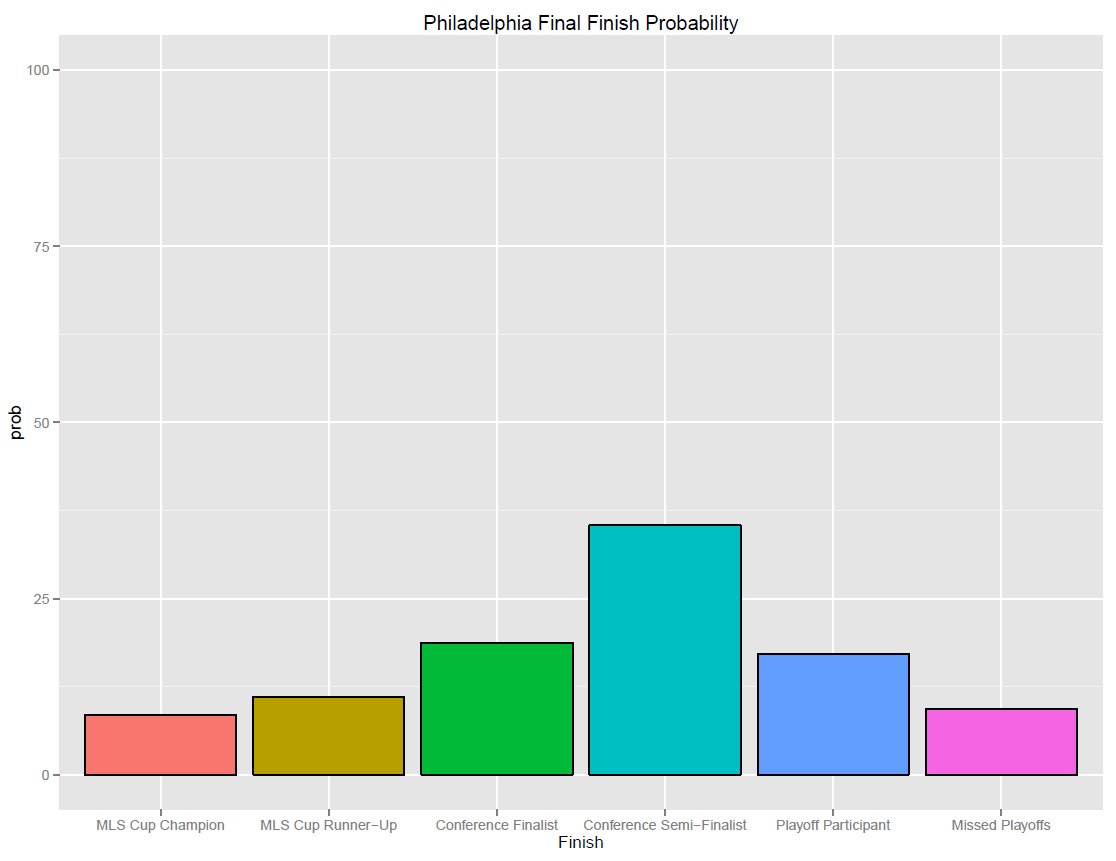
Philadelphia finishing
The following shows the probability of various Playoff categories and Philadelphia’s probability of each of them. Keep in mind that “Missed Playoffs” is, by default, 8 times as likely as “MLS Cup Champion.”
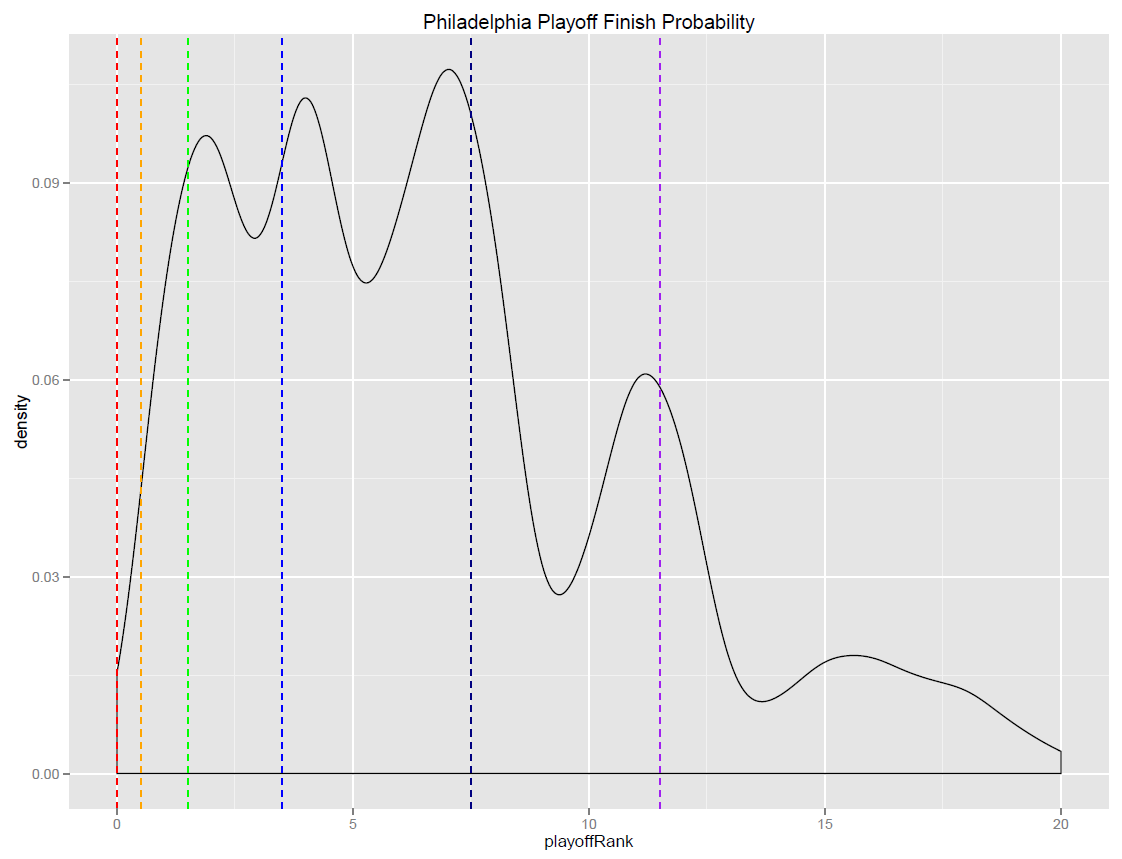
The following is a “density” chart showing the relative probability of Philadelphia finishing at the different after-playoffs rankings from 1 to 20.
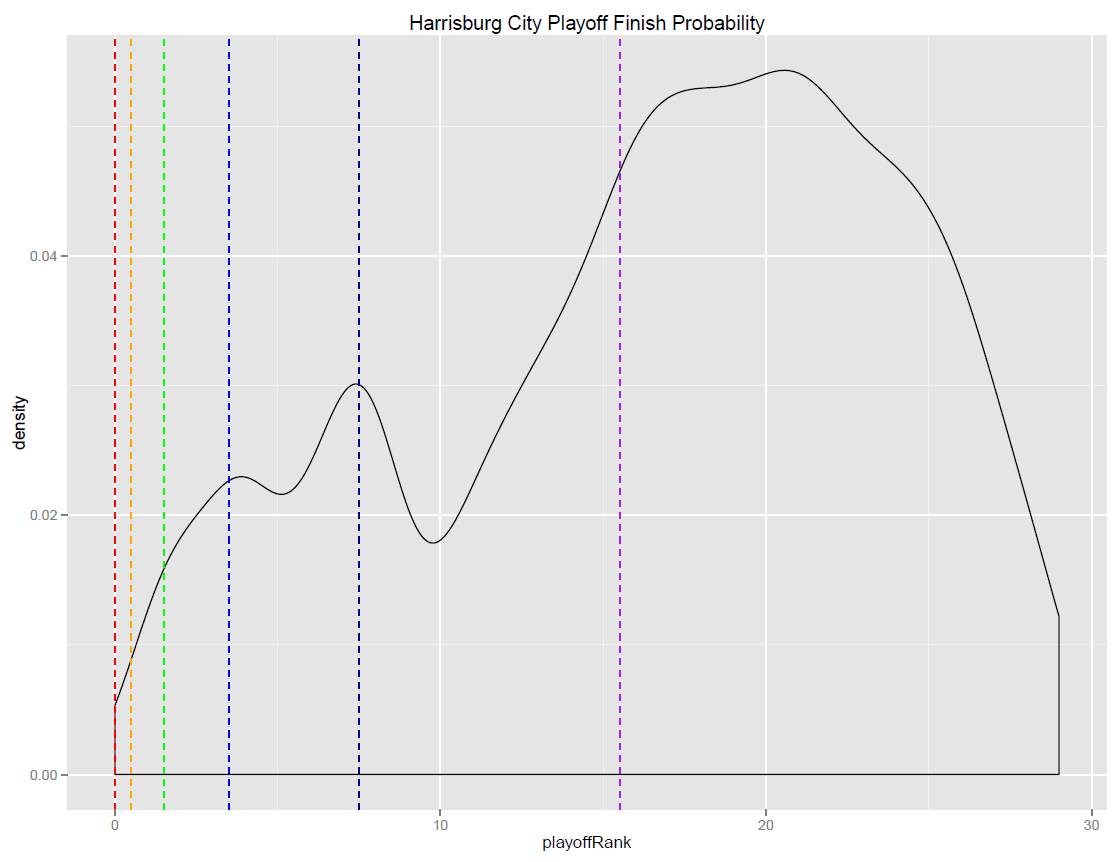
To repeat last week (and likely going to continue throughout the season), the loopiness you see in the higher ranks is likely due to the disparity in conference strength. If Philadelphia finishes in a higher round than a Western team, they are automatically ranked higher, but if they finish in the same round, Philadelphia will often be ranked lower (based on regular season single-table finishing).
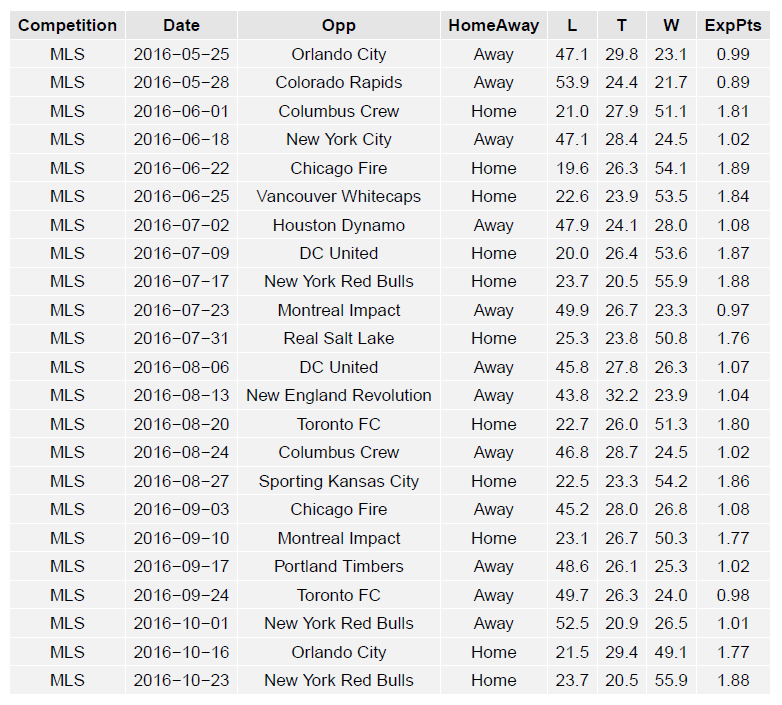
The following is the list of Philadelphia’s remaining scheduled matches accompanied by result probabilities as predicted by SEBA.
Finally, the charts below shows the average results of all the simulations and the probabilities associated with all of the above. The chart is broken up into two parts in order to better fit on your screen.
(Note: CCLAlternate refers to qualifying for CONCACAF Champions League non-traditionally. U.S. teams qualify by winning the MLS Cup, winning the Supporters’ Shield, winning the Conference in the regular season, and by winning the U.S. Open Cup. If a Canadian team wins any of these or a U.S. team wins more than one, the extra slots are filled by top regular season performers.)
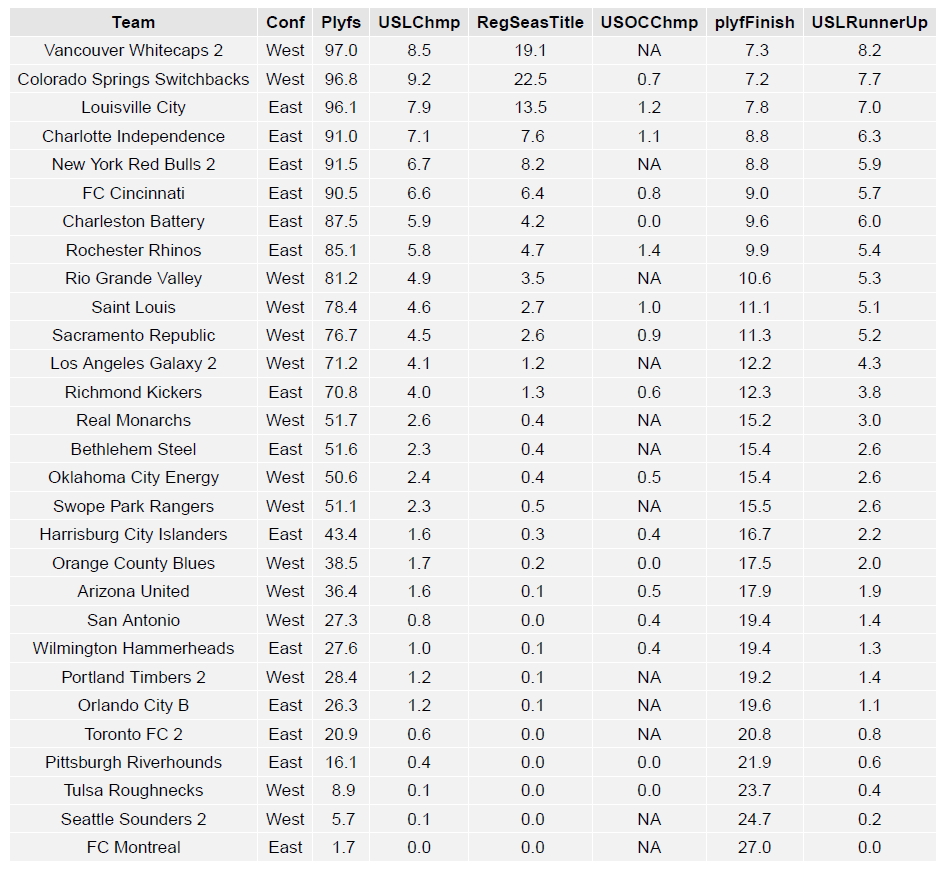
USL Projections (through May 22)
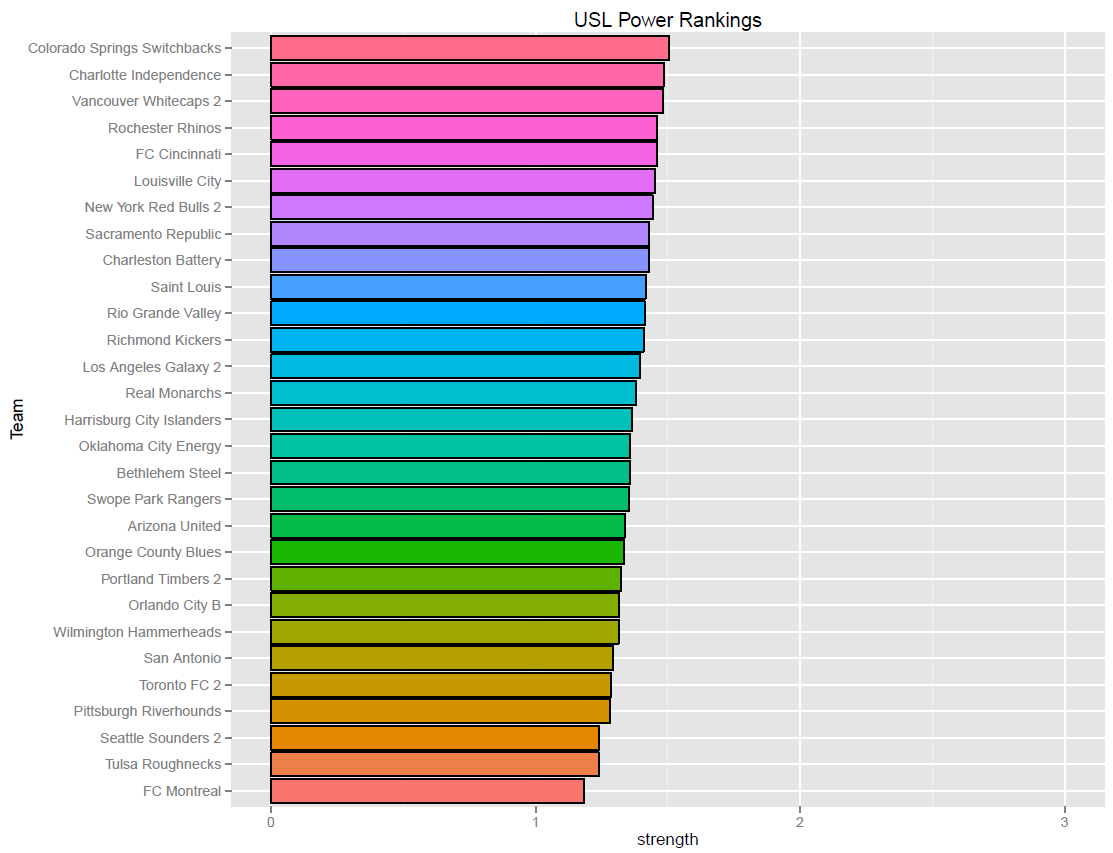
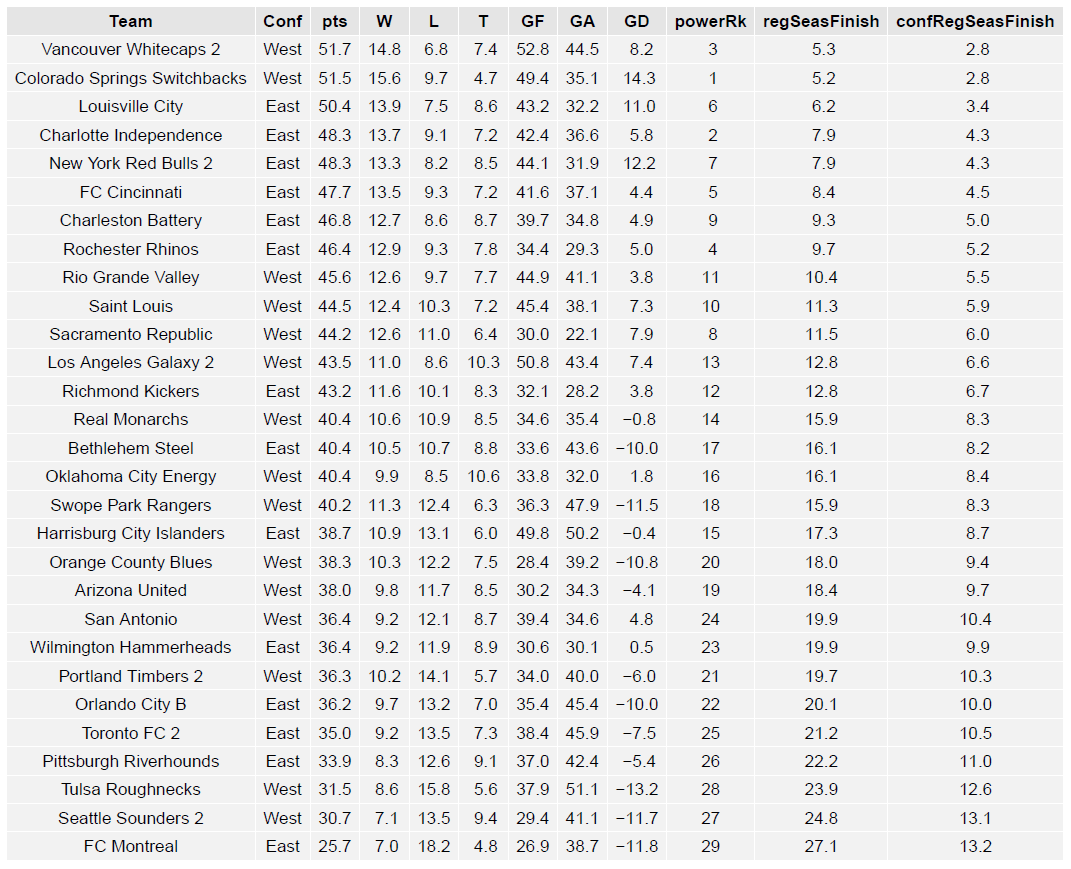
Bethlehem comes in at 17th in strength and Harrisburg City comes in at 15th. While MLS doesn’t have a perfectly balanced schedule, USL is more unbalanced, so Power Rankings for USL will vary more often. USLSoccer.com does not have either team ranked in the top 15.
Last week, Bethlehem was 14th and Harrisburg was 21st.
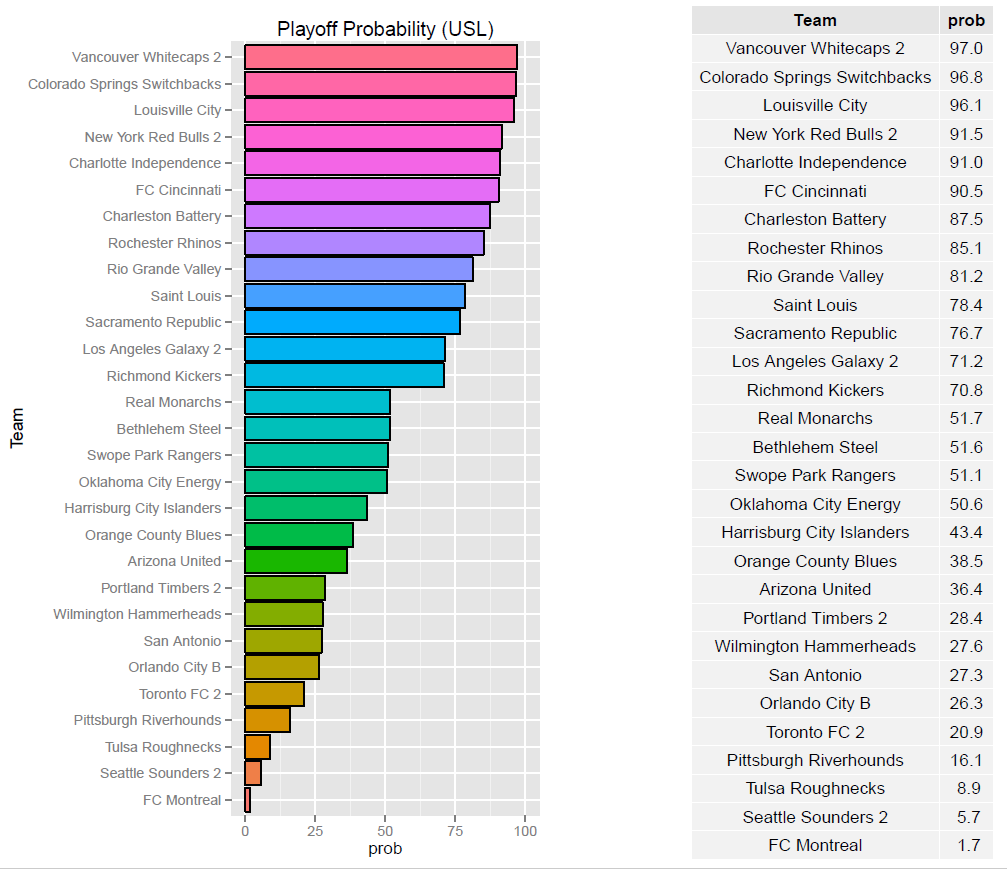
While Bethlehem is currently more-or-less at a 50/50 chance, Harrisburg is slightly less likely to make the playoffs. One factor to consider is that, on the whole, it appears as if the Eastern conference is the stronger conference for USL, which will make it easier for Western conference teams to make the playoffs, however, it should also be noted that there are fewer Eastern conference teams in the league (14 compared to 15) despite having the same number of playoff spots (8) making it easier for Eastern teams to make the playoffs.
Last week, Bethlehem had a 62.7% chance at the playoffs while Harrisburg had a 28.3% chance.
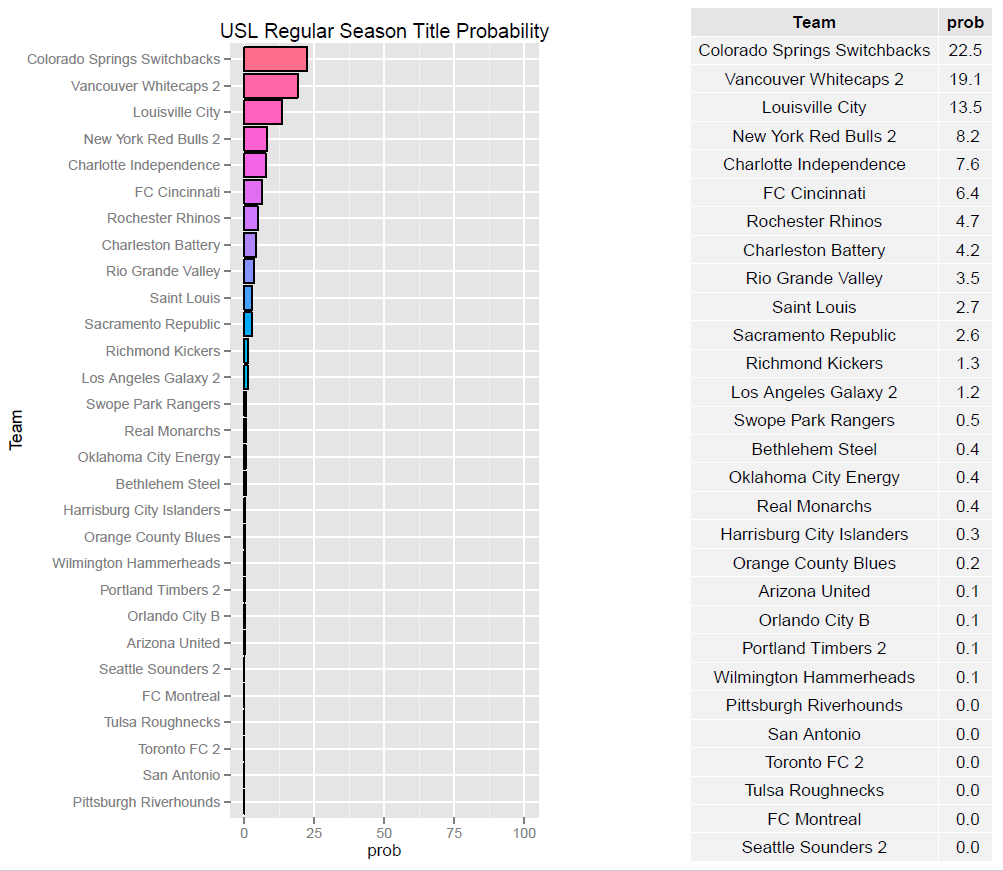
For Bethlehem and Harrisburg, the chances of winning the regular season title are practically non-existent. Colorado, Vancouver, and Louisville are the much more likely contenders. Last week, Bethlehem had a 1.0% chance at the title compared with Harrisburg’s 0.2%
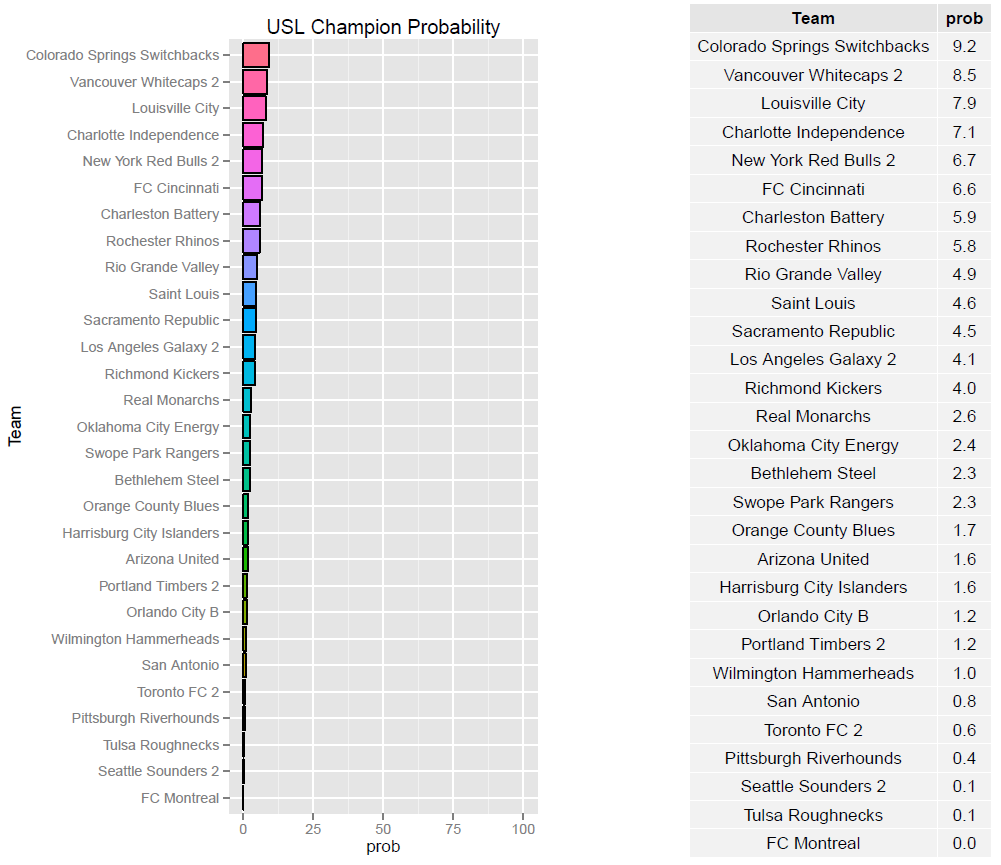
USL’s single-game playoff format (with no byes) definitely allows luck to play a greater role in determining the USL Cup victor. Bethlehem’s 2.3% (last week 3.2%) and Harrisburg’s 1.6% (last week 1.1%), while low odds, are not so different from the leader’s 9.2% as to write-off completely.
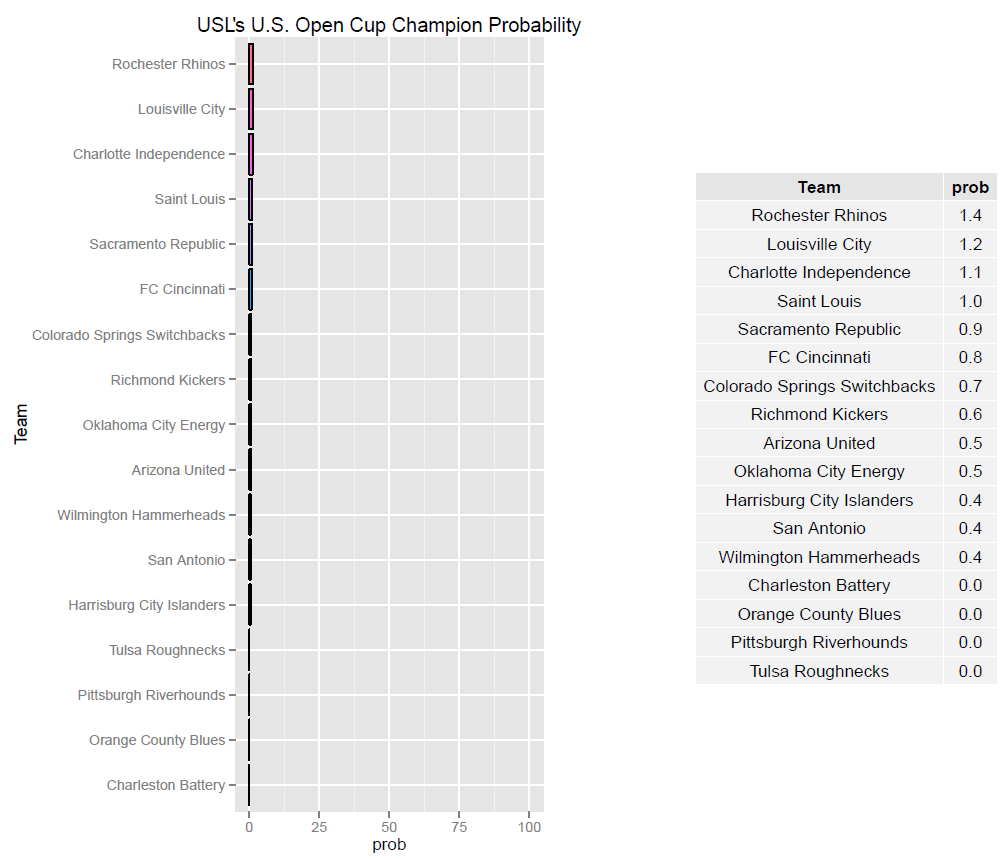
Rochester’s lead among USL teams gets a boost by getting to host their Fourth Round U.S. Open Cup match-up should they make it that far. Harrisburg is still alive at 0.4% (last week 0.3%). However, given that they’d have to defeat Philadelphia to accomplish that, I’m not exactly rooting for them.
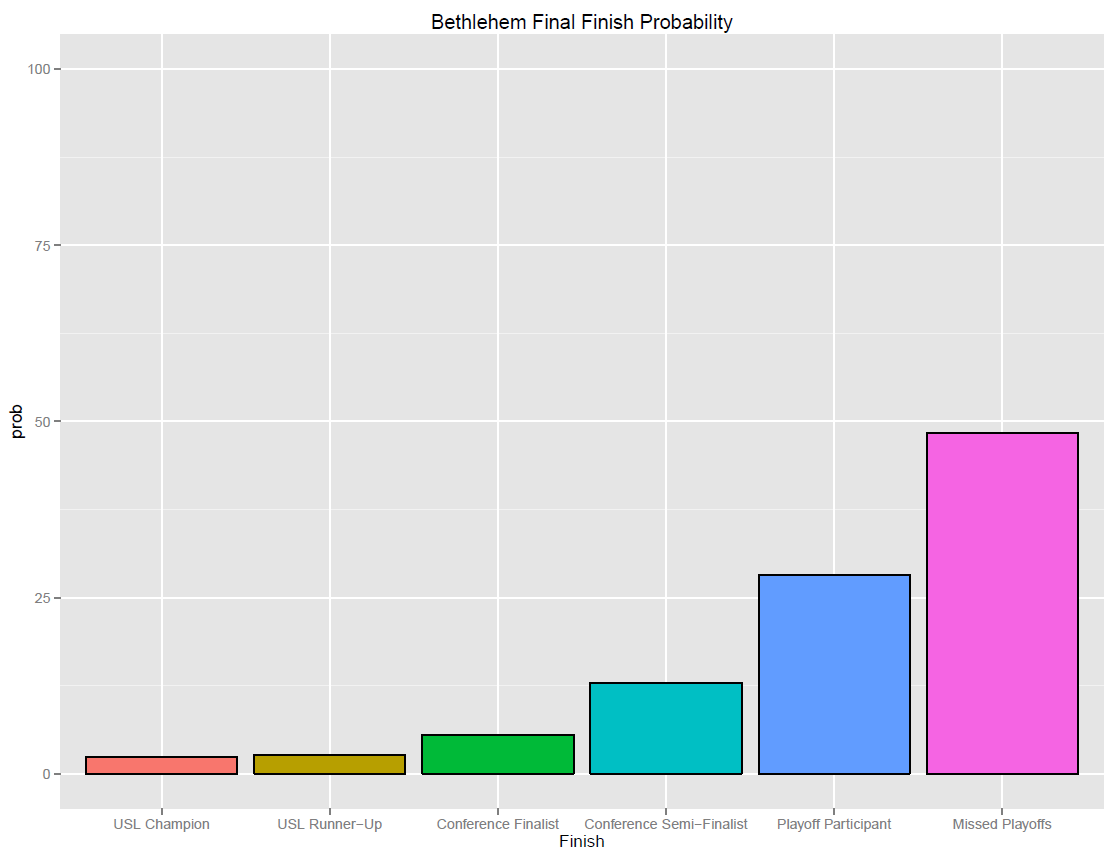
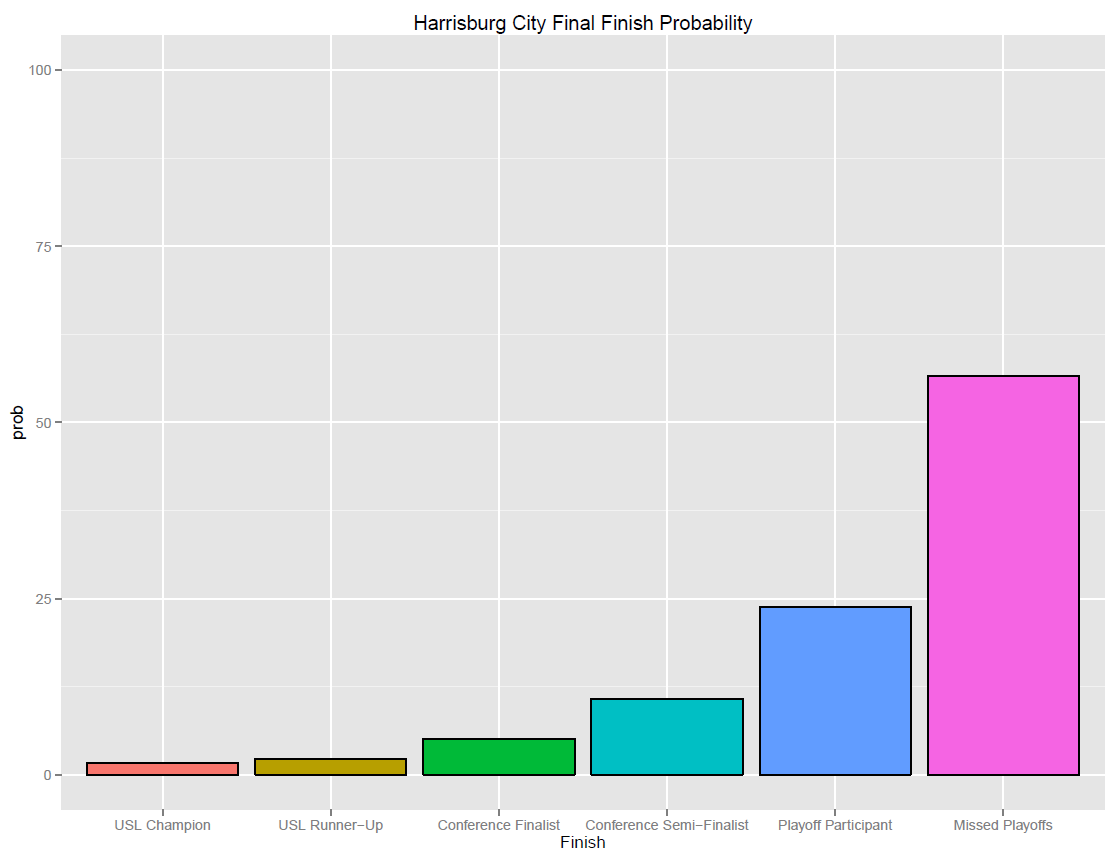
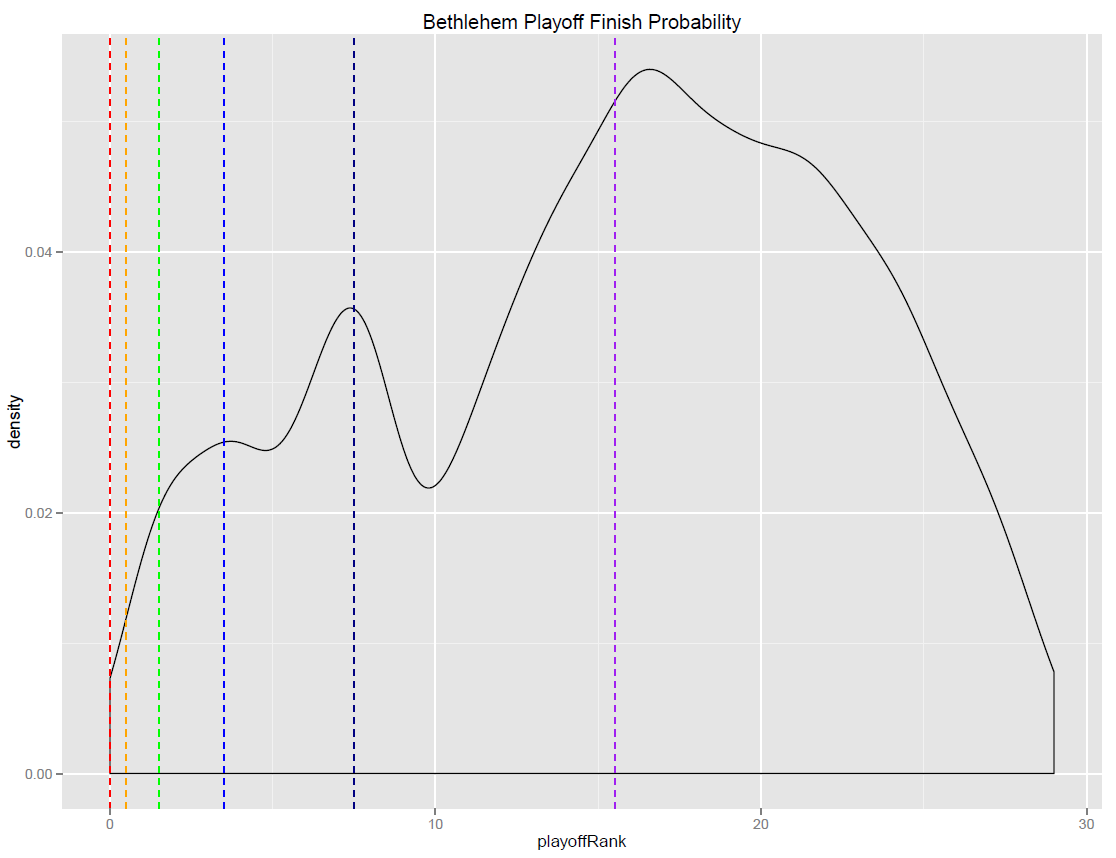
As with MLS, the below density charts show the relative probabilities of Bethlehem and Harrisburg finishing for their final playoff-rank.
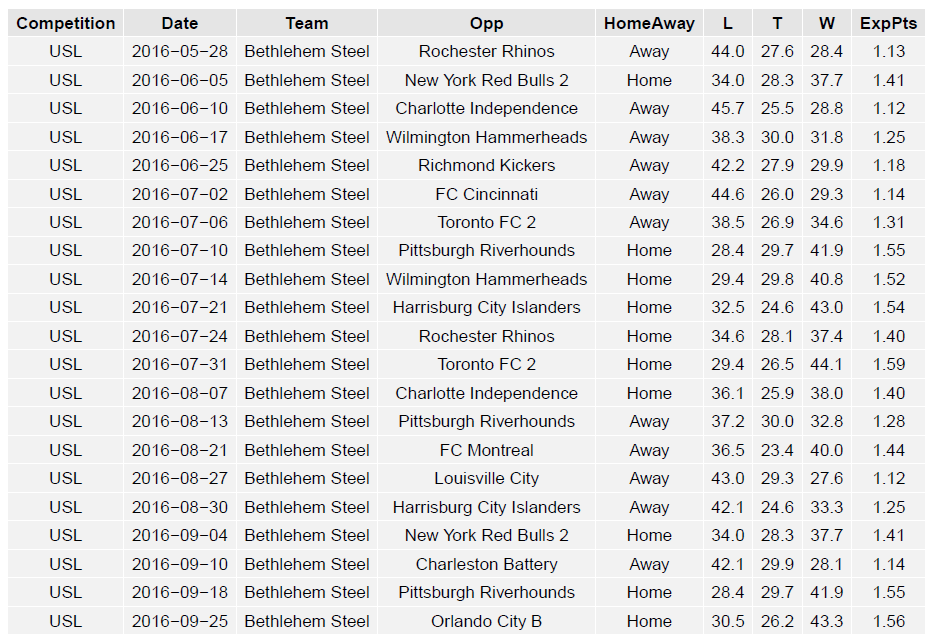
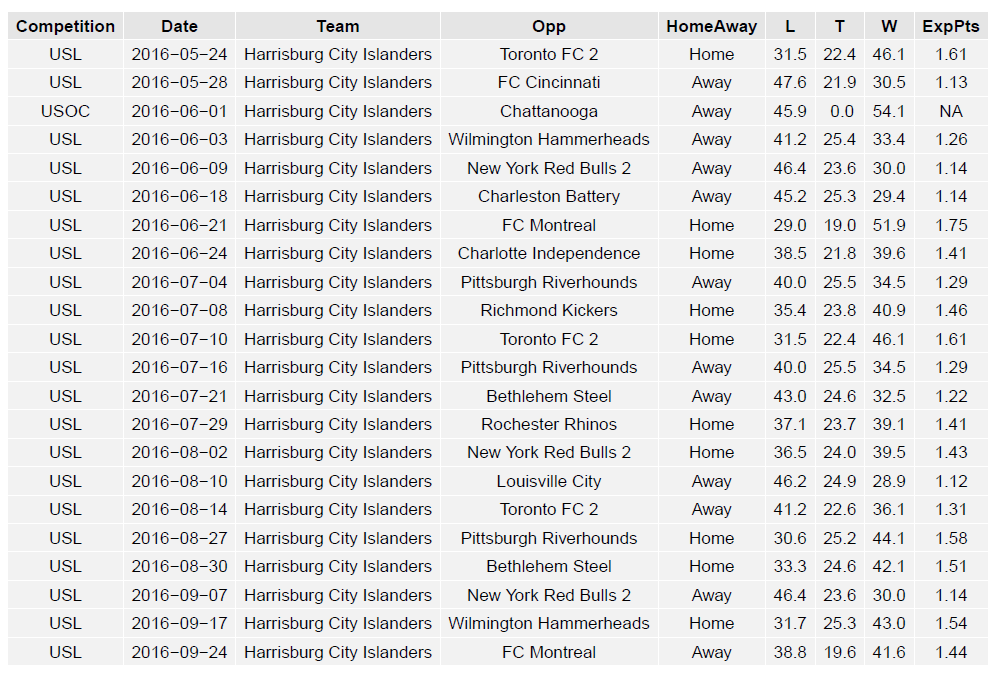
The following are the upcoming matches and associated probabilities for Bethlehem and Harrisburg. Bethlehem has a rough stretch of away matches coming up so it will be very interesting to see how they respond.
Harrisburg is also about to head into a rough stretch of road matches including a U.S. Open Cup match. (I apologize that I did not get this post out before Harrisburg’s 2-1 win over Toronto 2 on Tuesday night.)
As with the MLS post above, the following tables show the average simulation results. They are divided into two tables to present better to your screen.
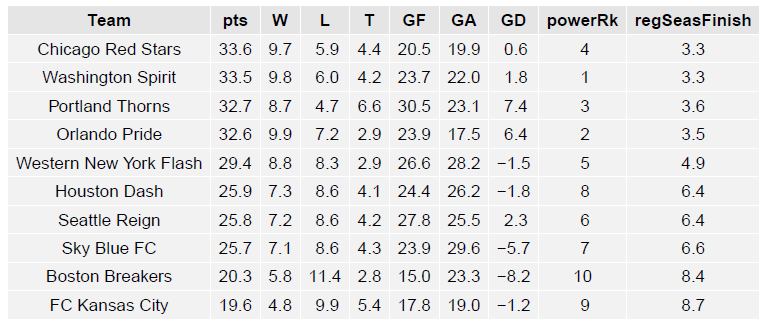
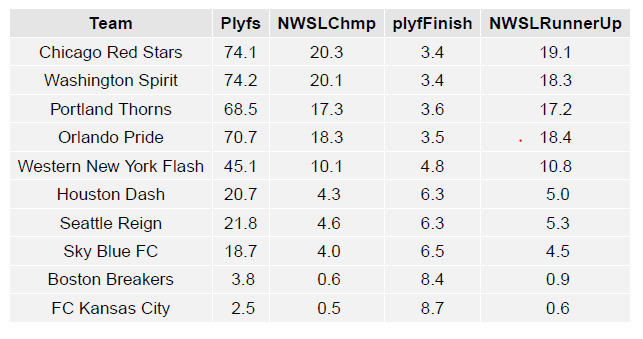
NWSL Projections (through May 22)
While Philadelphia does not currently have a team, I do very much hope that the league expands to Philadelphia as WPS did before it fell apart. I’ve gone to some Washington Spirit games and enjoyed myself very much (except for having to root for a Washington team).
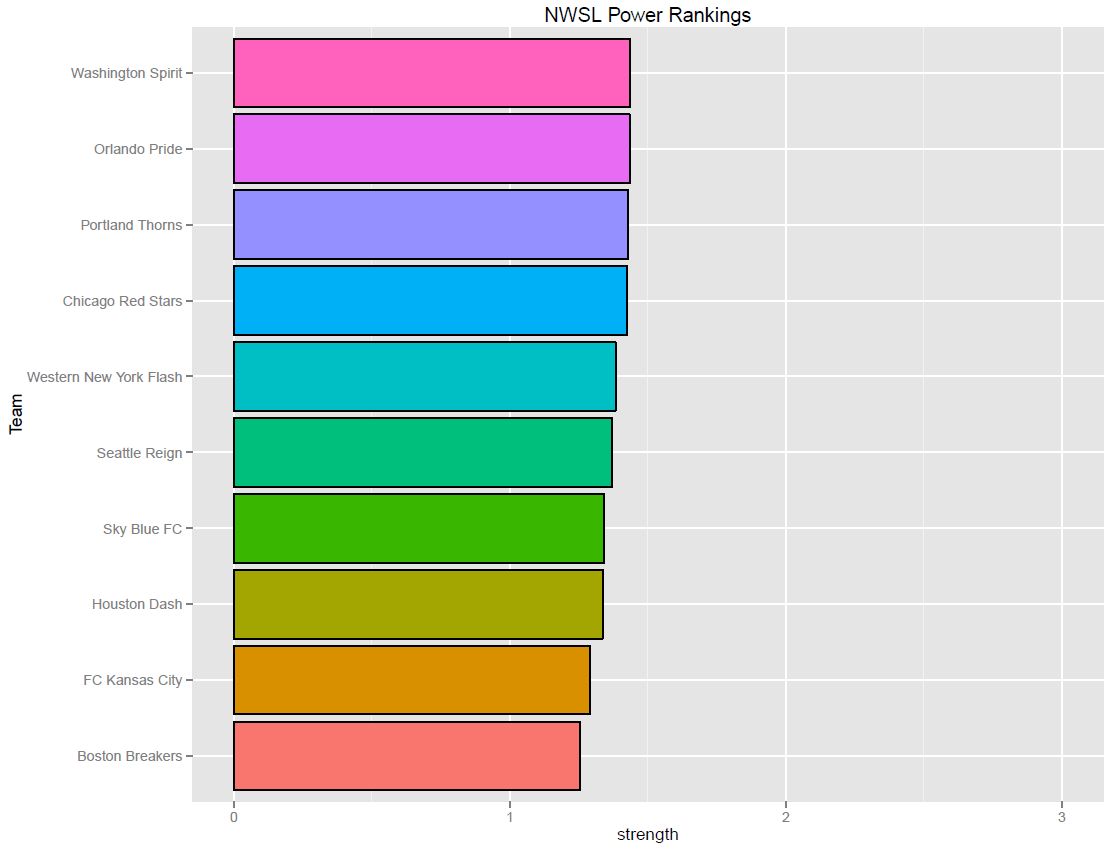
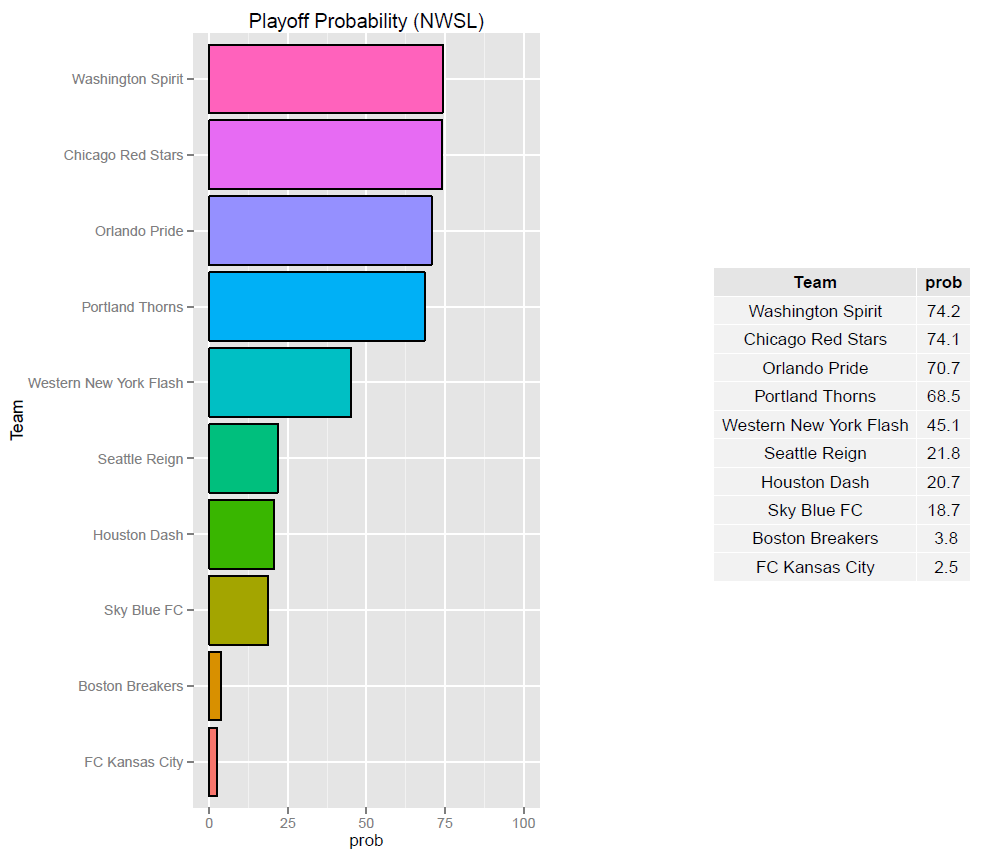
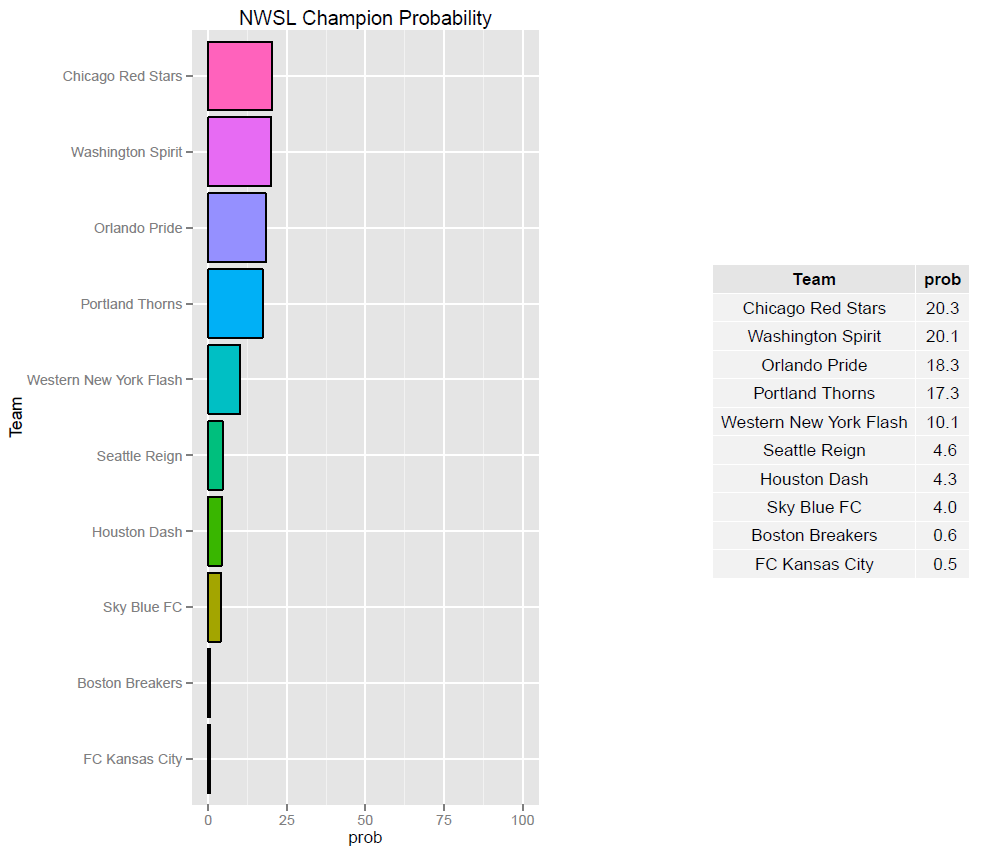
The following tables are the average simulation results produced by SEBA.

So you’re telling me there’s a chance!
Good stuff, Chris. One question, does the MLS simulation account for players missing time with national team duty and/or rest between games? For example, Saturday the Union will be facing Colorado on short rest which won’t help them but Colorado will be without Jermaine Jones which could help the Union.
Not yet on the players missing time, but it’s #1 on my list of adjustments I’d like to make. The problem is that it isn’t easy to gather player-level data so I’m working on securing a process to do that efficiently before I attempt to integrate into the model.
——–
Interesting note on the rest-between-games, is that when I’ve included rest-between-games in the model along with the other variables, it actually indicates that the team with Shorter rest is slightly more likely to do well than the well-rested side (which is actually a result I’ve similarly observed in models for NFL and NCAA-B too). Once I take care of some non-public improvements in my system (to make it more efficient) I intend to look into that anomaly. I suspect it might be something like teams who are expecting short rest might play worse in the earlier game to conserve their energy or that starters are on the bench for the early game to save legs for the later one.
How much does last years results factor in?
at the beginning of the season, they factor in a lot, but the influence of the previous season rapidly decays as we gain confidence in the current season’s ability to measure the strength of teams. As of this point in the season for MLS, last year has almost no influence.
While I normally enjoy data posts this is overwhelming.
I think a weekly and separate MLS and USL posts could be good. Also you should bring in the Open Cup data only for the weeks that there are open cup games for one of the local teams.
I want to enjoy this, but I’m really struggling to right now.
The most important clause in the entire article is, “if the team continues to play like it has been.”
.
Red Bulls seem now not to be playing as they had been earlier, for example.
.
Last season, sometime in late summer, Montreal stopped playing as they had been (he’s from the Ivory Coast and his initials are DD) and began playing differently and better.
.
My new favorite series on the internet. Another reason why PSP is the king of local soccer sites.