
Even ignoring the CBA negotiations, this MLS off-season was full of activity. Consistently under-performing teams like the Chicago Fire and Montreal Impact rebuilt their rosters. Big market teams made big name signings, bringing in players like Jozy Altidore and Steven Gerrard. Teams close to the top, like Vancouver and Columbus, added pieces they believe will get them over the hump. There was a lot of player movement, and this, combined with two expansion teams joining the league, meant high roster turnover was the norm for most teams.
But not the Union.
Aside from bringing in C.J. Sapong, Steven Vitoria, Fernando Aristeguieta, and a few others and trading Amobi Okugo, Chris Albright and the front office mostly chose to stand pat. The Union are returning more than 85 percent of their field players’ minutes from last year. The league average since 2007 is about 71 percent.
In theory, this should be a positive for the team. Teams with low roster turnover tend to outperform teams with high roster turnover by about 8 points on average over the course of a season. So while other teams with higher turnover spend the first weeks of the season learning to play together, the Union should be able to hit the ground running. Now, the Rapids’ game may make you question that statement, but I would argue that result had more to do with tactical and personnel choices than any amount of meshing that needs to take place.
An important question to ask, though, is whether the team made enough roster moves to really improve on last year. There is a negative correlation between roster stability and improvement in points, meaning that the less turnover a team has, the less likely that team is to improve. We can actually project how a team will perform given its roster turnover at each position and its points recorded in the previous season, and this projection does an okay job, especially for teams at the high and low end of roster turnover. On average, it’s off by 7 to 8 points for any given team in any given season. So even though the projection isn’t overly precise, it gives a good range of where we can expect a team to finish.
Below is what the model projects for the 2015 season, with a few surprises (the Fire and Rapids, most notably). First, the Eastern Conference:

And the Western Conference:
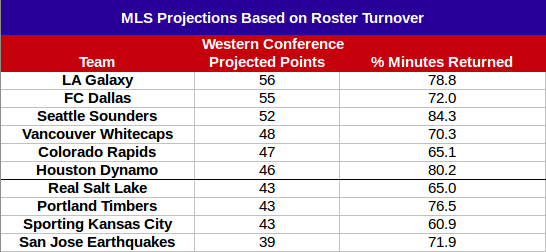
The projections, then, suggest the Union did enough in the off-season to contend for a playoff spot, but maybe not to achieve much more than that given their current talent. Let’s take a closer look at why that is.
The model works by finding the closest historic comparisons to the team, and then taking an average of how those teams performed (this is called a k-nearest neighbors regression, and in this case it is a bit more accurate than other models, like linear regression or LOESS regression). Here are the six closest comparisons to the Union, and the Union’s own statistics for reference:
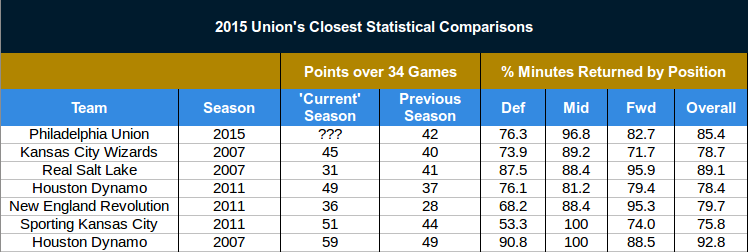
Five of the six teams there improved their points total over the previous season, at least by a couple of games. With that in mind, I wouldn’t be surprised to see the Union do the same, but the projection is tamped down a bit by Real Salt Lake’s 2007 season. This suggests the possibility is there for significant regression for the Union in 2015, and the model’s projection reflects that possibility.
One aspect the model does not consider is Philly’s form in 2014 under Jim Curtin. If the team is better under Curtin’s direction than their final points total suggests (and this is a real possibility given the team’s change in performance after the coaching switch), the model will under-predict the team’s points for this season. If that is, in fact, the case, it makes more sense that the team would hold onto a larger percentage of the roster, because that roster is better than its performance indicates, and the team will be able to improve just by virtue of Curtin coaching the entire season. The front office must believe that is the case or they would have made more off-season signings.
Given the Union’s relatively stable roster, then, it’s likely they will do no worse than last season, especially in an Eastern Conference with two expansion teams trying to find their footing and two or three other teams undergoing large rebuilding projects.
Unfortunately, though, overall improvement may be limited, unless their form from the second half of last season is indicative of a stronger side than their final standing would suggest.

Linear Regression.
.
I took math in college and my professor came in and sat down on the desk, feet dangling like a kid and said, “Math is fun. Math is creative. This semester I want you to use your imagination with functions and linear regressions.”
.
I live in the world of words- not numbers – dropped that class in 6 minutes, found a more appropriate mathematical model for me and skated on through. Linear Regression. Still gives me chills. Ten years later became an RN and had to learn all about them anyway.
.
Tells me what we all figure- mid table team then…mid table team now…mid table team going forward. Hey a puncher’s chance though. I rue those words— puncher’s chance.
.
Good stuff Kevin.
some statistics will catch your eye quite quickly and have more validity than others when it comes to footy…………..these statistics don’t seem to mean much. Roster turnover and lack of are subjective….footballers drop in and out of form…..and teams change their tactics and formations from year to year. To predict overall points gained………….plenty of ways to disprove the hypothesis….or let me remember college…null hypothesis?
“One aspect the model does not consider is Philly’s form in 2014 under Jim Curtin. If the team is better under Curtin’s direction than their final points total suggests (and this is a real possibility given the team’s change in performance after the coaching switch), the model will under-predict the team’s points for this season.”
.
OK, so what happens if you take the points earned while Curtin was coach last year, and prorate that amount of the course of the whole season. Then use that number to predict the new number for this year?
.
I find the last two rows on the table the most interesting, because those seem to fit the Union the most – 100% of the midfield minutes (via starters – I know Okugo is gone obviously) returning, with changes of varying degrees at forward and defense.
I’m willing to bet a year’s supply of donuts that Chicago doesn’t finish 4th in the east. I’m almost willing to bet they don’t finish better than 7th.
Yeah agreed. And there is NO WAY Colorado makes the playoffs in the West. Not after what I just saw at PPL this past weekend.
.
Not saying the Union are guaranteed a spot either, but they are certainly better than Colorado.
Also, what about the Energy Drinks finishing third?? They have lost too many pieces including a decent coach on the rise and one of the best players this league has ever seen who tallied 10 goals and 14 (!) assists last season.
I don’t know. Chicago is pretty loaded…
Sarcasm?
I wish. They have actually mustered up some talented players and I think that they will be a tough team to play against, this year. I don’t see them finishing fourth as being beyond the realm of possibility…
Also, how does DC end up first?
Love me some analytics! Would like to hear whether the Union are doing much of their own beside fitness-related data. Given the recent “lightening” of their PR staff, my guess is no. Several MLS teams are I believe. Many top European clubs now employ an entire staff for analytics. ESPN’s doc on Southampton was pretty impressive from the amount and use of data they employ. Looking forward to more from you Kevin!
Link or title to the Southampton article?
http://prosoccertalk.nbcsports.com/2015/01/02/video-watch-the-southampton-way-documentary-in-full/
I am even less mathematically oriented that Joel claims to be. But I do have a question. Does not the use of statistics to predict future action at its most fundamental confuse the dependent variable – the effect in the world of words – with independent or determinate one – the cause in the world of words.
.
You seem to assume that roster stability determines success, if I have correctly understood (it is eminently probable that I have not). I would argue that roster stability reflects success not determines it. A team stands pat when it has been good, all other things being equal, on the assumption that the good performance will continue. Performance is more the determinant than is roster stability. Chivas was poor and disbanded. Seattle did not clean house; Chicago, Colorado and Montreal did.
Yeah, cause and effect is a good question to ask in this sort of analysis. I’m not sure it has an answer, without more data and correlating data.
Data, of necessity, represents past history. Past history does not necessarily predict future events, as per the caveats on all SEC approved investment prospectuses.
Yes, absolutely. That doesn’t mean there is – or isn’t – a correlation, though. There can still be a correlation between past events, and the current/future events serve as a statistical out-lier. To make up an example, “80% of people who watch Danny Cruz play suffer a brain aneurysm.” Let’s pretend there is good, solid scientific evidence for that statement. Does it mean Danny Cruz’s play causes the aneurysm? Does it mean people who are more prone to aneurysms also happen to be more prone to watch Cruz? That’s where cause and effect come in.
.
The fact that 20% of people who watch Cruz don’t suffer an aneurysm doesn’t validate or invalidate the conclusion. It just means they’re a statistical out-lier.
.
Data can’t 100% predict future events. But good data can predict events within a degree of certainty.
Interesting information. While I’m not fully convinced about it’s predictive power, I think you’ve done a great job proving the general relationship between roster turnover and immediate performance improvement. Thanks for putting this all together and gathering the data.
—
A couple of things would be interesting to include in this is the interaction effect of Age vs. Turnover and an examination of the lag-effect of Turnover against Improvement. I would expect retaining younger players could lead to much greater improvement than retaining older players. Additionally, improvement due to roster turnover would likely have a lag effect which would only show improvement within 2 years or so.
I’m struggling a bit – the two statements I pulled from the article feel contradictory to me. Can someone please help me understand if I’m missing something? The overall gist of the article seemed to be that stability is generally a good thing, but the second quote below seems to refute that.
“Teams with low roster turnover tend to outperform teams with high roster turnover by about 8 points on average over the course of a season.”
“There is a negative correlation between roster stability and improvement in points, meaning that the less turnover a team has, the less likely that team is to improve.”
Seems the article succinctly argues to me that the club is a non playoff playoff team. Or more simply- mid table.
.
I’m surprised by the predictions and ultimate outcome given what I’ve read before in the book “Soccernomics”. The authors of the book dedicated a whole chapter to this stuff and I thought their conclusion was the exact opposite (it has been a few years since I’ve read it though), that teams in the EPL and beyond that constantly splash cash in free-agency on all the biggest signings actually end up getting a very poor return on their investment. I believe their analysis determined that teams that spent more money on keeping their talent, rather than buying new talent outside of the organization, achieved the best return. I’m absolutely not gifted in math at all so I’m not questioning your methods, just interesting to see your different conclusion…