 The Union slump worsened on Saturday with the 2–1 loss to Columbus. The Union’s record on the road now stands at 3–5—4. Overall, they are 8–6–10 with a 5–1–6 home record.
The Union are now winless in five games, having gone L–D–D–D–L since their last win on the road in New England on July 17, which also happens to be the last shutout the team has recorded and the last league game Carlos Ruiz played for the club. Previously, the longest winless streak of the season occurred in the beginning of May with a road loss to Portland, a draw at home to LA and a loss to Dallas. Before that, the longest winless streaks were six games (0–3–3) and five games (0–4–1) in 2010. Since their last home win, against Chivas USA on June 25, the Union are 2–2–5. In other words, since their last win, the Union have earned three out of a possible 15 points. Since their last home win, they have earned eight out of a possible 24 points.
The Union have demonstrated little ability to come from behind this year. When an opponent scores first, they are 1–6–4, the only come-from-behind win coming at home against Chivas. In each of their five road losses, the Union conceded first. By comparison, when the Union score first, they are 7–0–4. (There have been two scoreless draws this season, one at home against now second place Kansas City, the other on the road against San Jose).
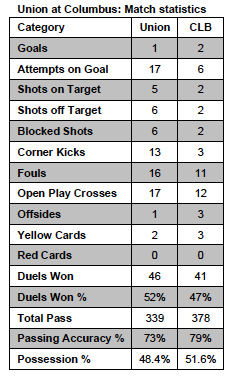
Match statistics: Union at Columbus
Looking at the match statistics it would be easy to believe Philadelphia was the winning team on Saturday.
The Union’s 17 attempts on goal was nearly three times as many as the six recorded by Columbus. The five shots on target recorded by the Union was more than twice as many as the two recorded by the home team. The Union recorded more than four times as many corner kicks, more open play crosses and had the upper hand in duels won. 
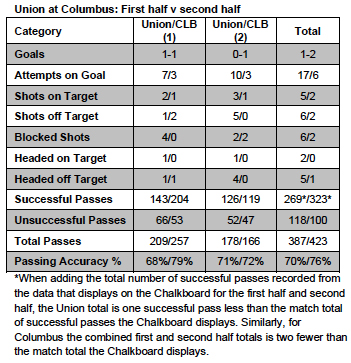
The advantage becomes more pronounced when you compare the first half numbers with the second half numbers. The Union upped its tempo in the second half, increasing the first half tally of three attempts on goal to eight while also increasing the number of shots on target from two to three. Meanwhile, Columbus recorded only a single shot on target from three attempts on goal in the first half, the same in the second half. The difference is that both of their shots on goal—the garbage dribbler in the first half and the penalty kick in the second half—went in.
Paunovic led the team’s offensive production with one goal from three shots on goal out of eight shots. Sebastien Le Toux had one shot on goal from three shots while Danny Mwanga and Stefani Miglioranzi each recorded two shots, Mwanga recording one shot on goal. Jack McInerney recorded one shot, a header that was off target.
Looking at the bright side, the Union continue to improve their ability to create corner kicks. The ten corner kicks recorded against Dallas at home on August 13 was the highest number created this season and that number increased to 13 against Columbus. The Union are now tied with Toronto at 98 corner kicks, one more than bottom-ranked San Jose.
The Union even scored a goal off of a corner kick for only the second time this season, the previous corner kick goal occurring against Toronto and scored by Danny Mwanga. The team’s conversion rate for corner kicks now stands at 2.04 percent. Veljko Paunovic’s header was also the second time the Union have scored a headed goal in 2011, the previous headed goal coming from Keon Daniel against Real Salt Lake.
(N.B.: Once again, the figures provided by the Stats tab and the Chalkboard tab at MLS MatchCenter do not agree. The Stats tab reports fewer passes for each team and greater passing accuracy than the Chalkboard tab.)
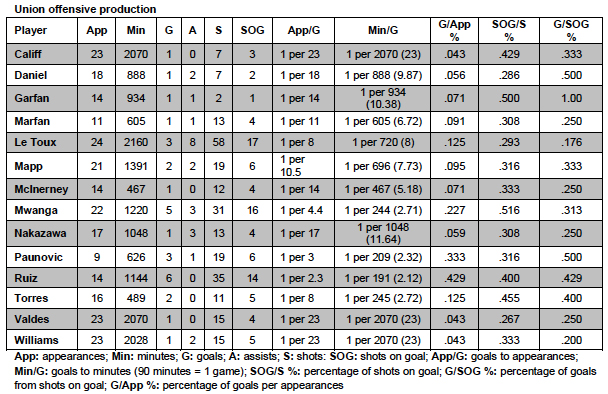
Union offensive production
When Paunovic scored that cracking goal against Chicago a few weeks ago, it was his second goal from three shots on goal in six appearances. He now has three goals from six shots on goal in nine appearances.
In terms of goals per appearances, that works out to Paunovic averaging a goal every three appearances. In terms of minutes played, Paunovic is averaging a goal every 209 minutes or 2.32 games. Only one player this season has better numbers than that and Carlos Ruiz is no longer with the club.
Of the 14 Union players to have scored this season, six players have scored more than one goal. In addition to Ruiz (6) and Paunovic (3), those players are Sebastien Le Toux (3), Justin Mapp (2), Mwanga (5) and Roger Torres (2). Looking at goals per appearances, Danny Mwanga is behind Ruiz and Paunovic with an average of one goal per 4.4 appearances, or one goal every 244 minutes played (2.71 games). Next is Le Toux with one goal per eight appearances, or one goal every 720 minutes played (8.0 games). Torres also averages one goal every eight appearances, but in terms of actual minutes played has a much better average of one goal every 245 minutes played (2.72 games). Mapp follows with one goal every 10.5 appearances, or one goal per 696 minutes played (7.73 games). Among those who have scored only one goal, Michael Farfan and Jack McInerney have the best goals per appearances numbers with McInerney’s one goal every 467 minutes played (5.18 games) topping Marfan’s one goal every 605 minutes played (6.72 games).
In order to get a further sense of the efficiency of the Union’s offensive production, I created percentages for goals from appearances (G/App), shots on goal from shots (SOG/S) and goals from shots on goal (G/SOG). Unsurprisingly, these percentages generally follow the rankings above.
The departed Carlos Ruiz leads in goals per appearances with a .429 average, followed by Paunovic (.333), Mwanga (.227) and a tie between Le Toux and Torres (.125).
Mwanga leads the percentage of shots on goal from shots with a .516 average, followed by Torres (.455), Ruiz (.400) and a tie between Paunovic and Mapp (.316). Gabriel Farfan’s one shot on goal from two shots is best overall at .500.
Paunovic is the leader of goals from shots on goal at .500 (Daniel’s one goal from two shots on goal is also .500), followed by Ruiz (.429), Torres (.400) and Mapp (.333).


“By comparison, when the Union score first, they are 7–0–4.”
– How many times have we heard the coaching staff say they are happy with the team’s play and the chances created after a game in which the other team scores first? Thanks for digging this stat up, Ed.