Below are the current forecasts using data from matches through September 5, 2017.
Hexagonal Power Rankings
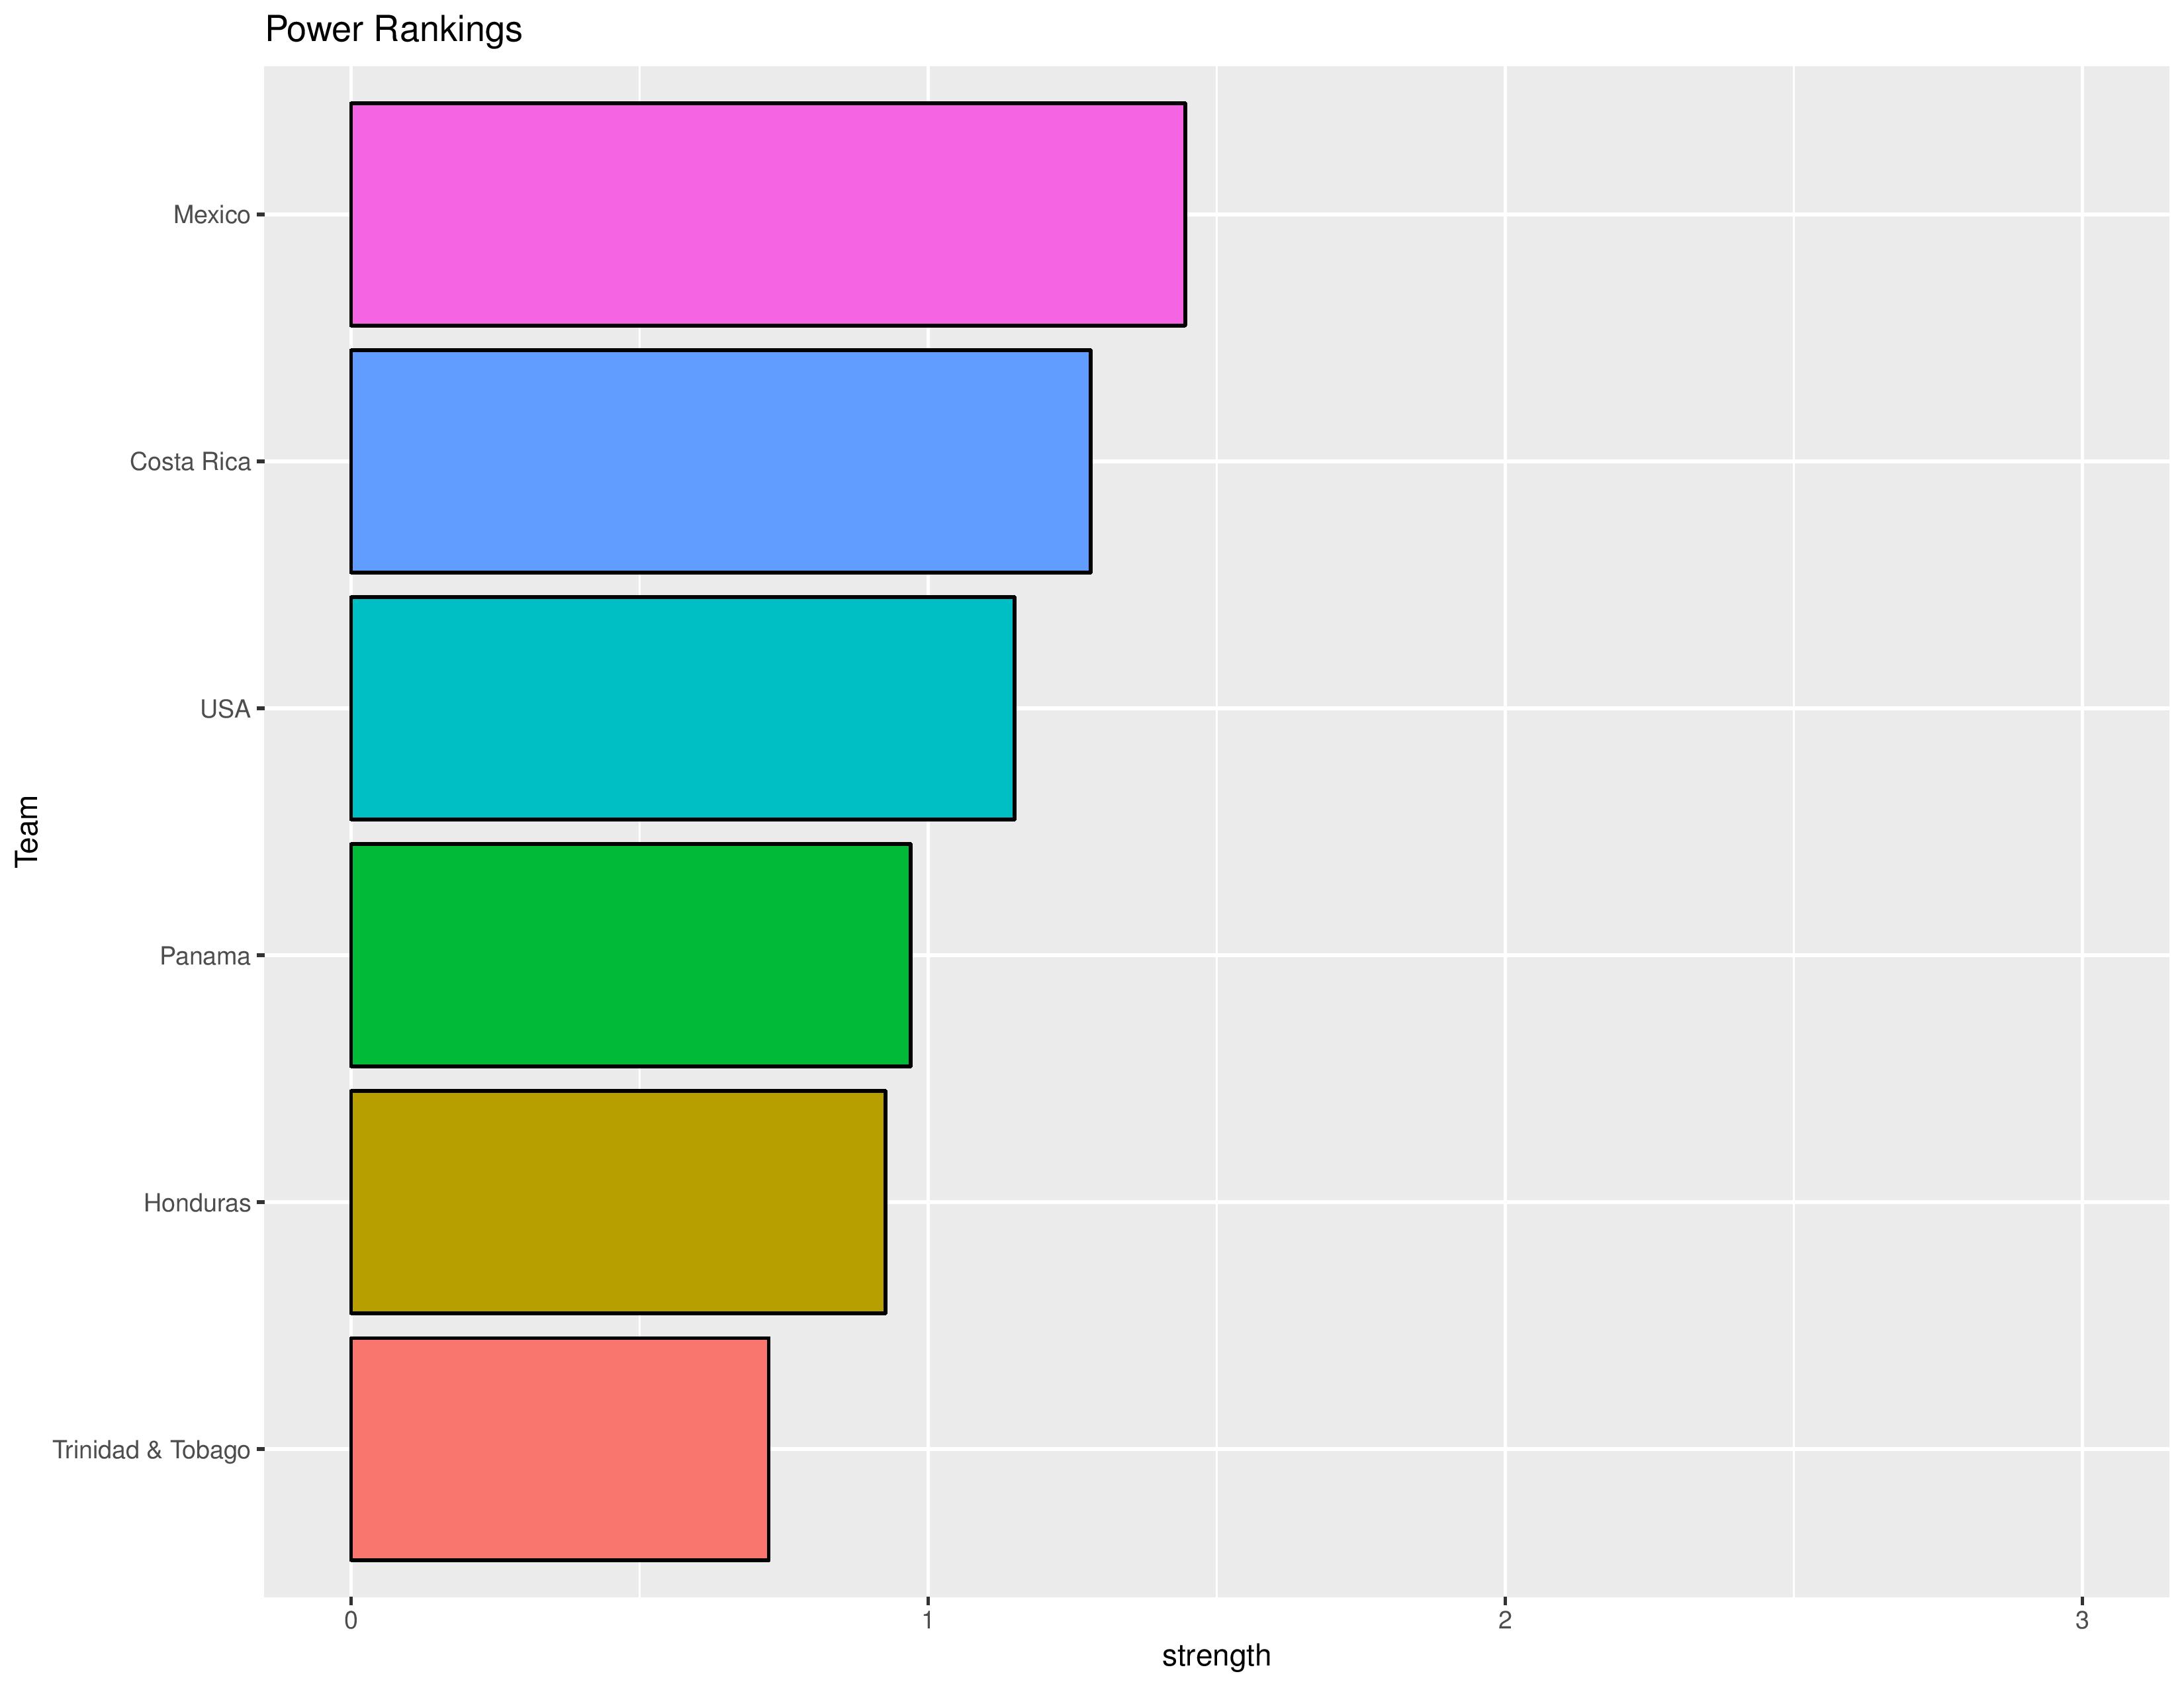
The “Power Rankings” we concoct are the actual “strength” of the team according to competitive expectations. The value represented on the X-Axis is the average amount of points we expect that team to receive when playing against every national team that participated in the previous World Cup on neutral territory:

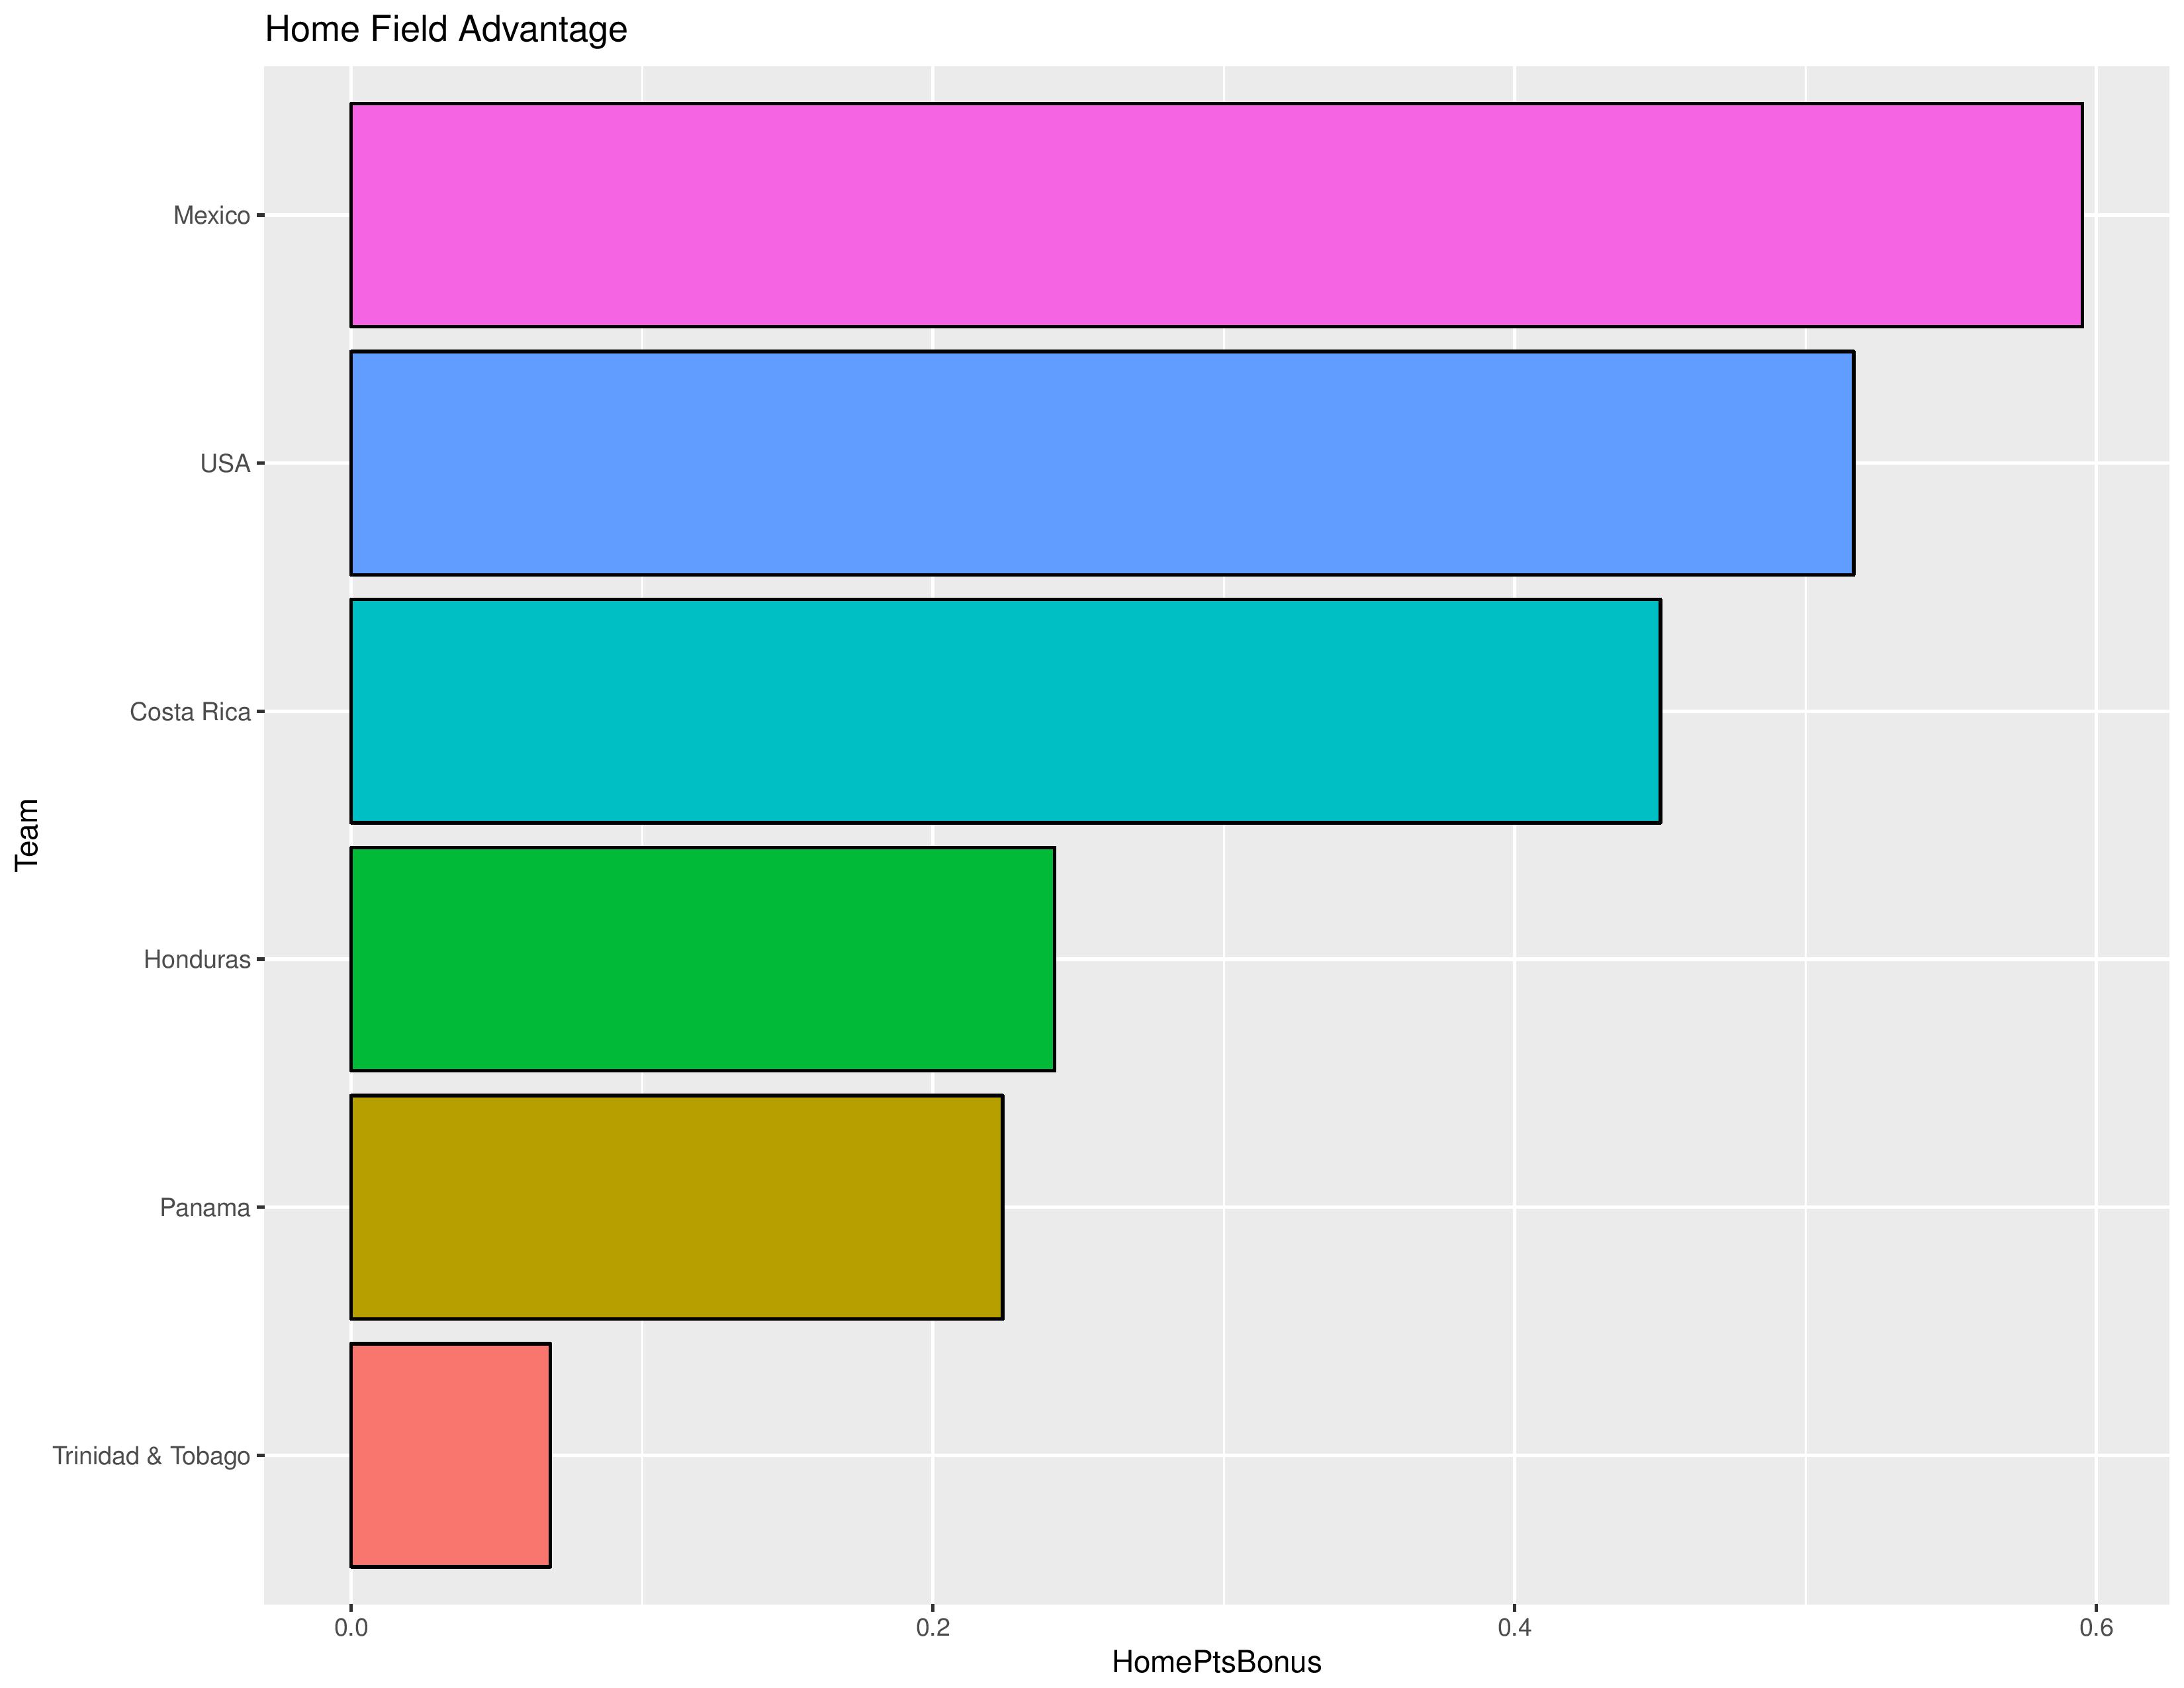
The following chart shows the average points bonus for a particular nation’s home field advantage. This is important in explaining why teams may seem to have favorable odds to qualify even when ranked lower.
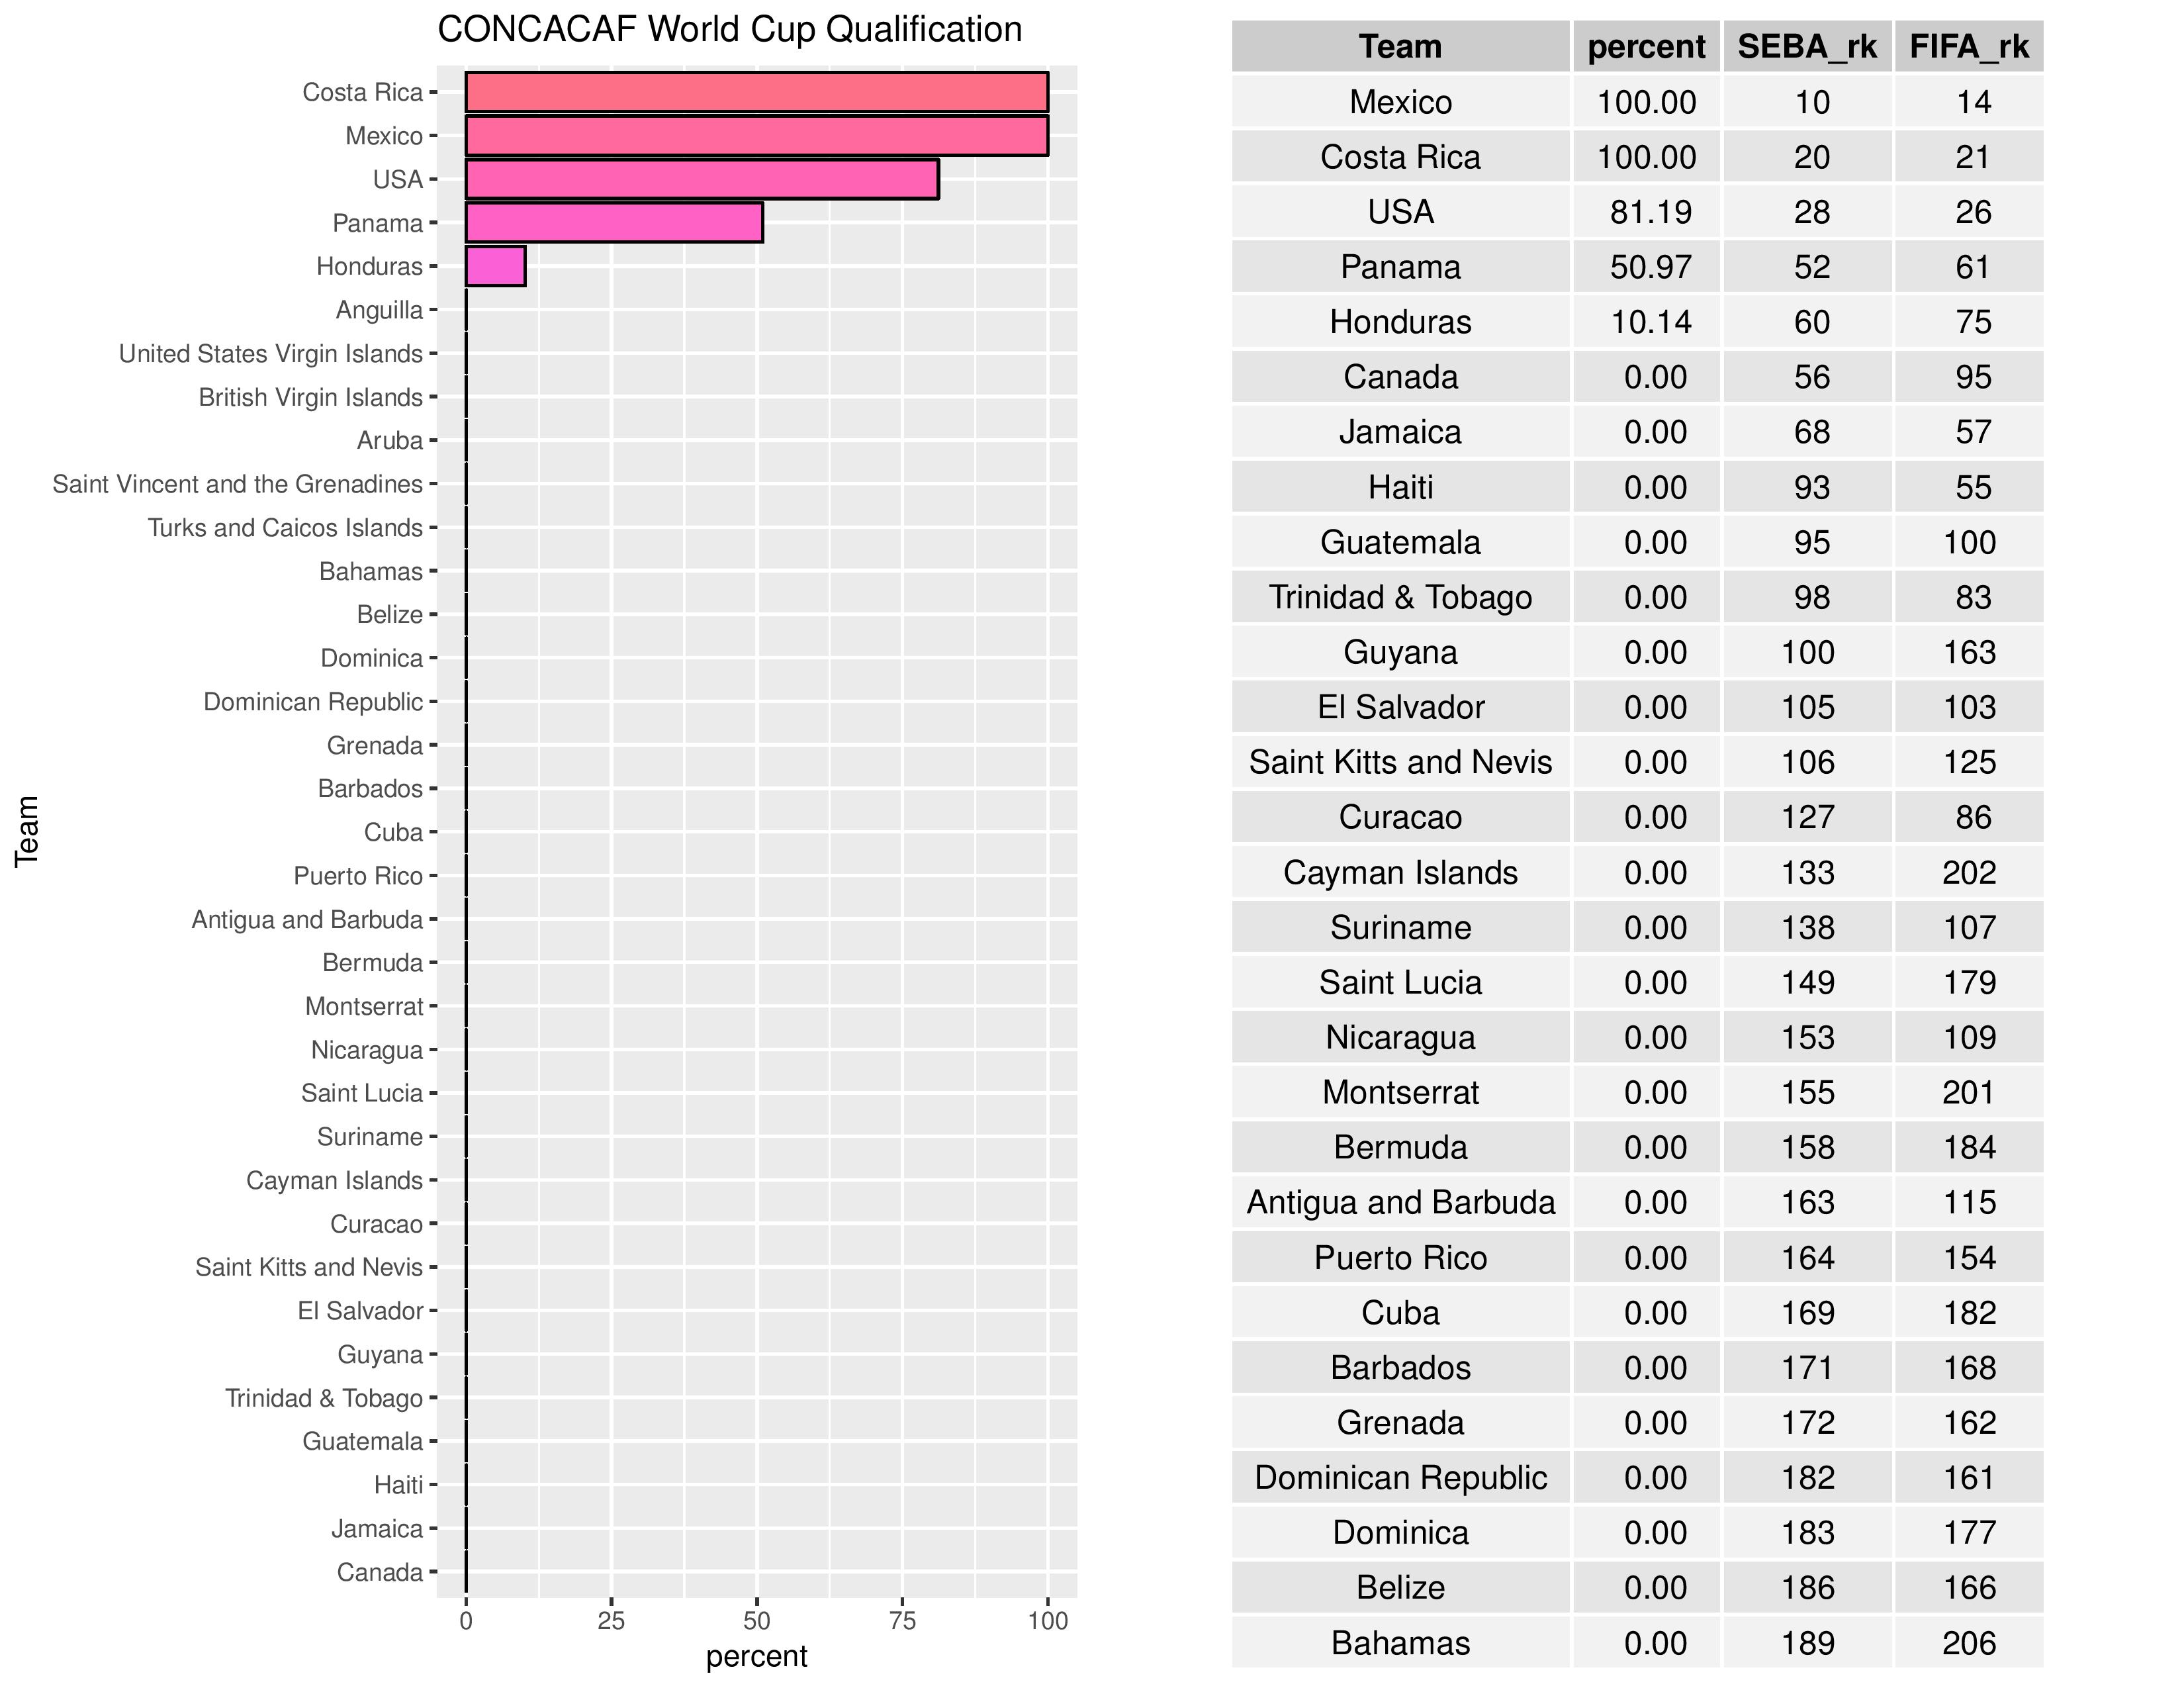
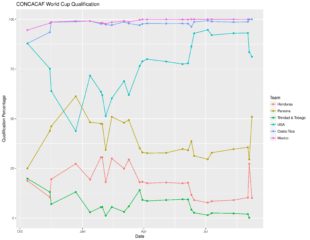
World Cup Qualification
The US’s chances of qualifying for the World Cup have decreased from 94.70% to 81.19% from the last published forecast.

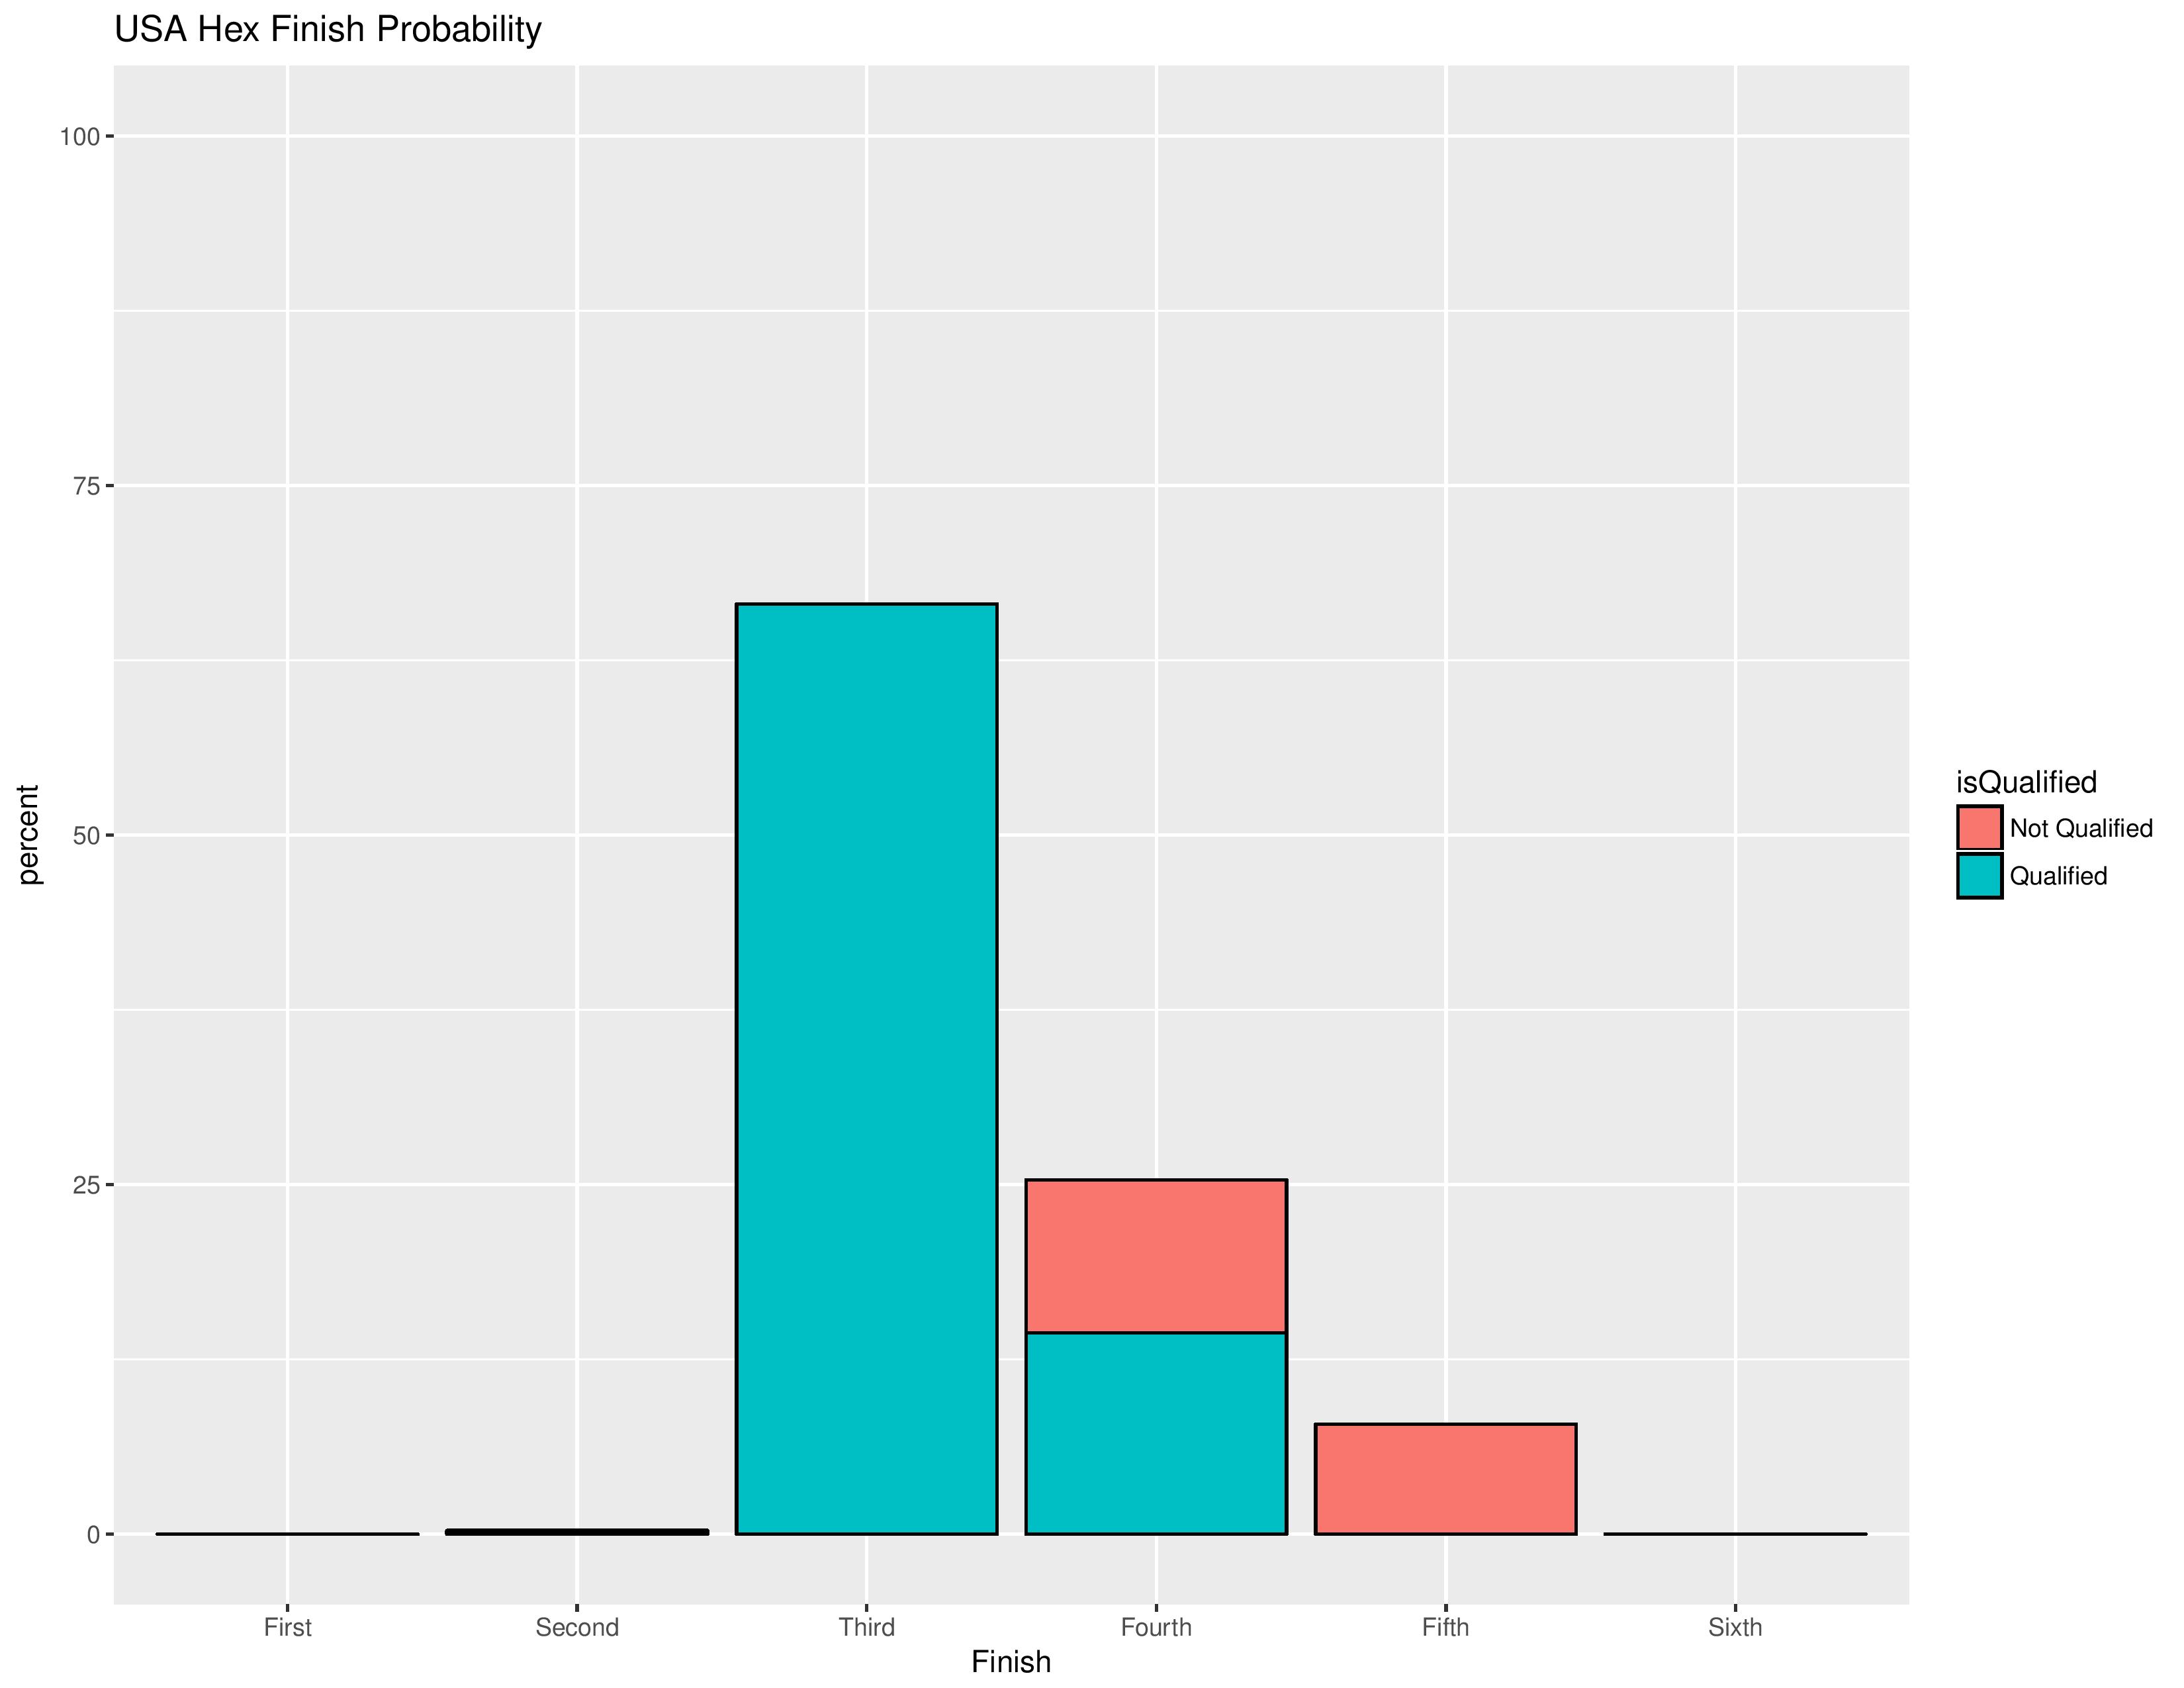
The next chart shows the probabilities of each of the USA’s potential Hex finishing spots.
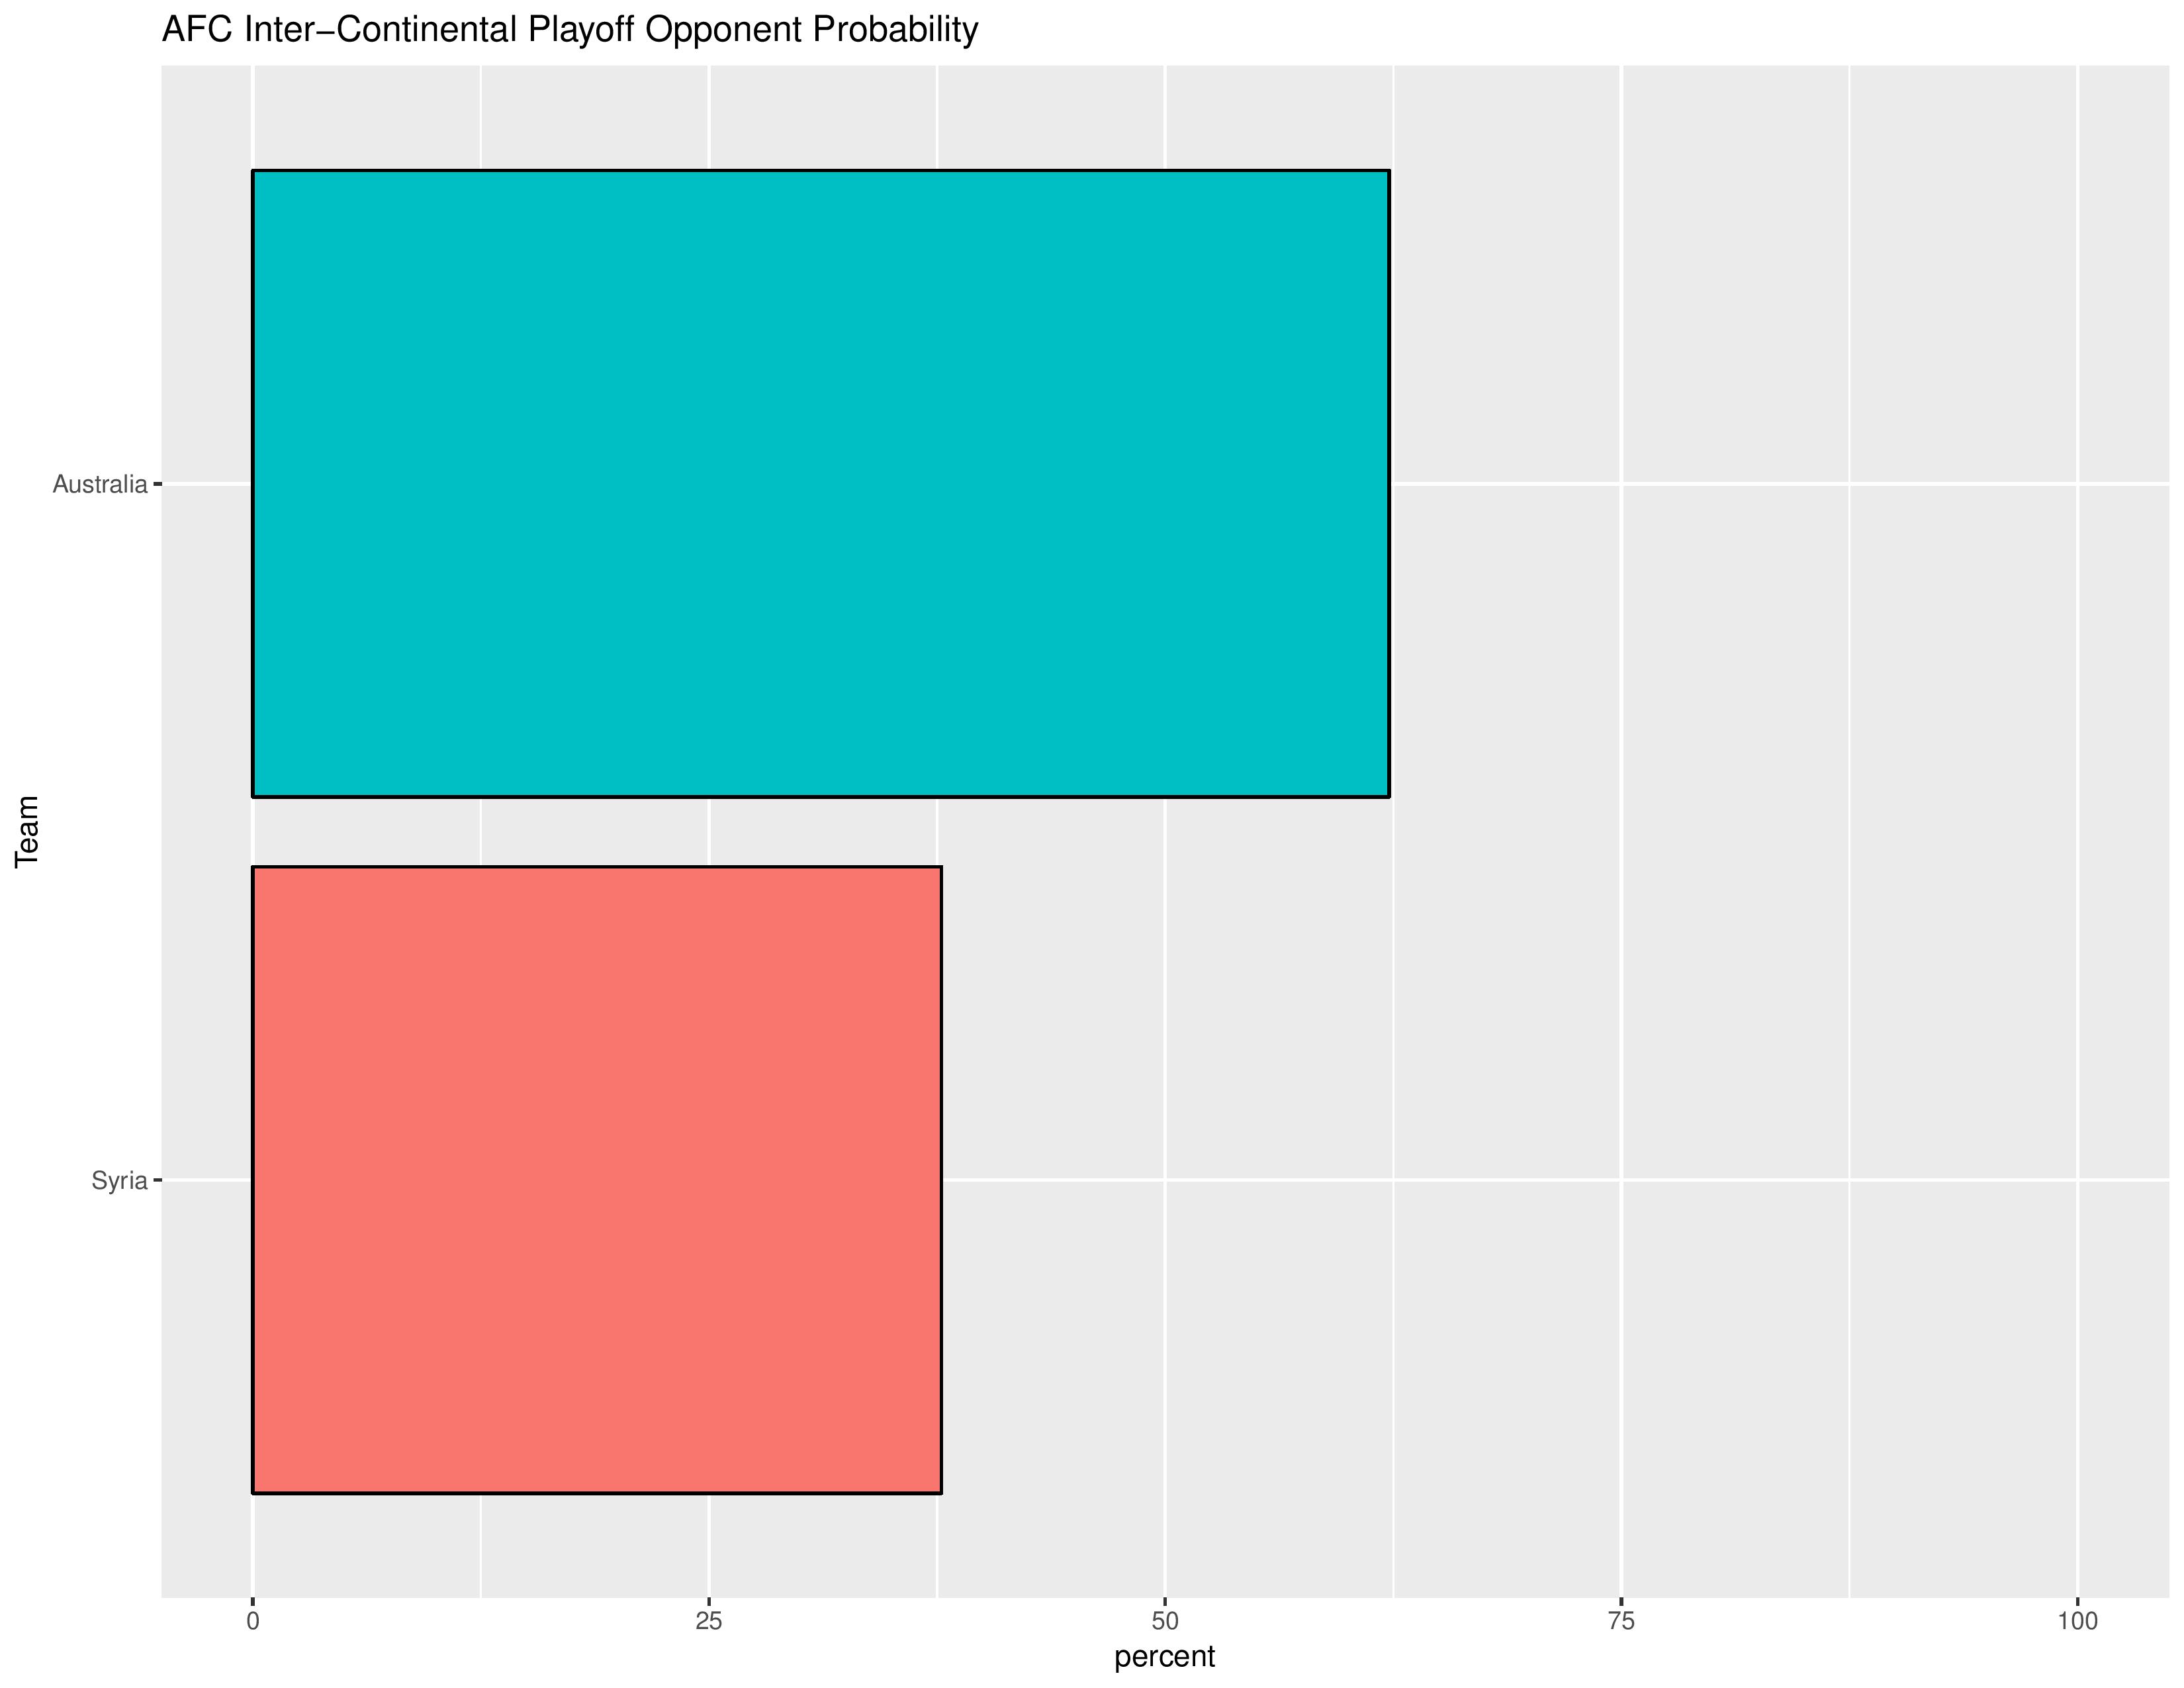
The following chart shows the likelihood of the AFC team for the inter-confederation match-up (4th place CONCACAF vs. 5th place AFC).
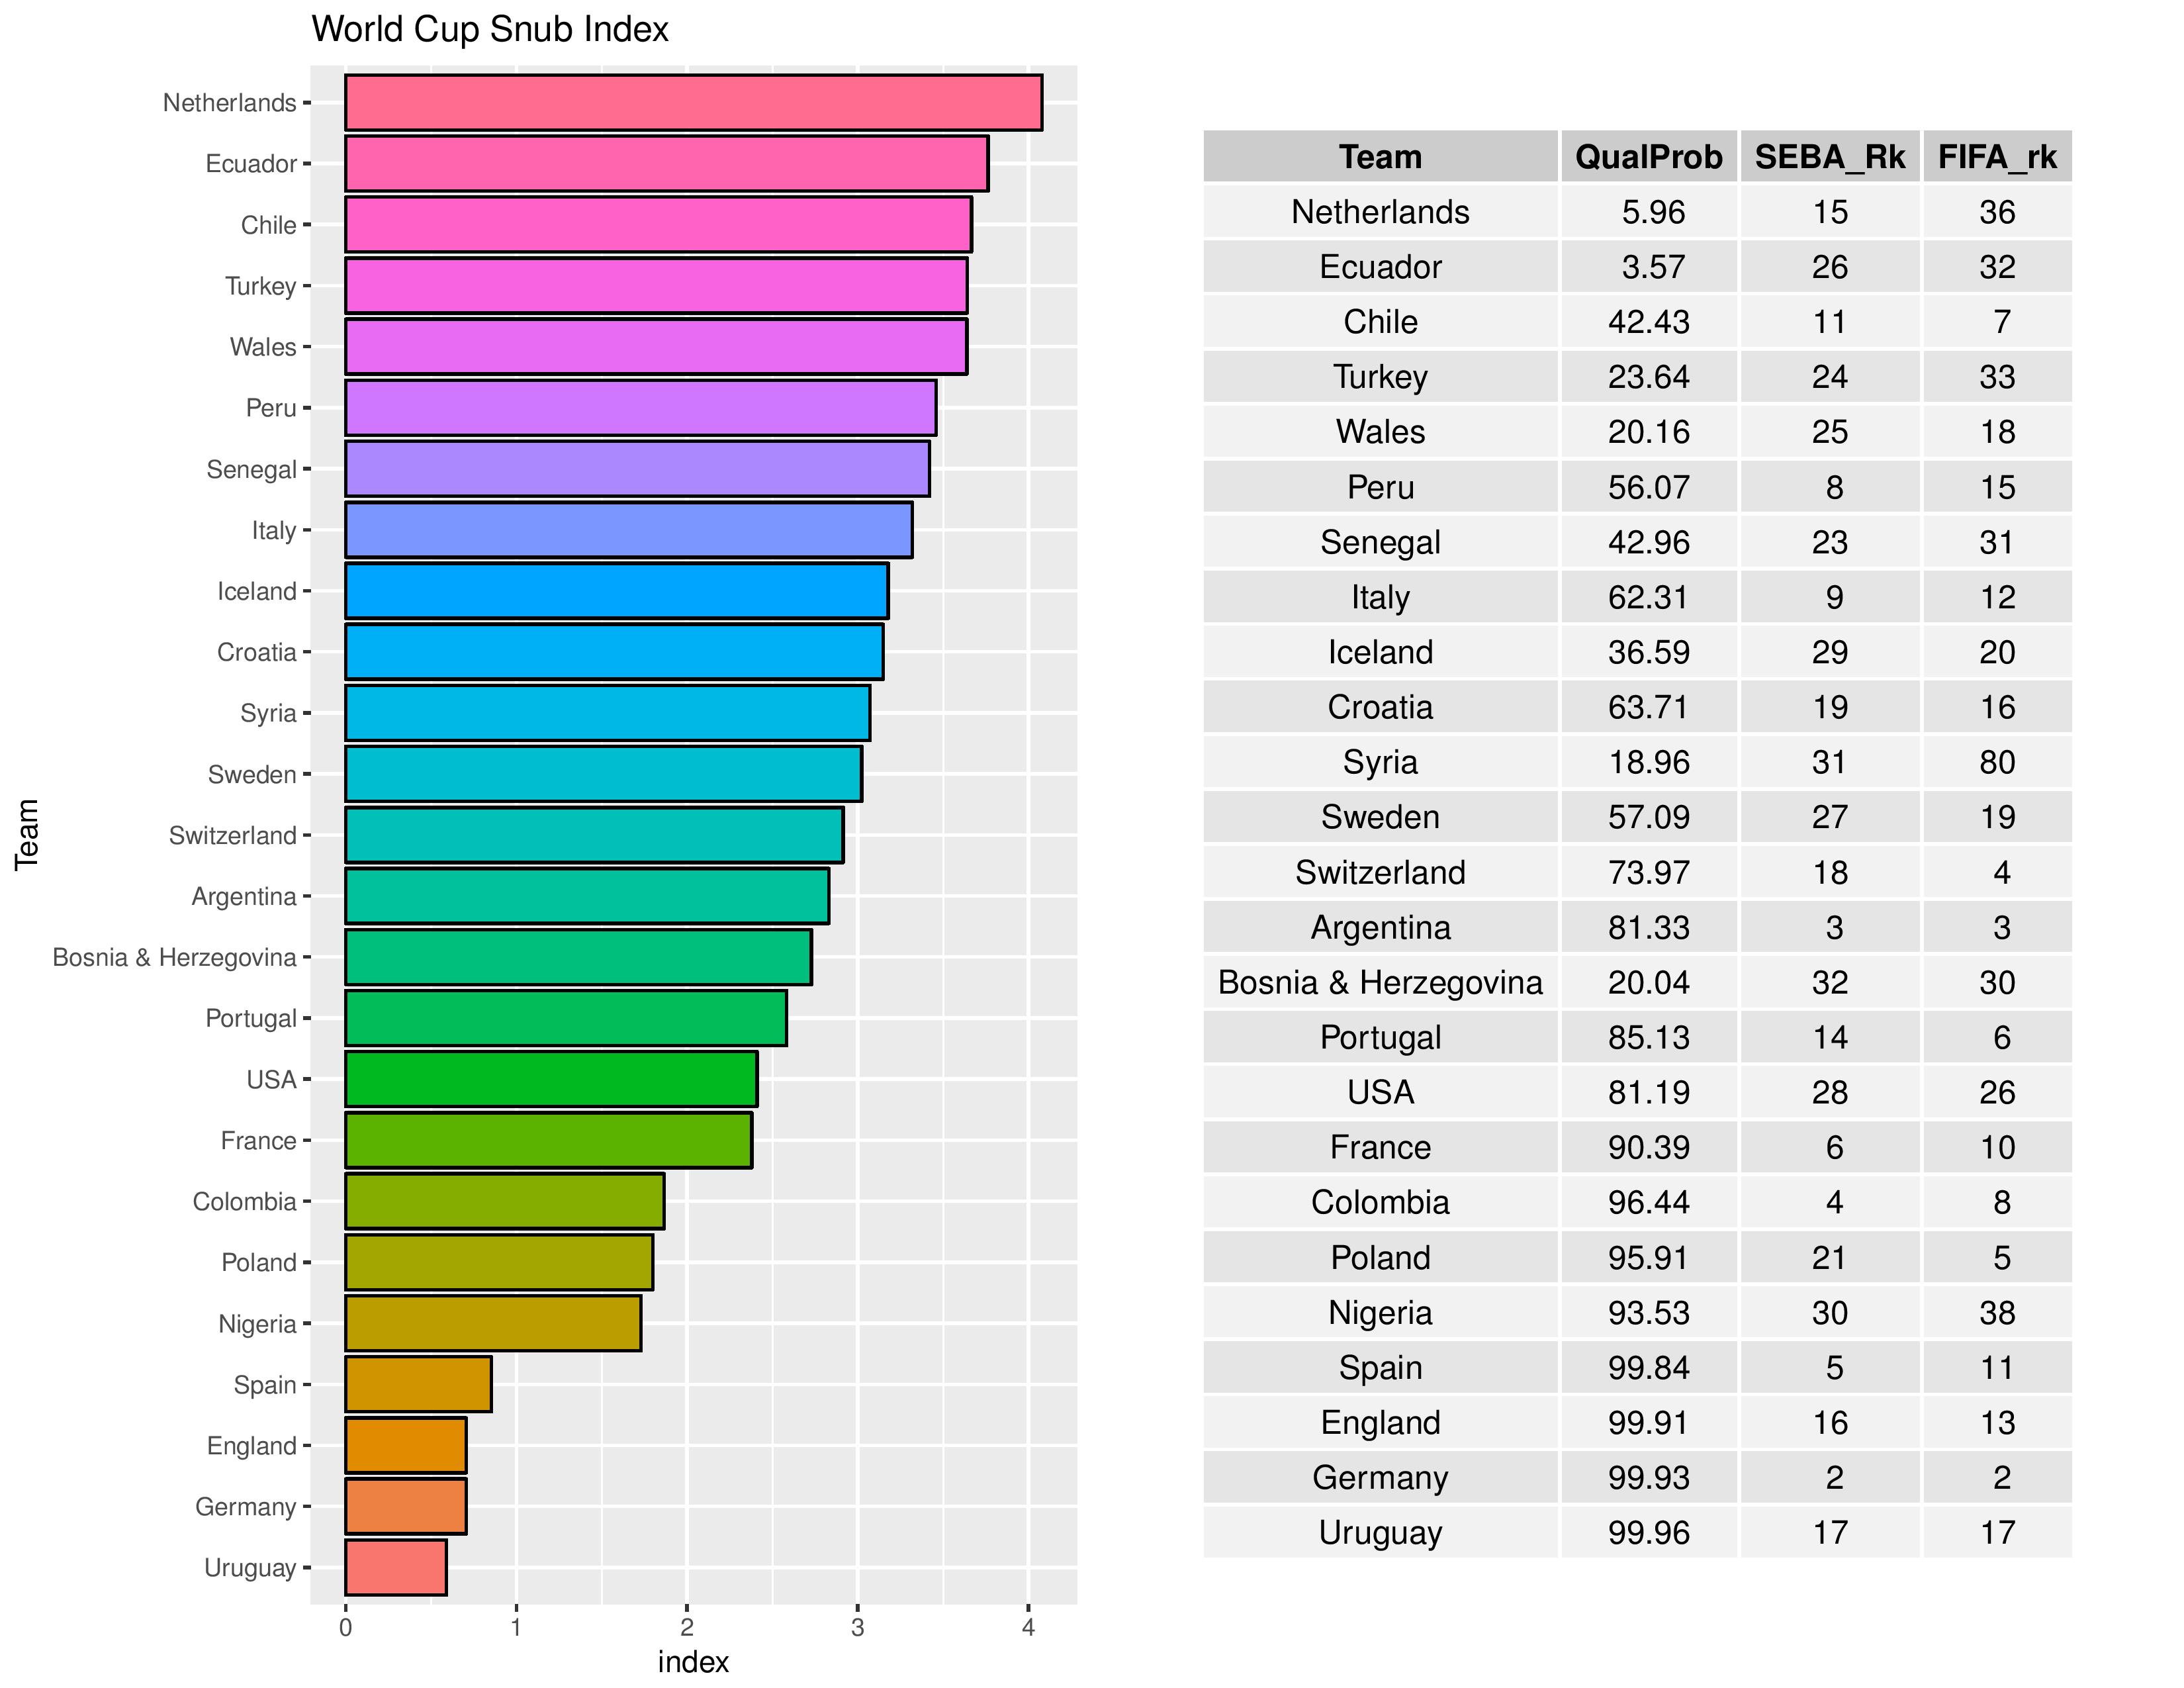
The following chart shows the “Snub Index.” If the World Cup were to be a tournament for the 32 truly-top teams in the world (at least according to SEBA), then this chart is sorted by how damaged the top 32 teams’ chances are in qualifying for the World Cup. If they have already qualified (or have >= 99.995% odds) then they disappear from this chart.
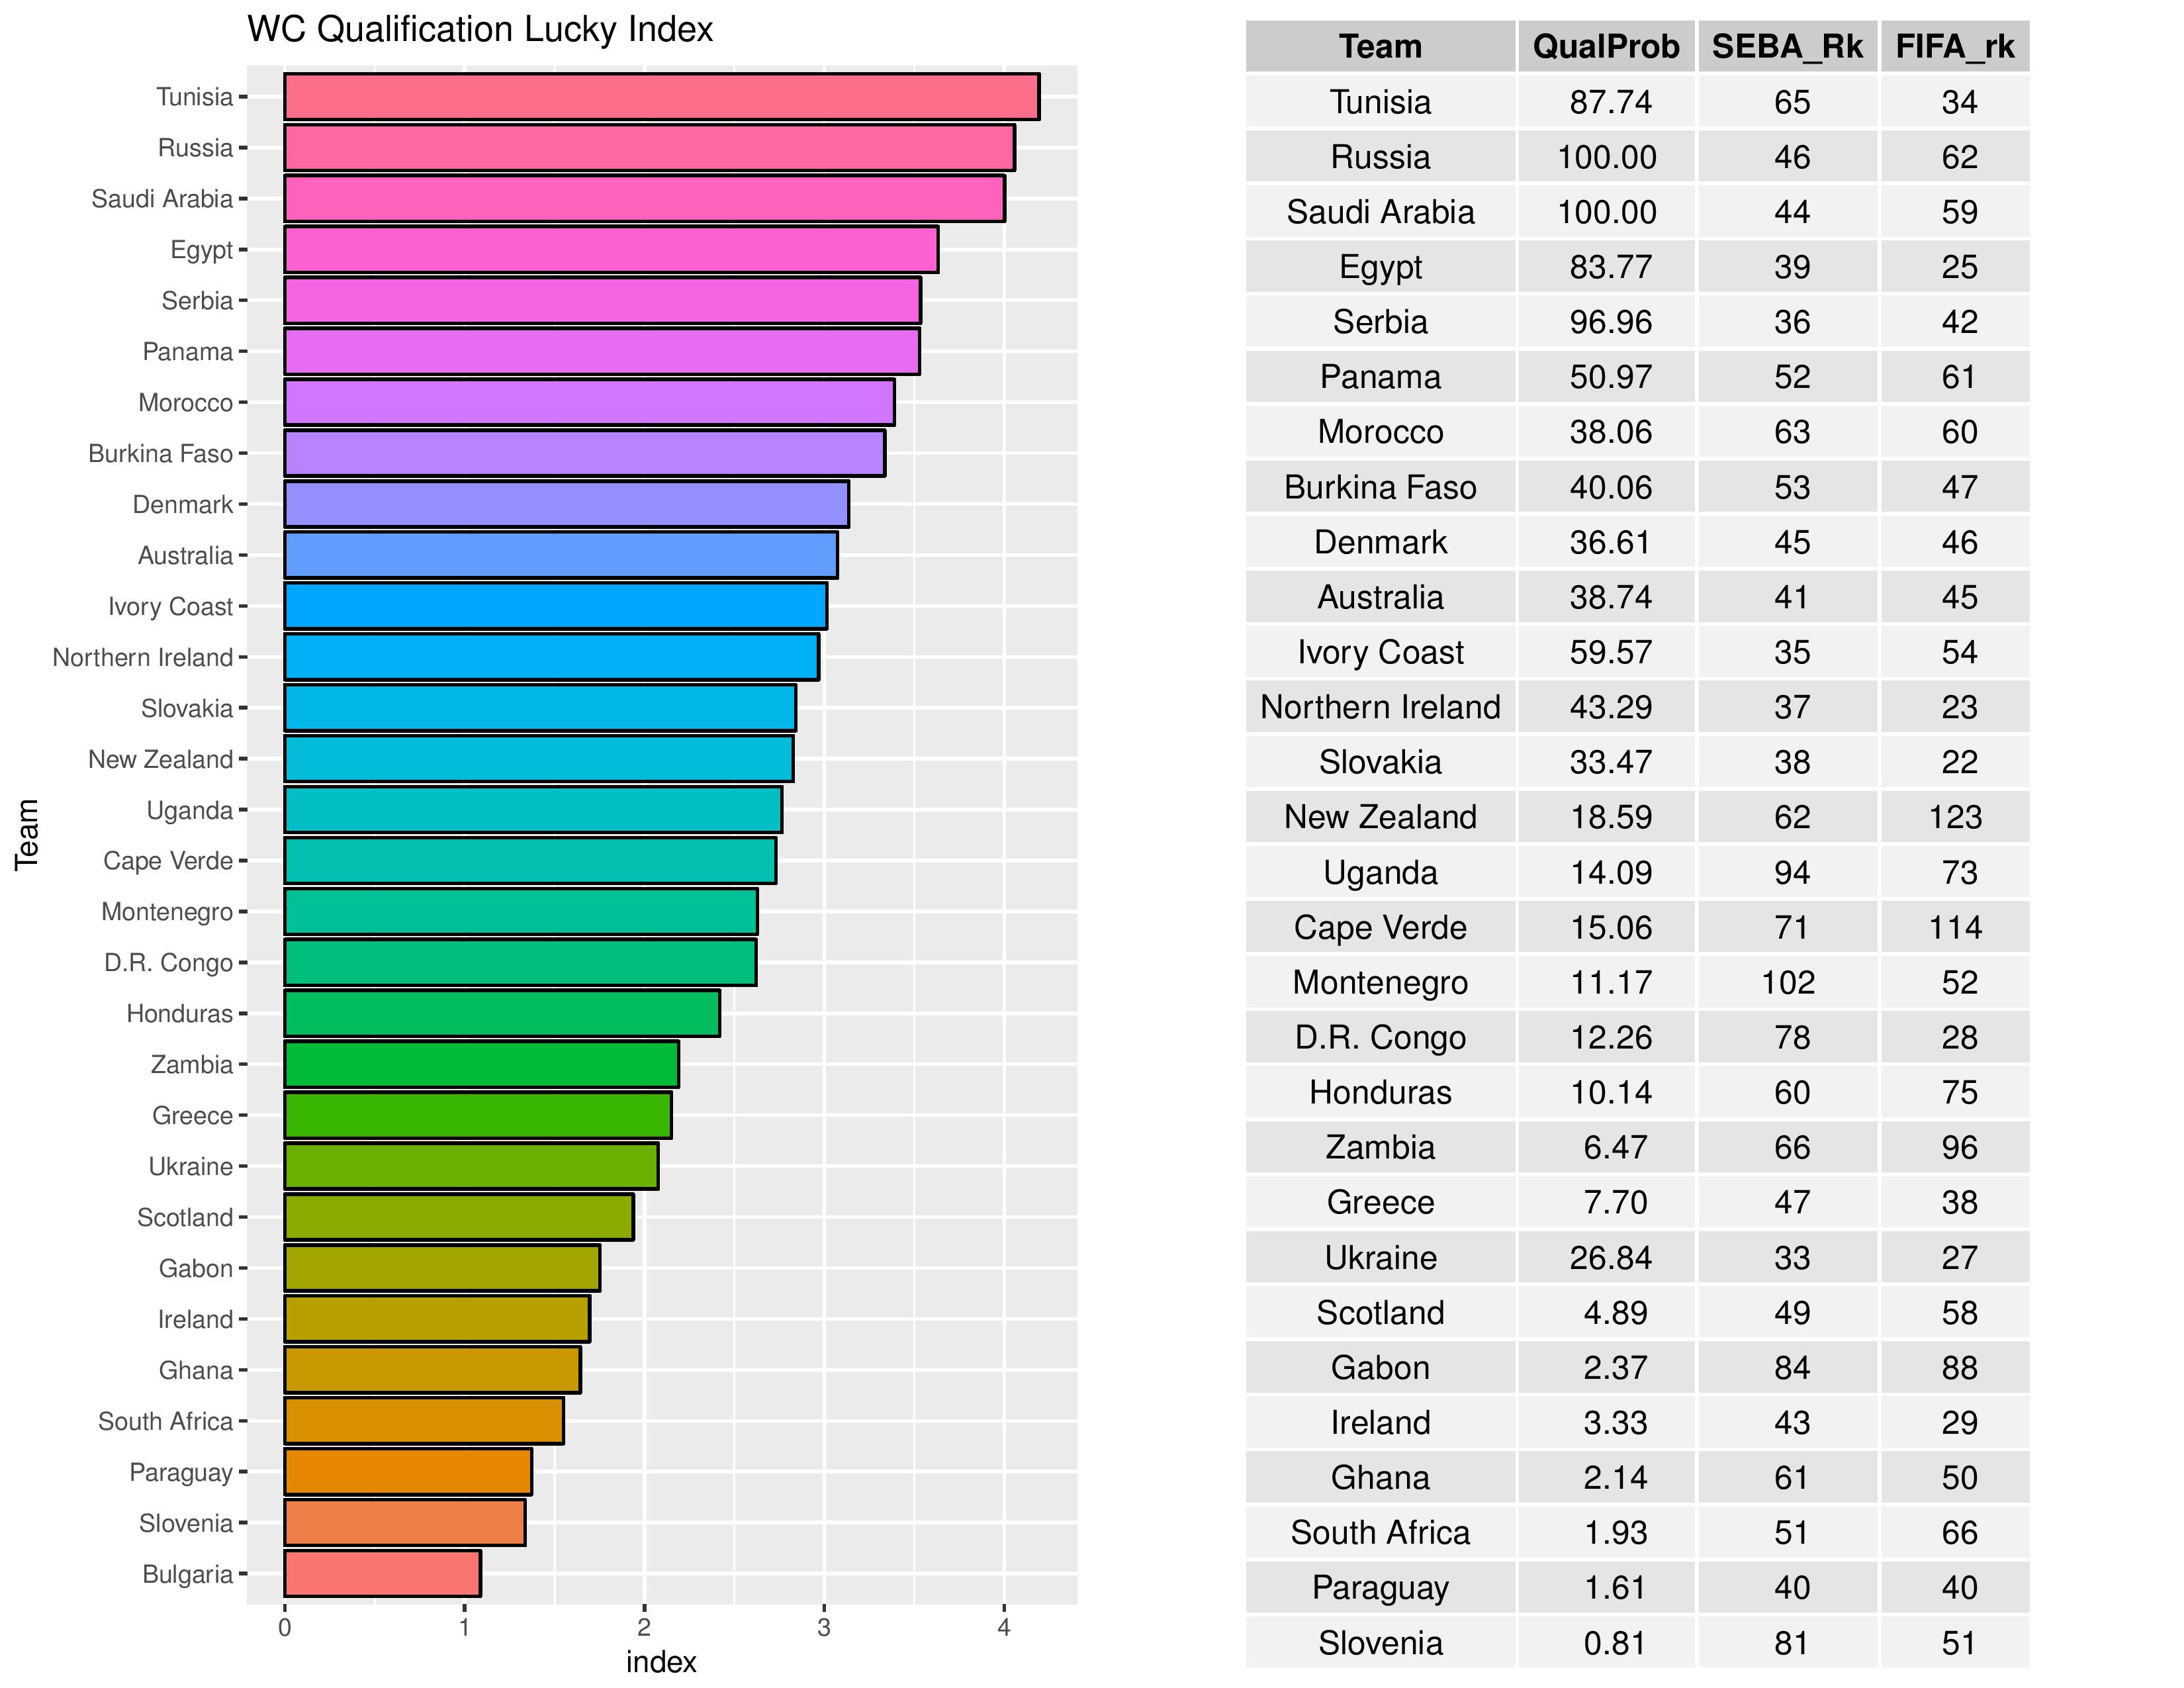
On the other side, this chart shows the nations outside of the top 32 who, perhaps unfairly, benefit from an imperfect qualification system and are ranked by their benefit.
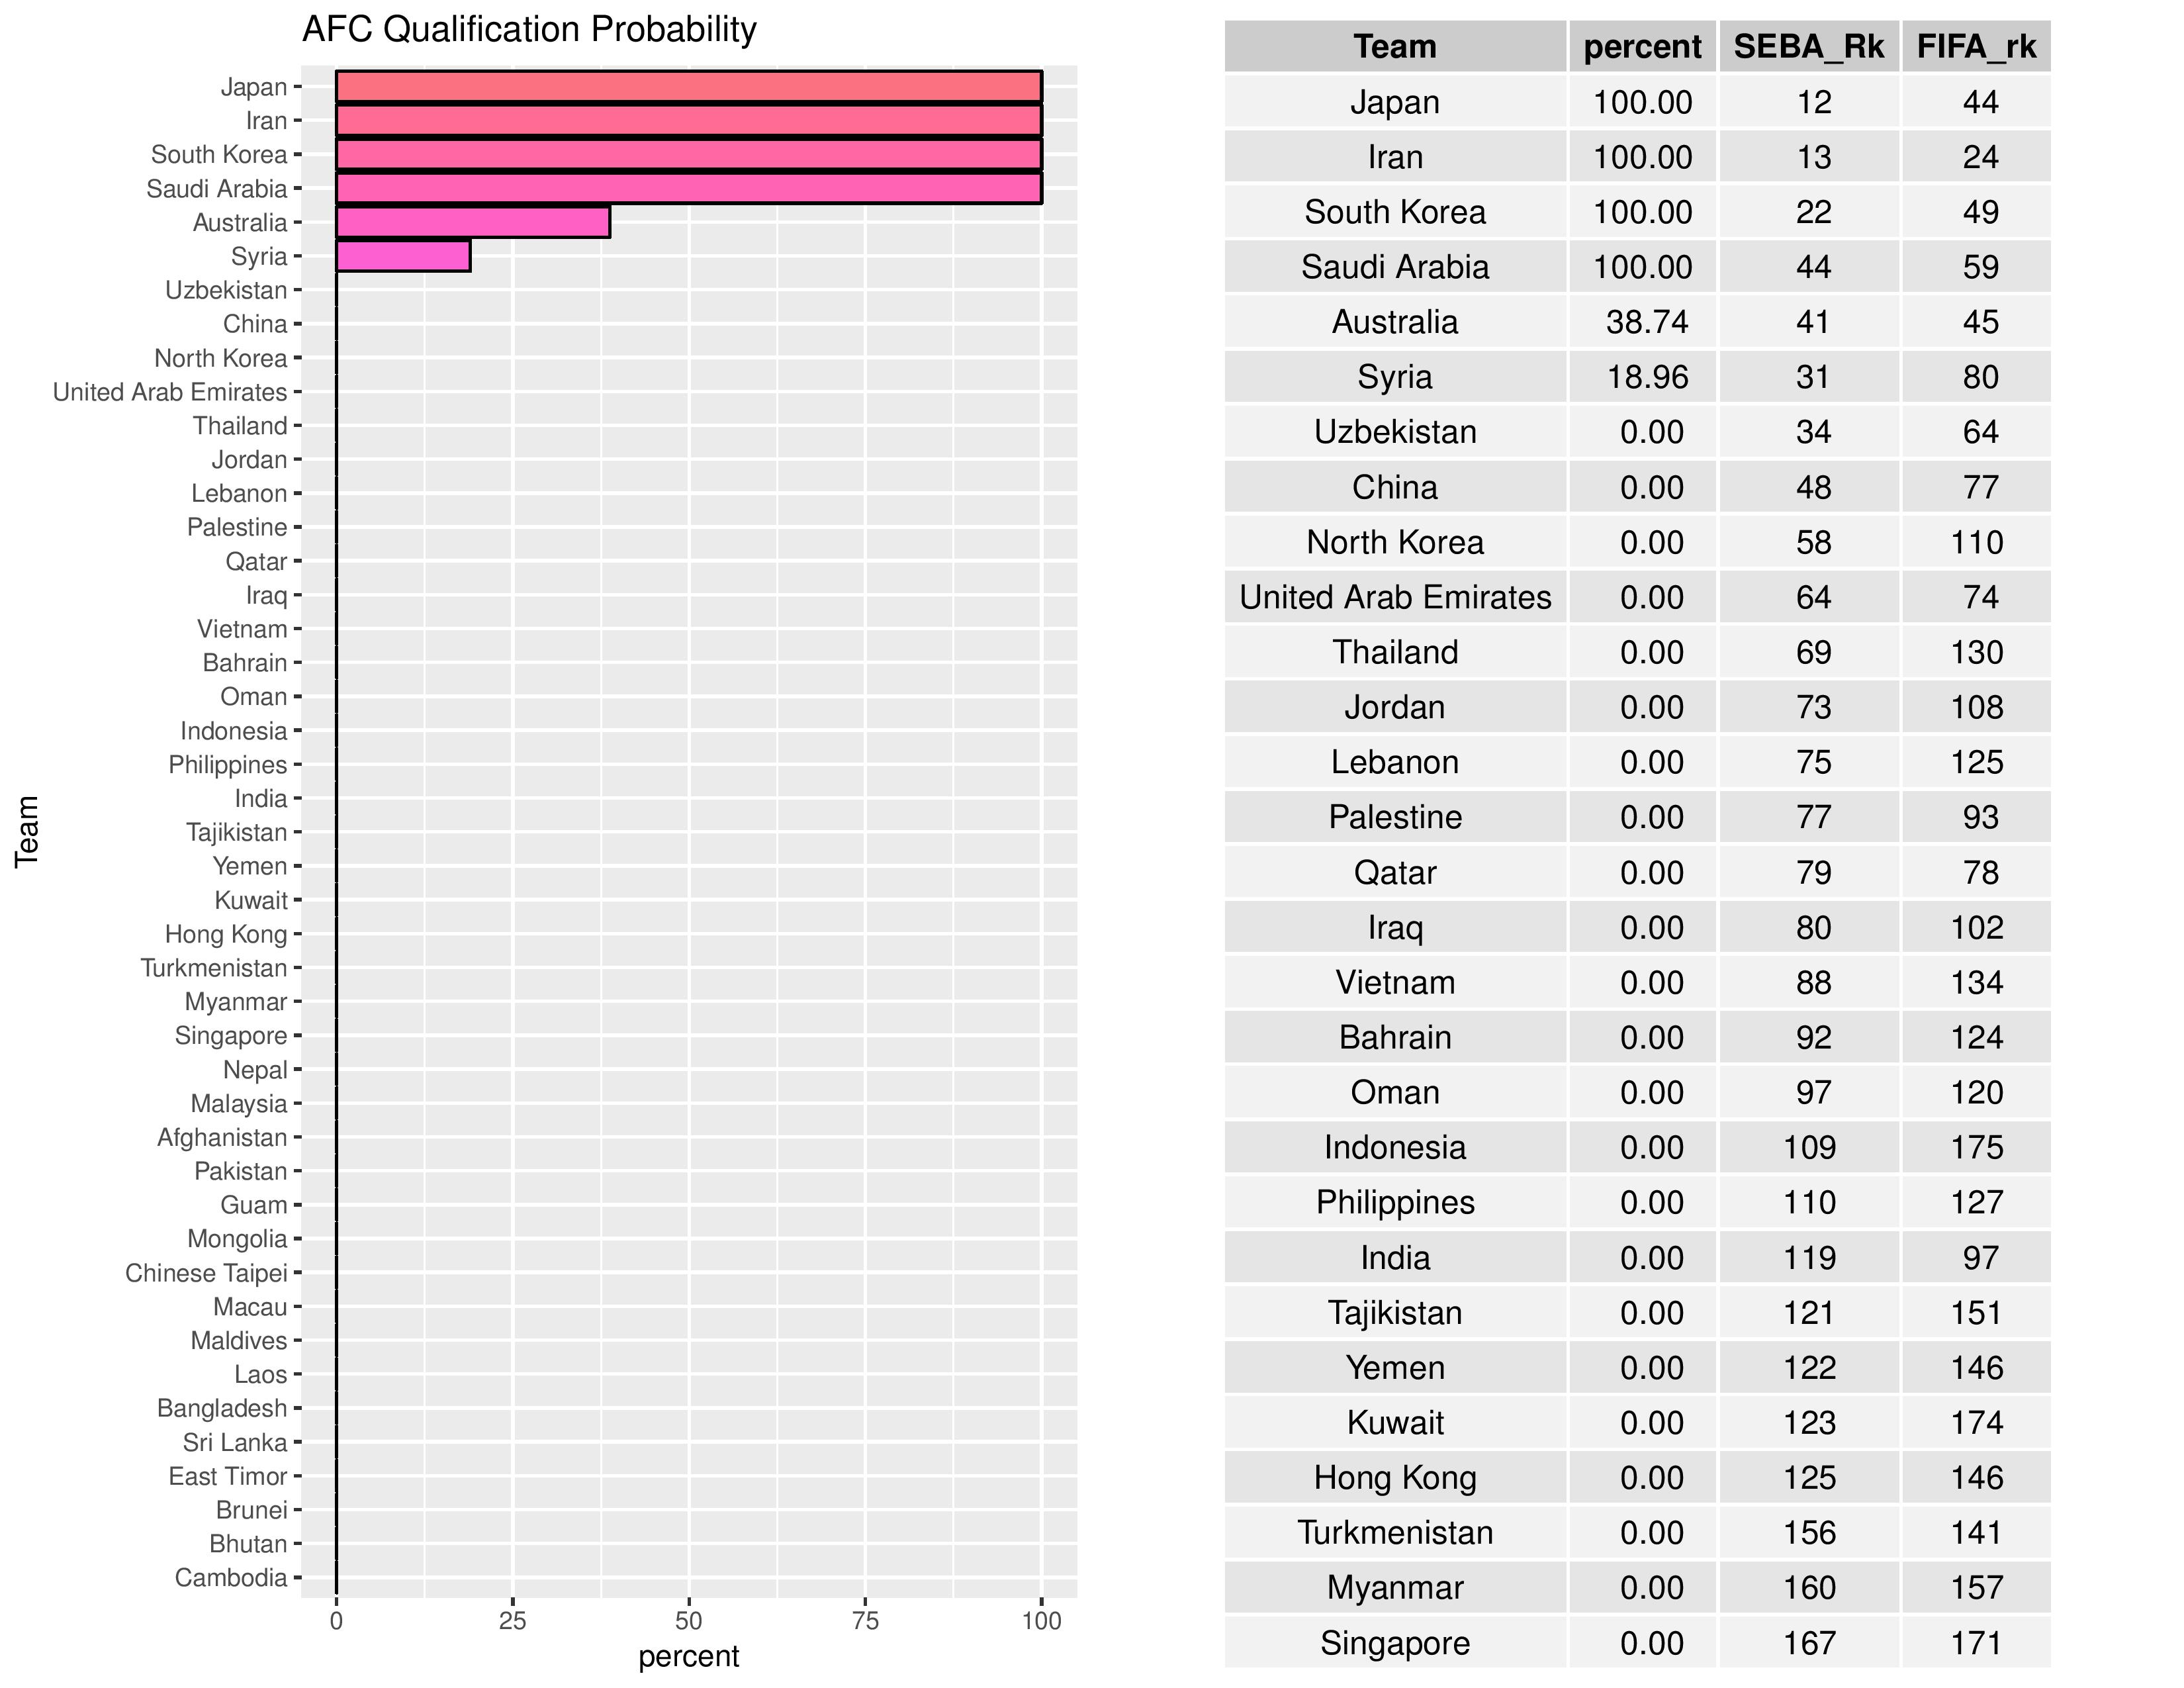
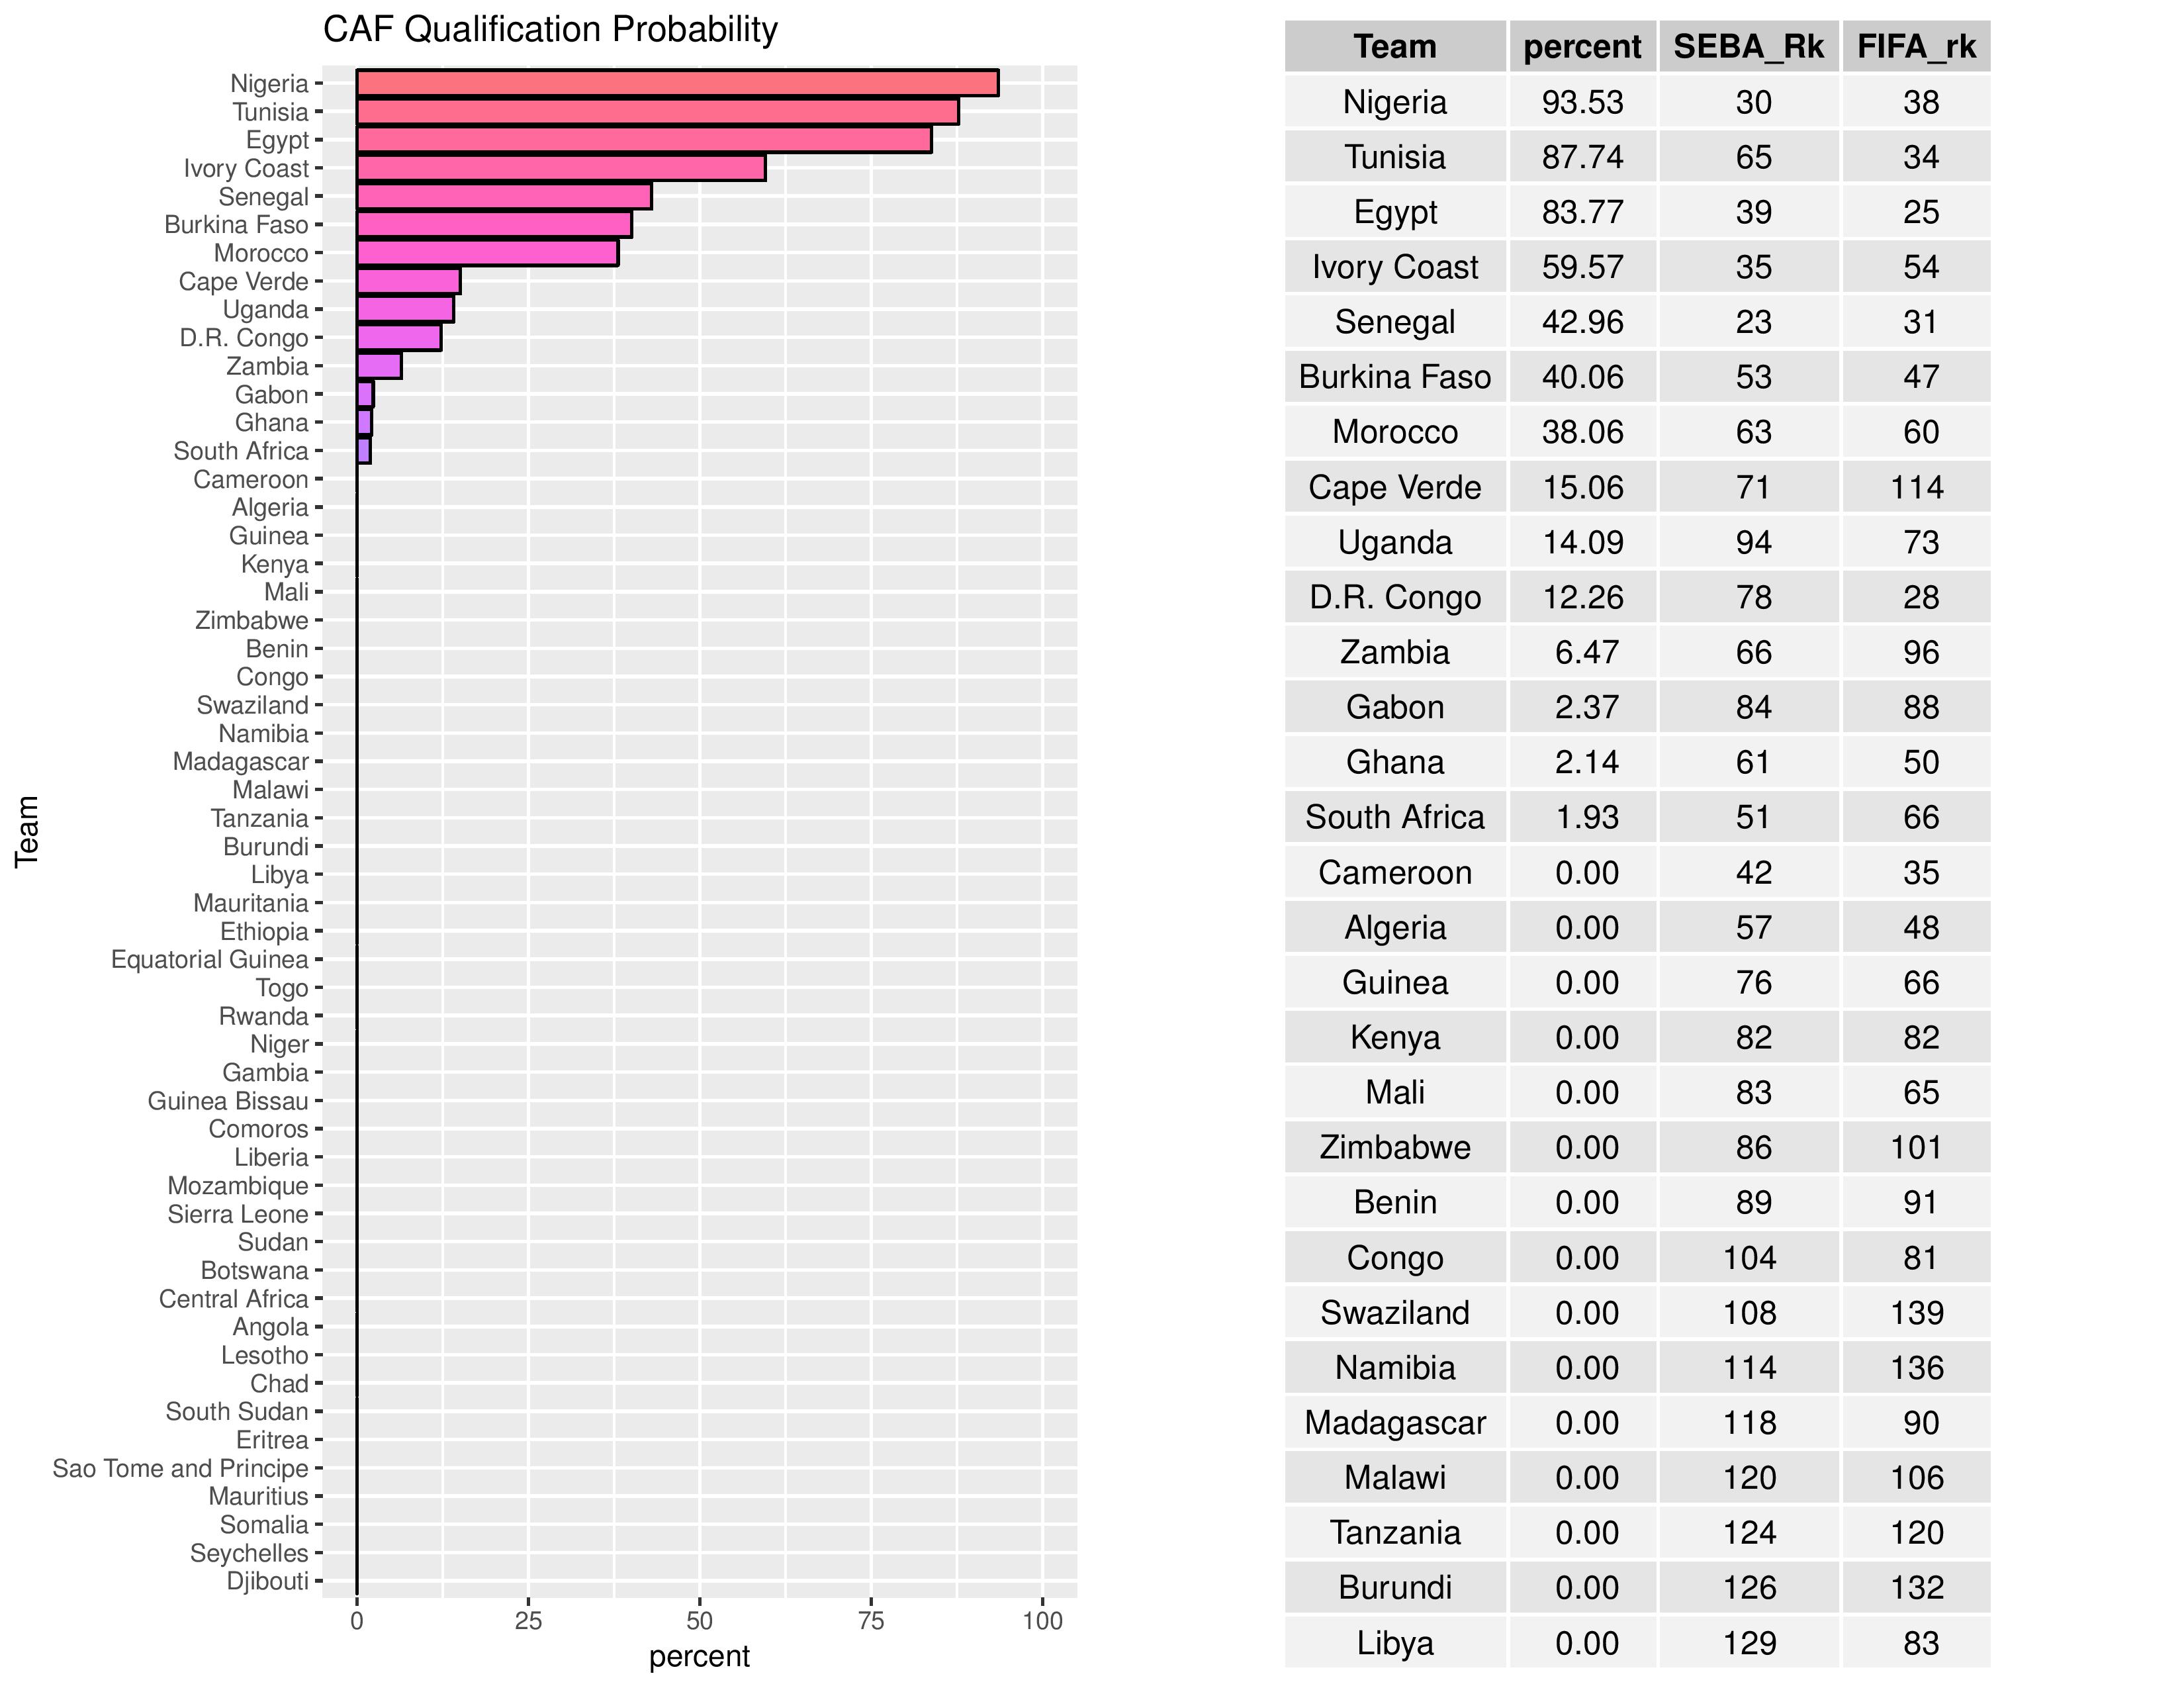
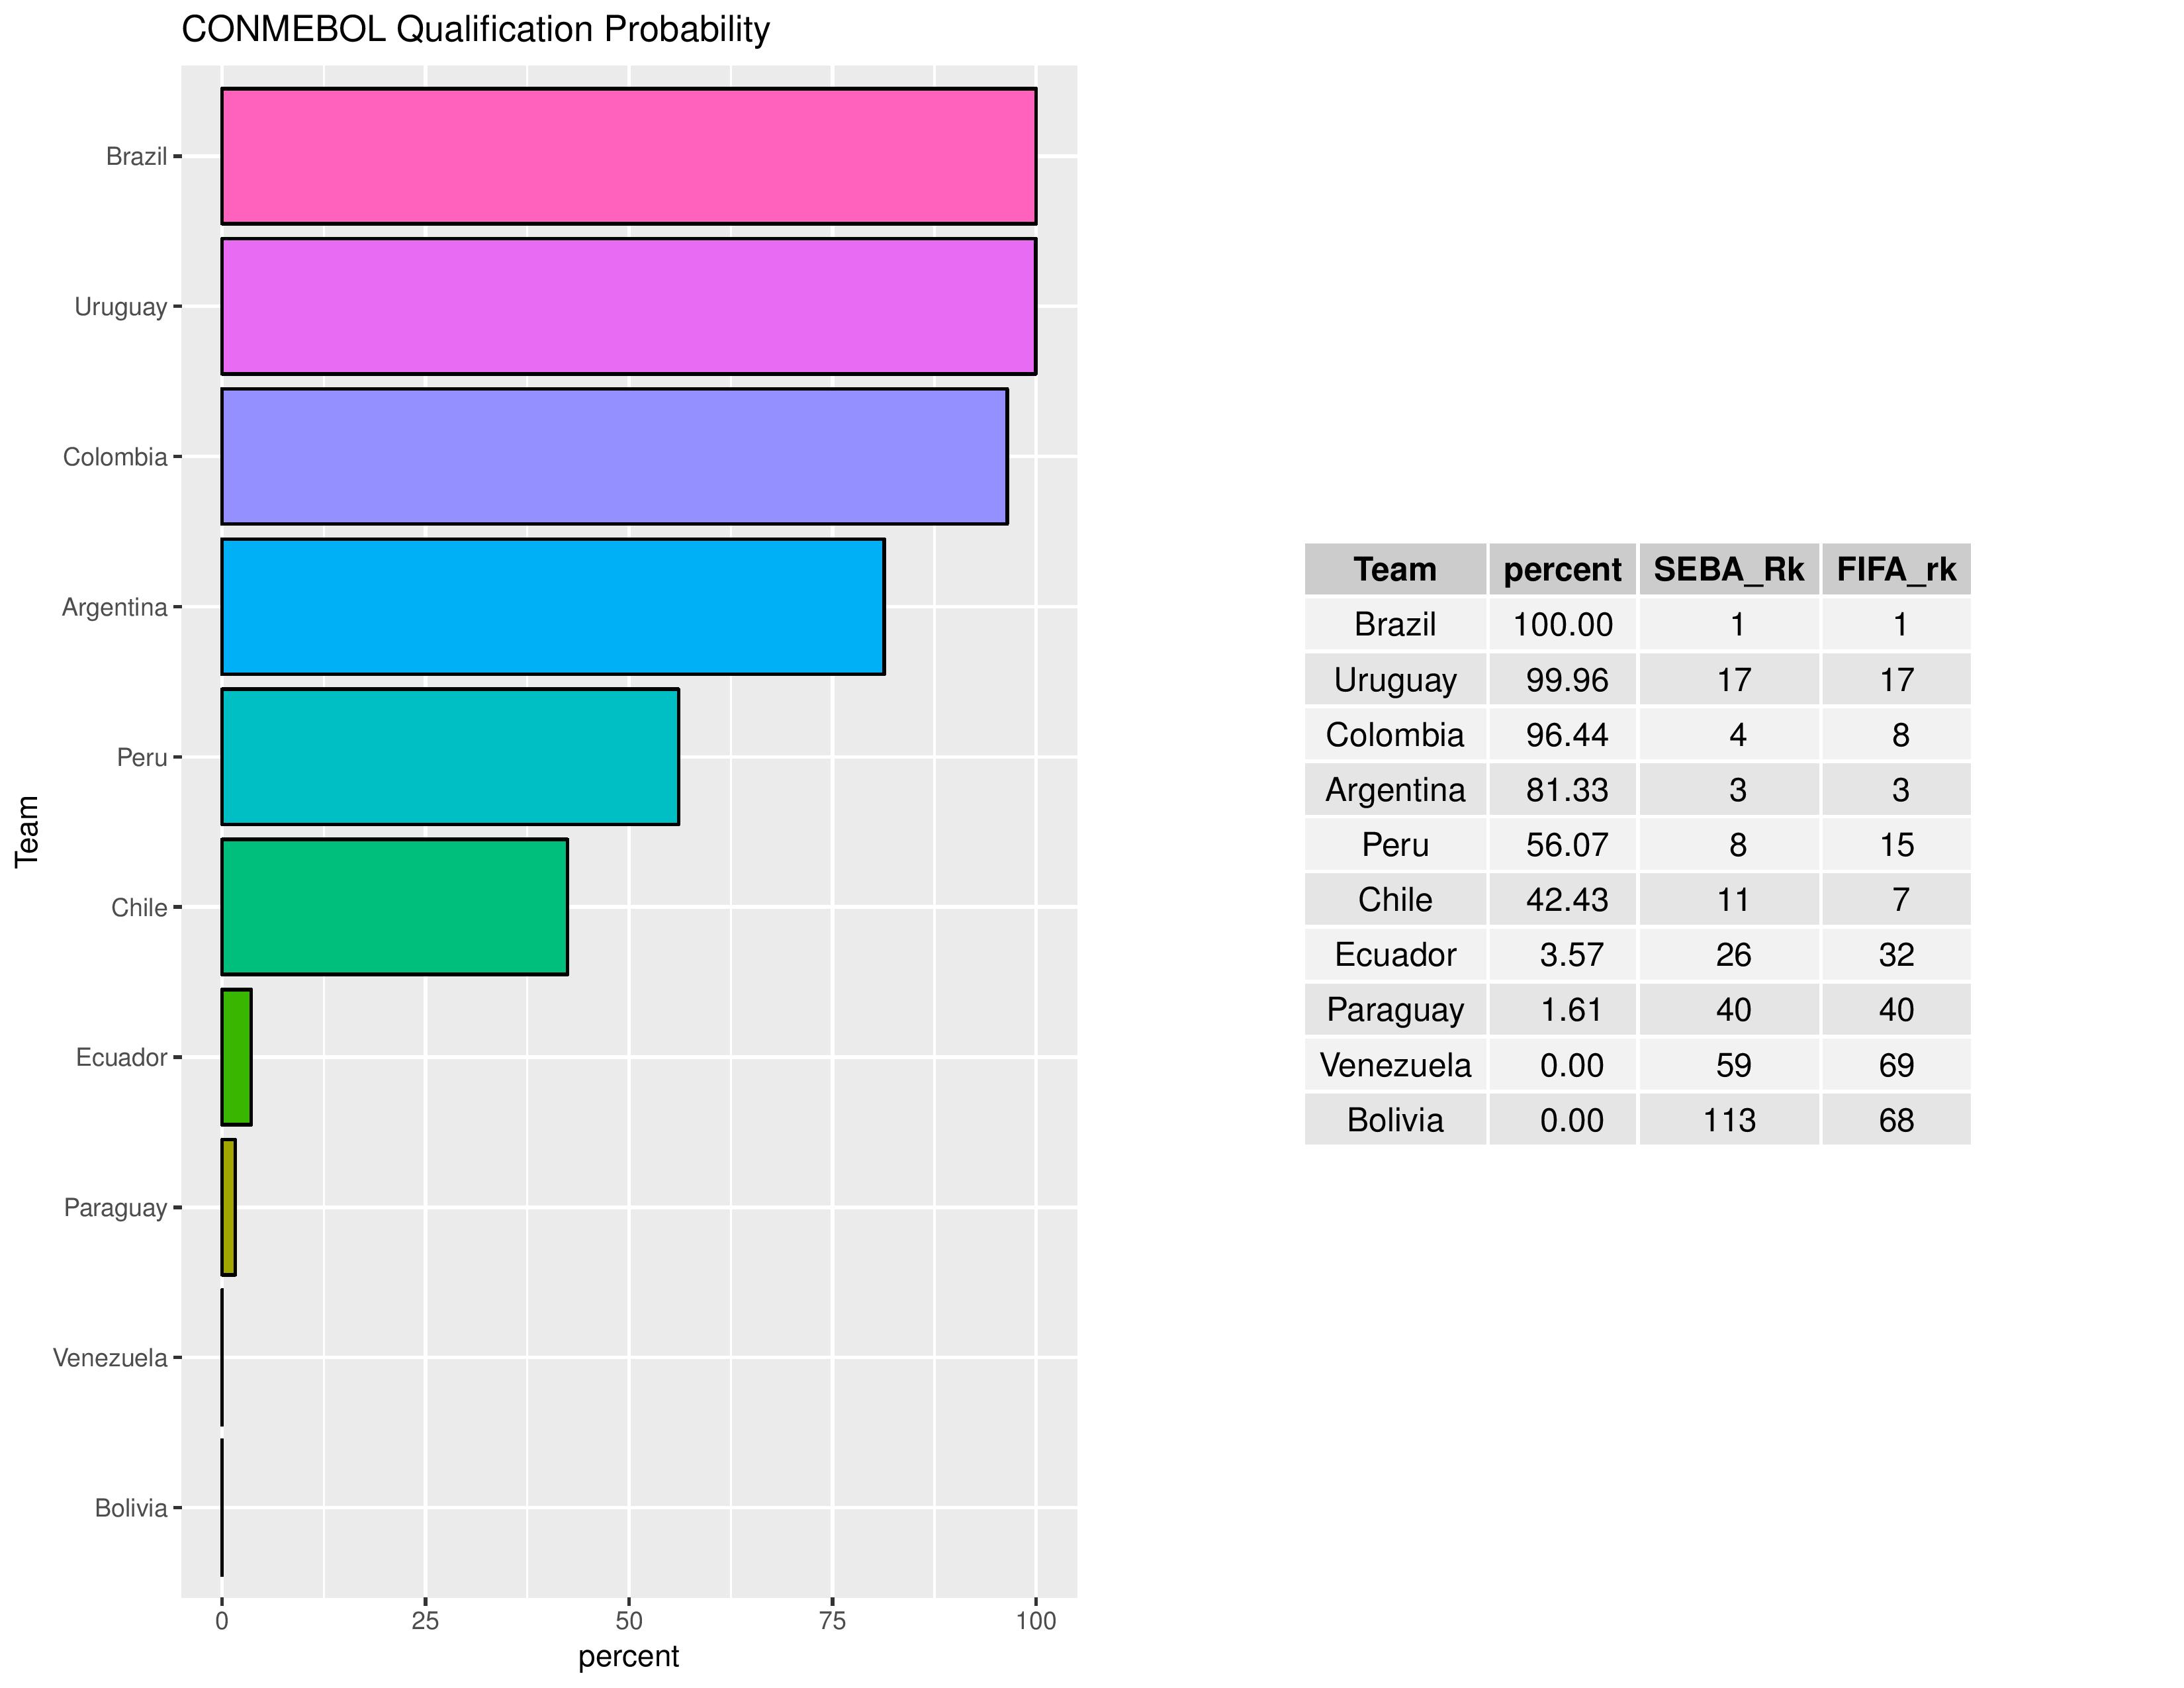
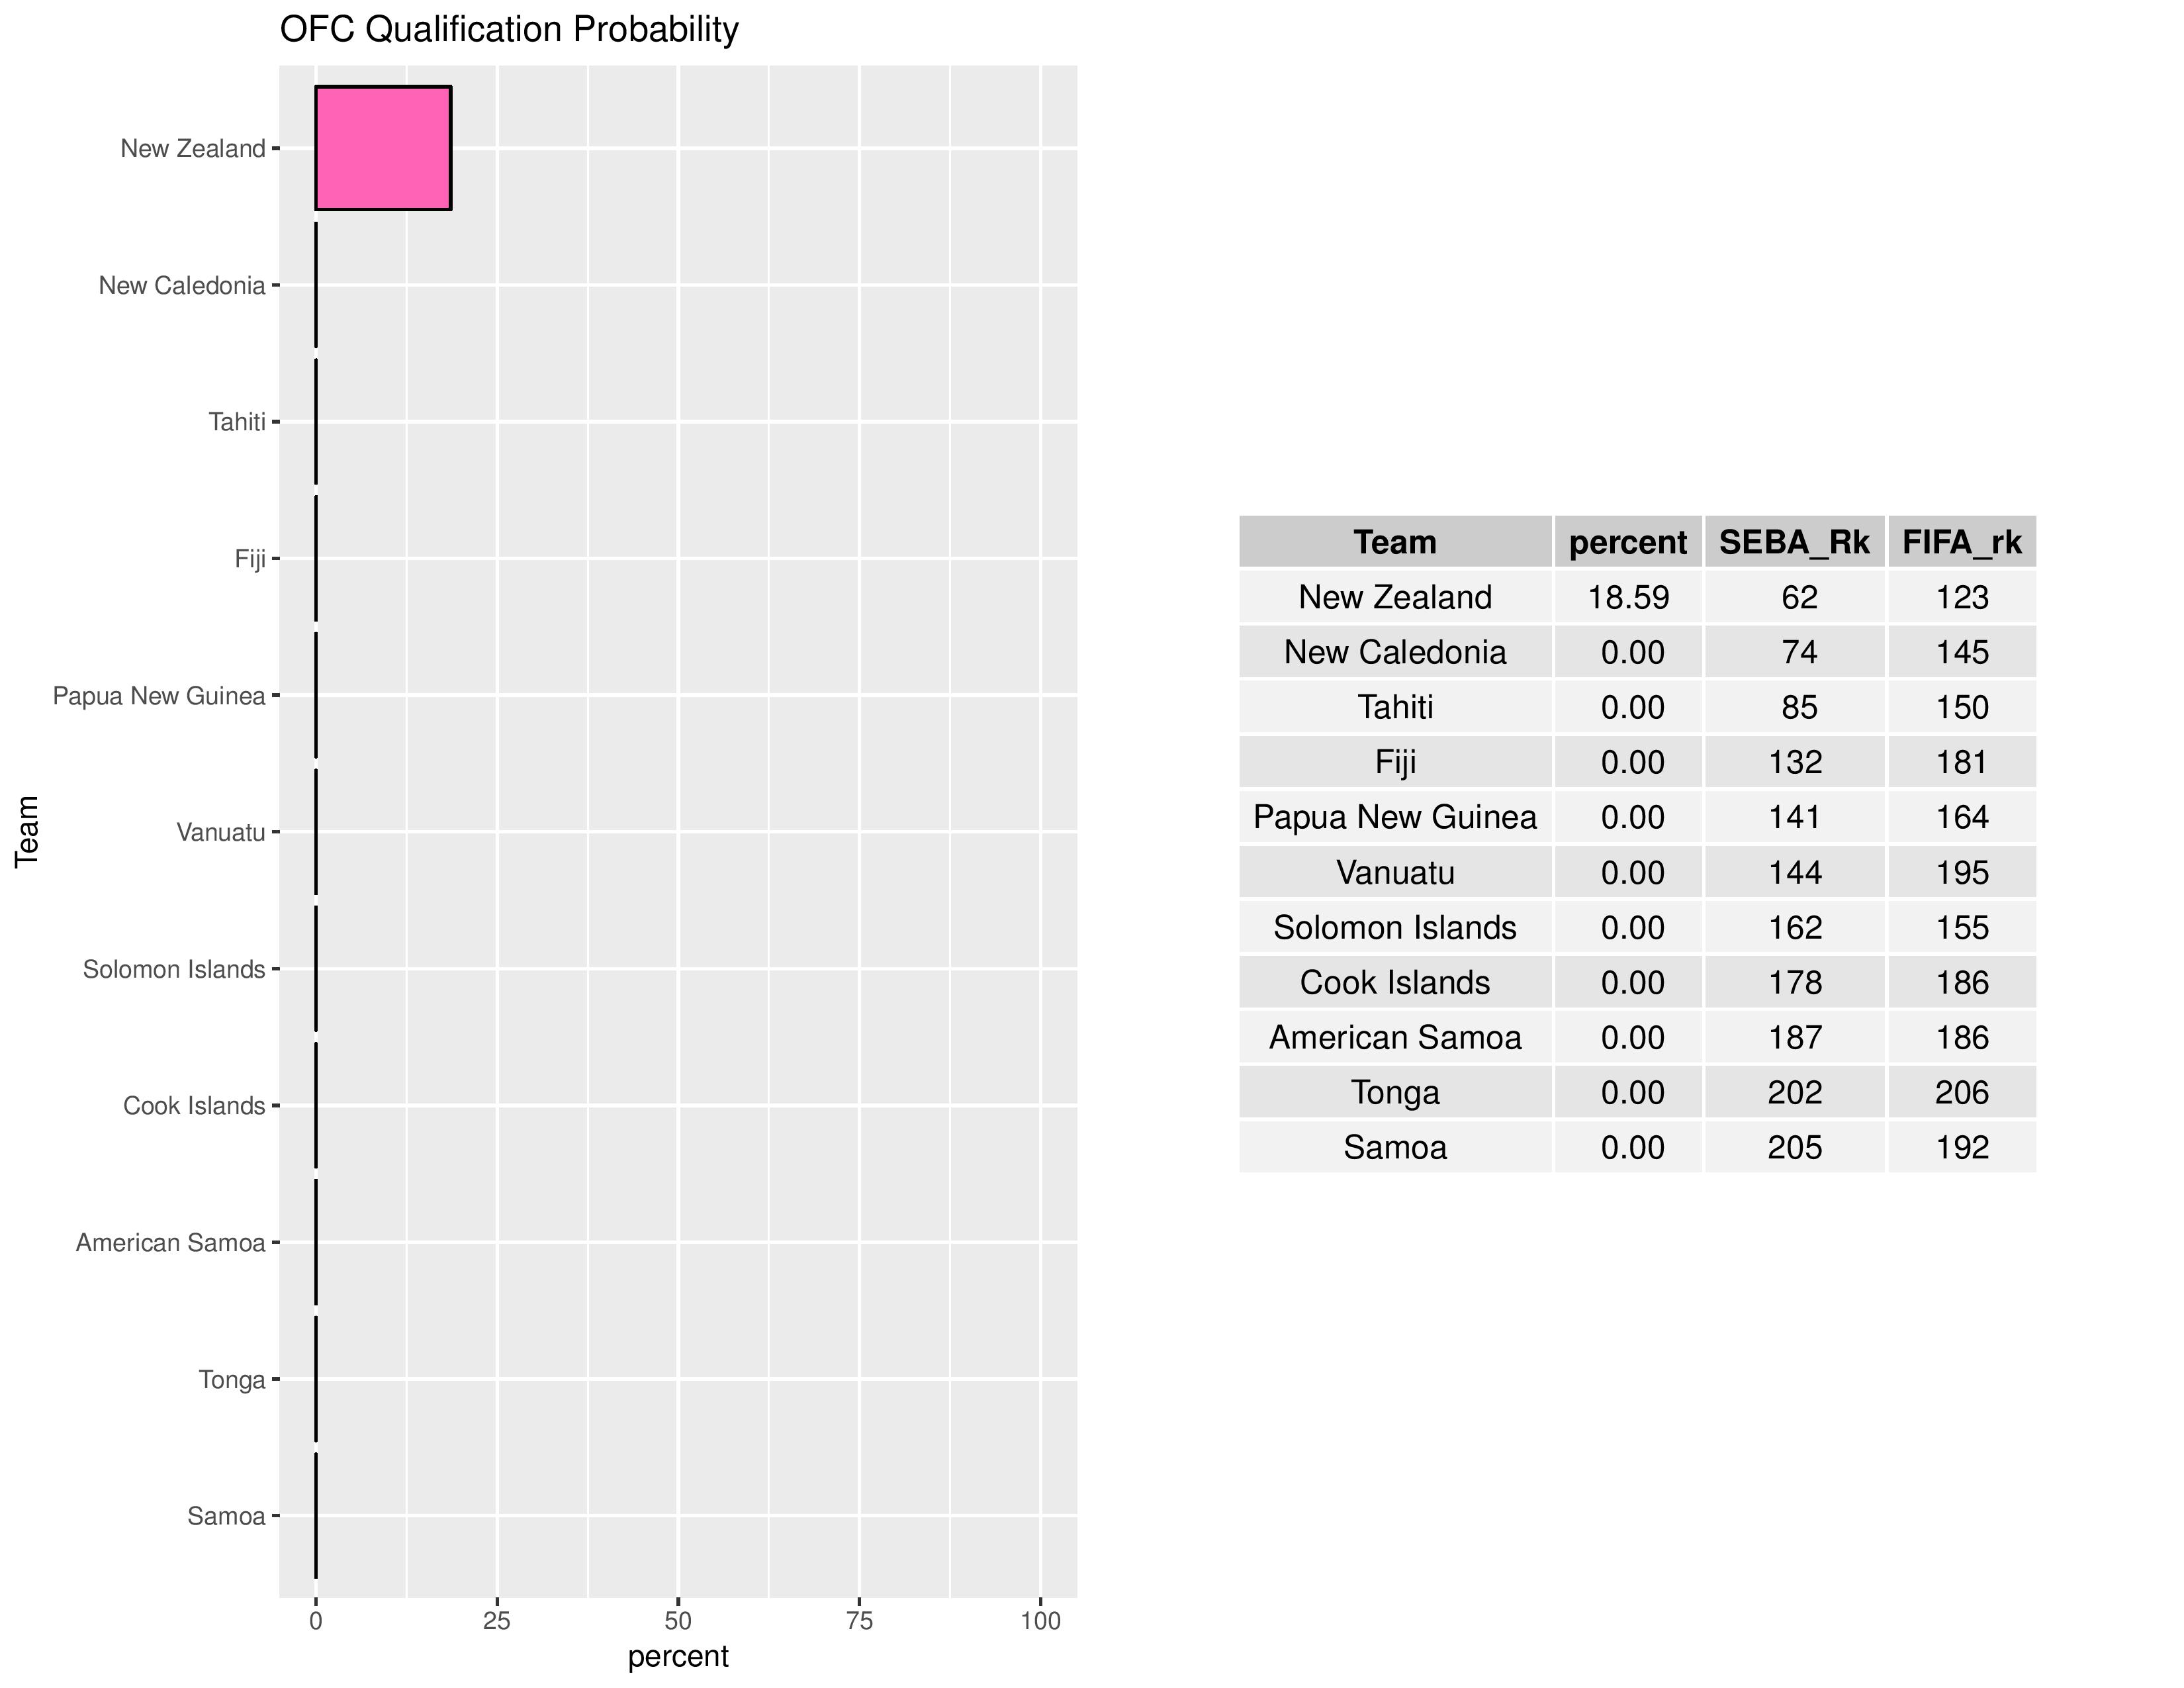
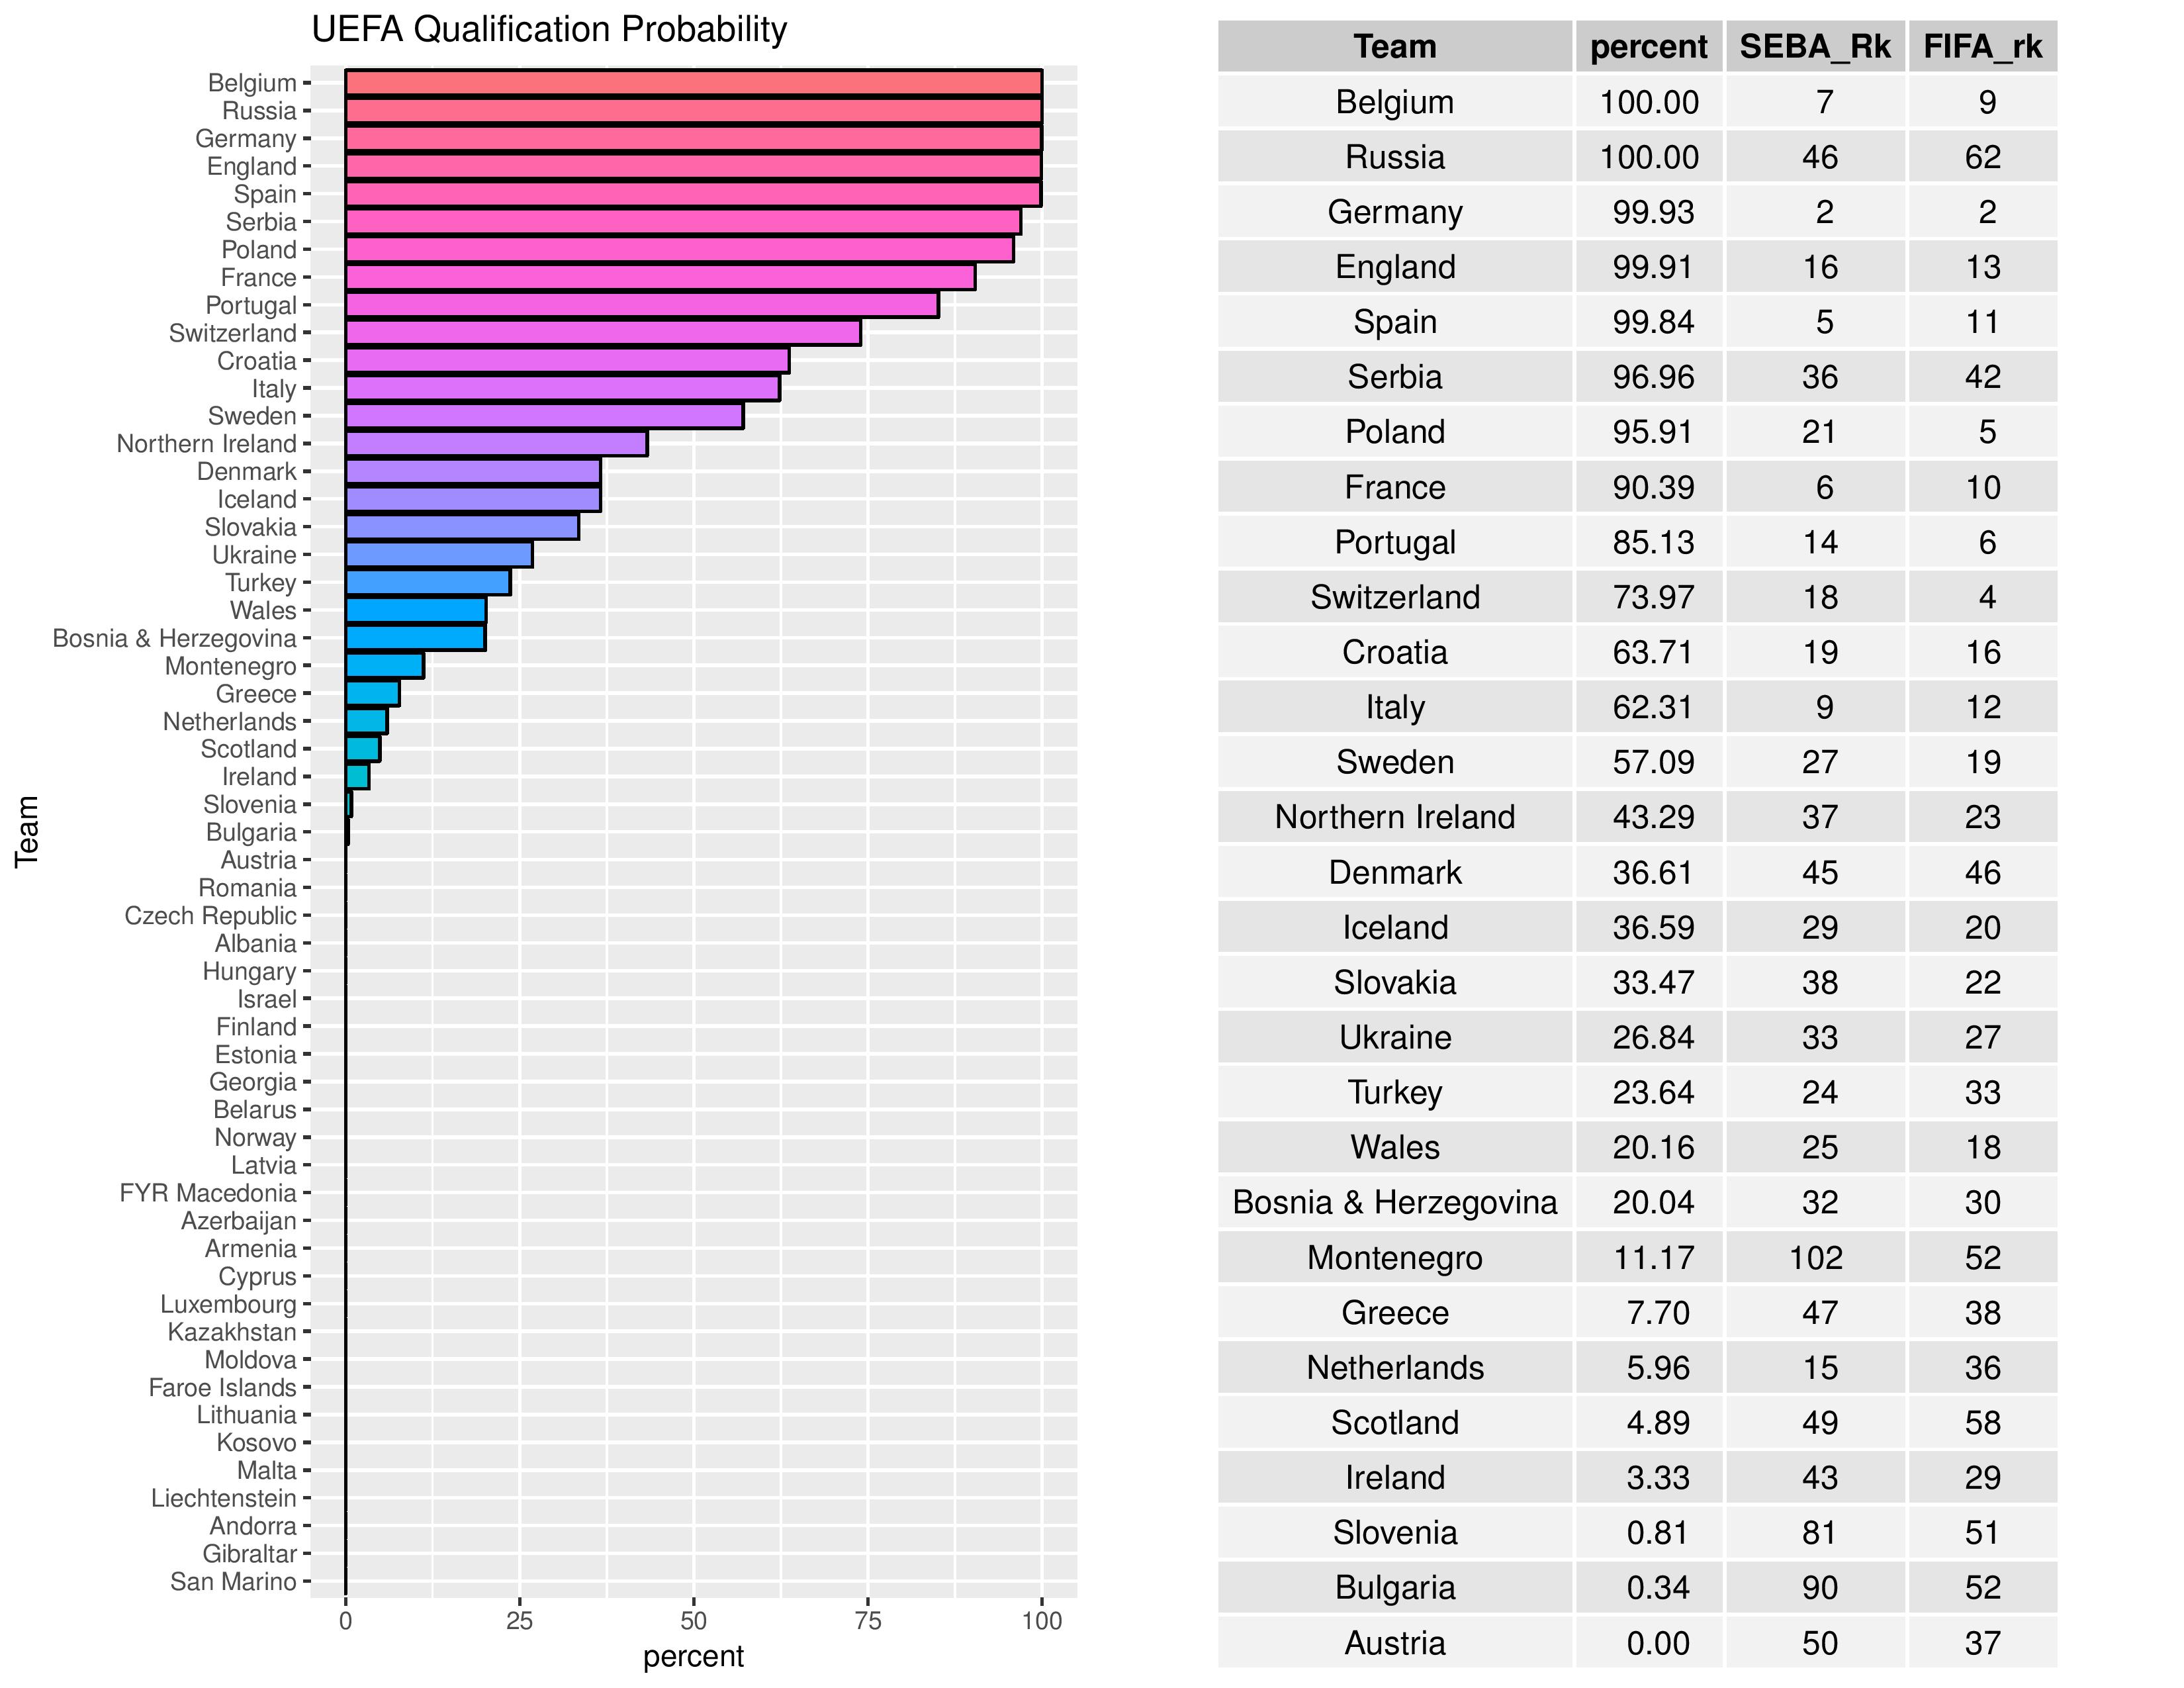
The next charts show the probabilities of other confederations qualifying for the World Cup.
World Cup 2018
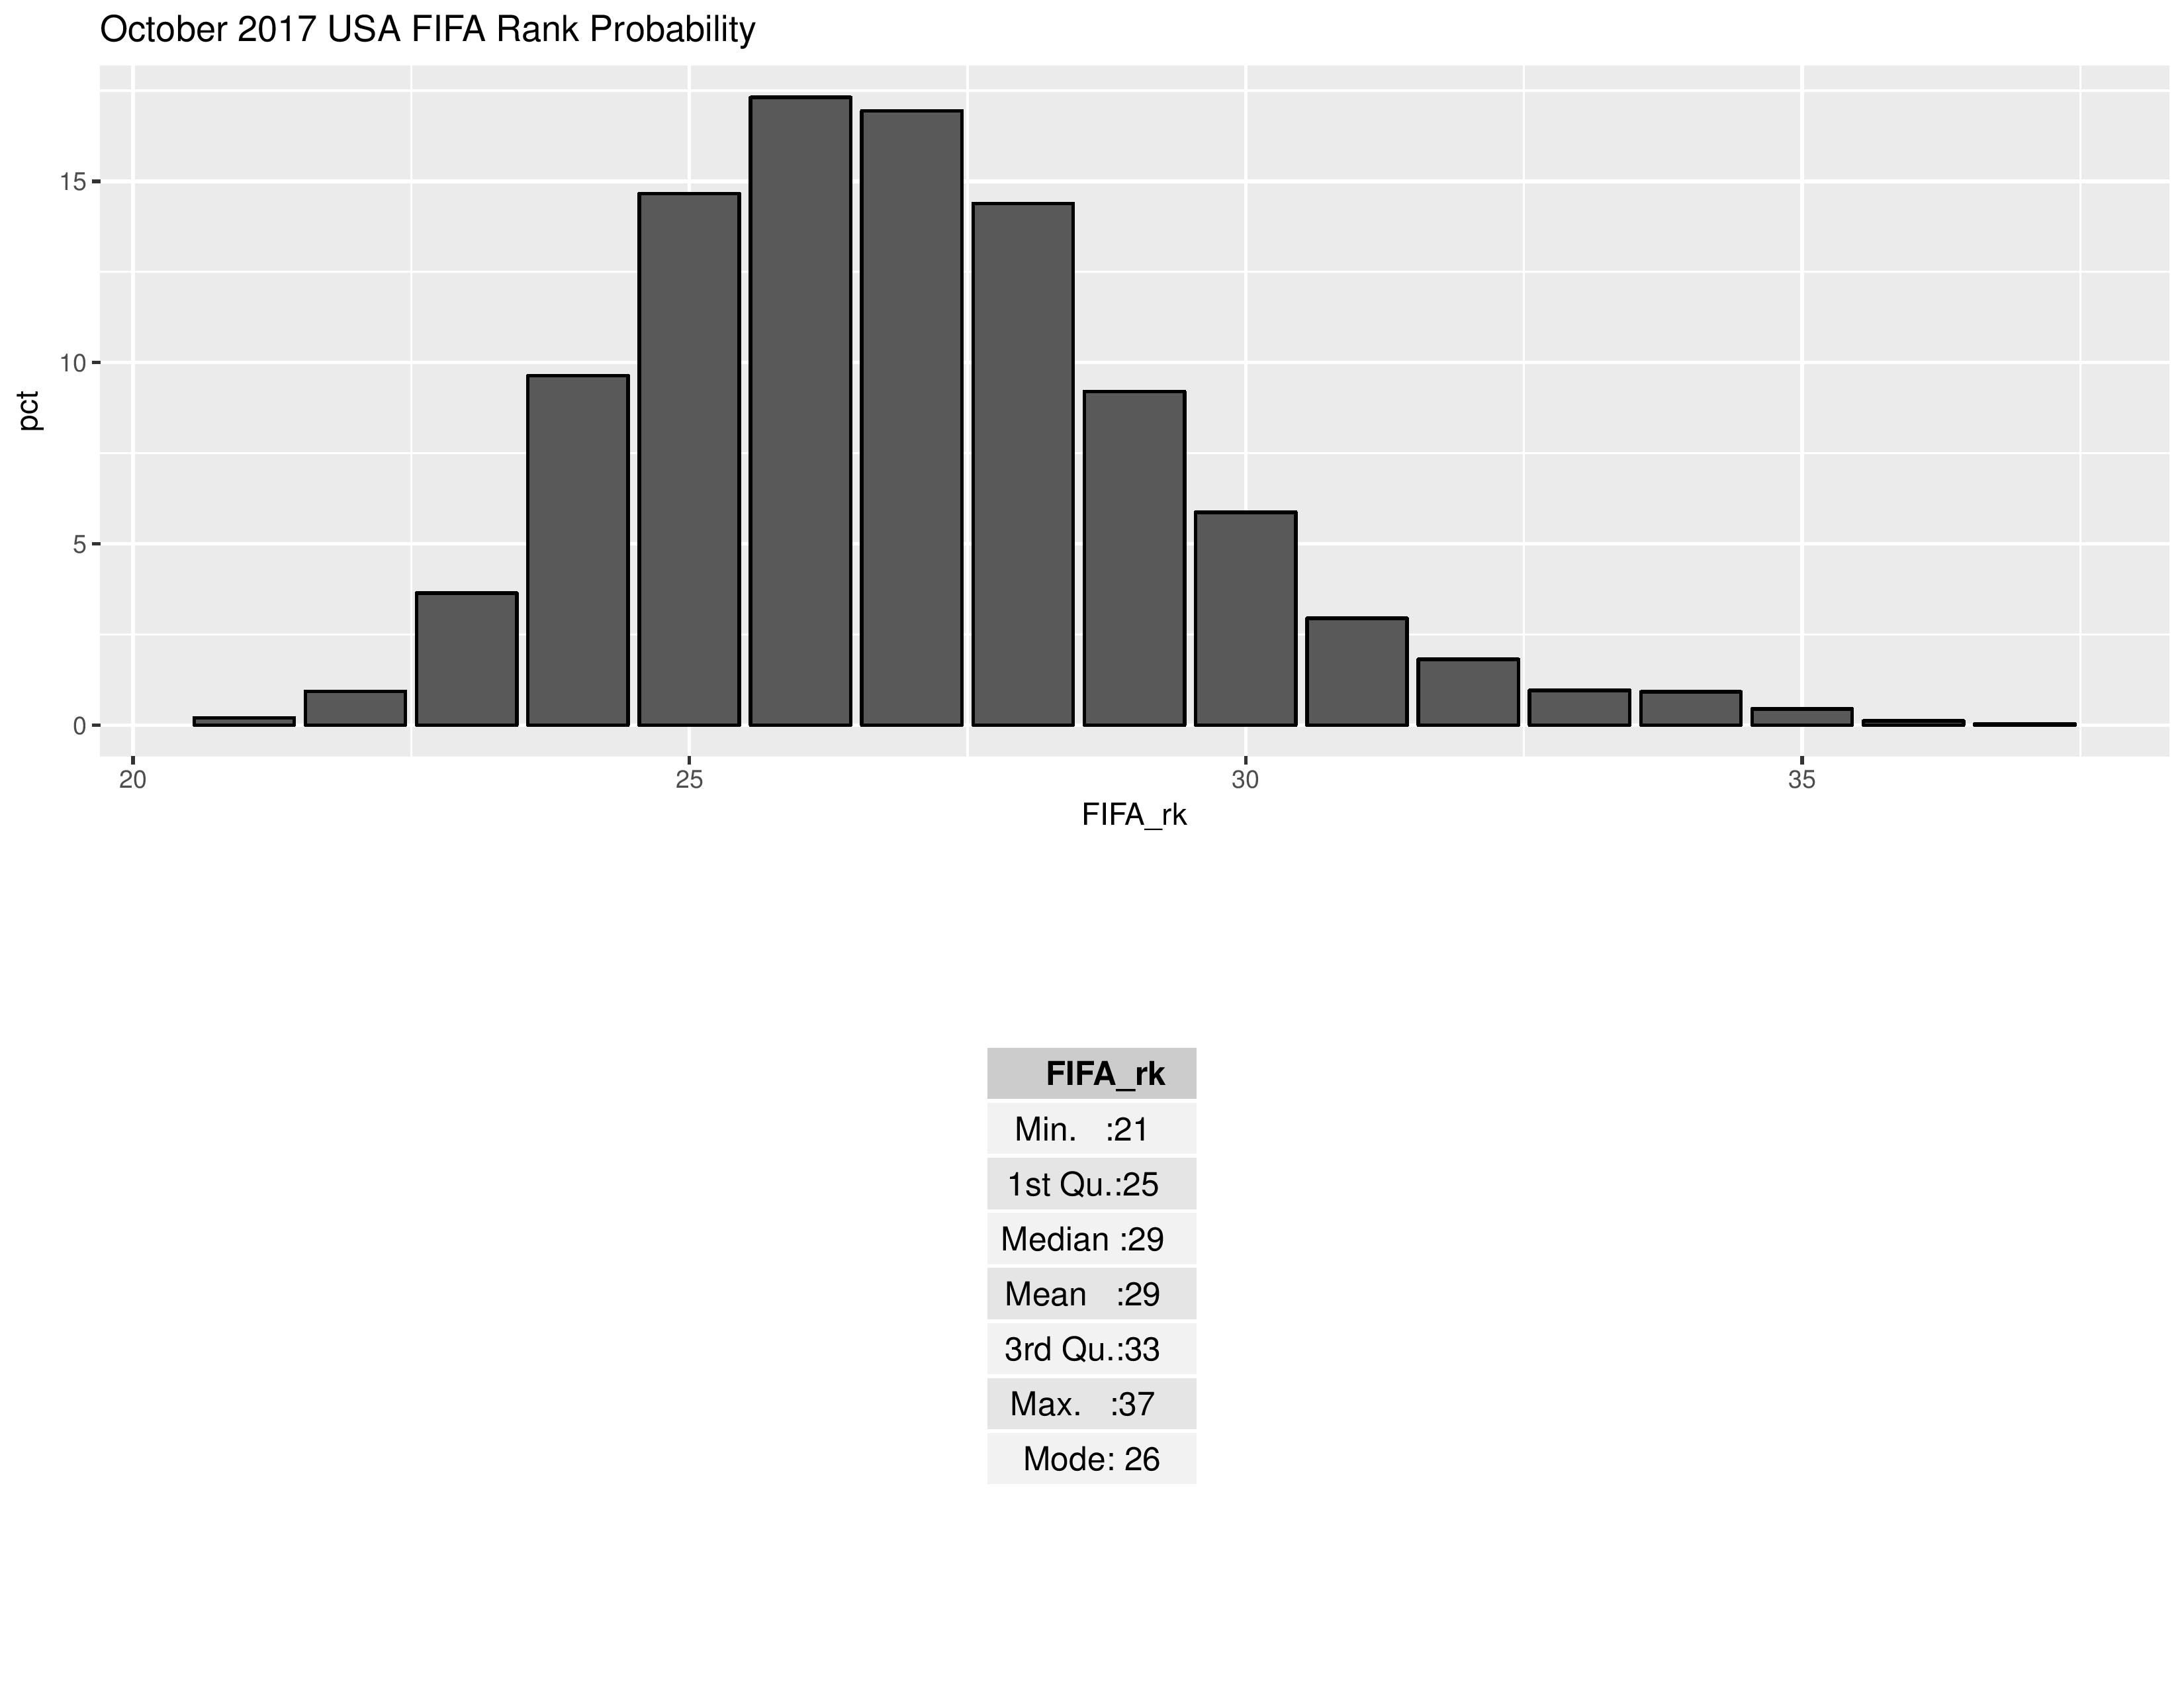
For the last World Cup, the October 2013 rankings were deemed ‘final’ before the World Cup draw, so I’m now assuming October 2017 are the rankings to shoot for. also don’t have the forecast system perfectly aligned with reality, although it is quite similar. I have not built in the different point outcomes for PK-wins/losses in my FIFA ranking projections, and I obviously do not have a mechanism for forecasting currently-unscheduled friendlies. However, I have forecasted every scheduled tournament between now and October.
Below shows the simulated FIFA ranks for the USA. Summary statistics are below the chart. USA’s most common forecasted rank is 26, but could go as low as 21 and as high as 37. USA’s current rank is 26.
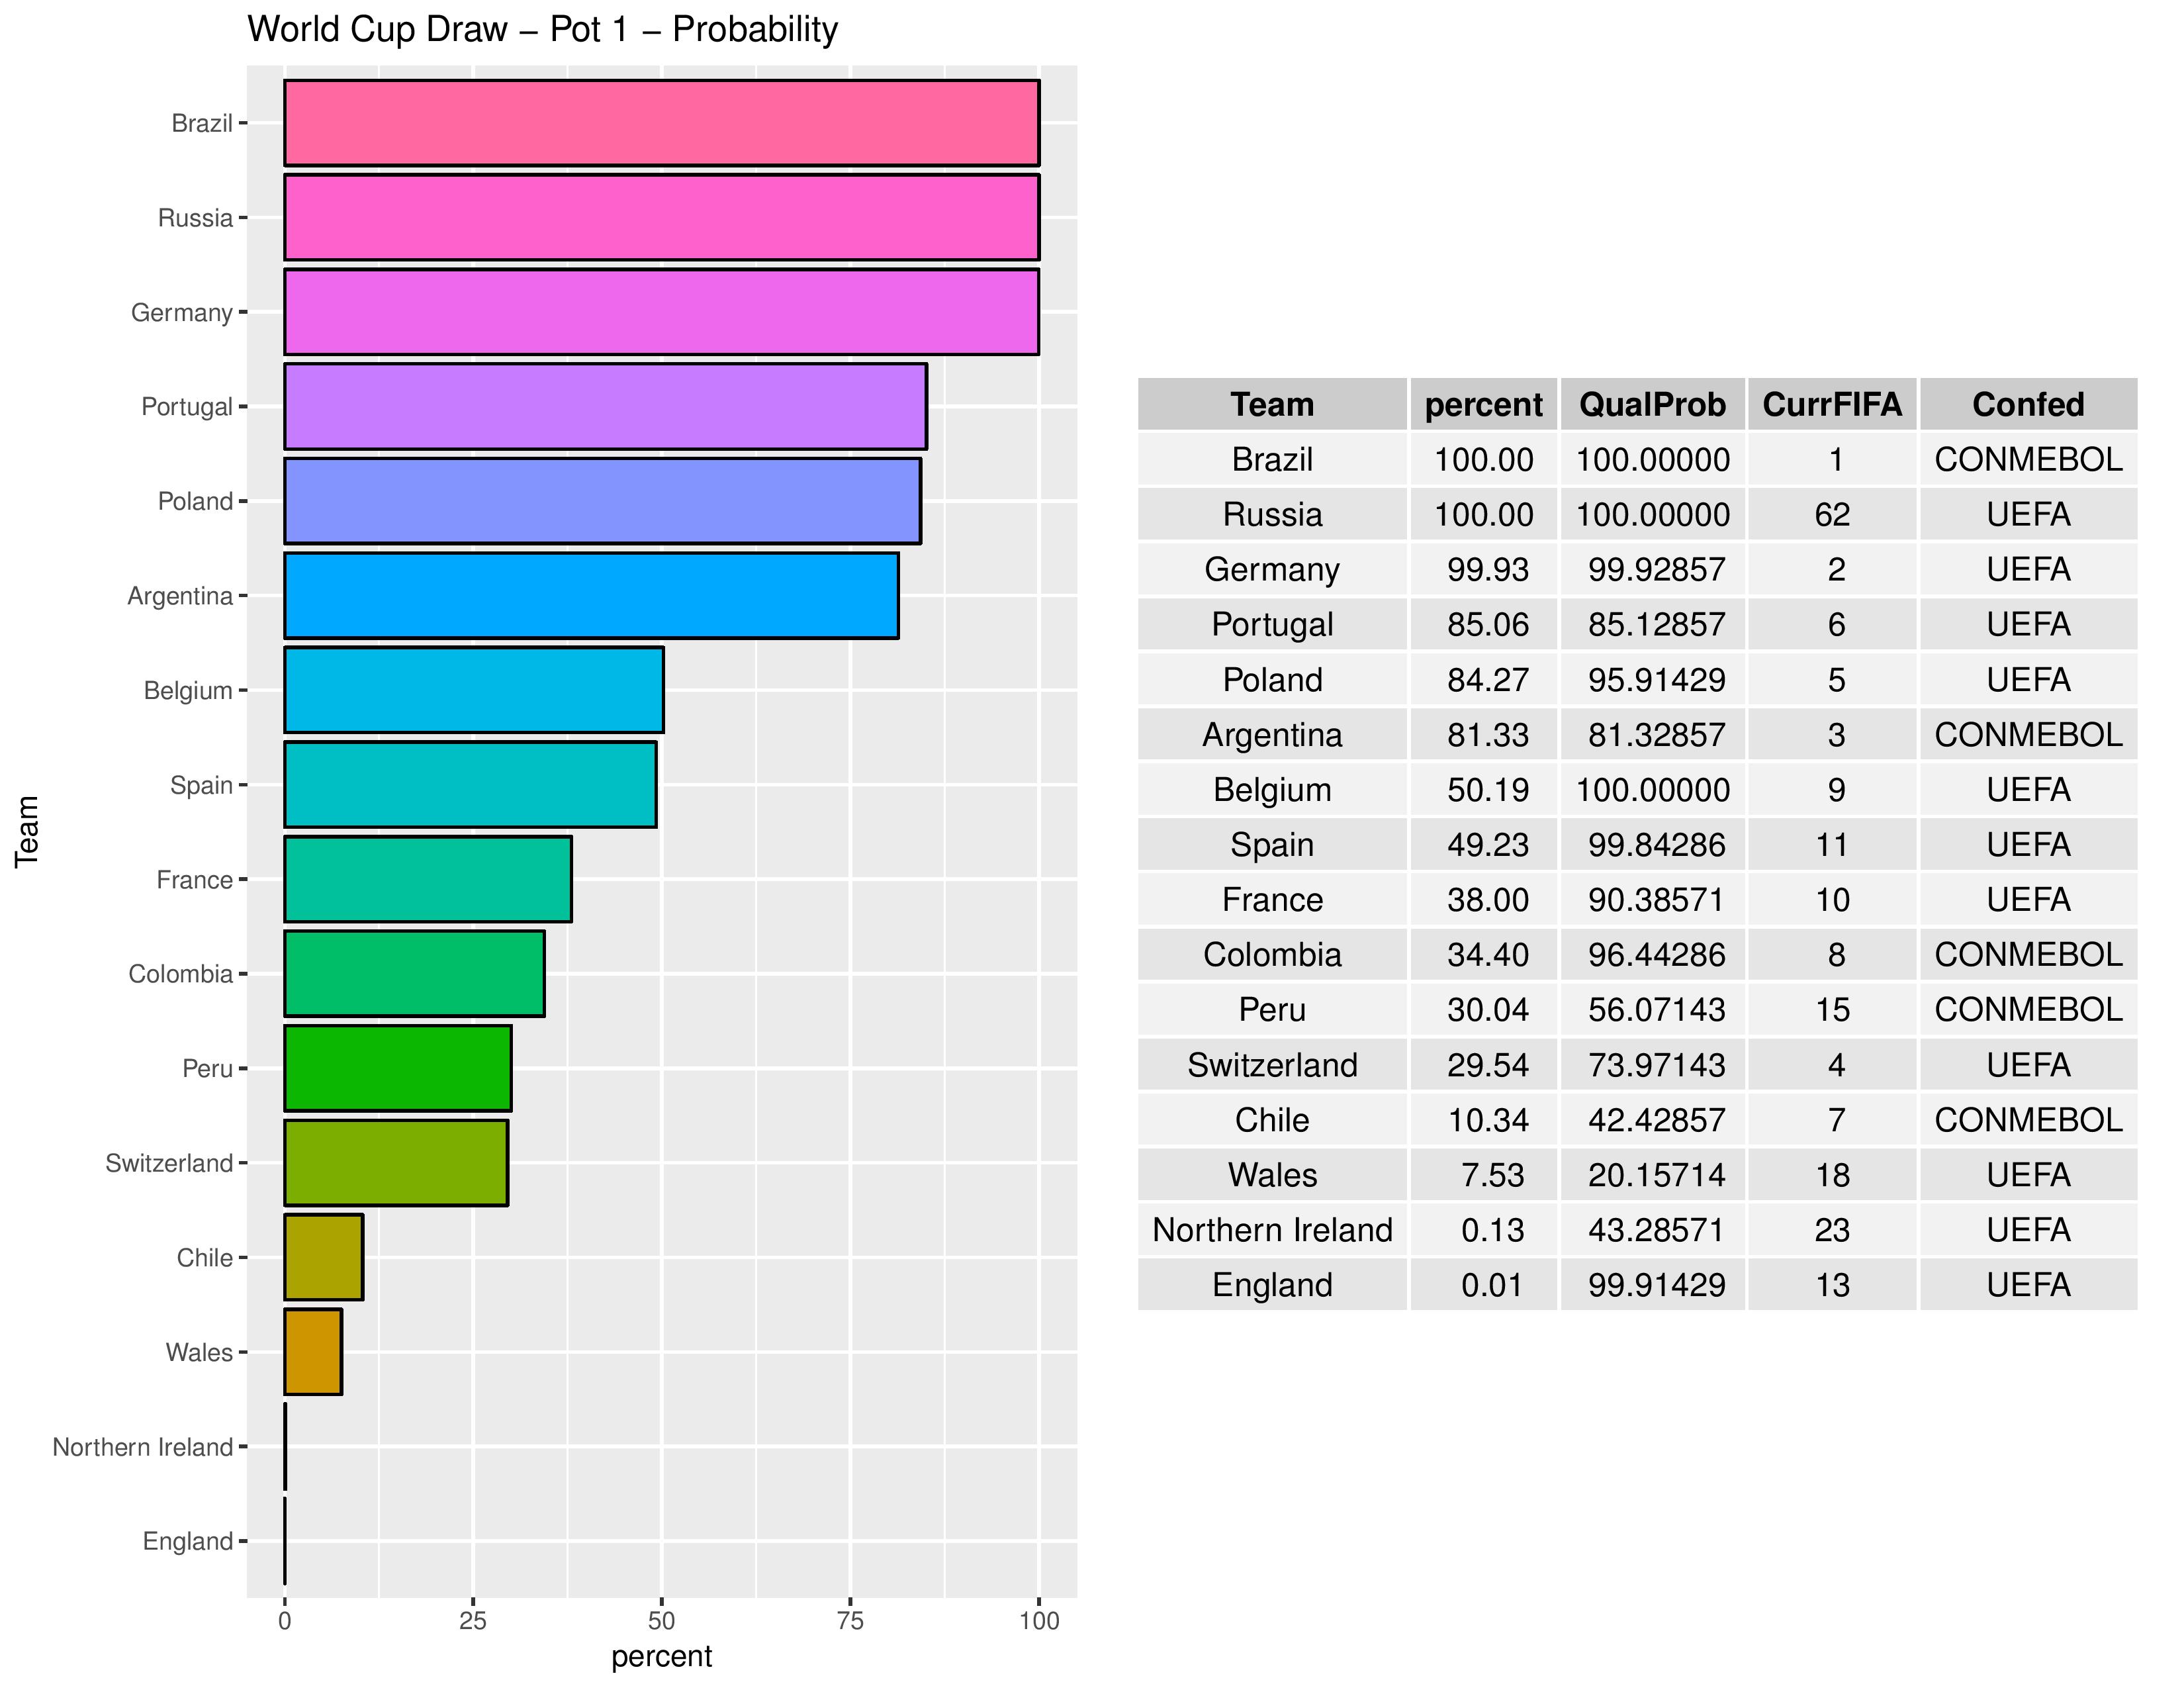
Below is the probability of obtaining Pot 1 status. In the table, we also include the team’s qualification probability (if they don’t qualify, they can’t be in Pot 1), their current FIFA rank, and their confederation for helpful information.
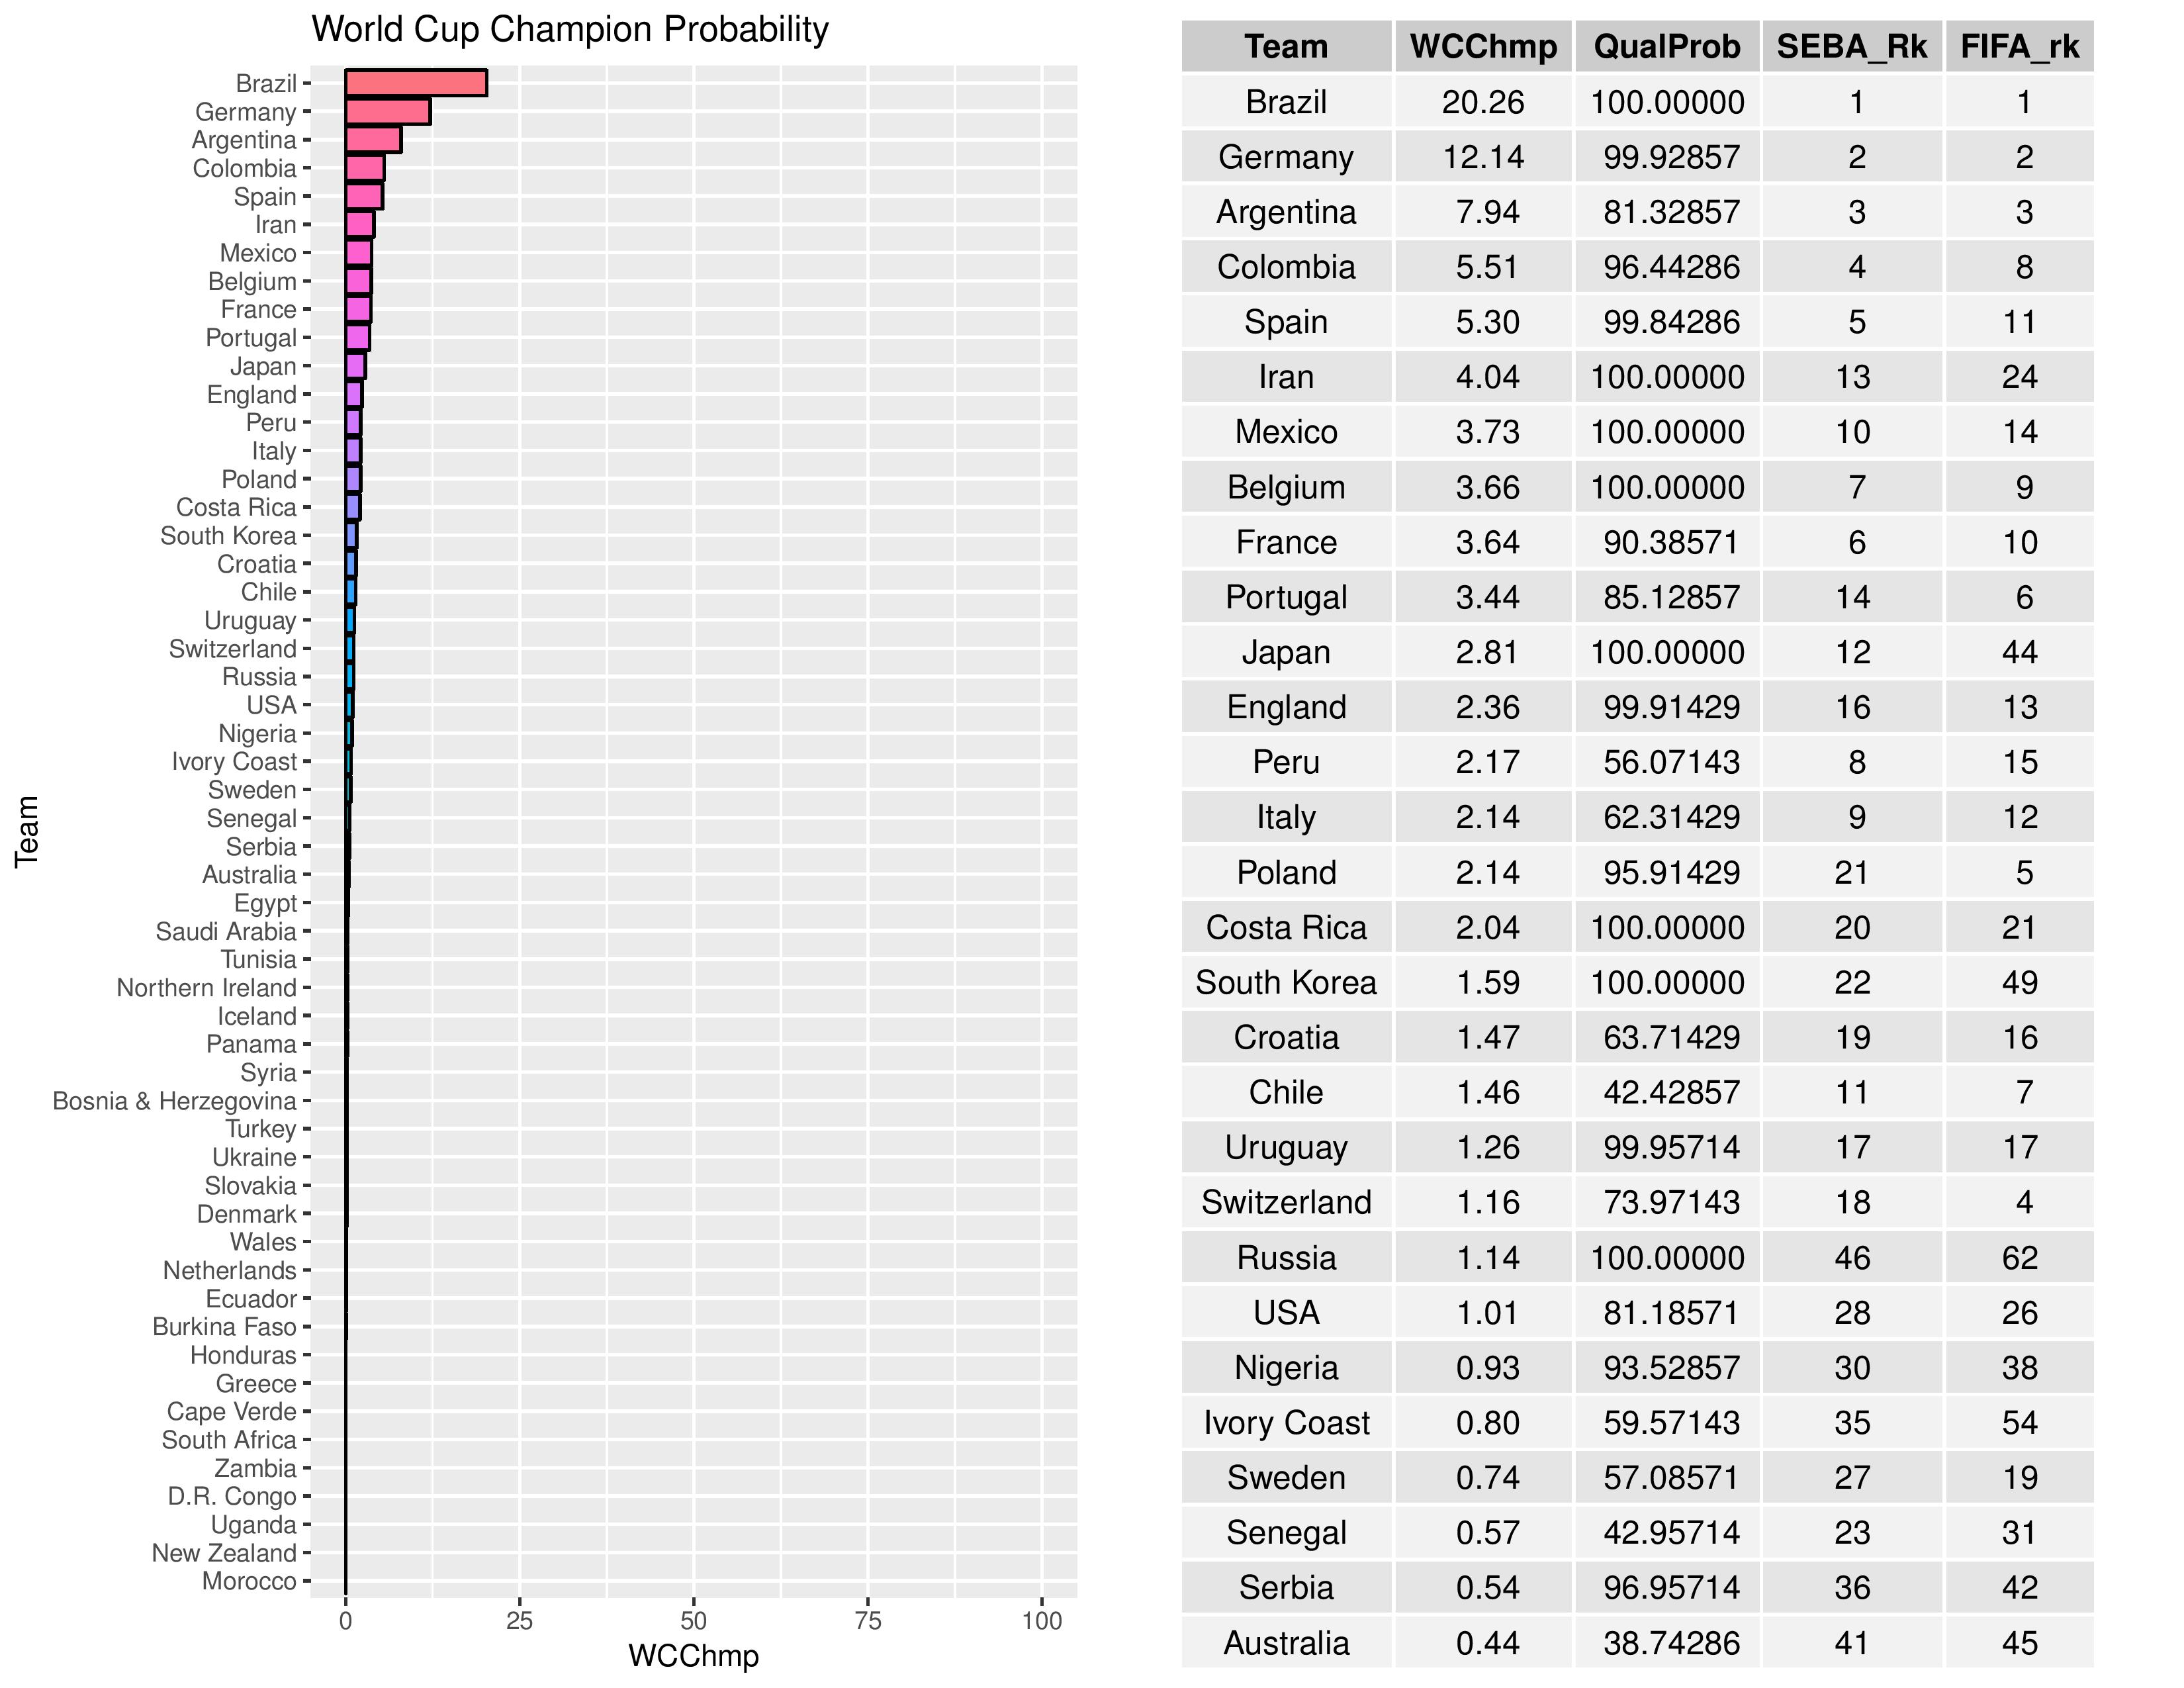
The following then manages to forecast the 2018 World Cup. Again, we accompany the odds of victory with qualification probability to help understand why some teams may be lower than expected. The USMNT have increased from 0.64% to a 1.01% chance of winning the World Cup since the last published forecast.
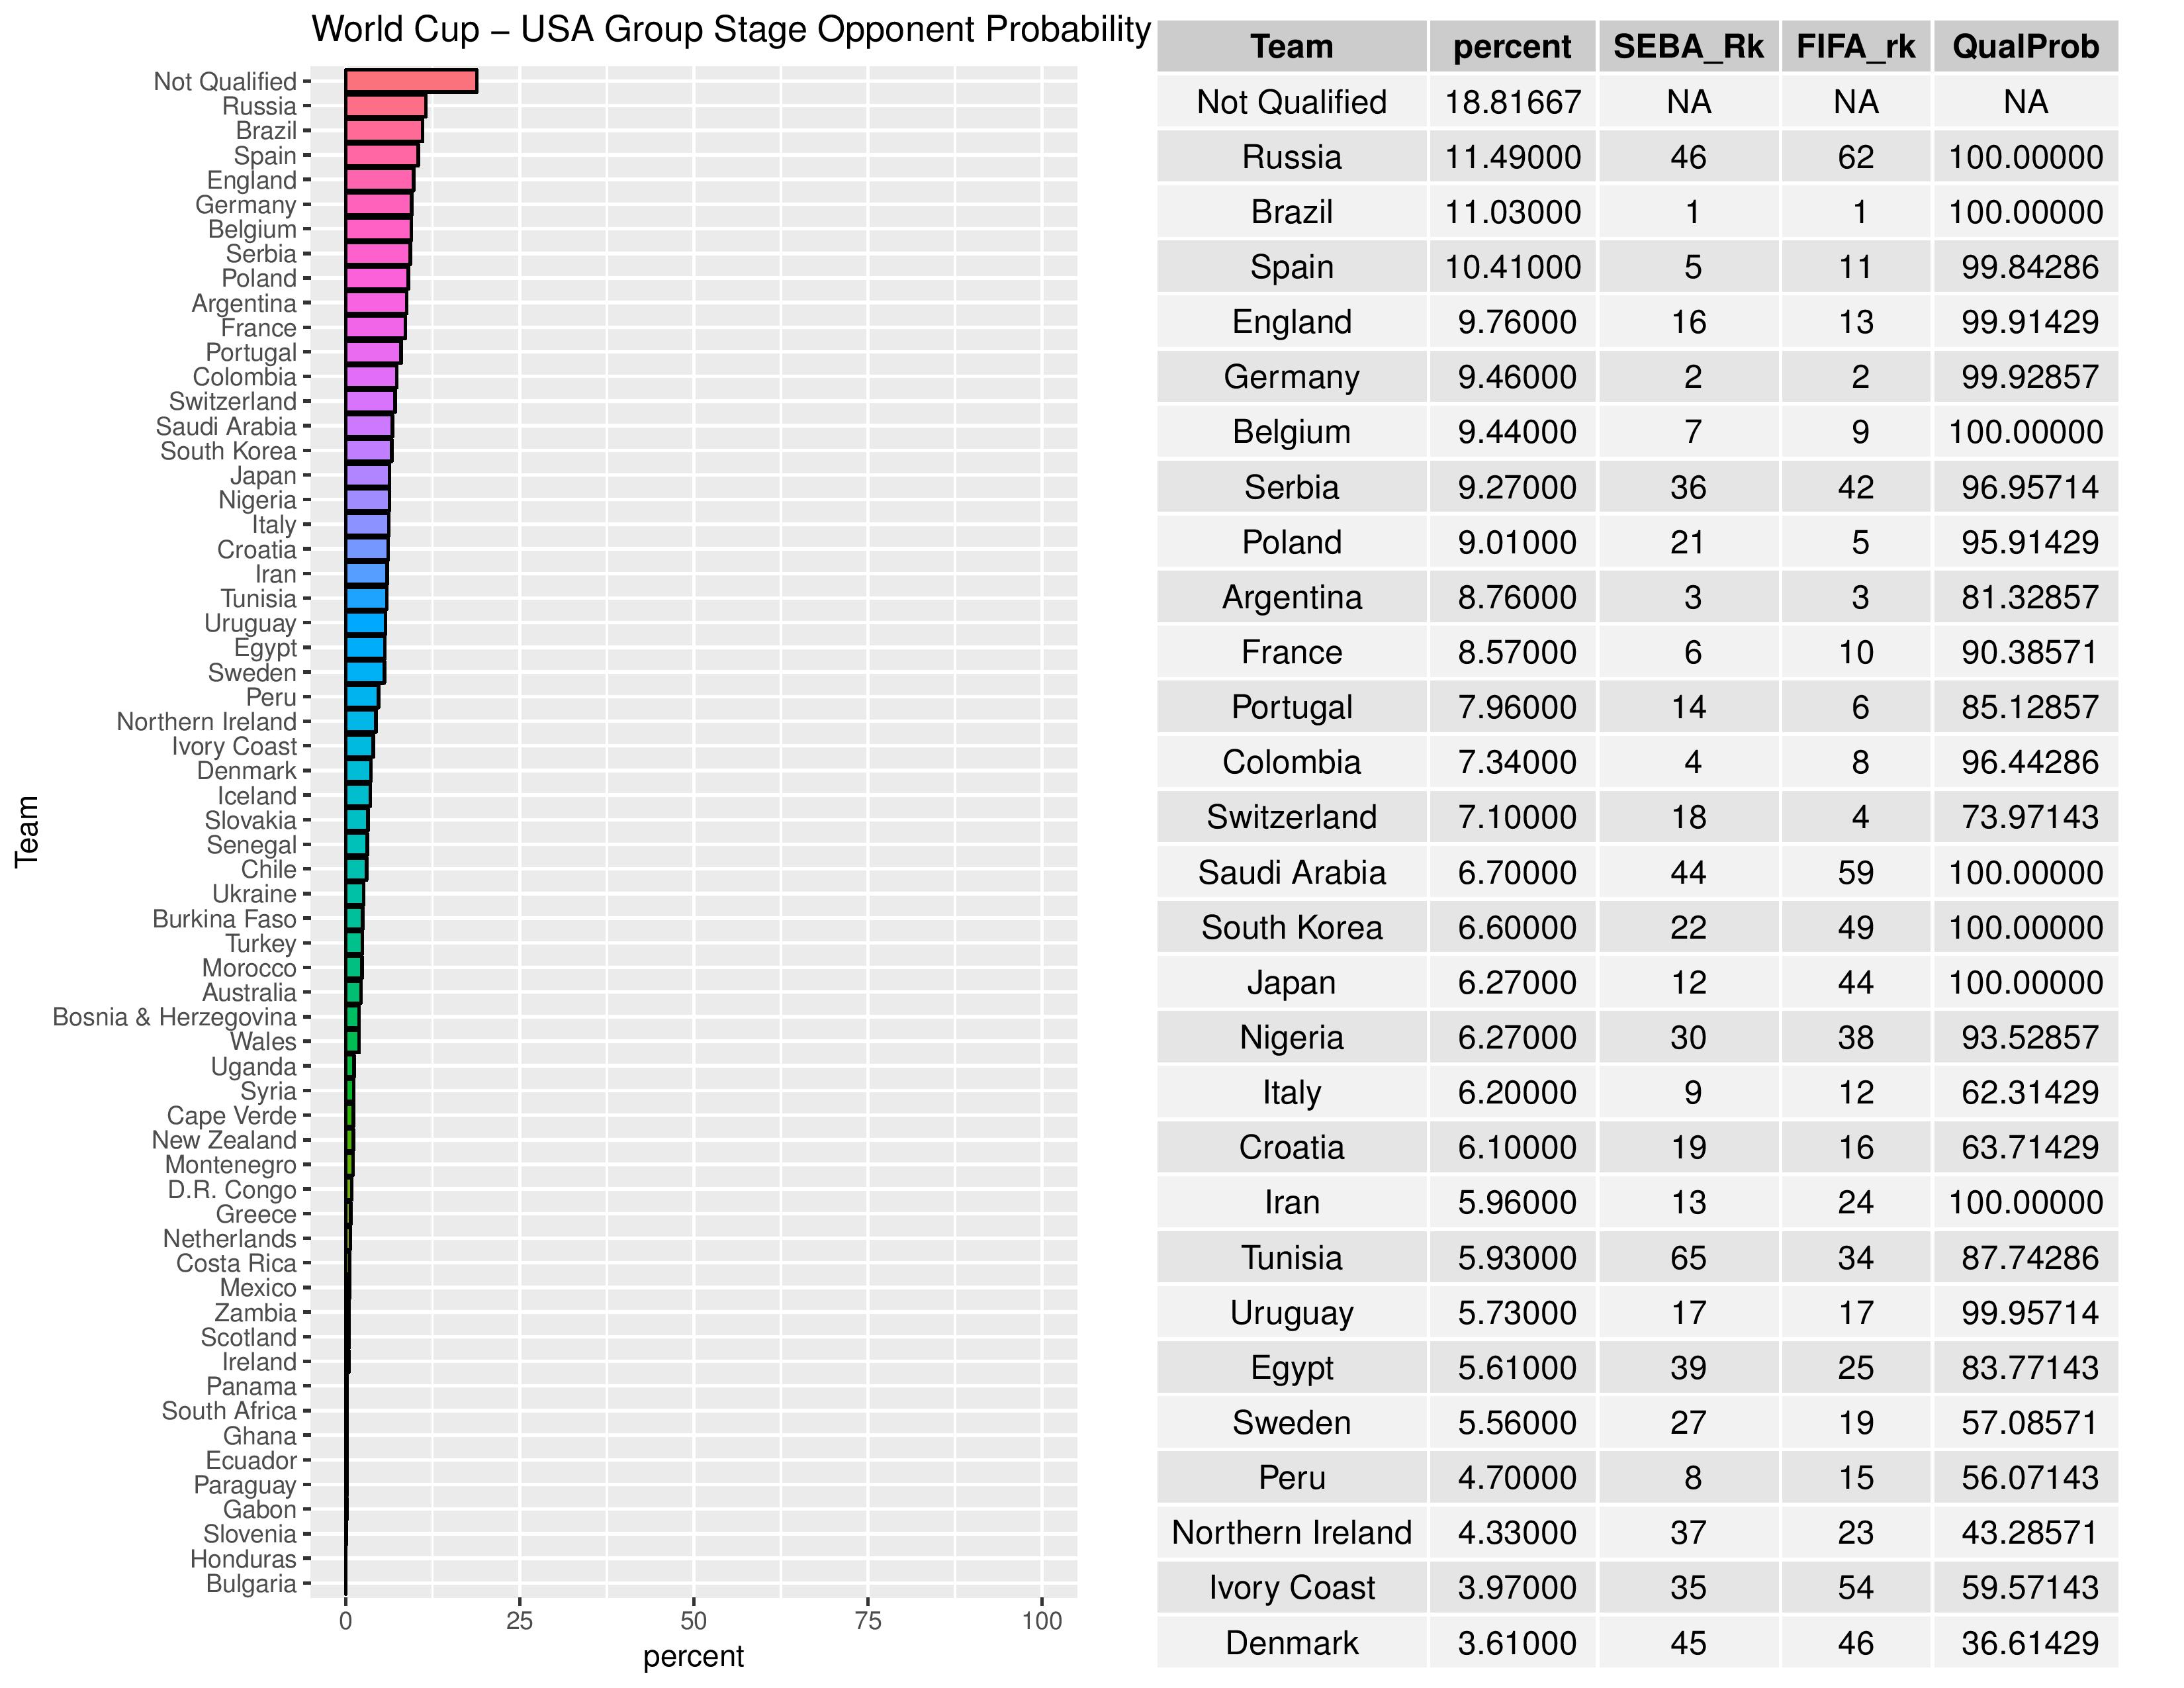
The following shows the USA’s most probable group stage Opponents.
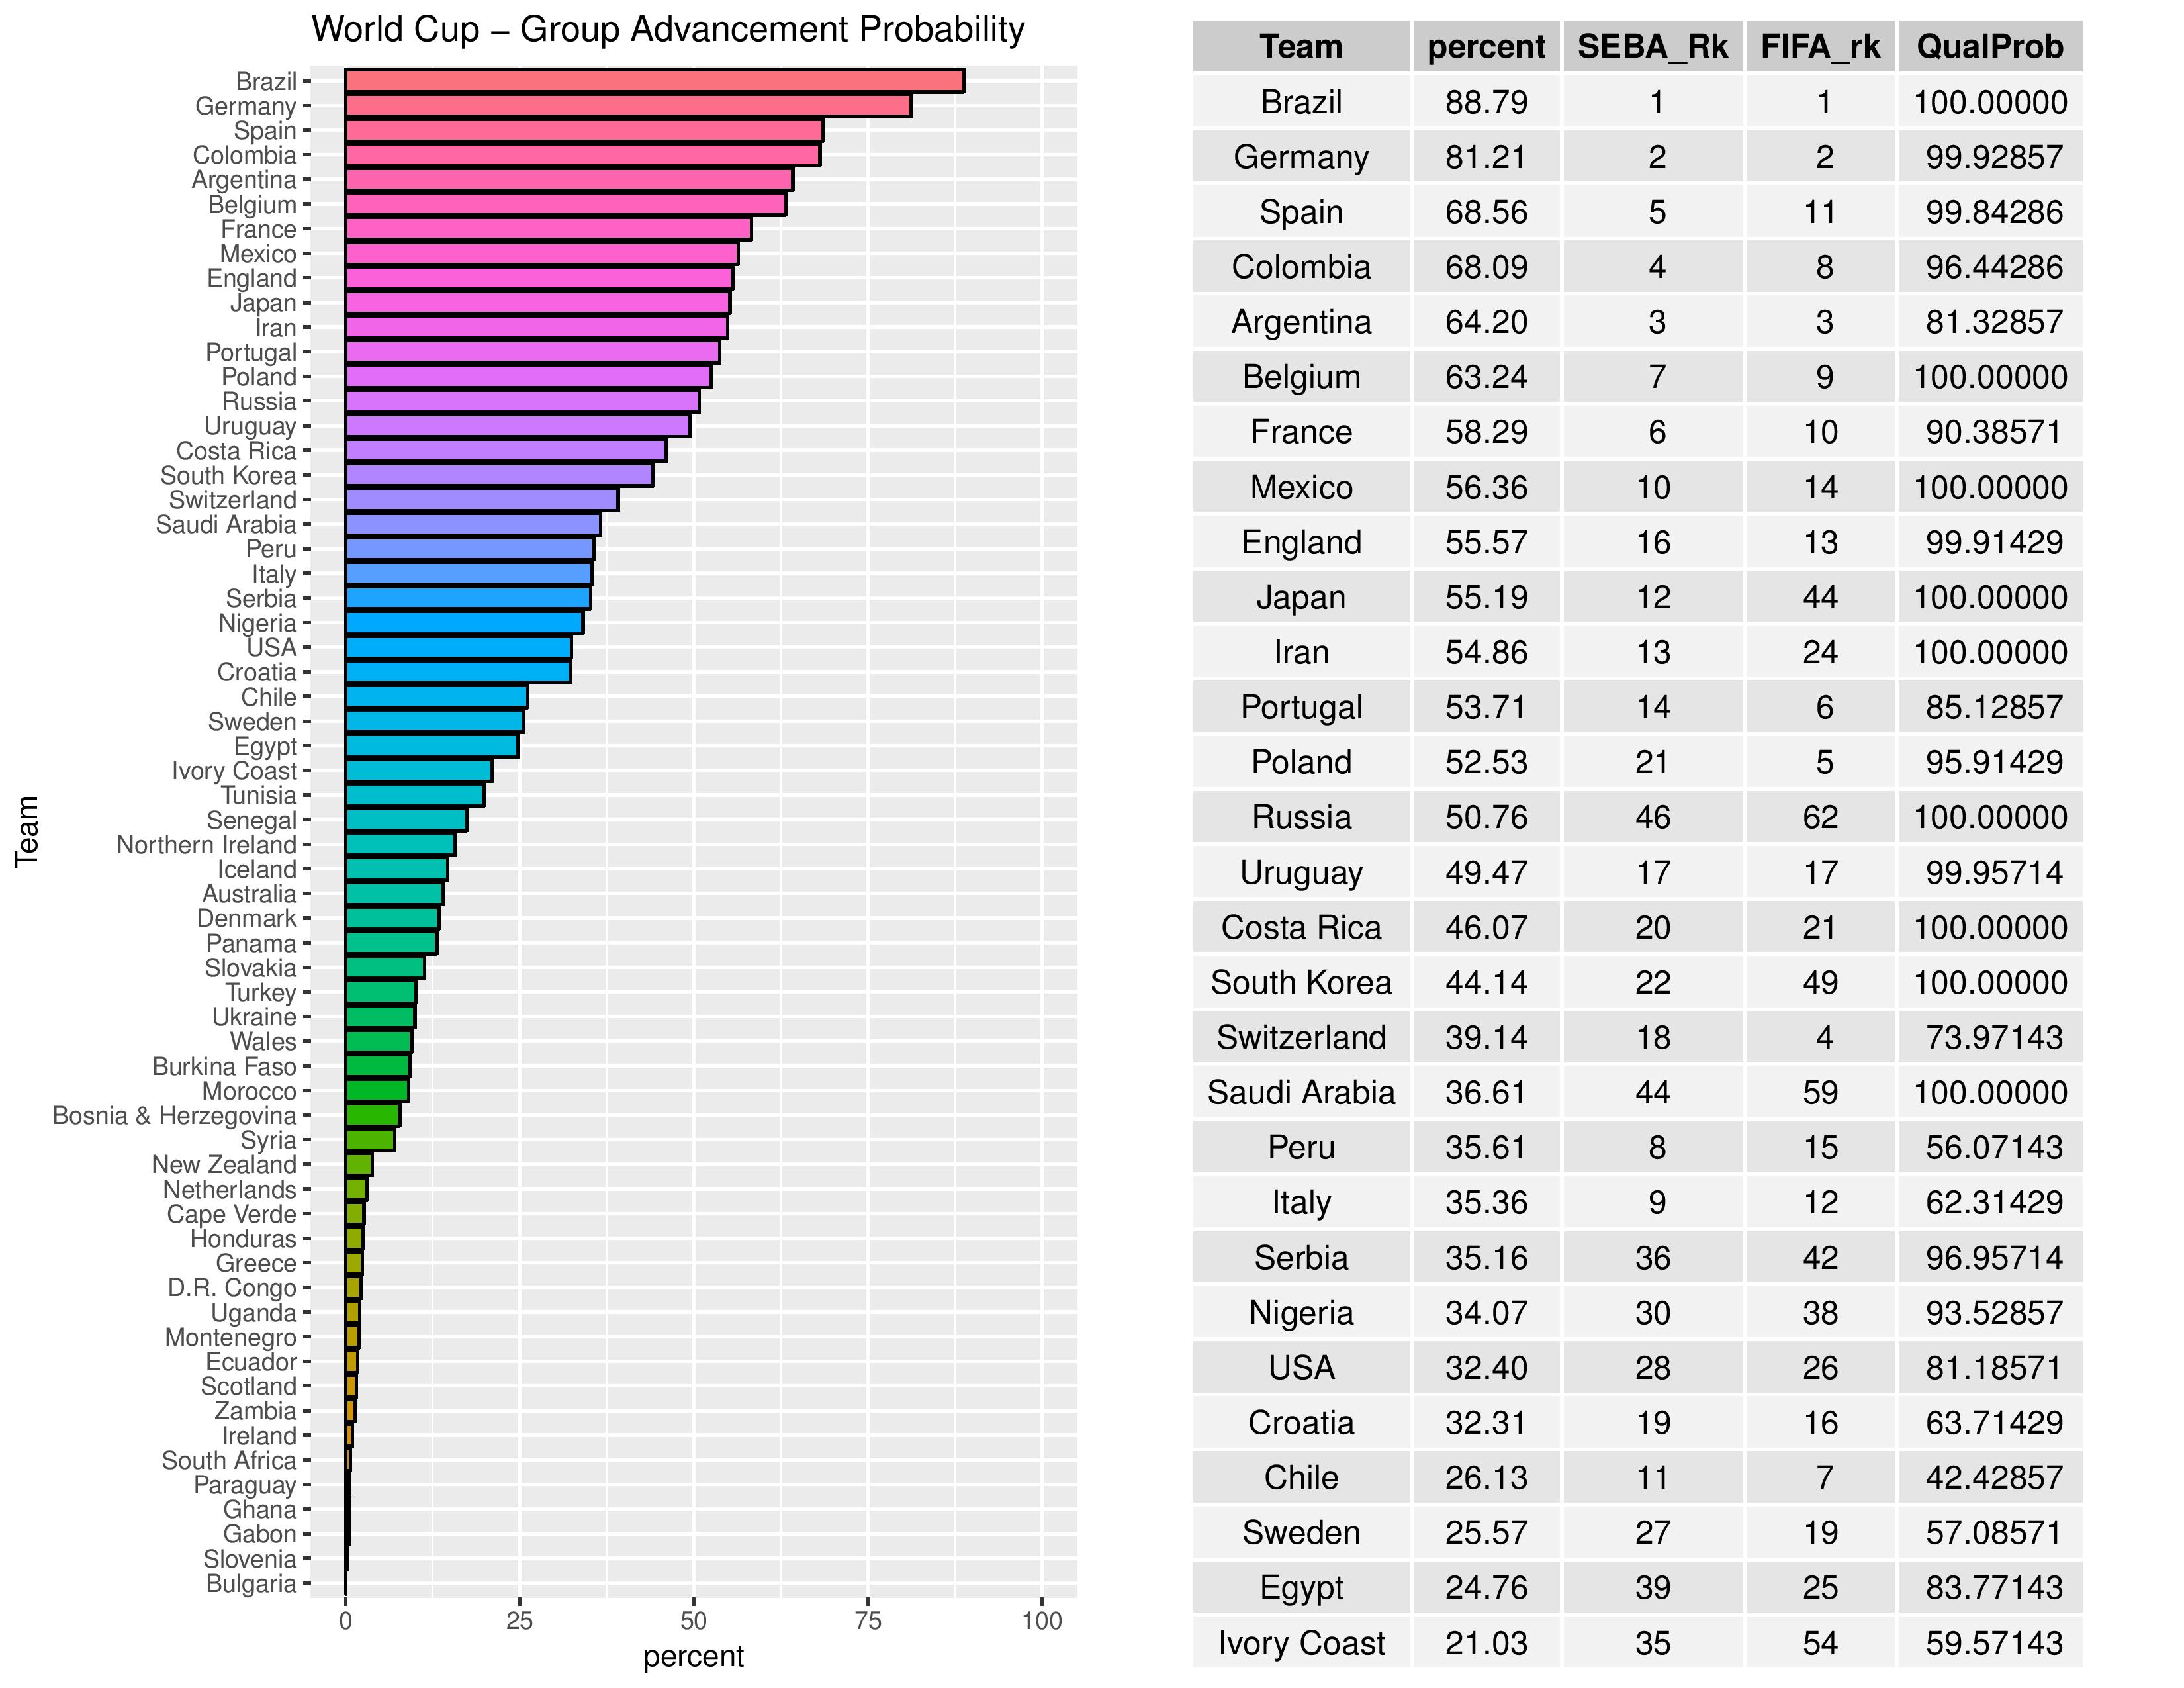
The following shows the various odds of each national team progressing out of the Group Stage. USA has decreased from 35.08% to 32.40% of making it through the group stage of the World Cup since the last published forecast.
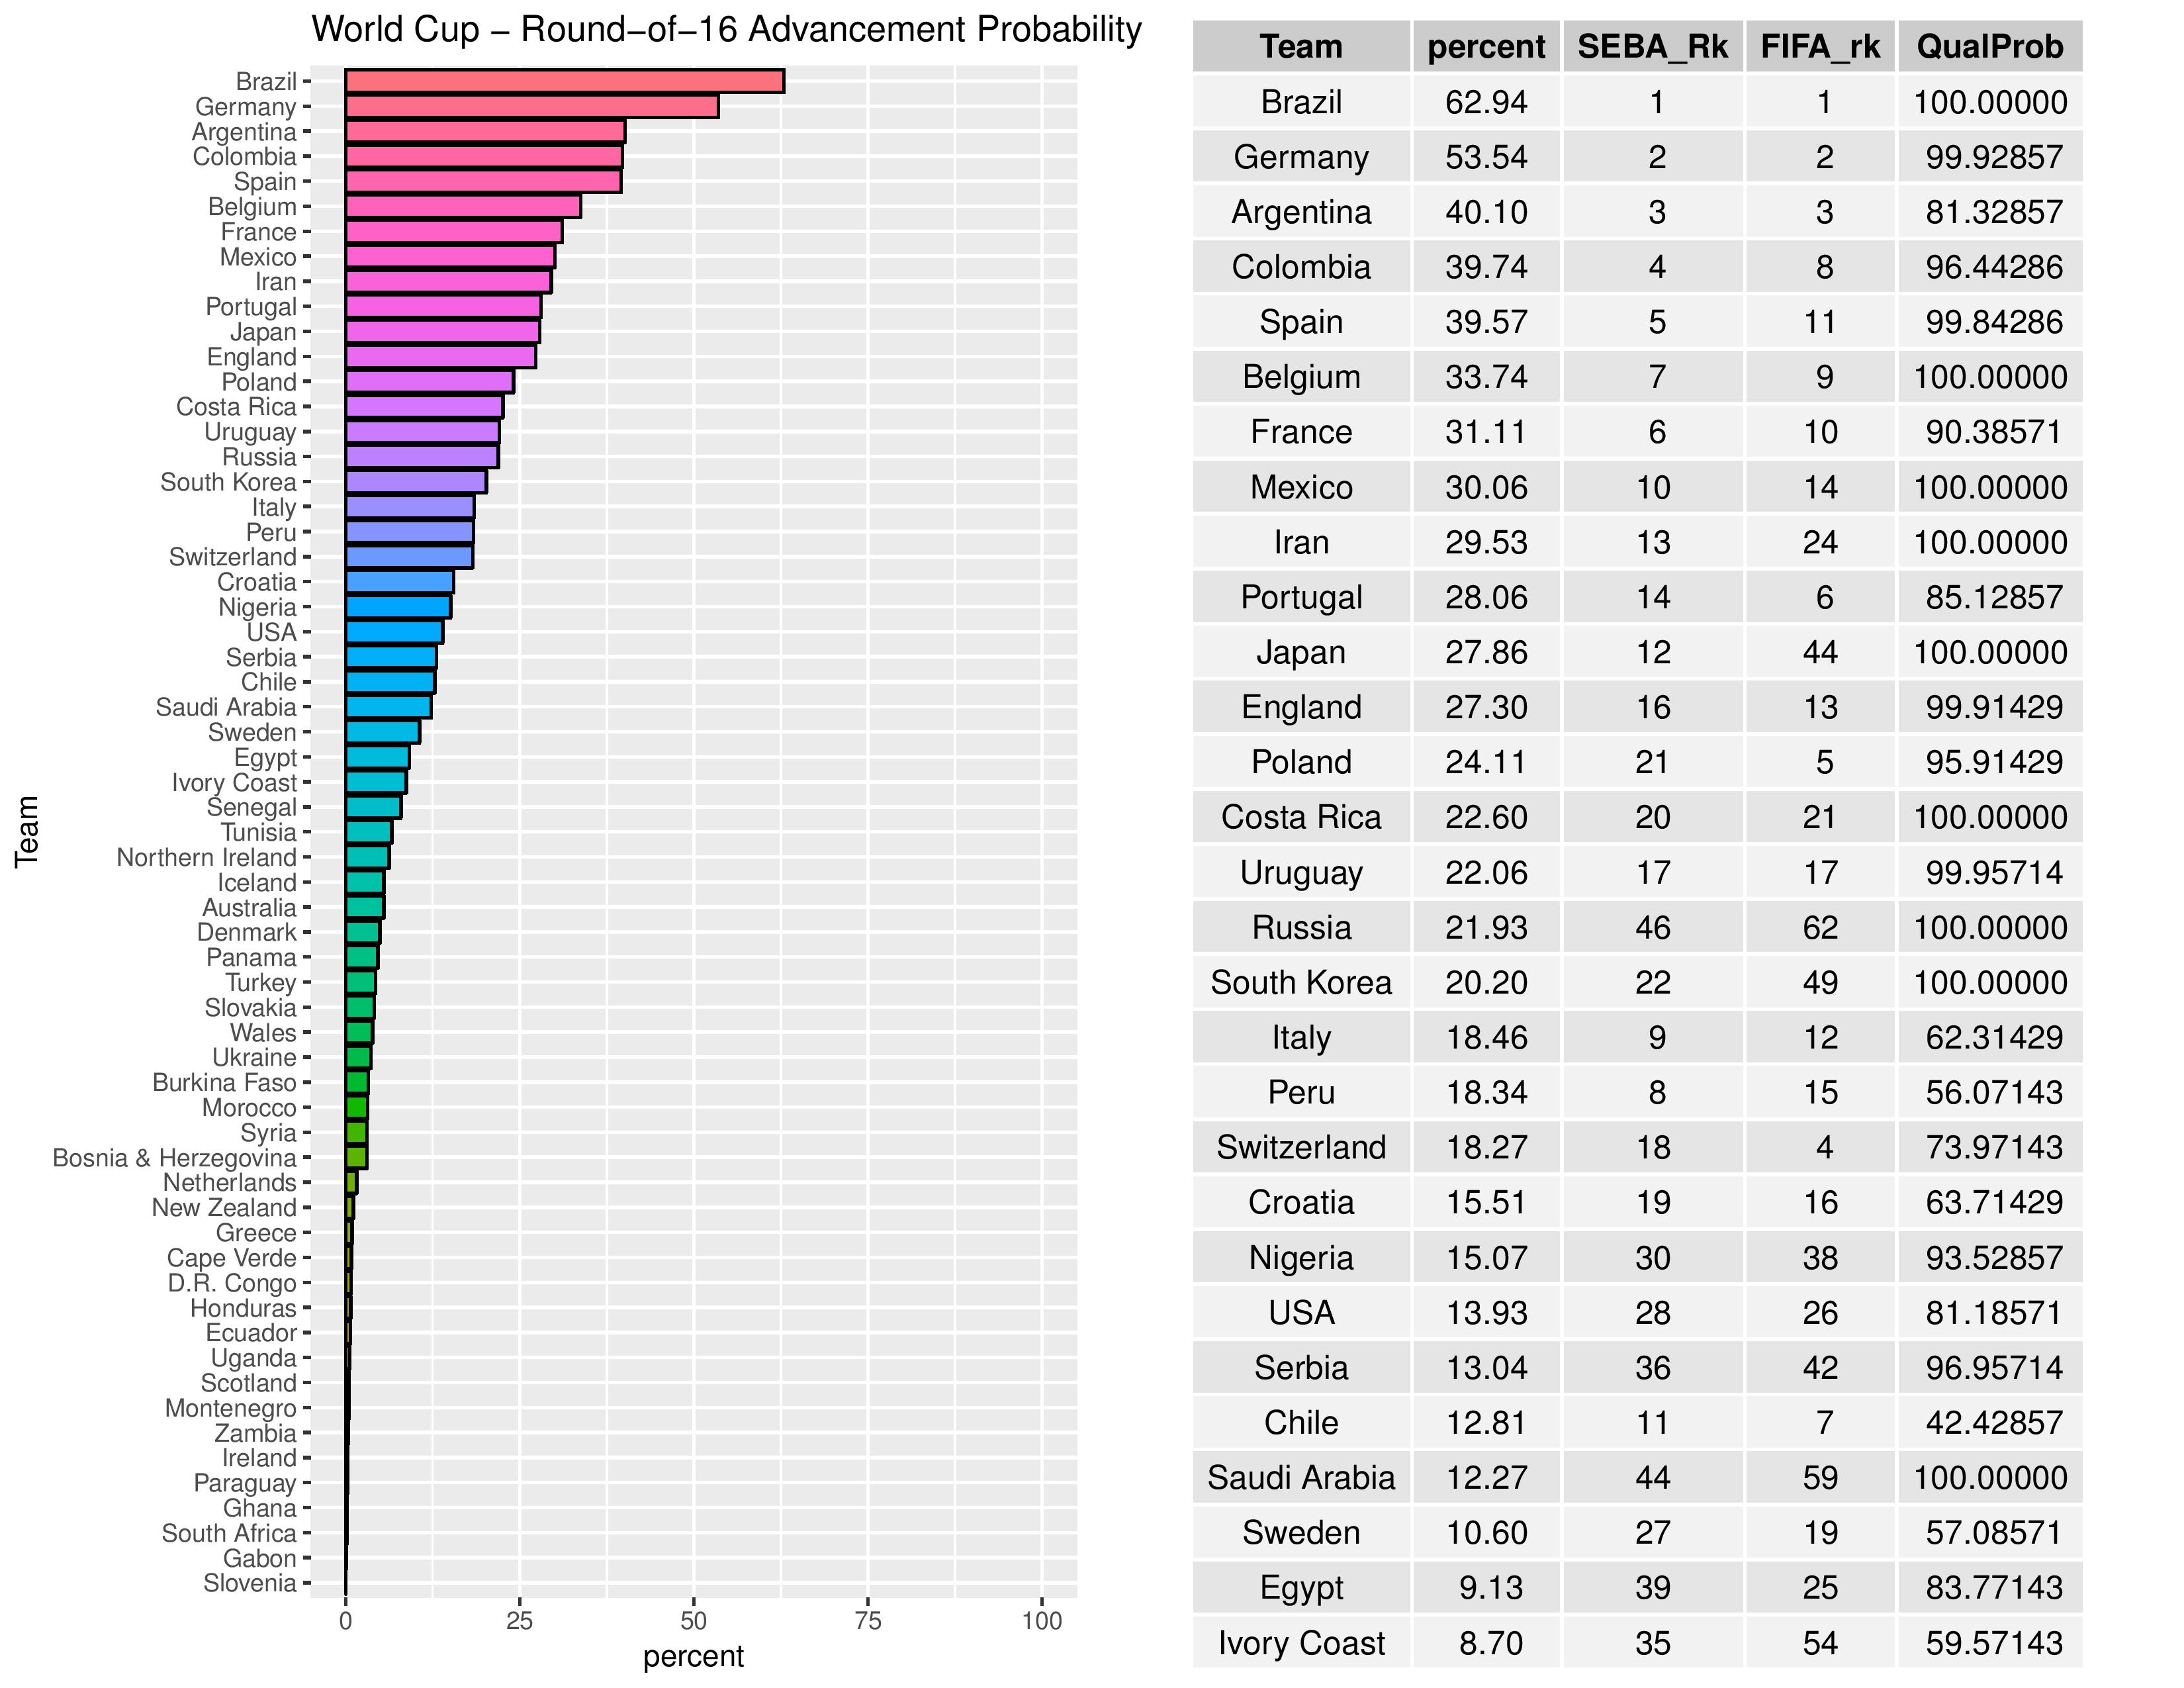
The following shows the probabilities of teams advancing through the Round of 16. The USA decreased from 14.74% to 13.93% in their chances of making it through the Round of 16 since the last published forecast.
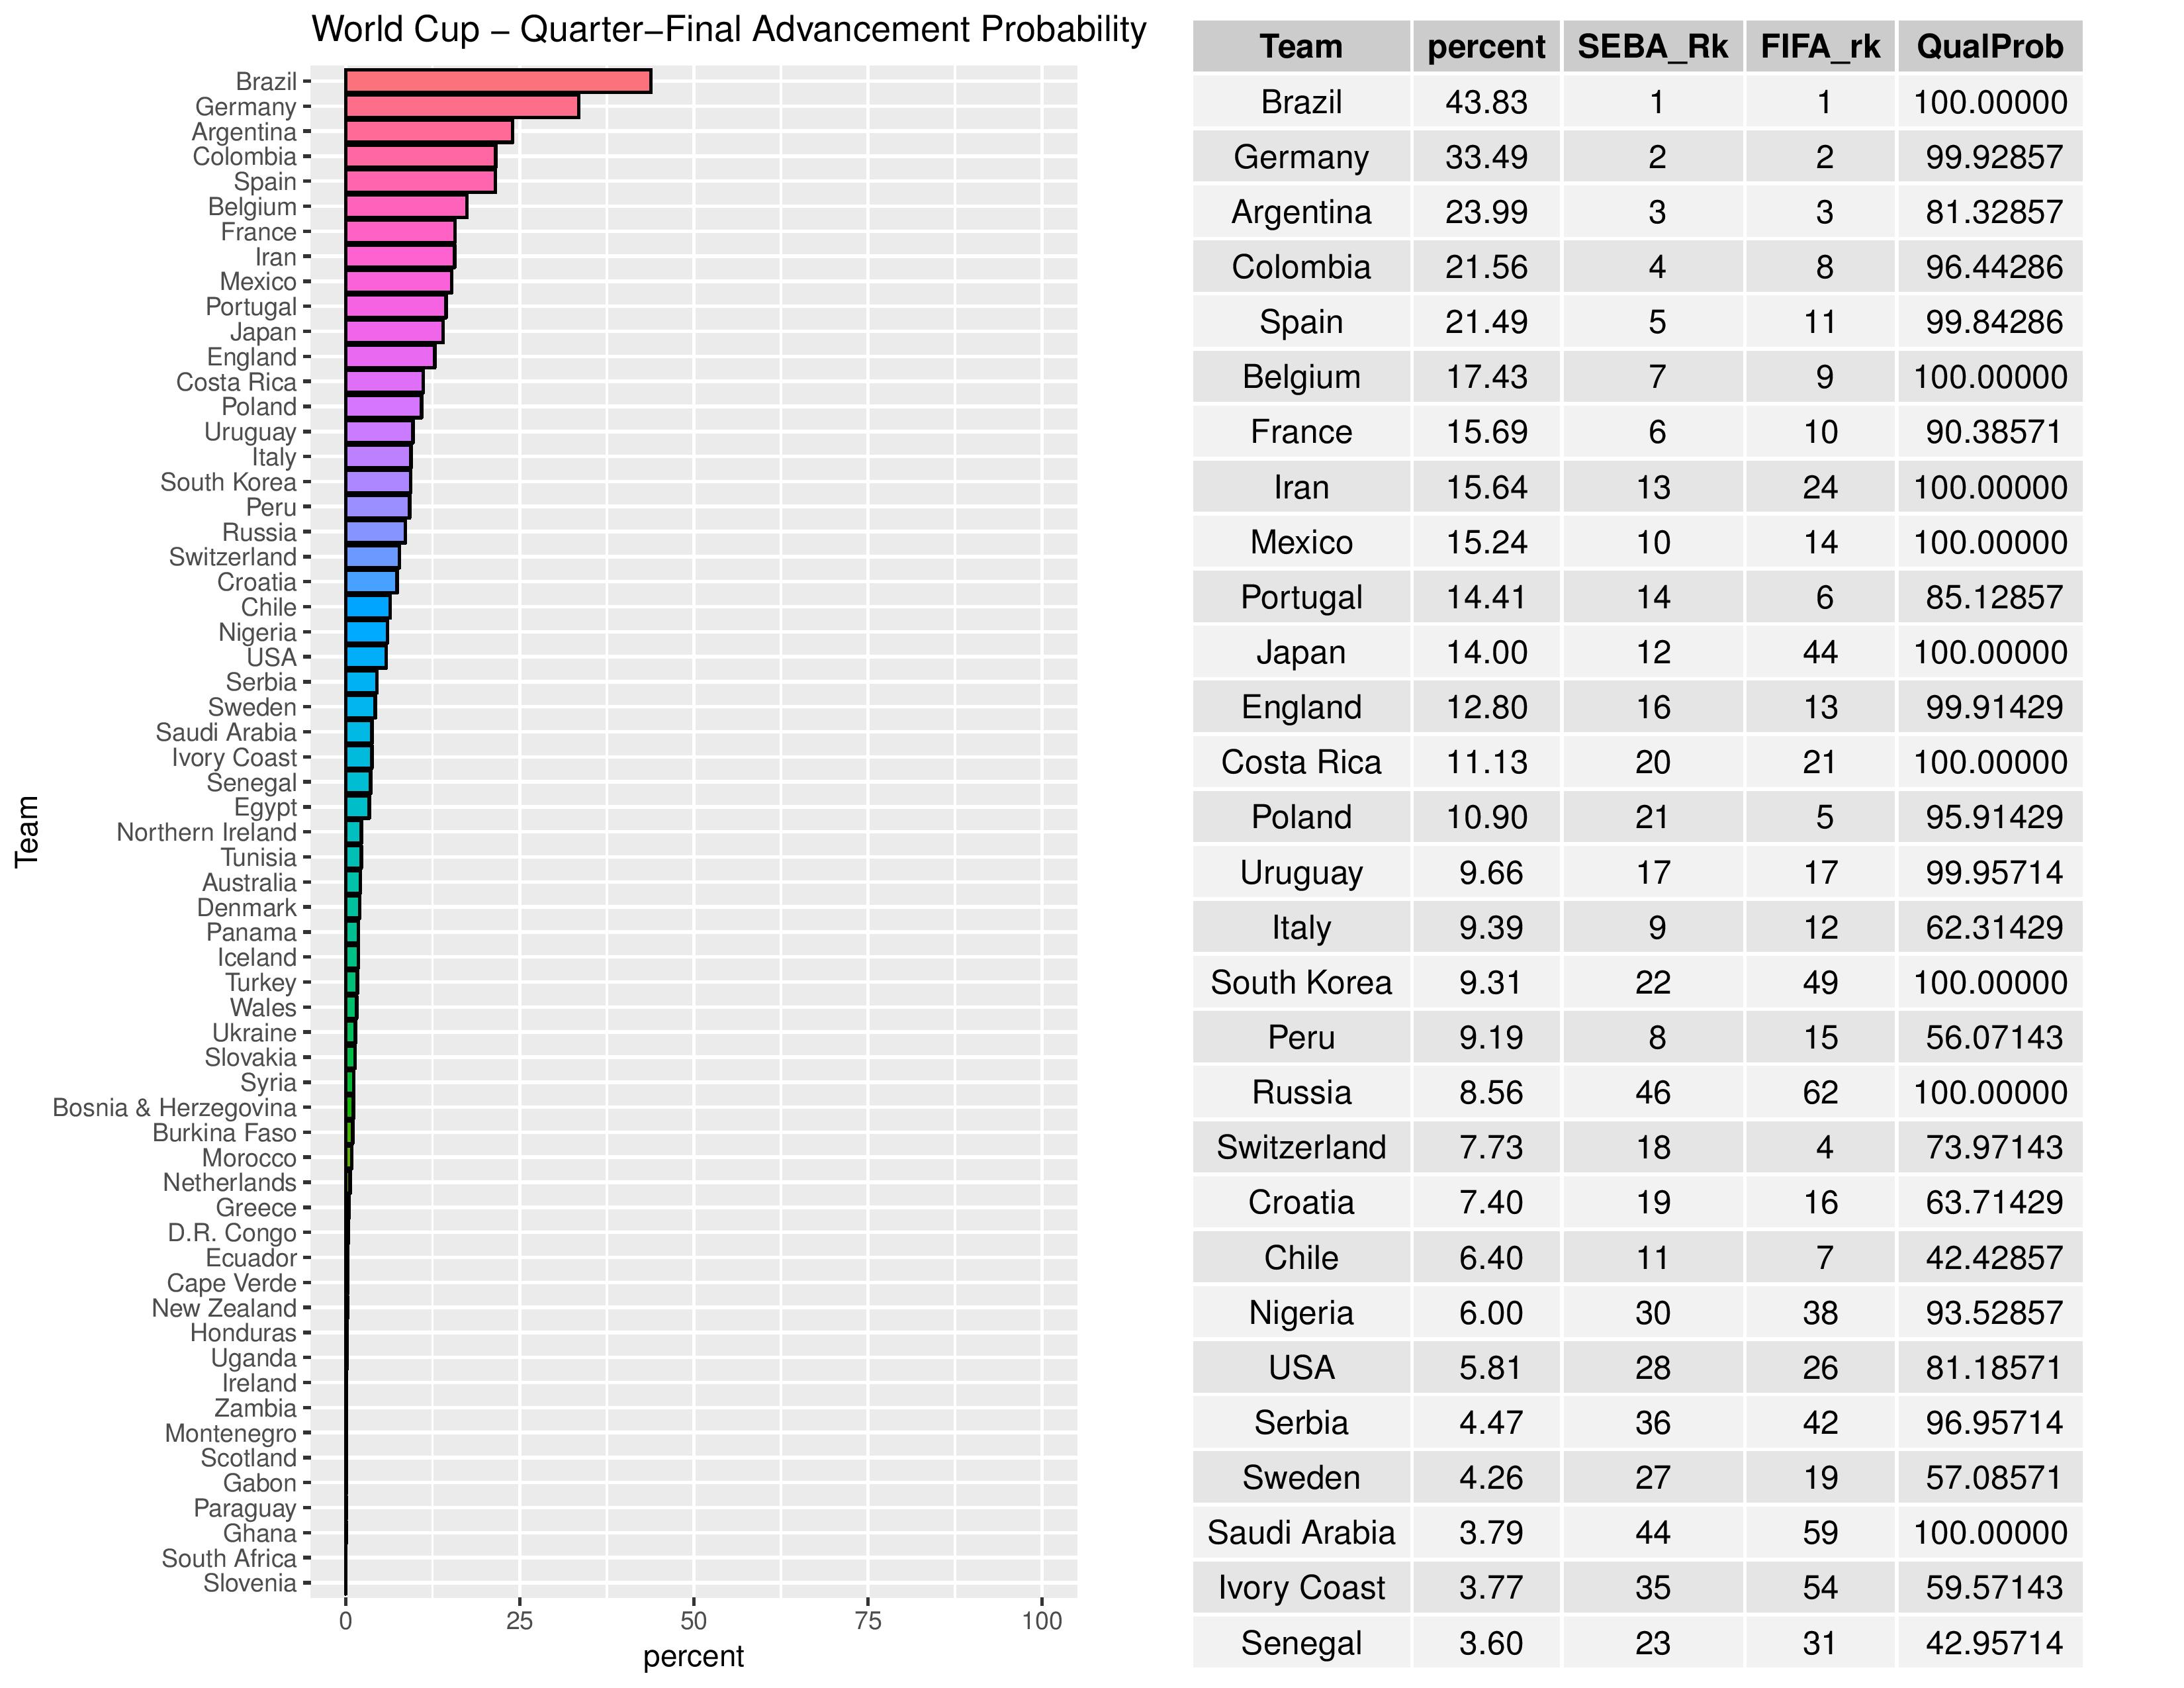
The following shows the probabilities of teams advancing through the quarterfinal. USA has decreased their chances from 6.28% to 5.81% of making it through the quarterfinal since the last published forecast.
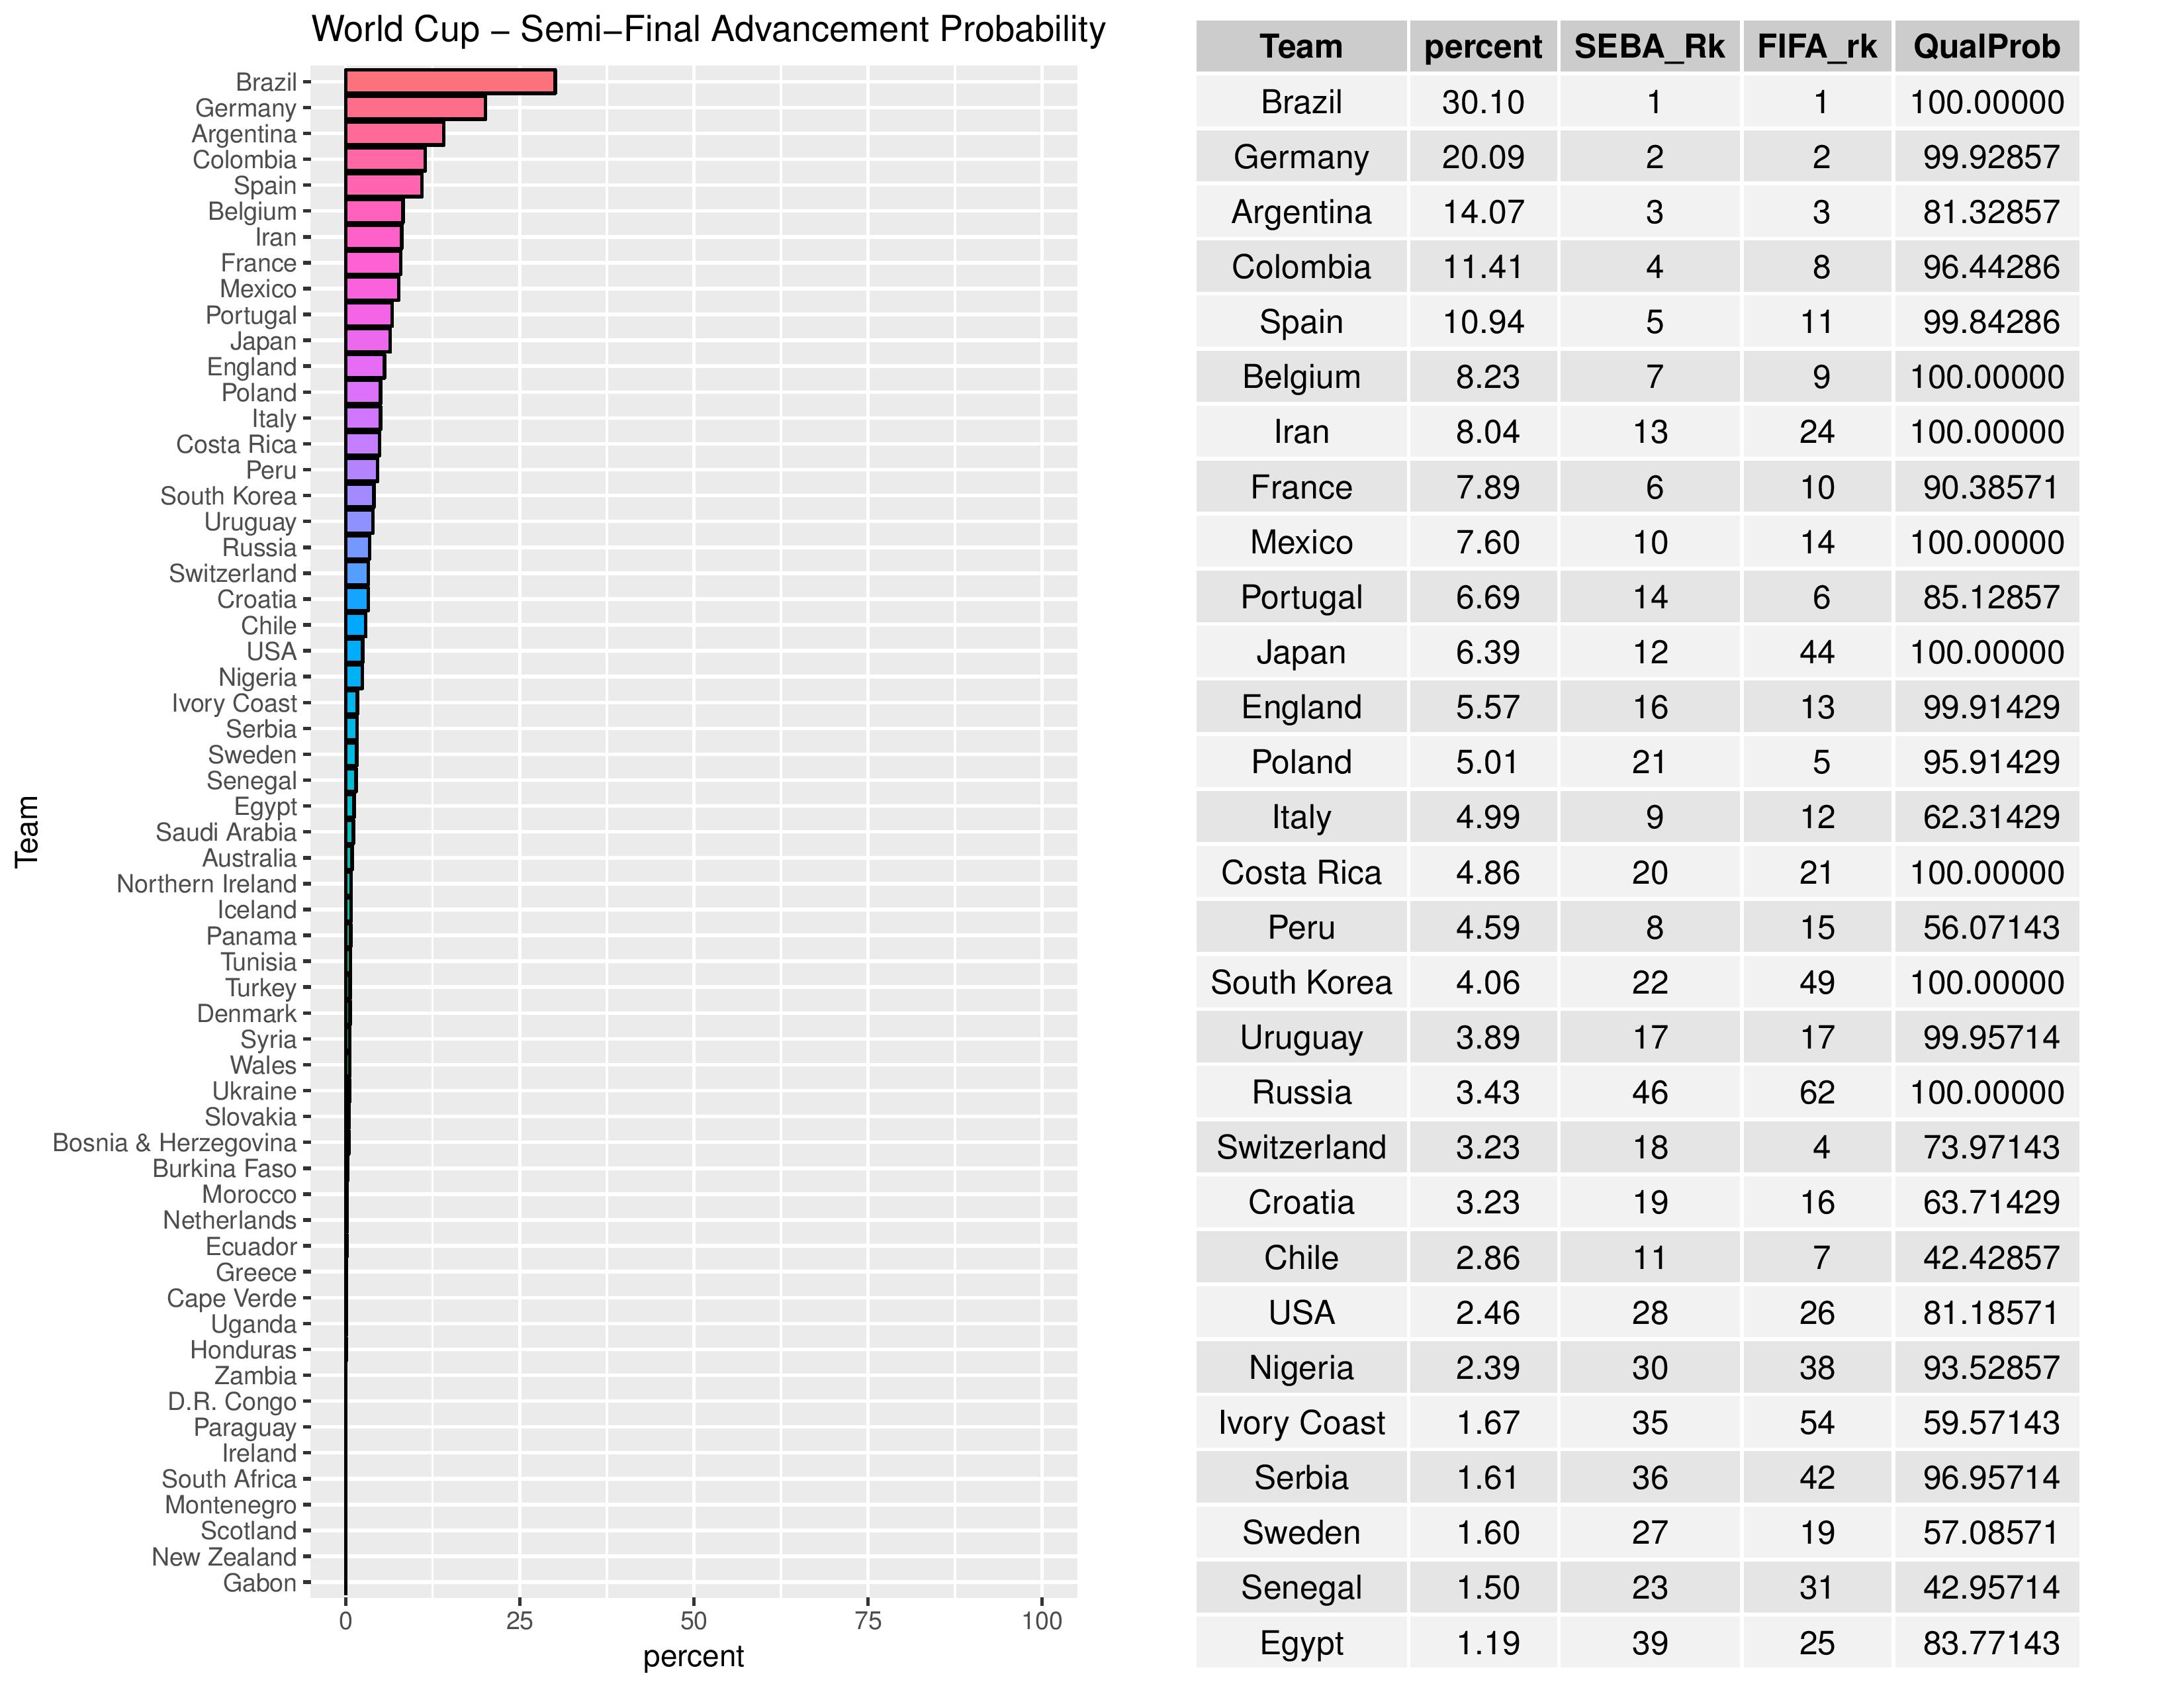
The following shows the probabilities of teams advancing through the semifinal. USA has increased from 2.38% to 2.46% in chances of making it through the semifinal since the last published forecast.
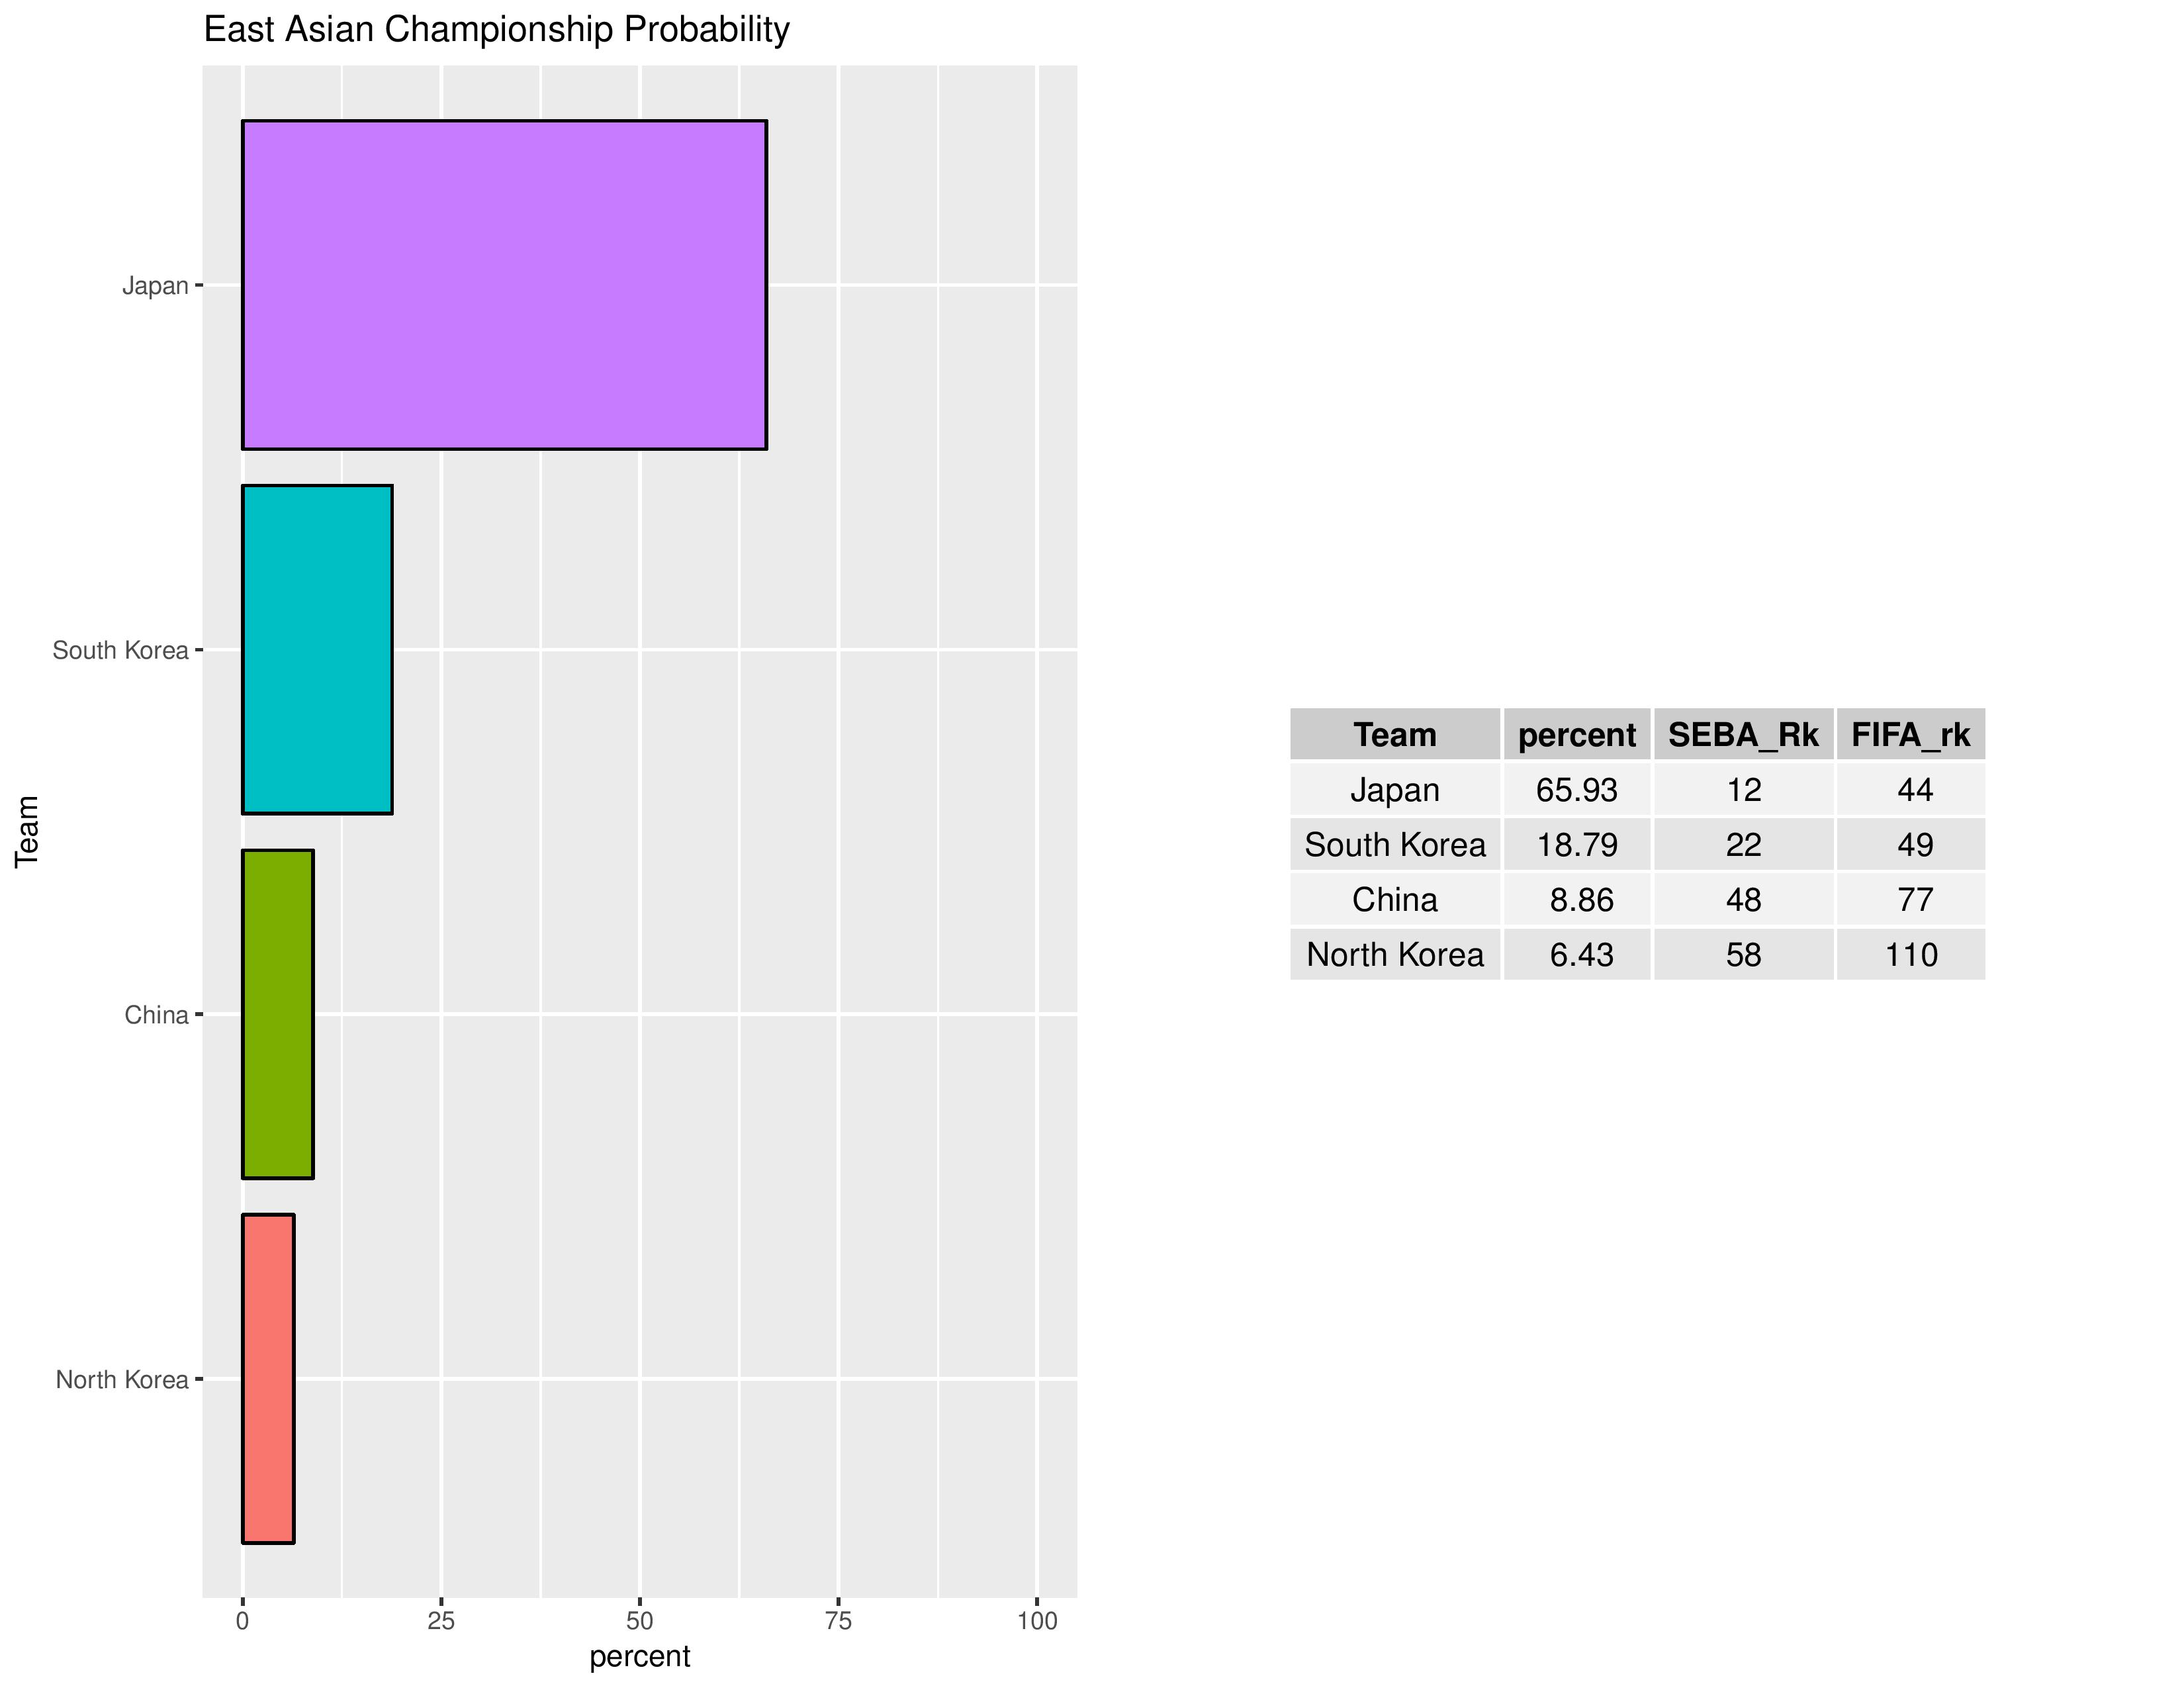
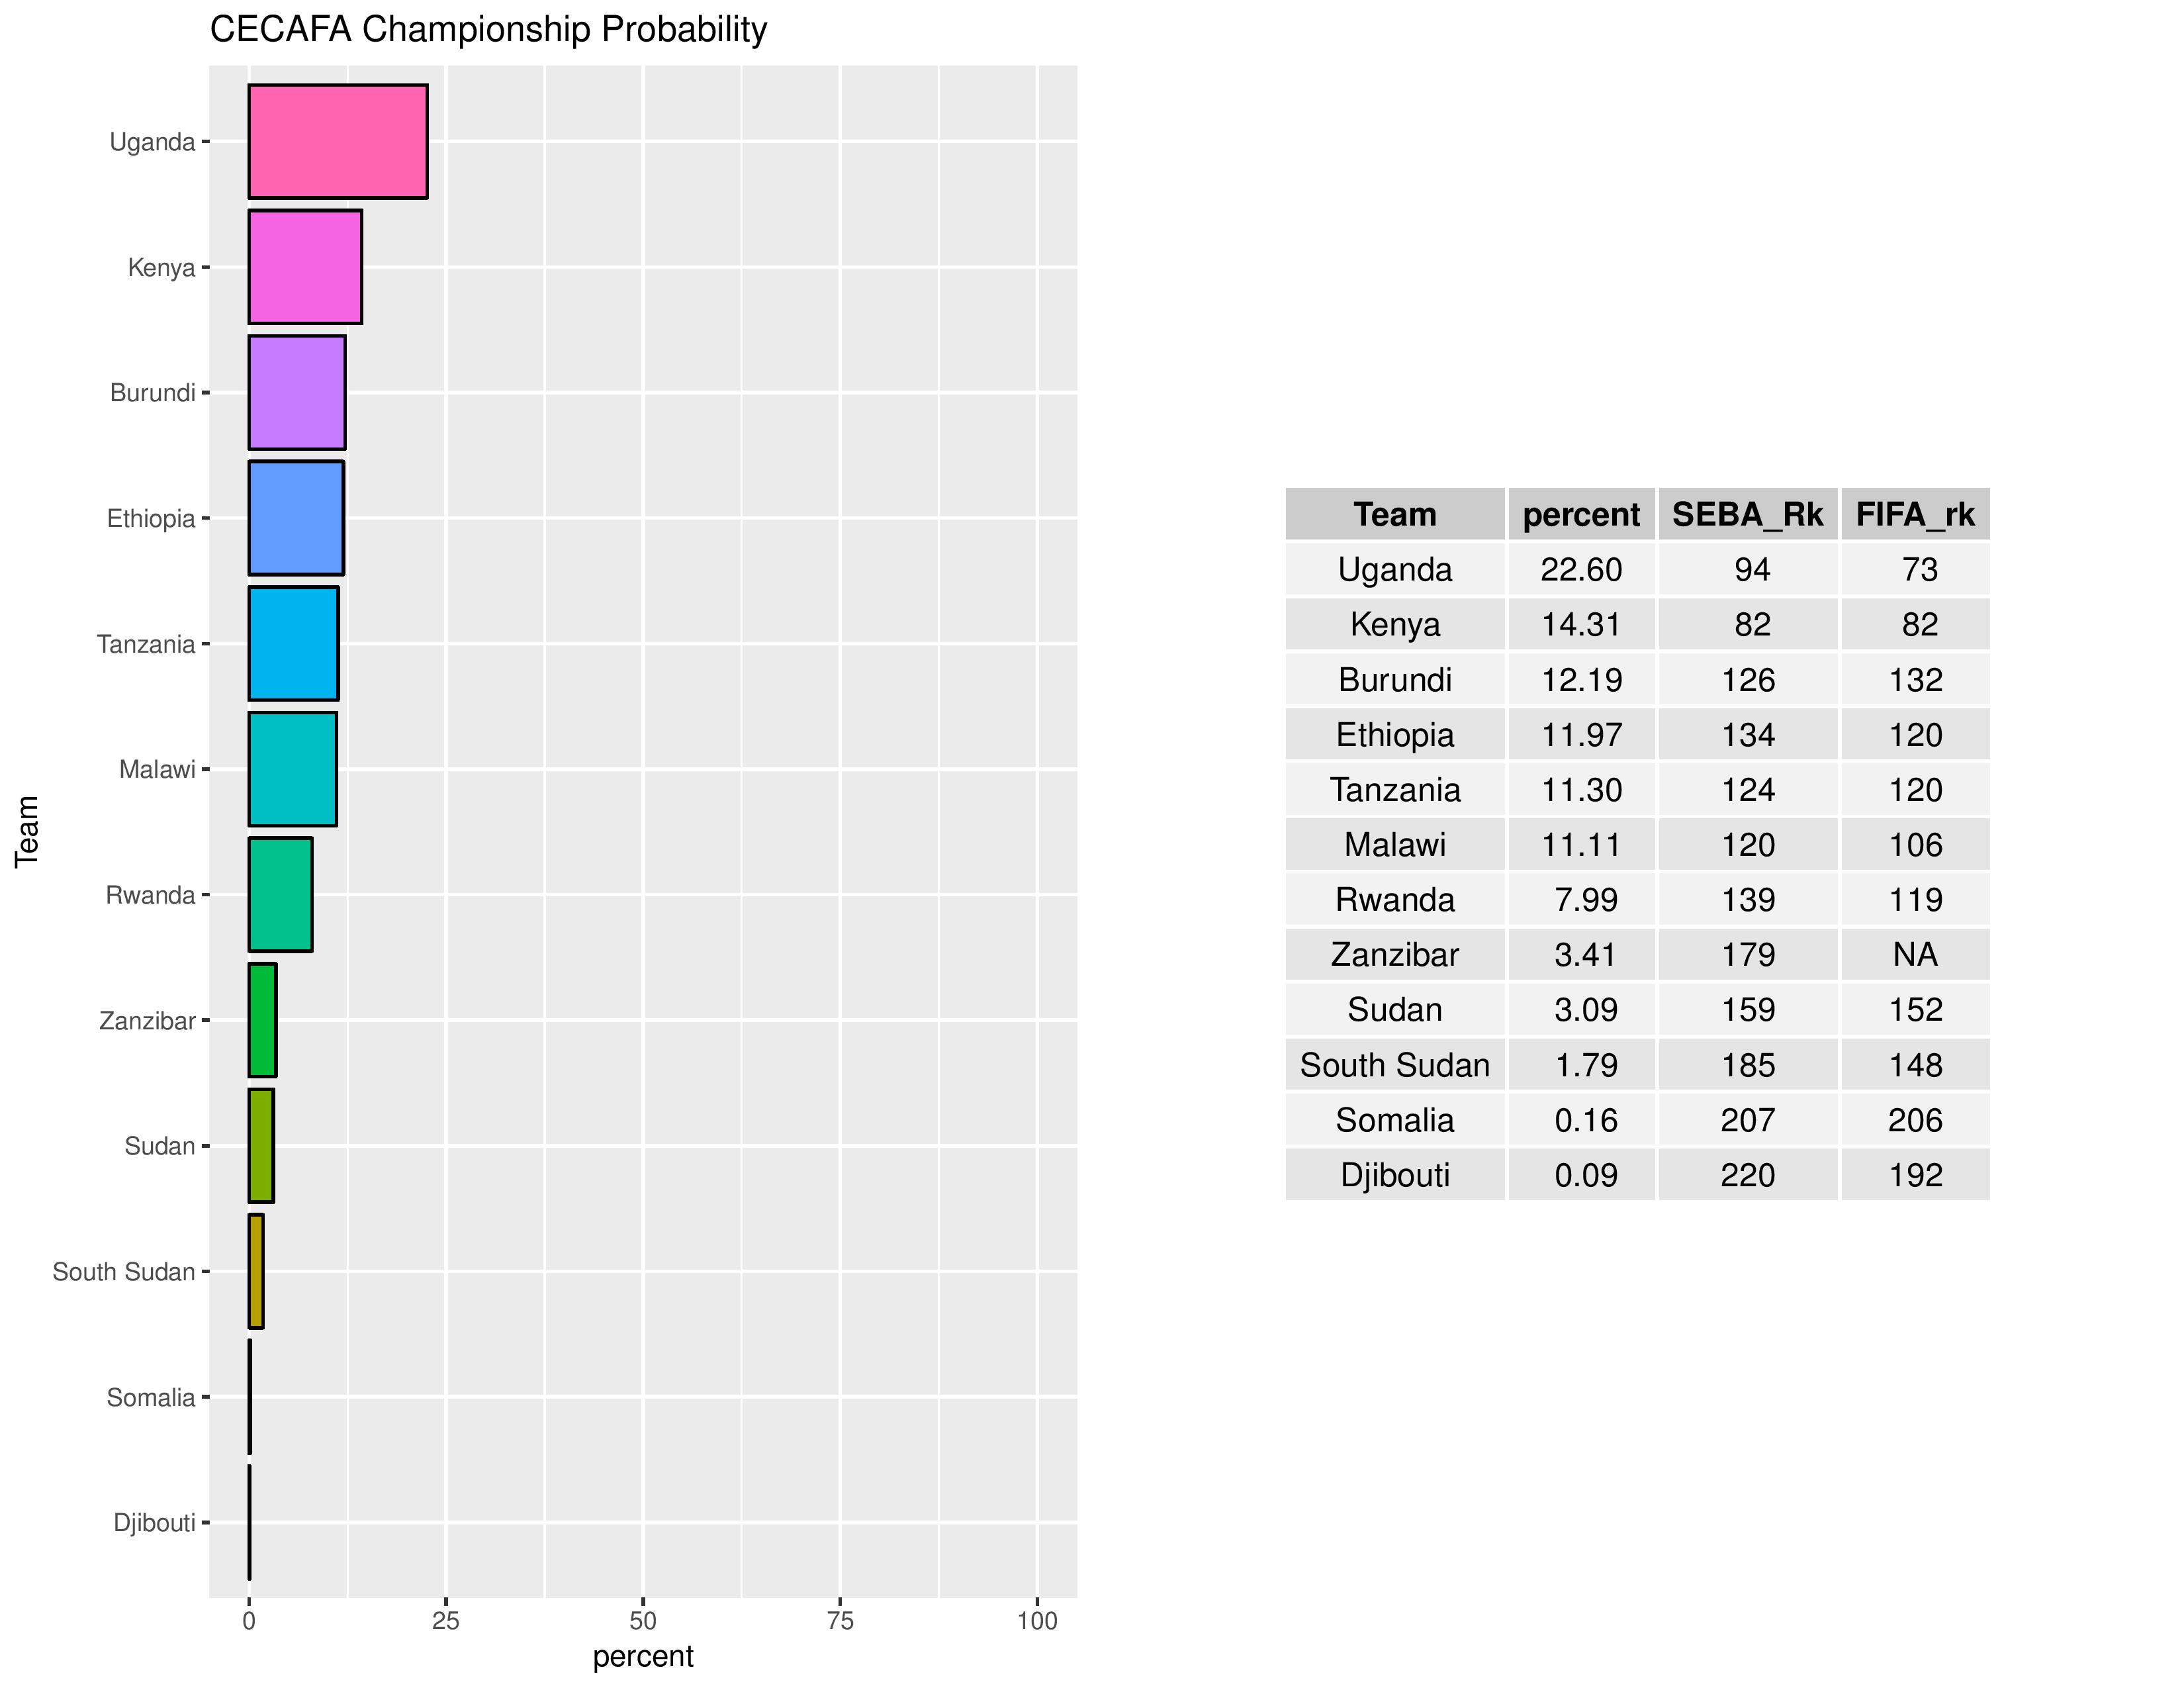
Other Tournaments
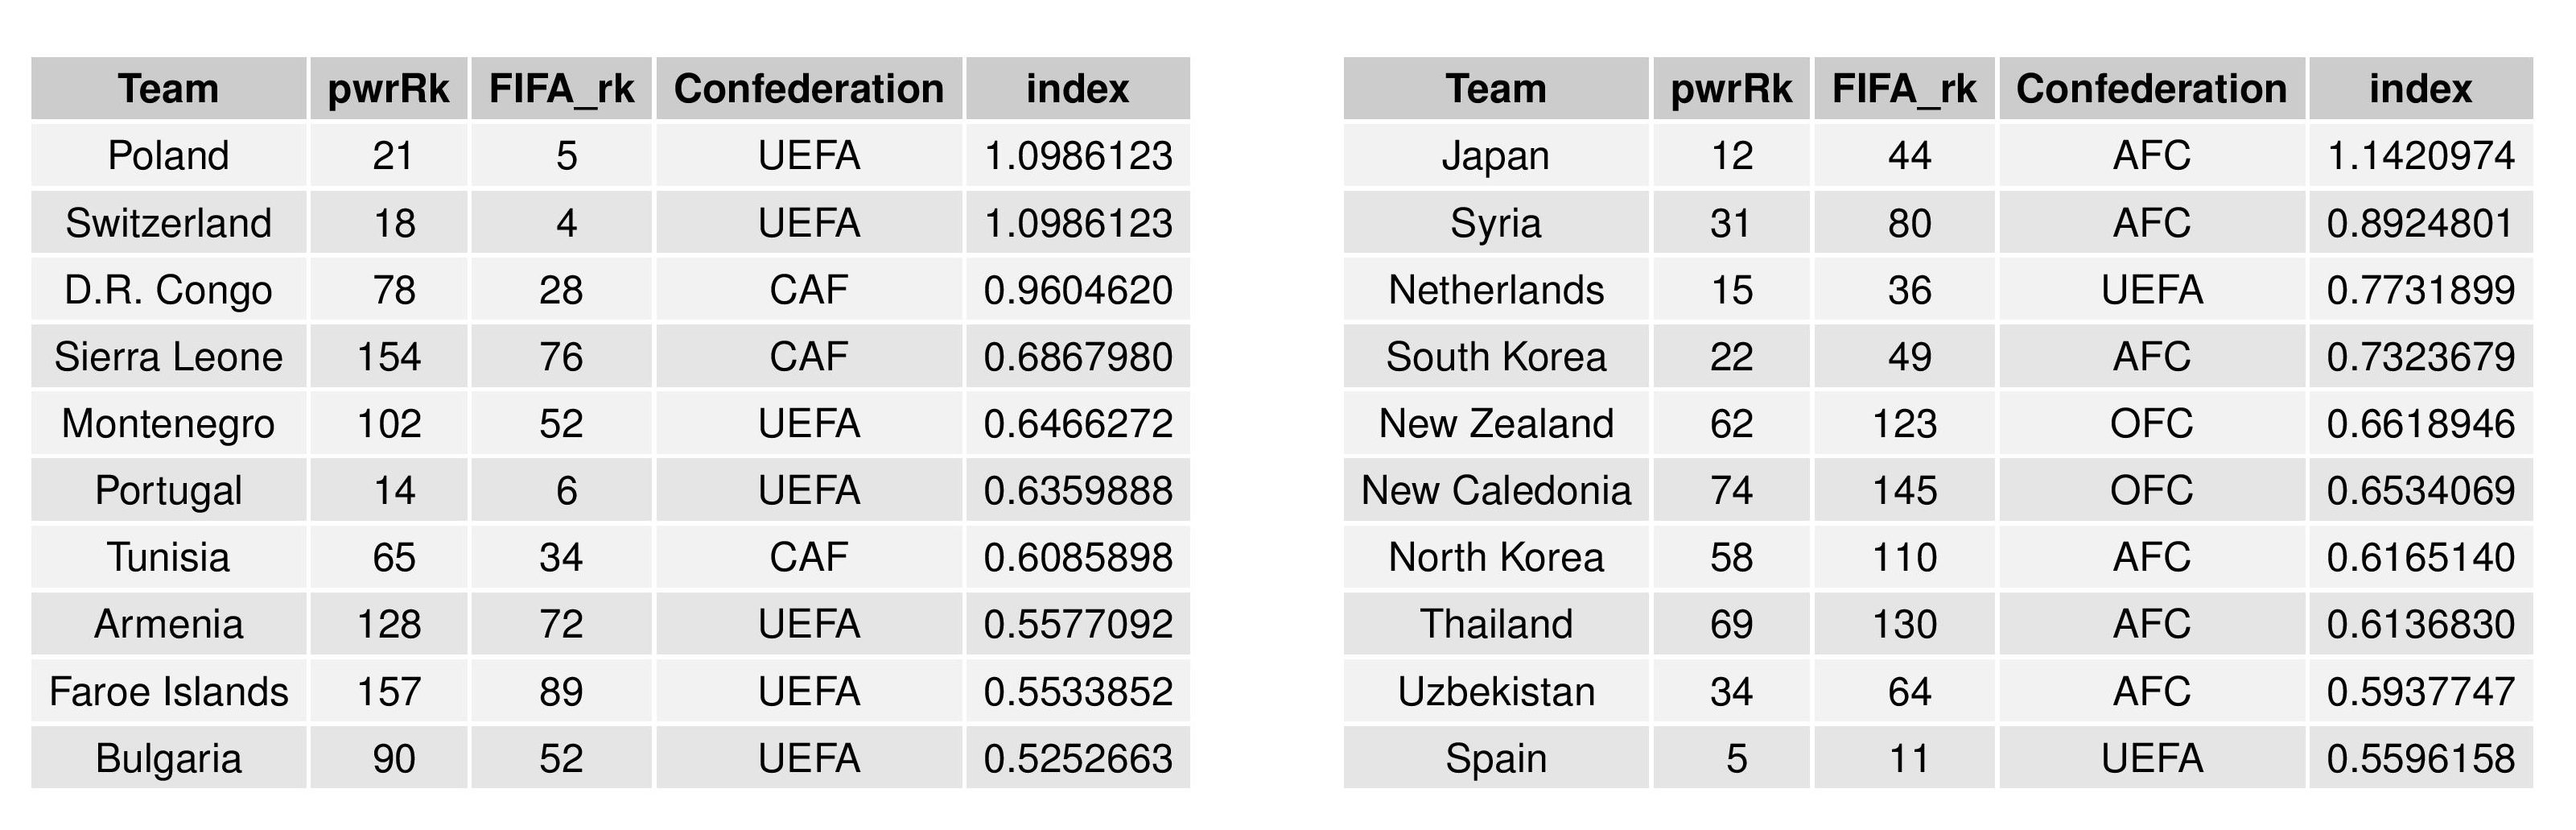
FIFA Rankings Comparison
For a discussion on how the FIFA rankings system differs from SEBA’s, check out the article from 3/28/2017.
The following shows, according to SEBA, the top-10 overrated teams to the left and the top-10 underrated teams to the right.
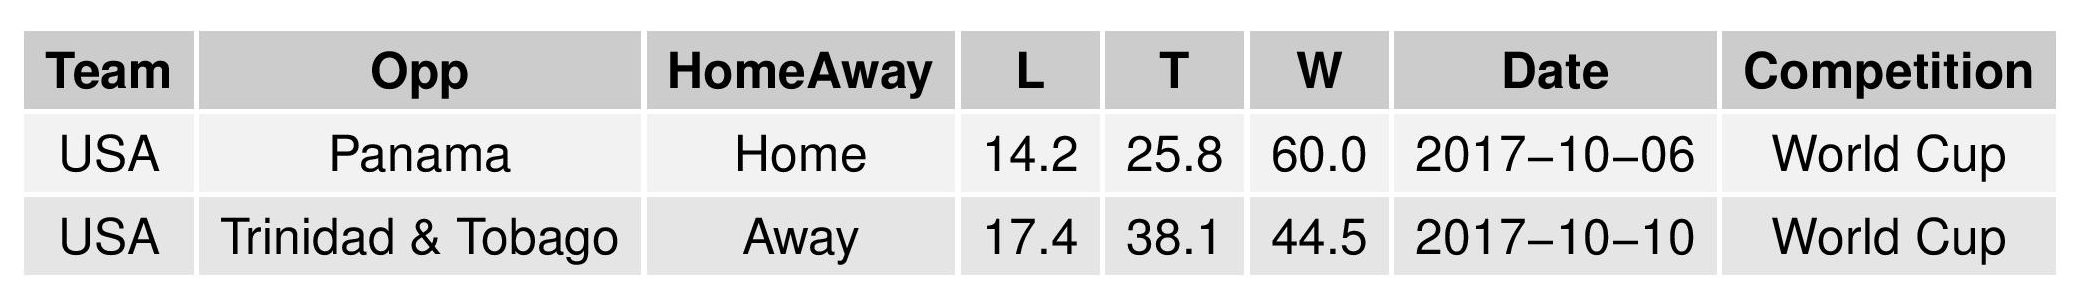
Scheduled USA Matches
Finally, the following shows the probabilities of results for upcoming USA matches.

Comments