Welcome to the International version of the Statistical Extrapolation Bayesian Analyzer Projection System, which is, of course, a tortured gathering of words used to create the SEBA Projection System (which is emitting a sad, Colorado odor at the moment).
The system consists of a model projecting the probabilities of game results and then a barrage of simulations which account for the remaining luck. So the probabilities you see below show, essentially, what the odds are of an outcome if the team continues to play like it has been.
Below are the current Women’s Olympic tournament forecasts through August 7.
Power Rankings
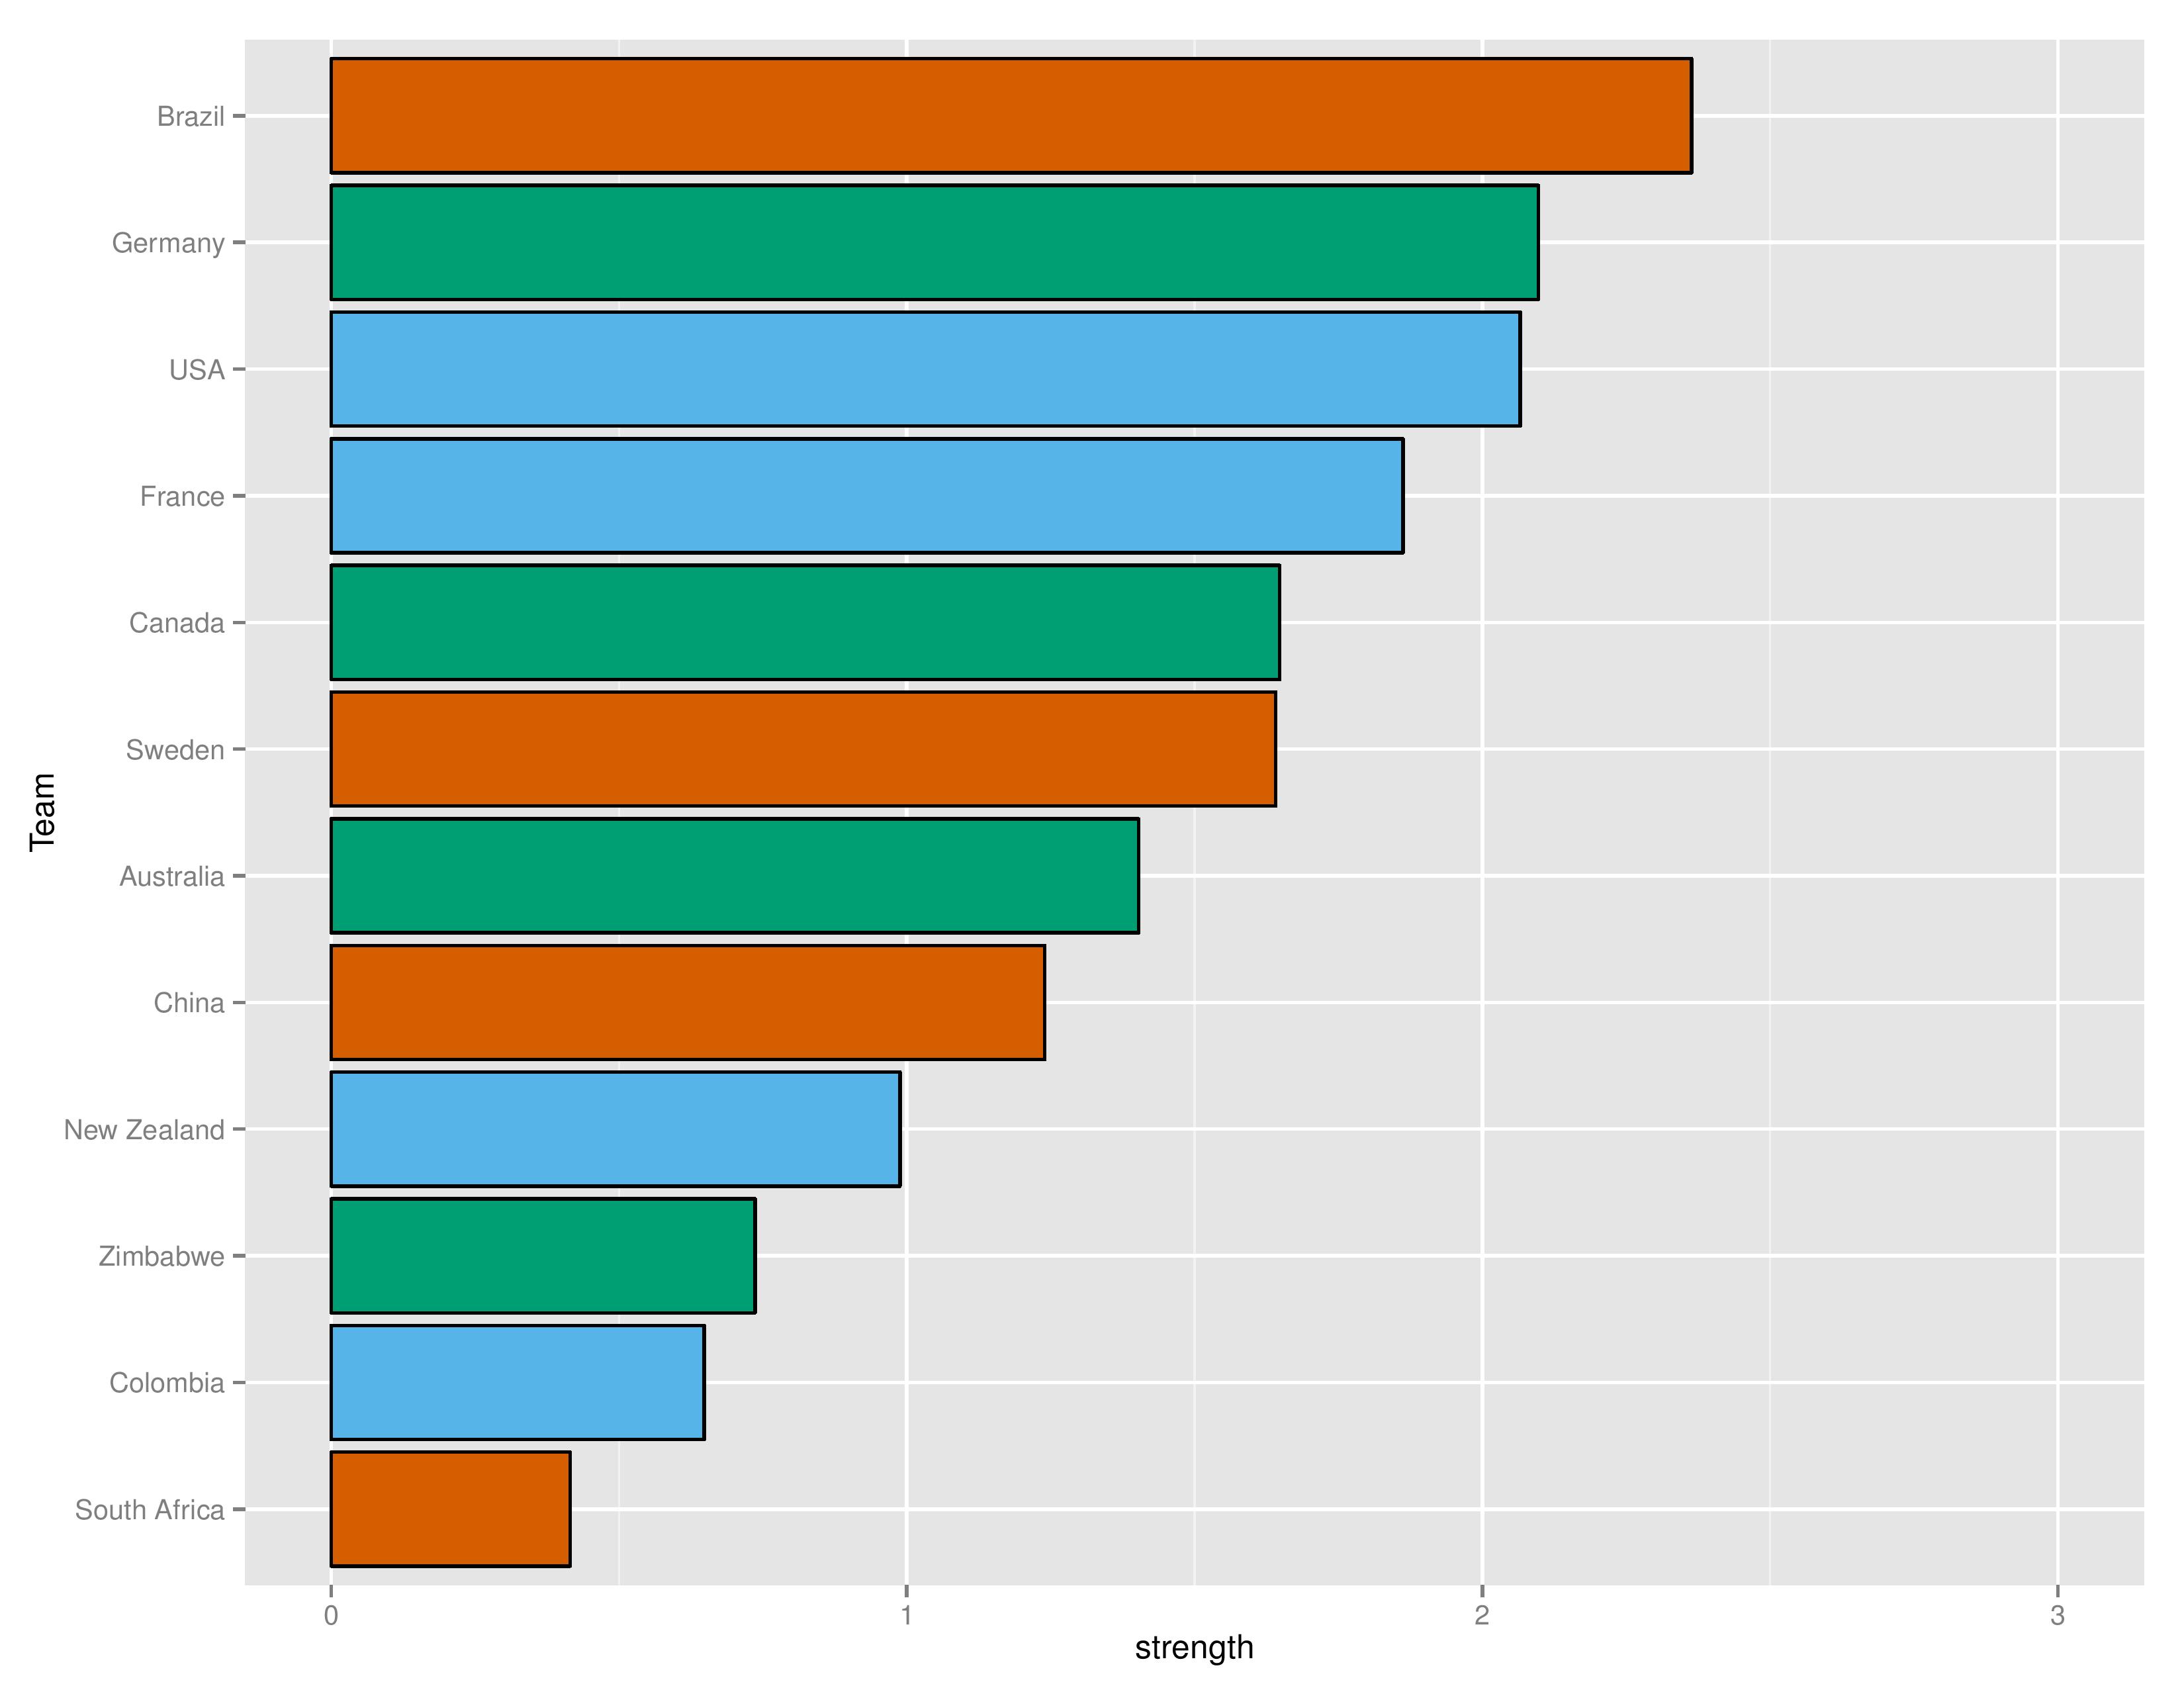
The “Power Rankings” we concoct are the actual “strength” of the team according to competitive expectations. The value represented on the X-Axis is the average amount of points we expect that team to receive if they played every other team in the tournament.
The colors represent the groups.
Keep in mind that Brazil’s home field advantage is included below:
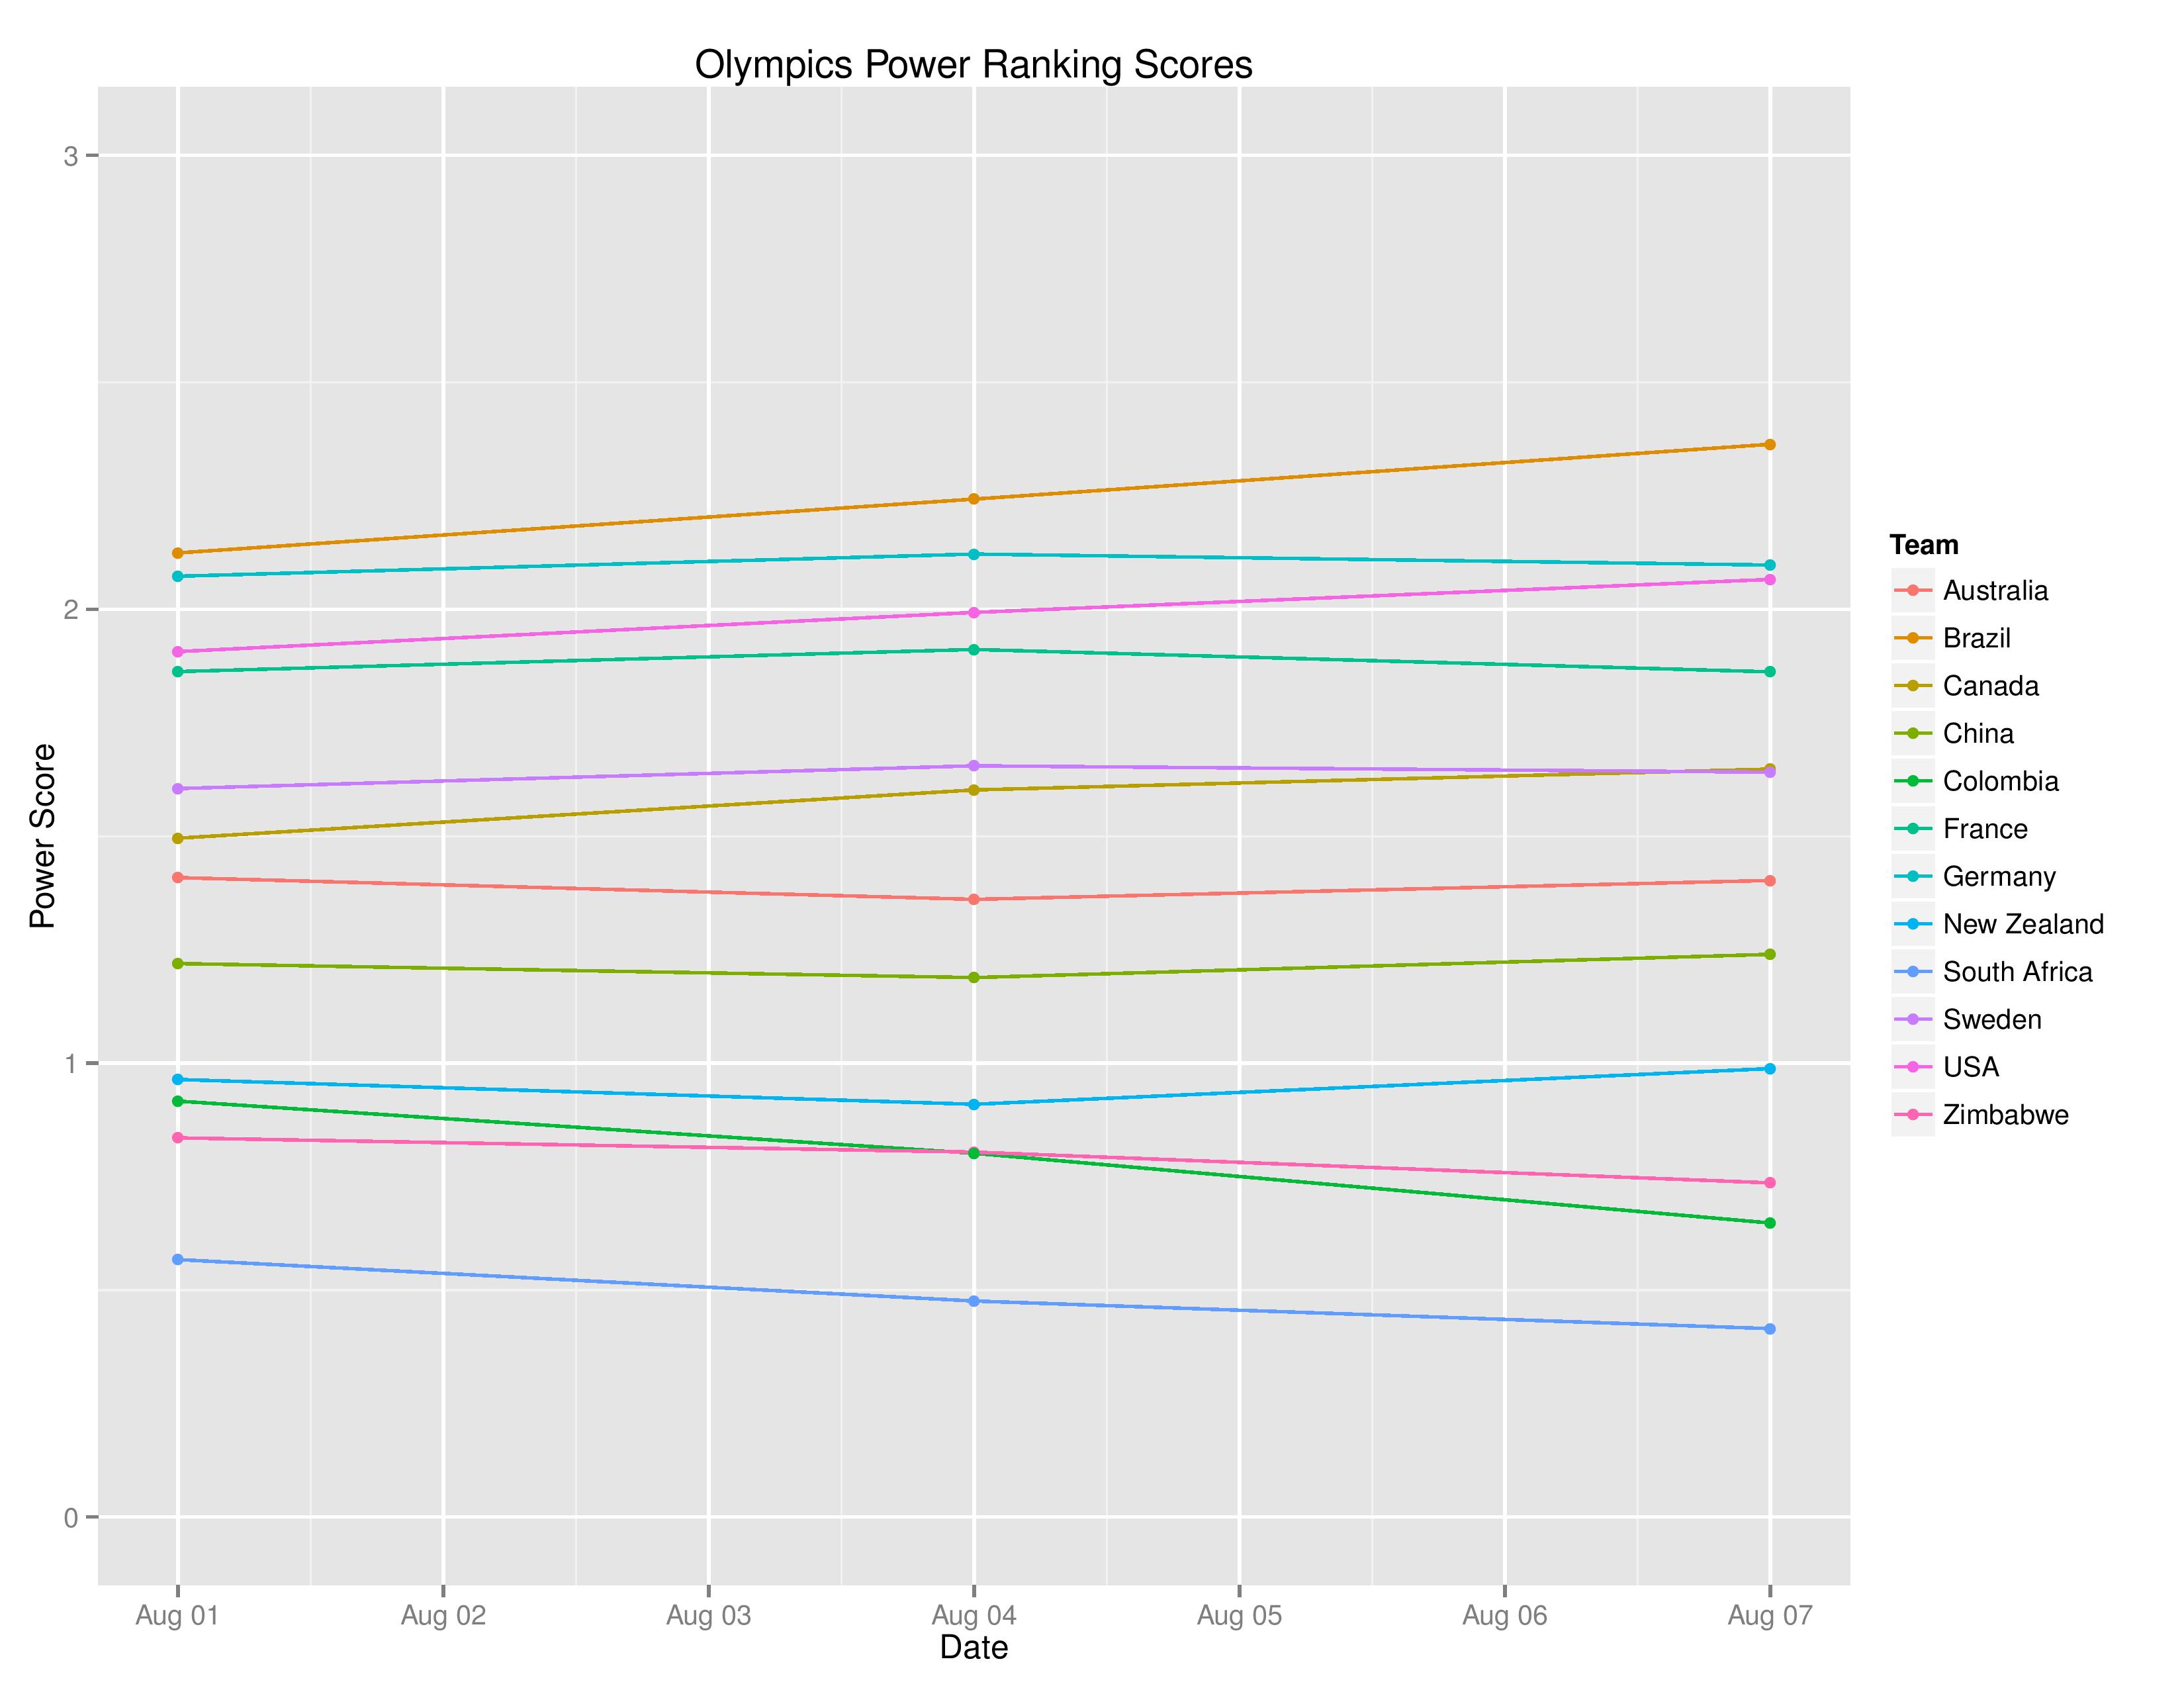
The only teams that changed ranks are Canada moving atop of Sweden. On the raw scores (which are used for the rankings), however, USA has closed the gap on Germany with their win over France and Germany’s draw with Australia.

Probability Outcomes
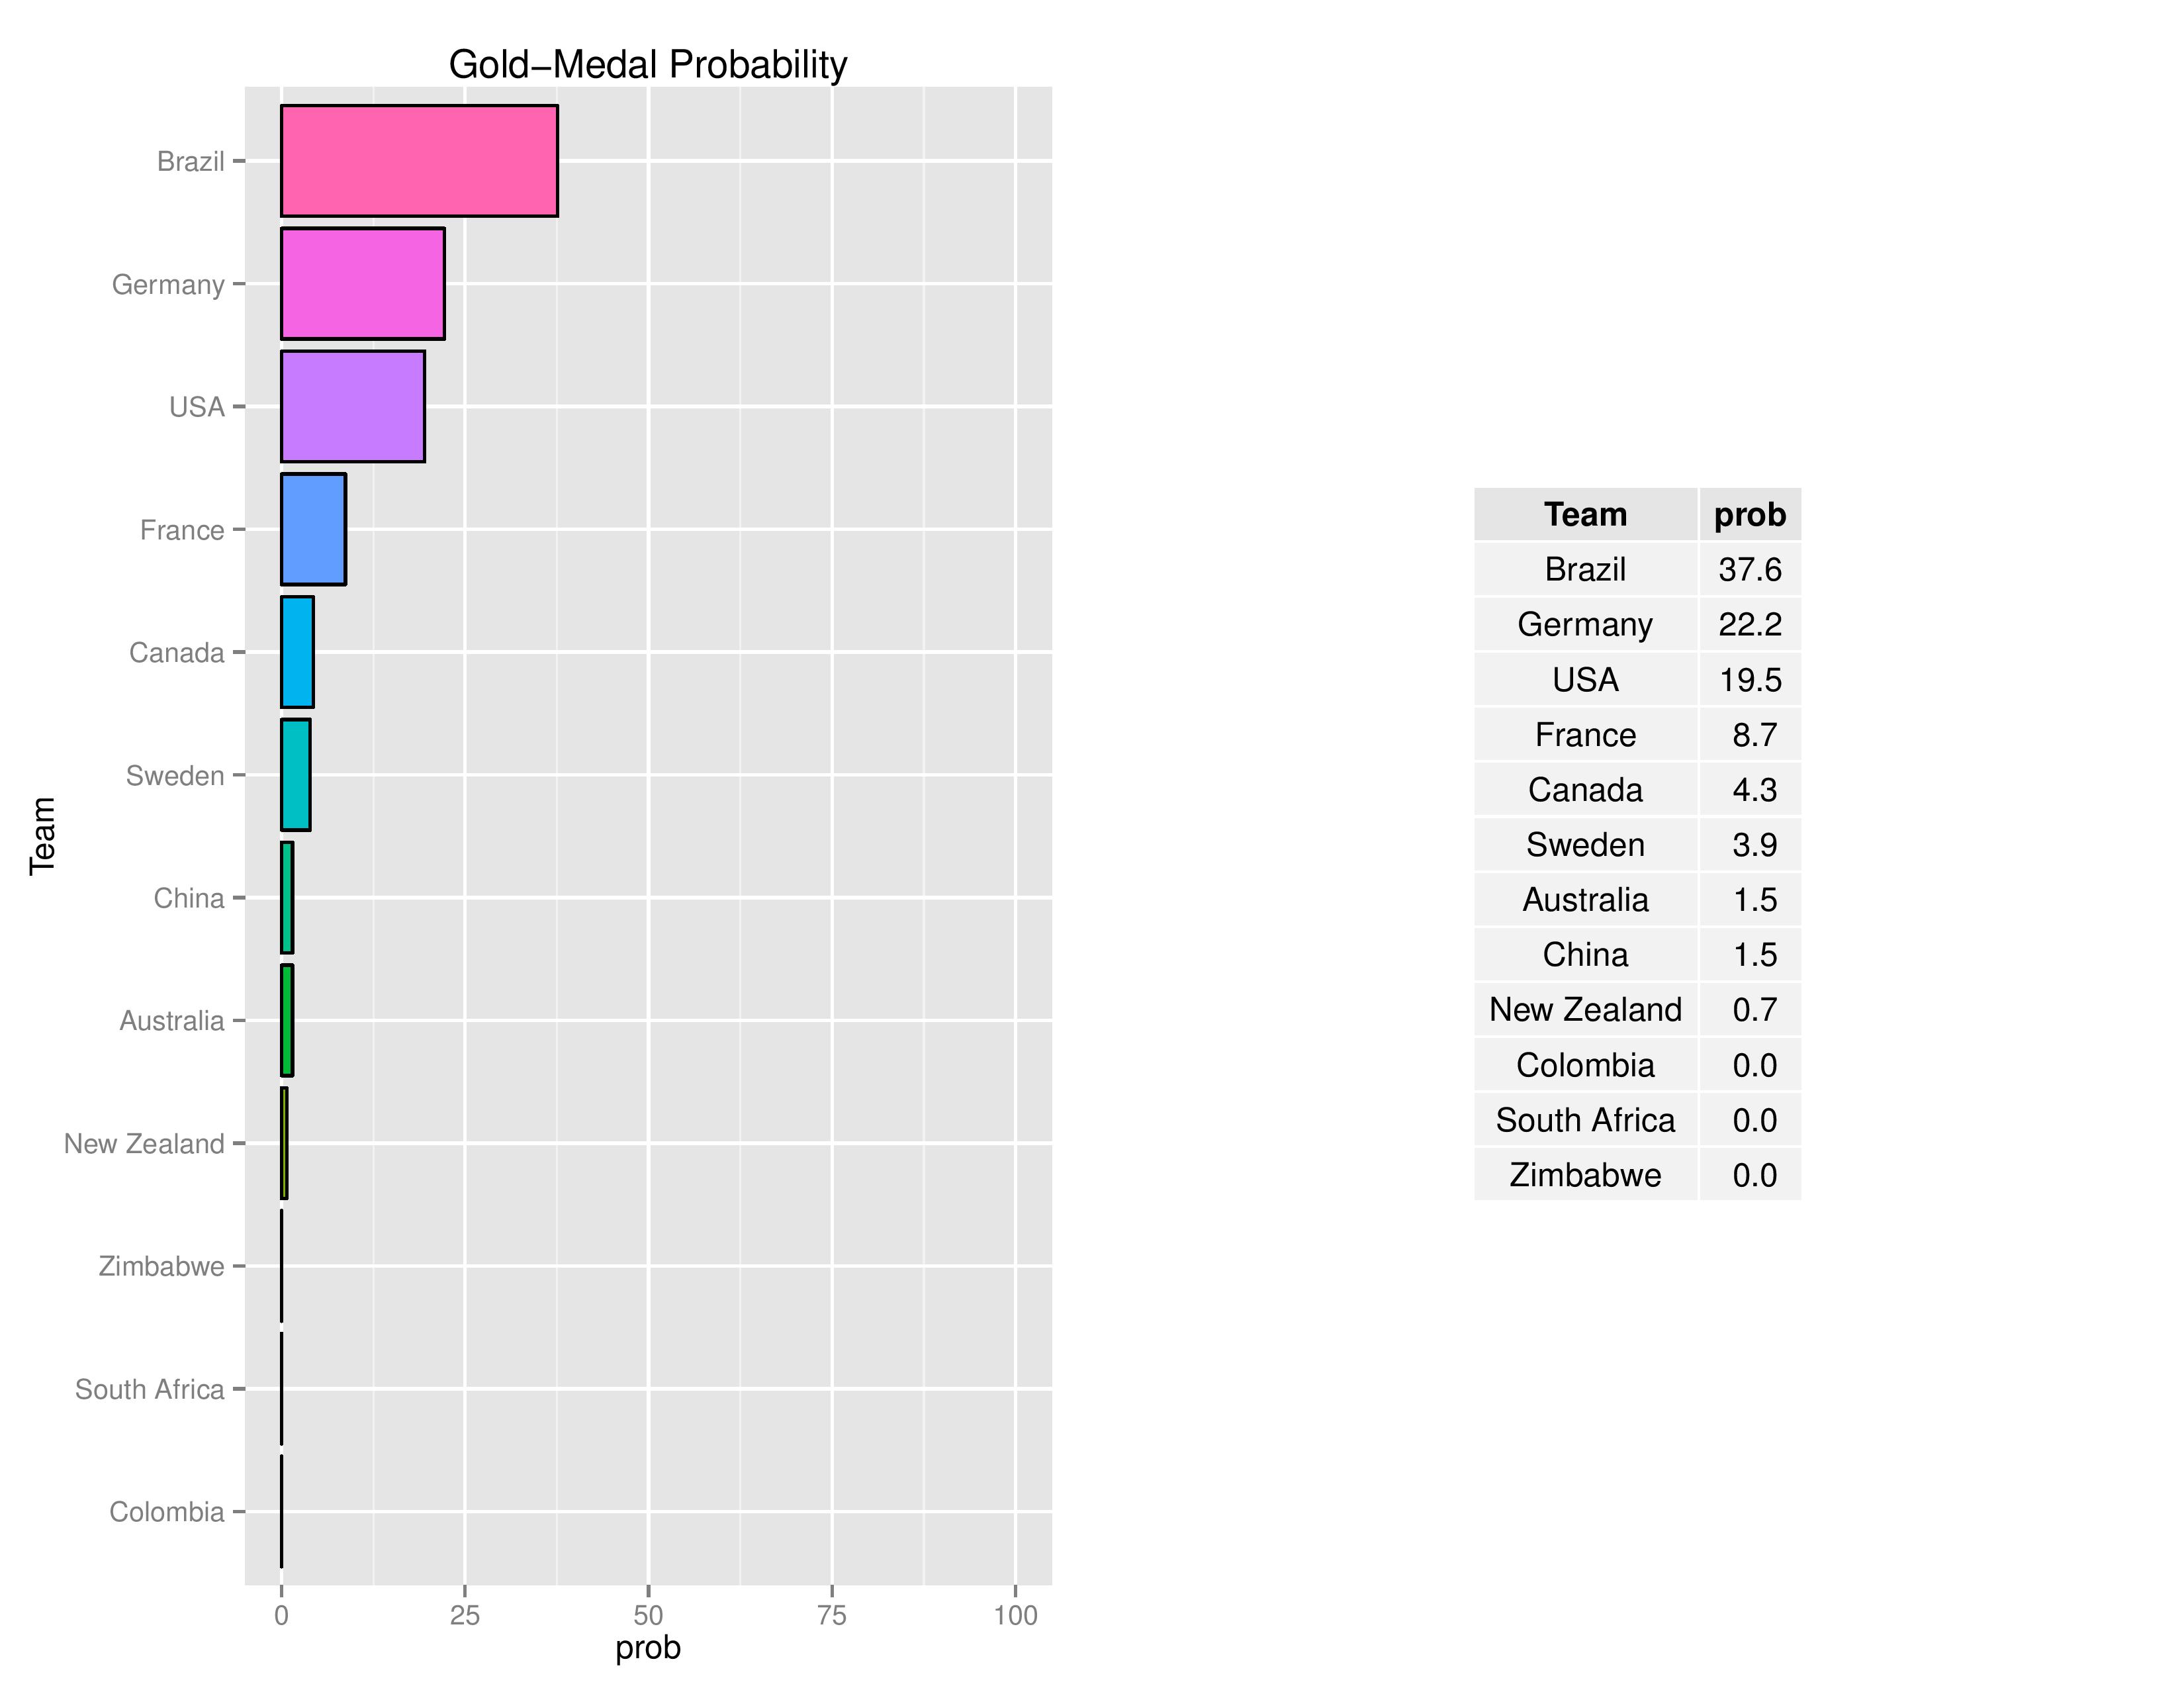
Next demonstrates the probability of winning the Gold Medal for each team.
USA’s chances improved slightly to 19.5% from 18.4% with their win over France.
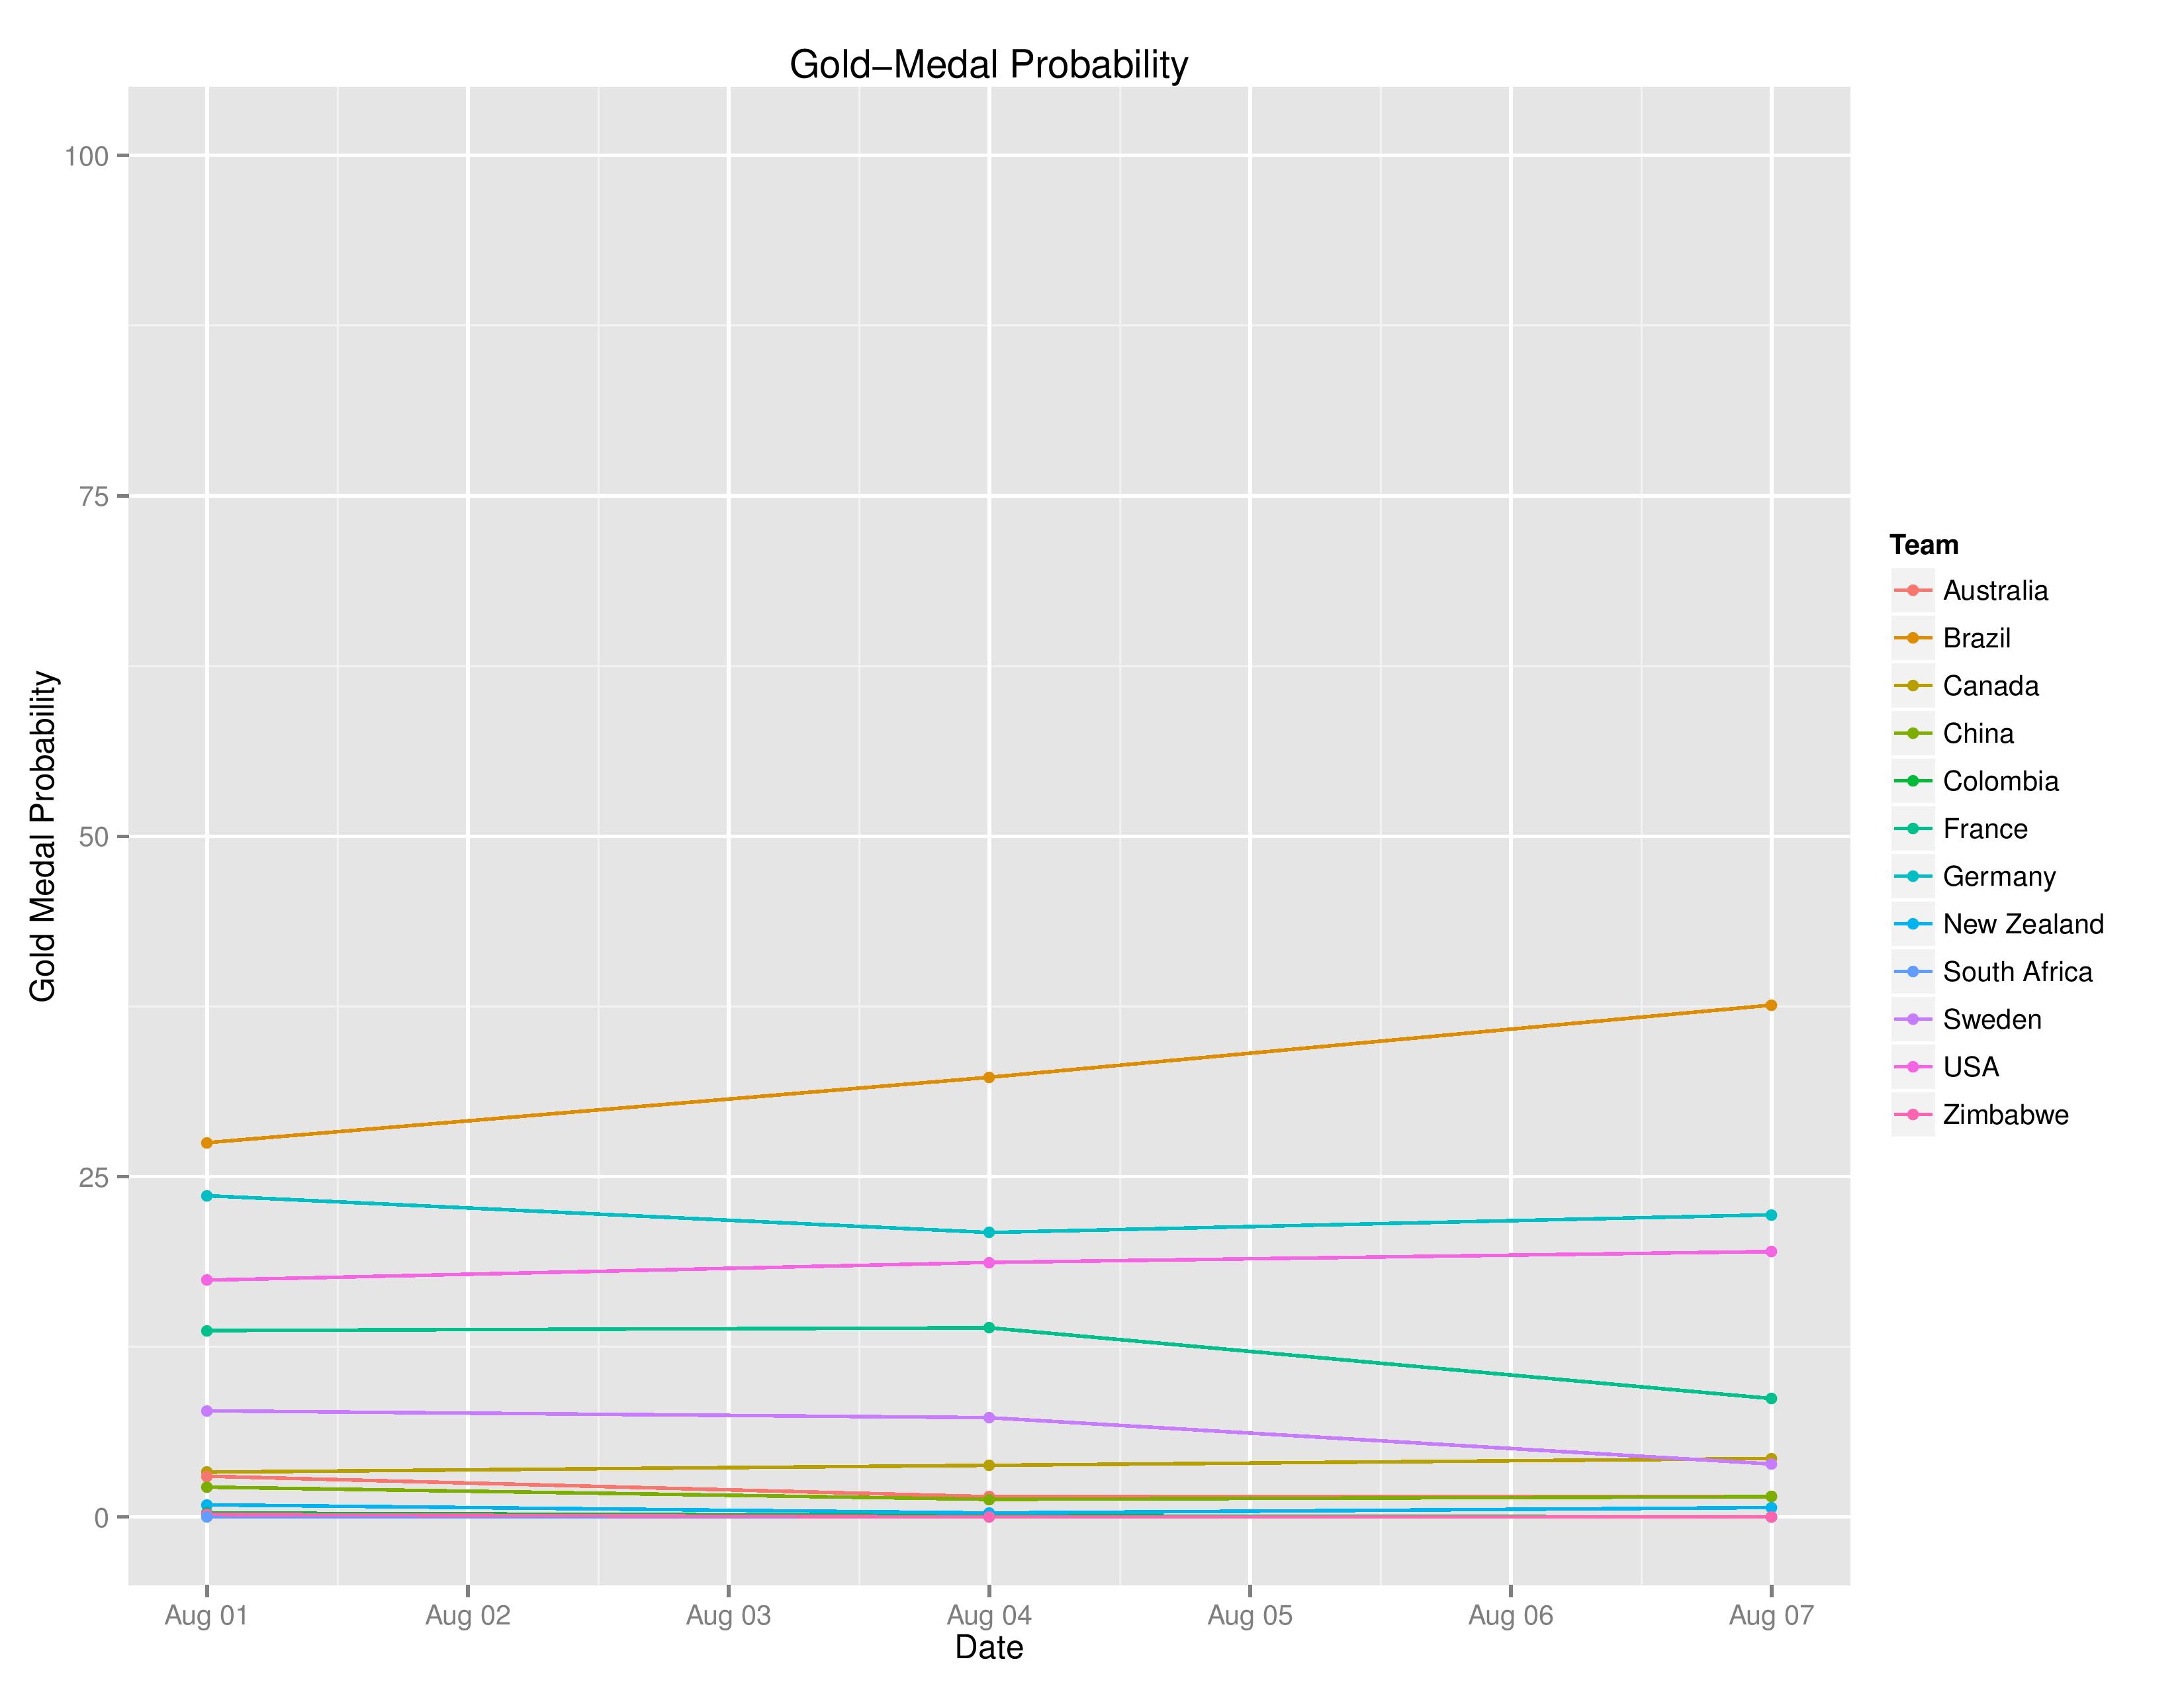
Next we see the Gold Medal probabilities changing as the tournament progresses:
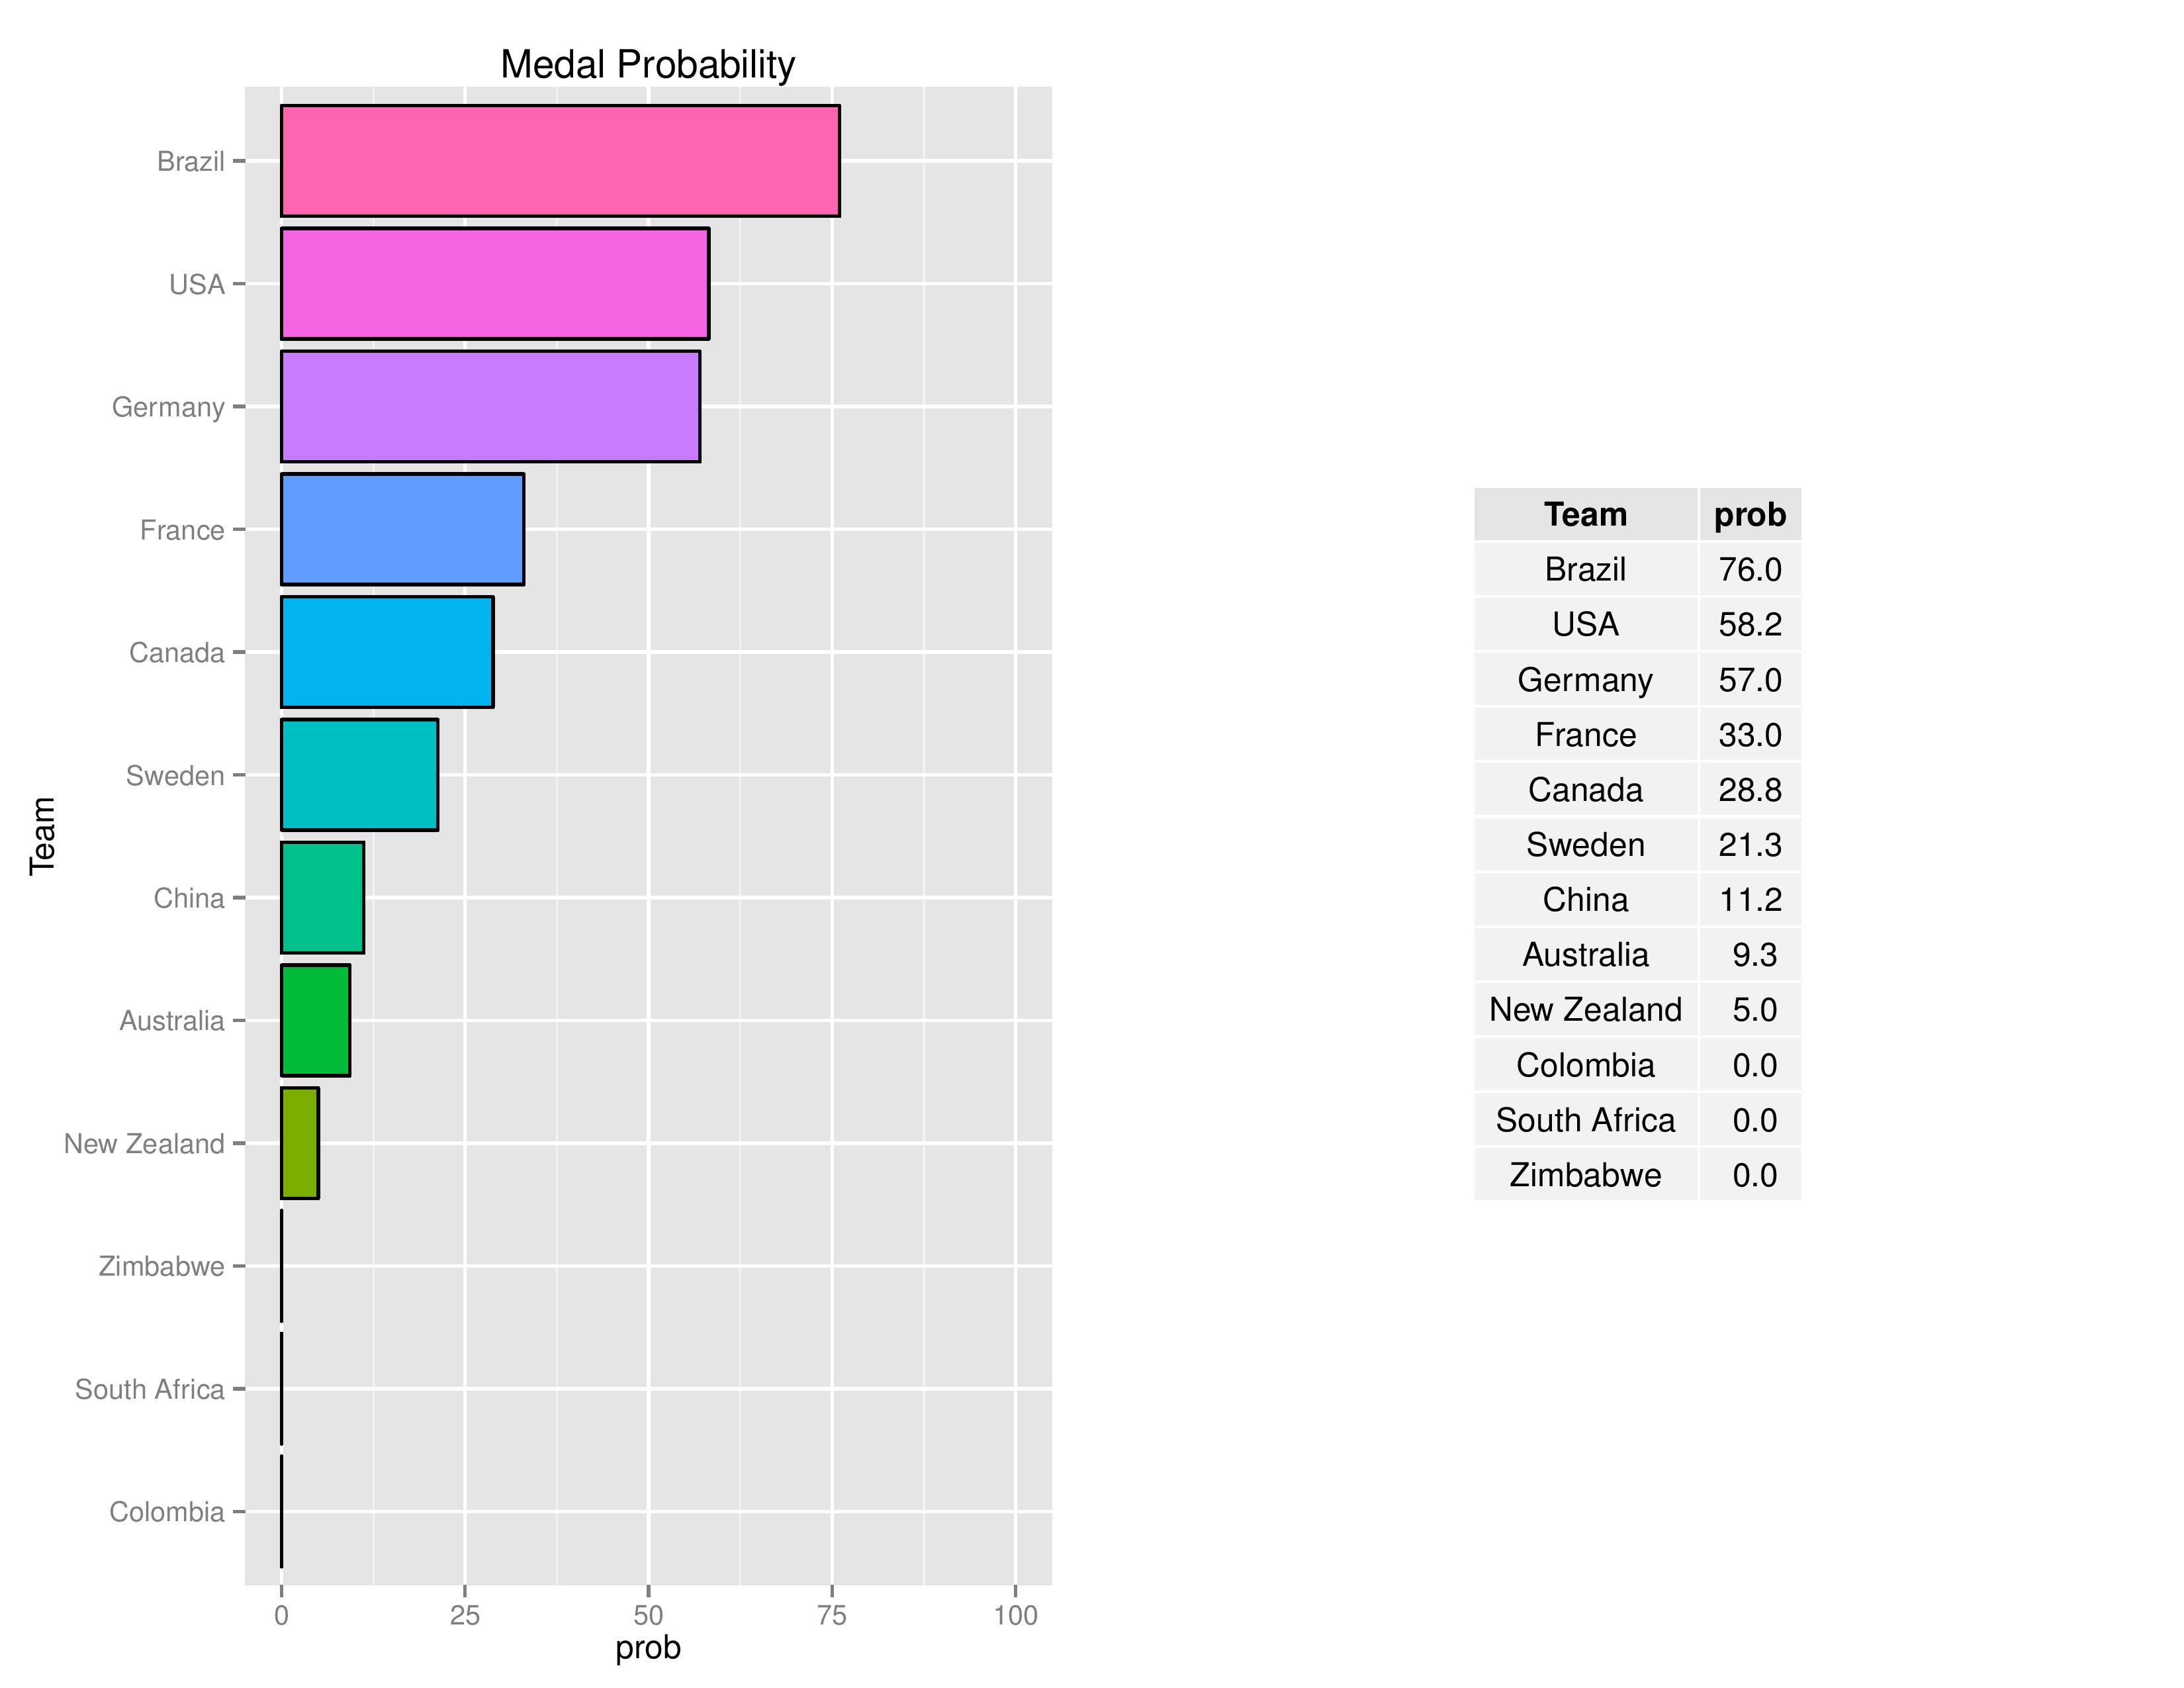
Below is the probability of winning any medal. USA has a 58.2% chance of winning a medal. Although SEBA expects Germany to be better than the USA, Germany has a dangerous matchup in (likely) France in the Quarter-finals before they can compete for a medal.
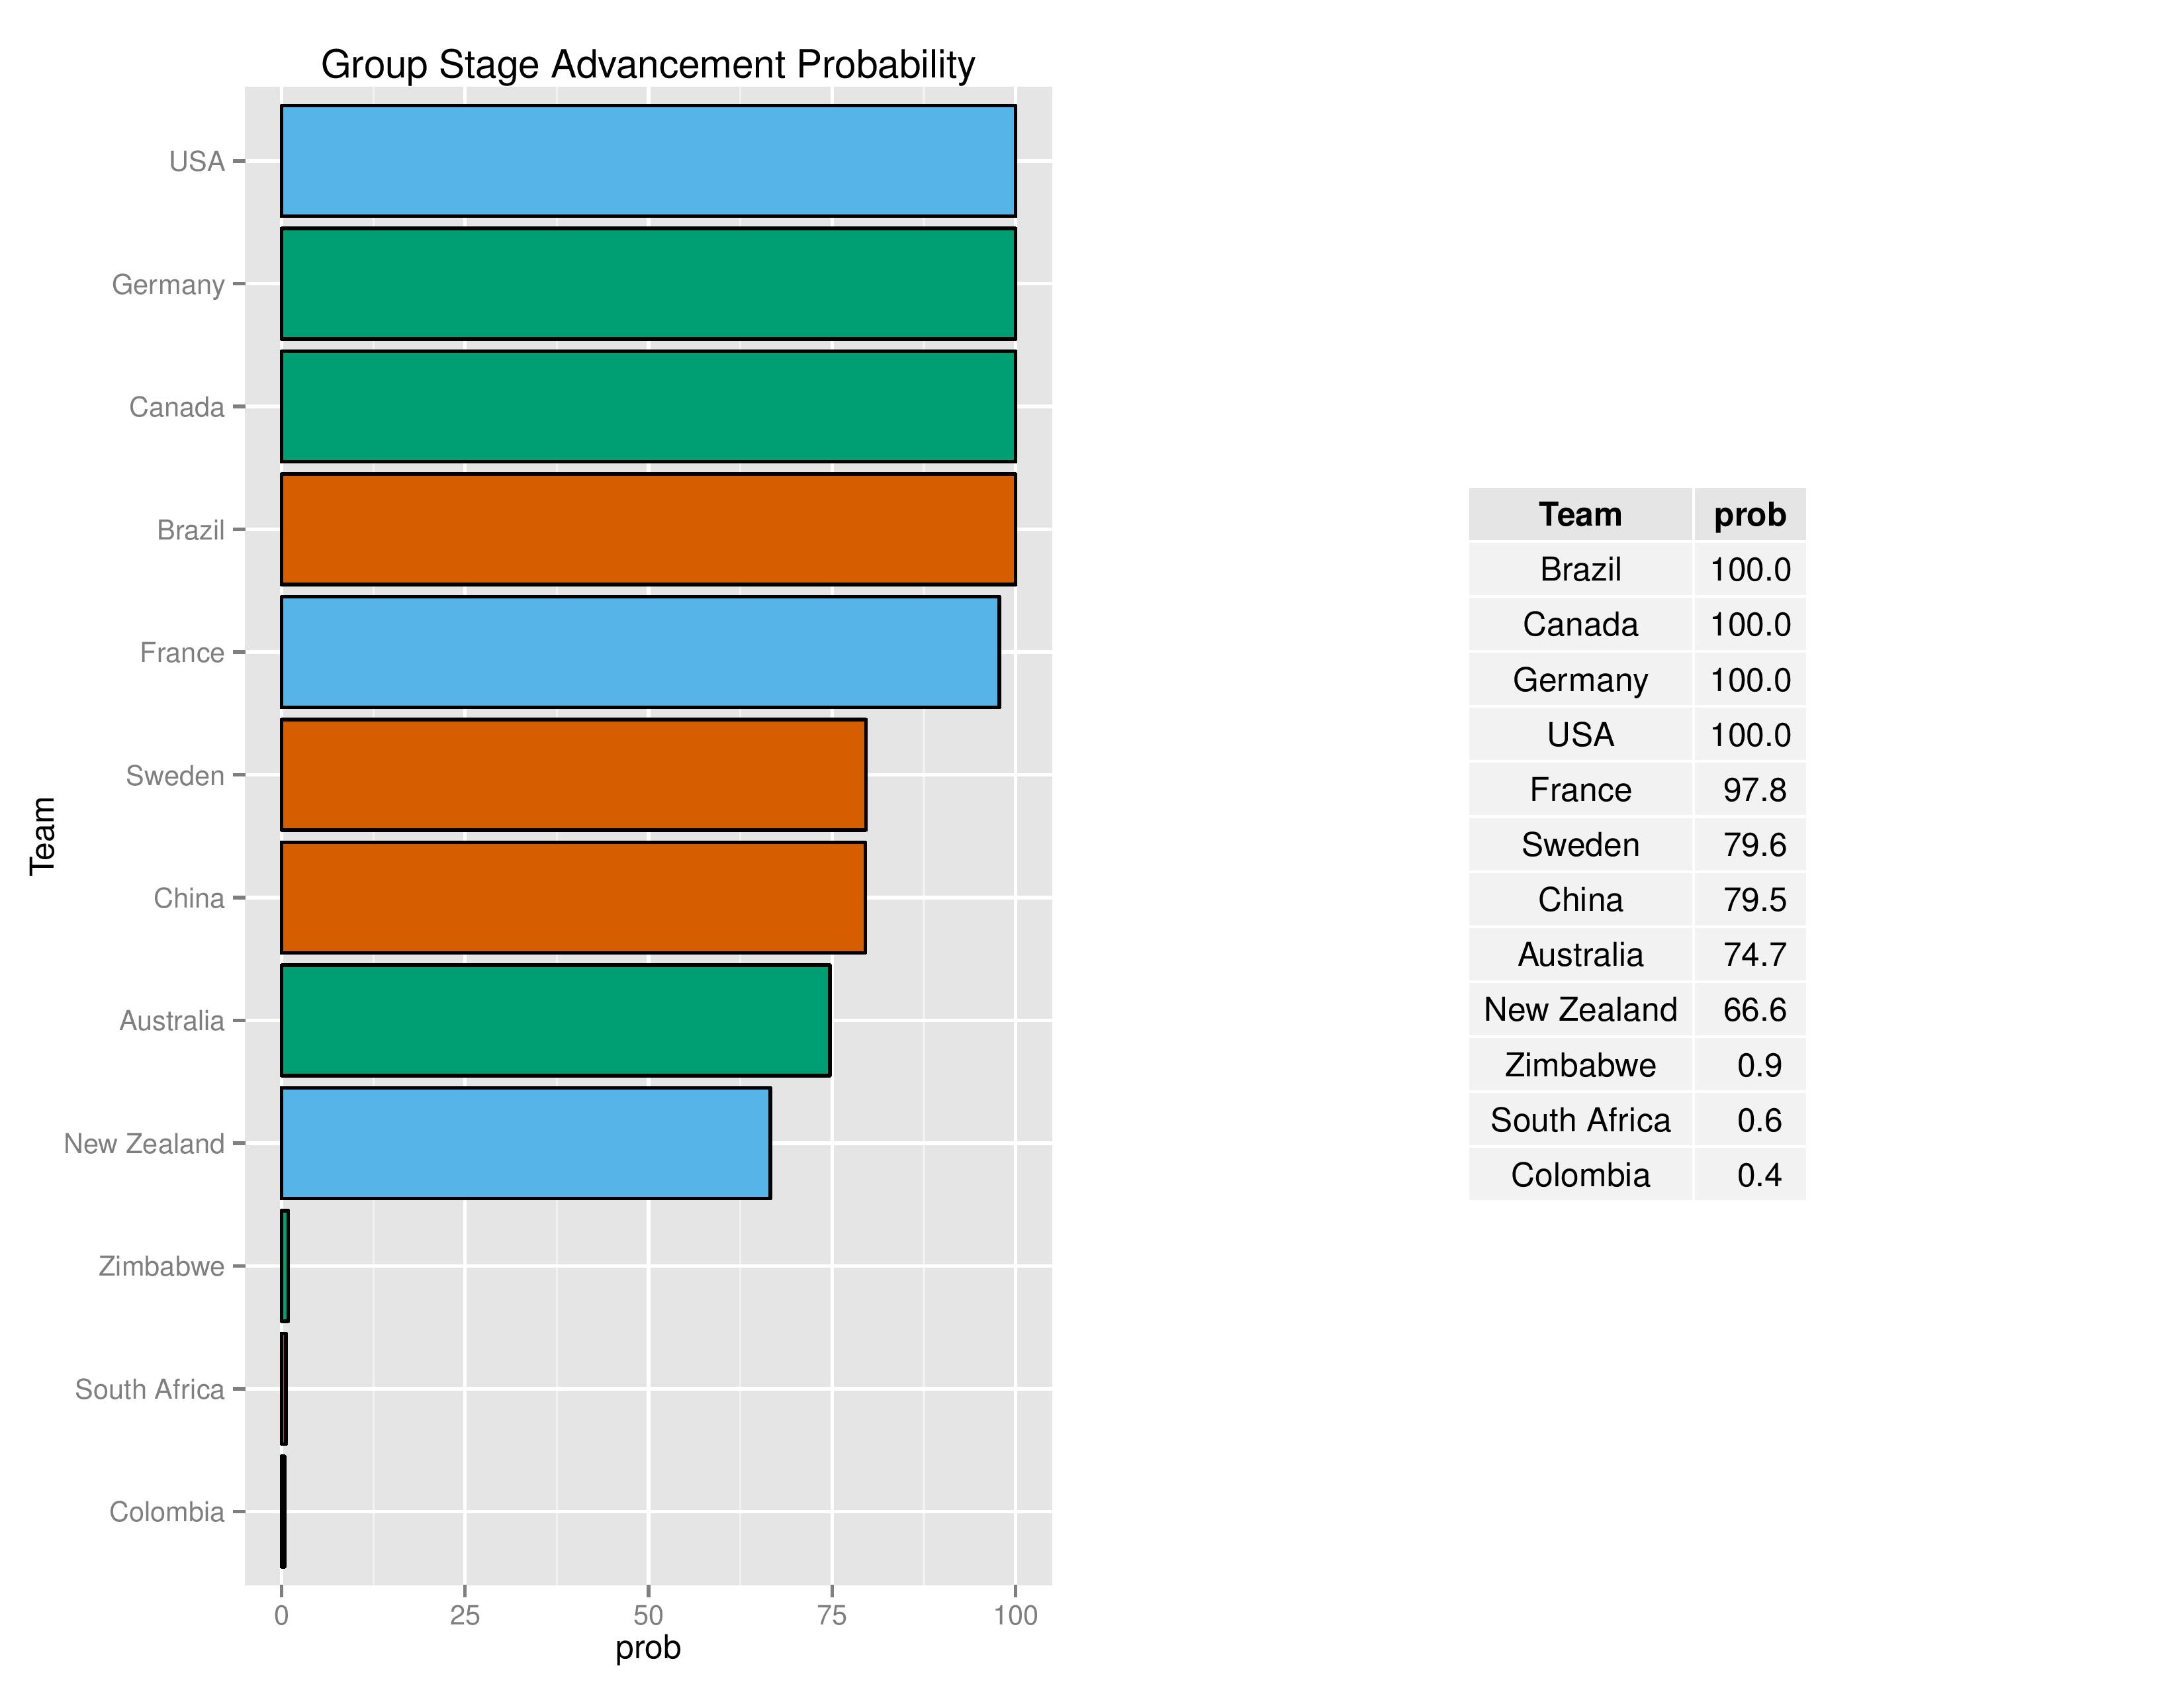
The following is the probabilities for the advancement from the group stage.
USA clinched Group-Stage-Advancement.
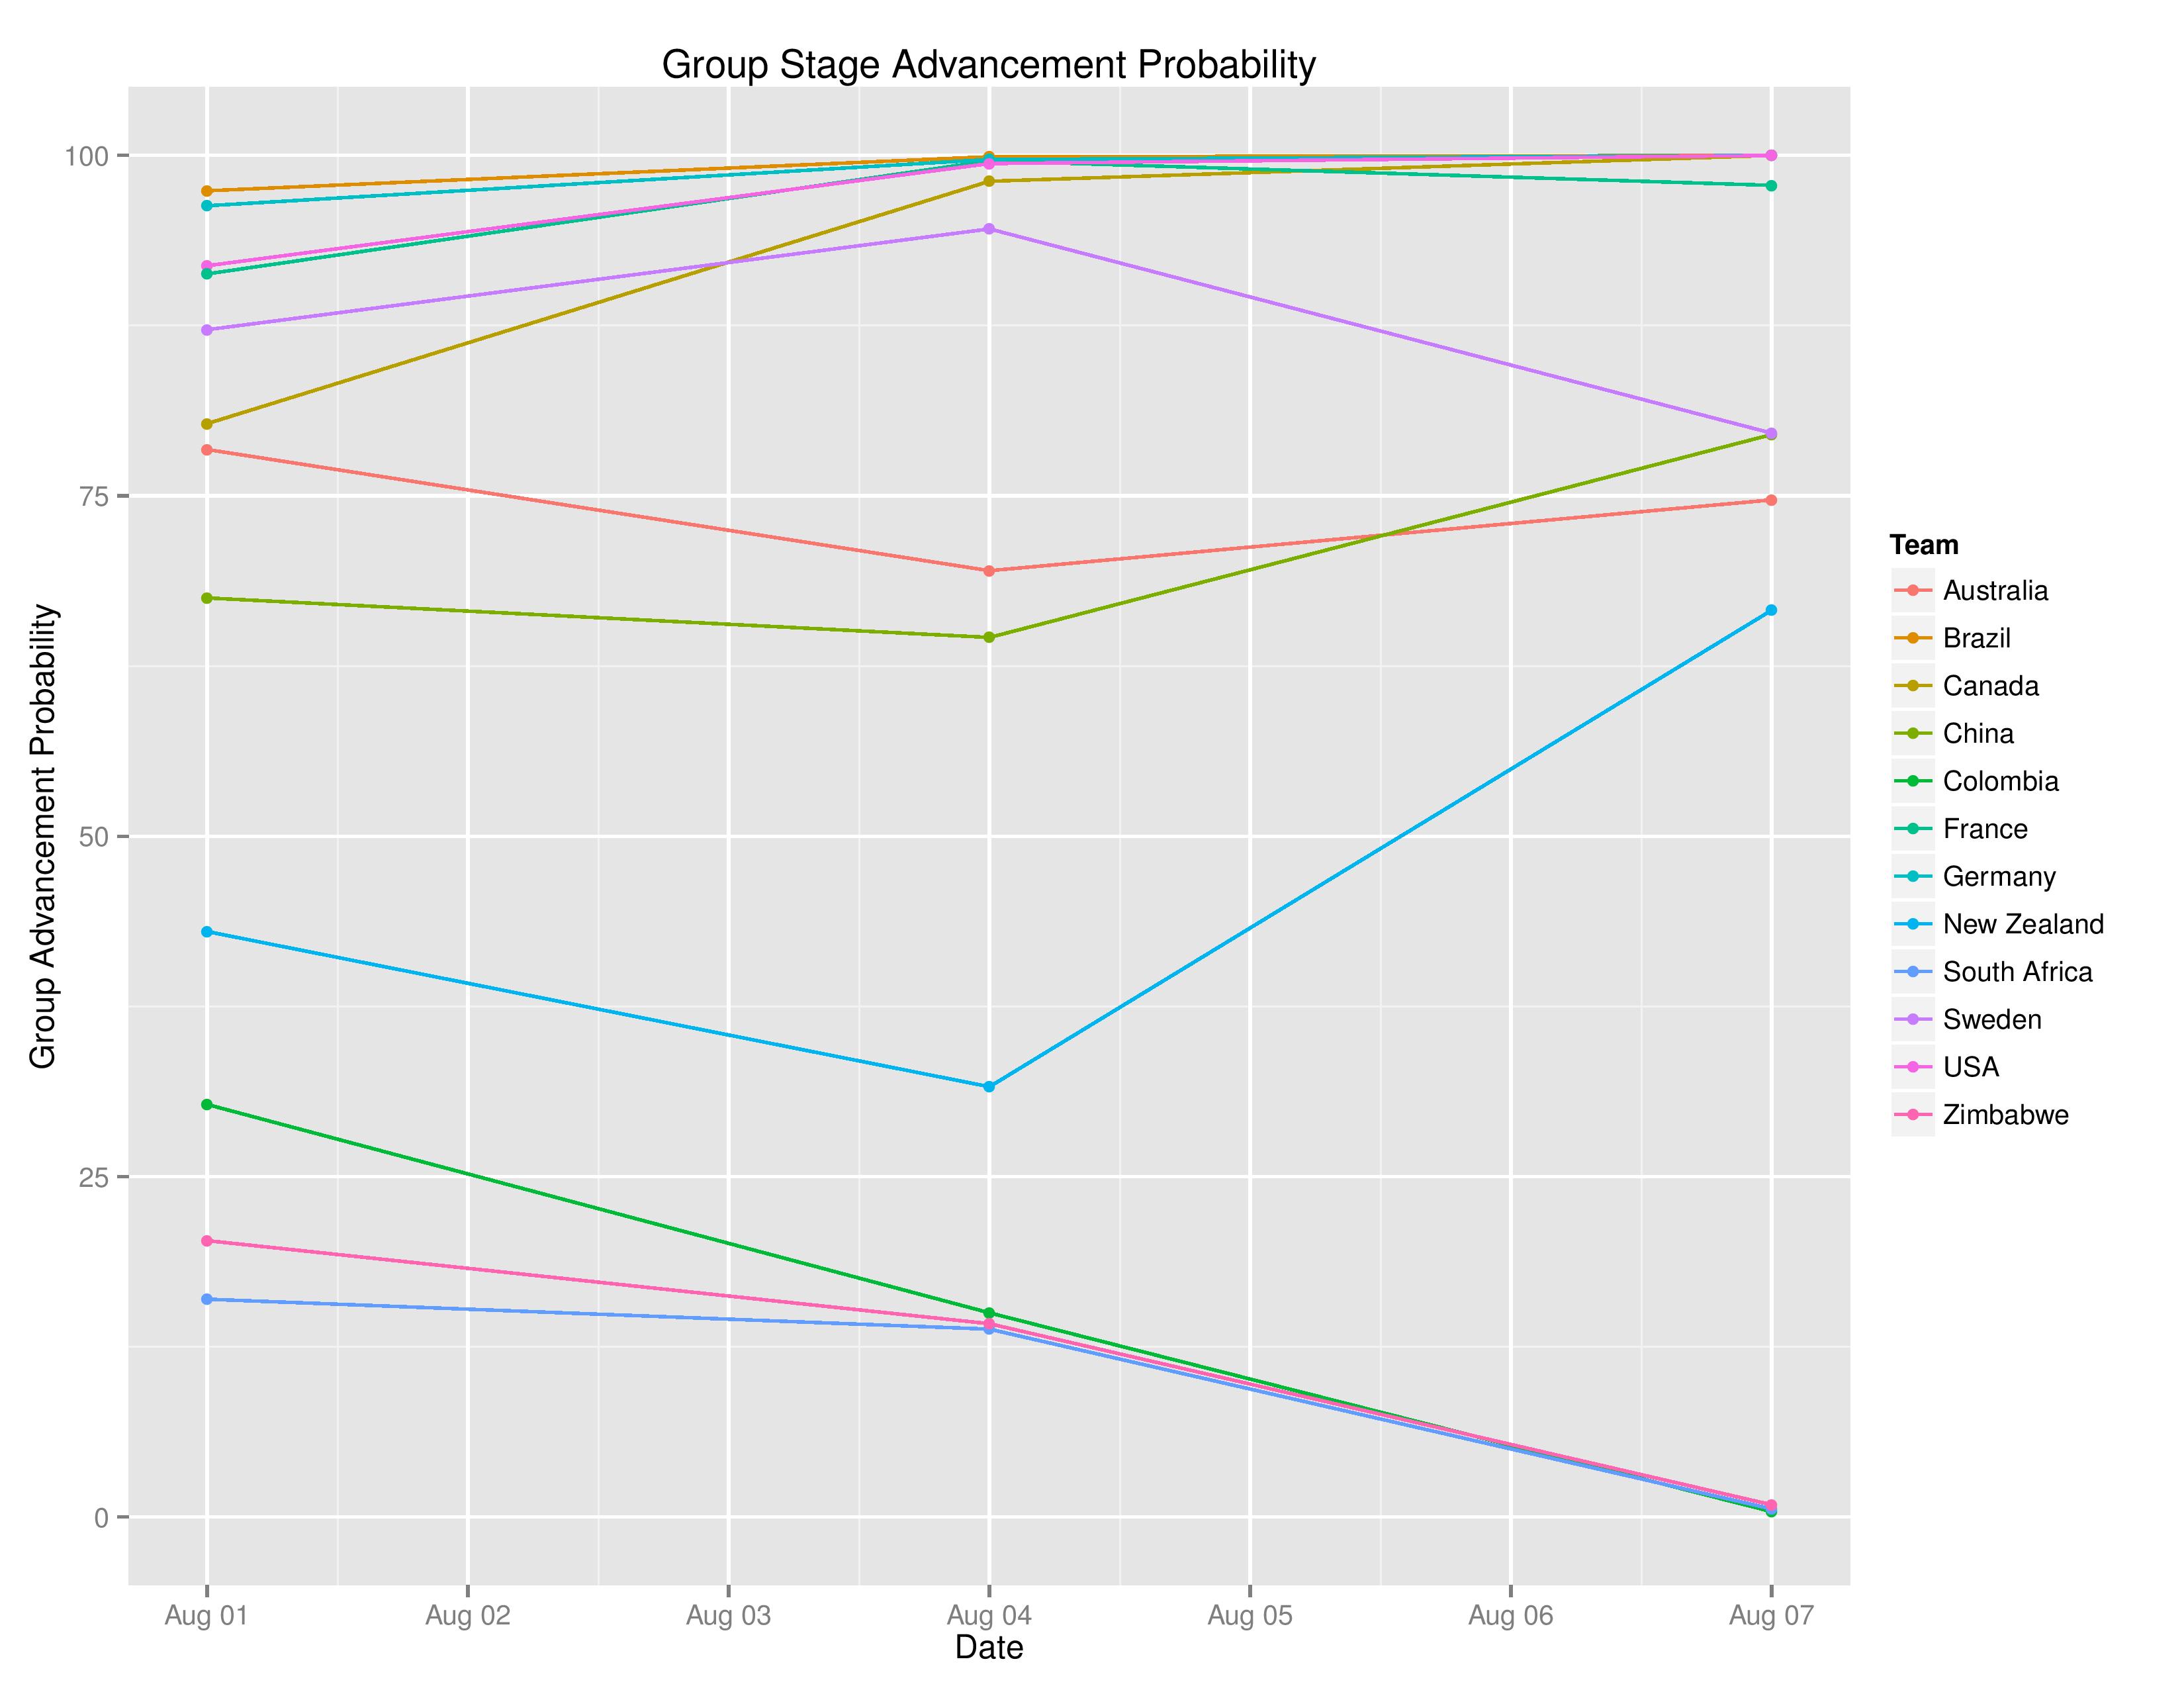
We can now see how the Group Advancement probabilities evolve over time:
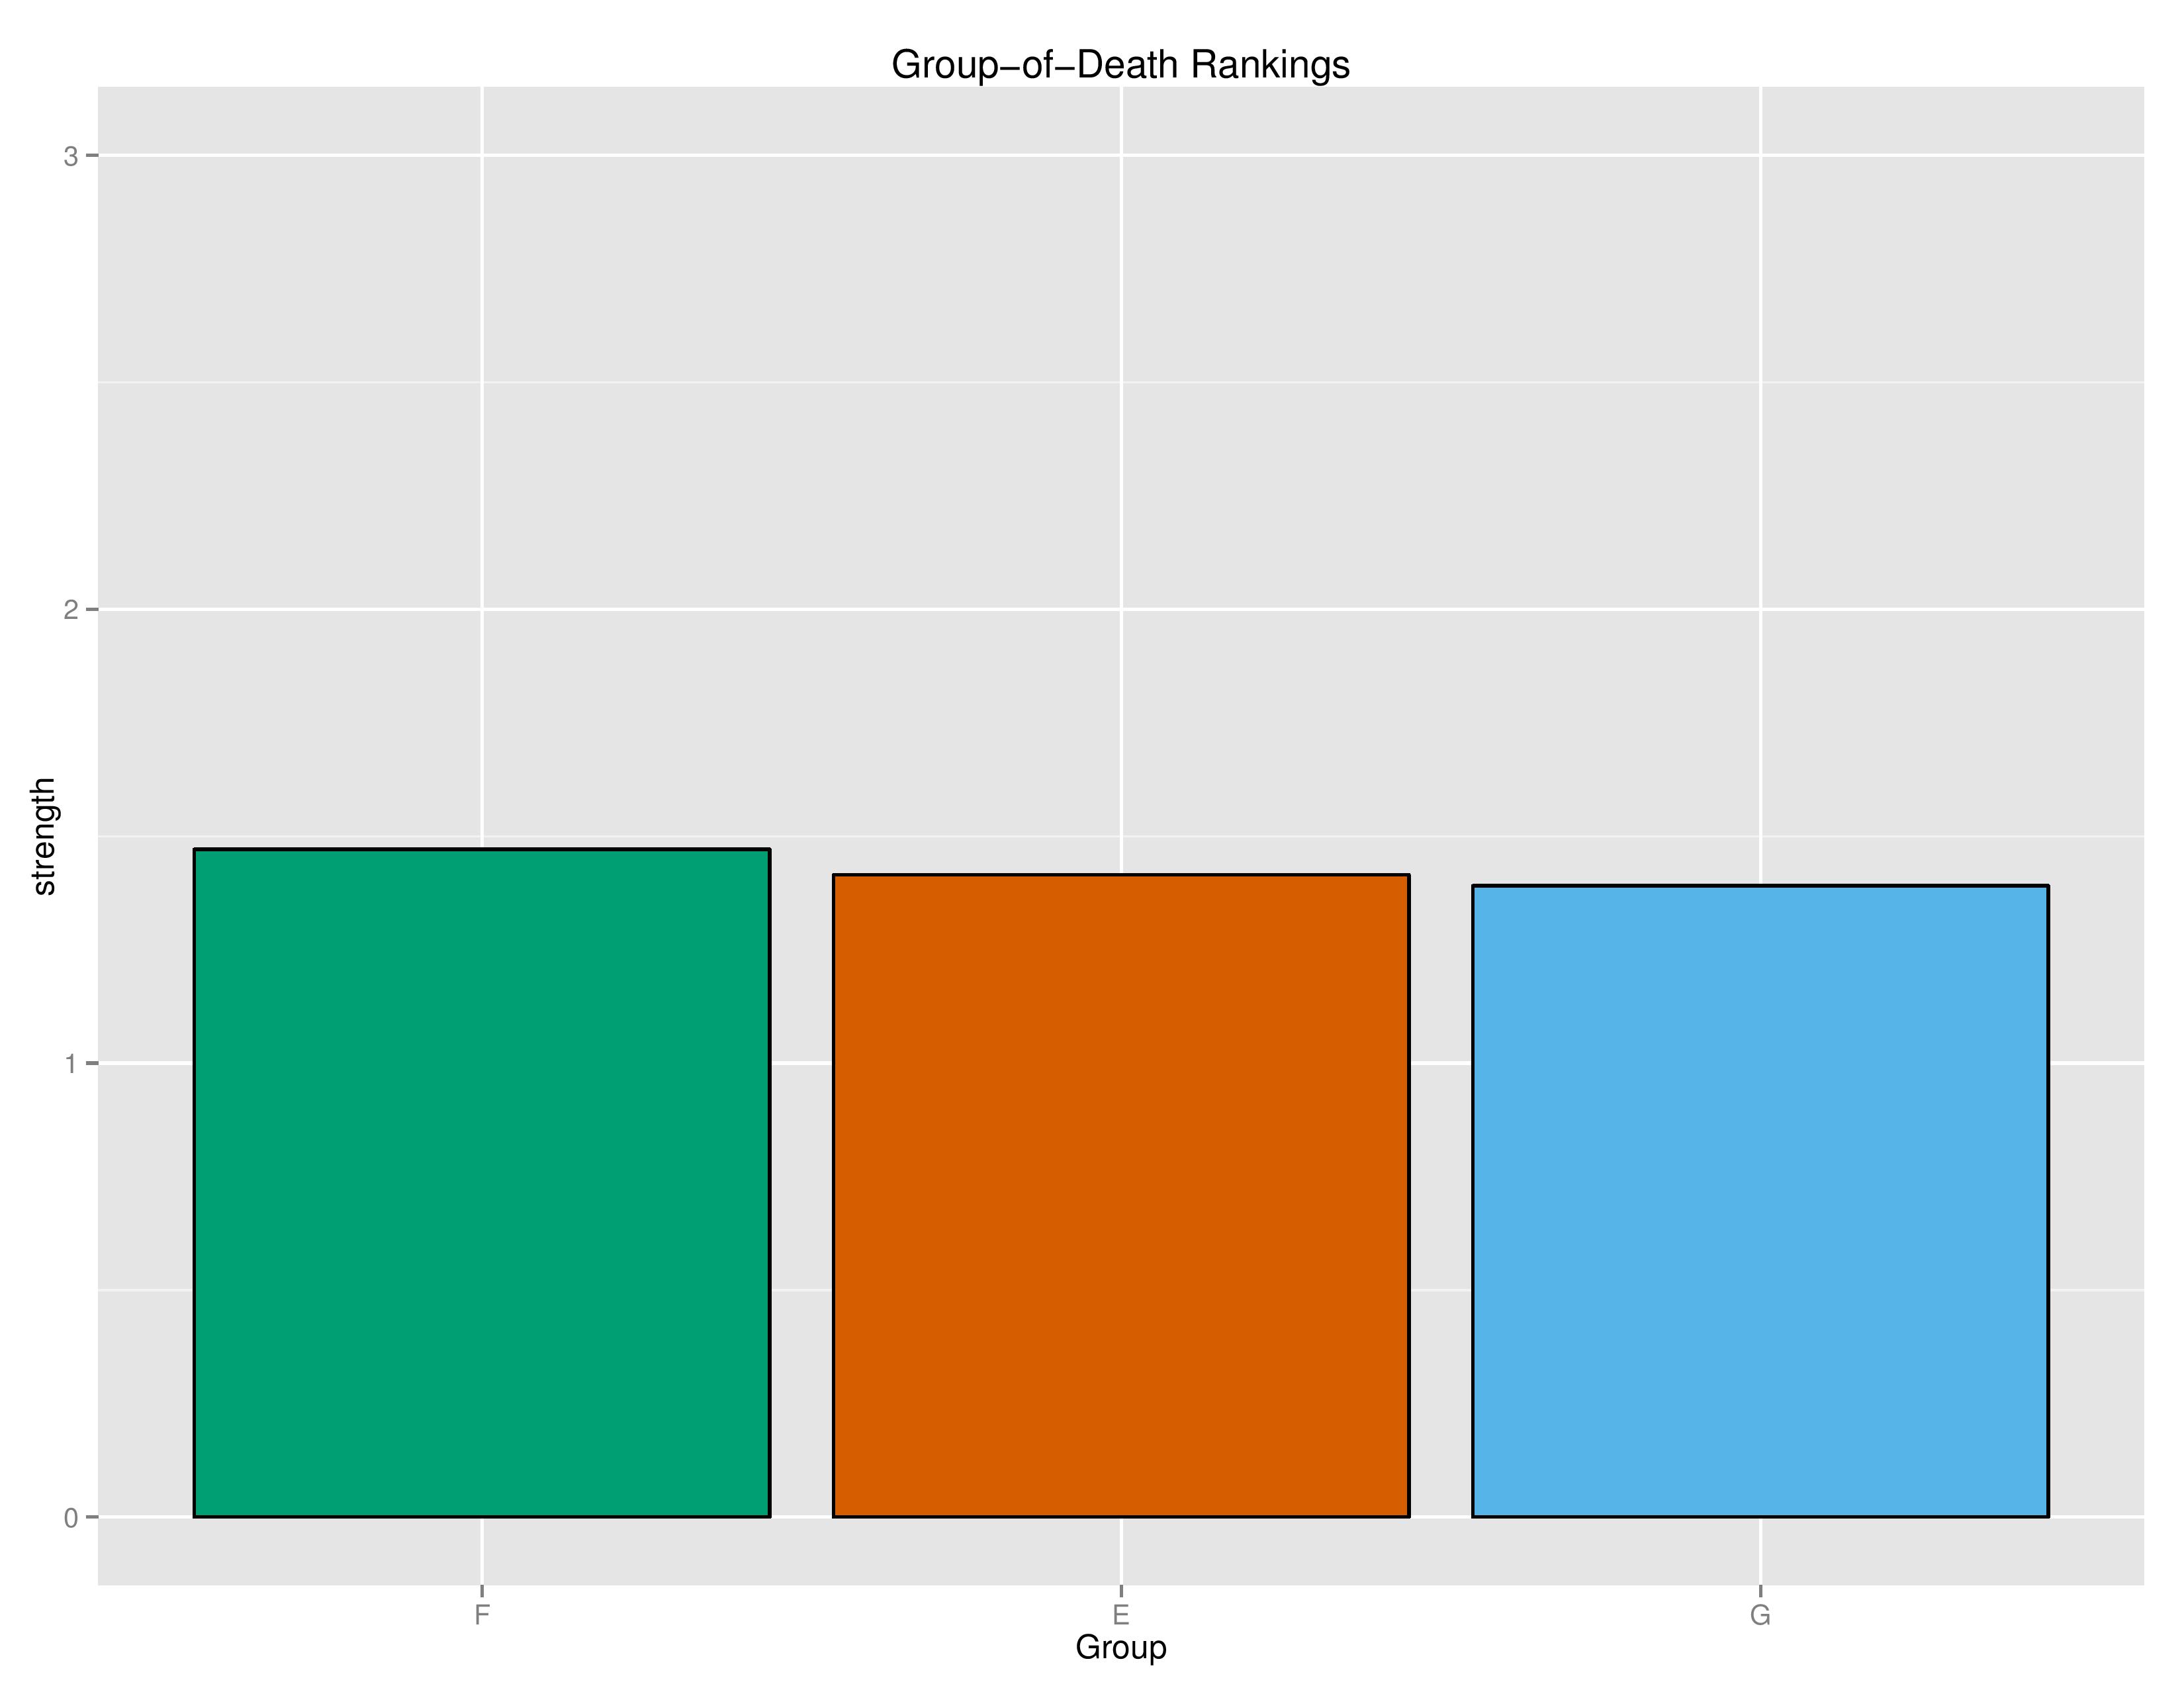
Next shows the Group of Death Rankings. This is determined by the All vs. All expectation of points (i.e. every team playing against every team and then averaging the expected points by group).
USA’s team is in Group G, which has been re-assessed to the weakest of the three groups (previously the middle-difficulty group). The most difficult group is Group F which is composed of Germany, Canada, Australia, and Zimbabwe.
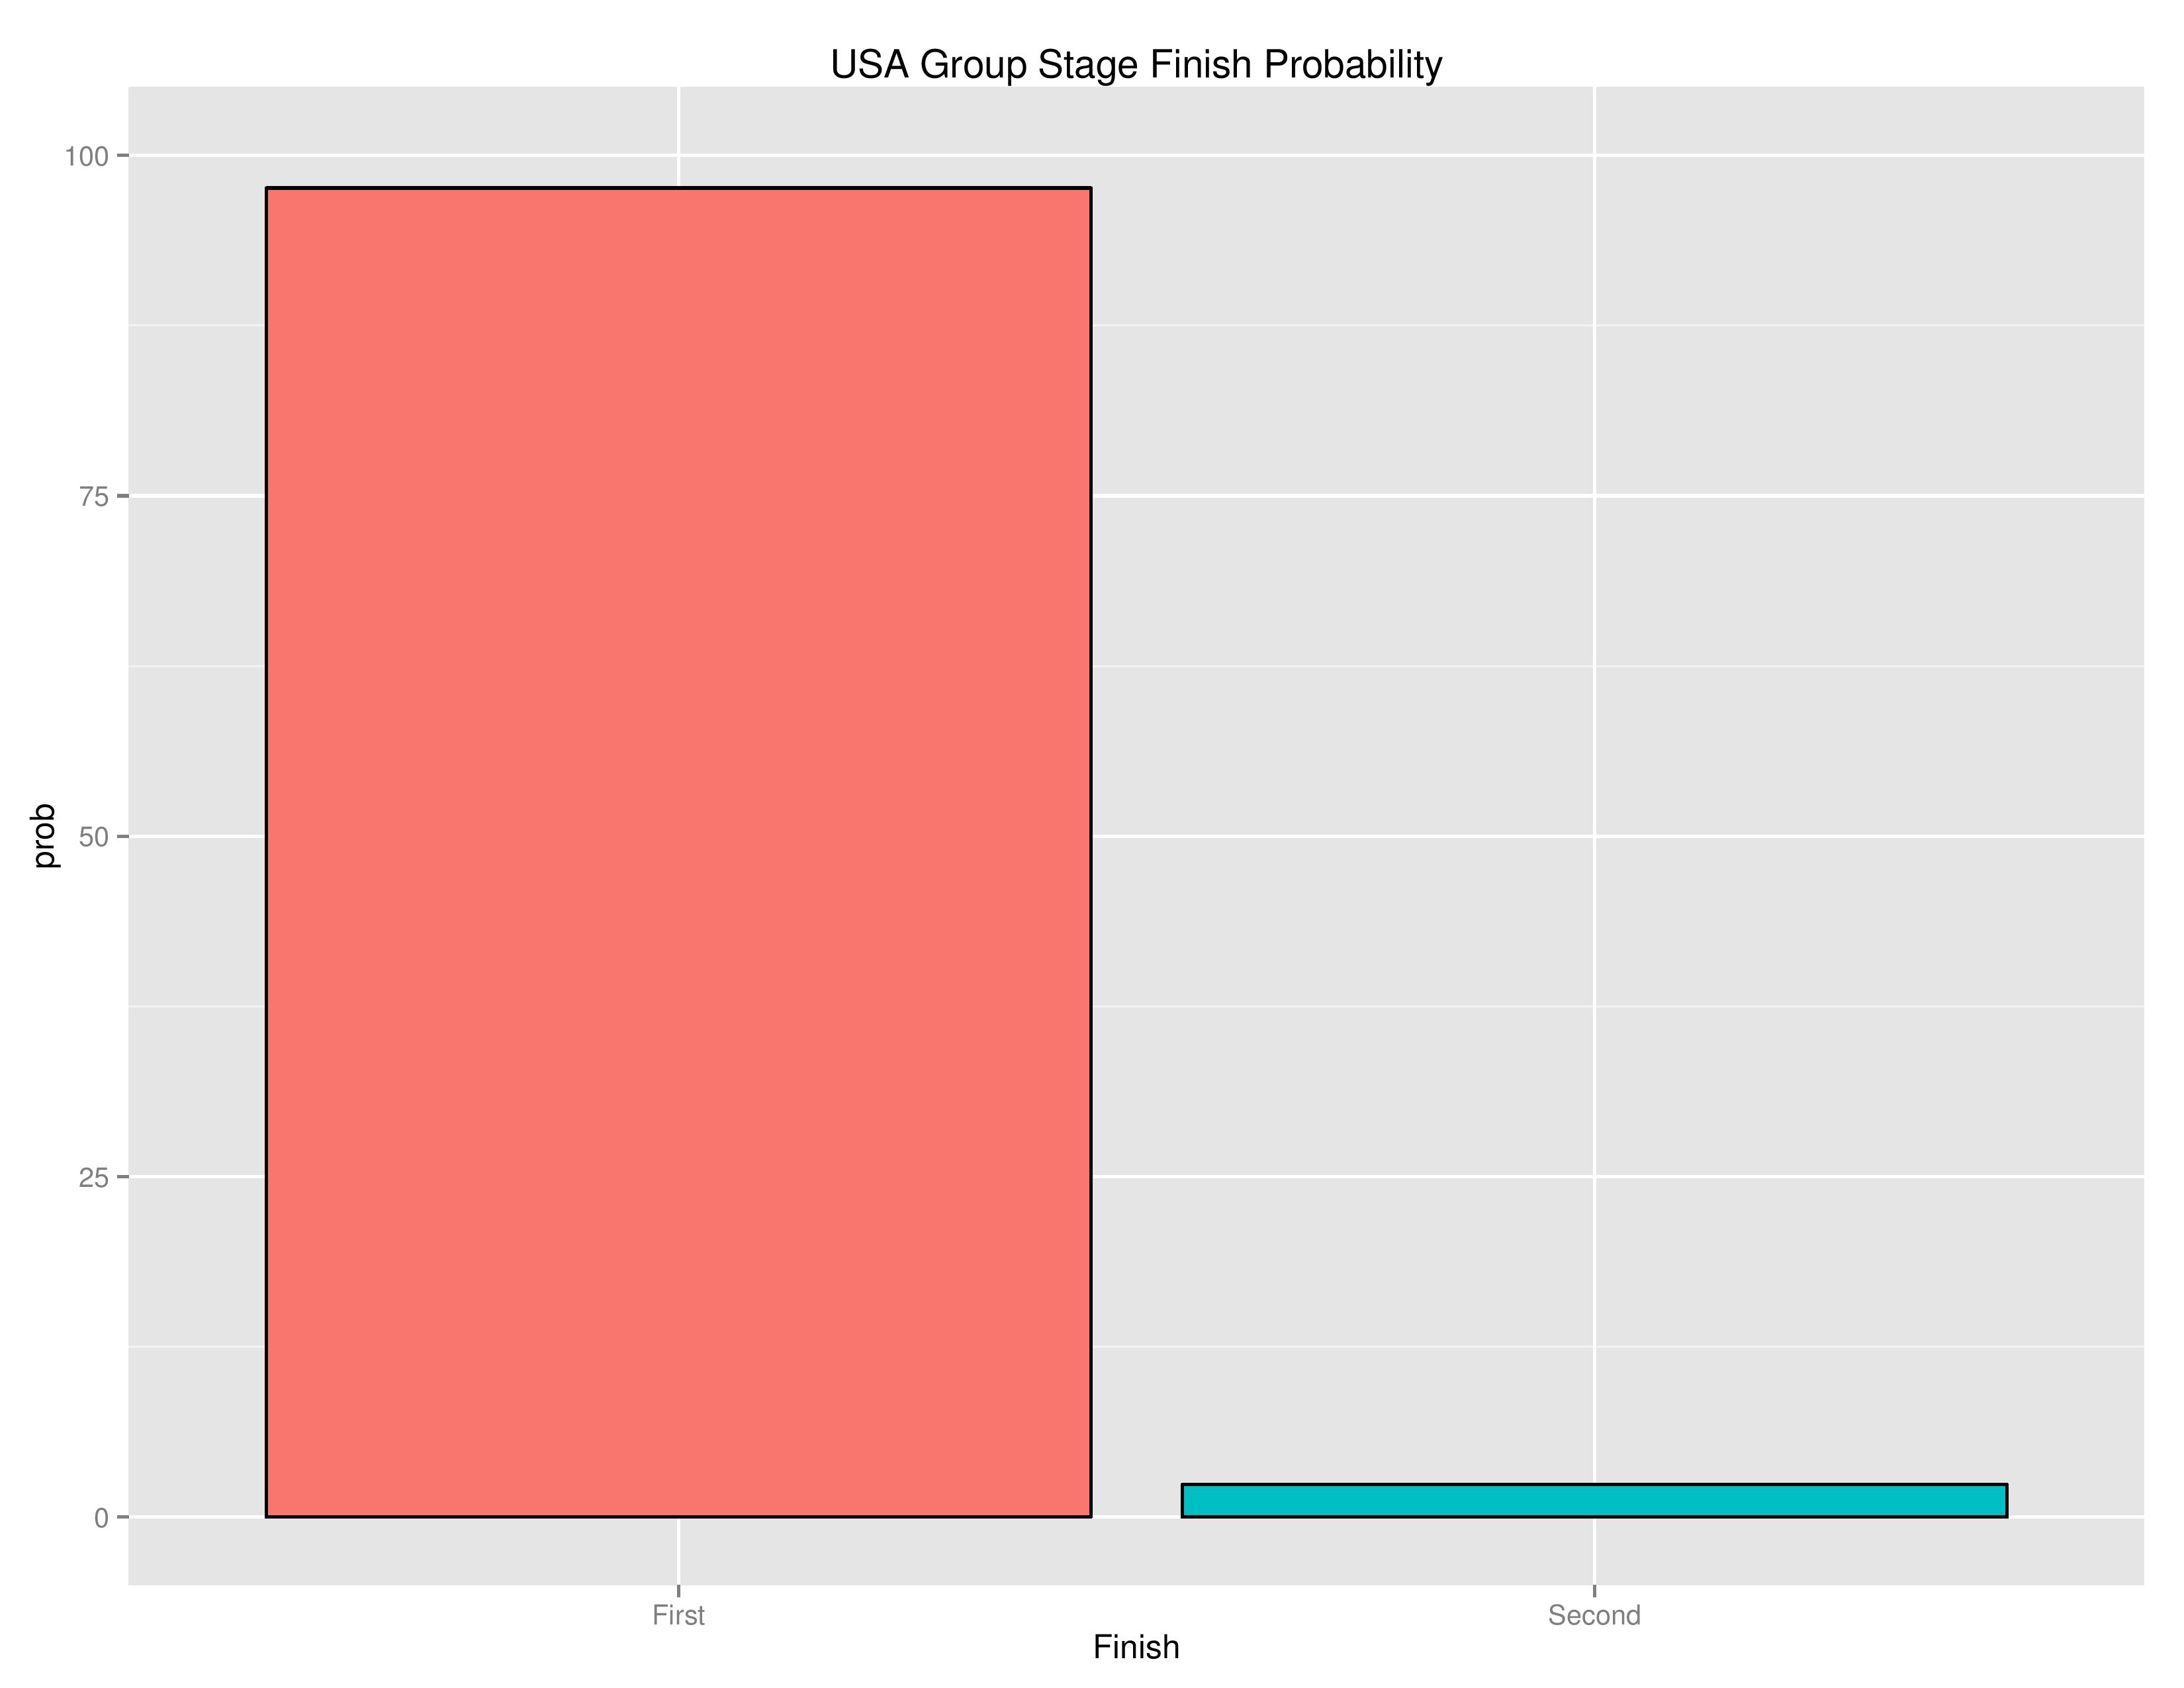
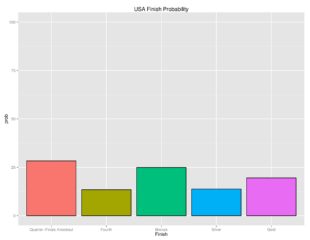
The following is the probabilities of how USA qualifies (or doesn’t) at the end of the group stage.
USA has nearly clinched winning the group and is no longer capable of either not qualifying or qualifying in third place.
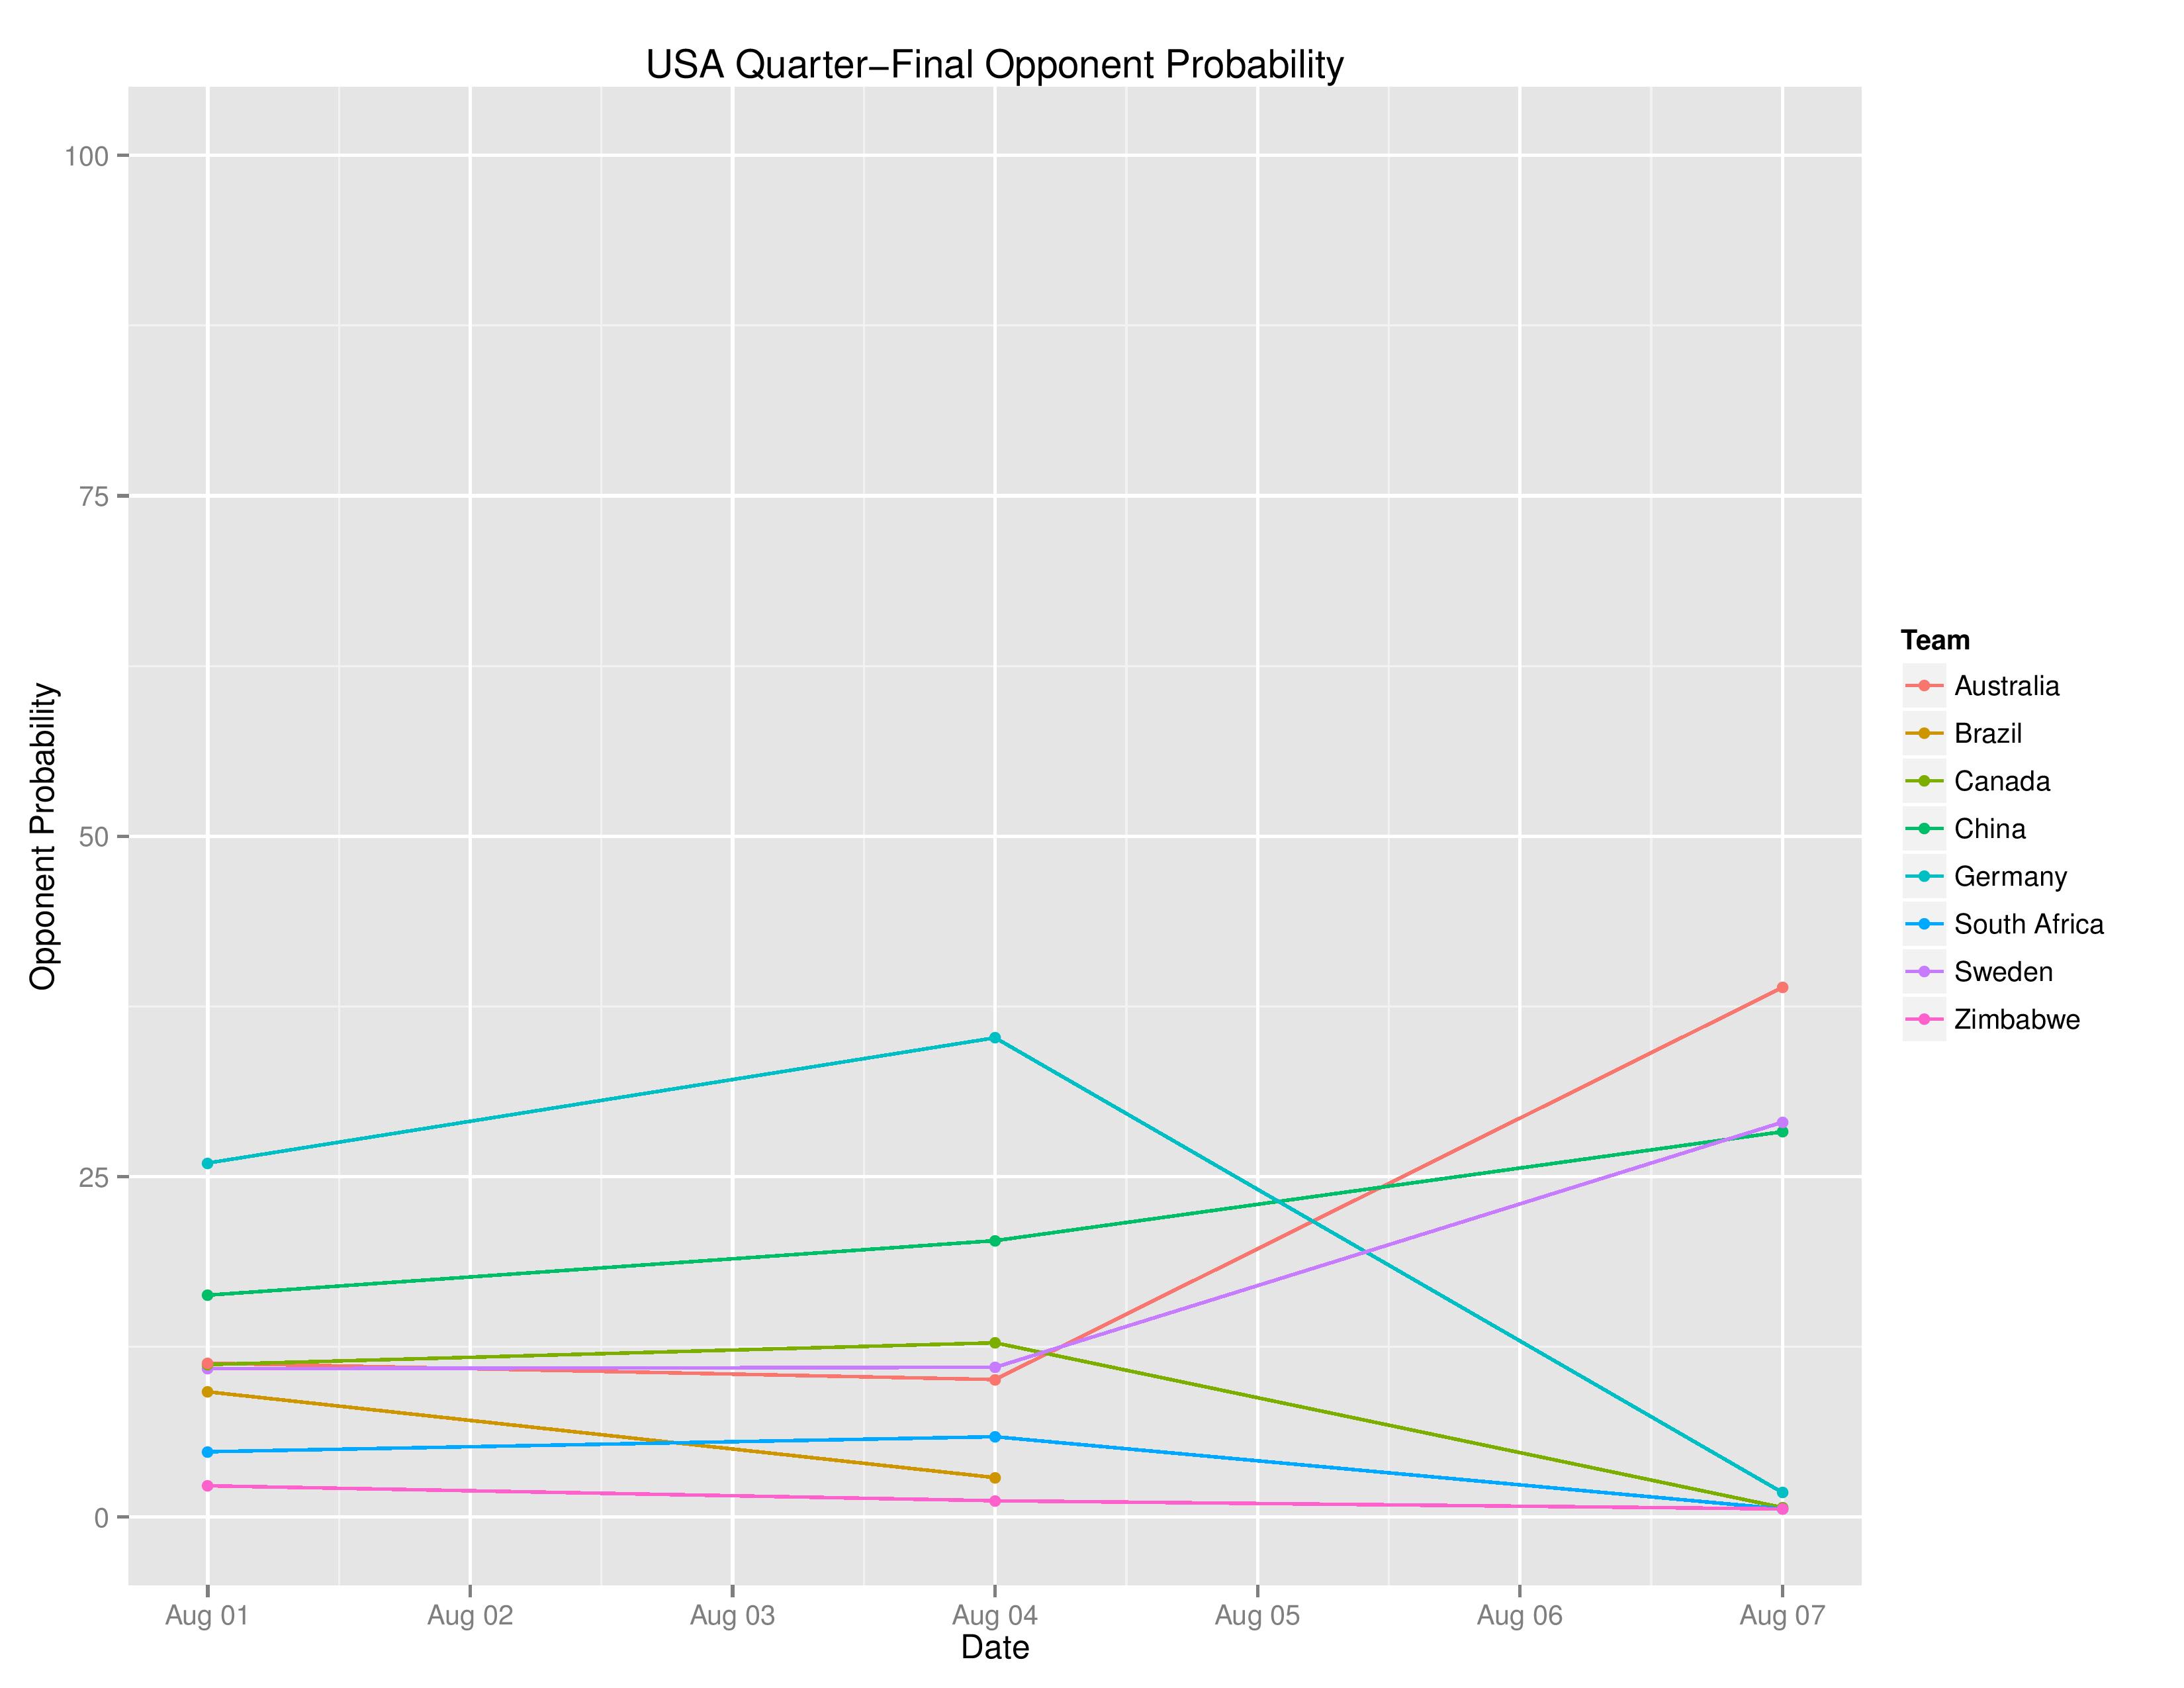
Next is showing USA’s probabilities of all possible outcomes:

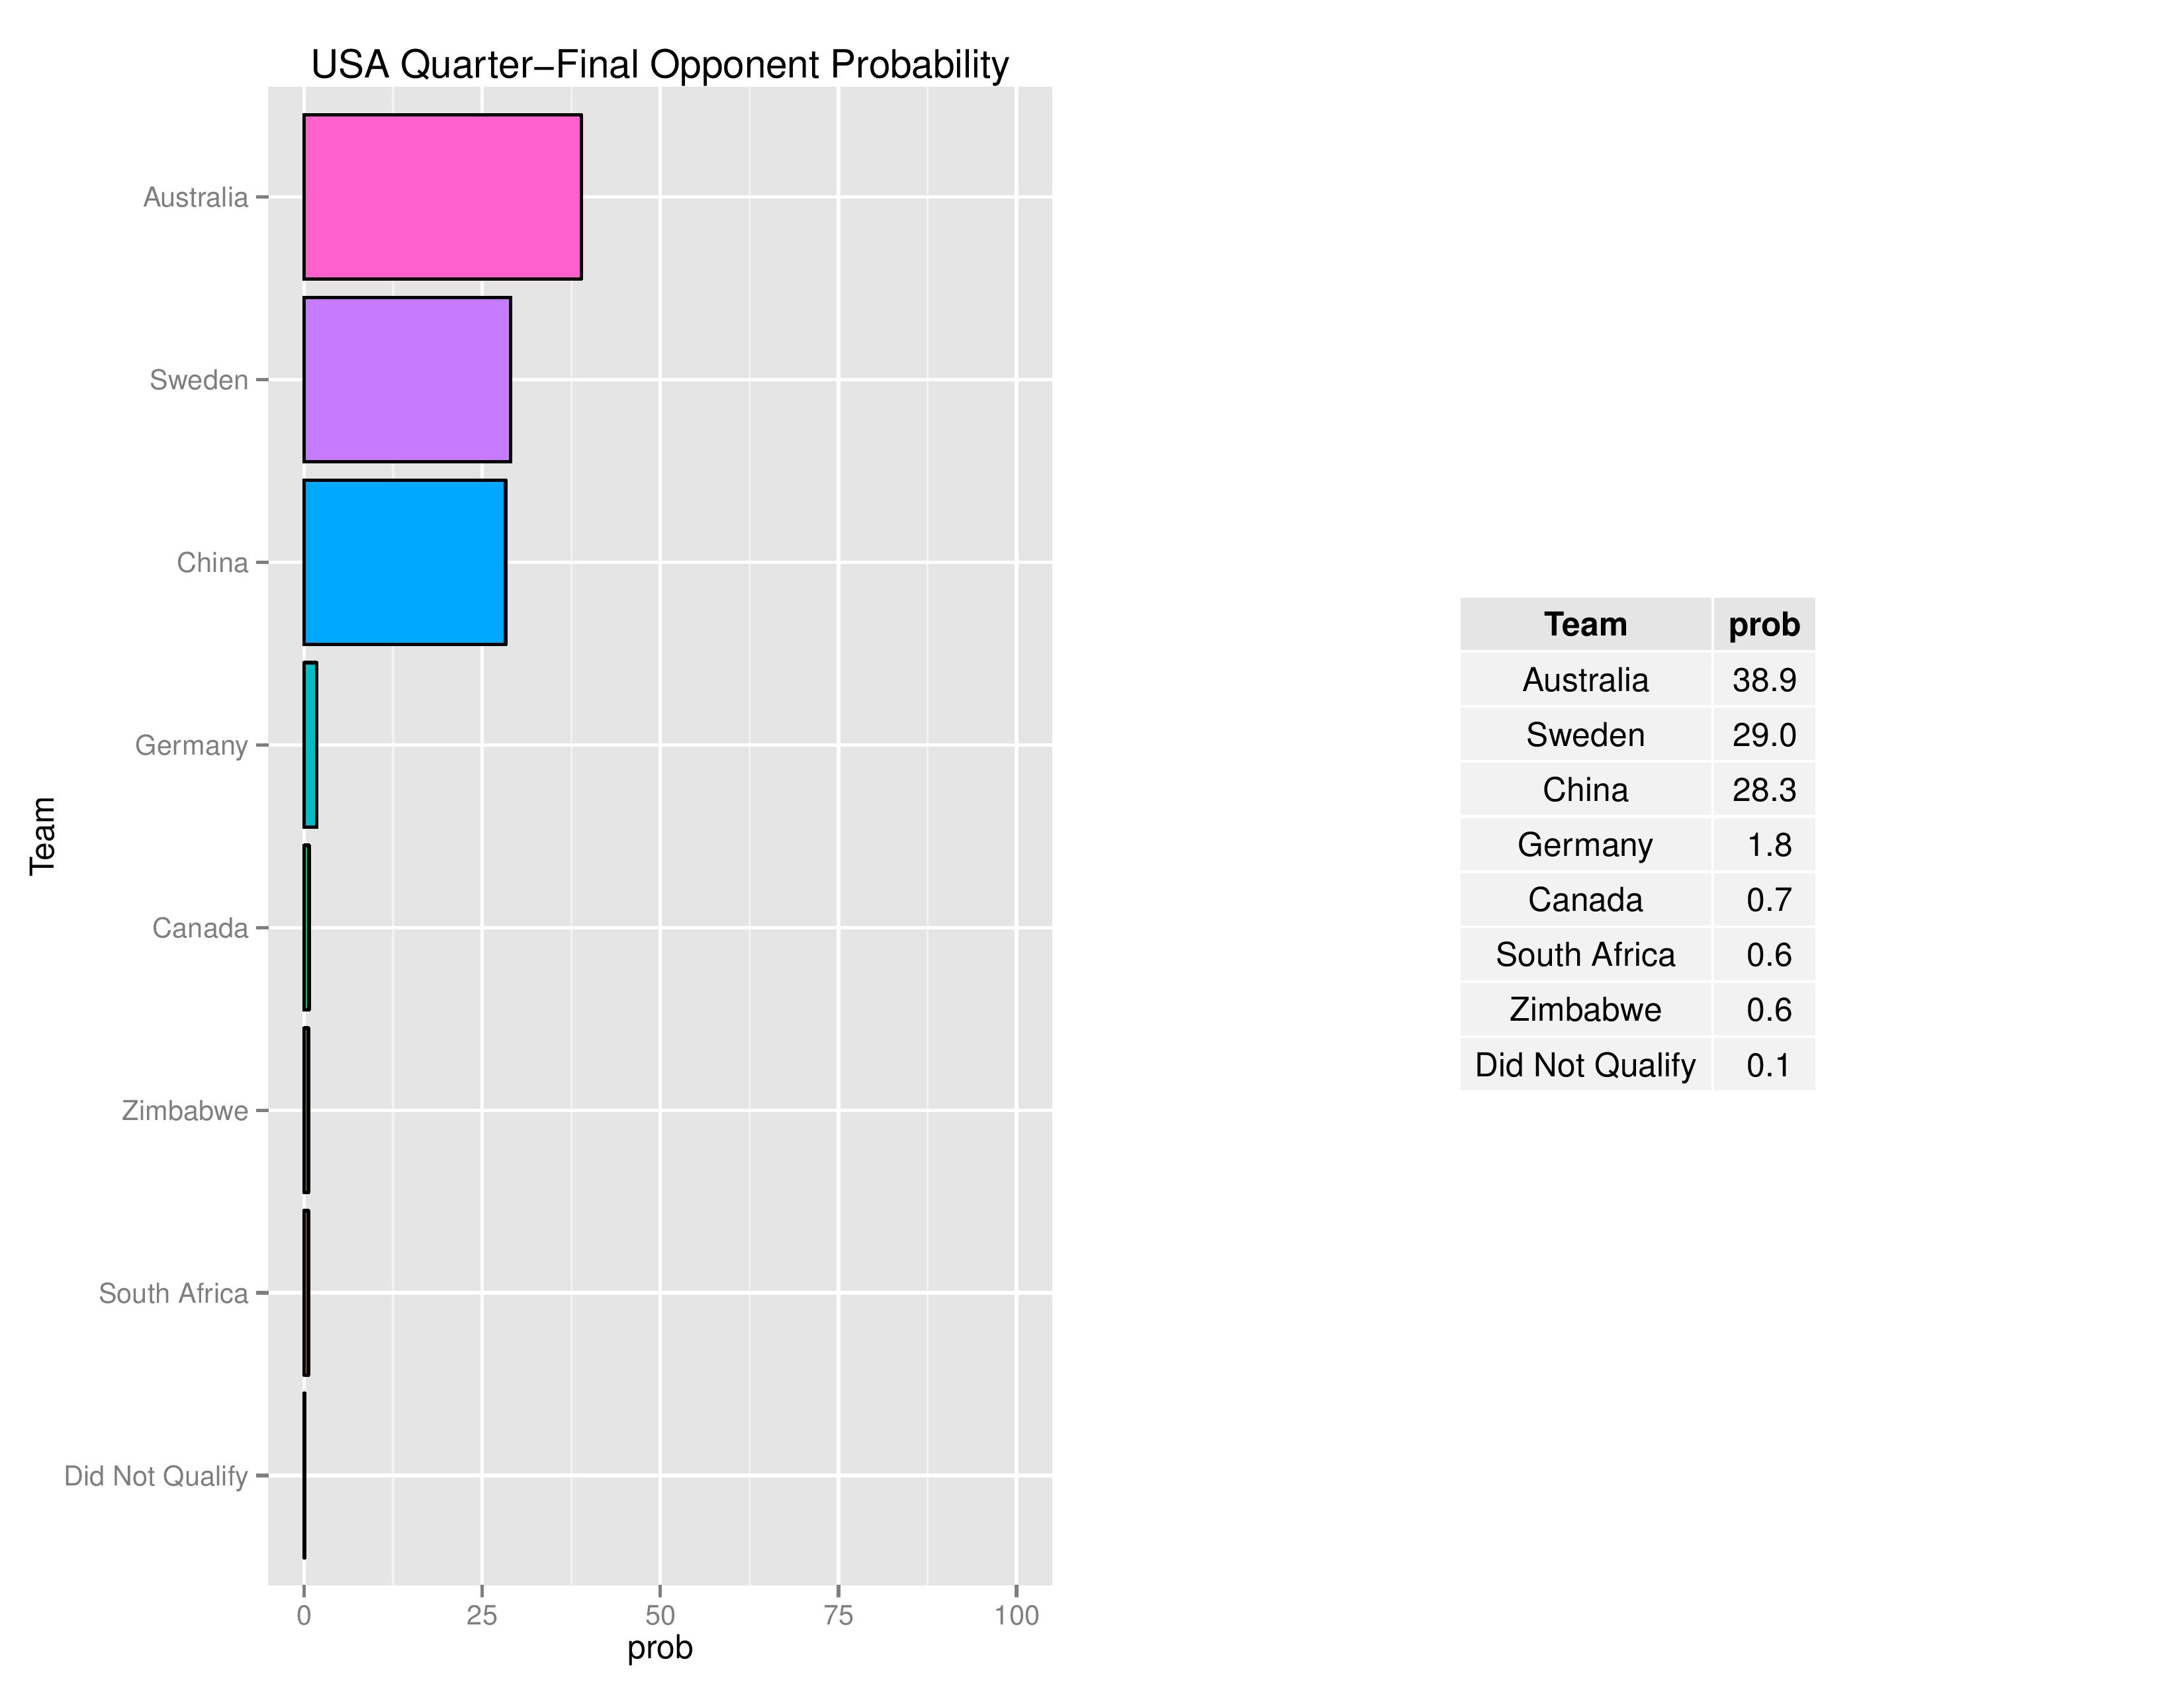
USA’s likelihood of their quarterfinal opponent is below. The USWNT is no longer likely to face Germany in the quarterfinals. Australia is now the most likely first-round-opponent with potentials in Sweden or China.
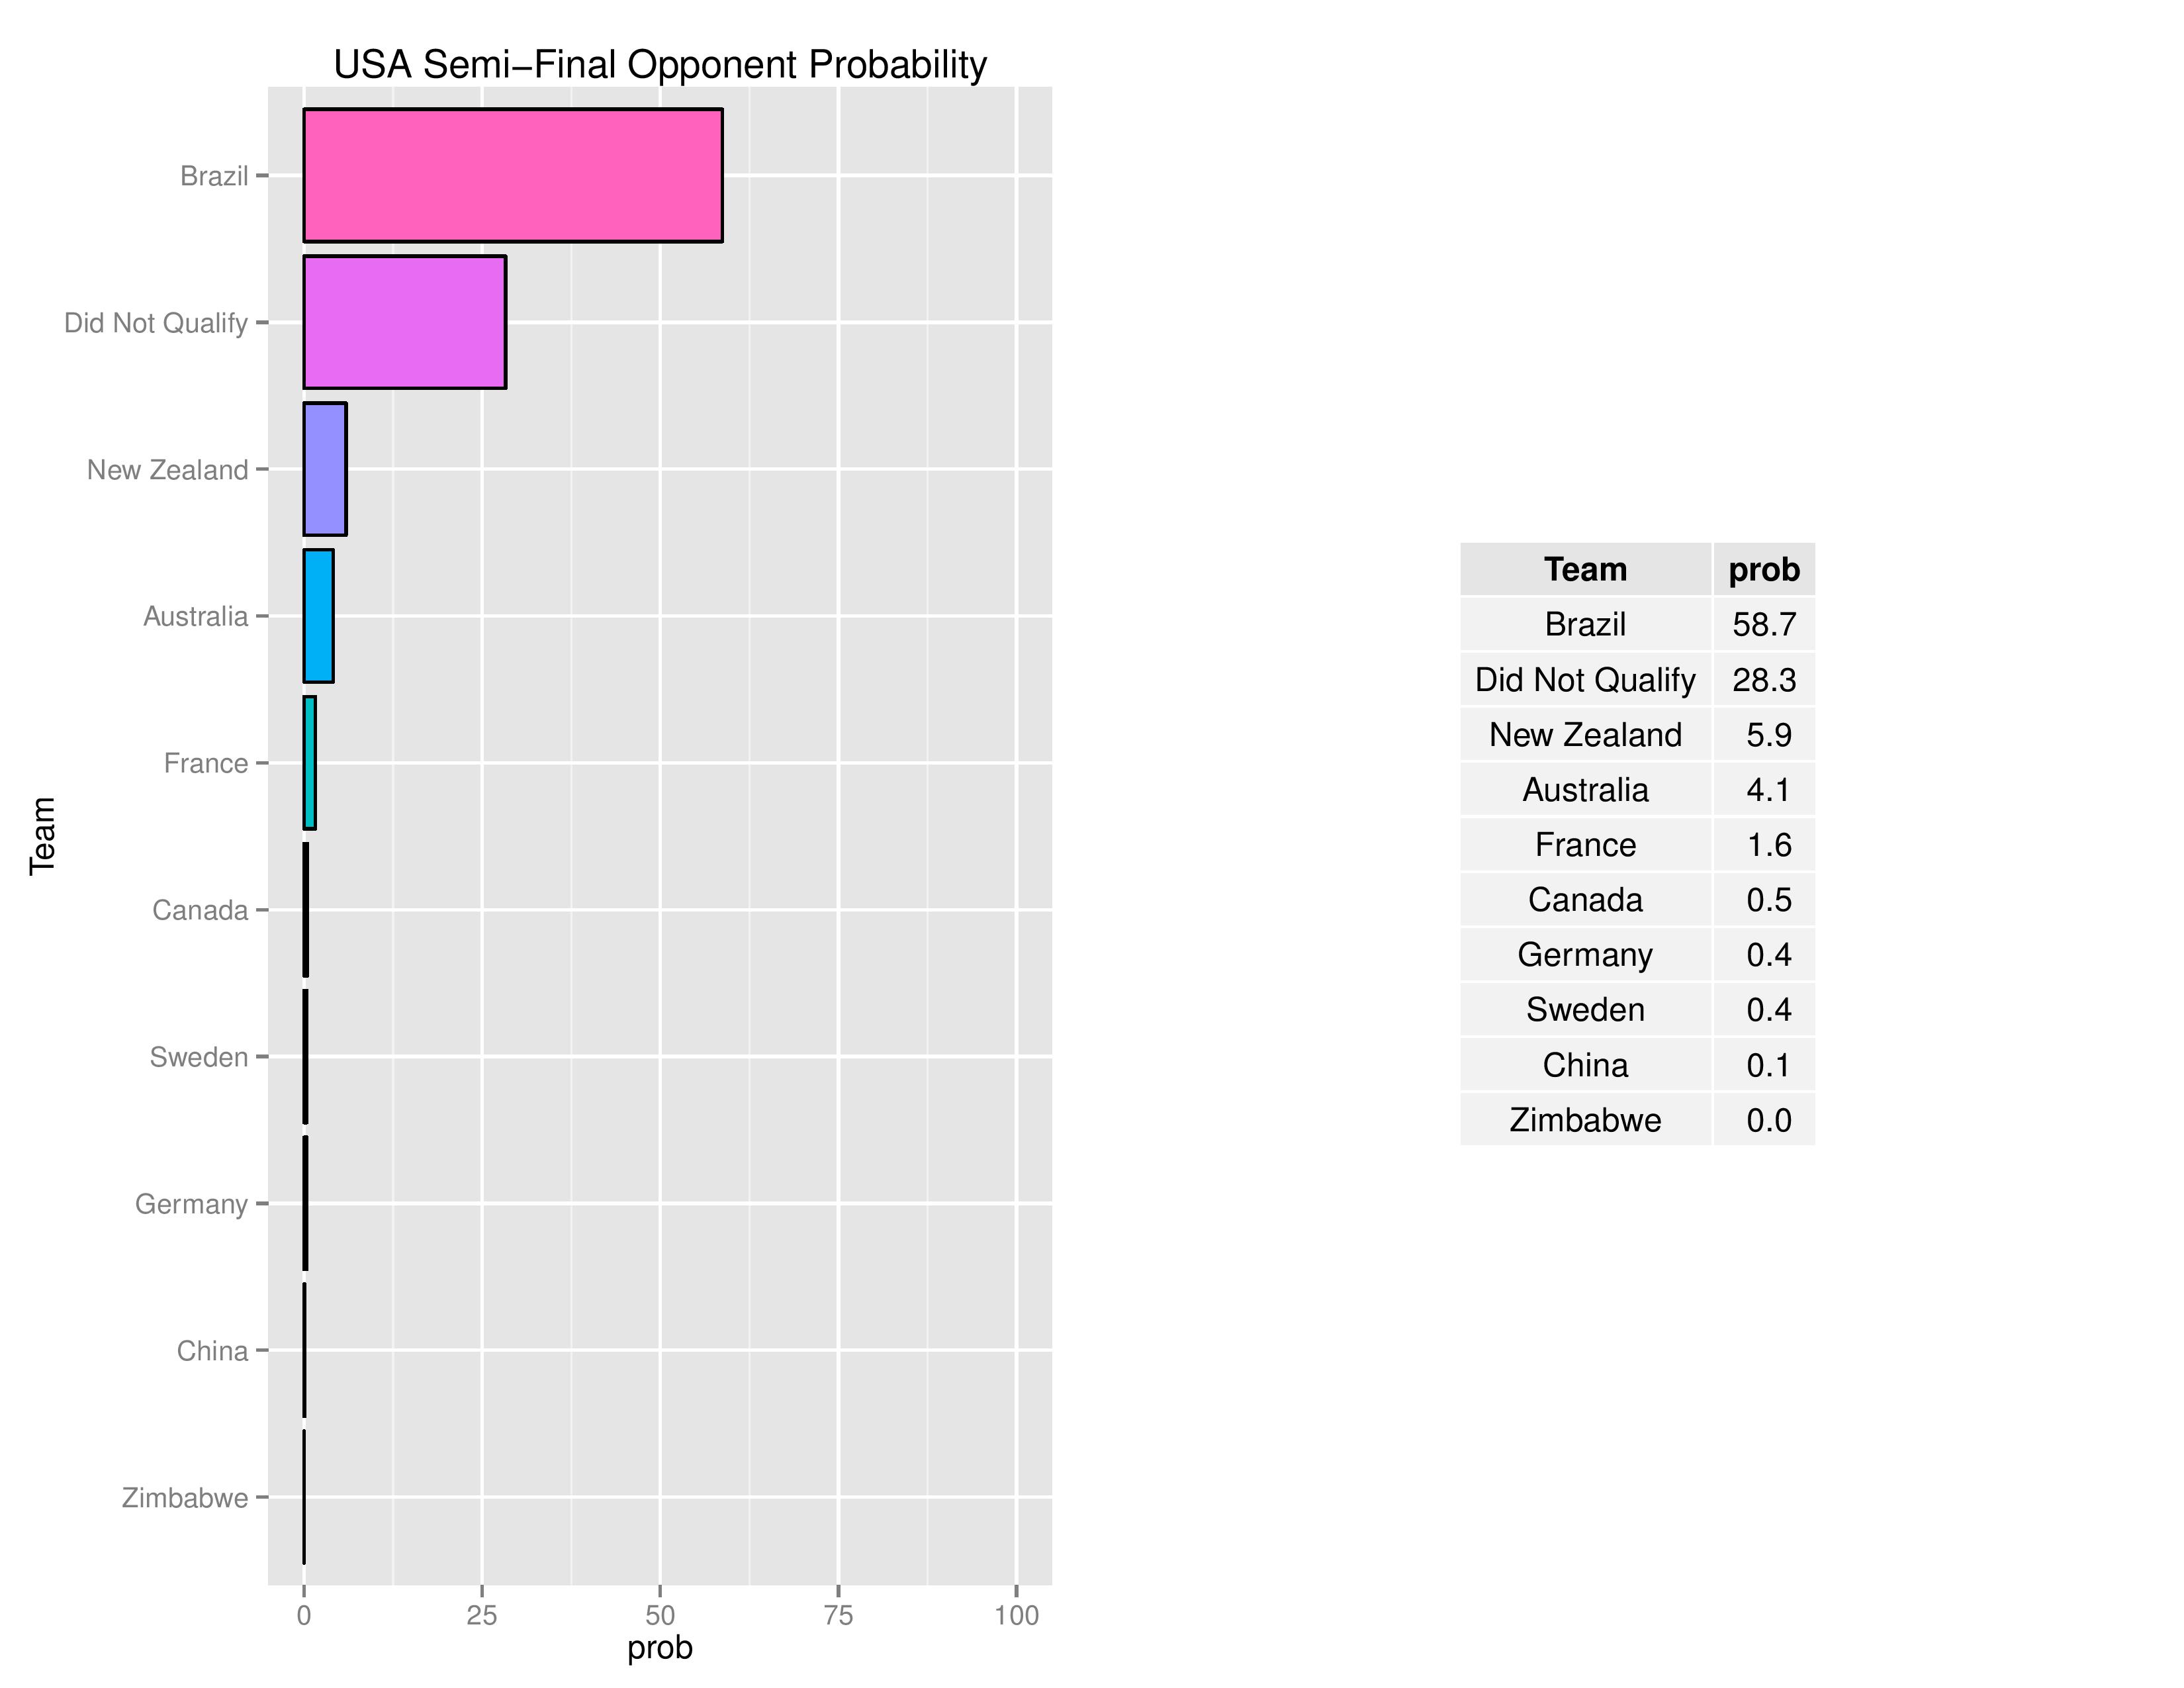
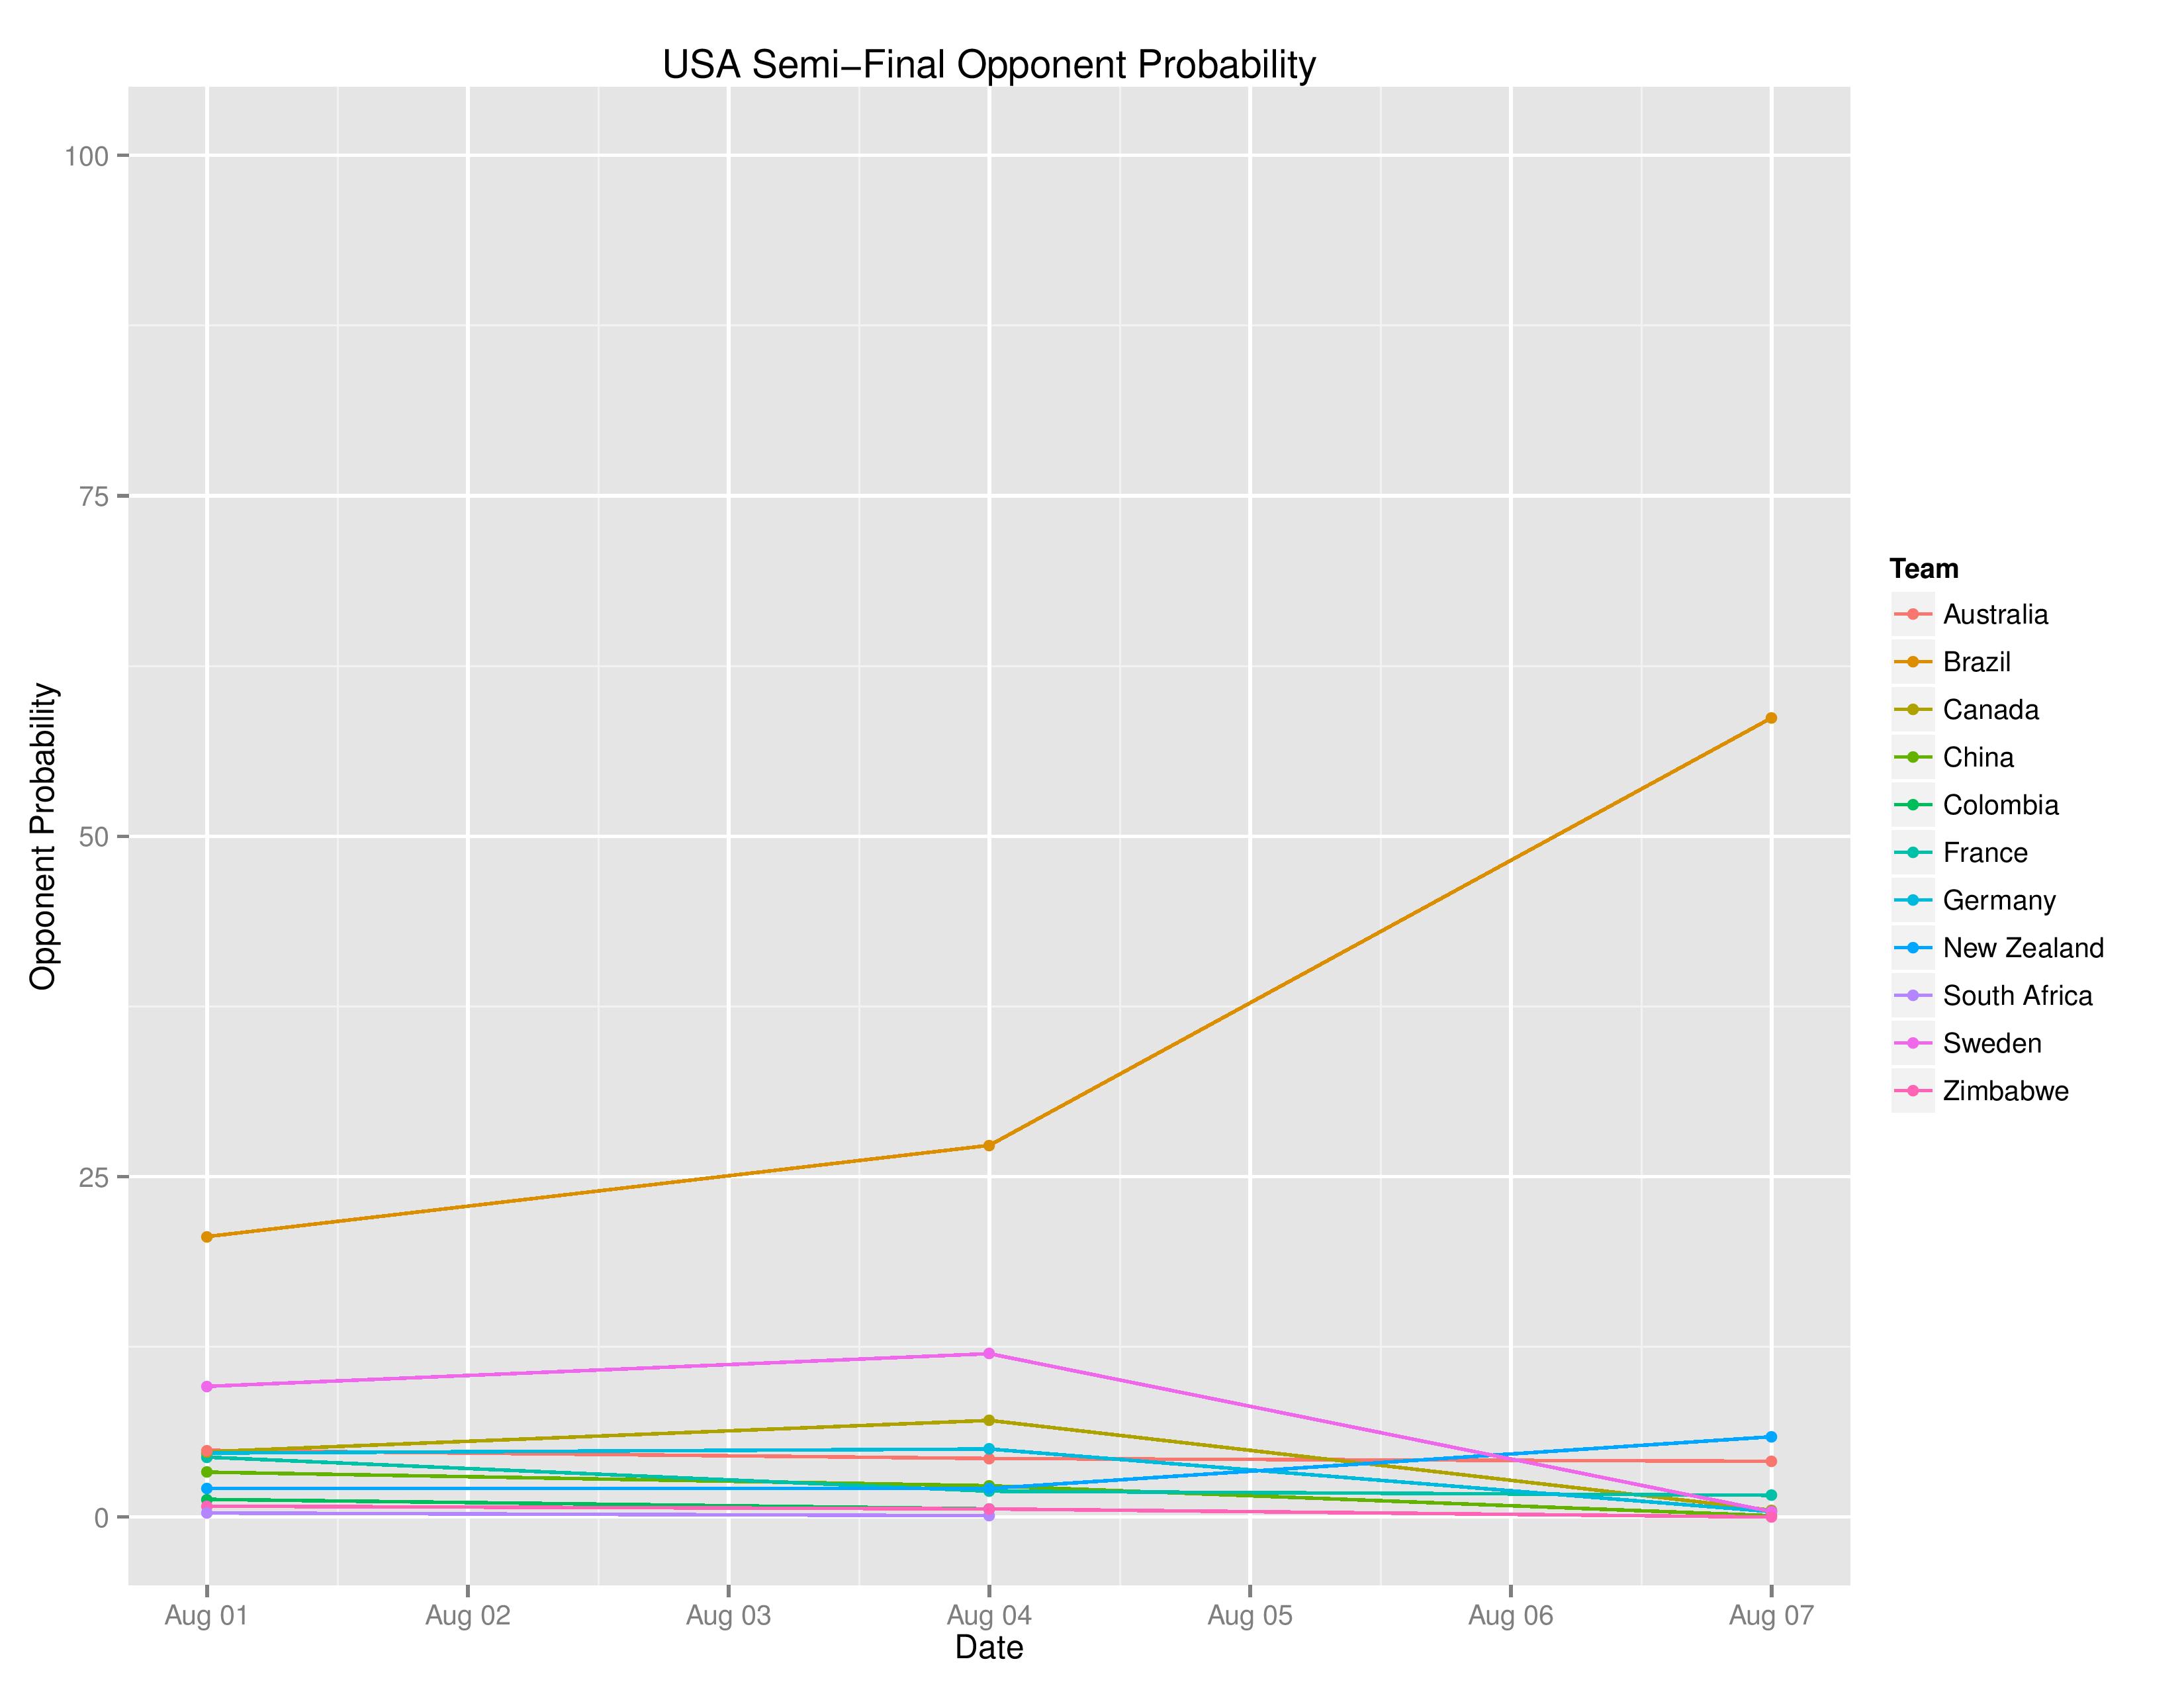
USA’s likelihood of their semifinal opponent down below. Assuming the US makes it to the semifinals, they are extremely likely to be facing Brazil.
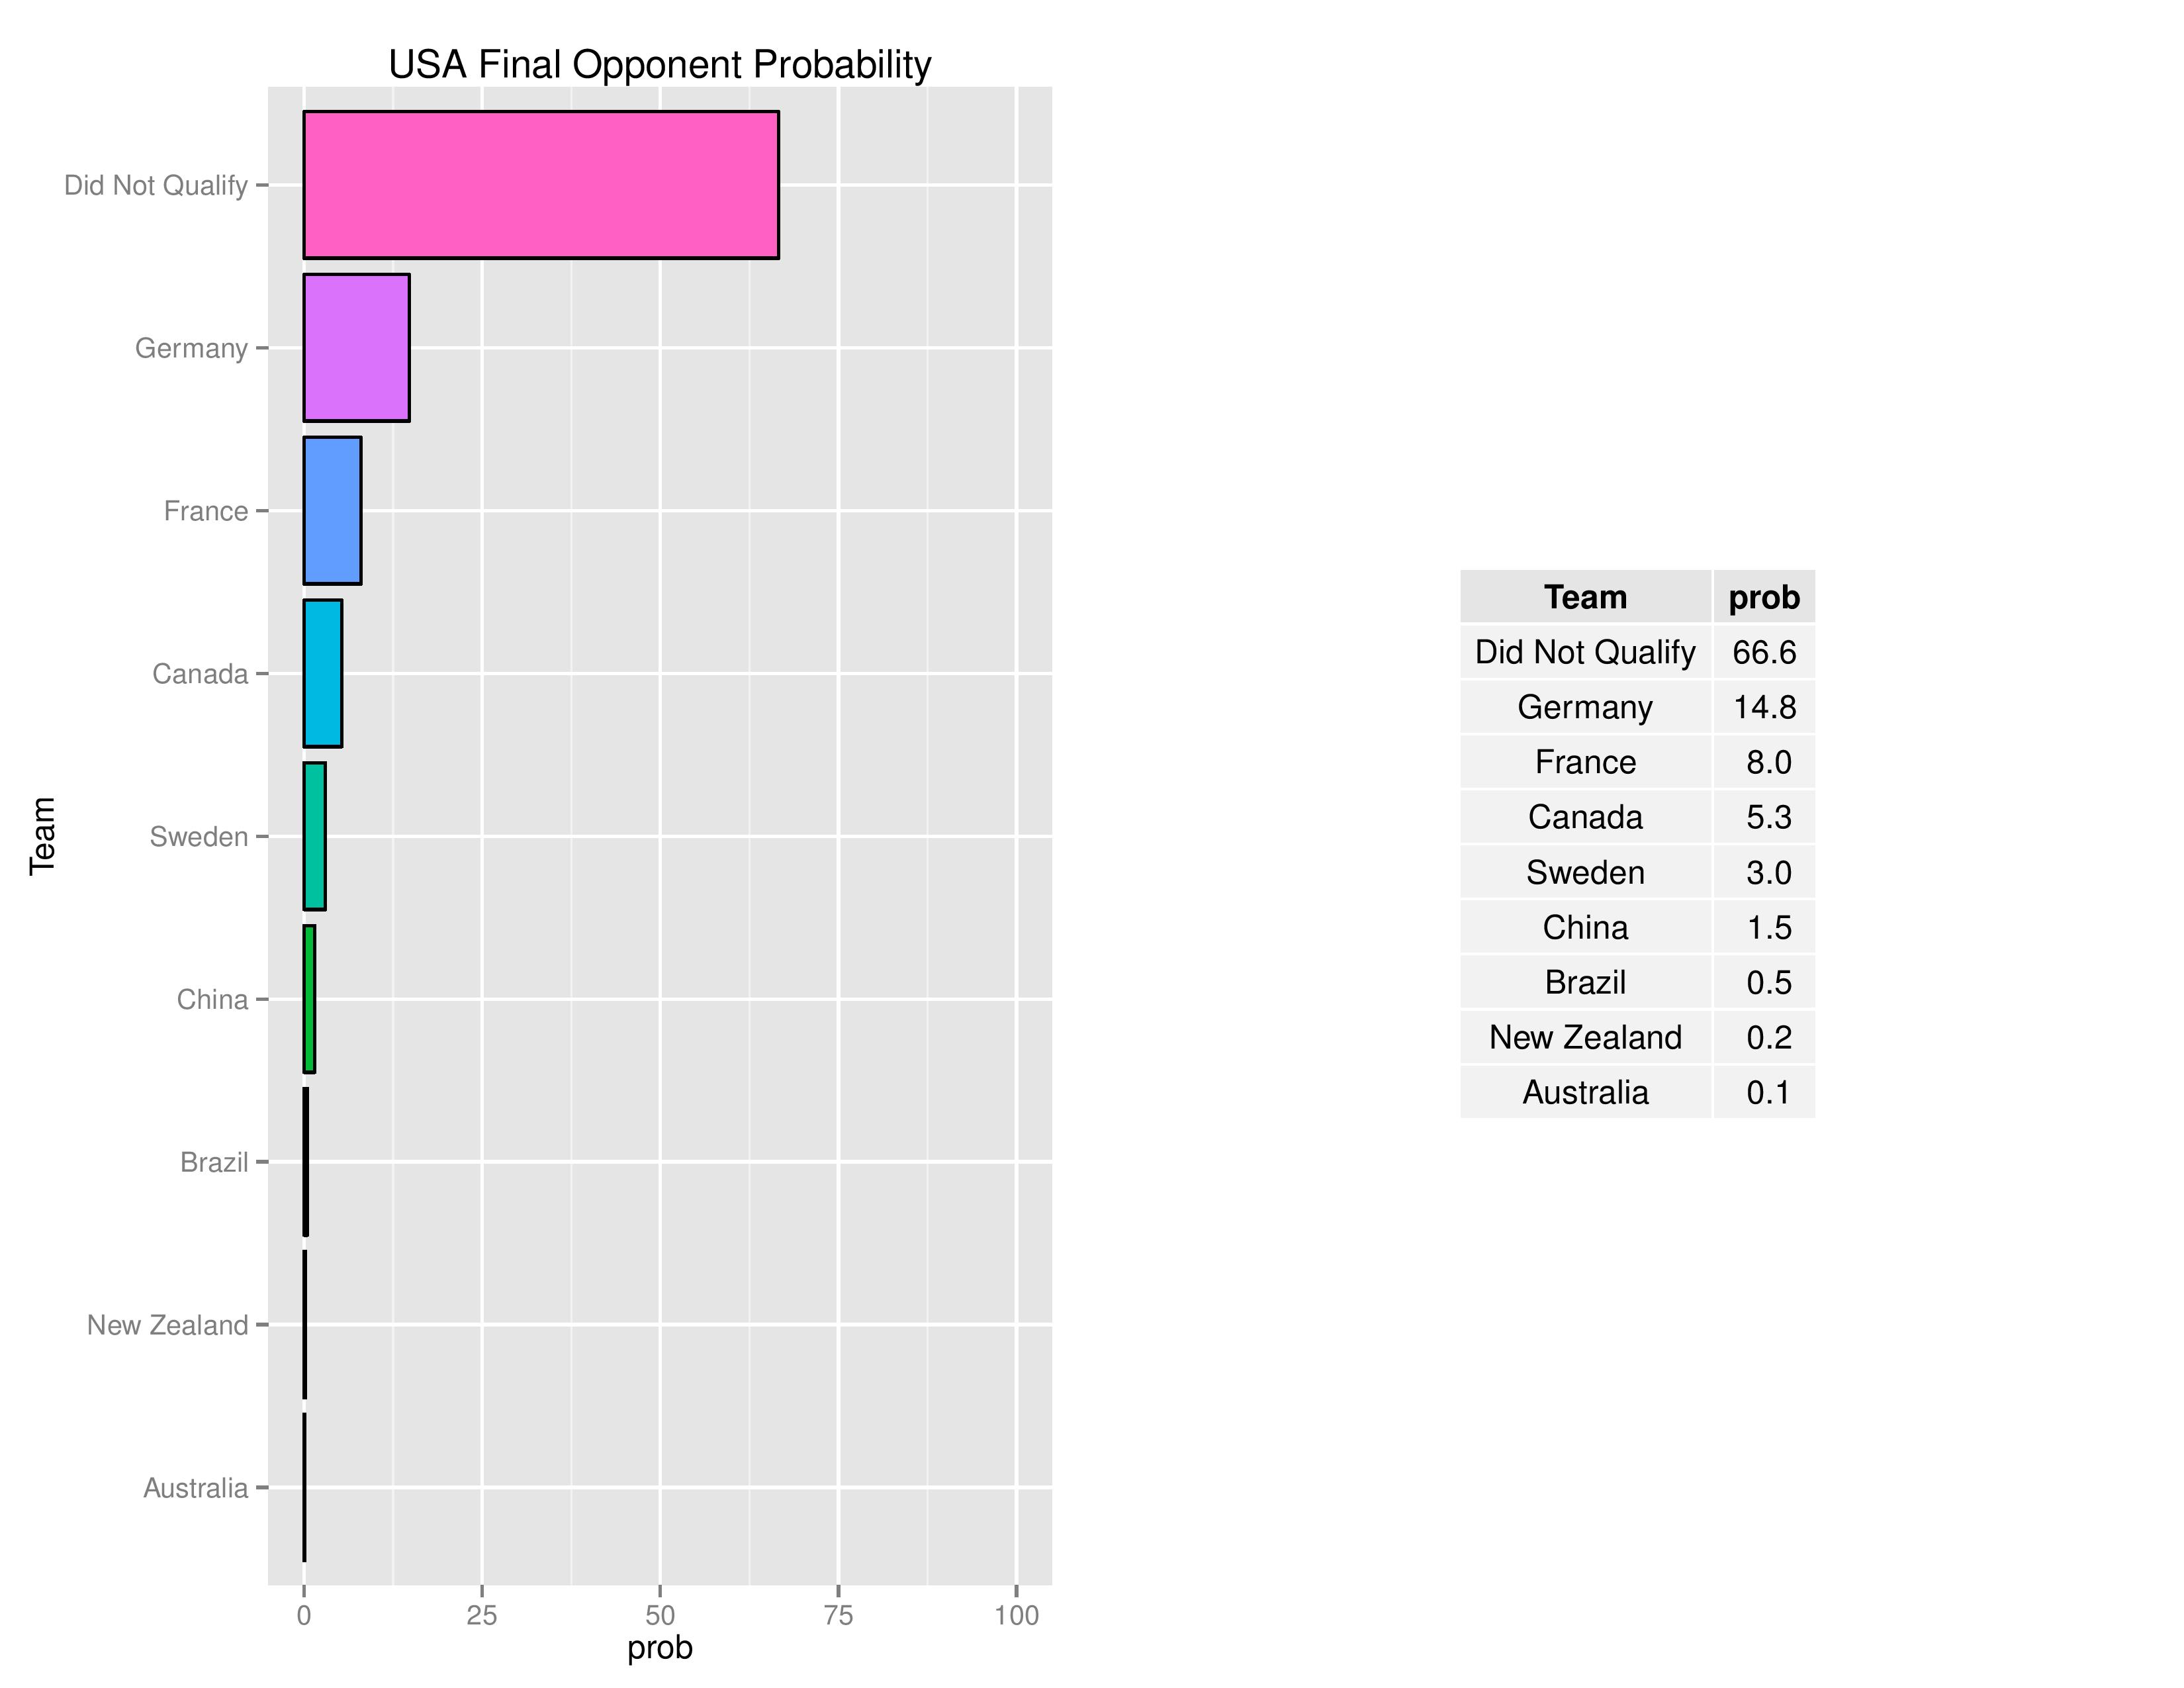
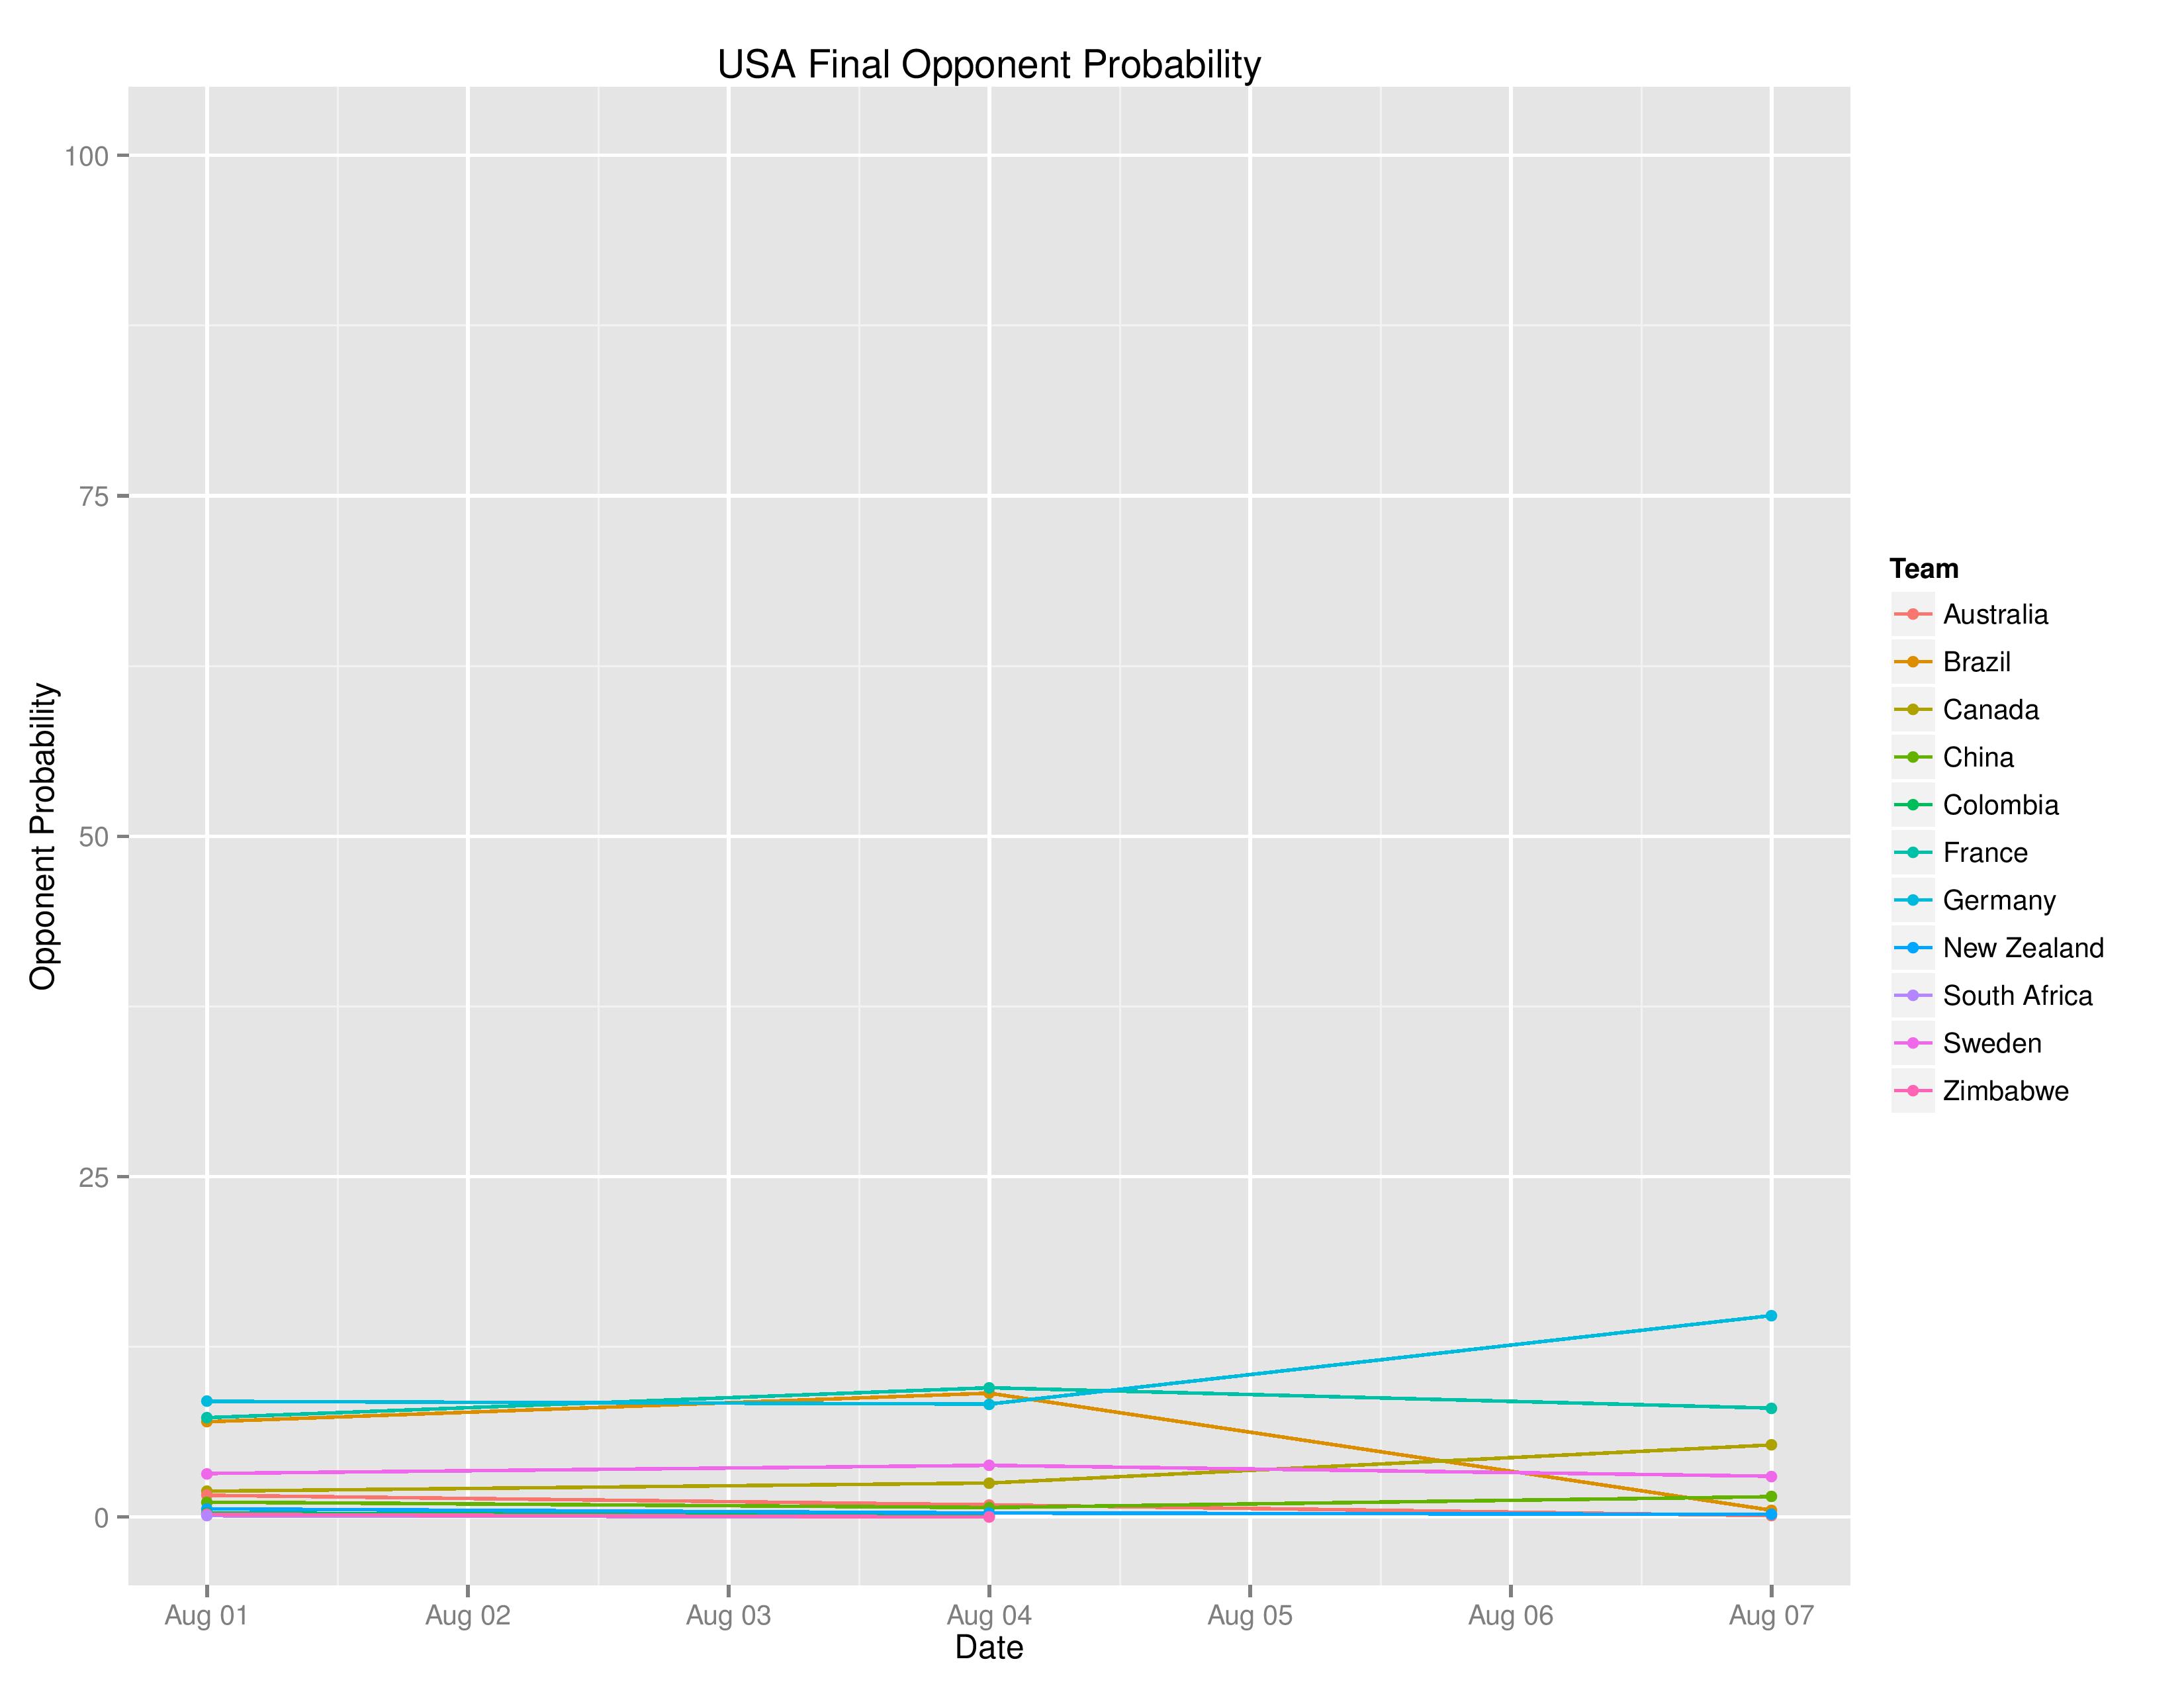
The USWNT’s probabilities of the final opponent is next:
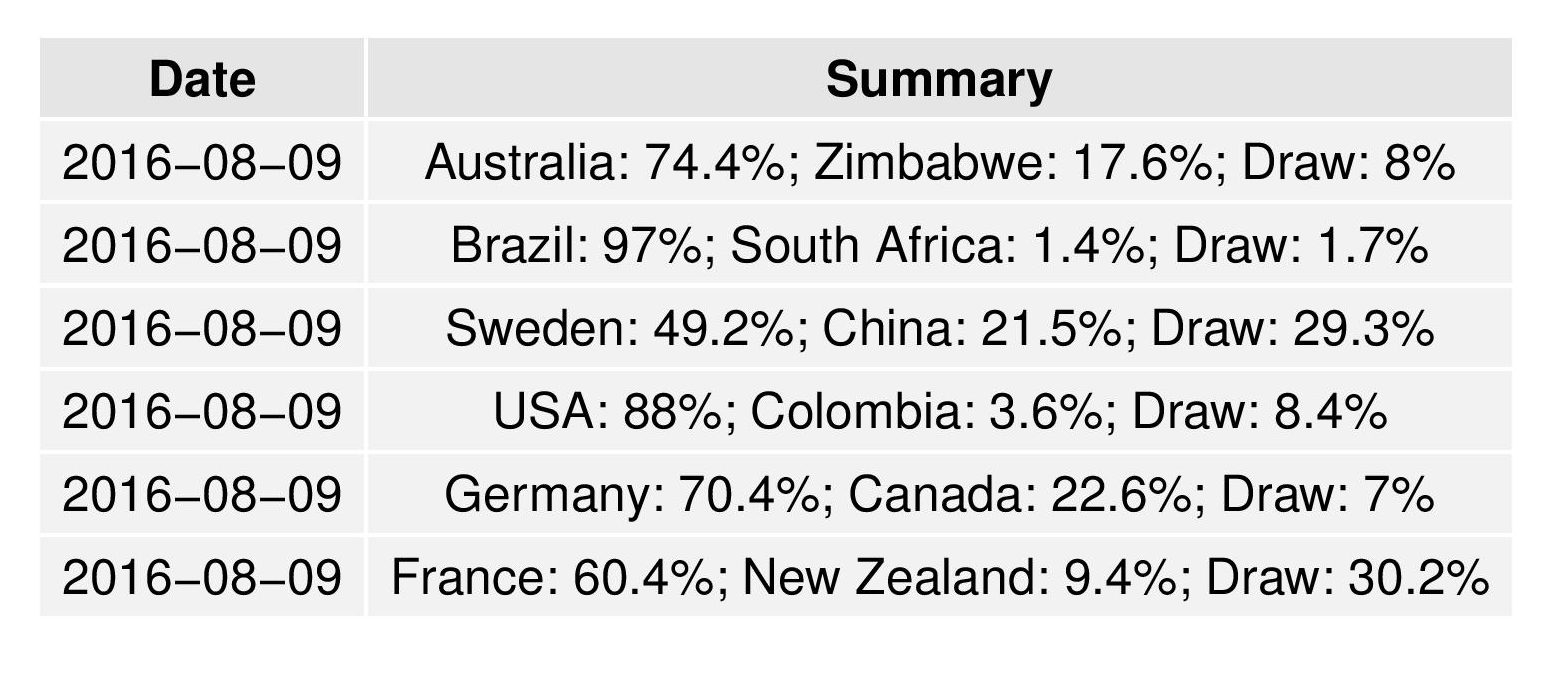
The following shows the upcoming game outcome probabilities:
How the model has changed since Copa America
Other than that this is for Women’s teams, of course, as the base methodologies are the same between Men’s and Women’s competitions.
A key difficulty with assessing national teams’ current form is in properly addressing teams which do not play a large variety of teams (and especially in confederations which do not play outside of their confederation often). Any model, without additional guidance, will treat teams as ‘average’ unless it is certain they are not. When a team from a weak confederations consistently gets wins against weak teams and does not compete against strong teams, the model will unfairly promote them as stronger than they likely are, even more so if those weak teams they beat up on also do not test against strong teams.
FIFA World Rankings tries to account for this by arbitrarily assigning a penalty to some confederations in all their match results. To me, this is a ludicrous practice, as this assumes that all teams from a weaker confederation are weaker merely for their geographic location. This unfairly punishes Big Fish in a Small Pond (like the USMNT and Mexico) and unfairly rewards Small Fish in a Big Pond. If the USMNT or Mexico defeats the top ten European teams in the world, they would still receive less credit than if a similarly-ranked European team did the same.
When I did the Copa America forecasts, I attempted to correct for these small-market-assessments by, instead, placing additional weights on matches where the teams play each other less frequently. While this helped with the desired result of having AFC and other isolated teams decline in the overall rankings, I do believe it was a mistake to instruct the model to place greater certainty on match-ups between teams that play each other less often. Soccer allows for a lot of chance to be involved, so to suggest that a single match-up could be worth the same weight as the summation of a more-frequent match-up (say USMNT vs. Mexico) is to falsely suggest that chance has little effect.
In this model, instead of changing the weights of less frequent match-ups, I include a national team’s isolation metric (based upon whom they play and whom their opponents play) to be a predictive variable. This is not ideal since teams who play fewer confederation-diverse matches are not inherently less skilled, but I believe it to be both necessary and an acceptable choice for assuming that teams who do not compete abroad tend to be weaker.
In addition, an isolation score is calculated for every match (as opposed to the national teams, in general, as described in the previous paragraphs) the model intends to score to represent the volume of information the model has to draw upon in predicting the outcome. It then uses the magnitude of this match-up-isolation-score to regress the result to the mean (bring the predictions closer to a worldwide average outcome) to reflect the added uncertainty we have with the particular match-up. This should also help to restrict the amount of penalty that the previous paragraph’s model additions add to teams which do not travel abroad. They’ll still be marked as weaker, but we’ll be acknowledging how uncertain we are about their ability.

The one flaw in the above is that Germany should go China/Korea women’s badminton against Canada and play for the tie so they are playing Sweden or China rather than France in the quarters.
That’s true that it might be smart to do tank their last game, but do you really think they will?