Welcome to the Statistical Extrapolation Bayesian Analyzer Projection System, which is, of course, a tortured gathering of words used to form the SEBA Projection System.
The system consists of a model projecting the probabilities of game results and then a barrage of simulations which account for the remaining luck. So the probabilities you see below show, essentially, what the odds are of an outcome if the team continues to play like it has been.
Below are the current season forecasts using data from MLS games through July 17, 2016.
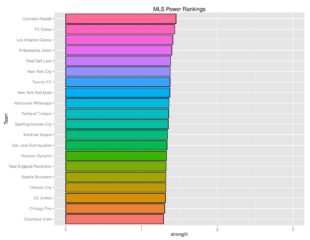
Power Rankings
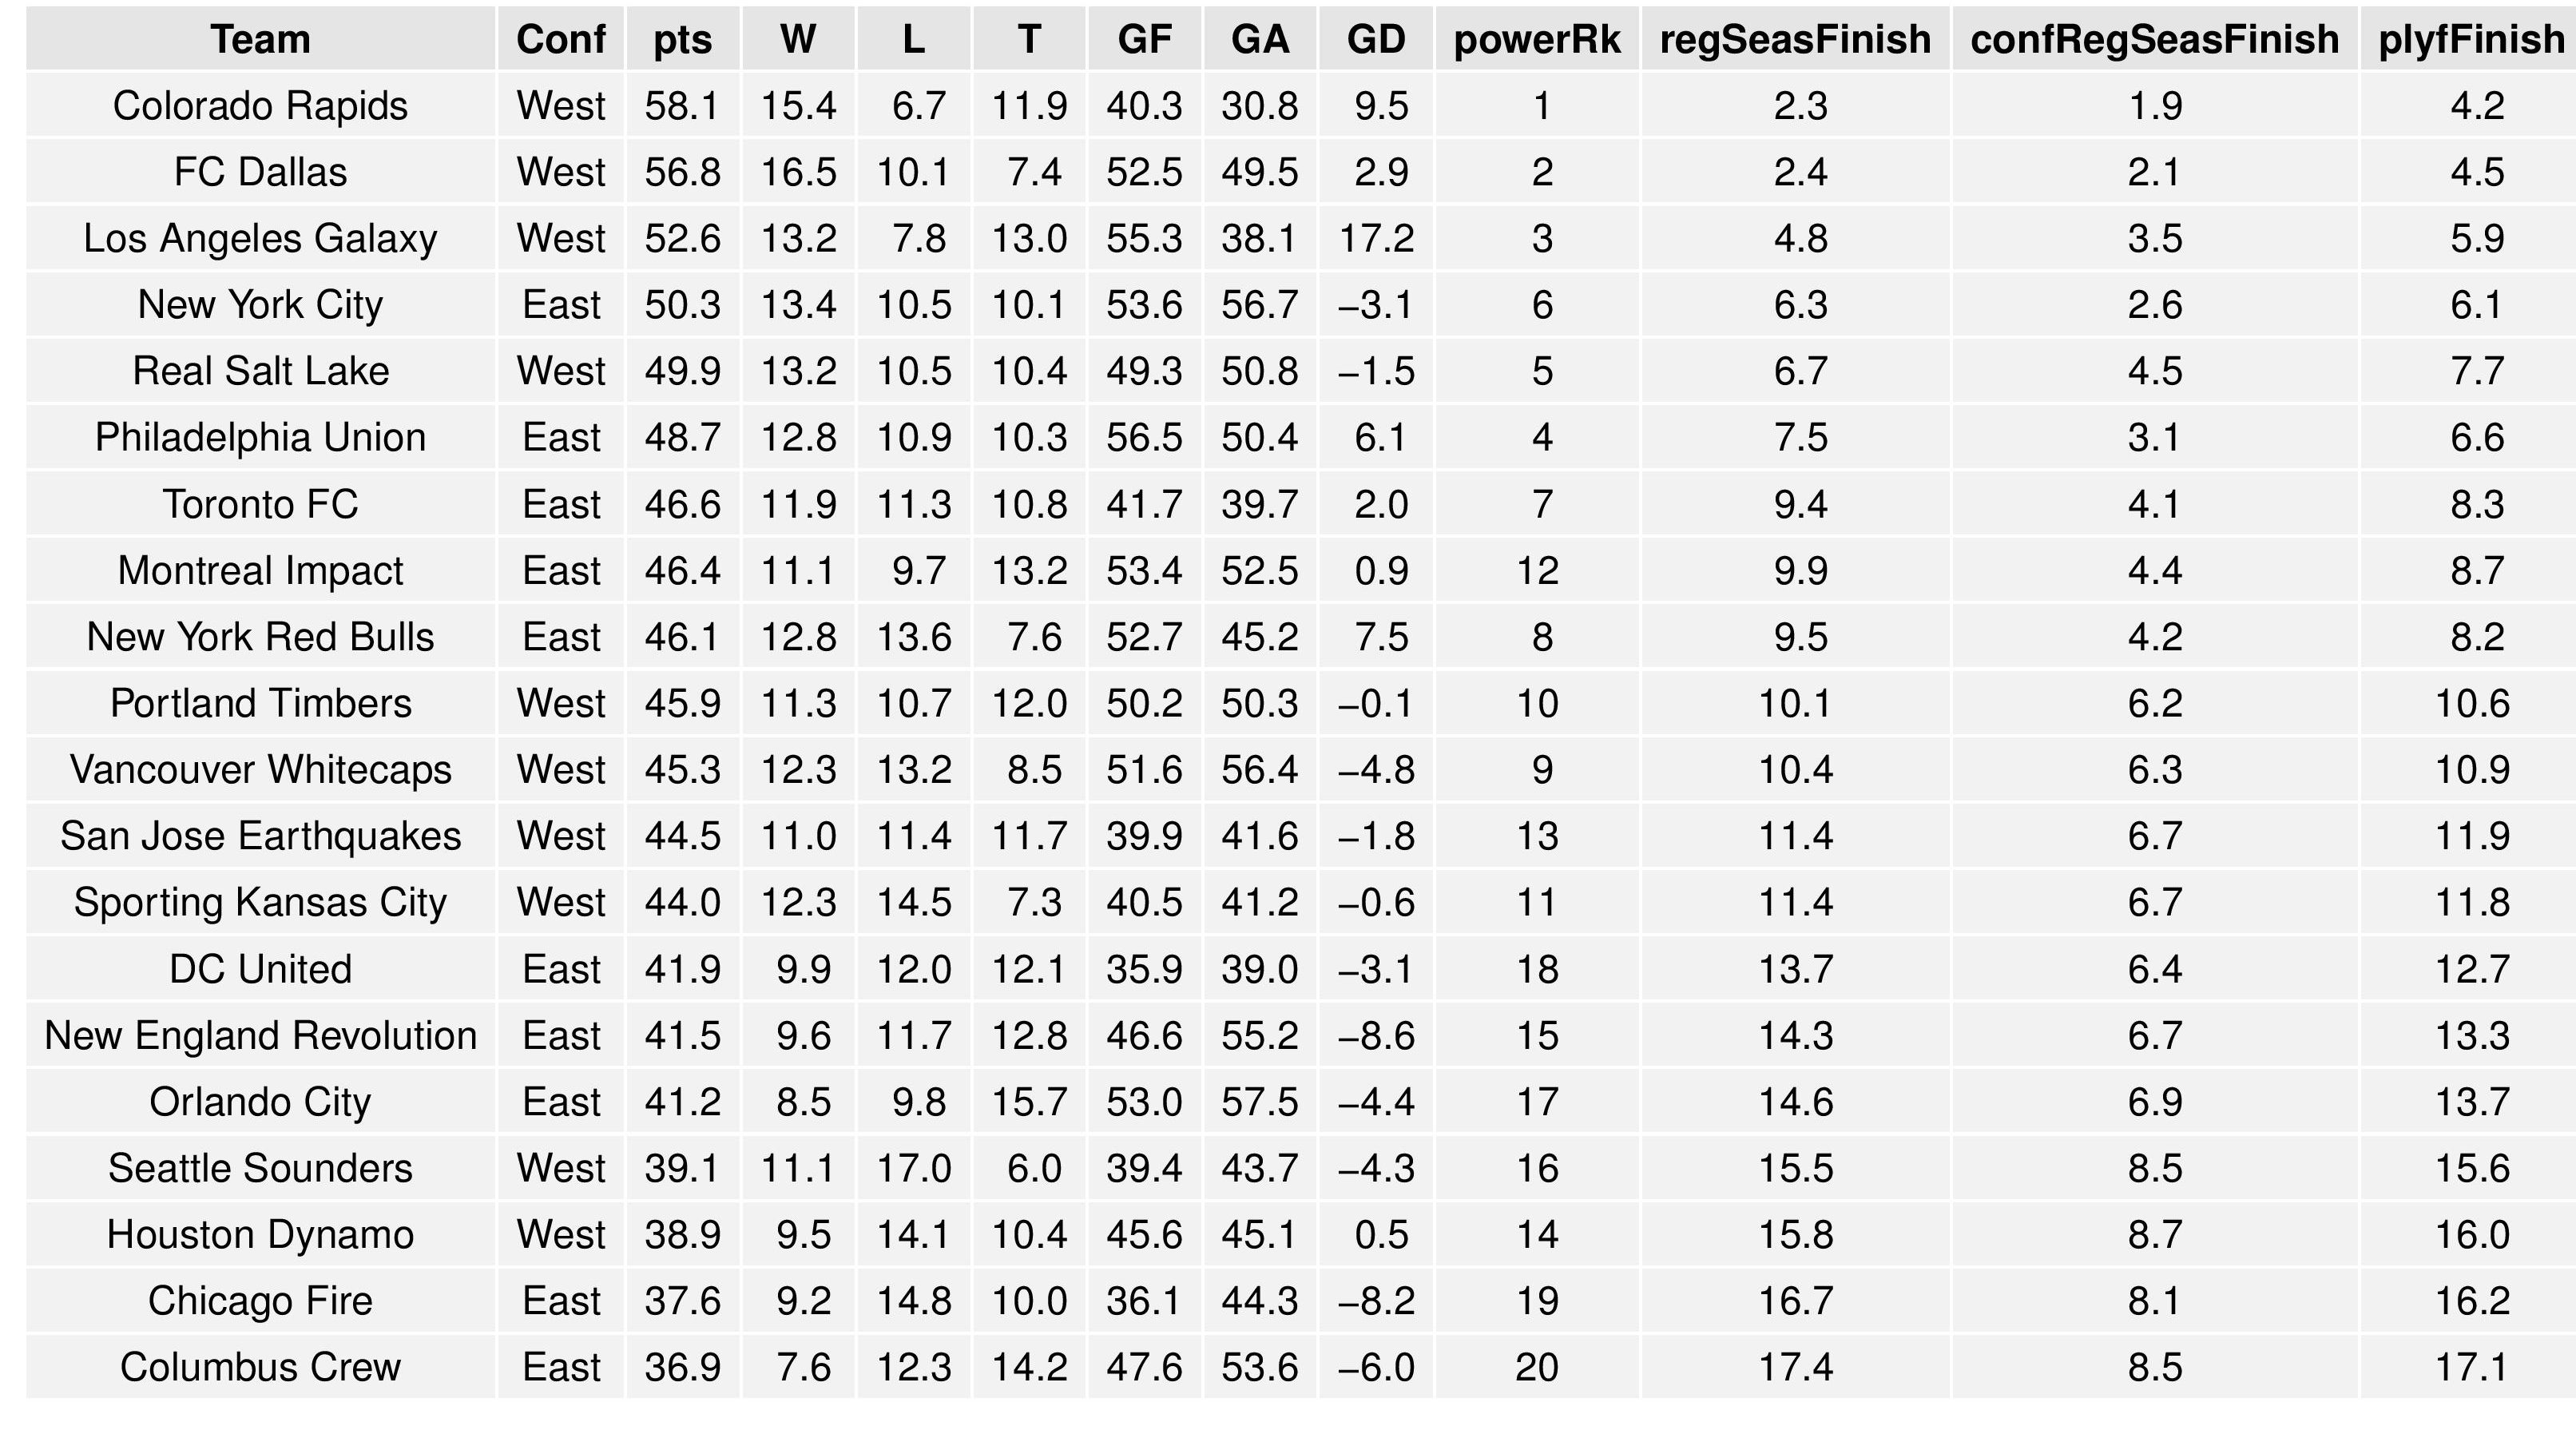
The “Power Rankings” we concoct are the actual “strength” of the team according to competitive expectations. They are computed showing average expected points result if every team in MLS played every team both home and away:

SEBA has the Union moving from No. 3 back to No. 4 this week being overtaken by the Galaxy. ESPN has the Union up 3 spots at No. 7 (2 home wins, a home loss, and a road loss is worth an 8-rank-slide, but a home draw is worth a 3-rank-bump? Consistency isn’t their thing I guess). SI also has them at No. 7. Soccer America has the Union remaining at No. 8.
Playoffs probability and more
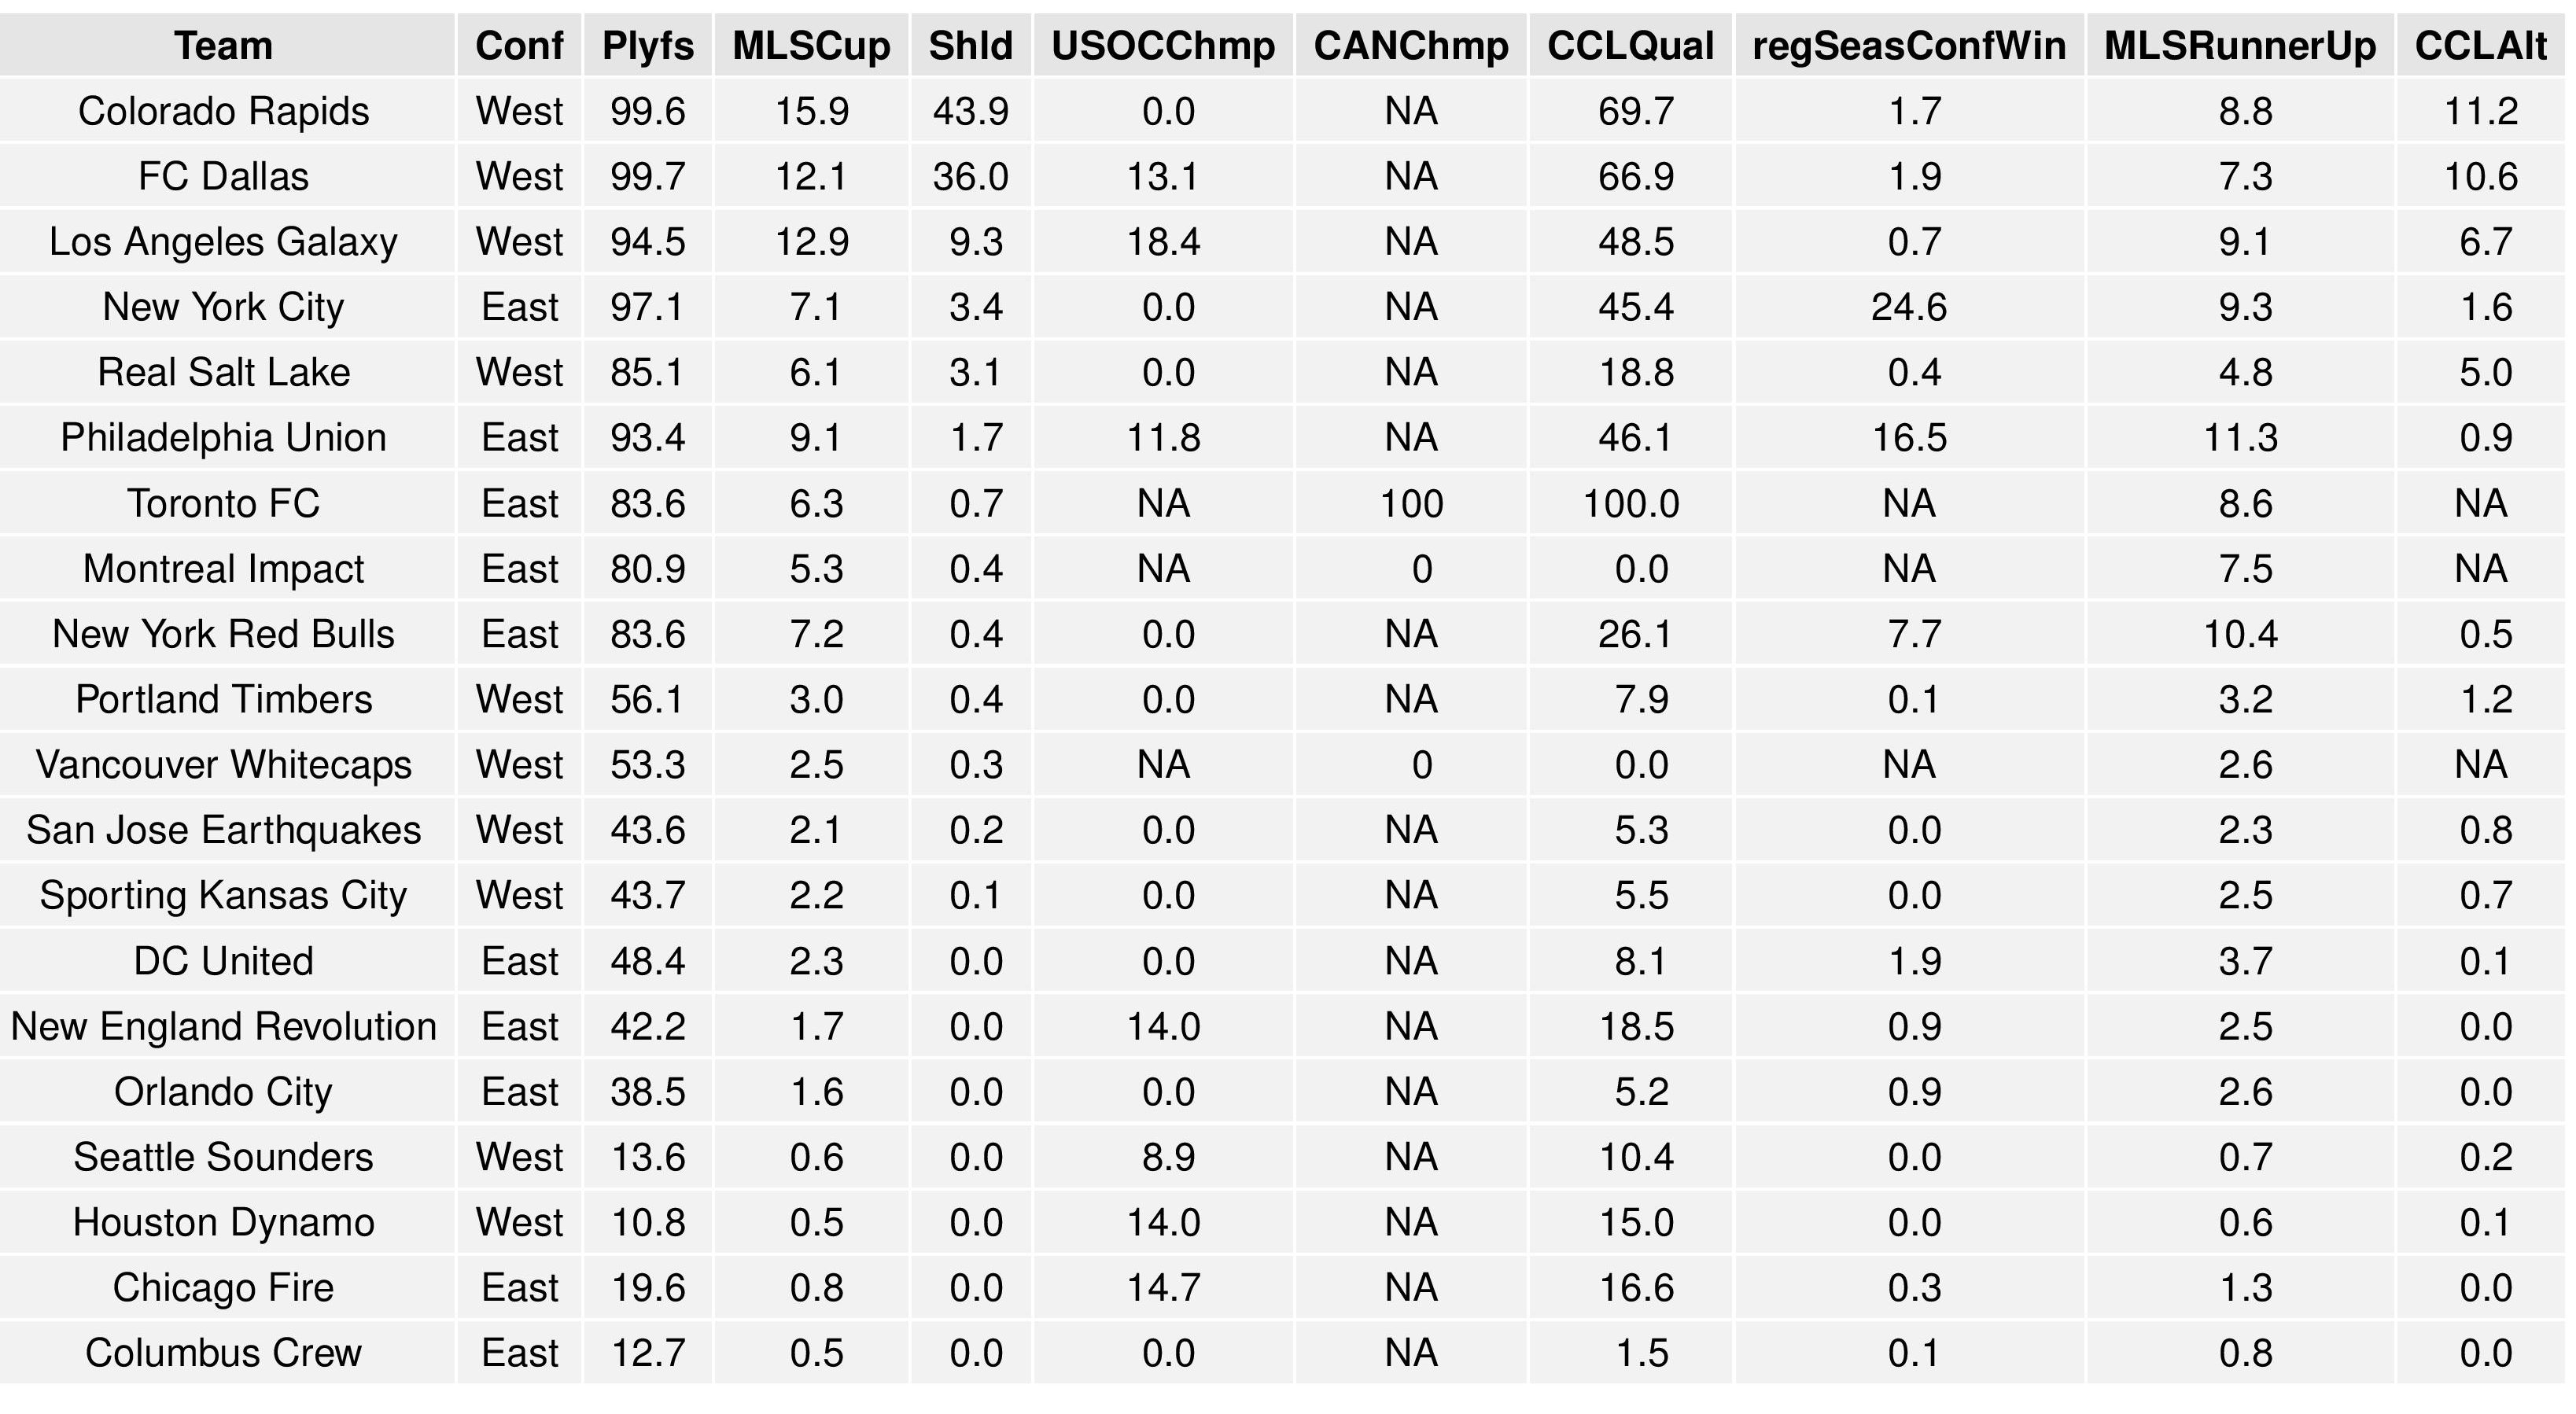
The following charts show the probabilities for making the playoffs, winning the Supporters’ Shield, winning the MLS Cup, winning the USOC Cup, and qualification for CONCACAF Champions League.
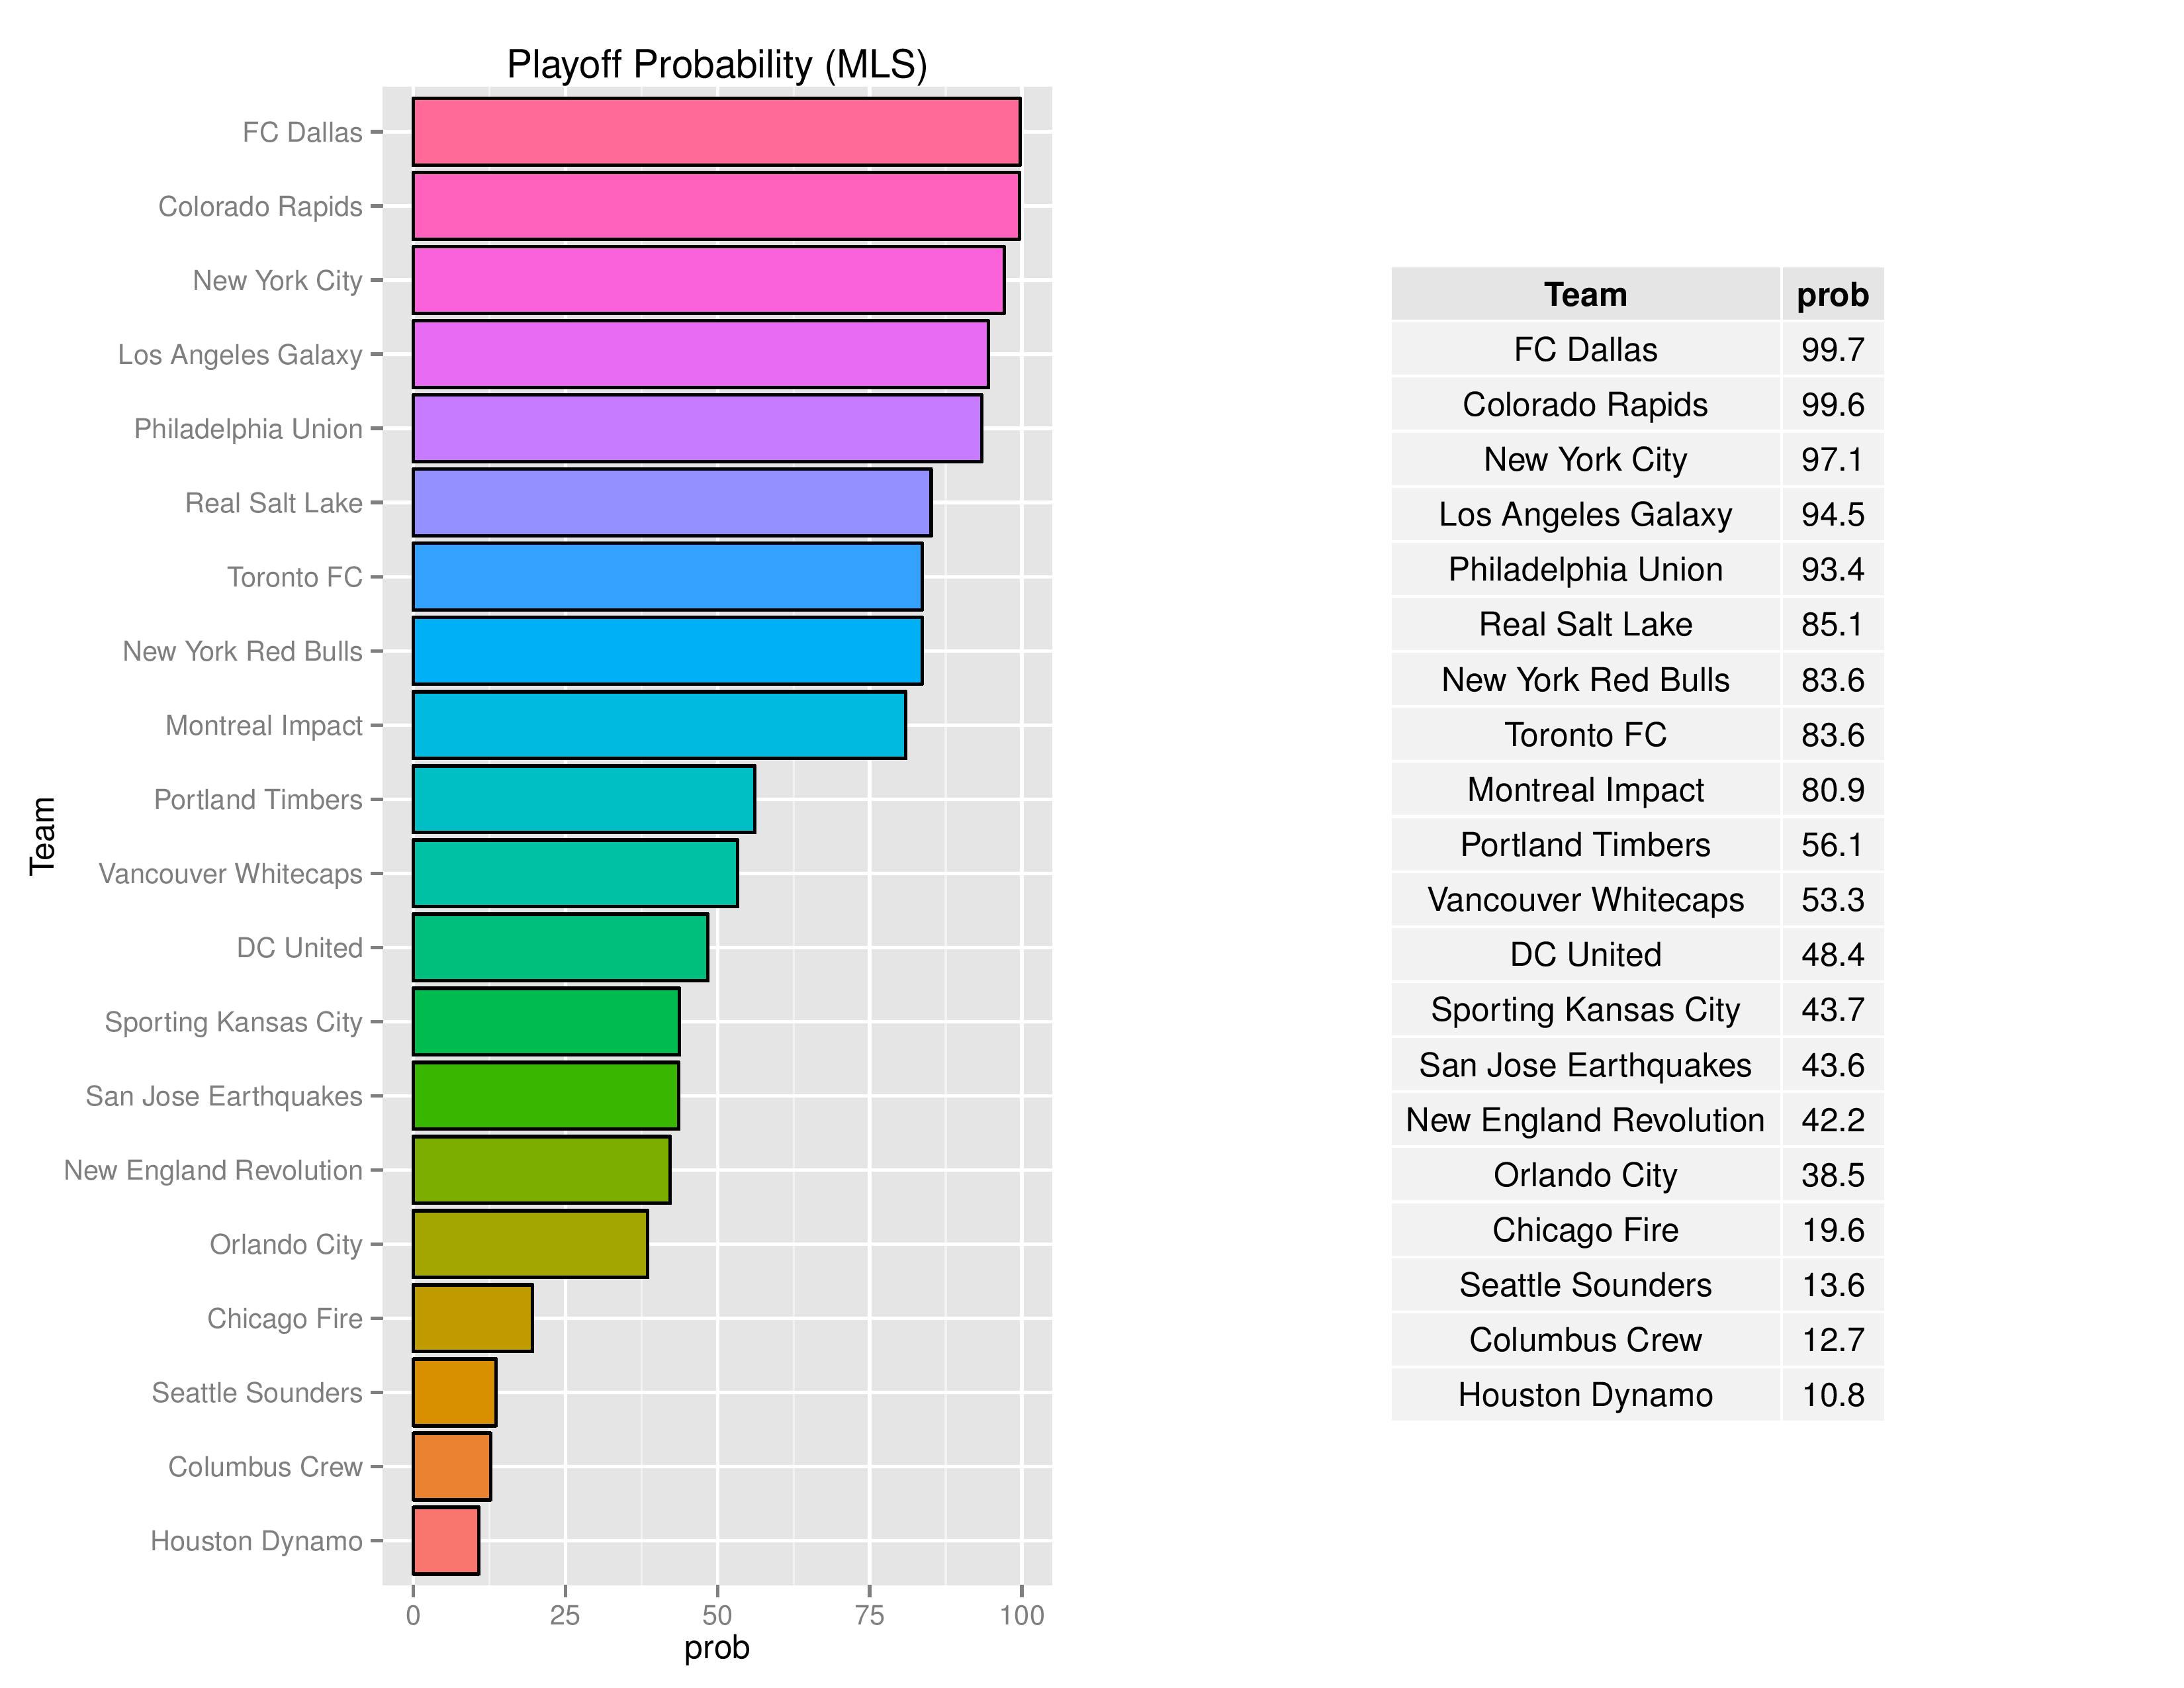
The Union went down slightly to 93.4% from 94.1% last week in their probability of making the playoffs.
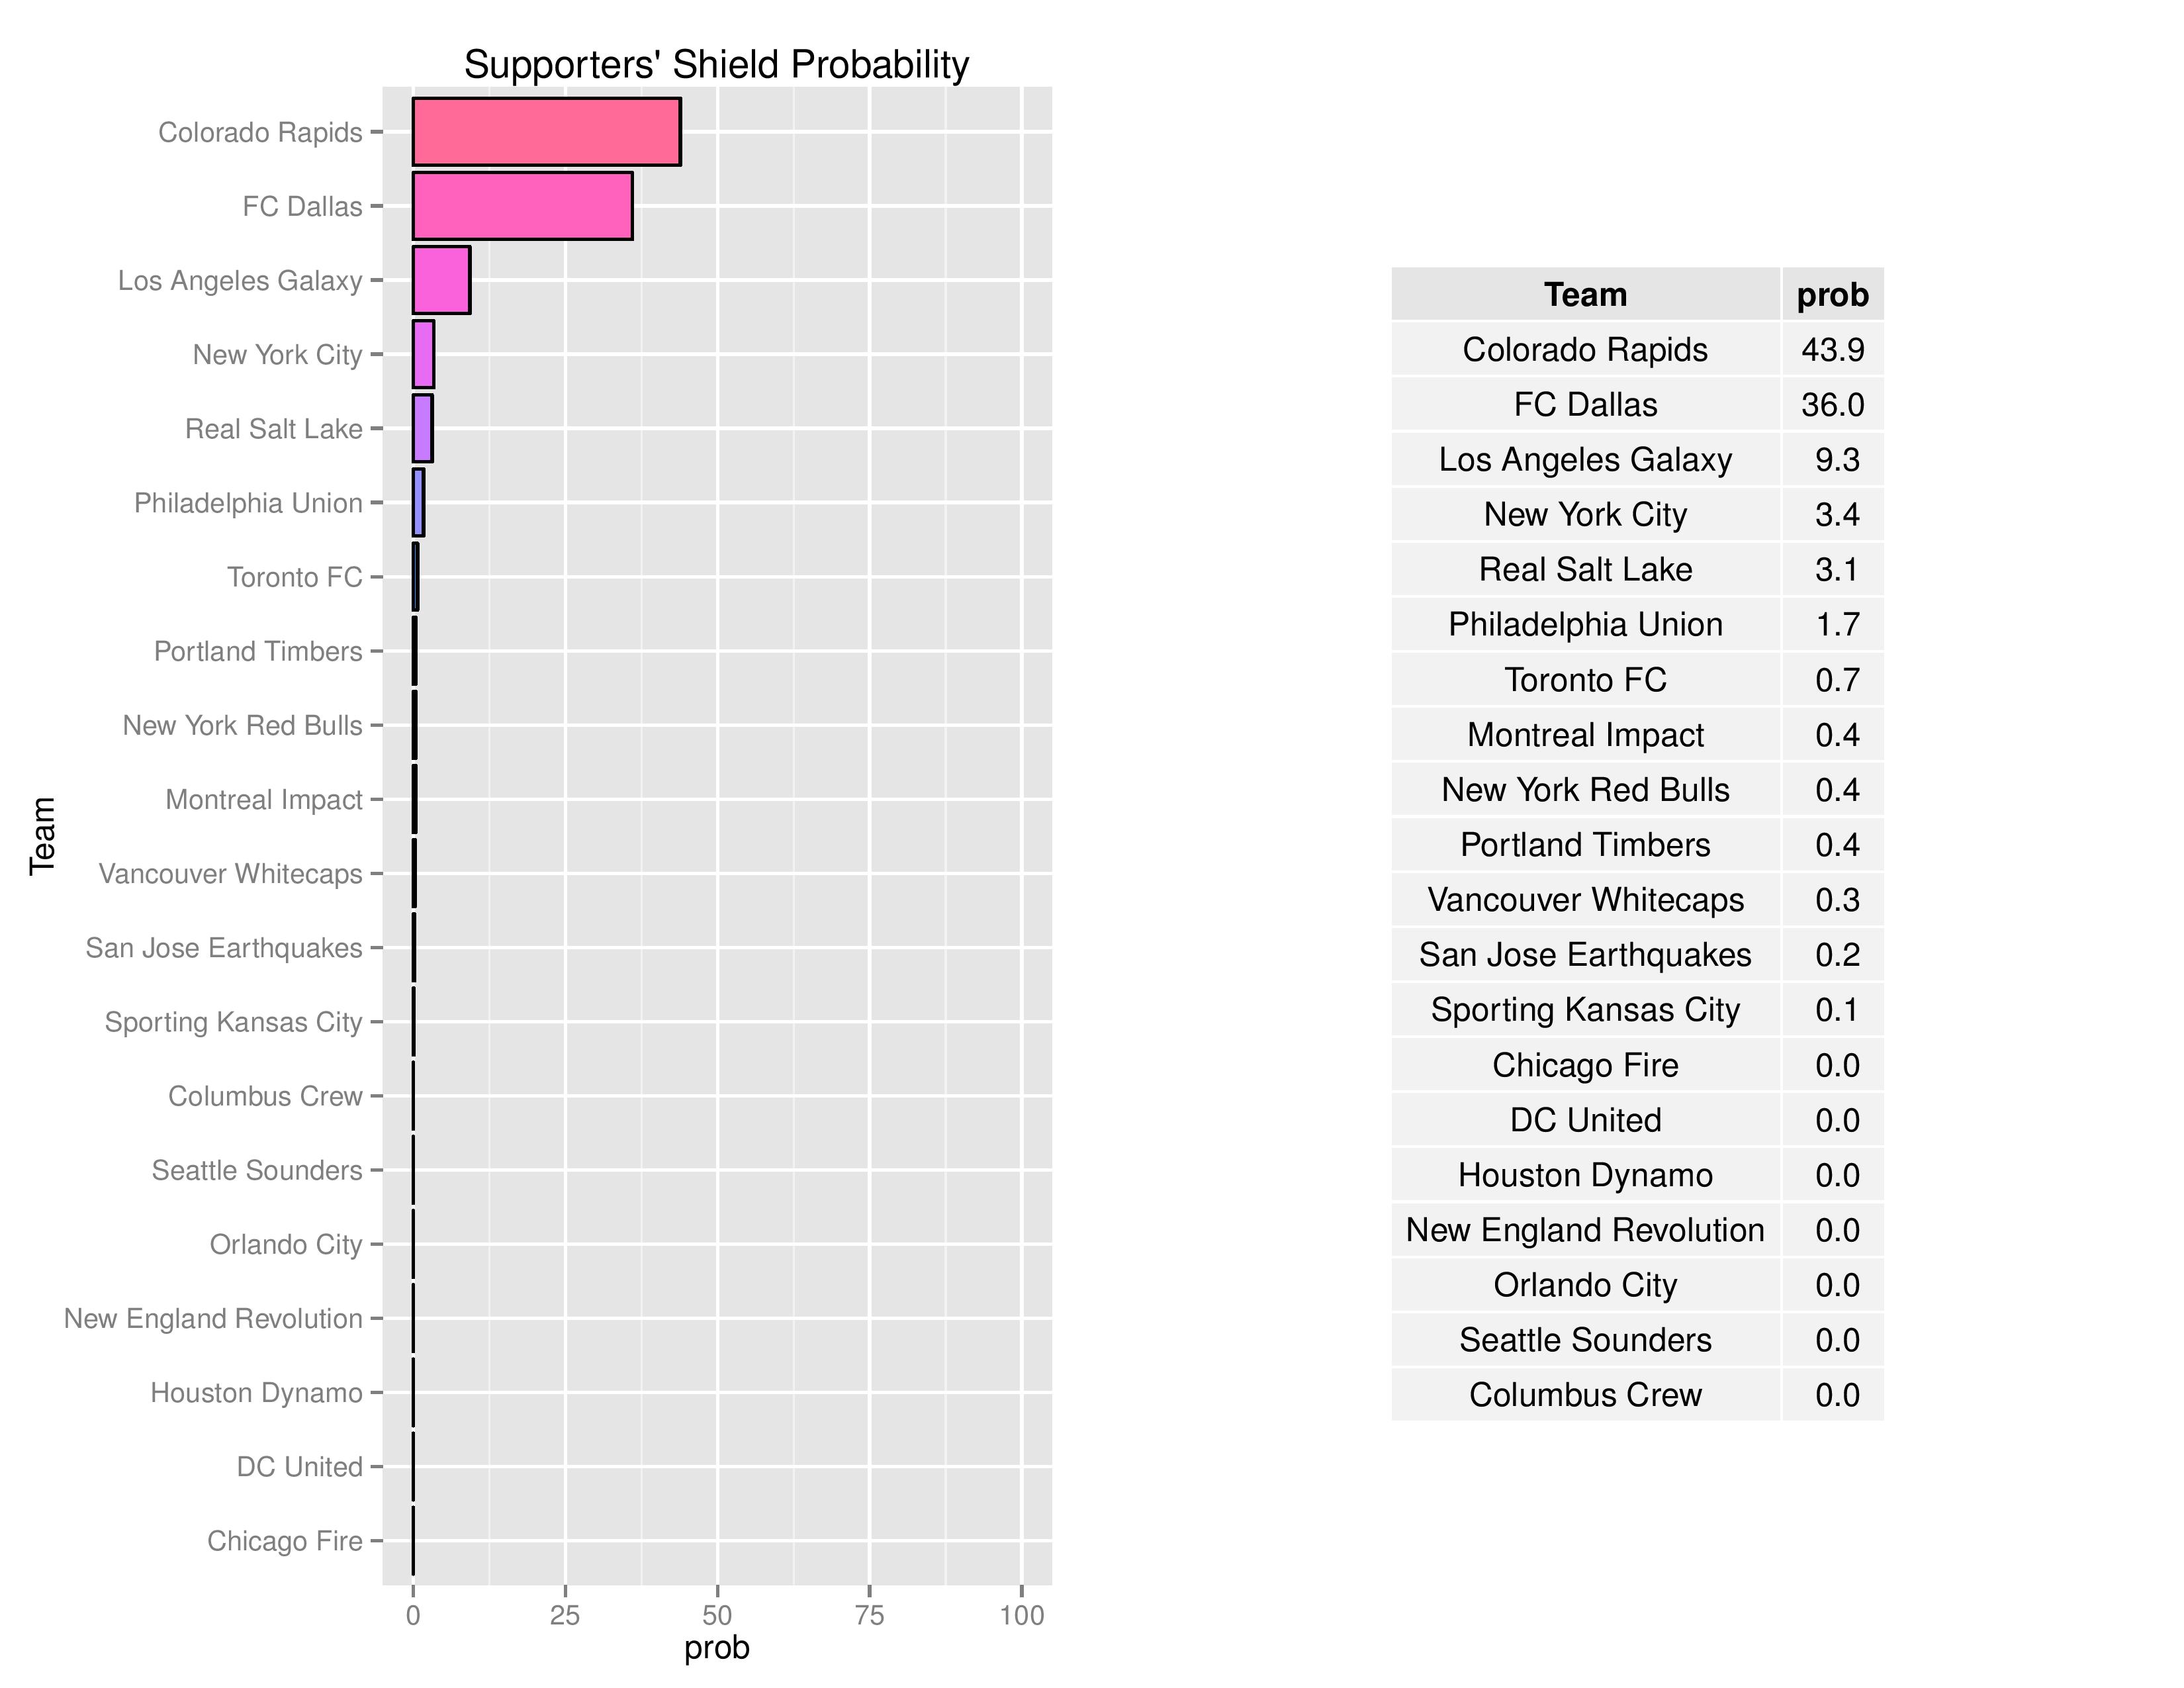
Philadelphia fell back down towards 1.7% from 3.7% in their odds of claiming the Shield.
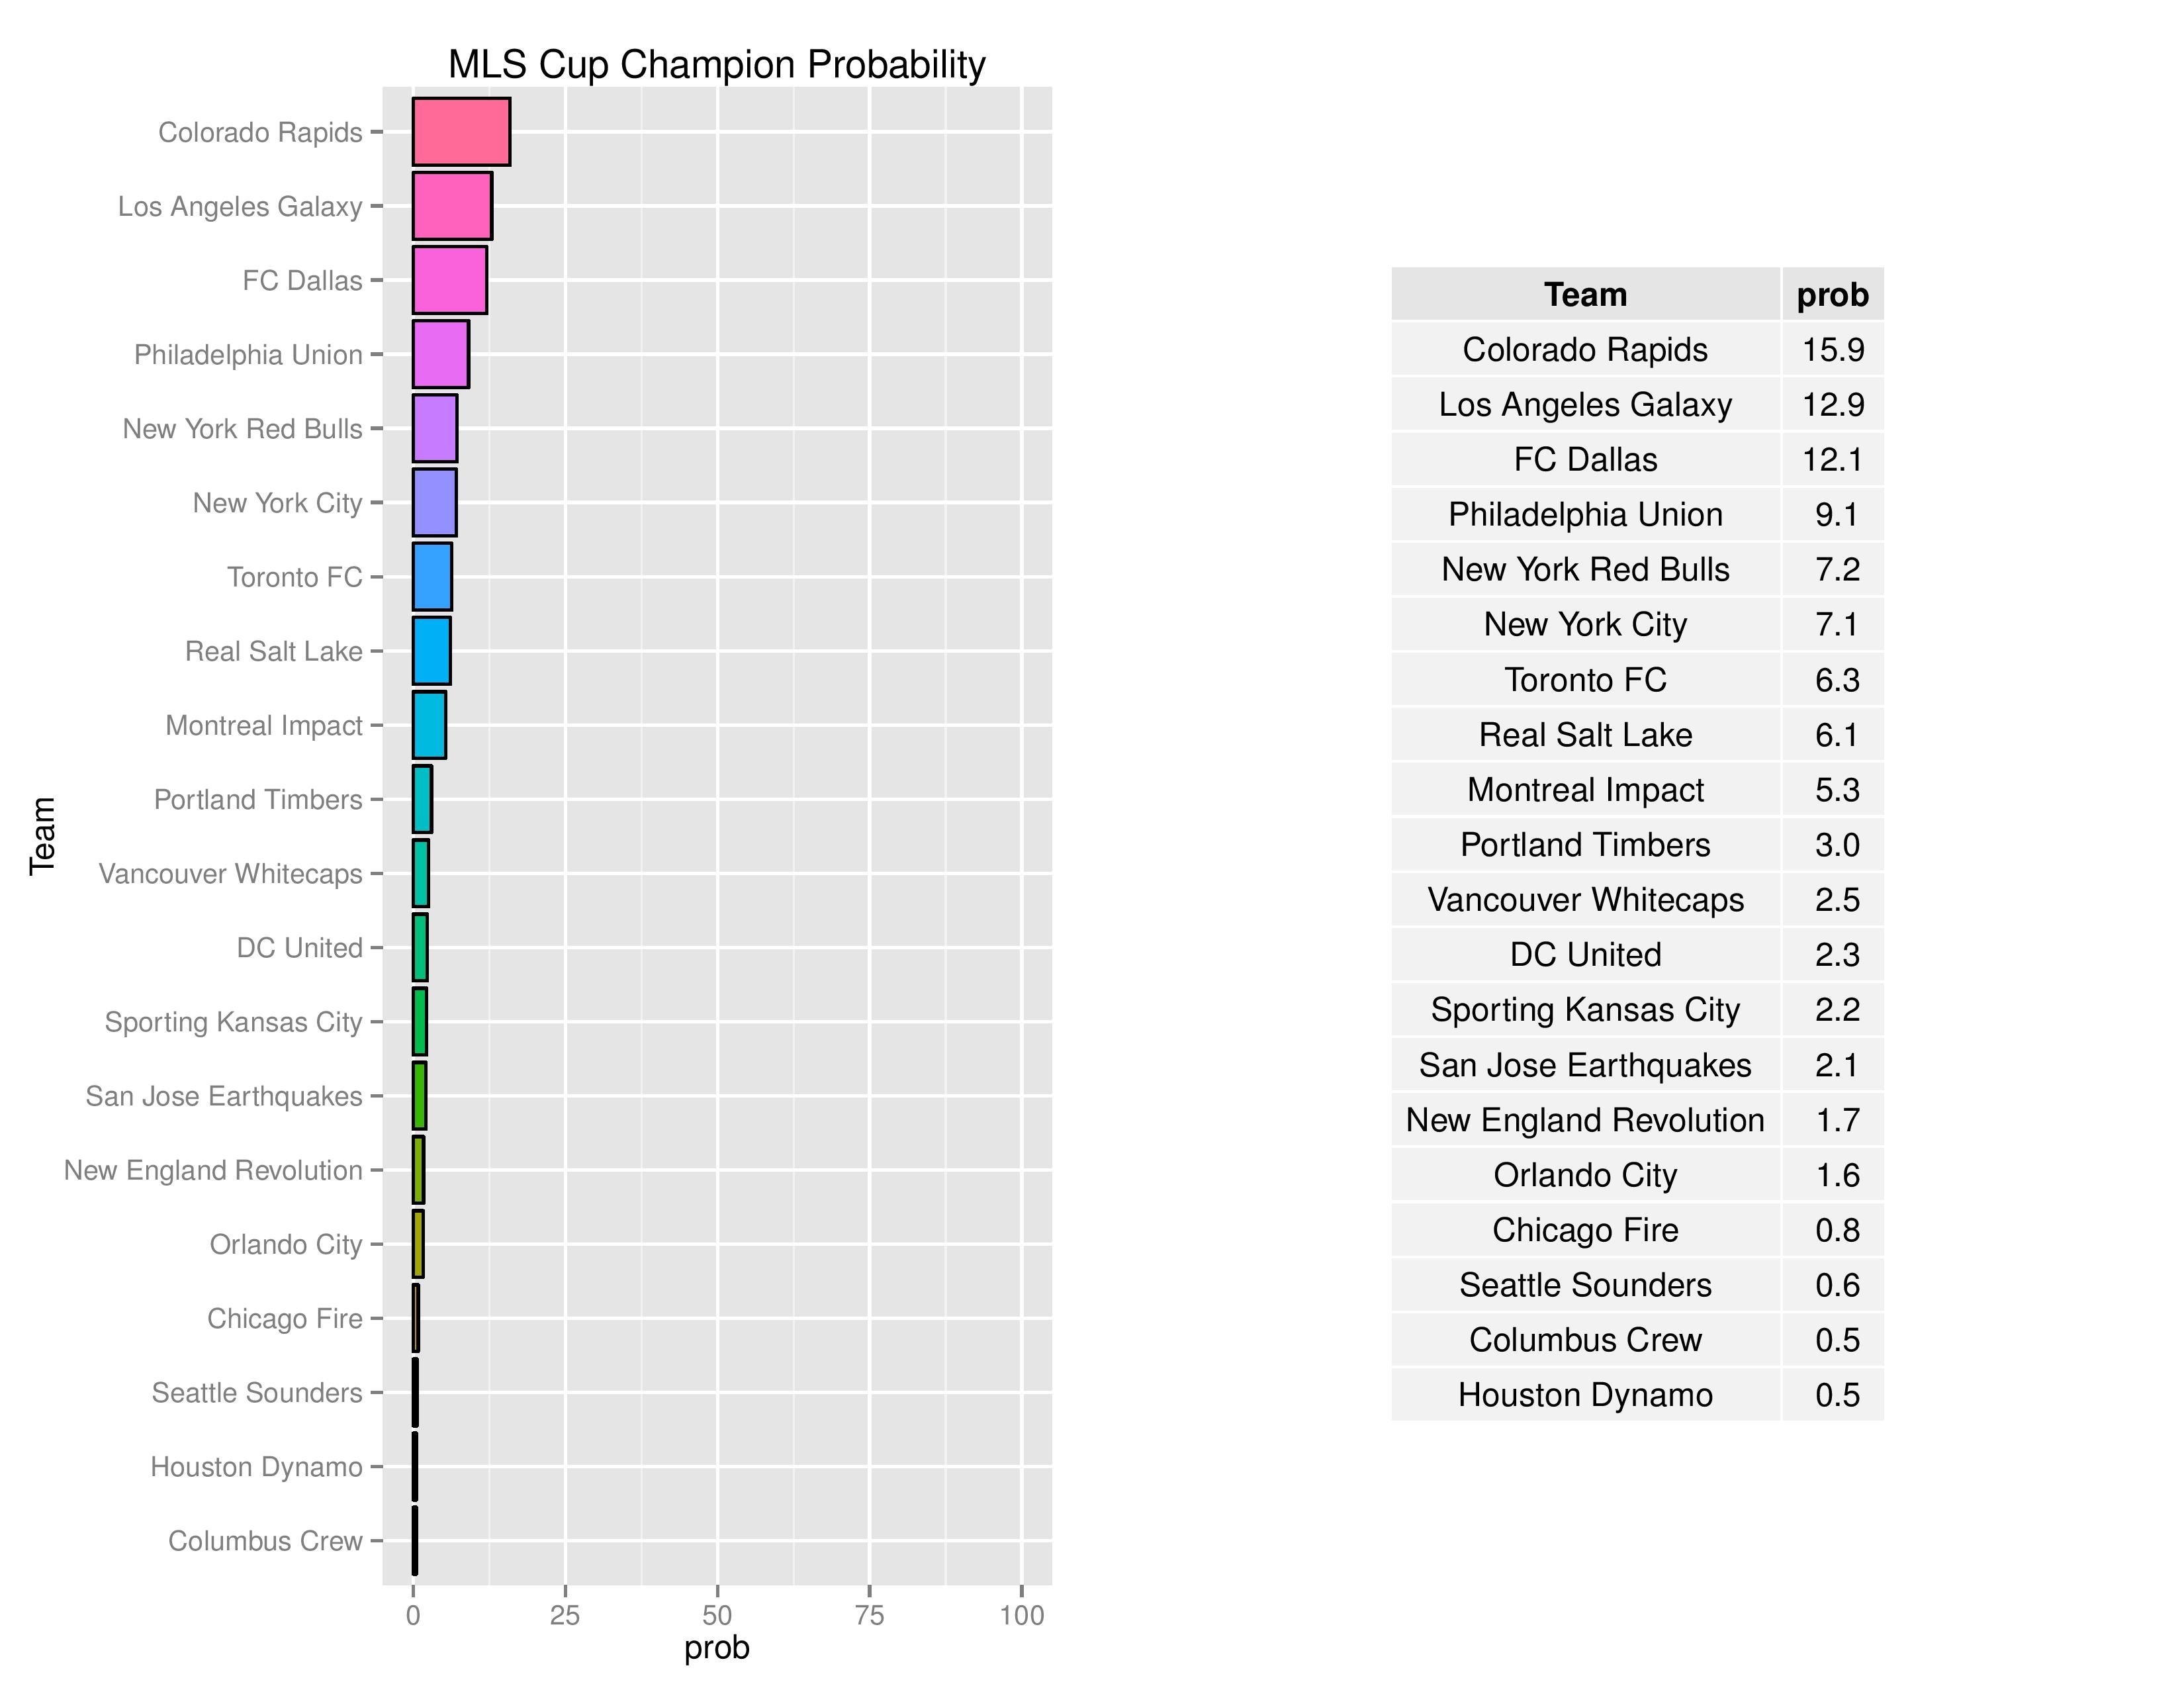
The Union dipped from 9.4% last week to 9.1% in their odds of capturing the MLS Cup.
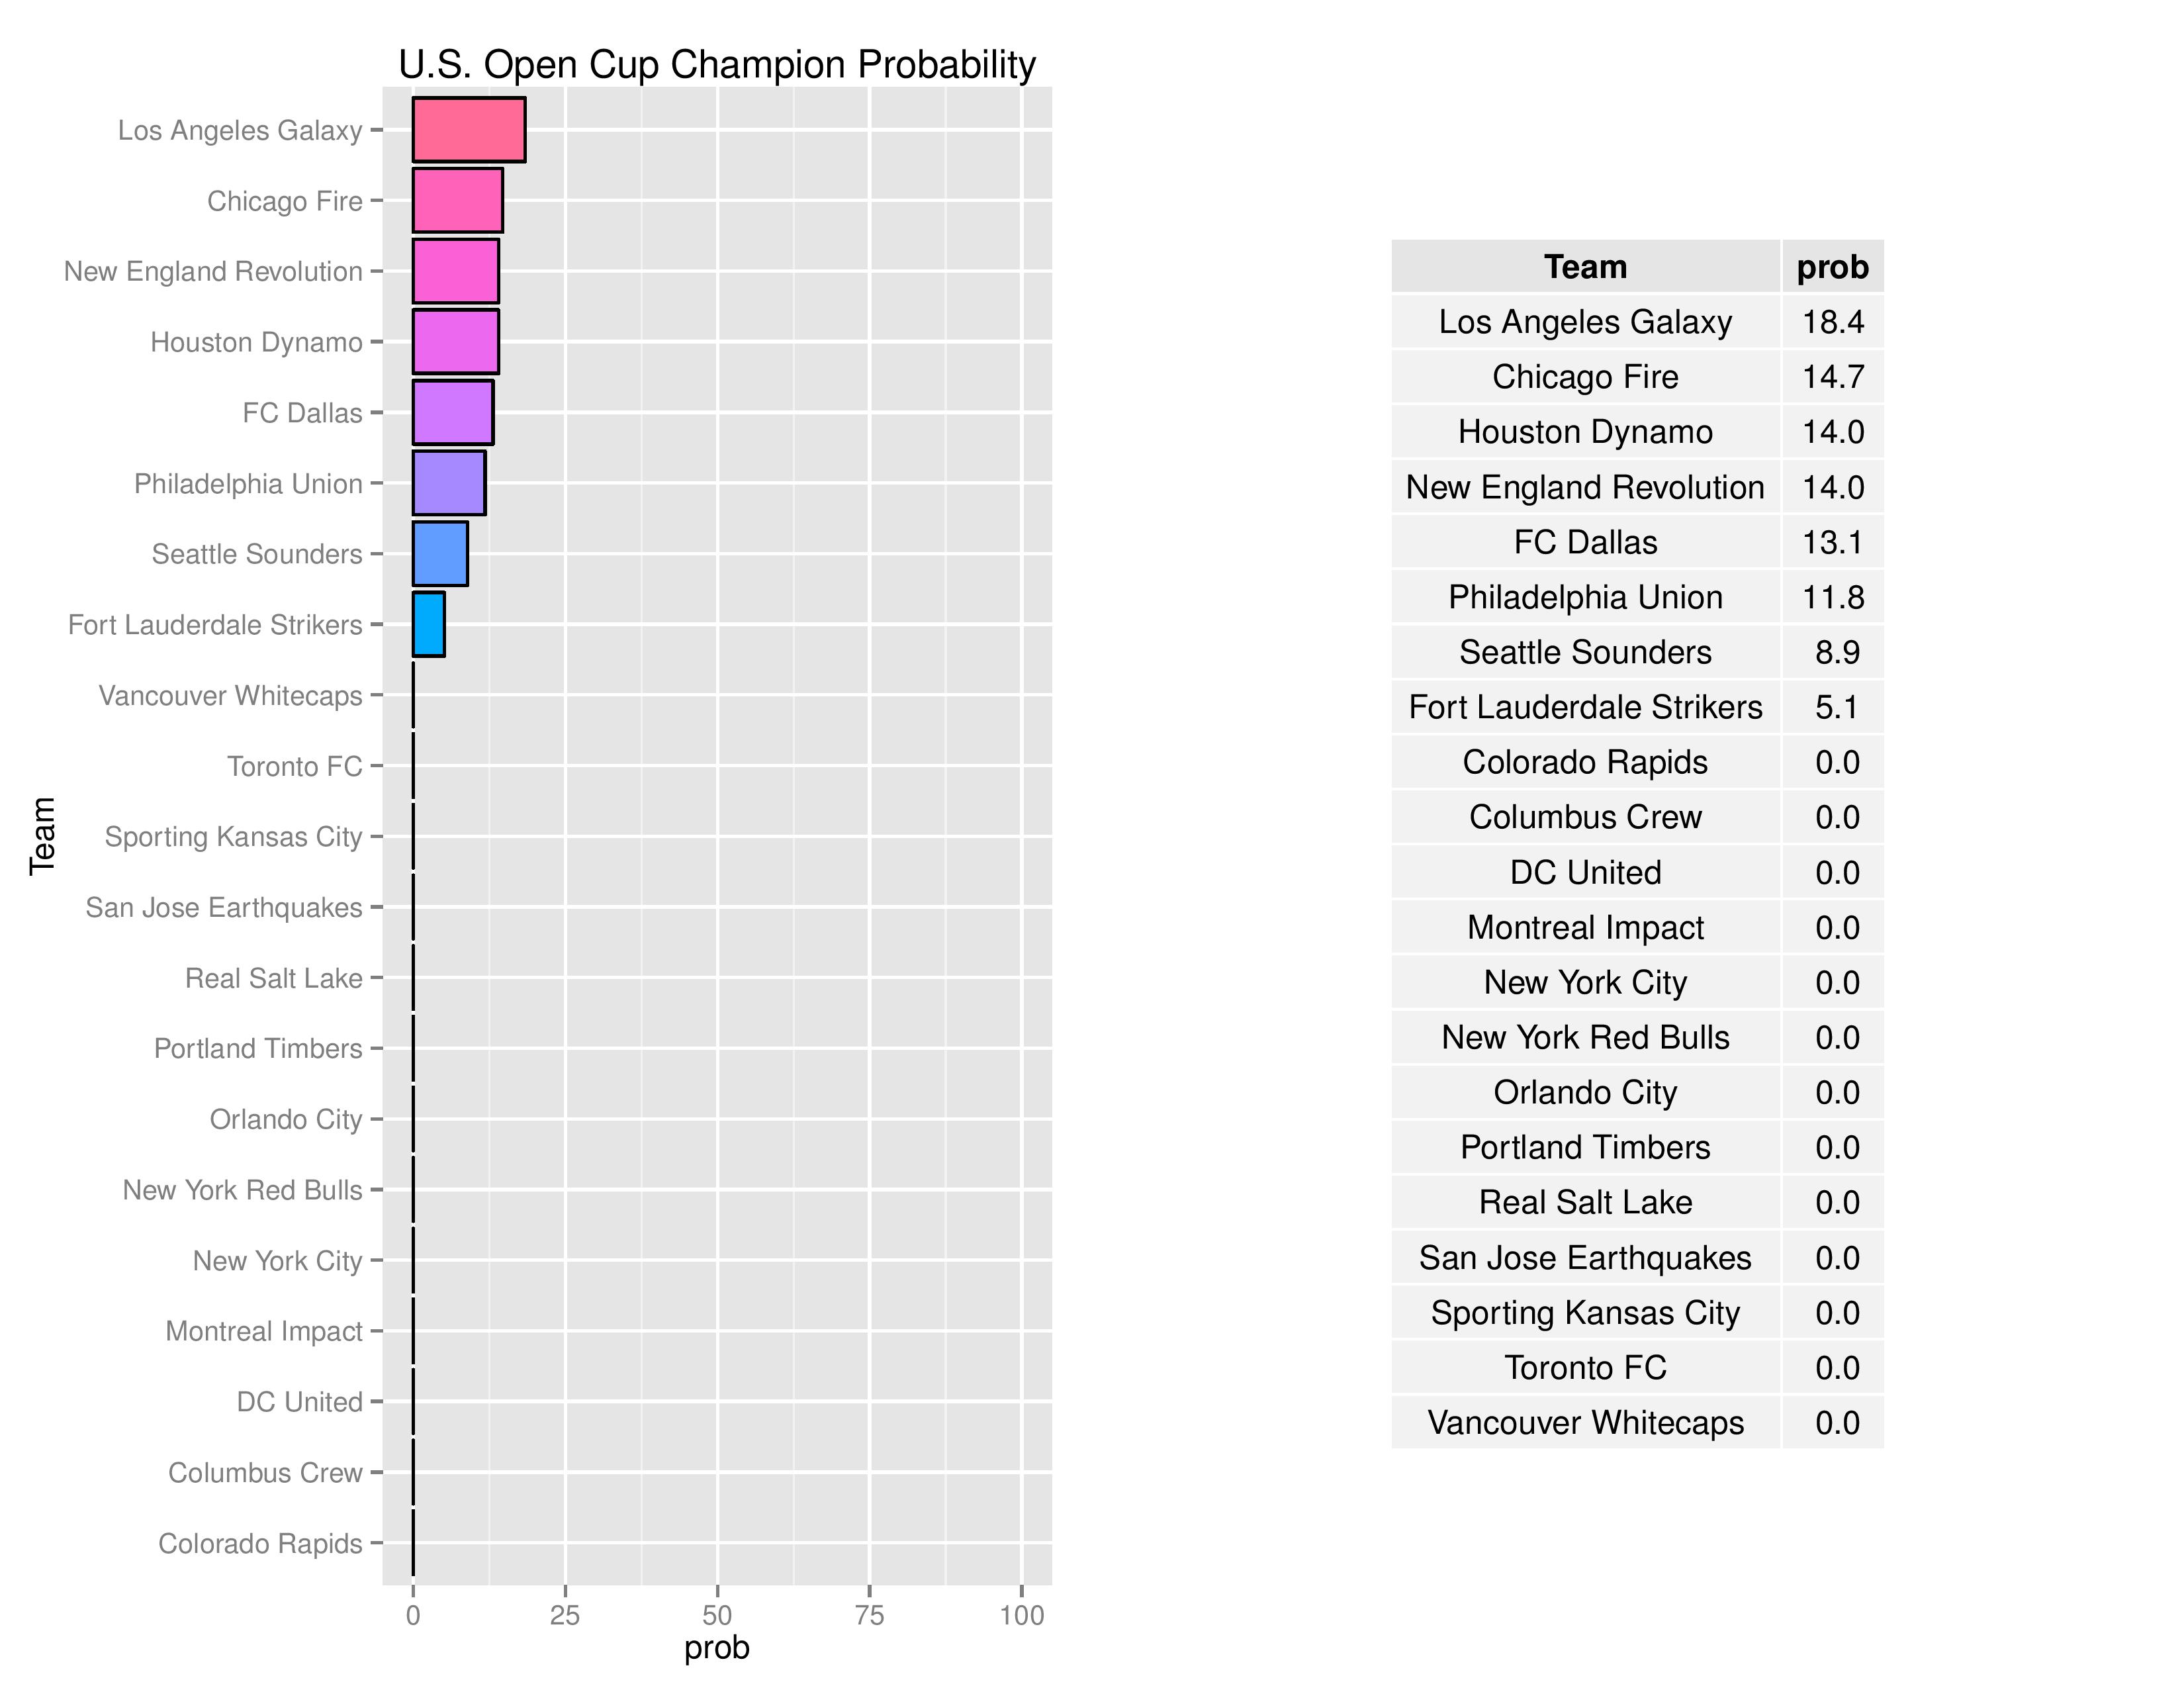
Philadelphia declined from 12.1% to 11.8% in their probability to win the US Open Cup.
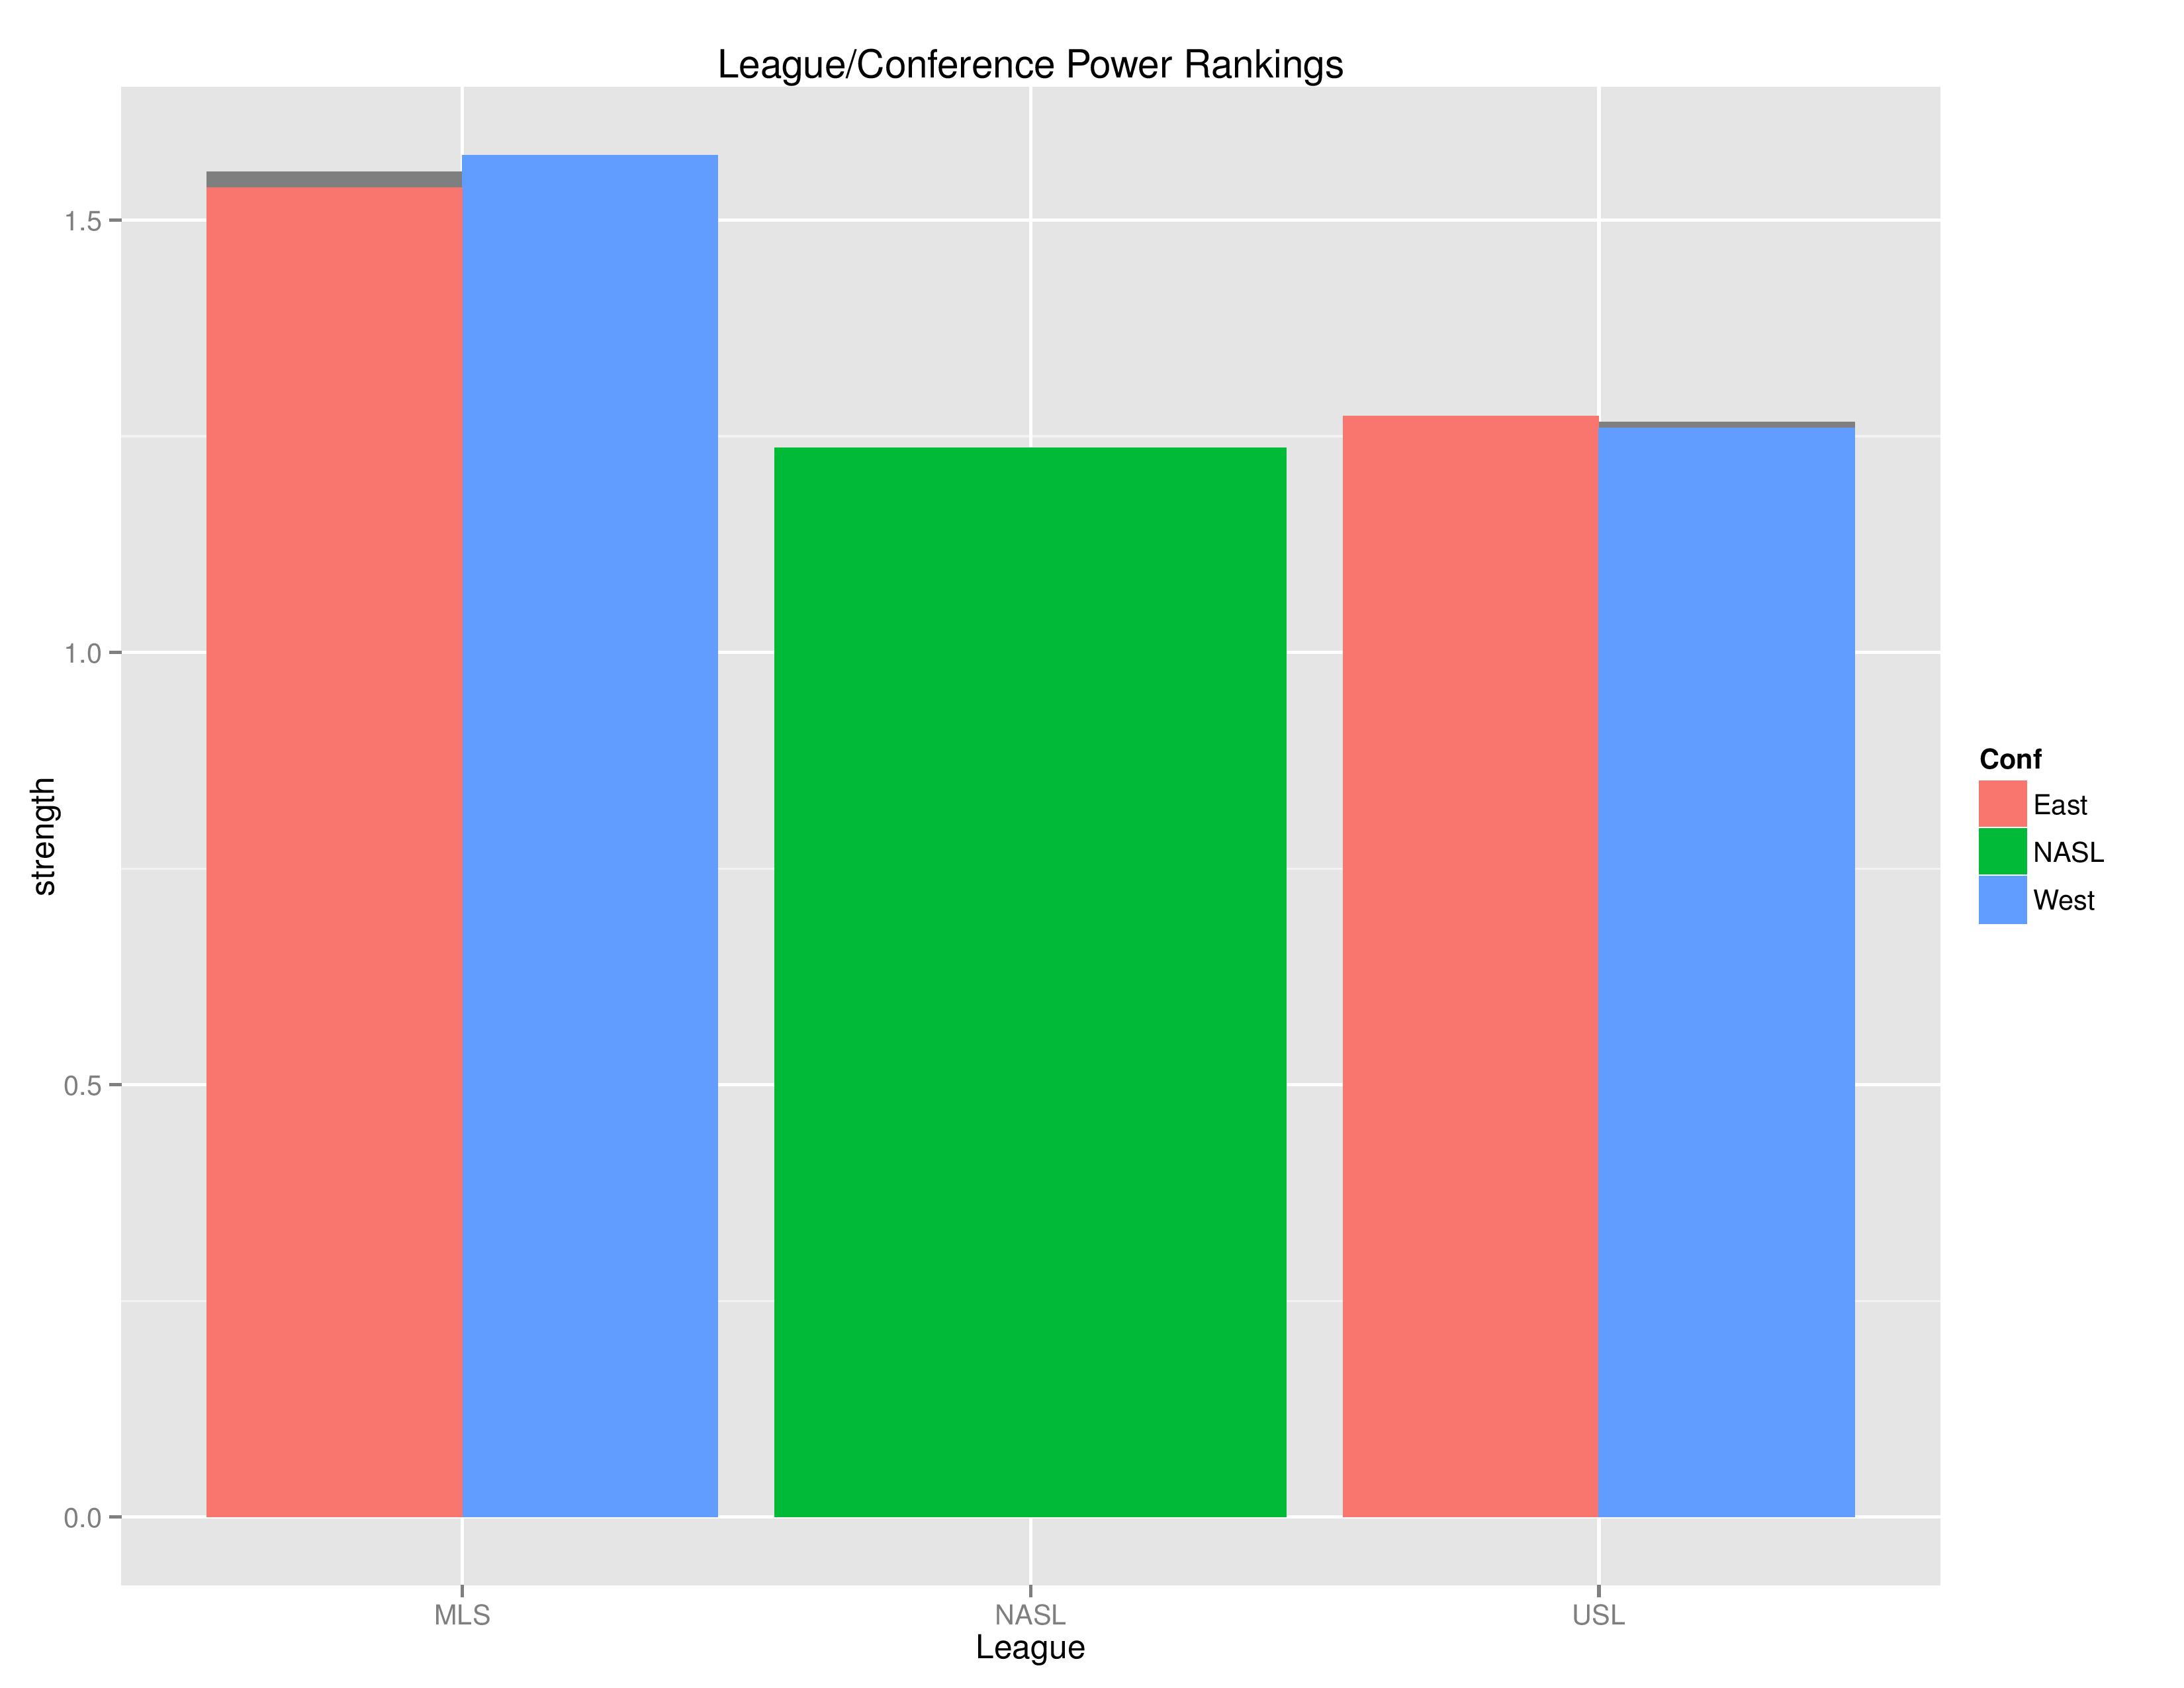
The above shows how the model rates each U.S. league & conference compared to one another. This is based on an all vs. all assessment rather than a top vs. top assessment. MLS is clearly rated as superior to either NASL or USL. USL has a slight edge over NASL though despite NASL still having one team available in the USOC. This also shows the MLS-West outperforming MLS-East and USL-East slightly outperforming USL-West.
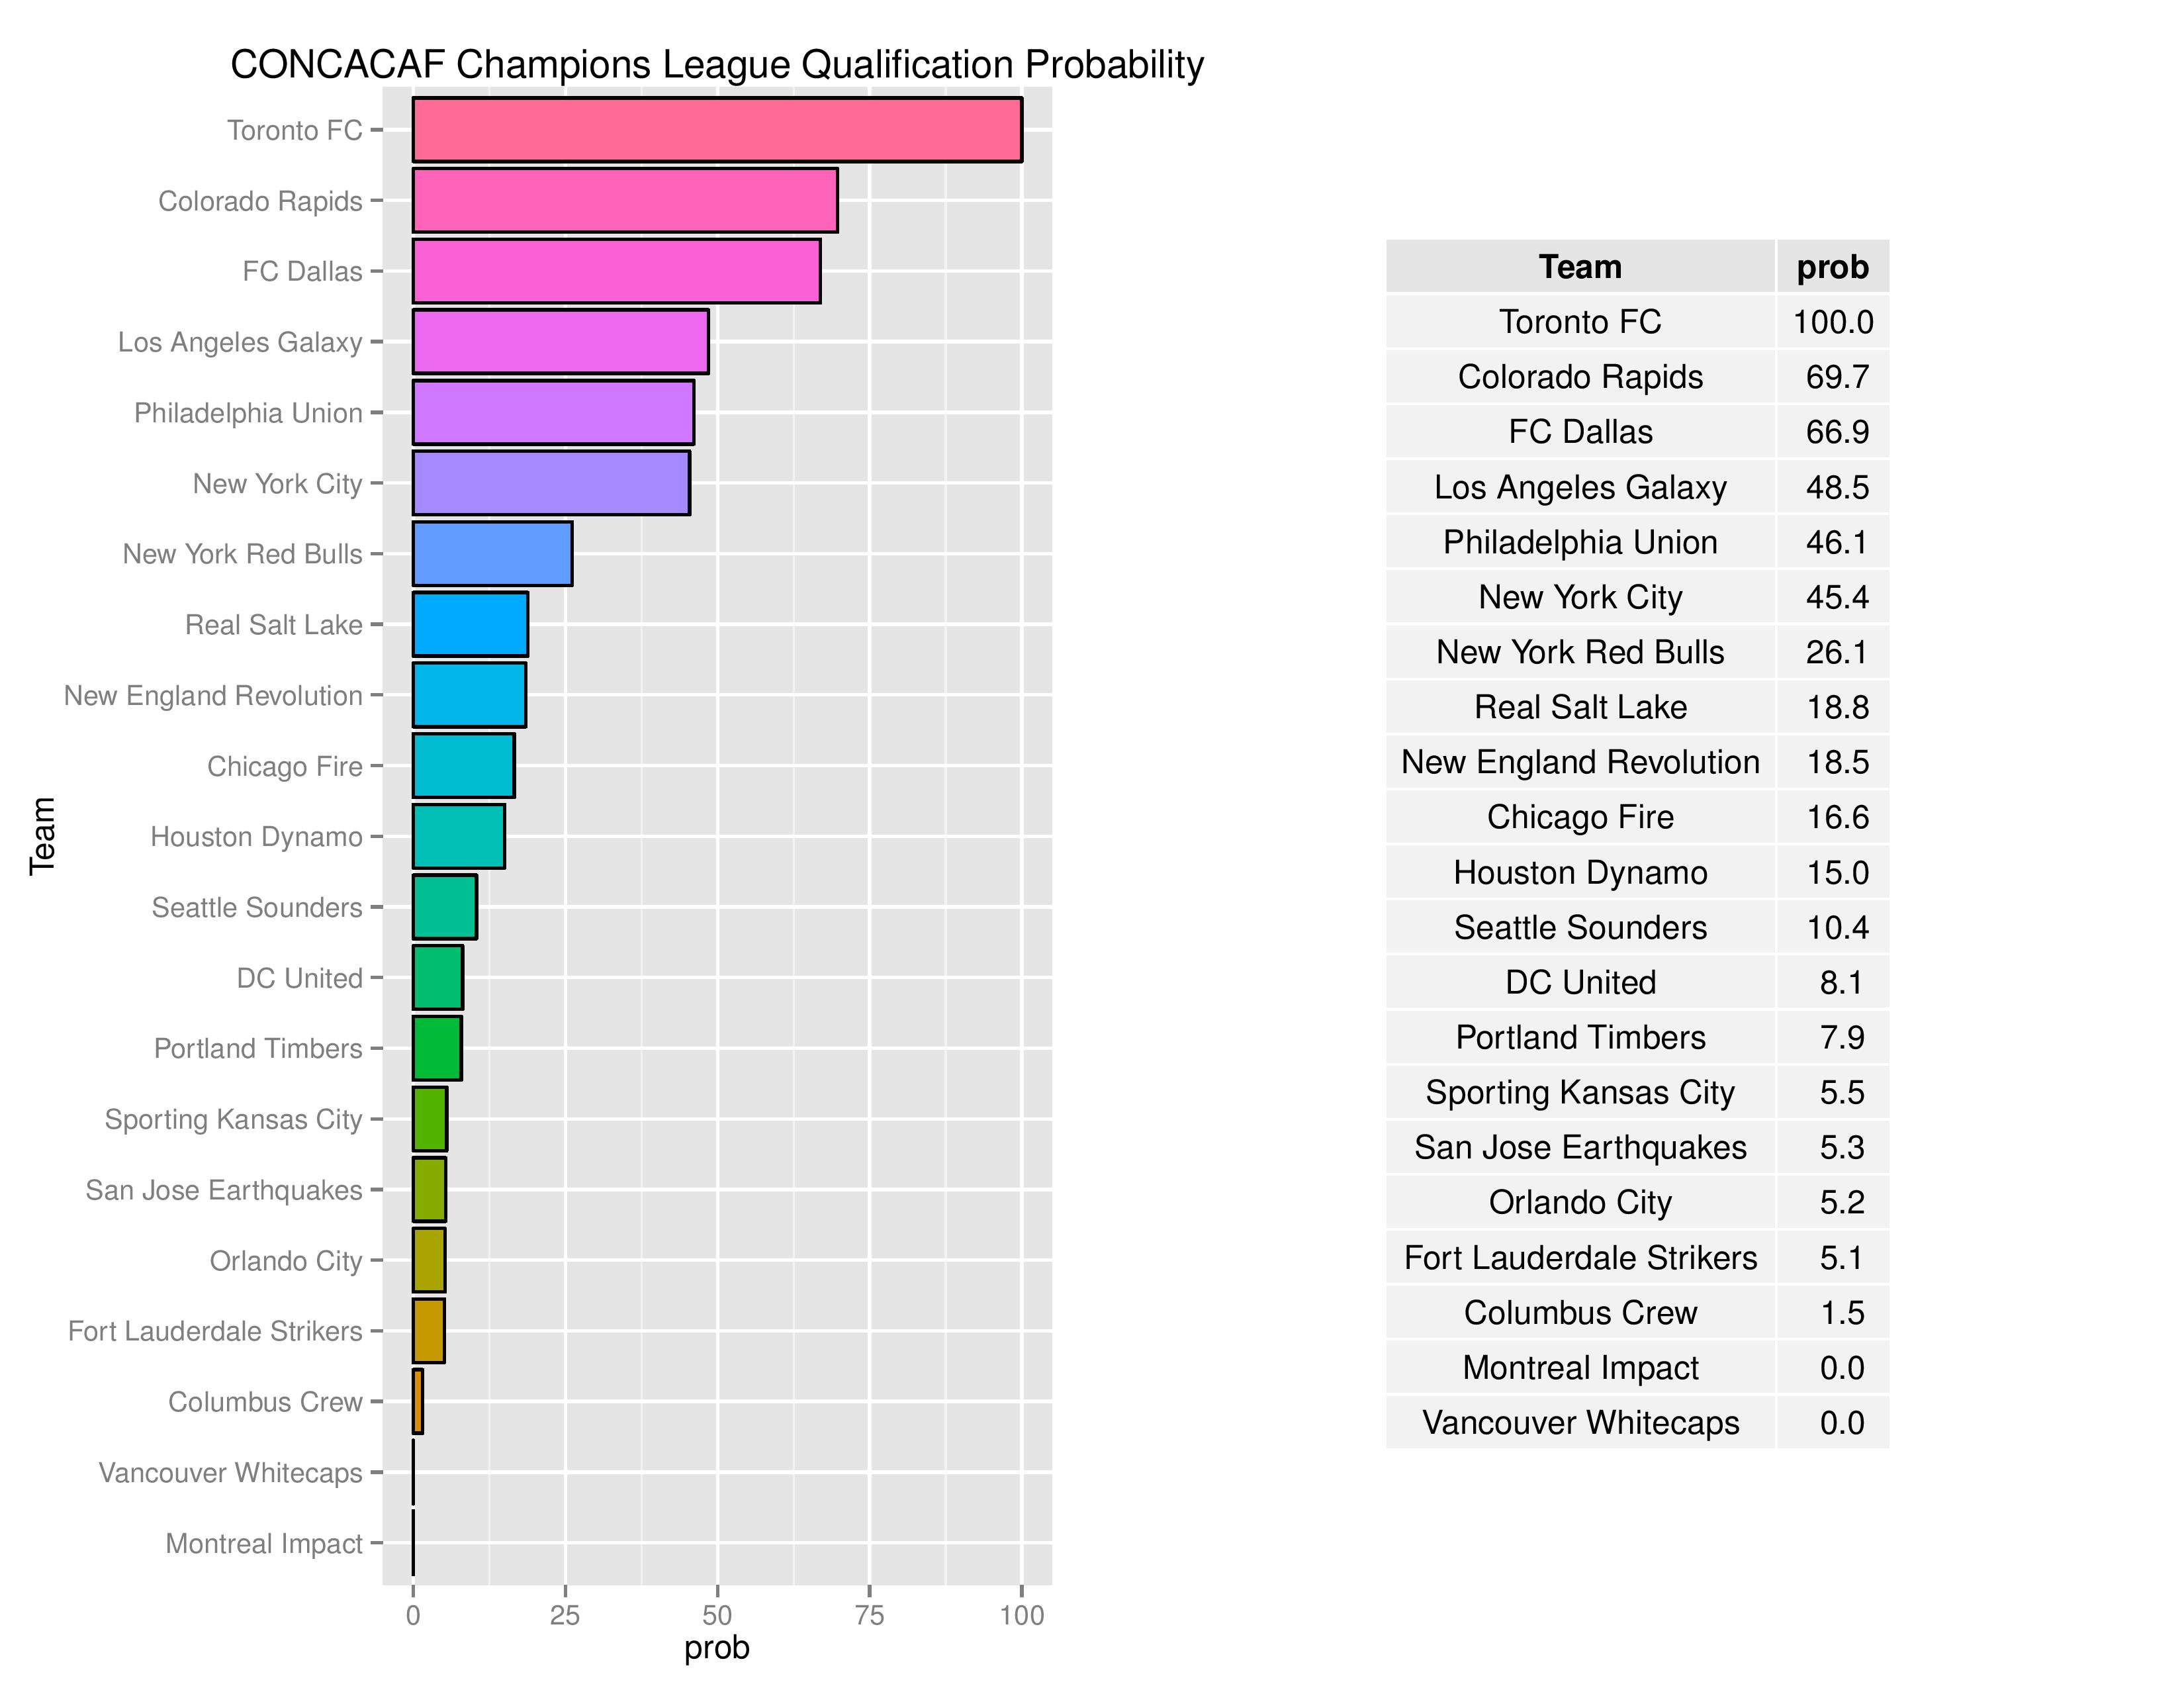
Philadelphia’s probability of qualifying for the CCL declined sharply from 52.9% to 46.1%. The steepness of the decline was heavily influenced by NYC’s continued success on the road and their advantage in obtaining the regular season conference win.
Philadelphia finishing
The following shows the probability of various Playoff categories and Philadelphia’s probability of each of them.

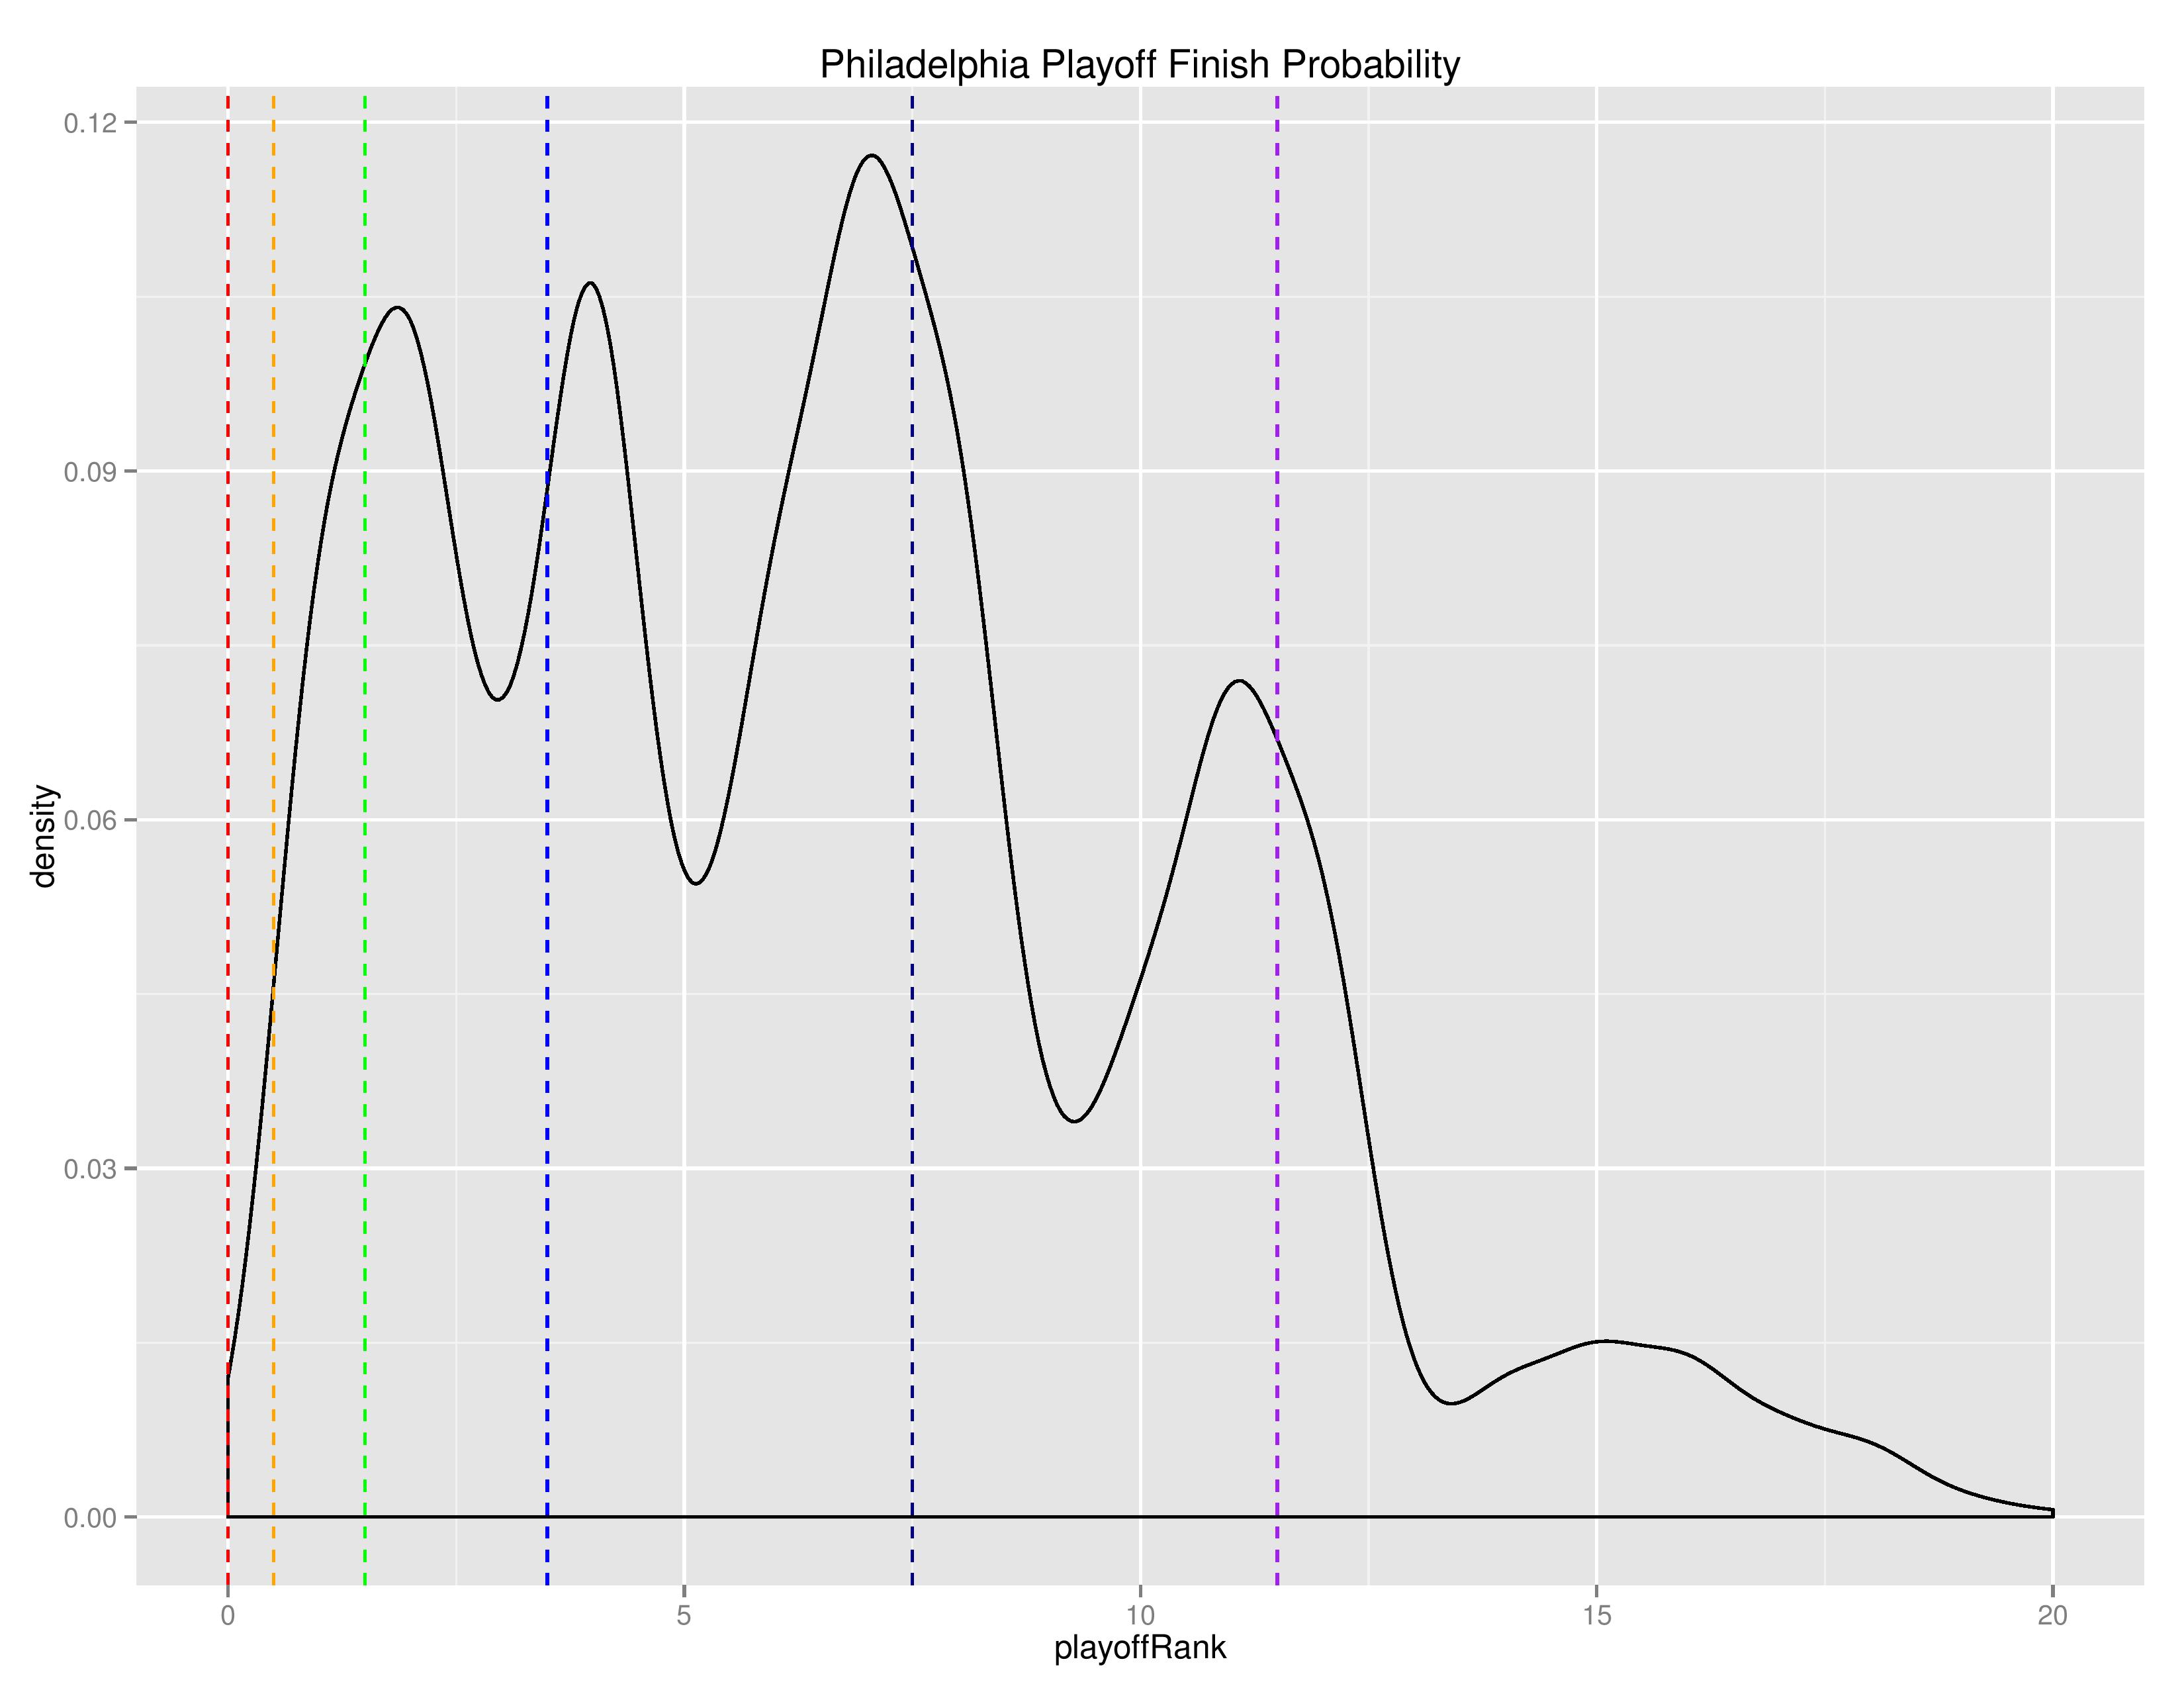
The following is a “density” chart showing the relative probability of Philadelphia finishing at the different after-playoffs rankings from 1 to 20.
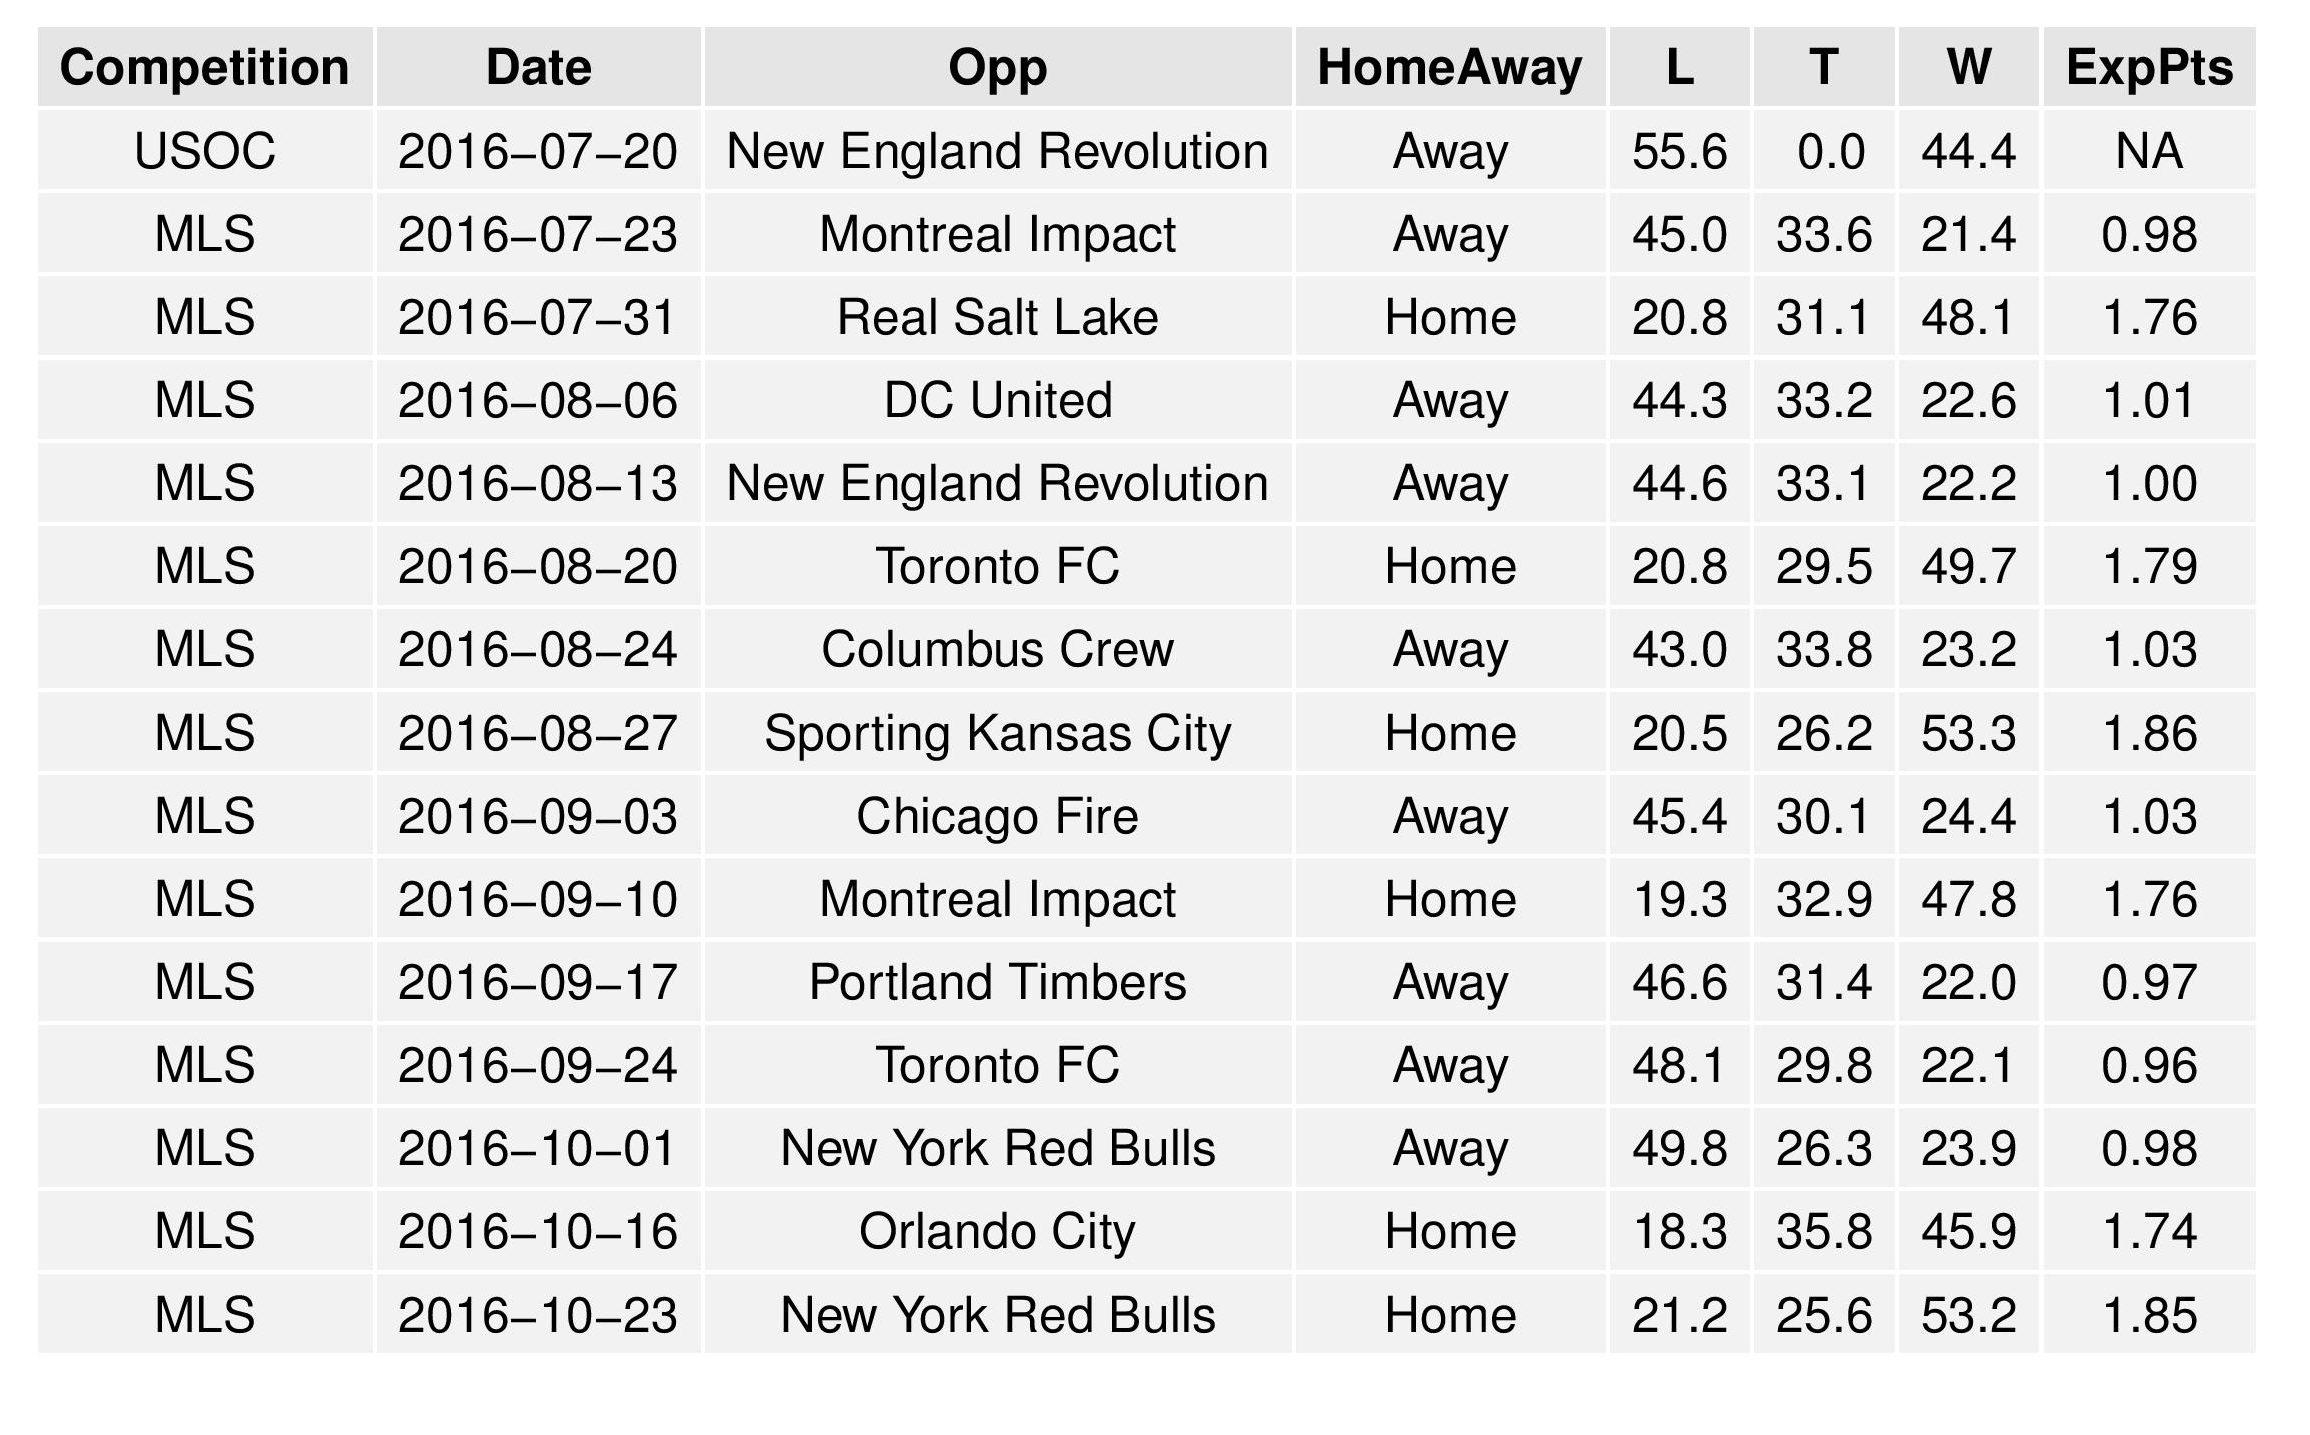
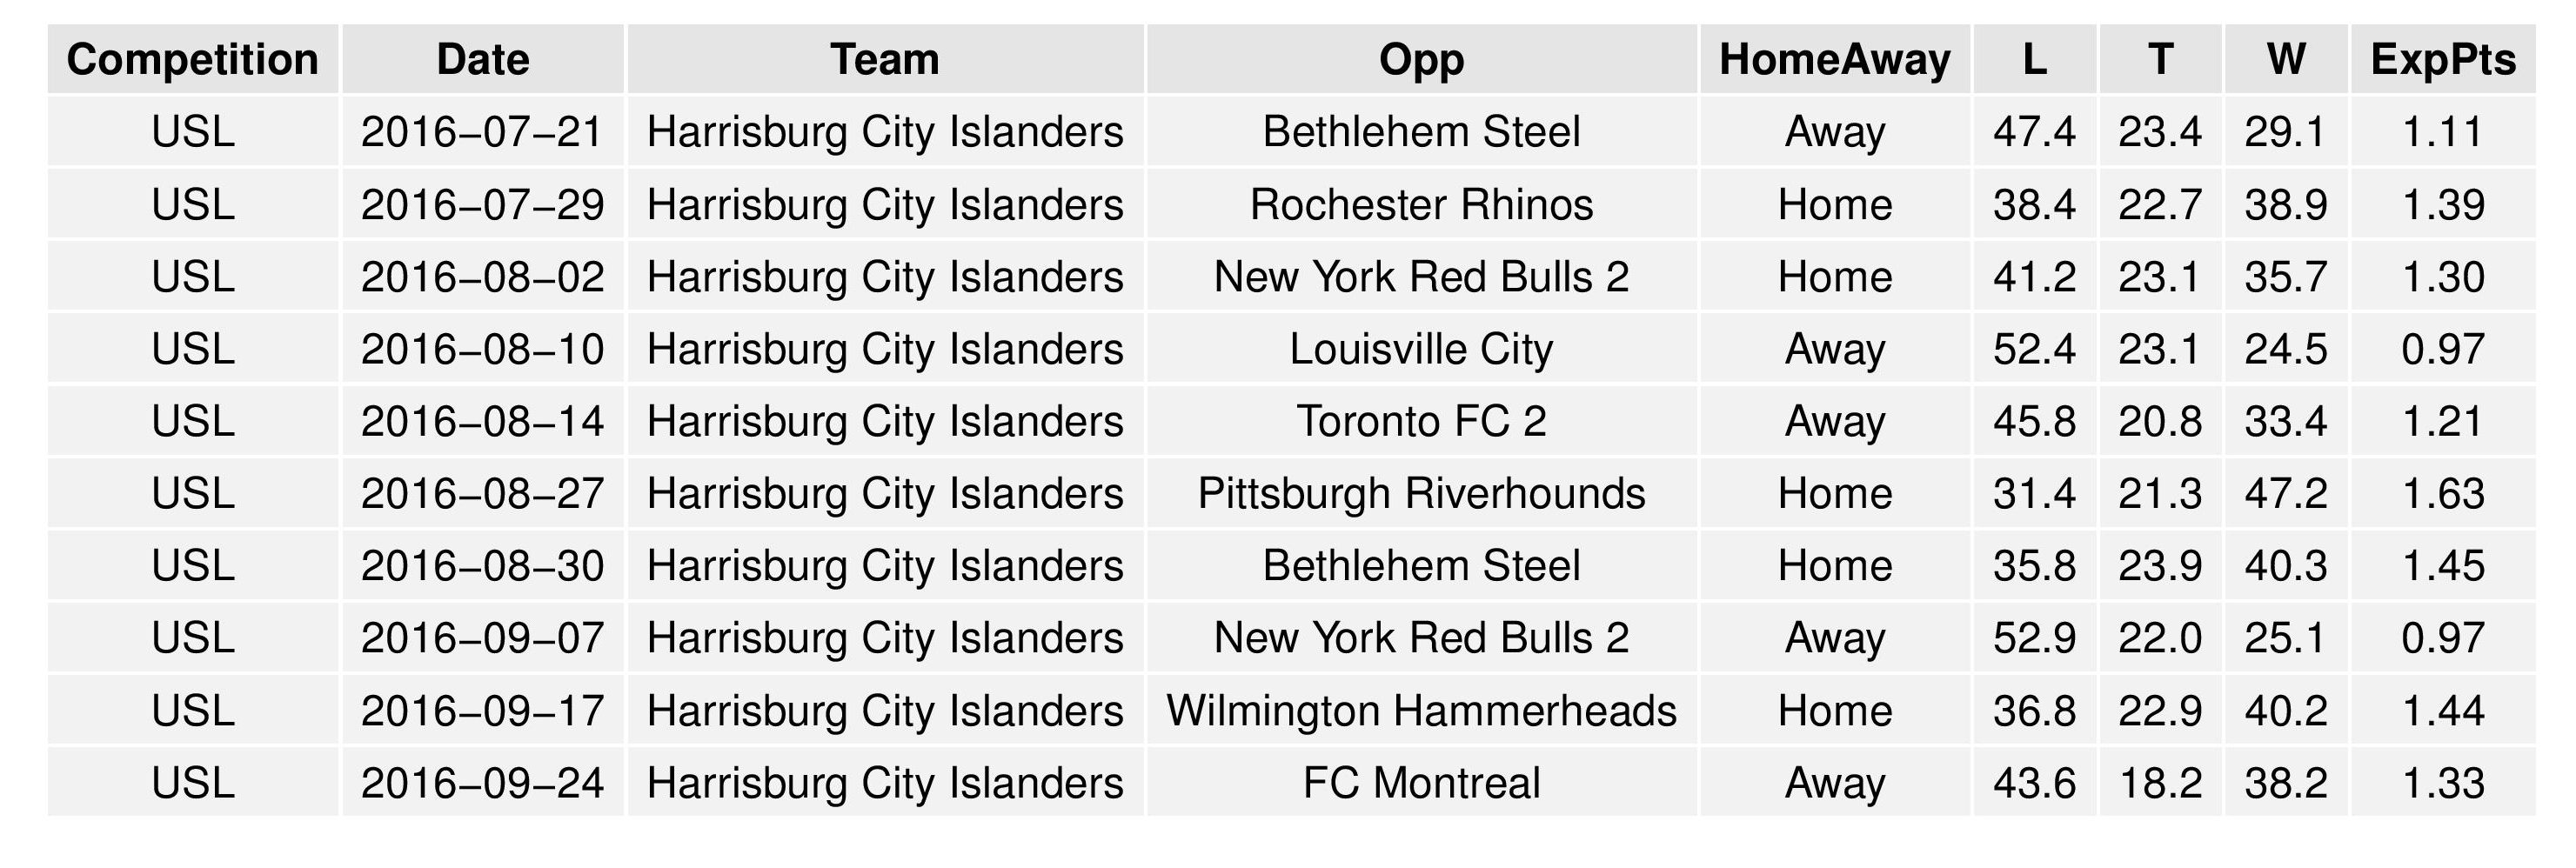
The following is the list of Philadelphia’s remaining scheduled matches accompanied by result probabilities as predicted by SEBA.
The charts below shows the average results of all the simulations and the probabilities associated with all of the above. The chart is broken up into two parts in order to better fit on your screen.
(Note: CCLAlternate refers to qualifying for CONCACAF Champions League non-traditionally. U.S. teams qualify by winning the MLS Cup, winning the Supporters’ Shield, winning the Conference in the regular season, and by winning the U.S. Open Cup. If a Canadian team wins any of these or a U.S. team wins more than one, the extra slots are filled by top regular season performers.)
Changes Over Time
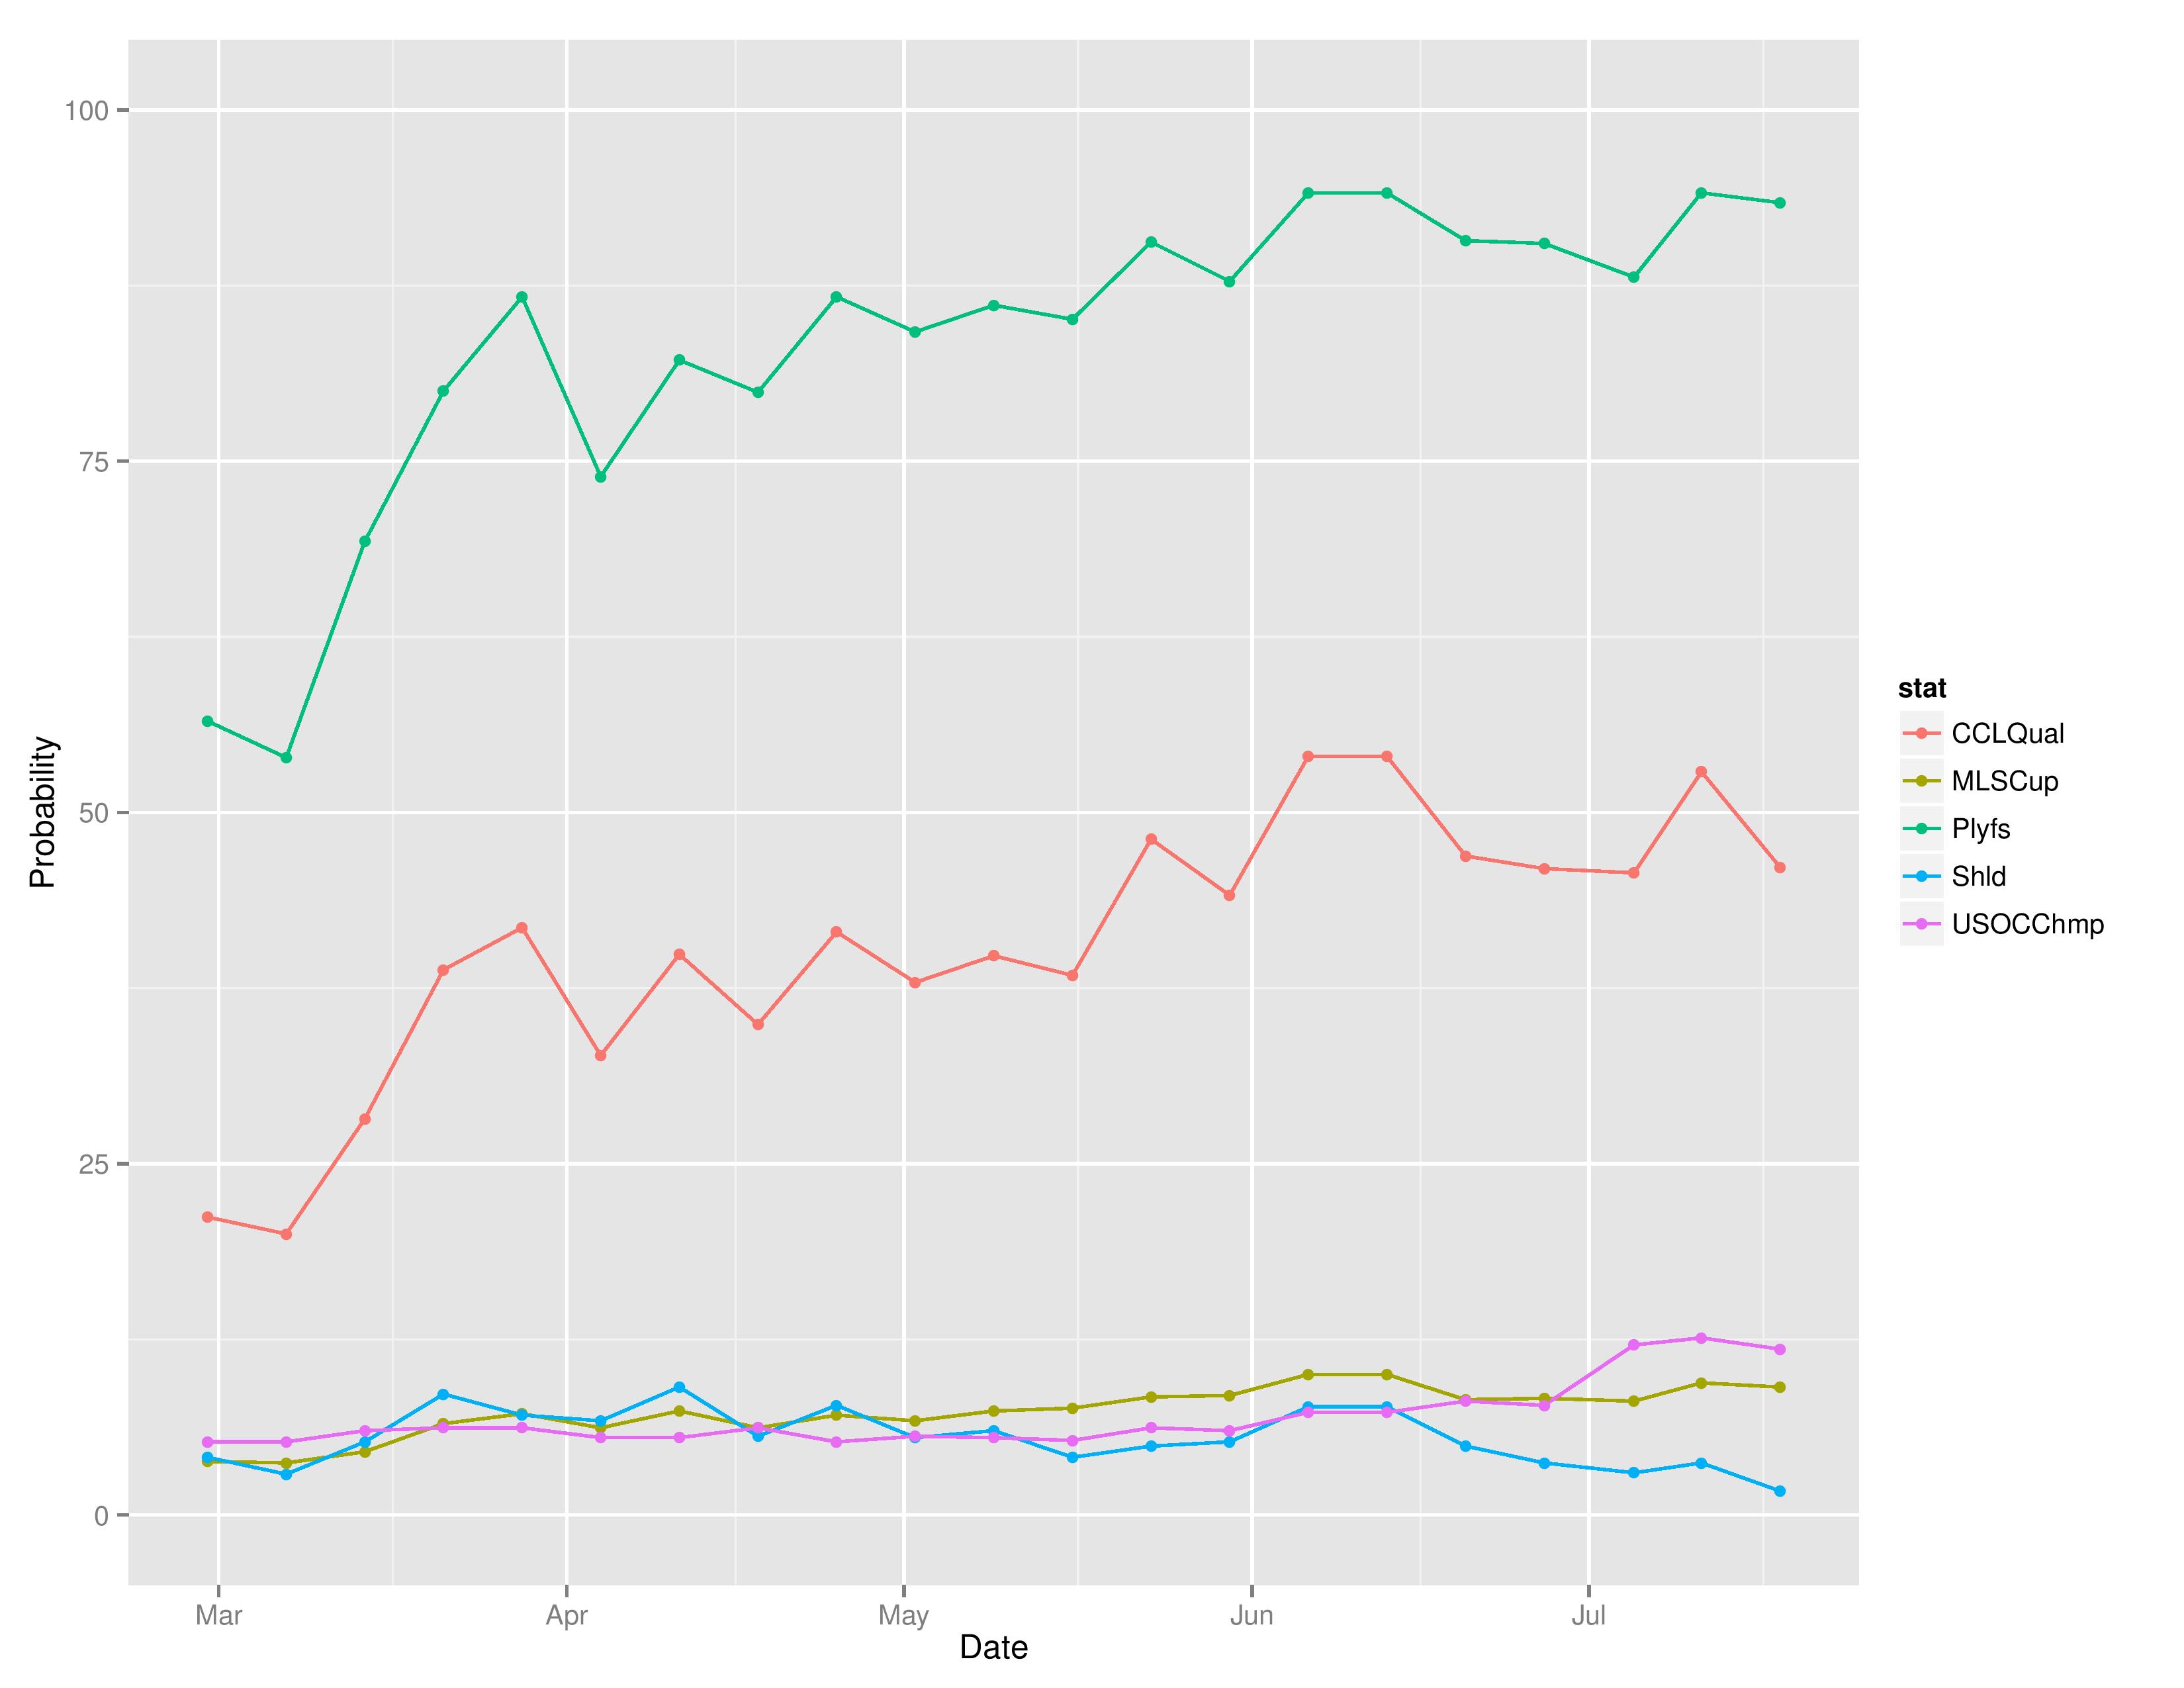
This chart shows how Philadelphia’s chances at each of the outcomes has evolved over the course of the season.
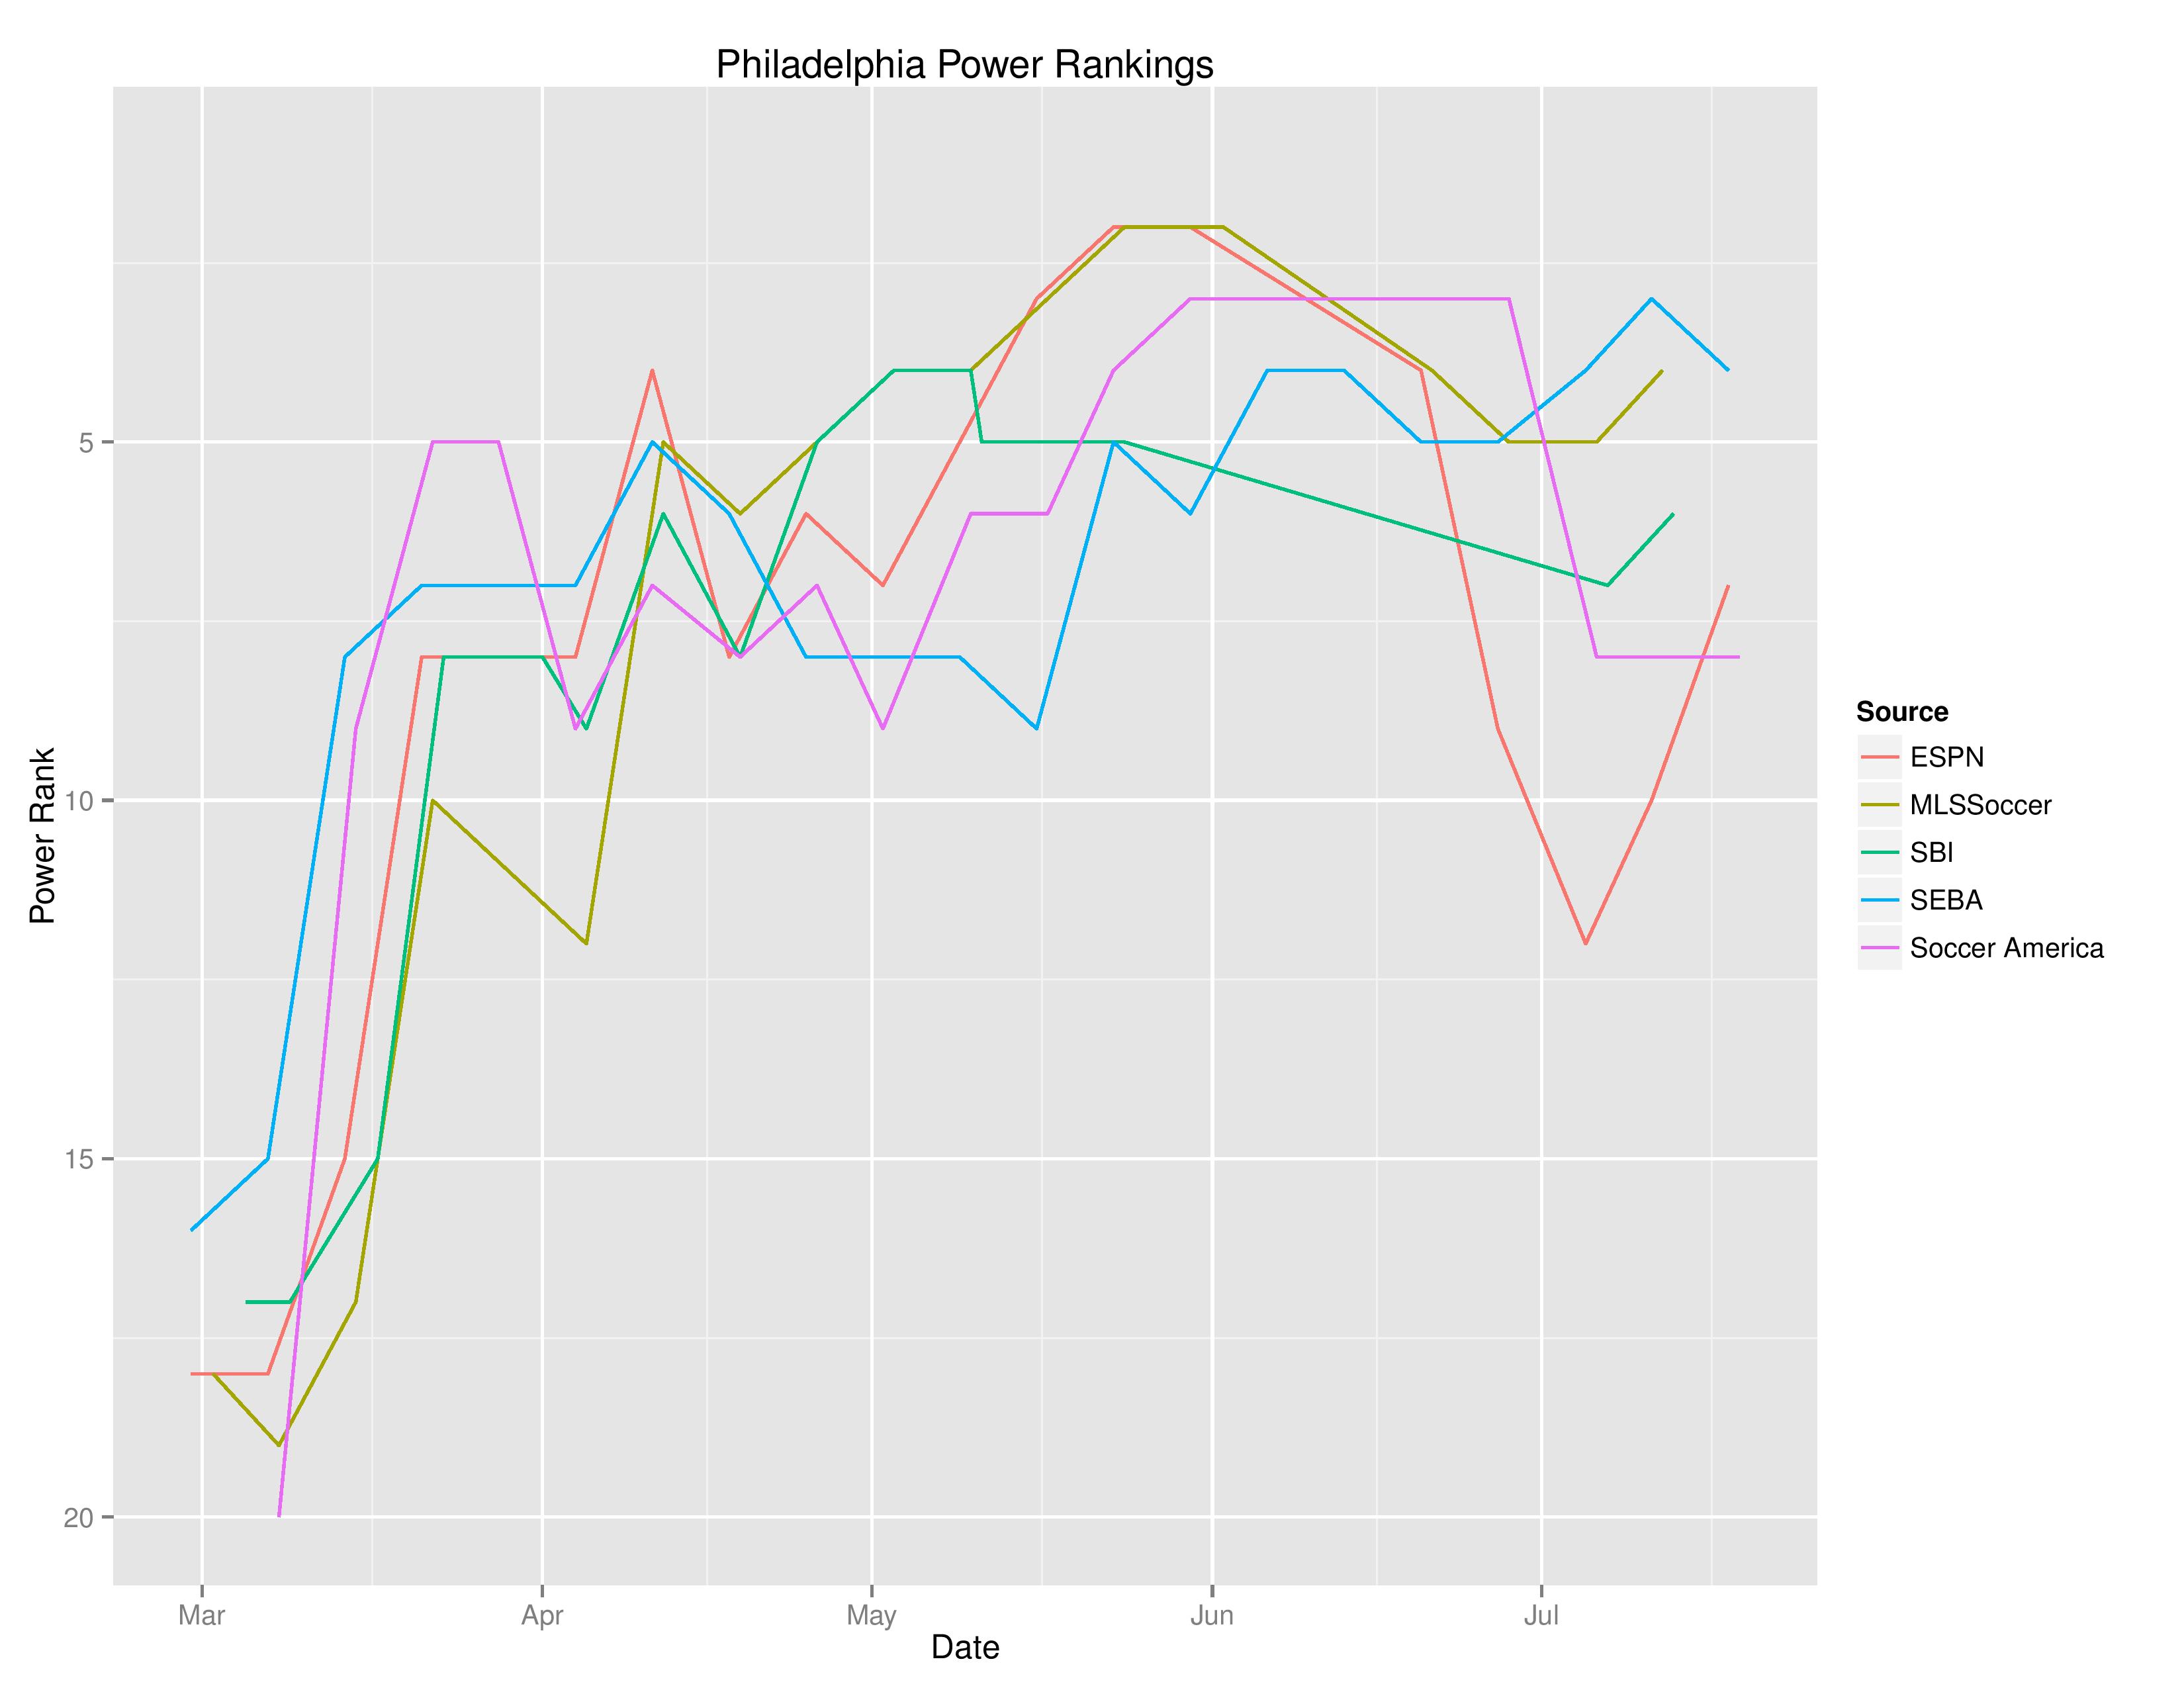
This shows the evolution of Philadelphia’s movement within SEBA and other media outlets’ power rankings.
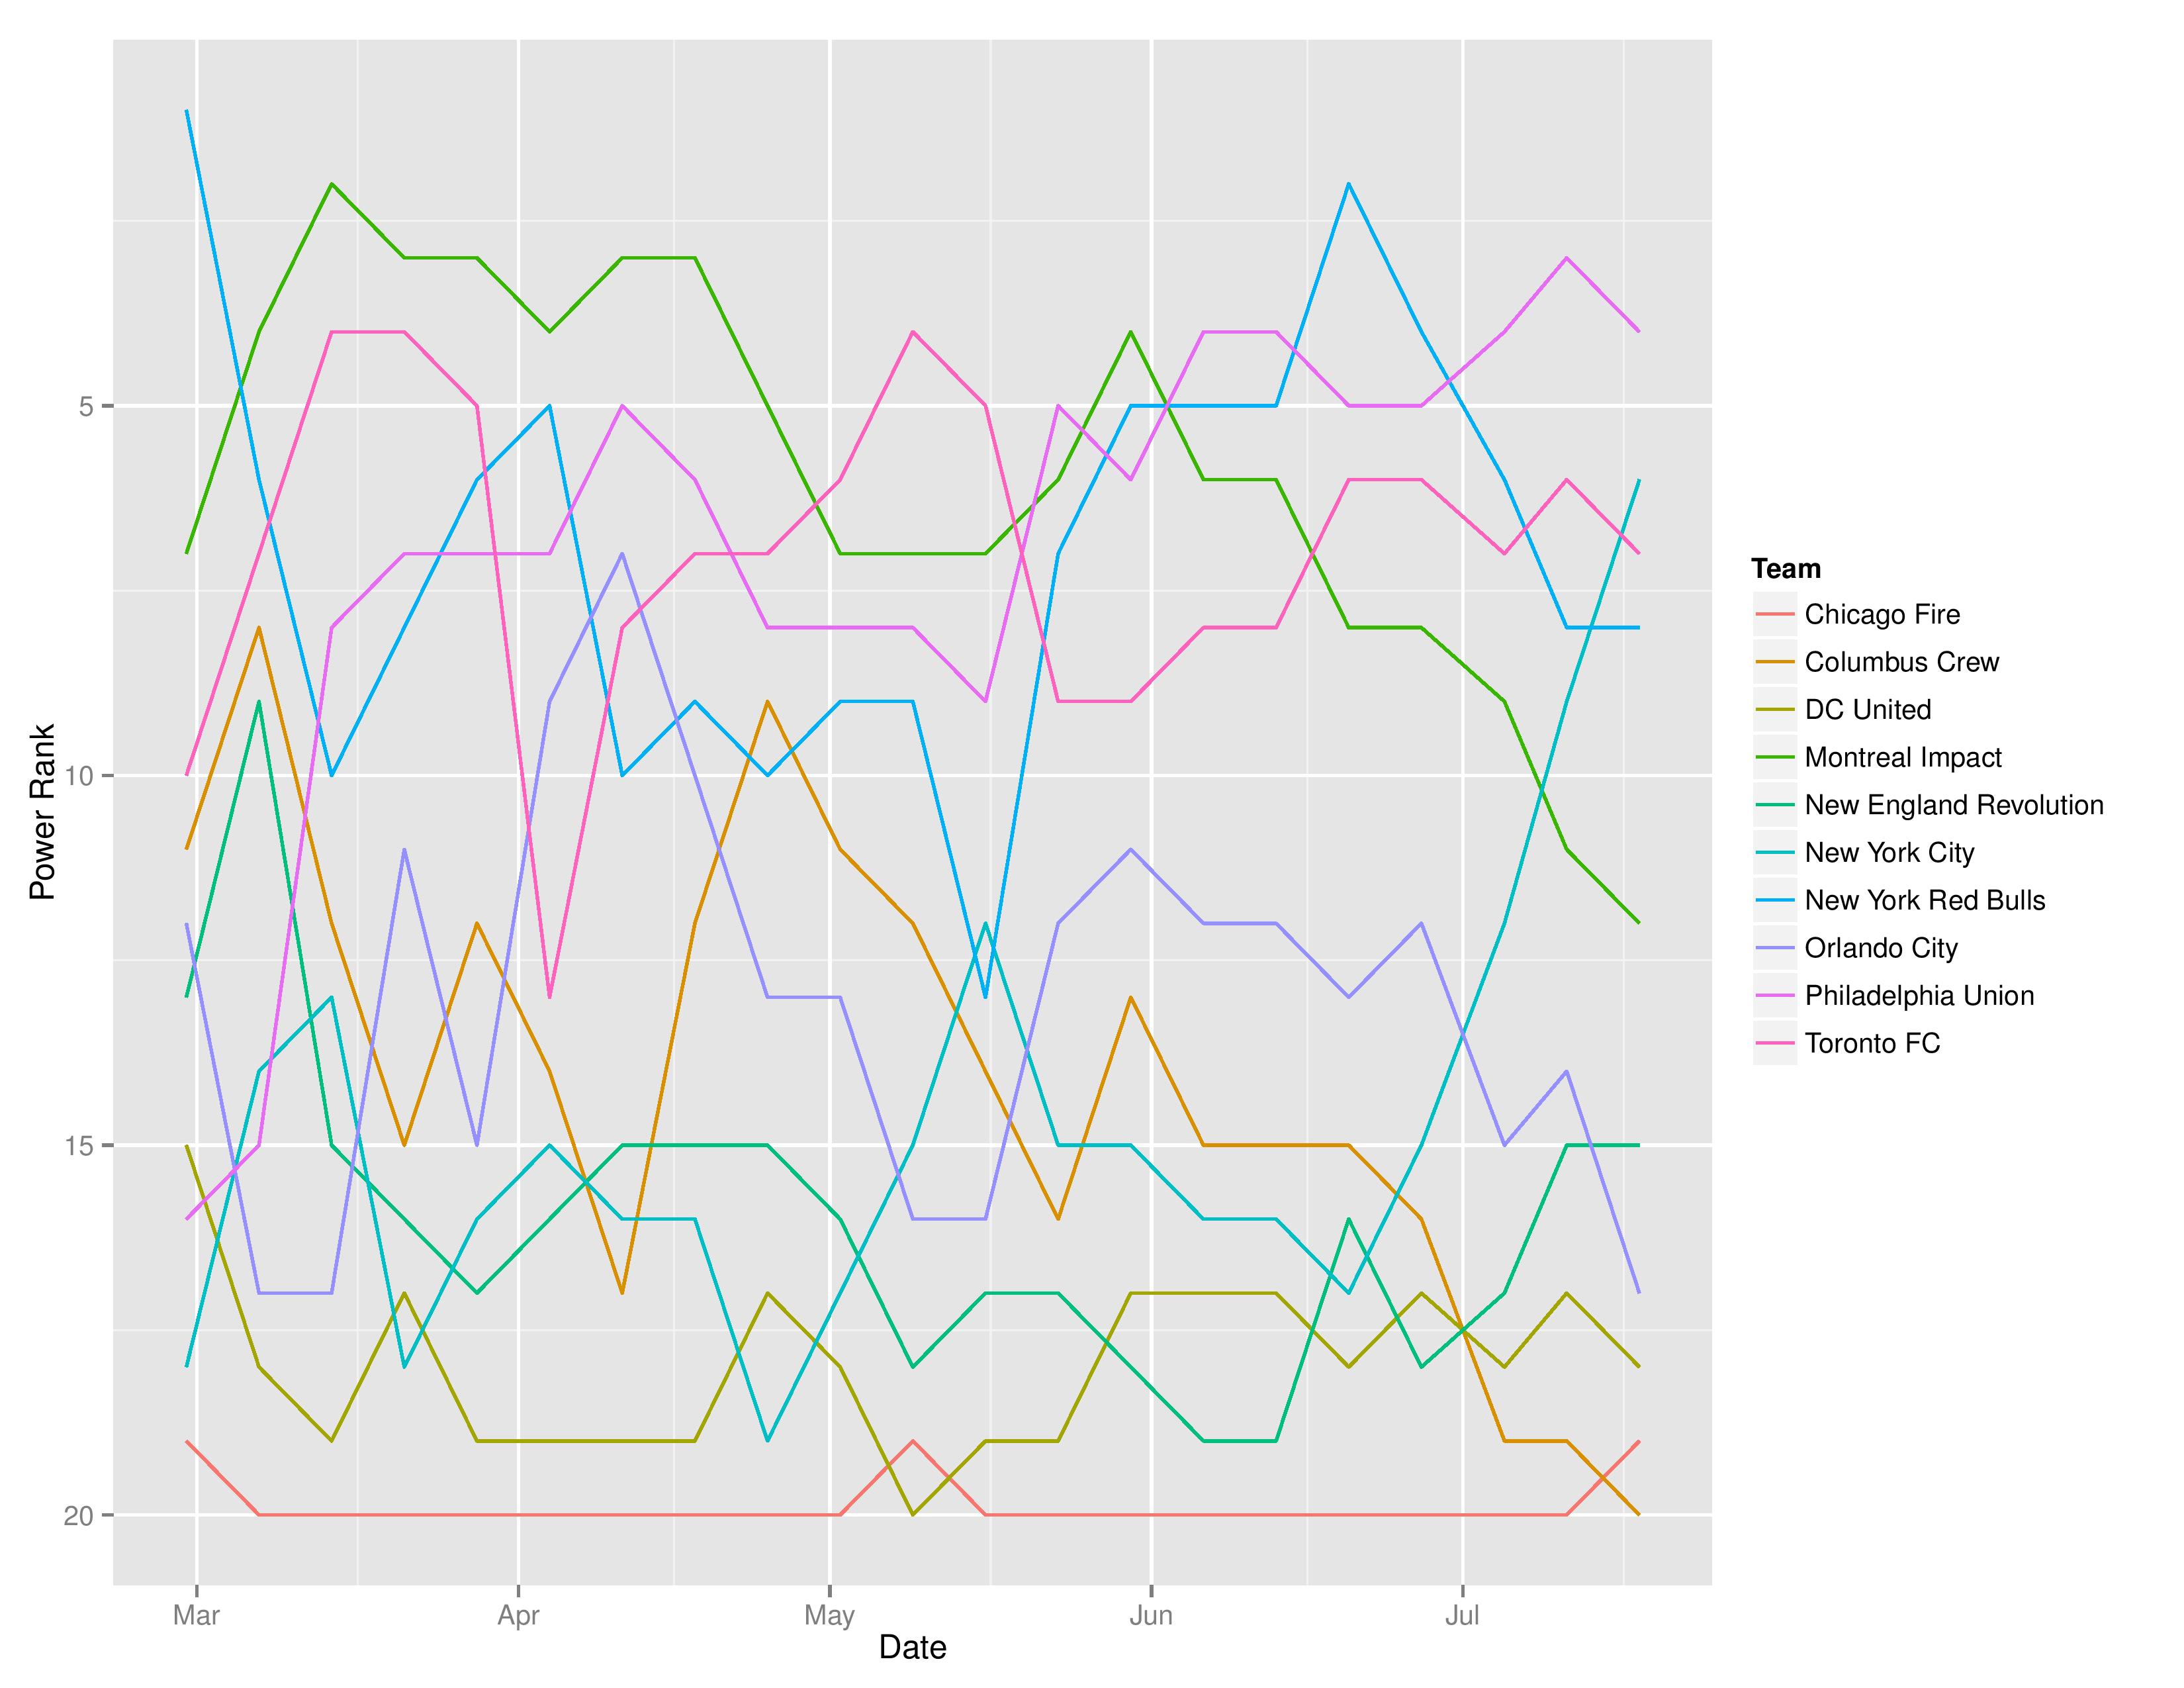
This shows the MLS Eastern Conference’s evolution of power rankings for SEBA throughout the season.
Records
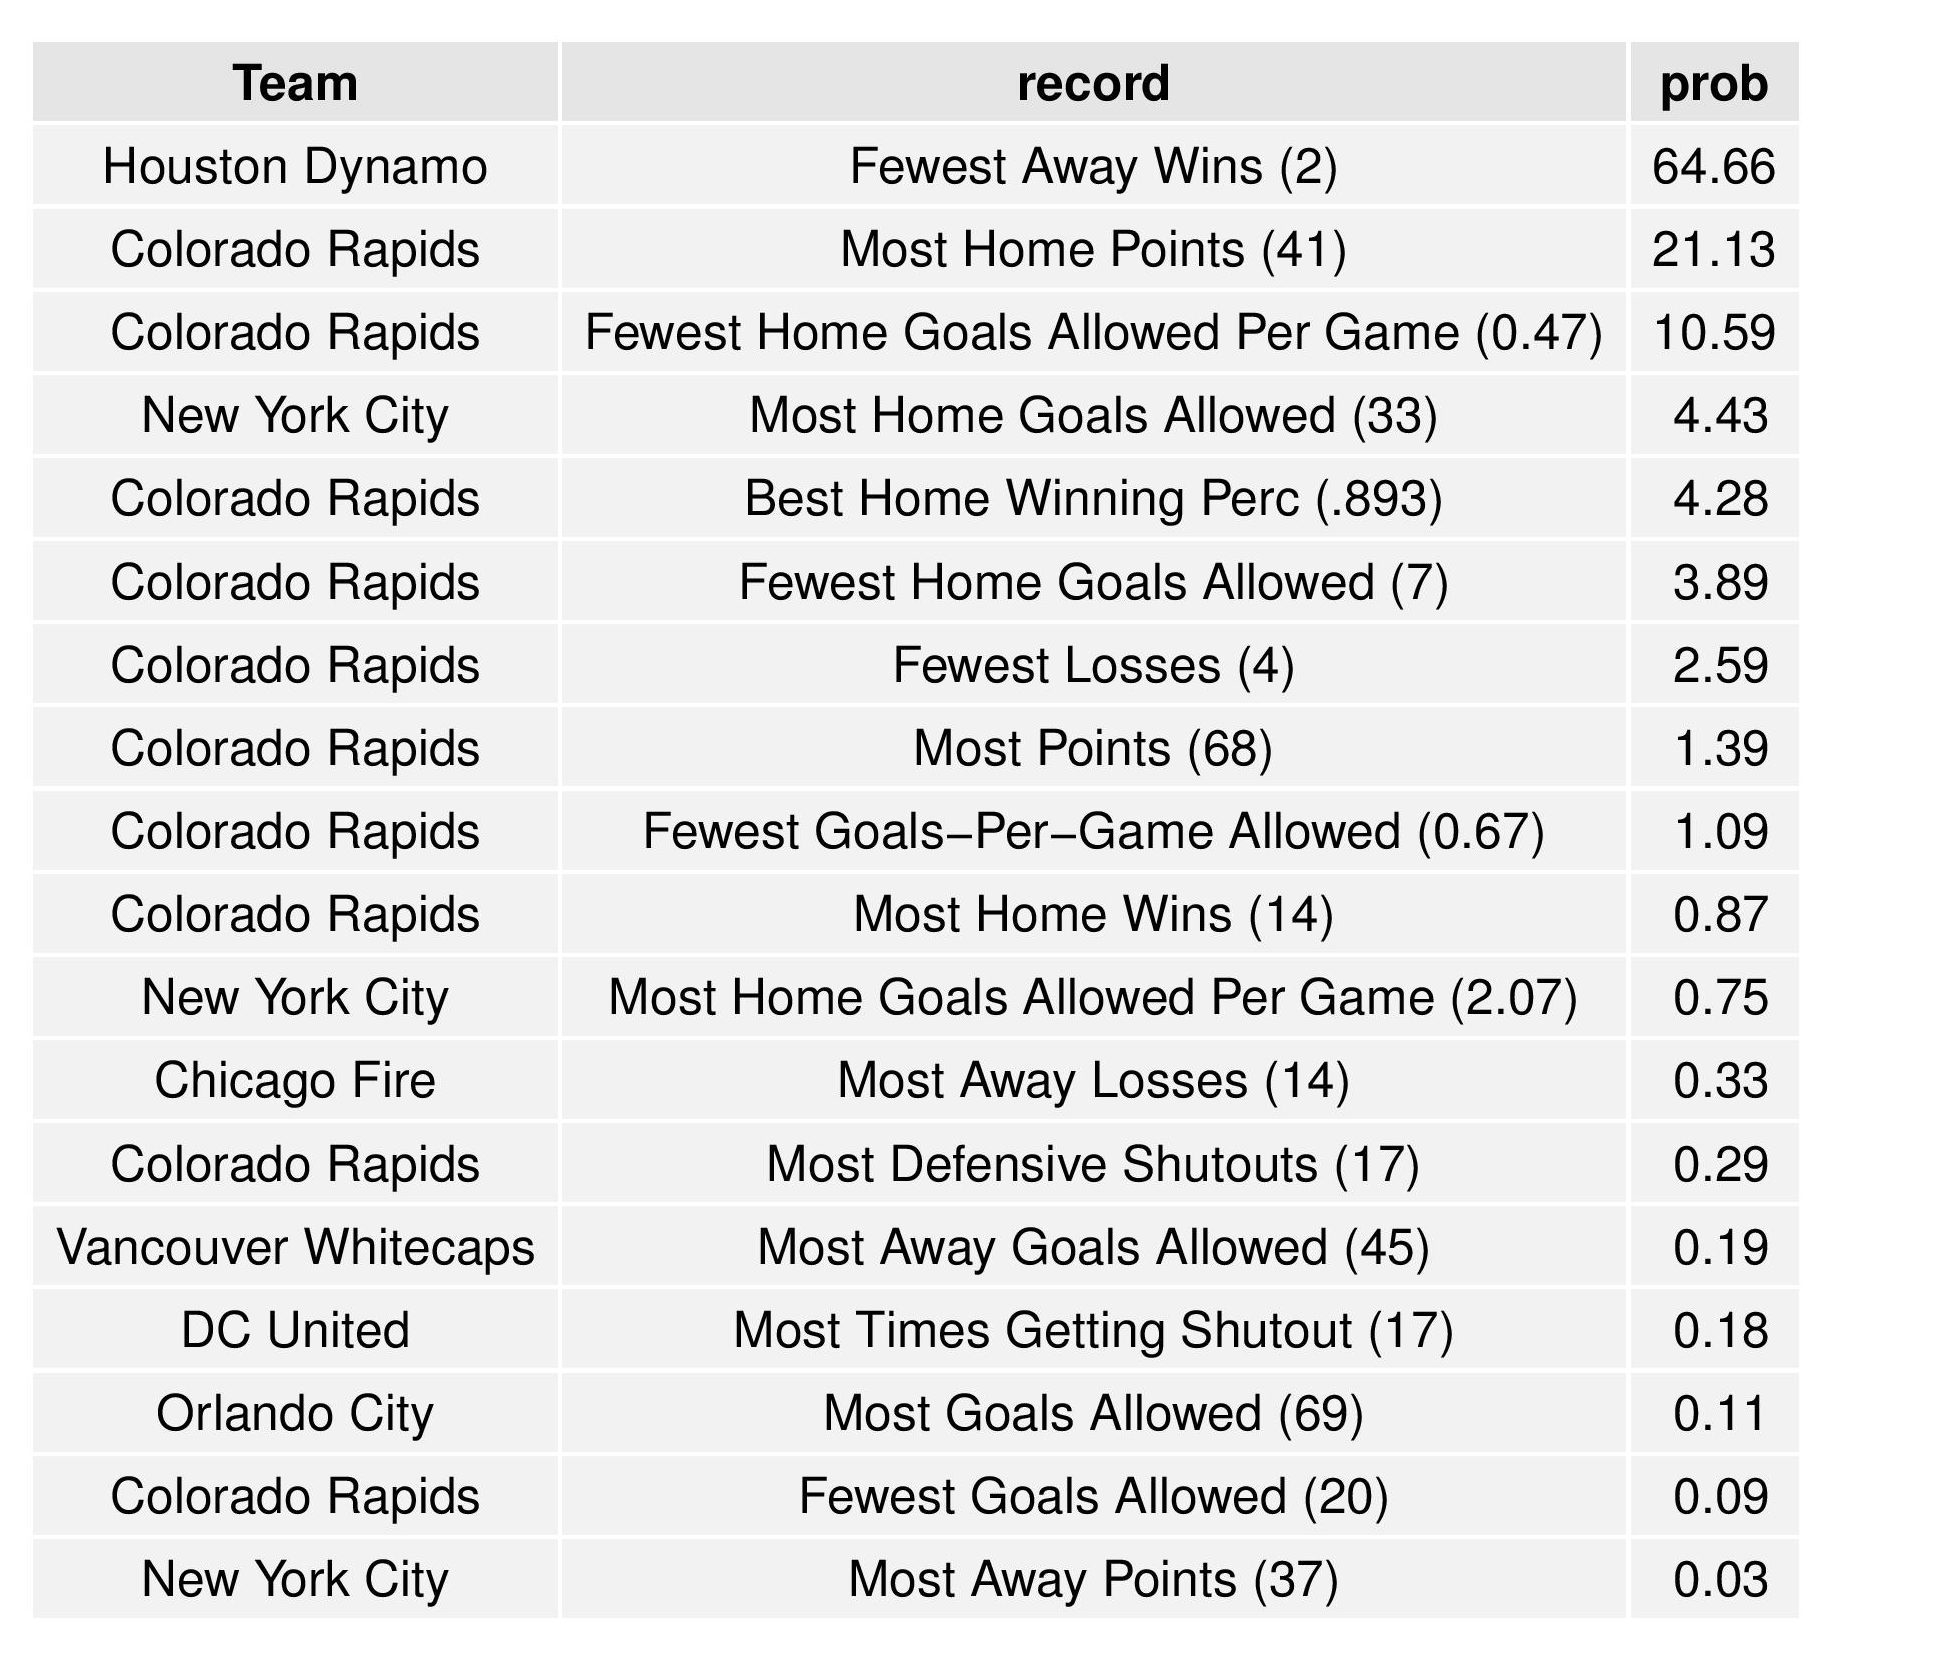
It should be noted that, with both of these tables, it shows the odds of breaking MLS single-season records, not of holding them. If more than one team would break the same record this season, they would both be represented below.
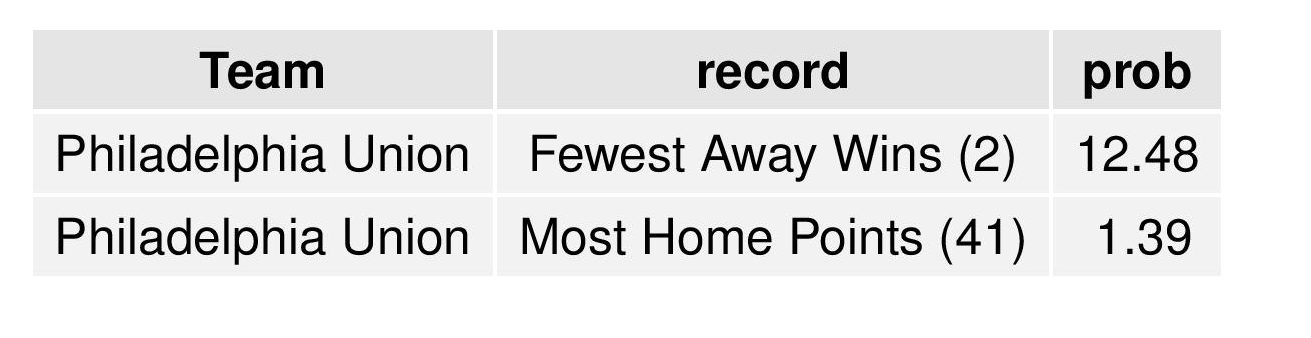
The following table shows Philadelphia’s odds at breaking various MLS single-season records
The following table shows all single-season records that had at least one simulation break the record. However, it limits the records to show only the most probable team for breaking each record.
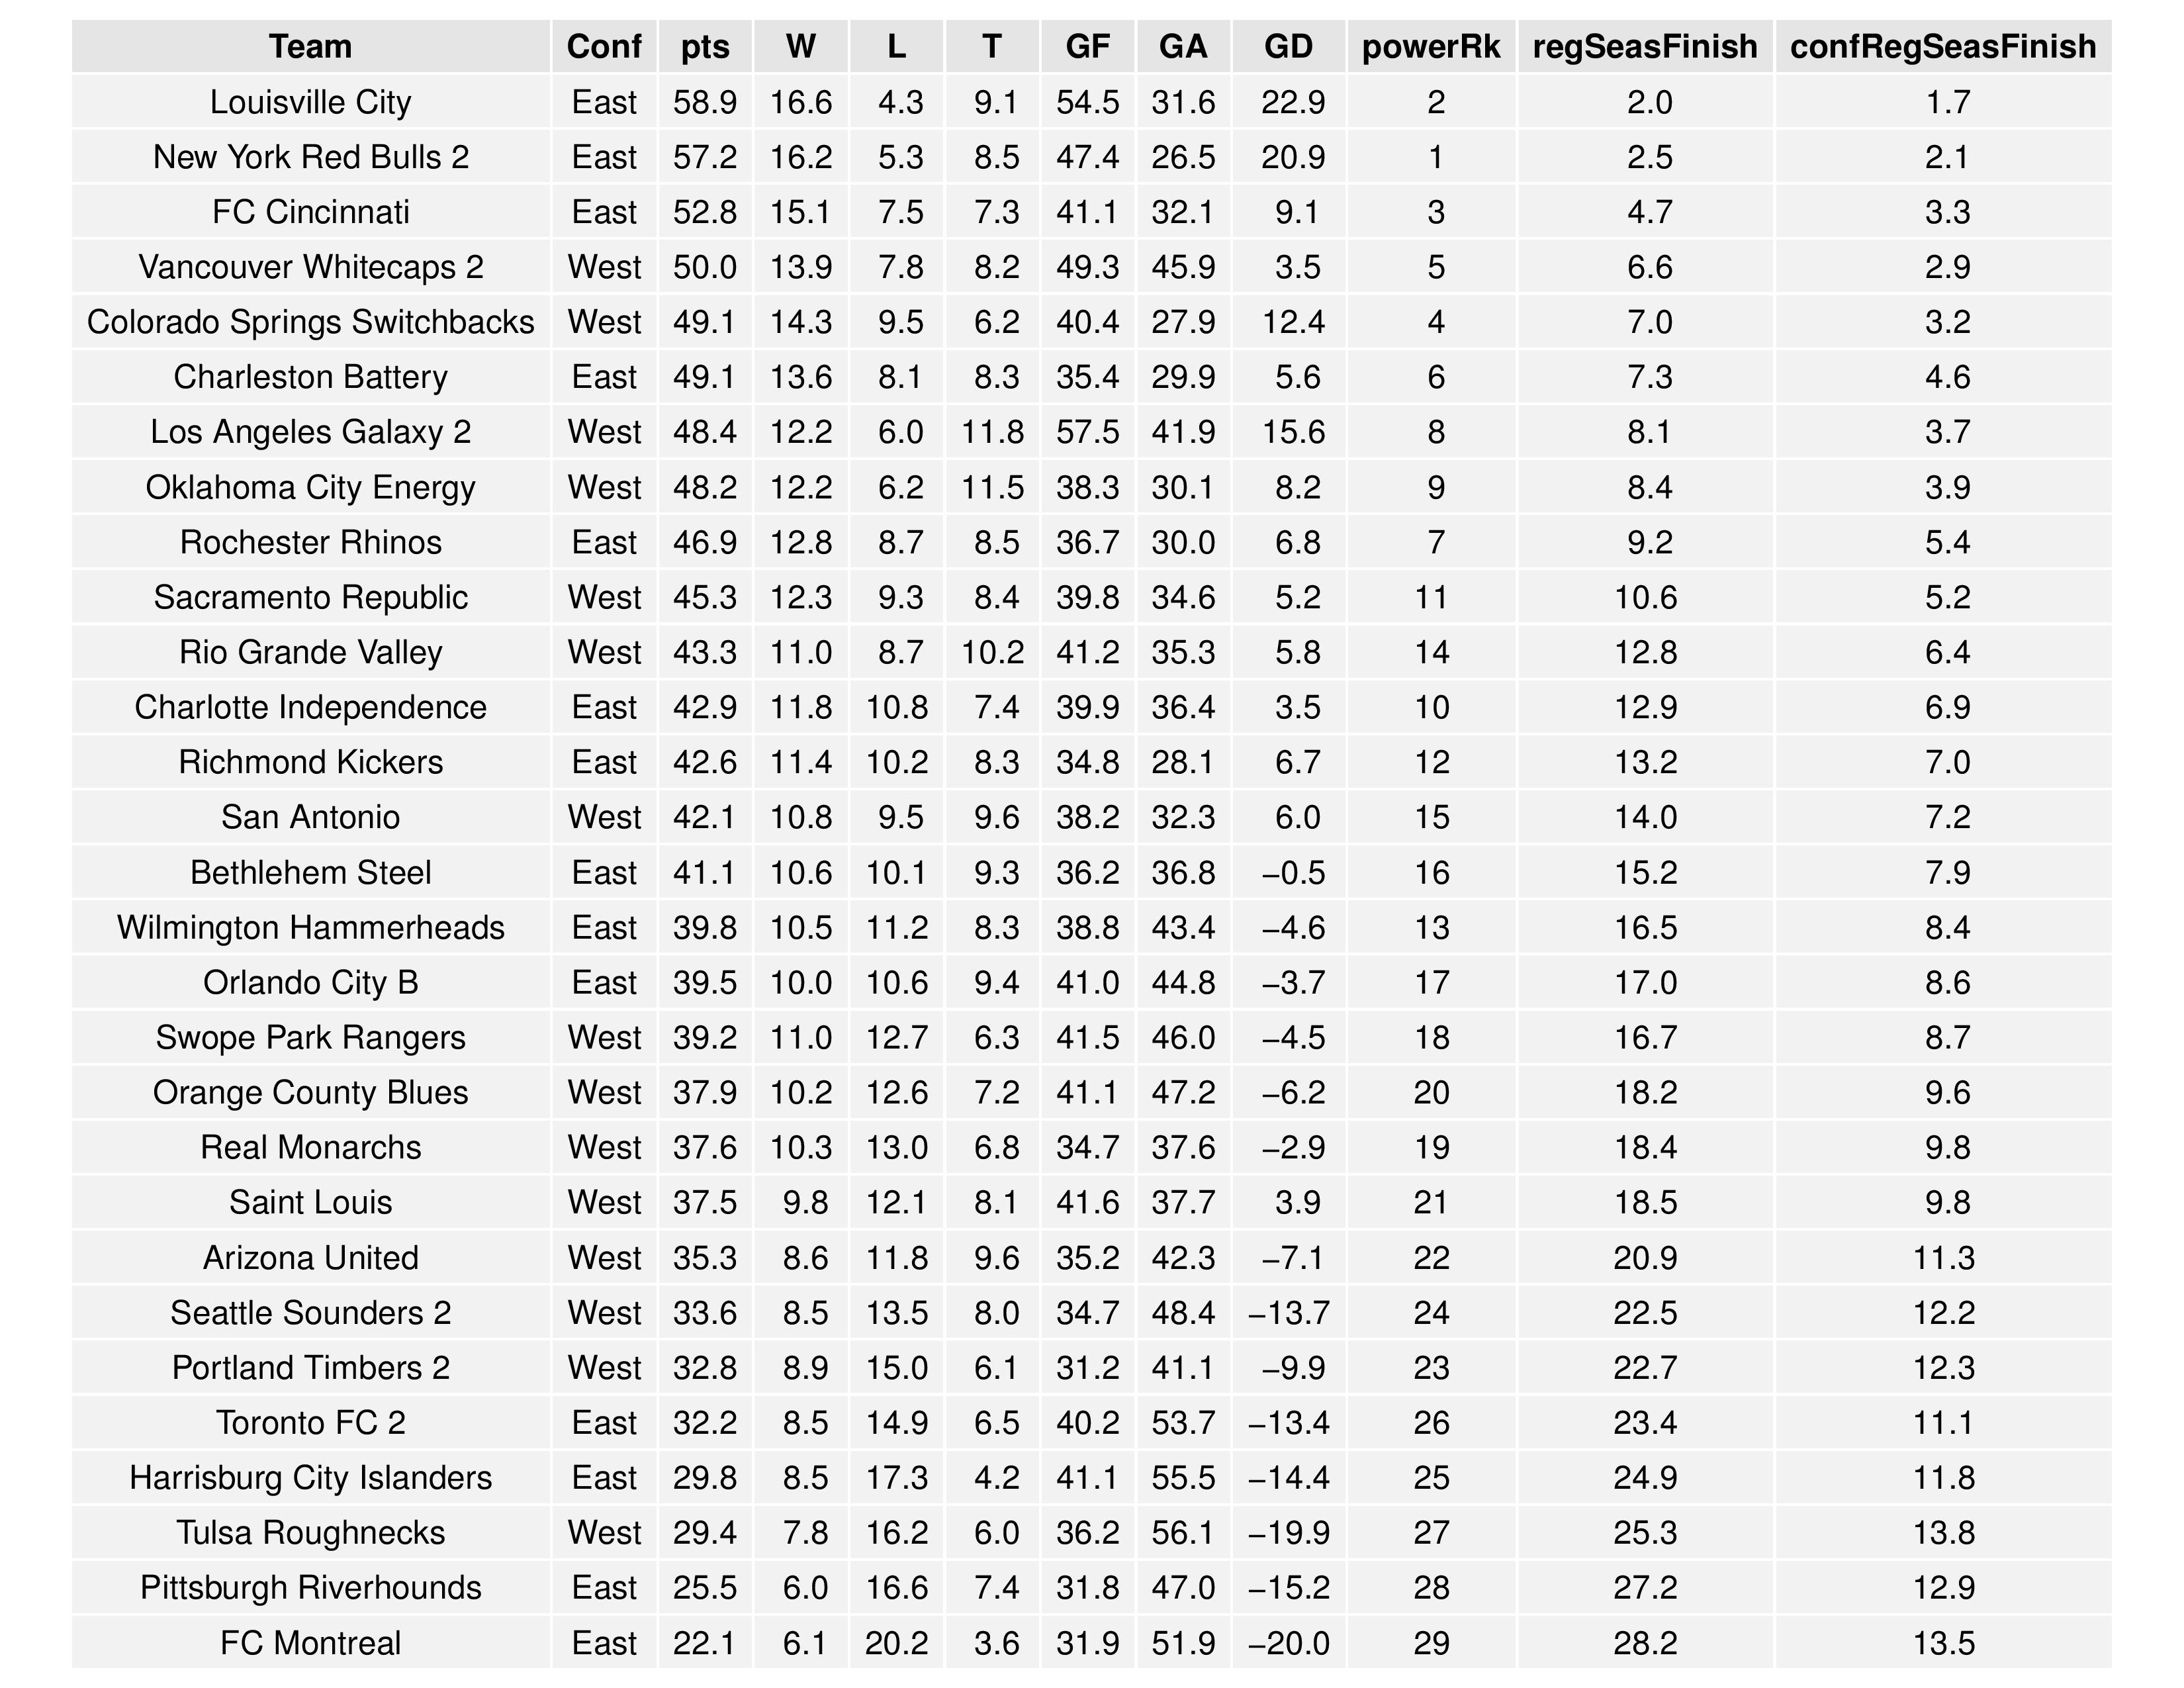
USL Projections
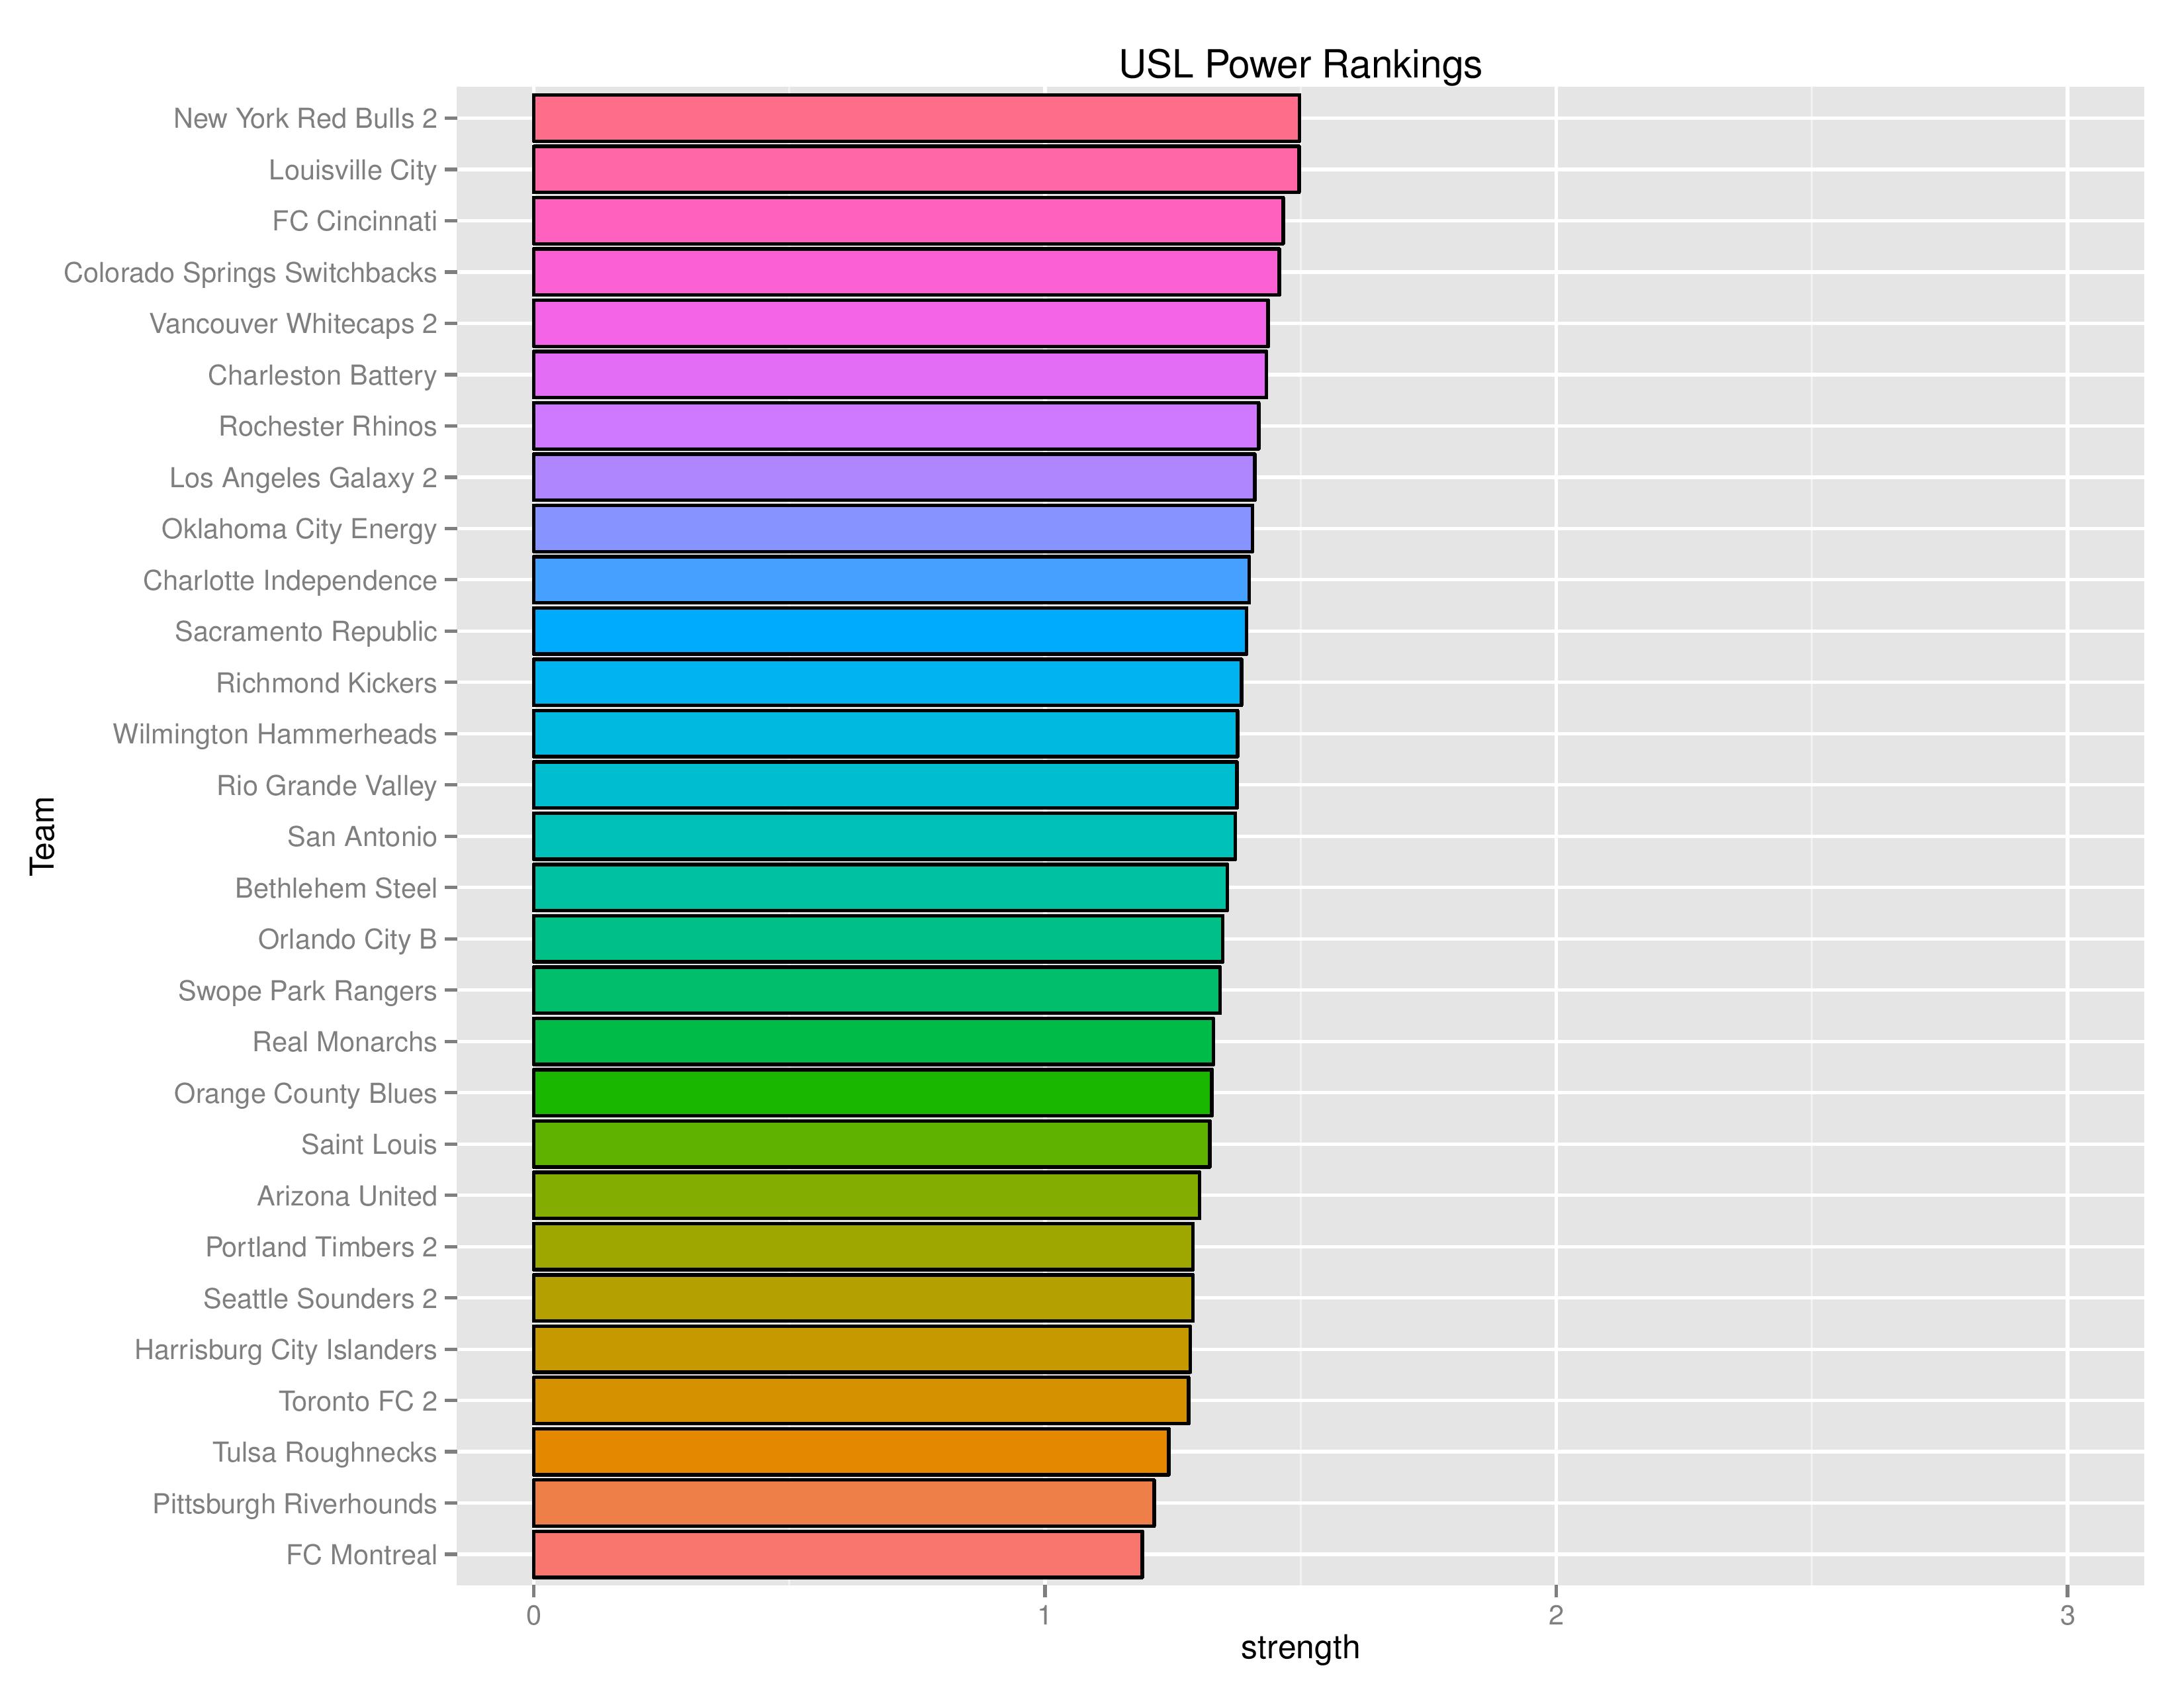
Bethlehem increased to 16th from 18th and Harrisburg City Islanders increased from 26th to 25th. USLSoccer.com‘s top 10 rankings do not include either team, but Bethlehem was mentioned in the “Best of the Rest”.
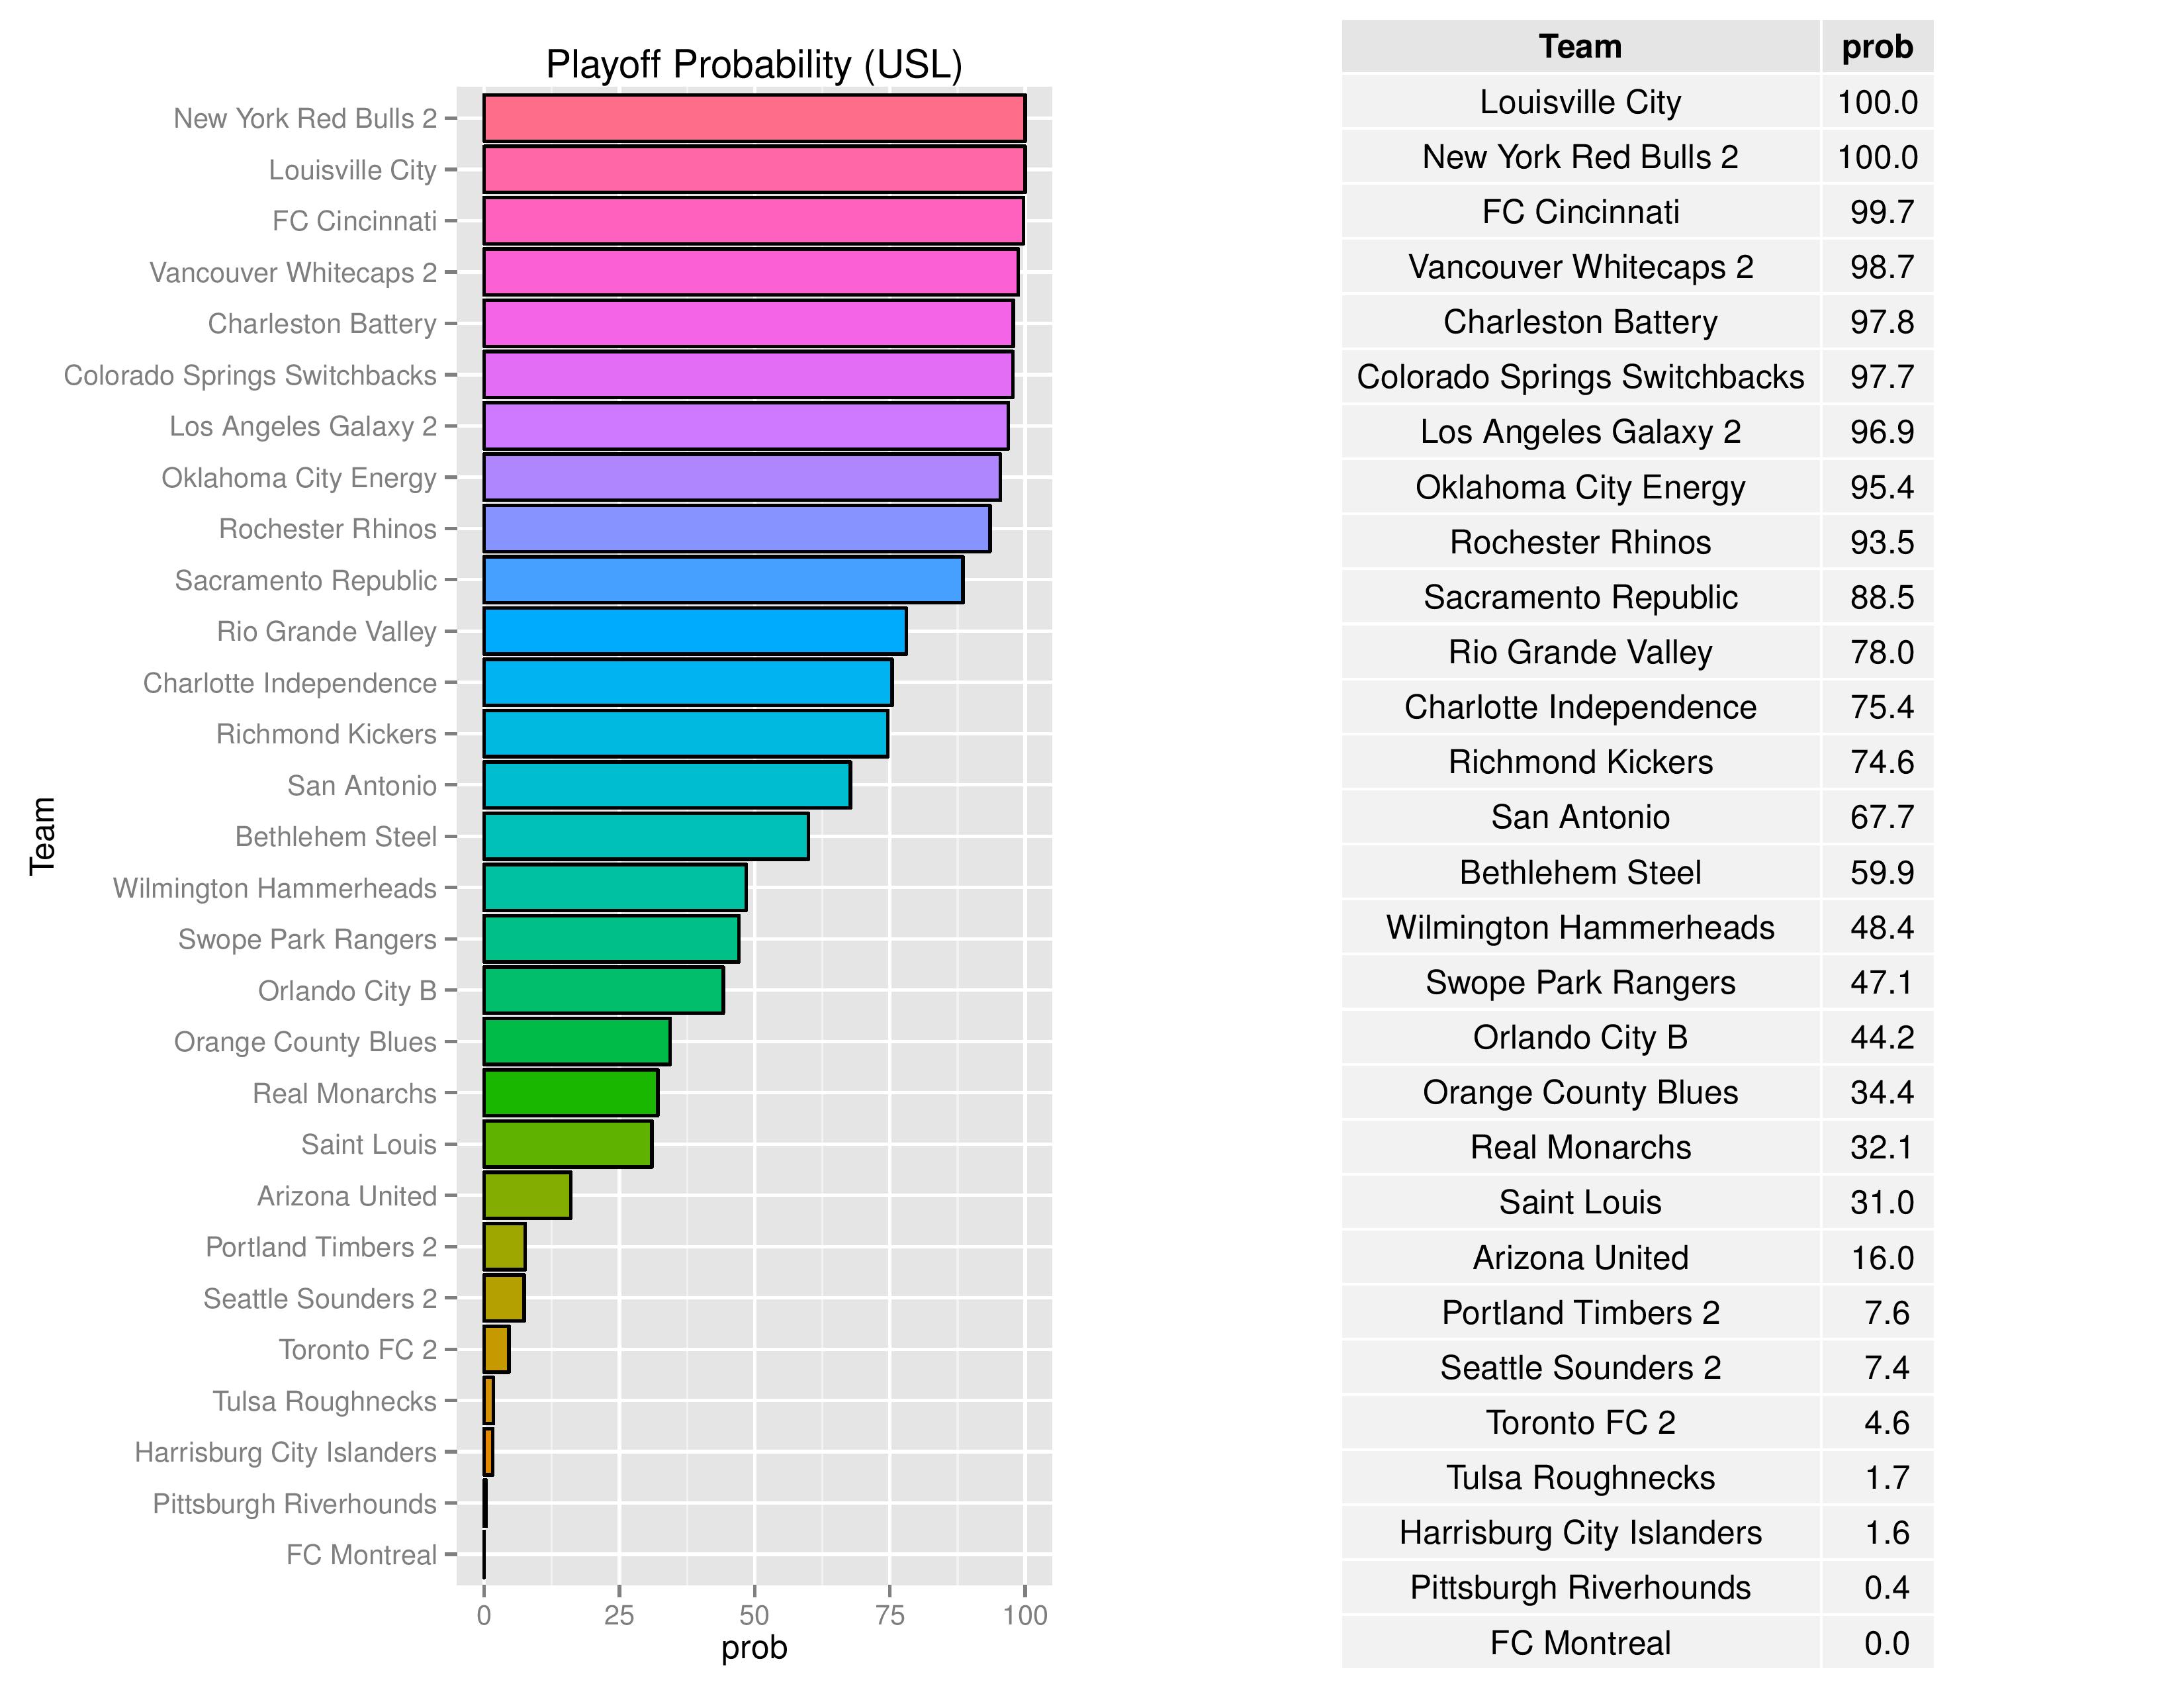
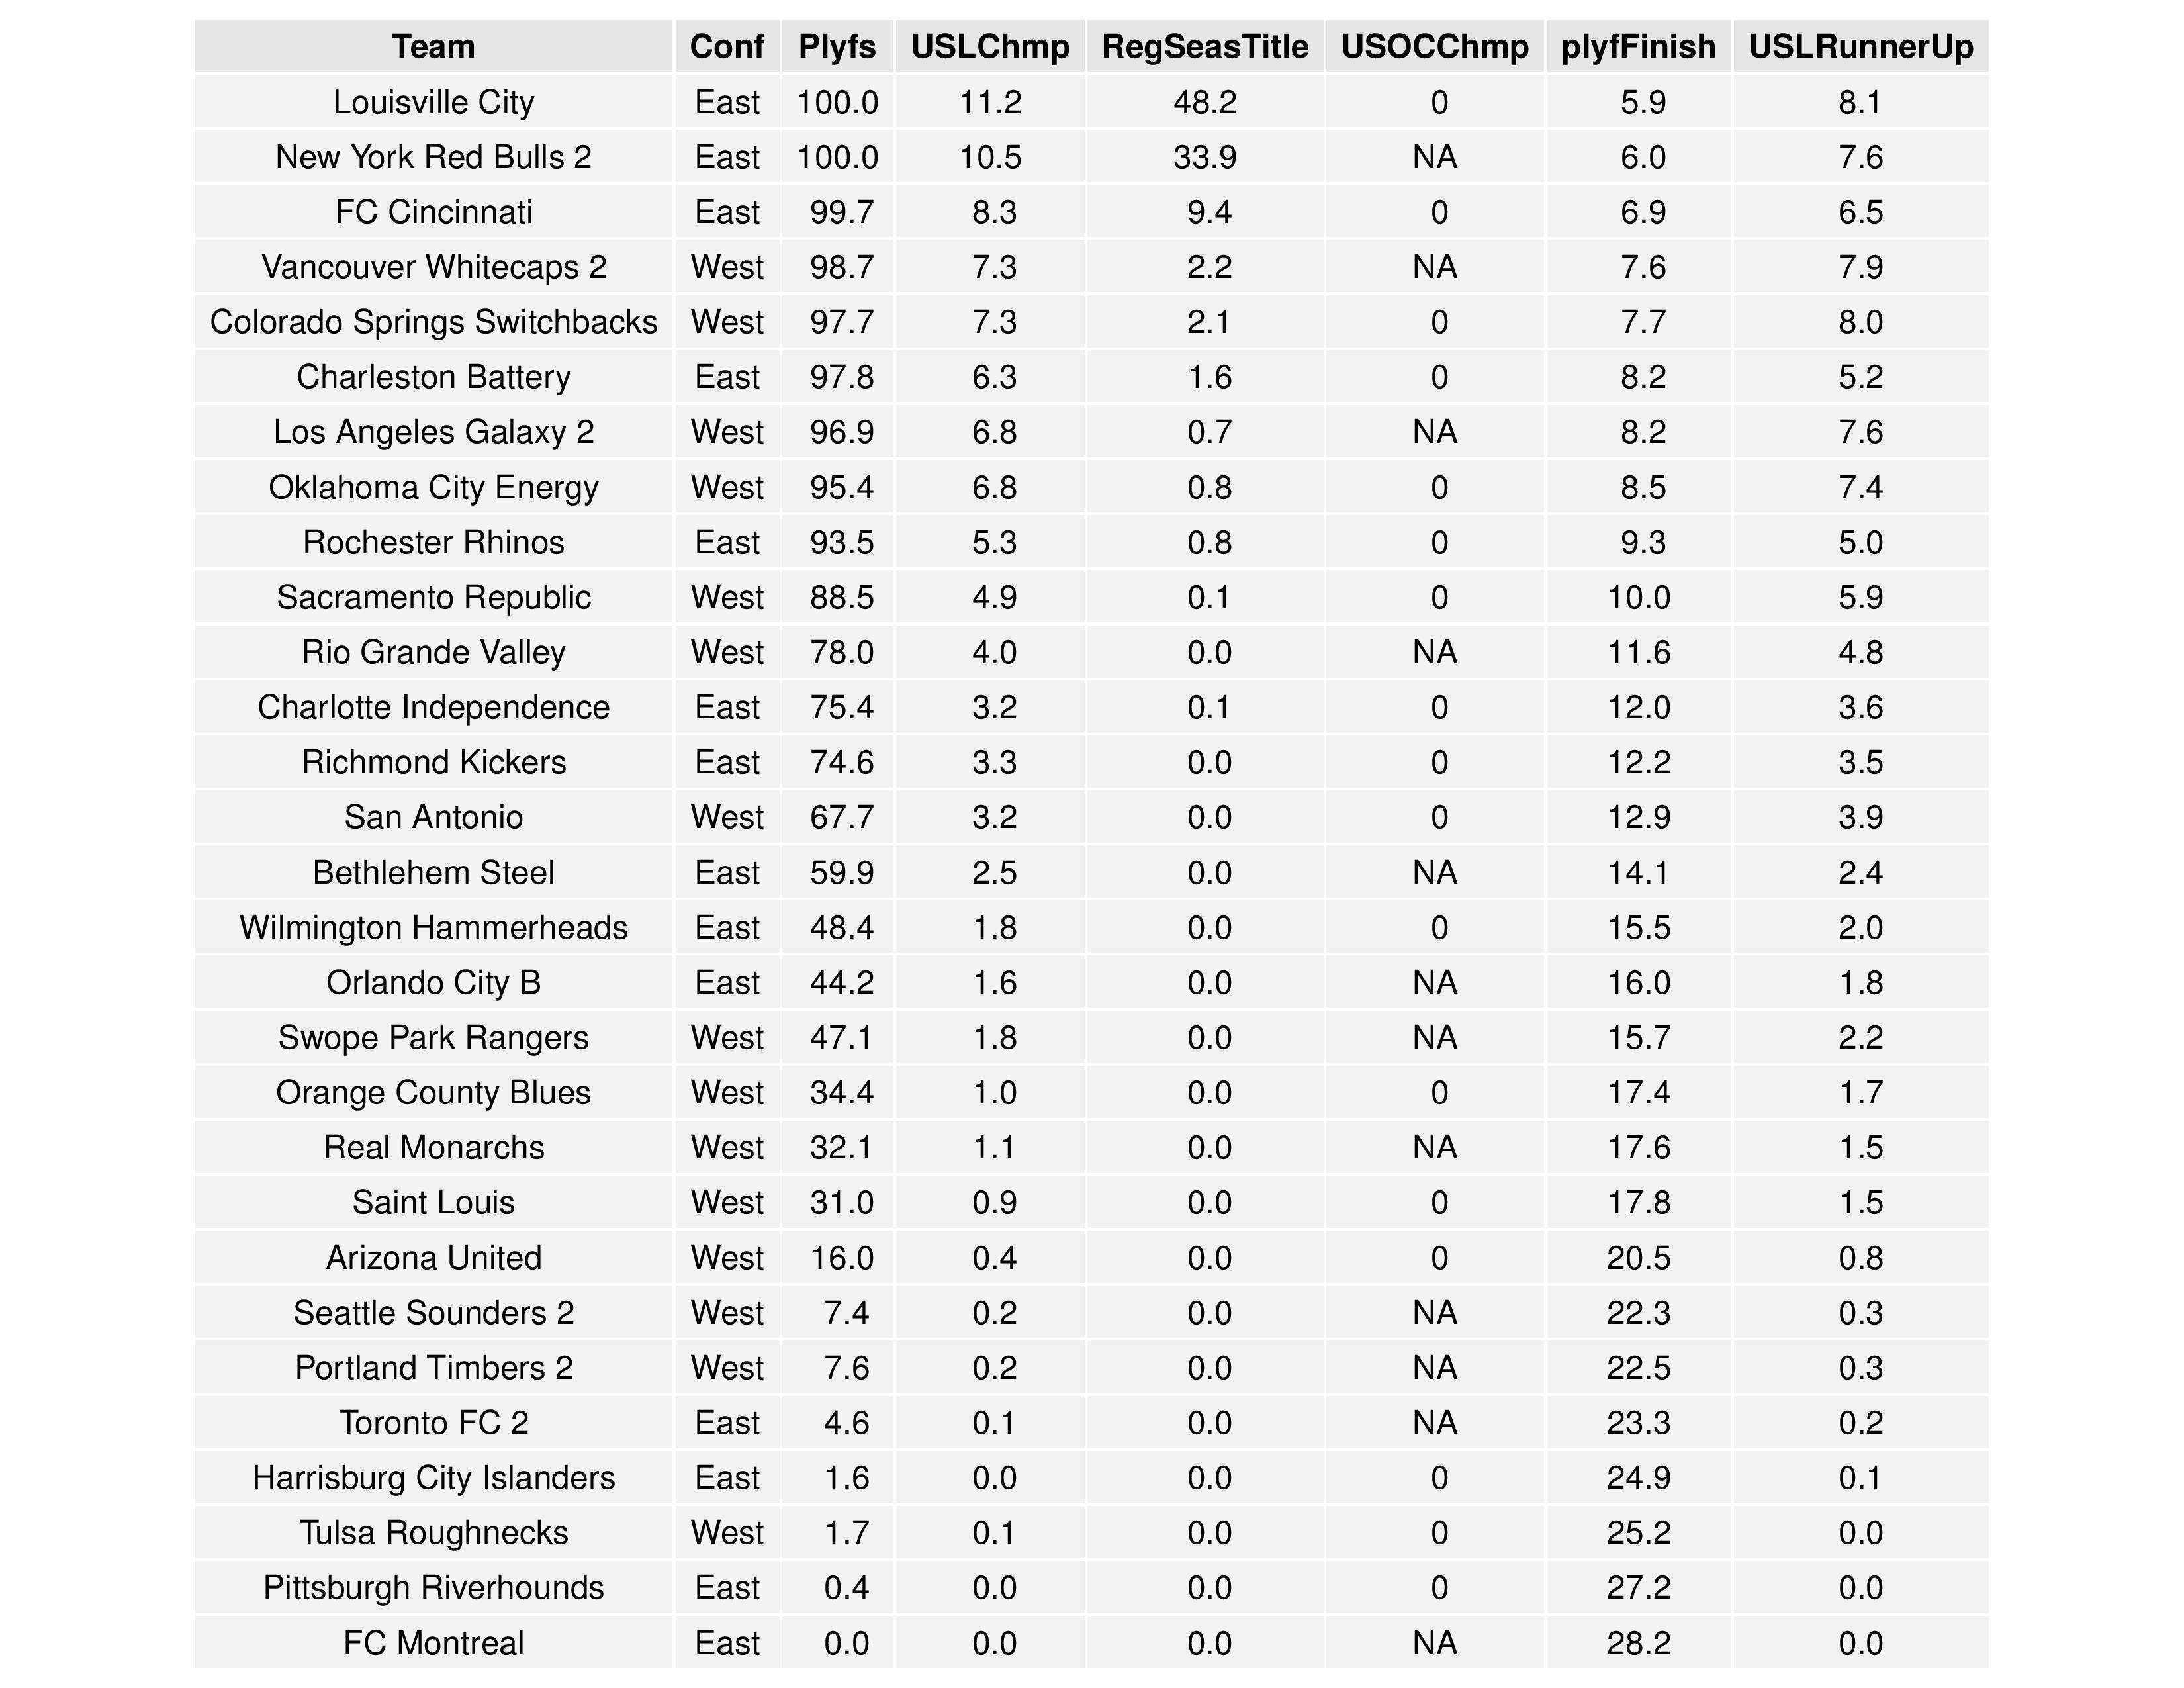
Bethlehem’s probability of making the playoffs rocketed up from 43.3% to 59.9%. Harrisburg City’s increased to 1.6% from 0.7%.
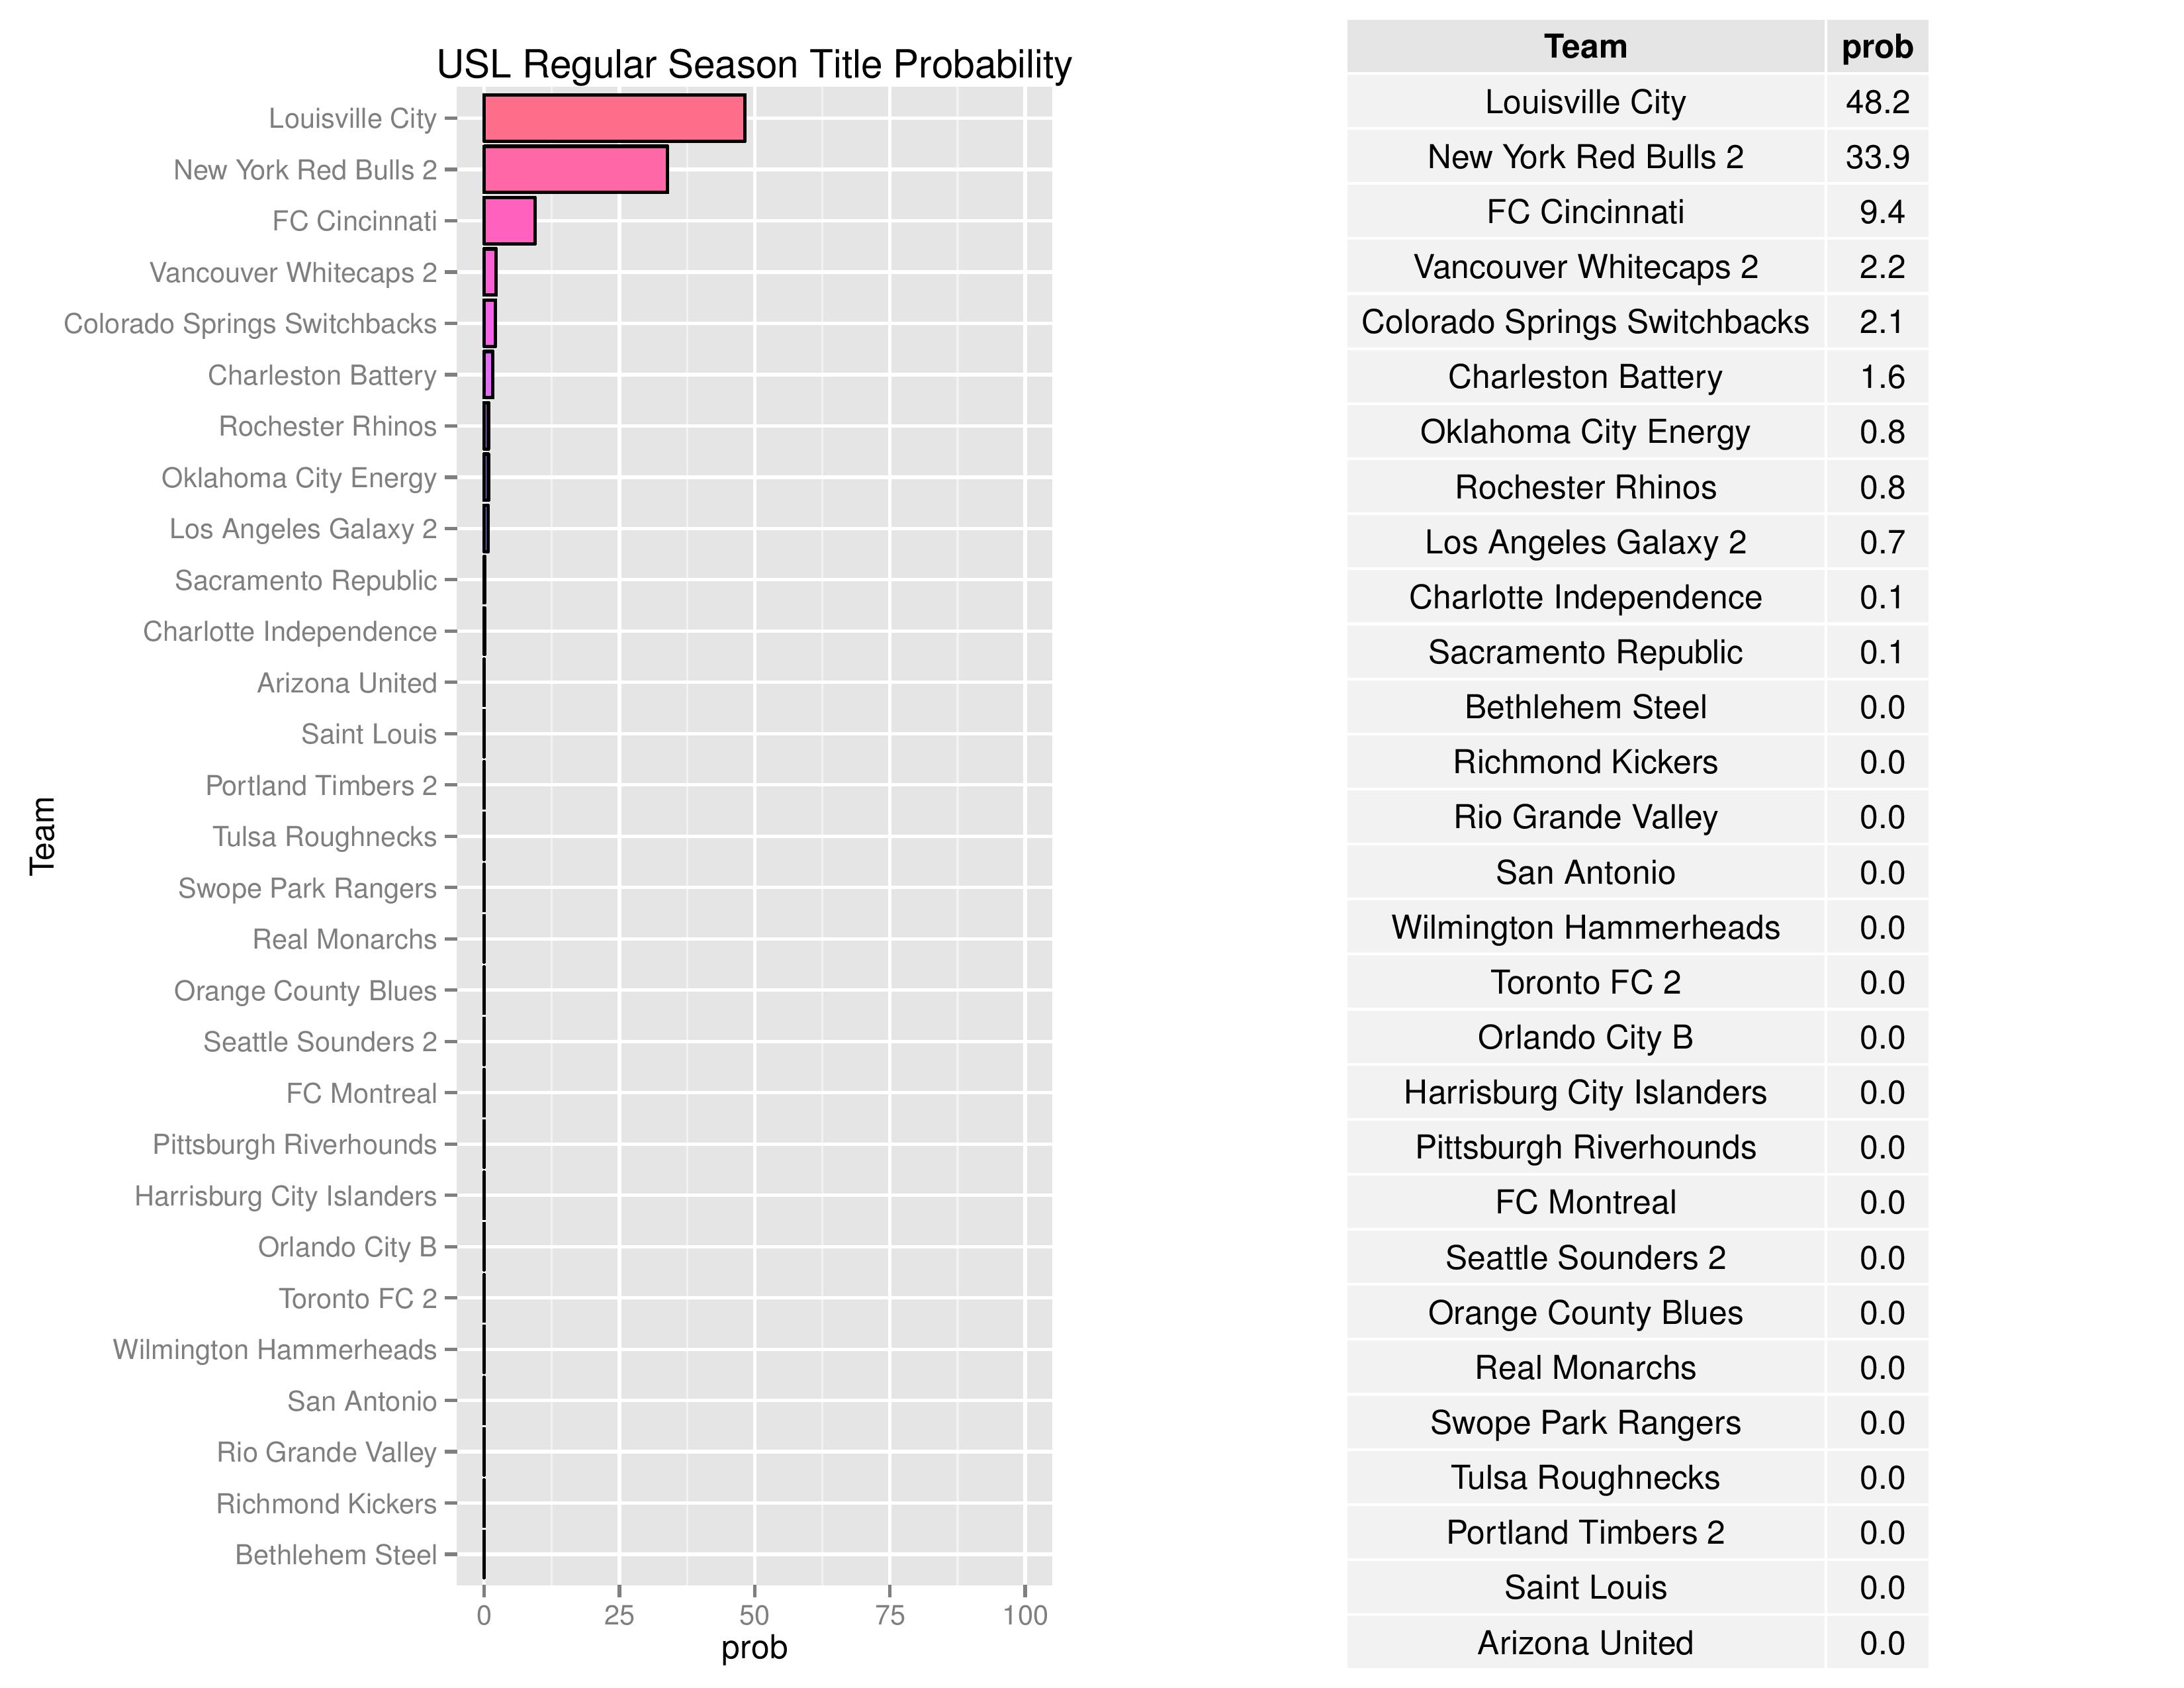
Both Bethlehem and Harrisburg City have no chance of winning the USL regular season title.
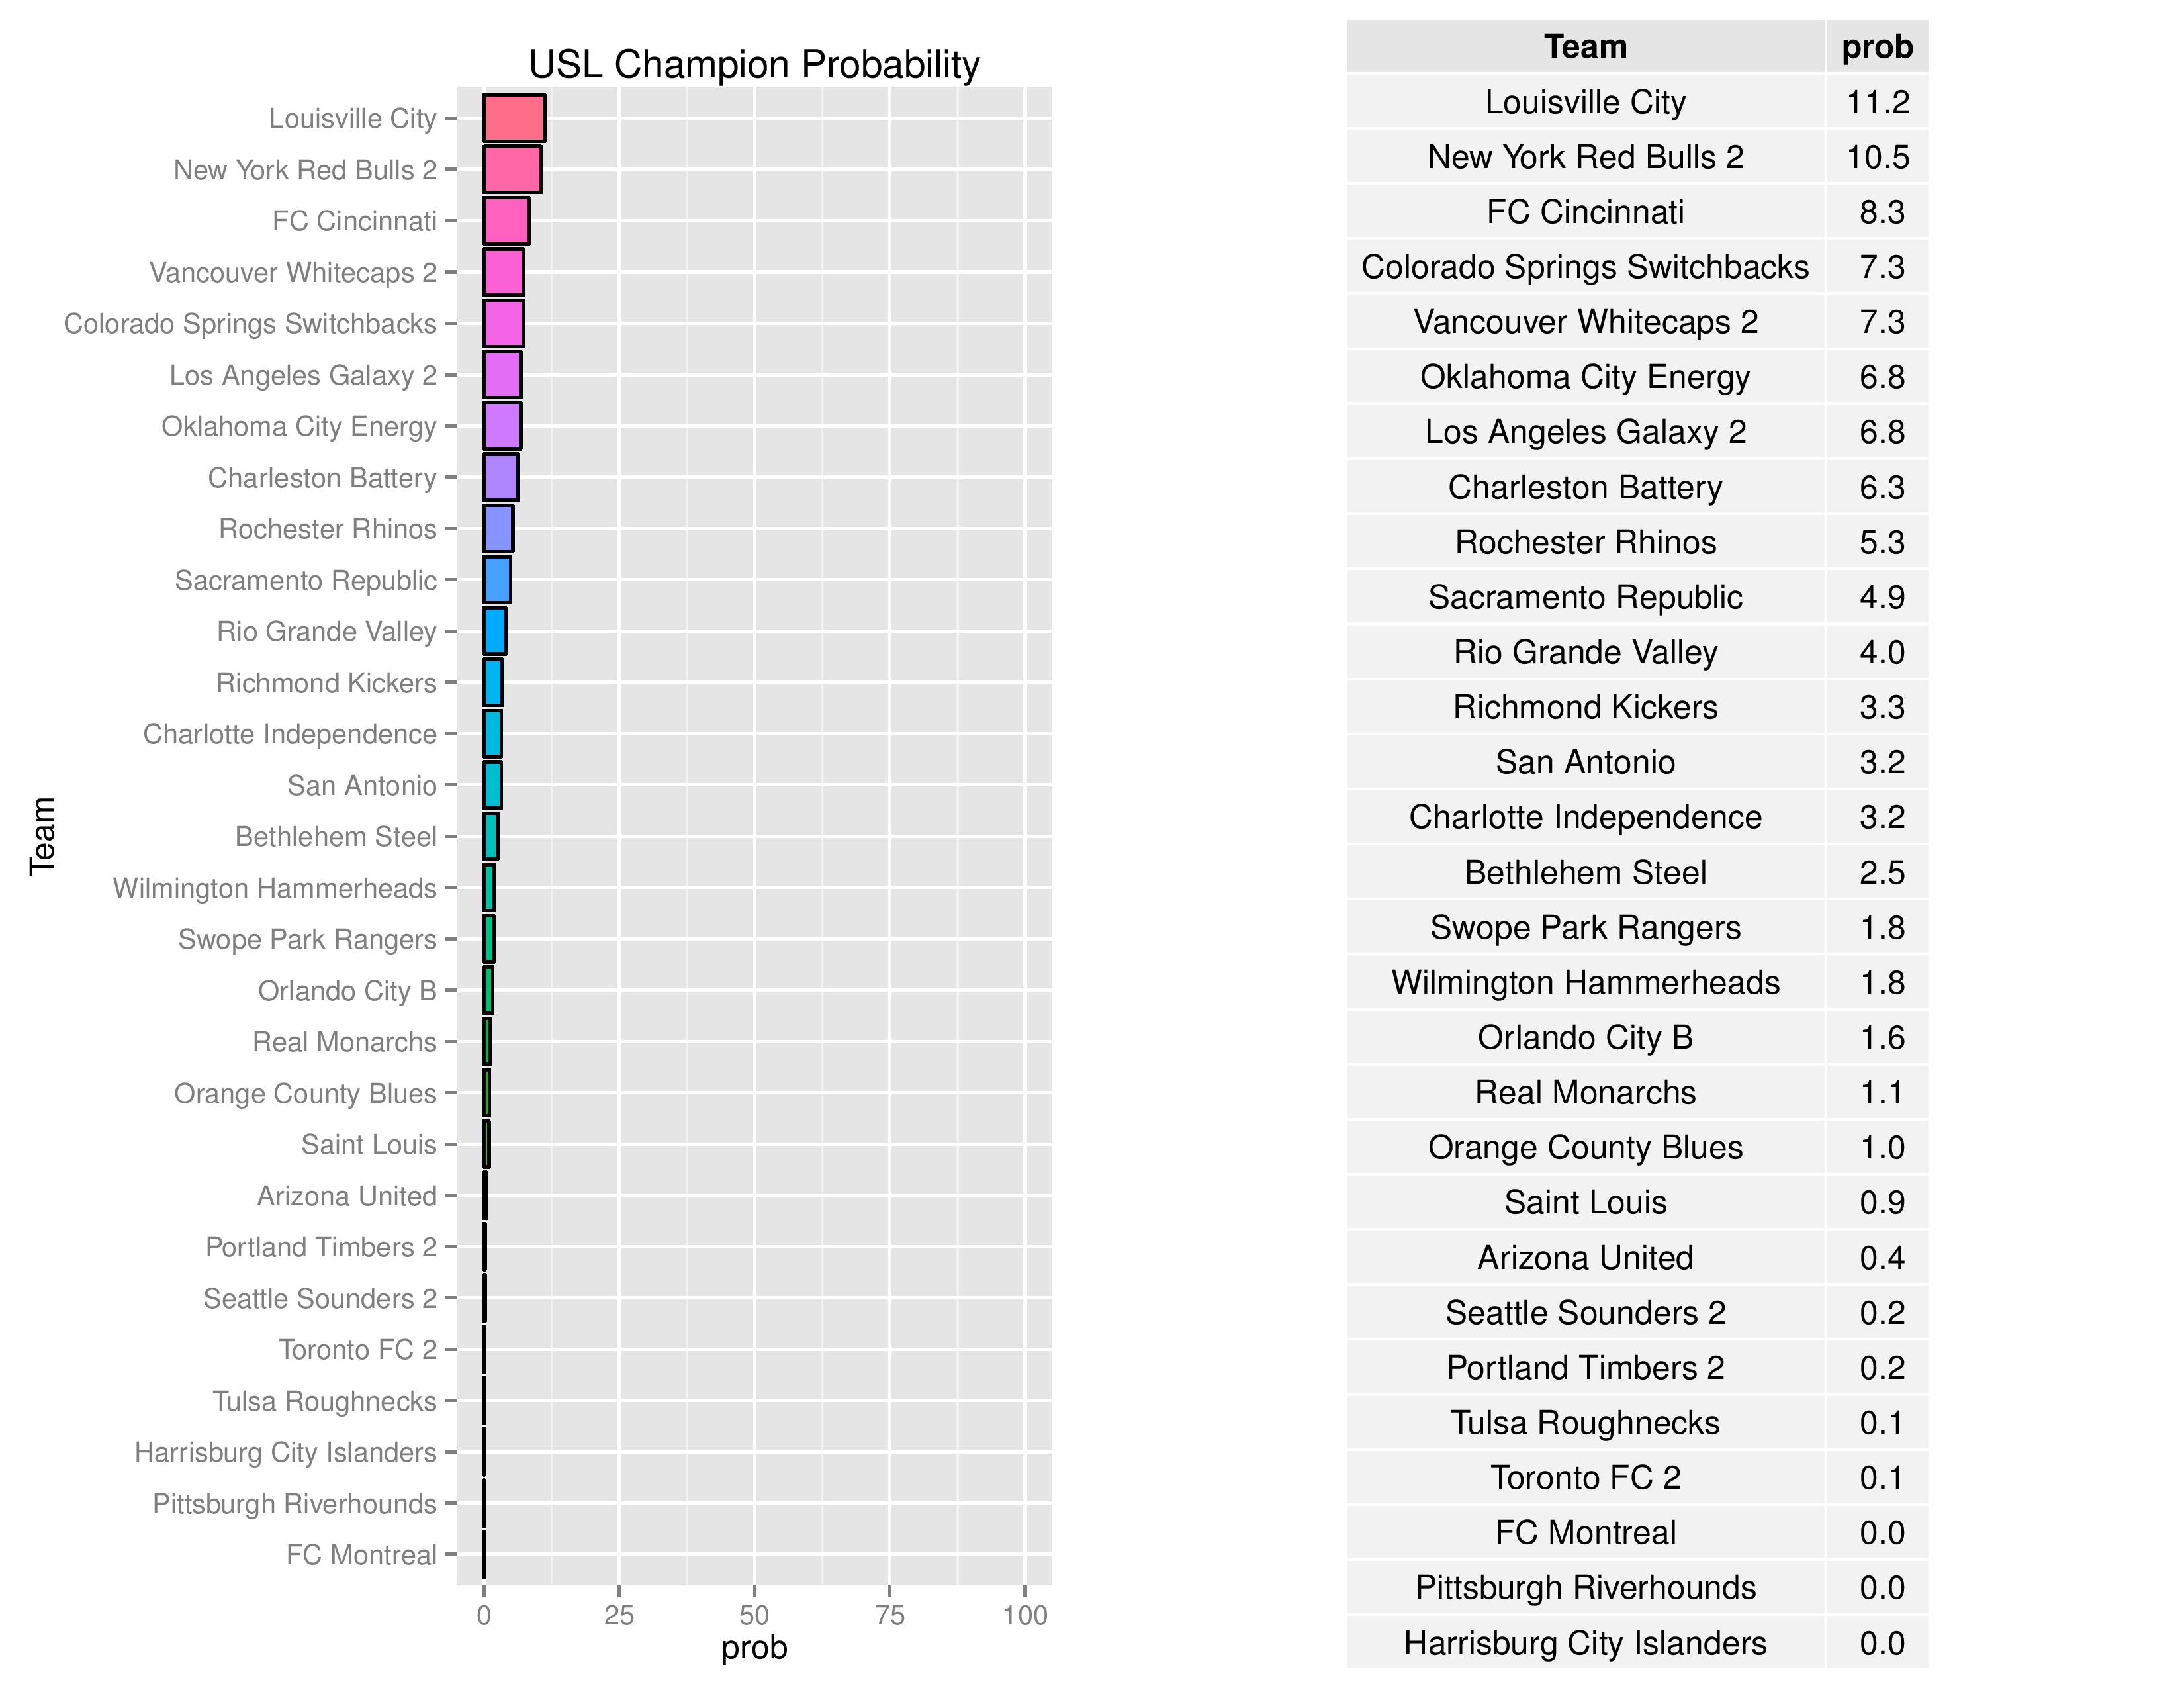
Bethlehem’s probability of winning the USL Championship increased from 1.5% to 2.5%. Harrisburg City’s chances are still near 0% (as they have a chance at the playoffs, they must have a chance at the cup, but < 1/15000).
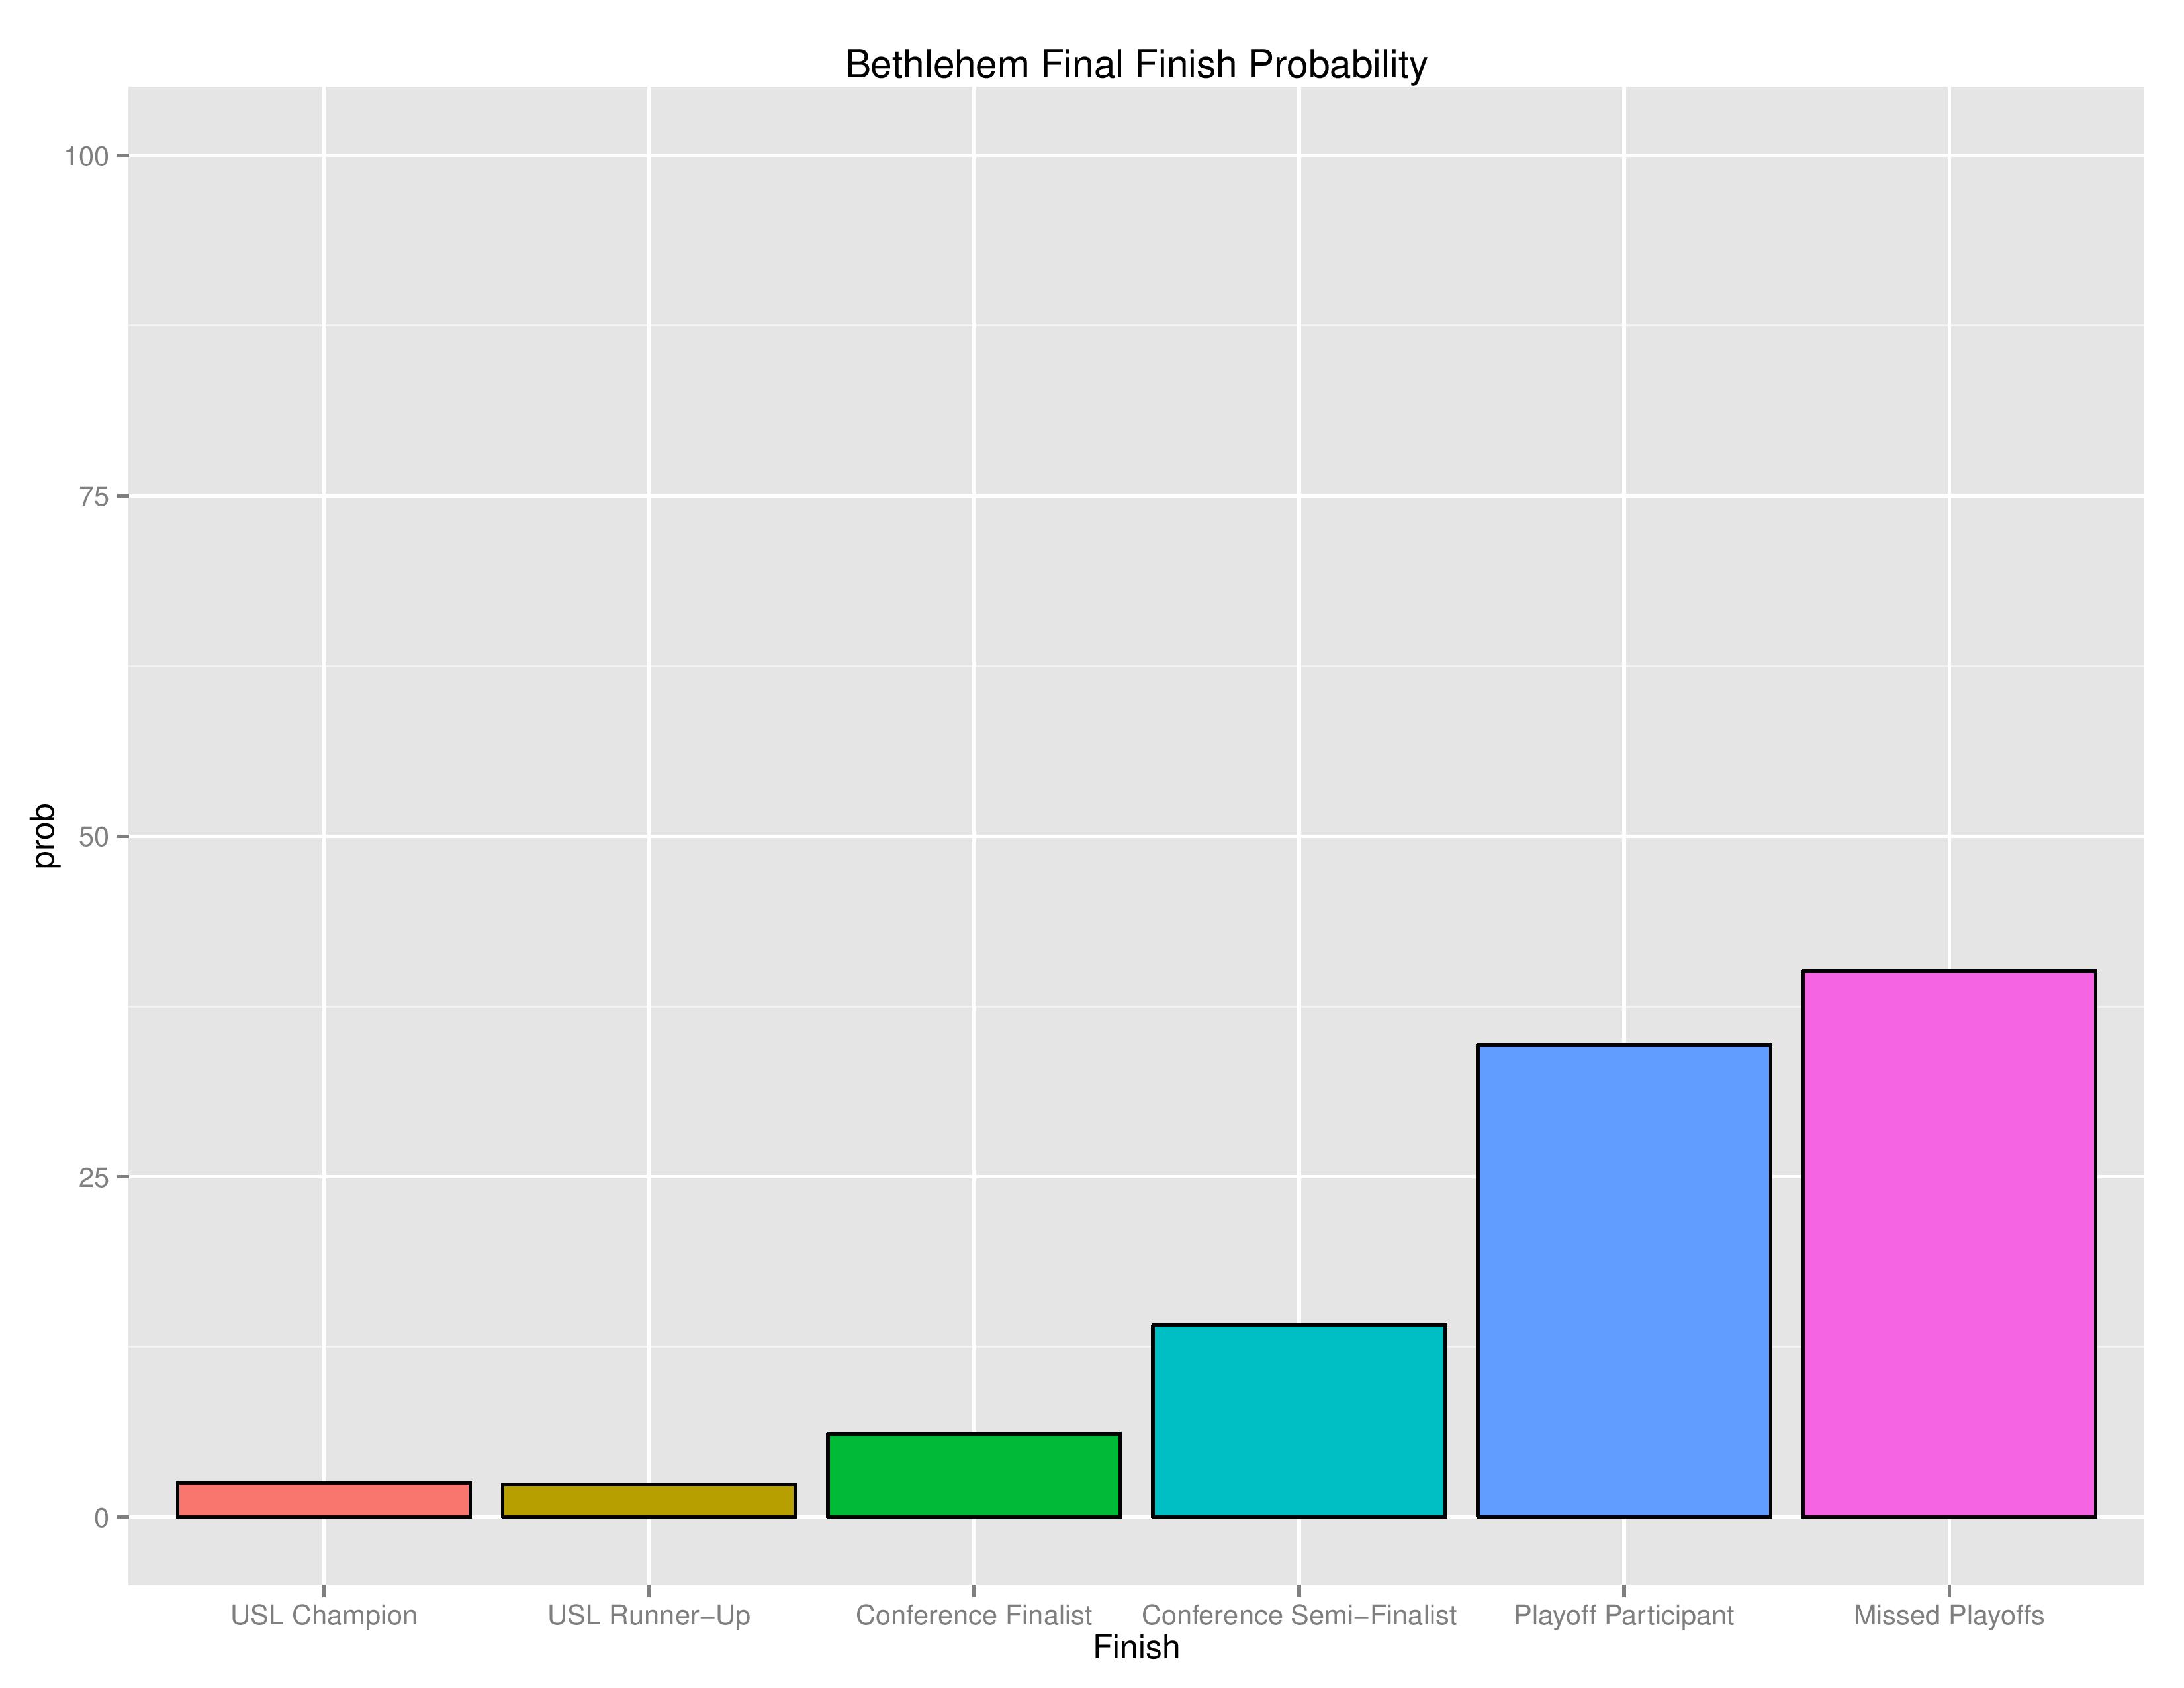
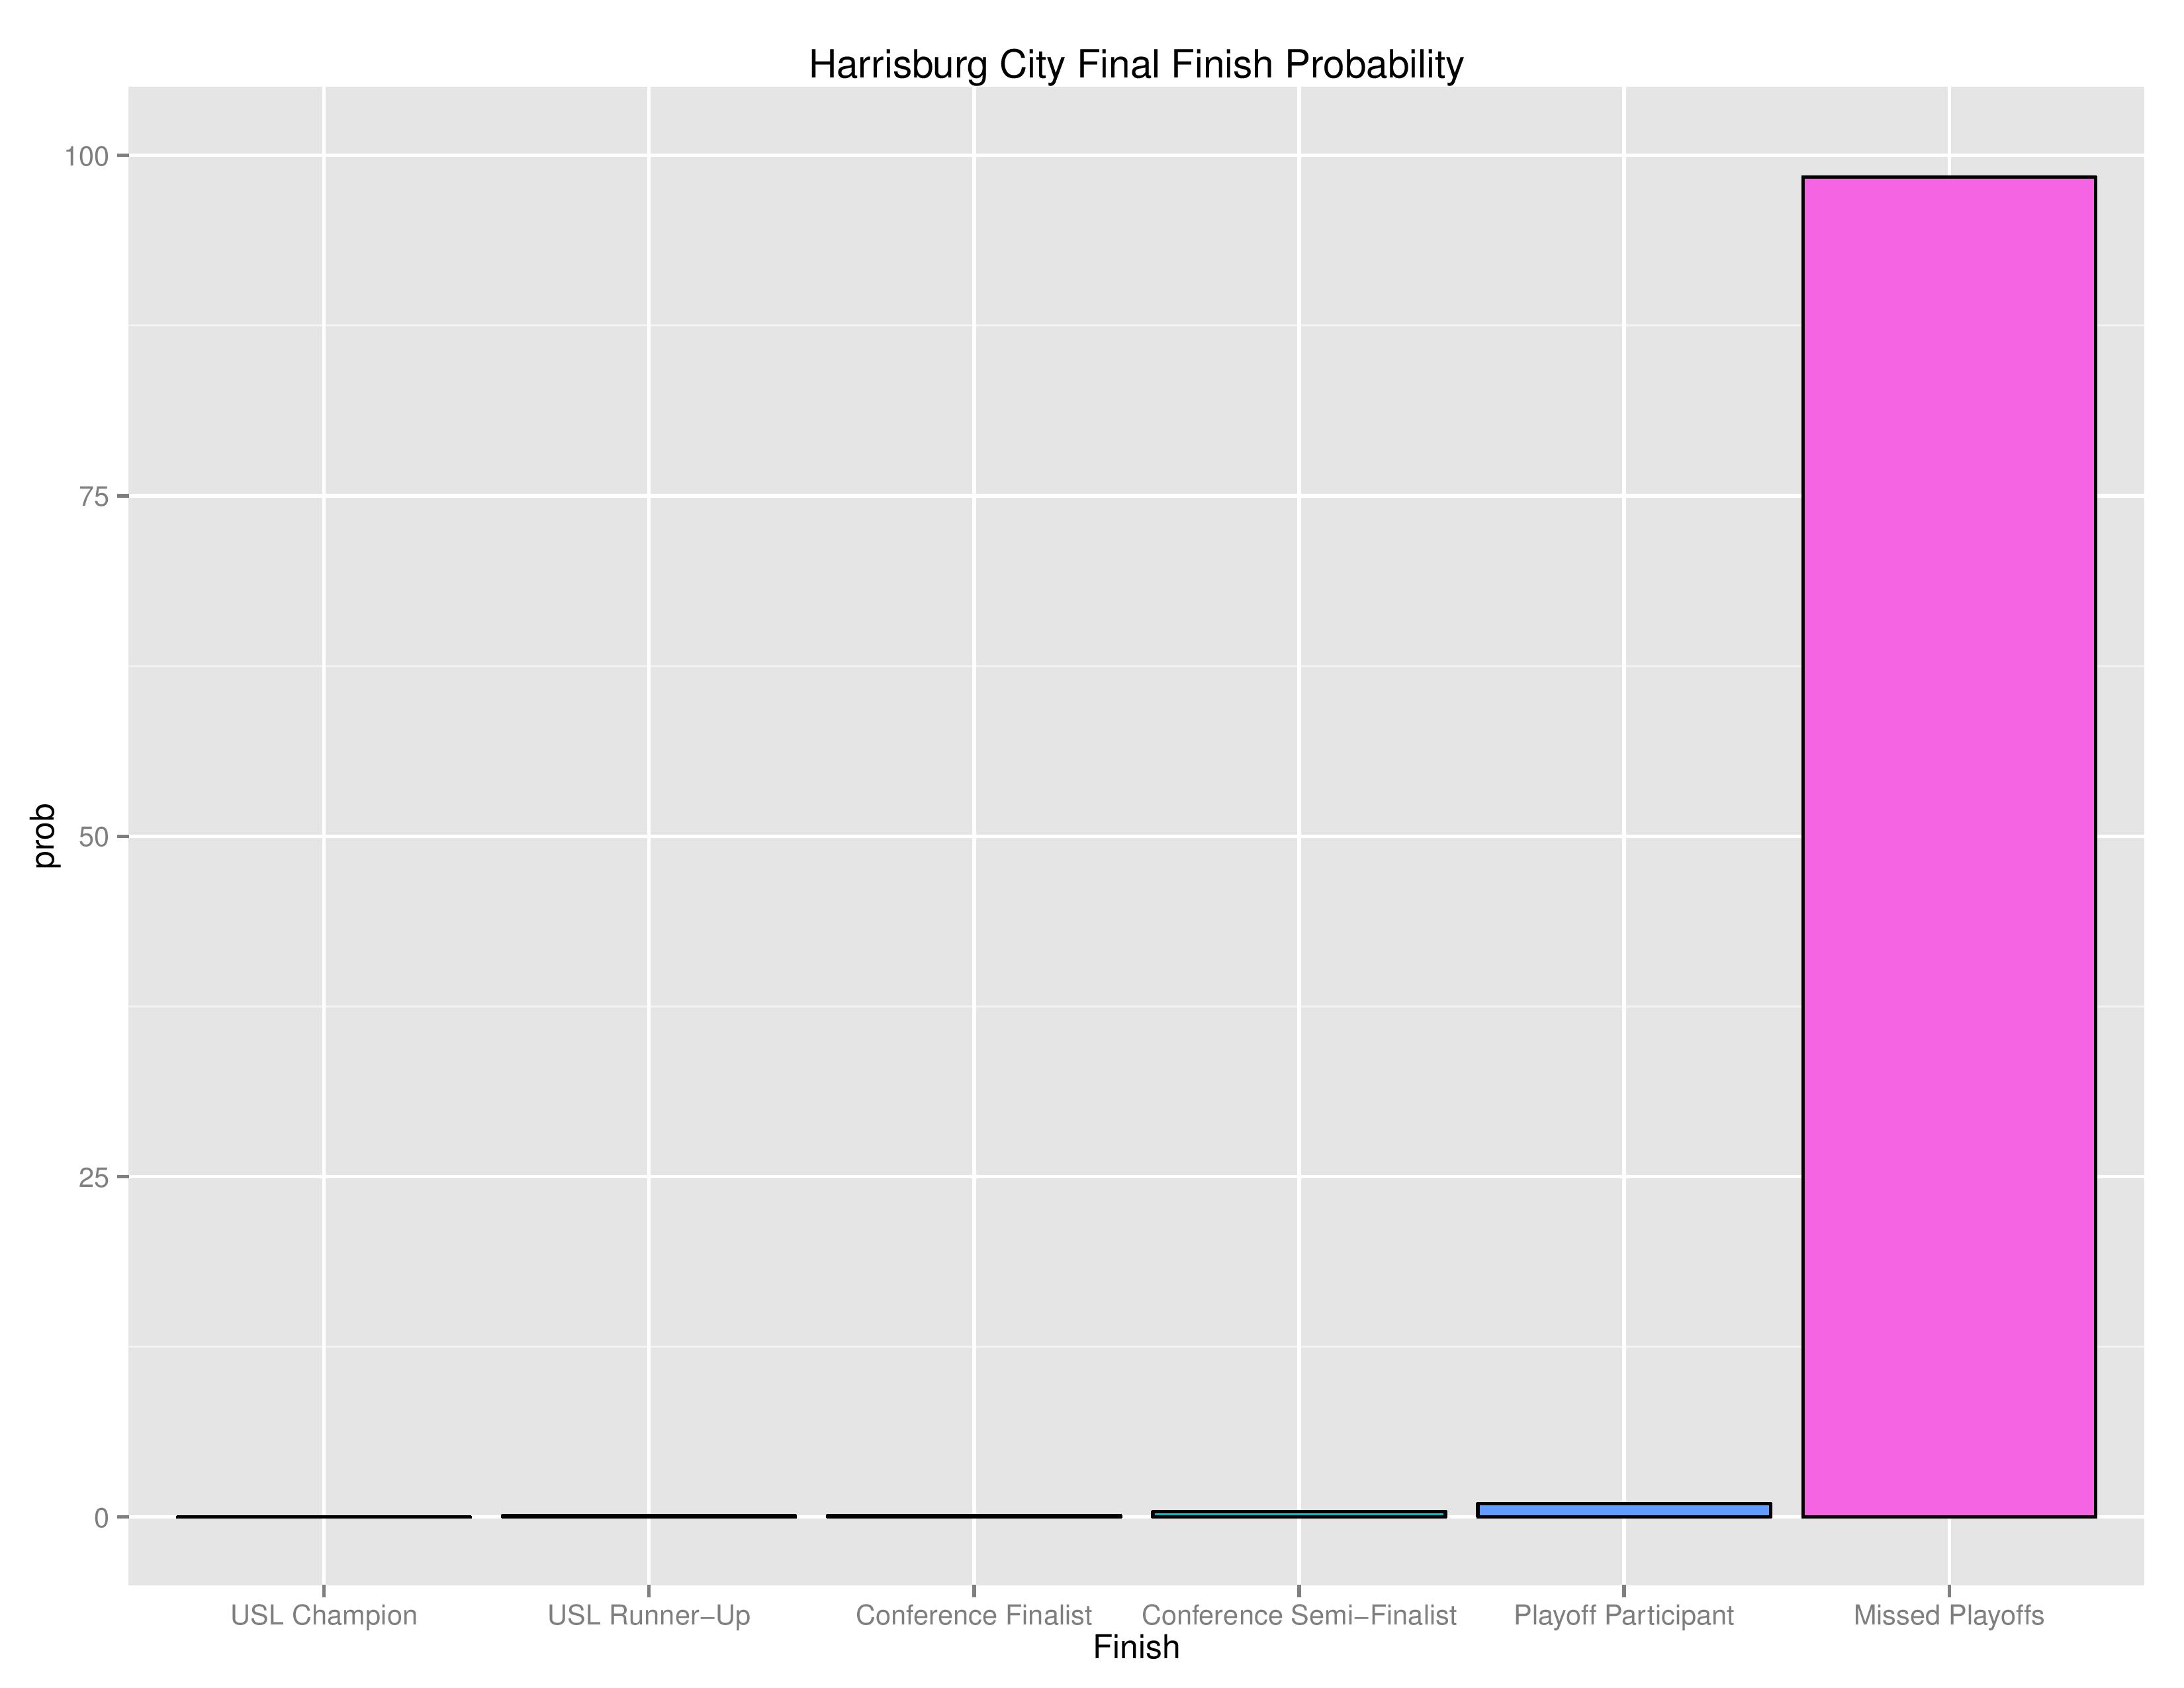
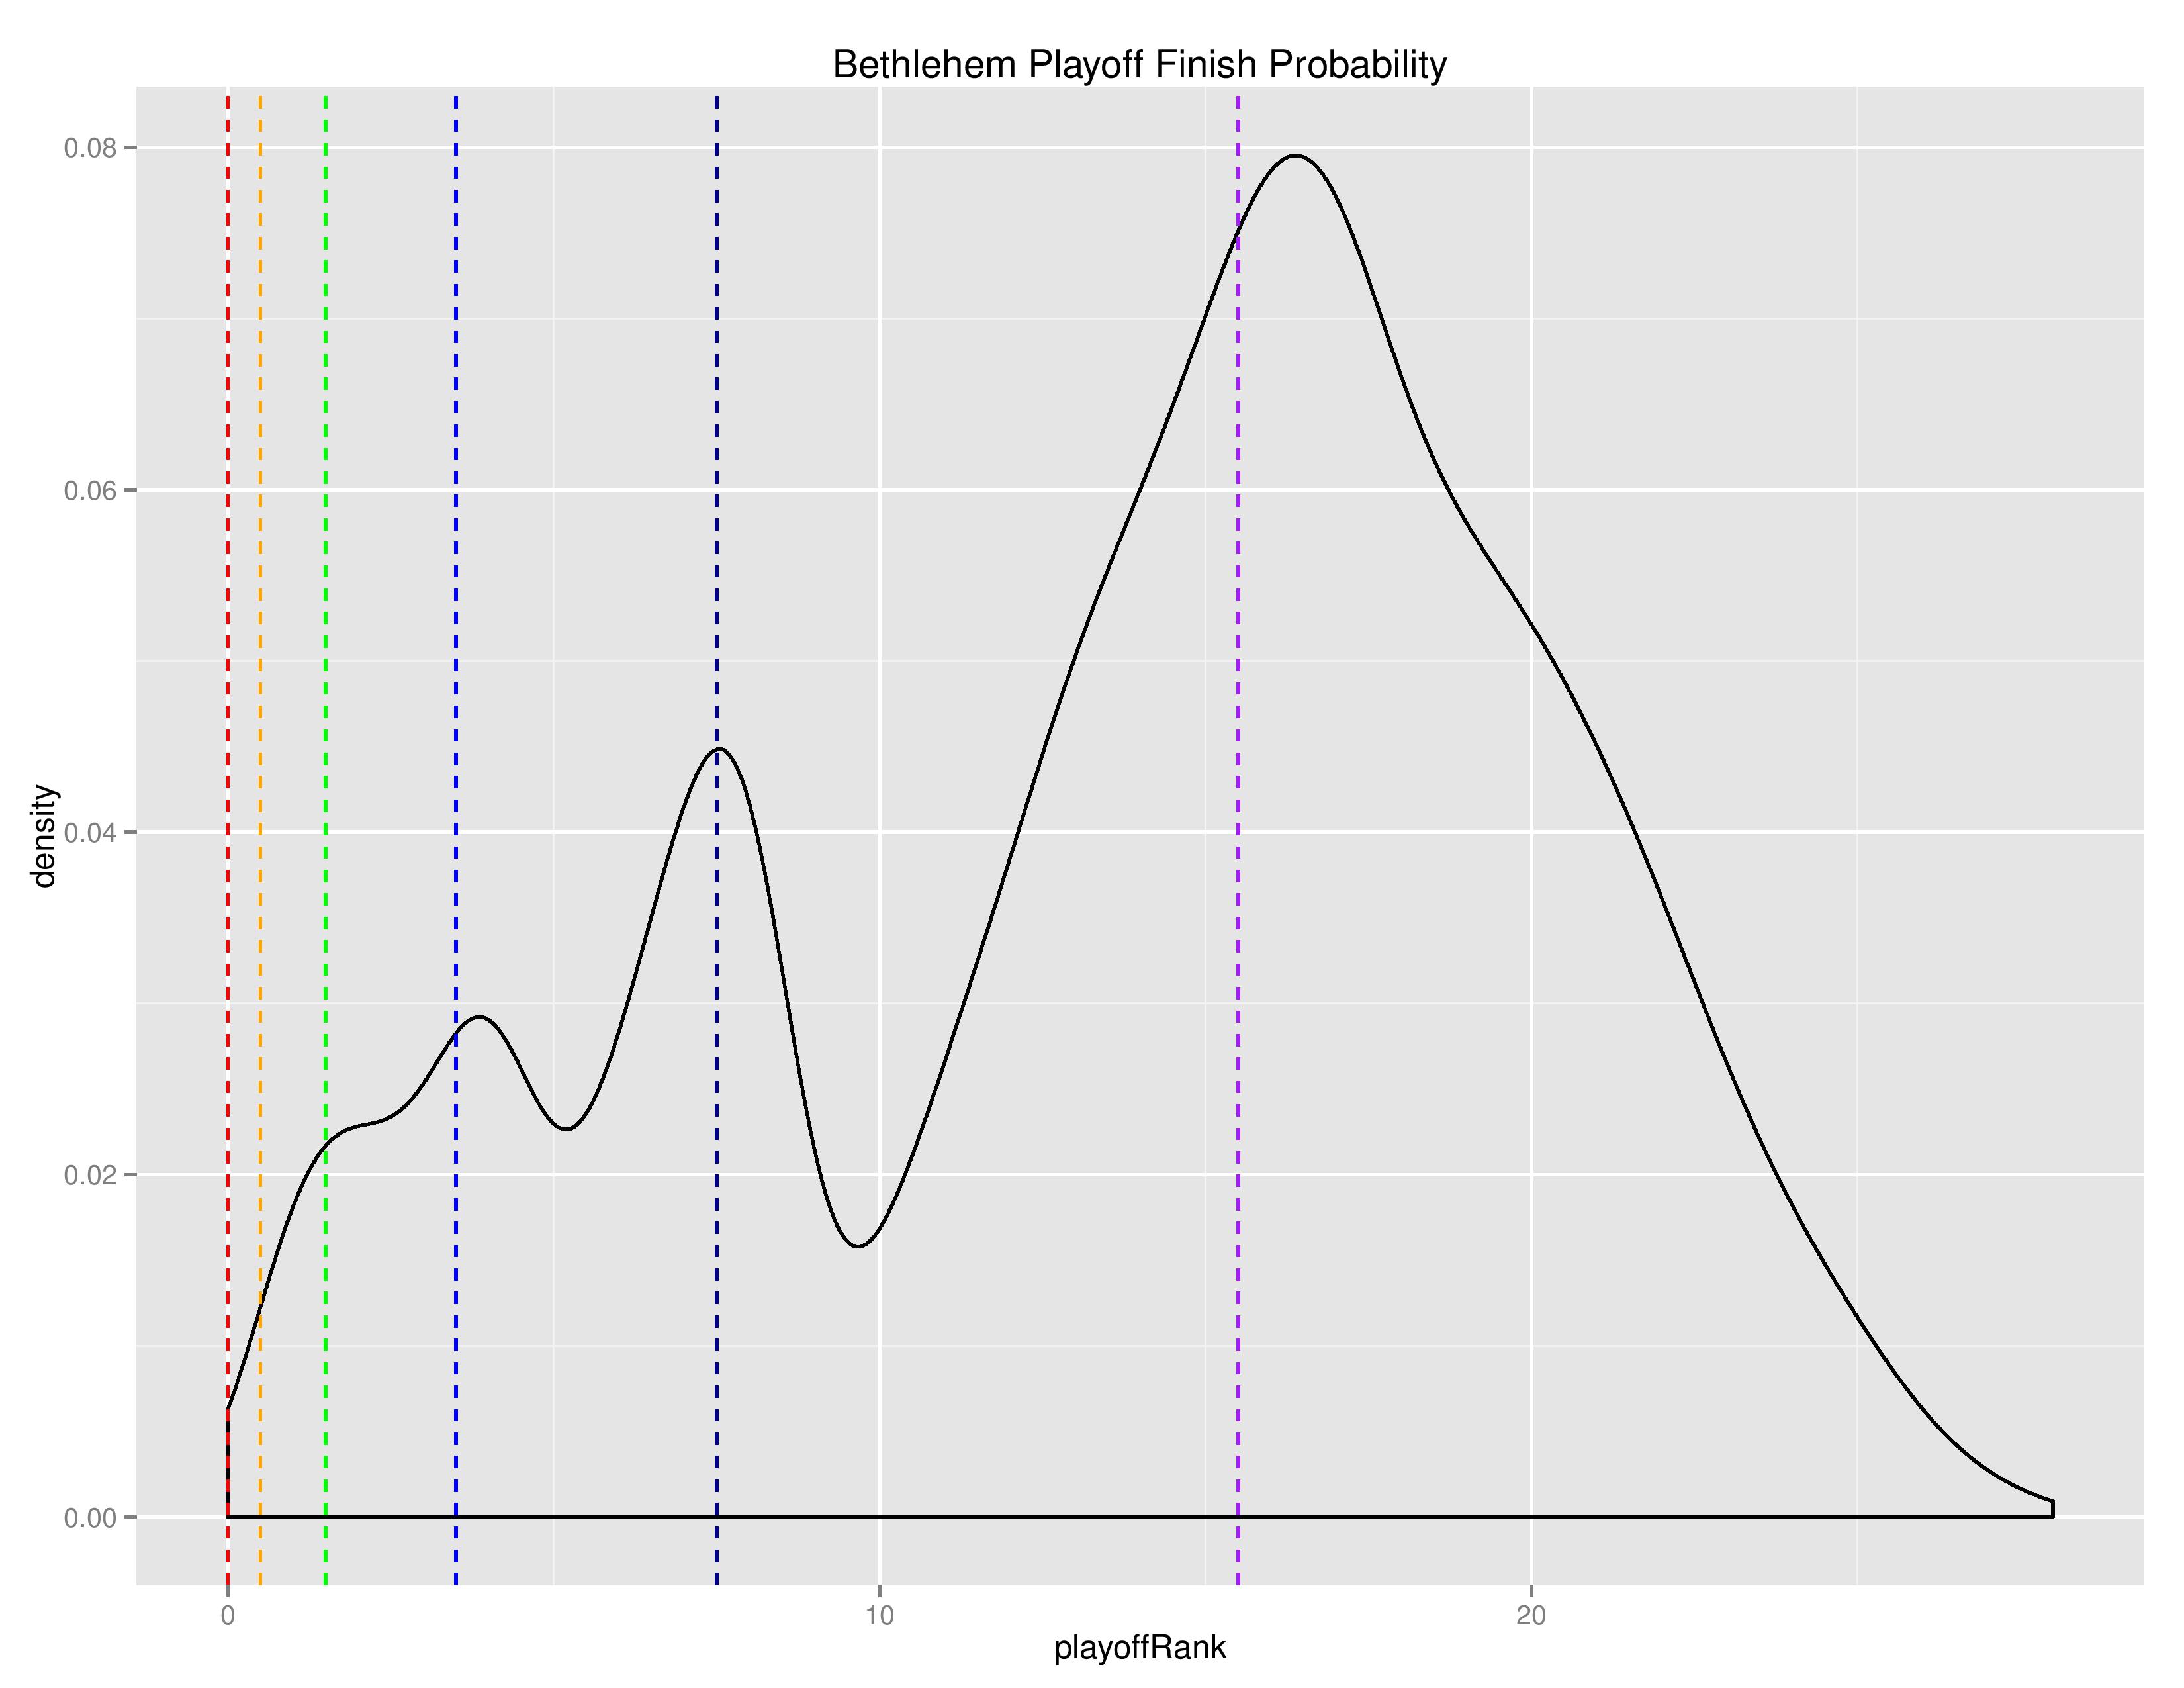
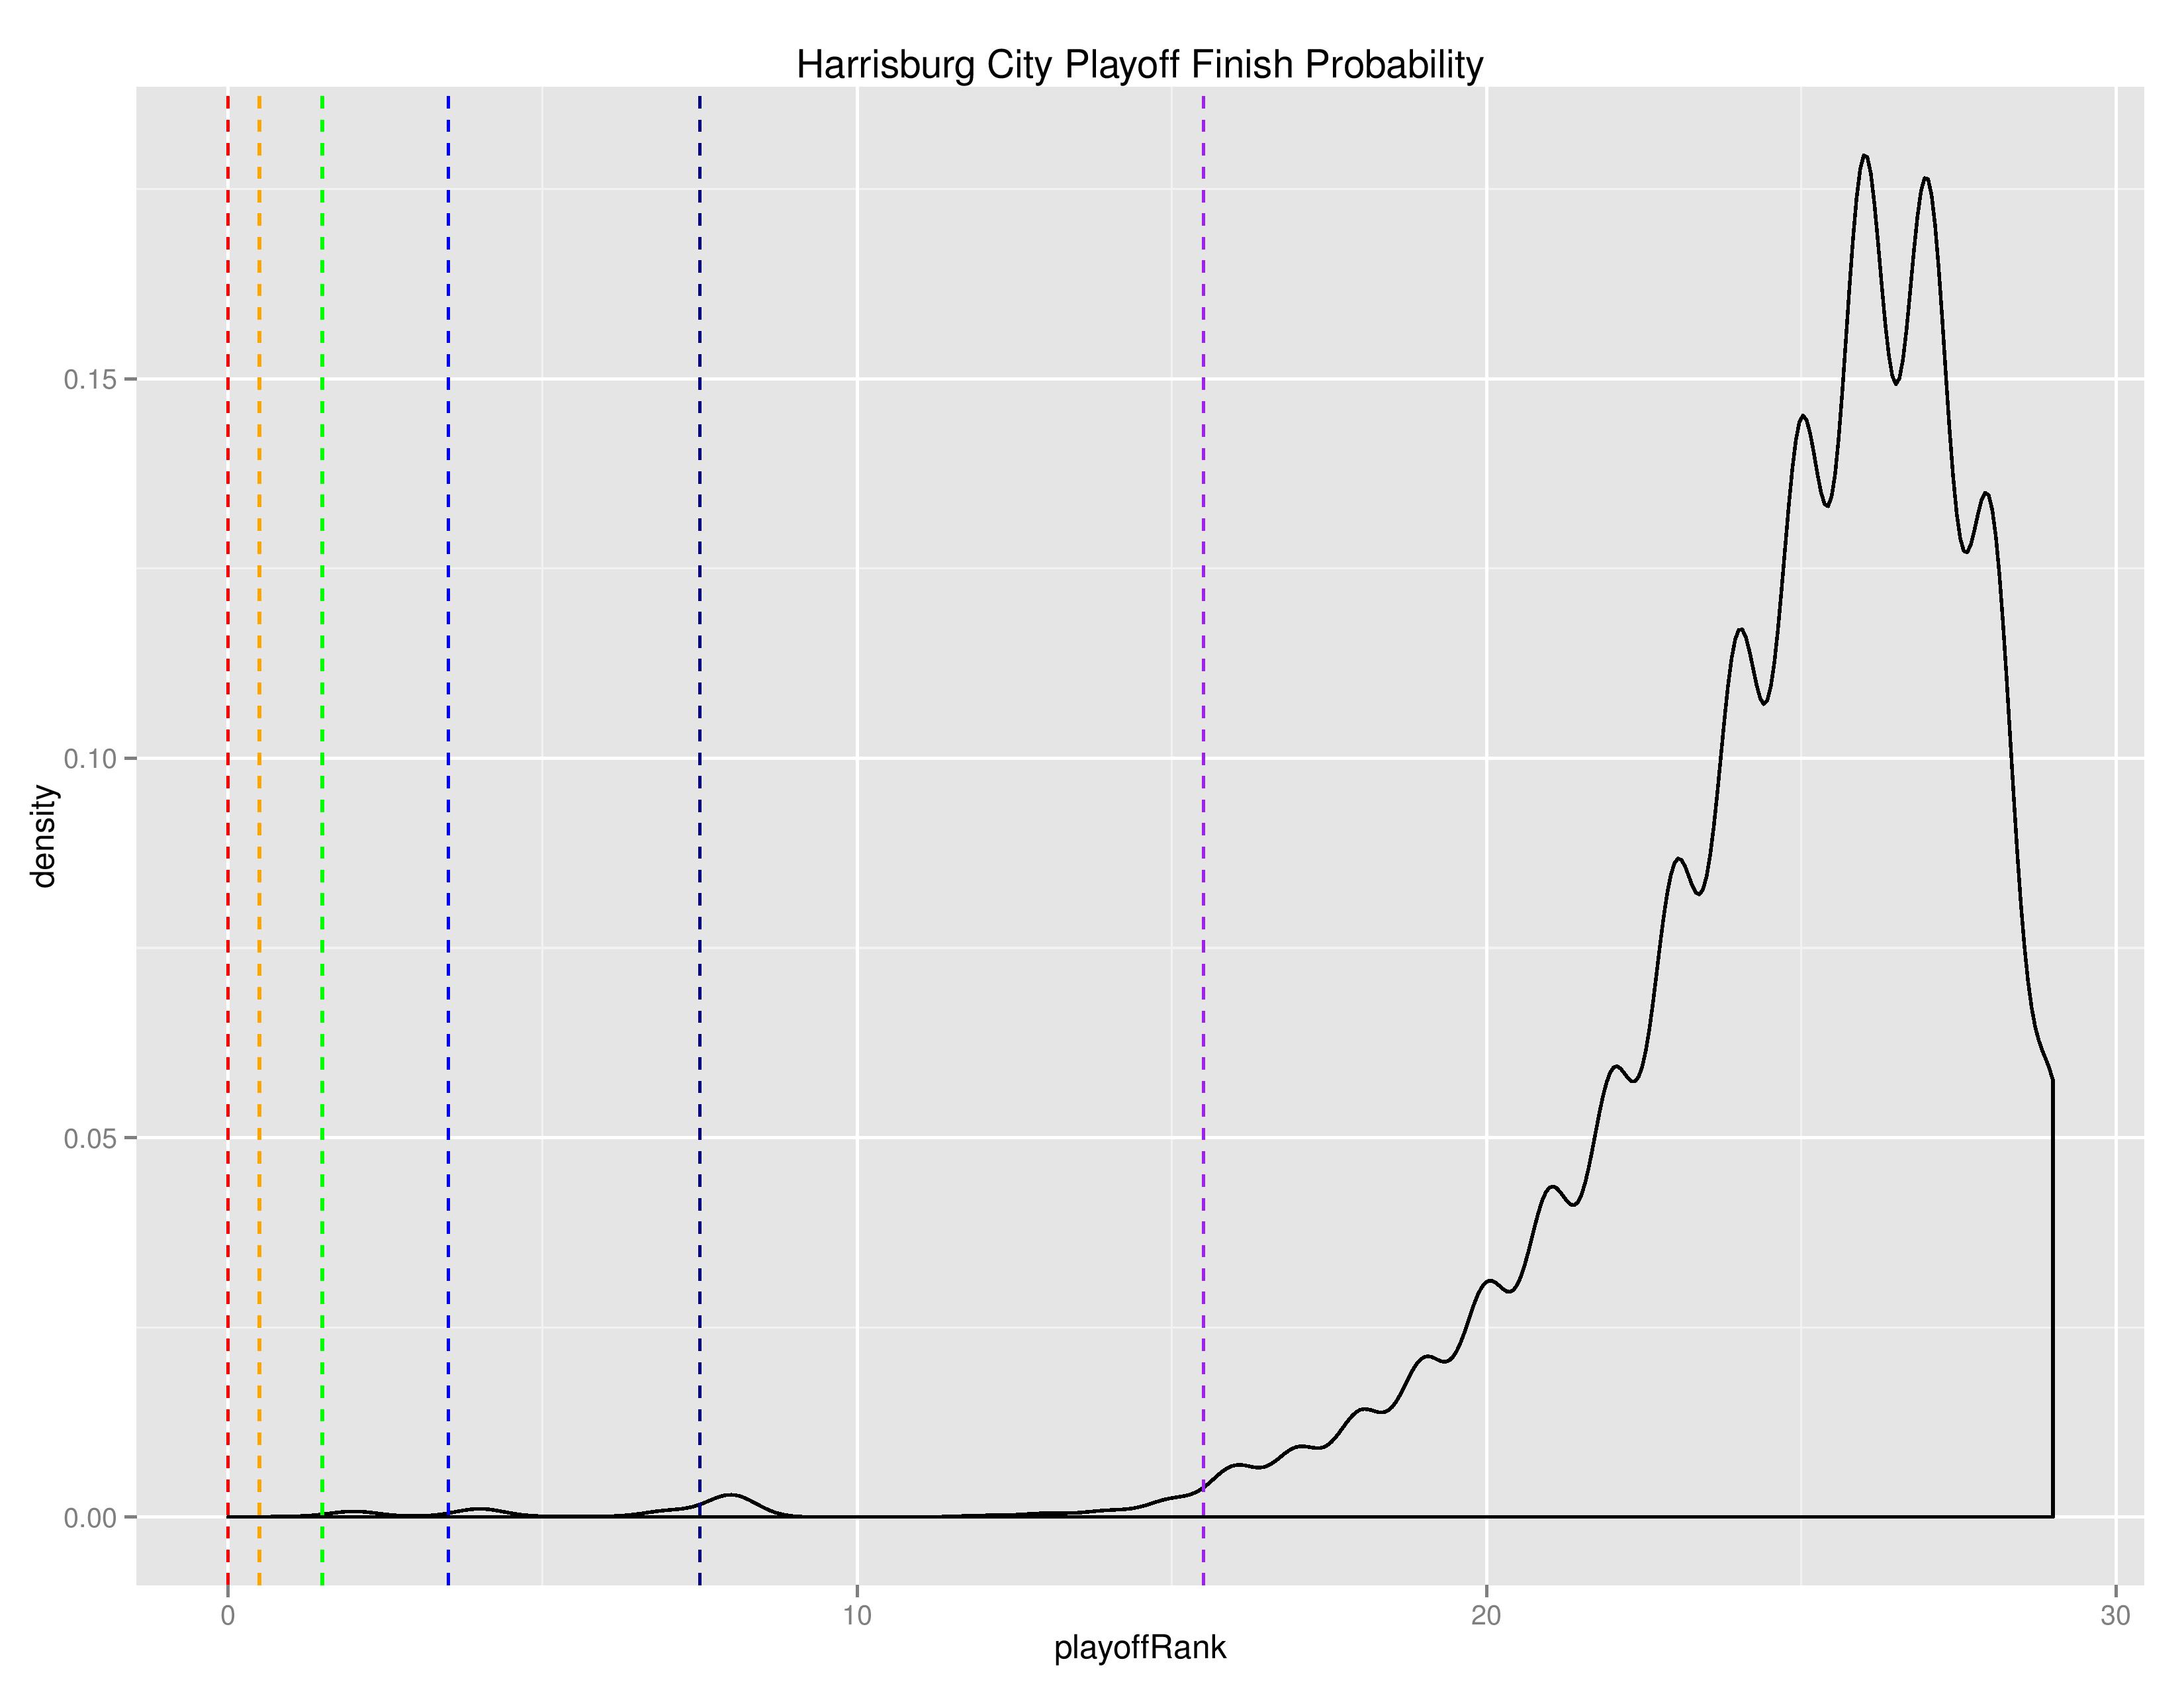
As with MLS, the below density charts show the relative probabilities of Bethlehem and Harrisburg finishing for their final playoff-rank.
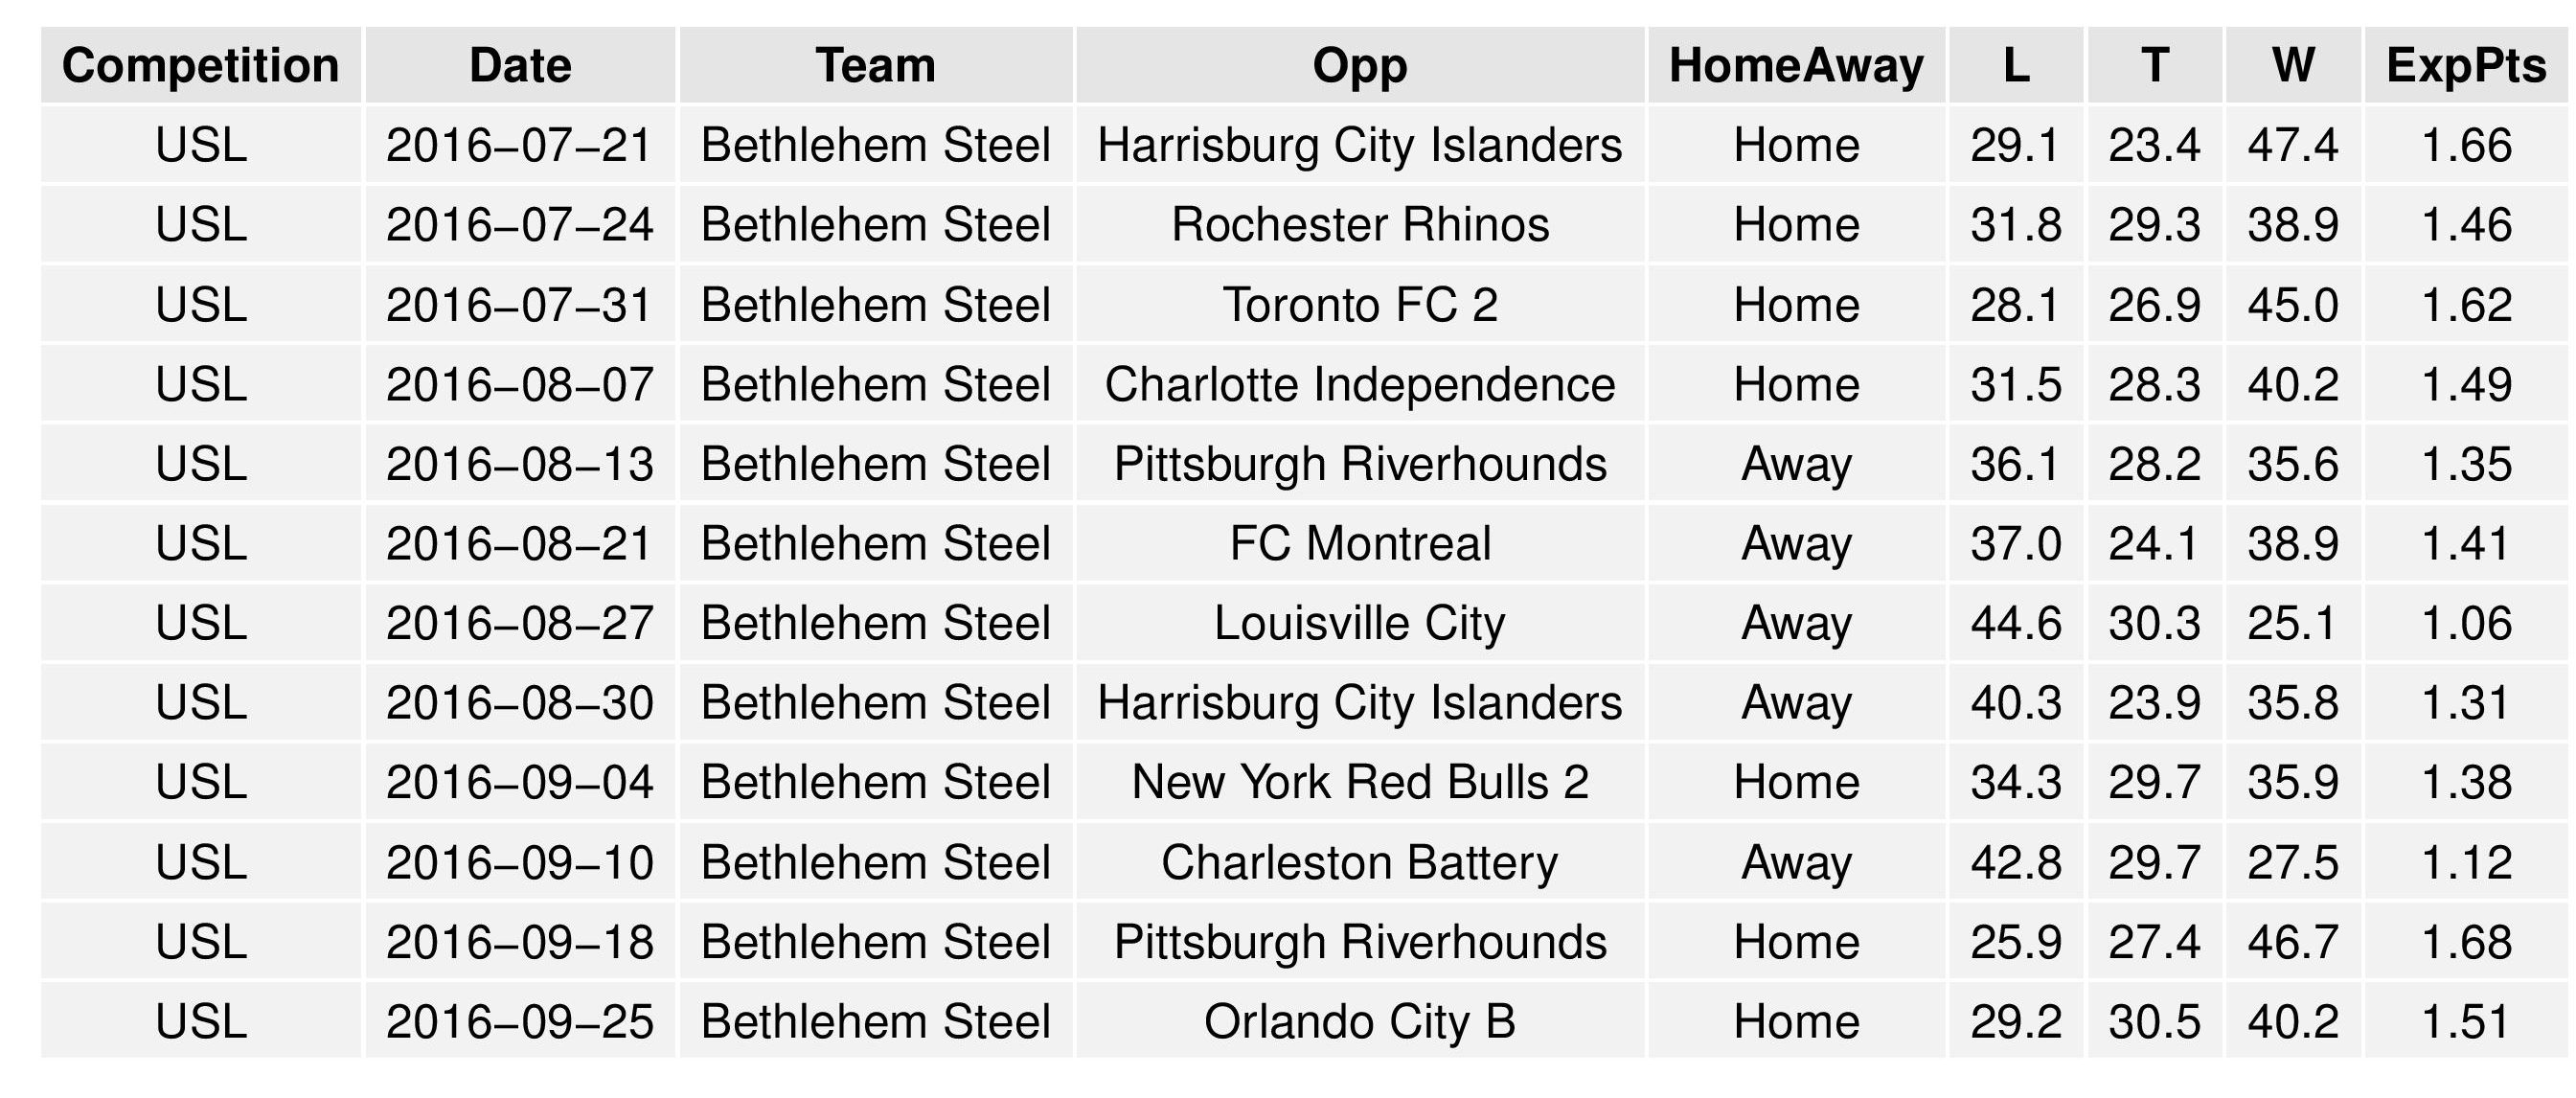
The following are the upcoming matches and associated probabilities for Bethlehem and Harrisburg City.
The following tables show the average simulation results. They are divided into two tables to present better to your screen.
Changes Over Time
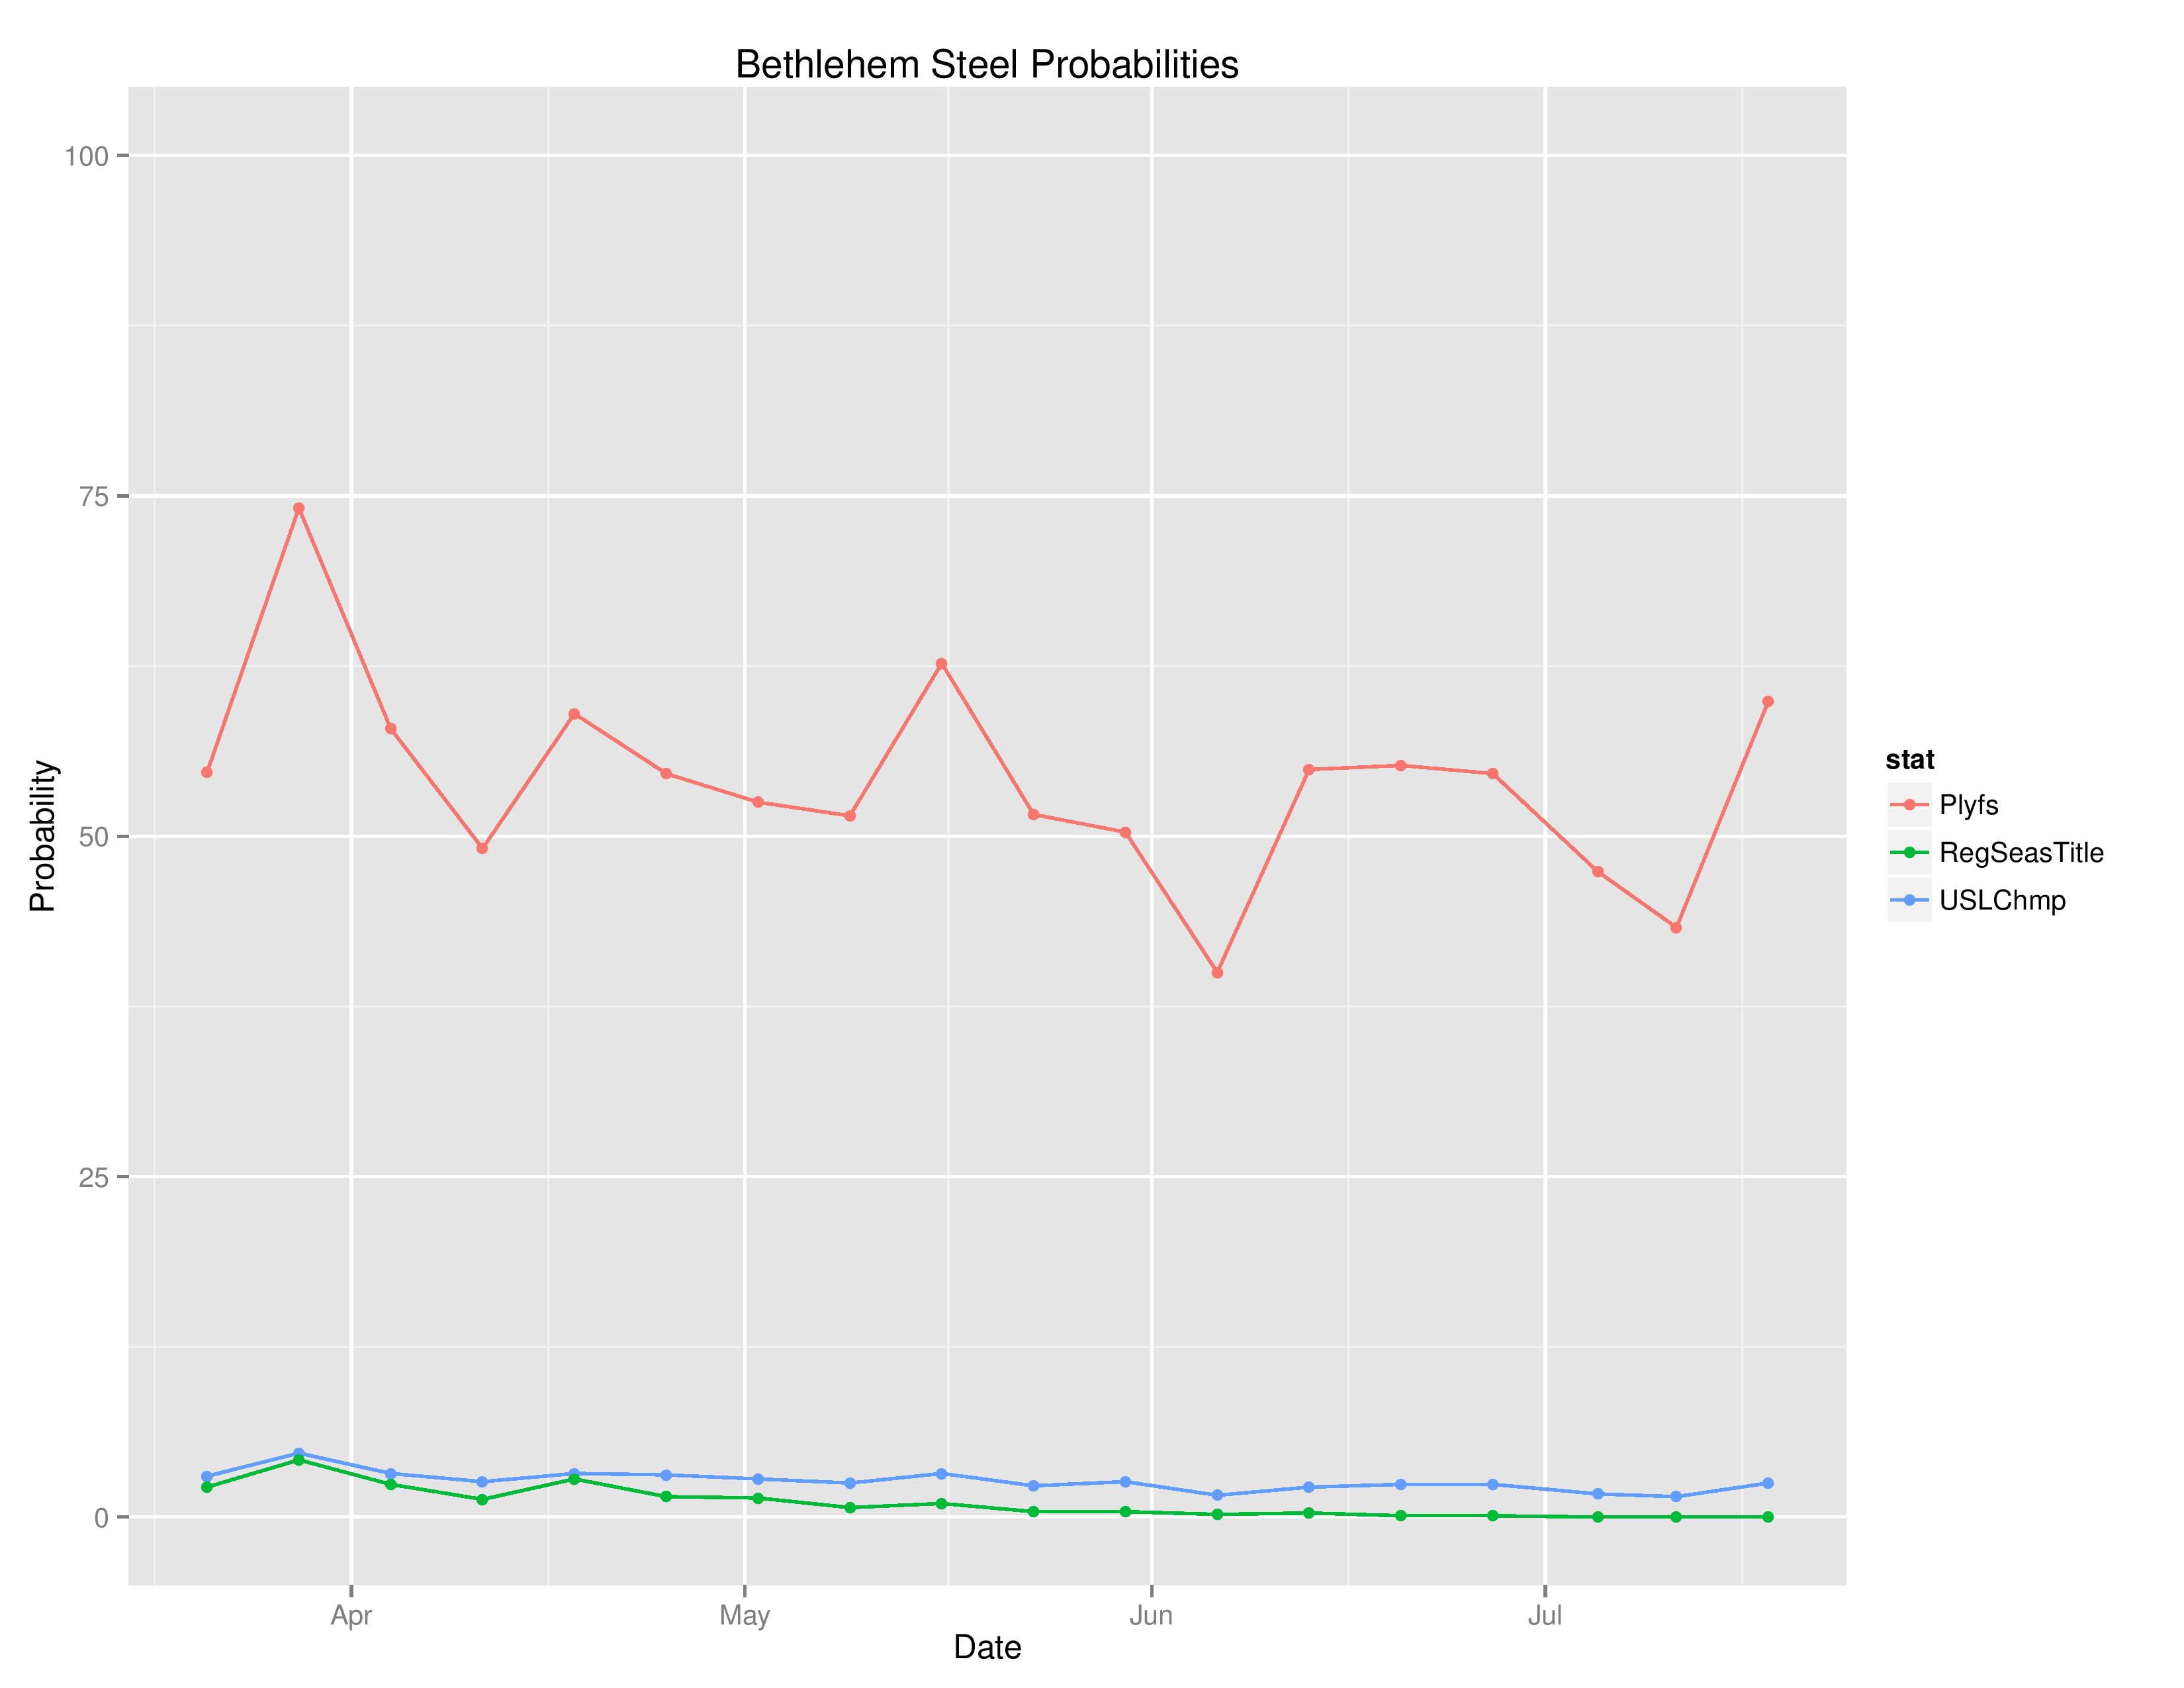
Above shows the probabilities of various outcomes for Bethlehem over the course of the season.
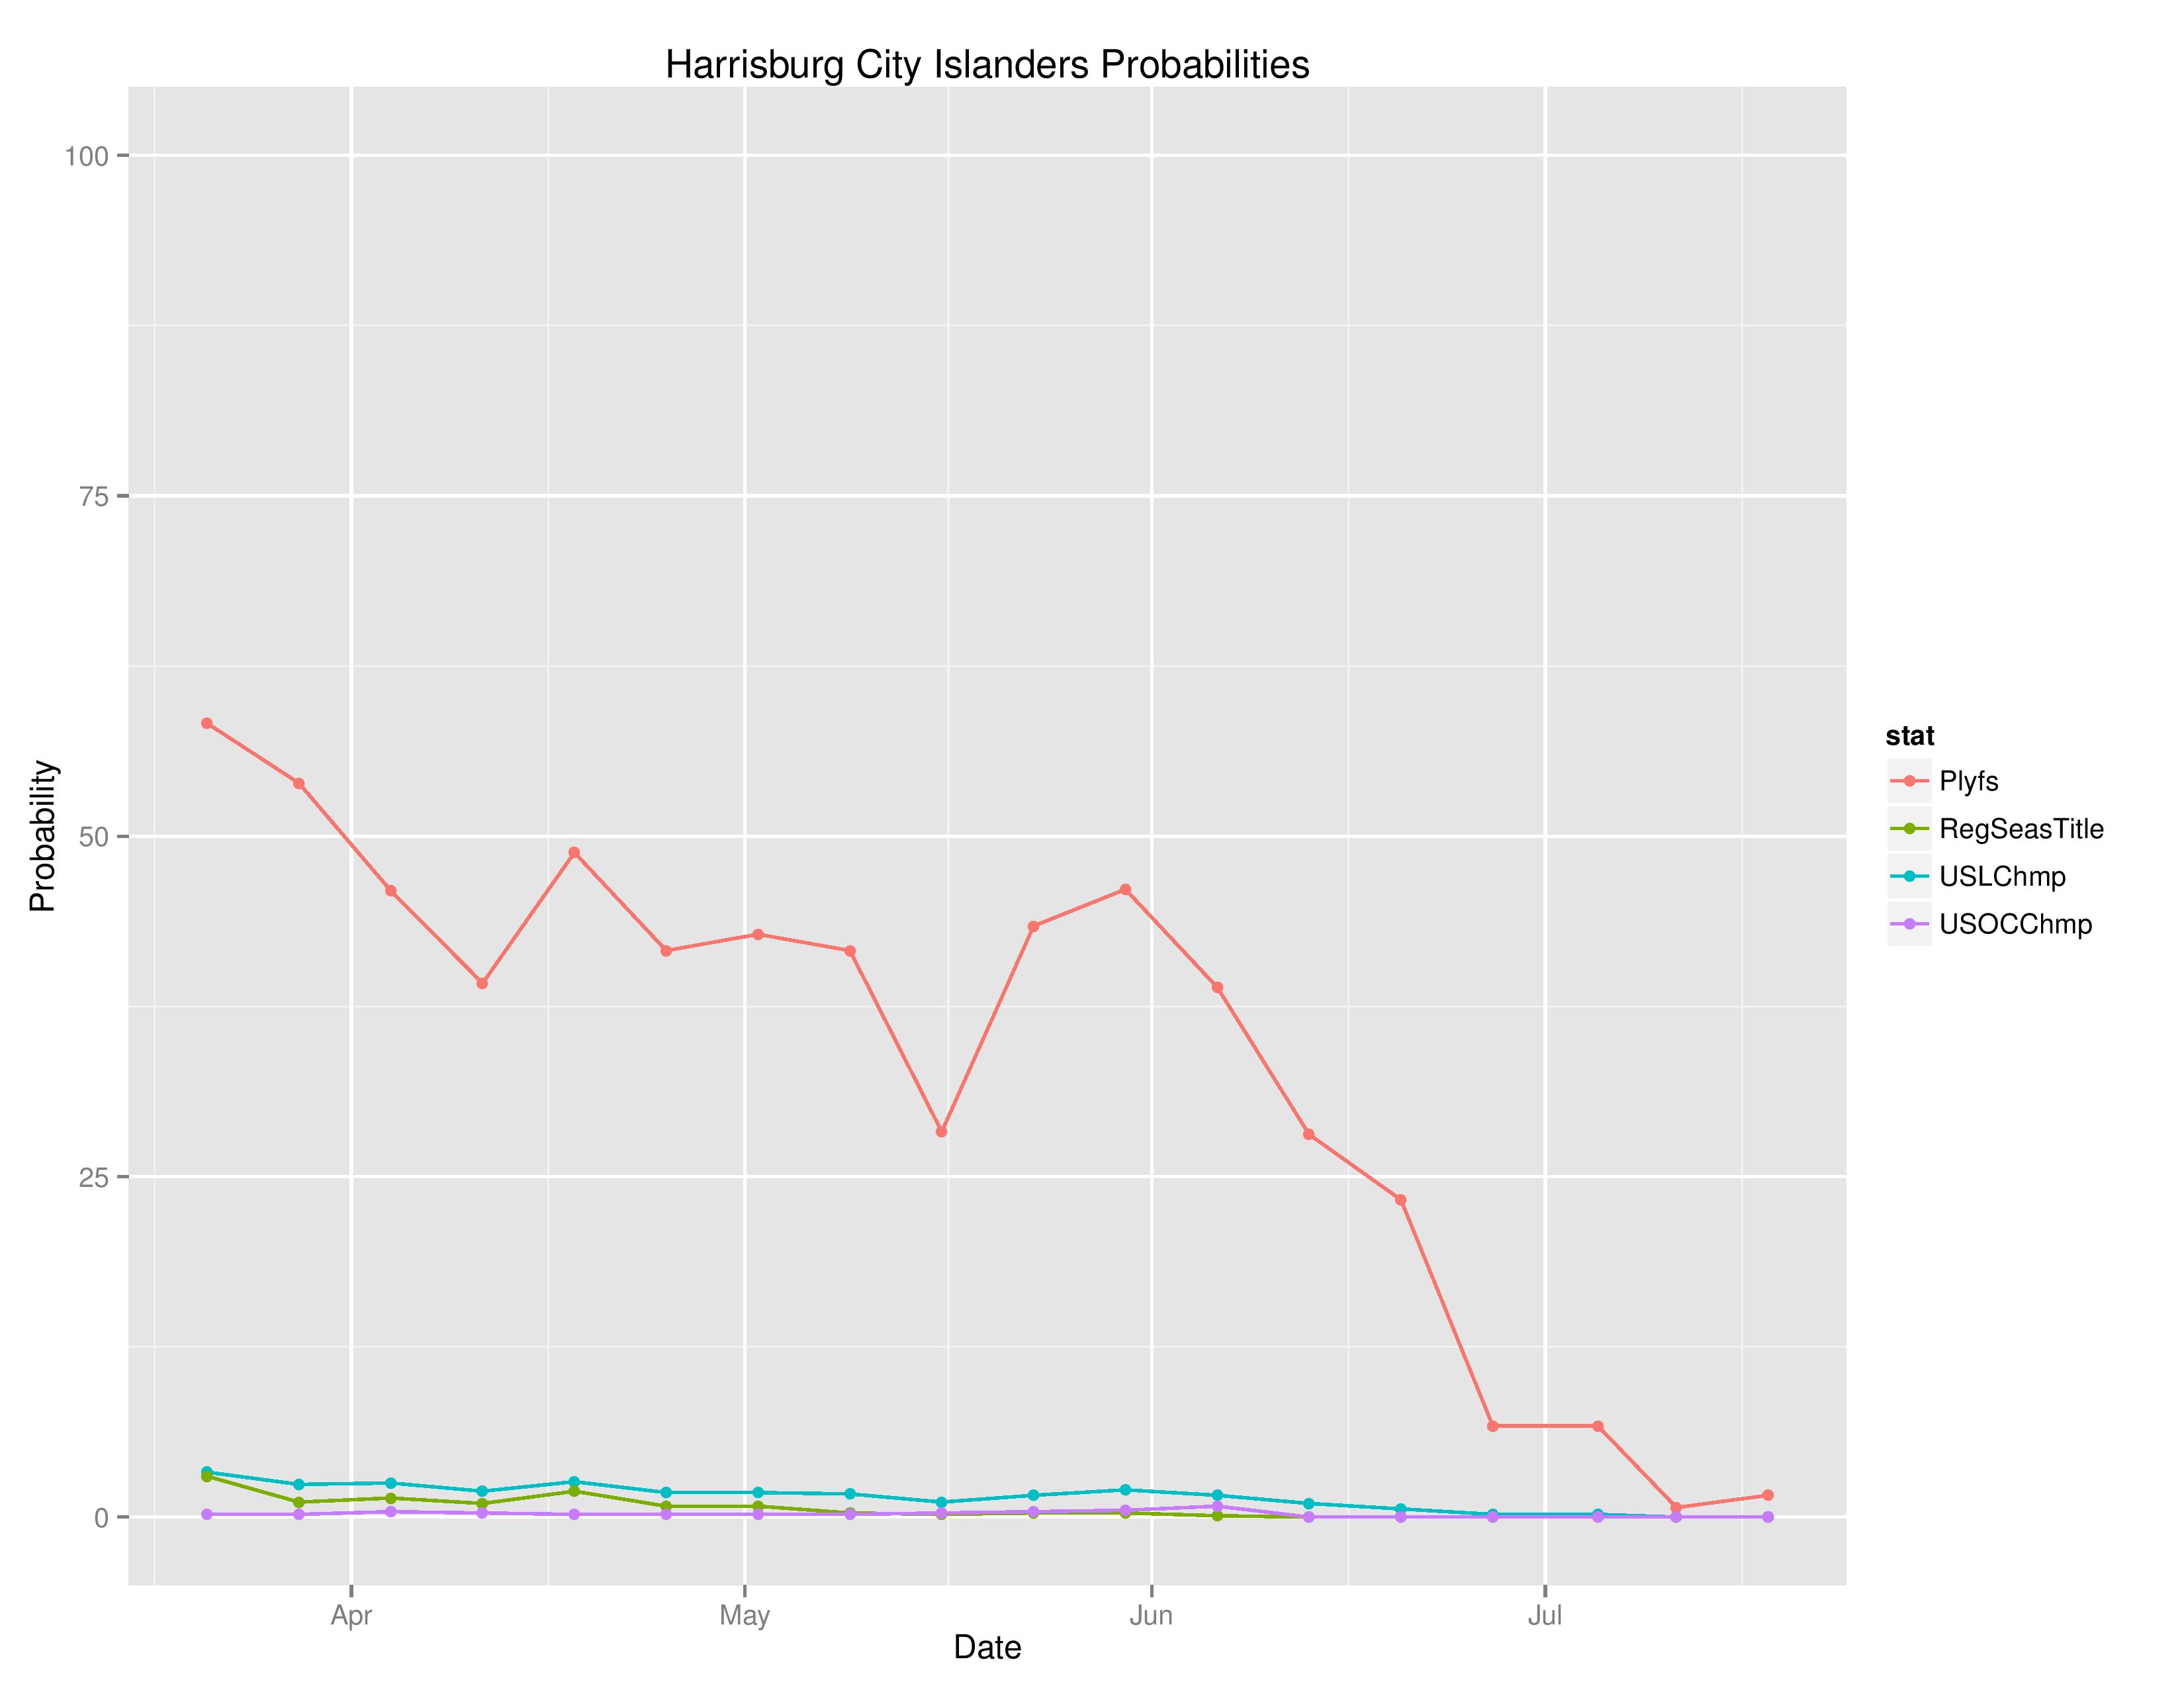
Above shows the probabilities of various outcomes for Harrisburg over the course of the season.
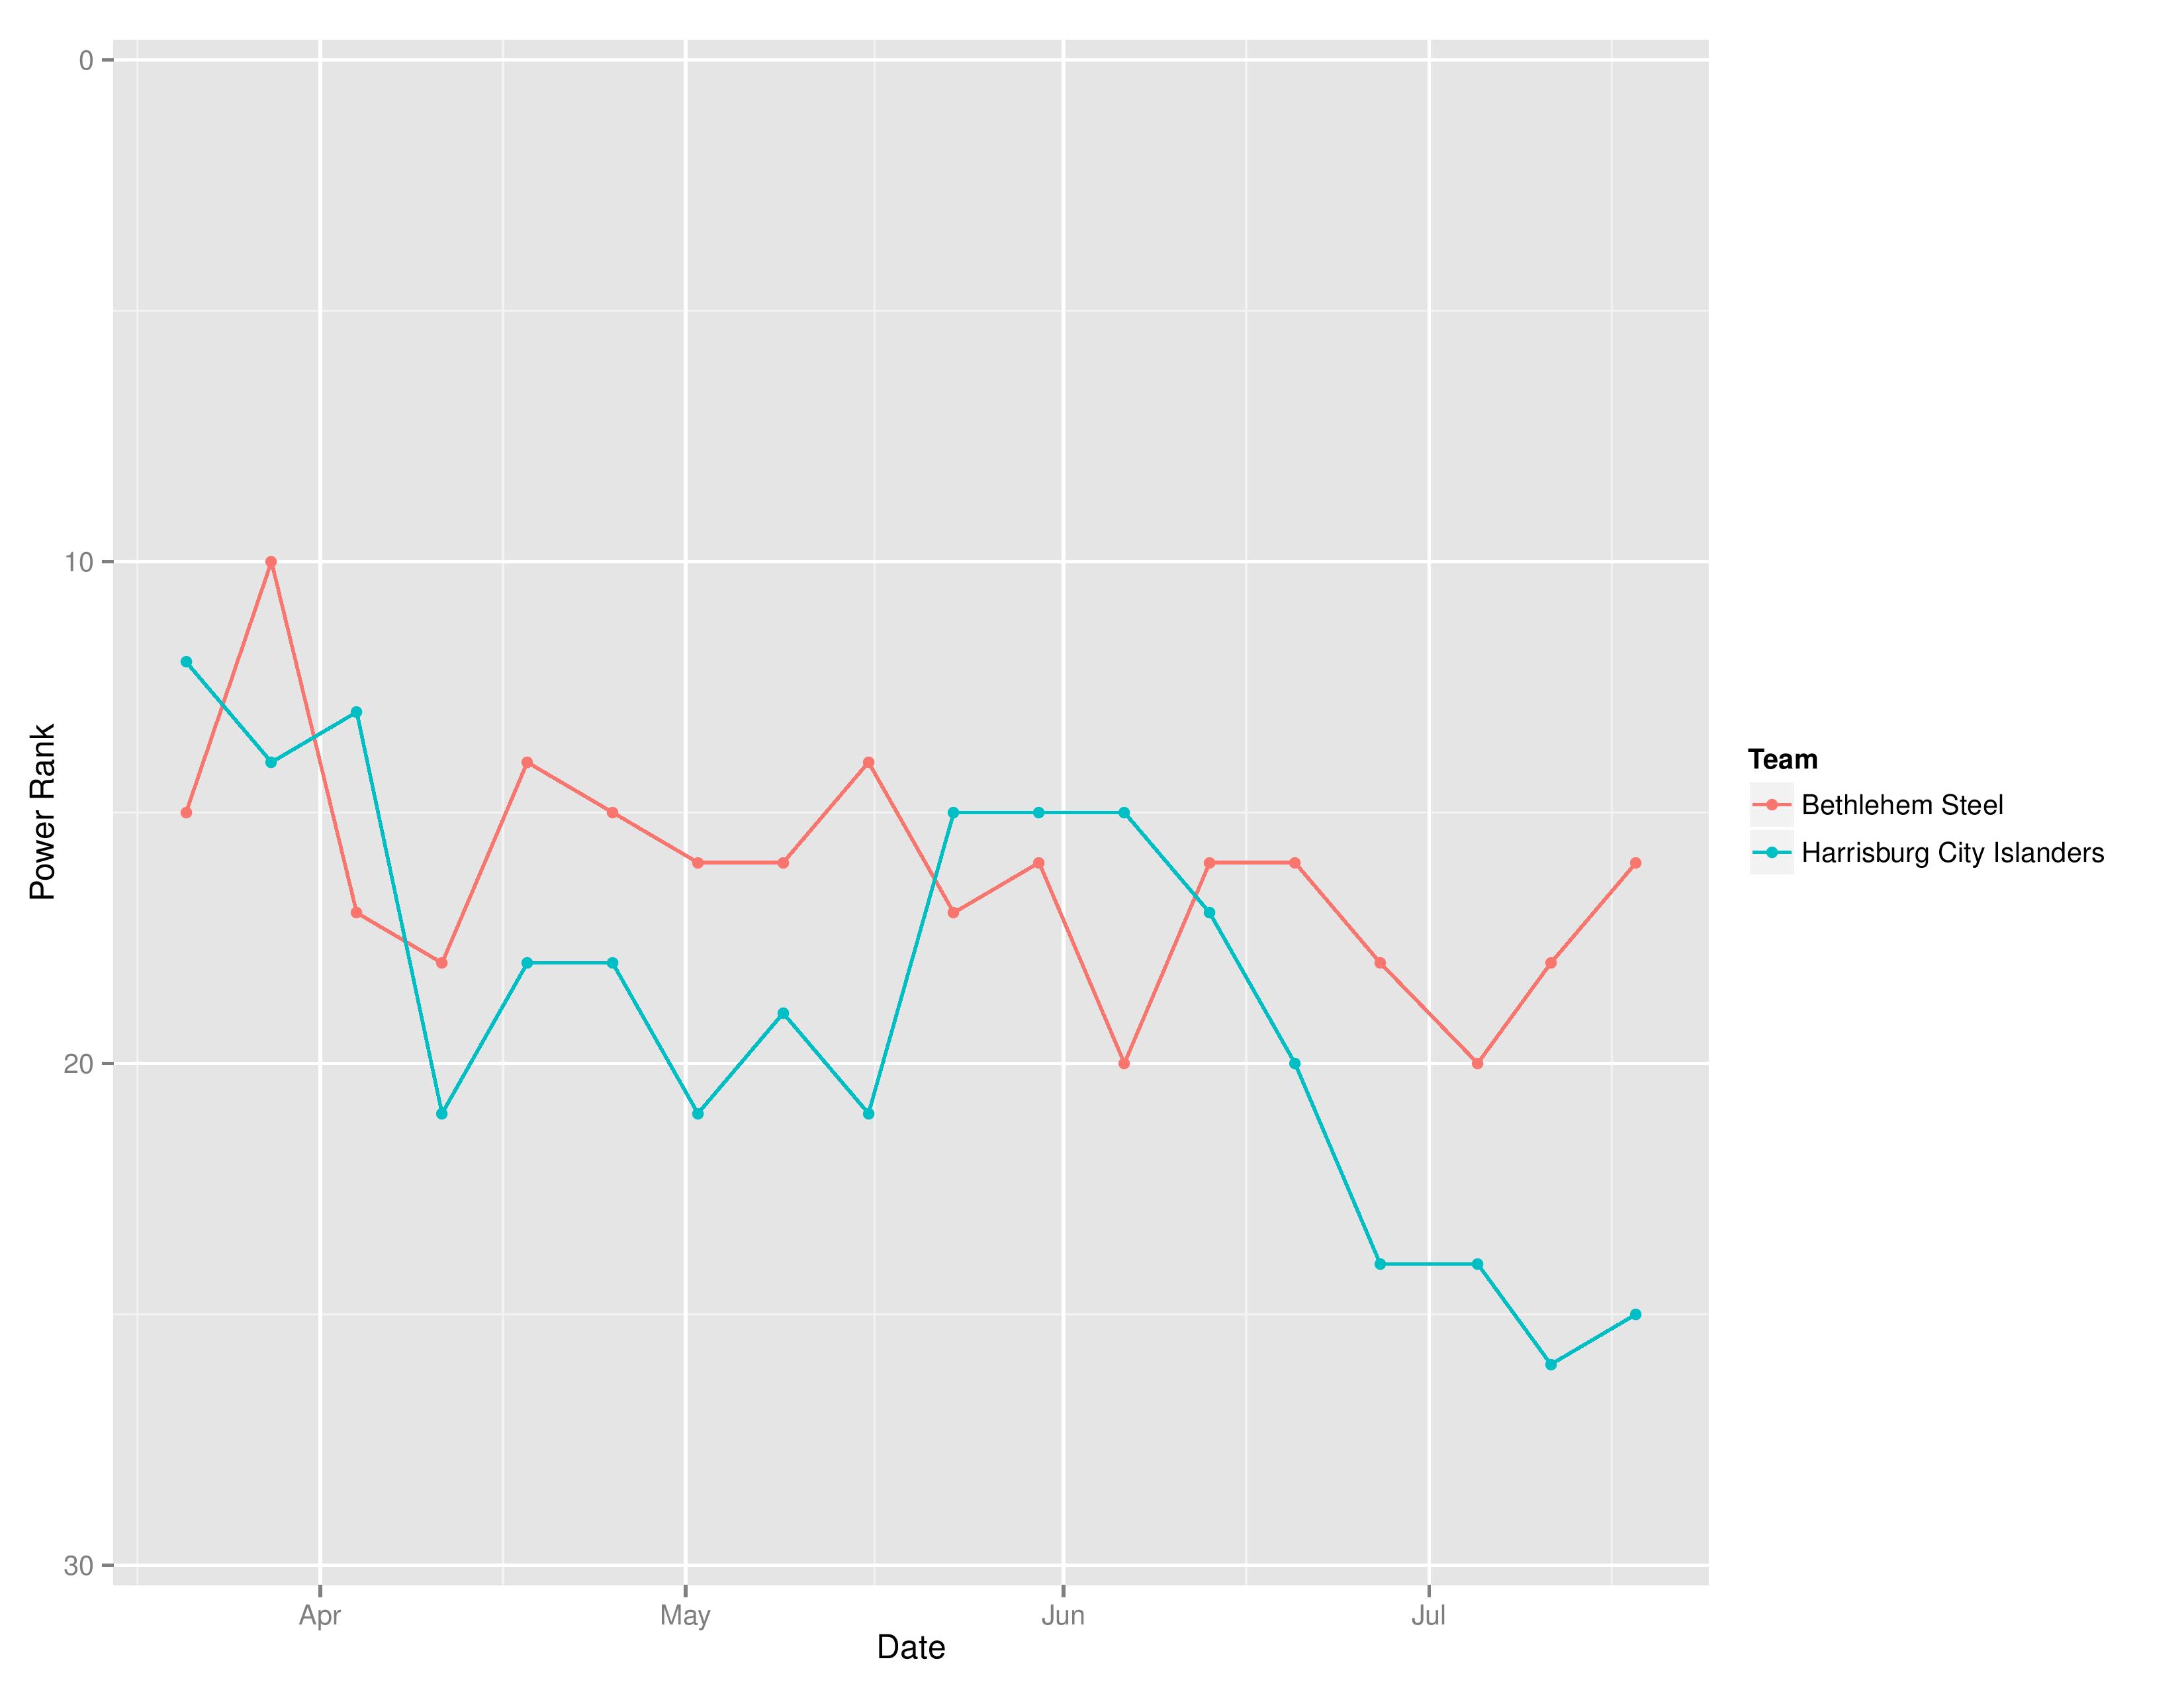
Above shows the evolution of SEBA’s power rankings for Bethlehem Steel FC and the Harrisburg City Islanders.
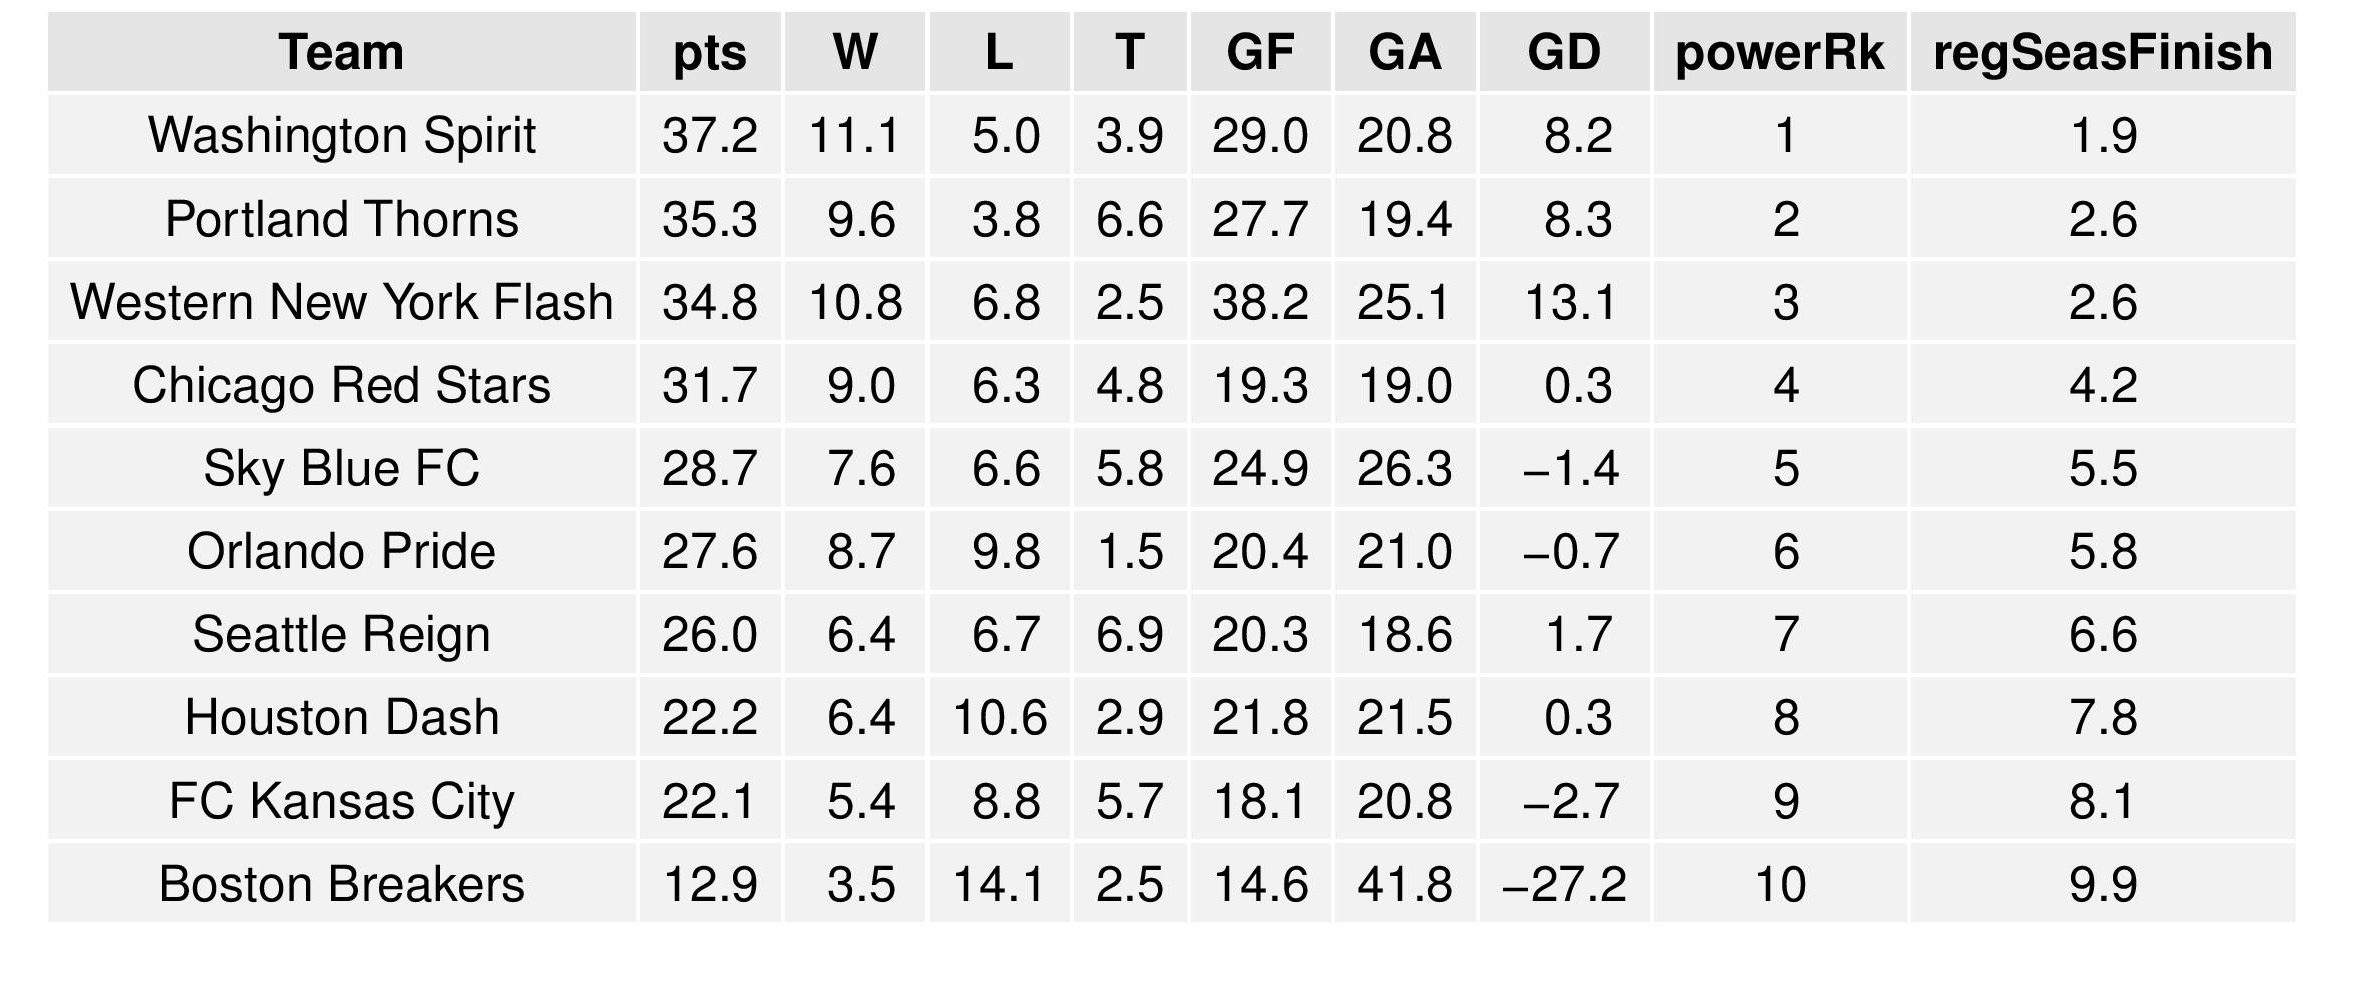
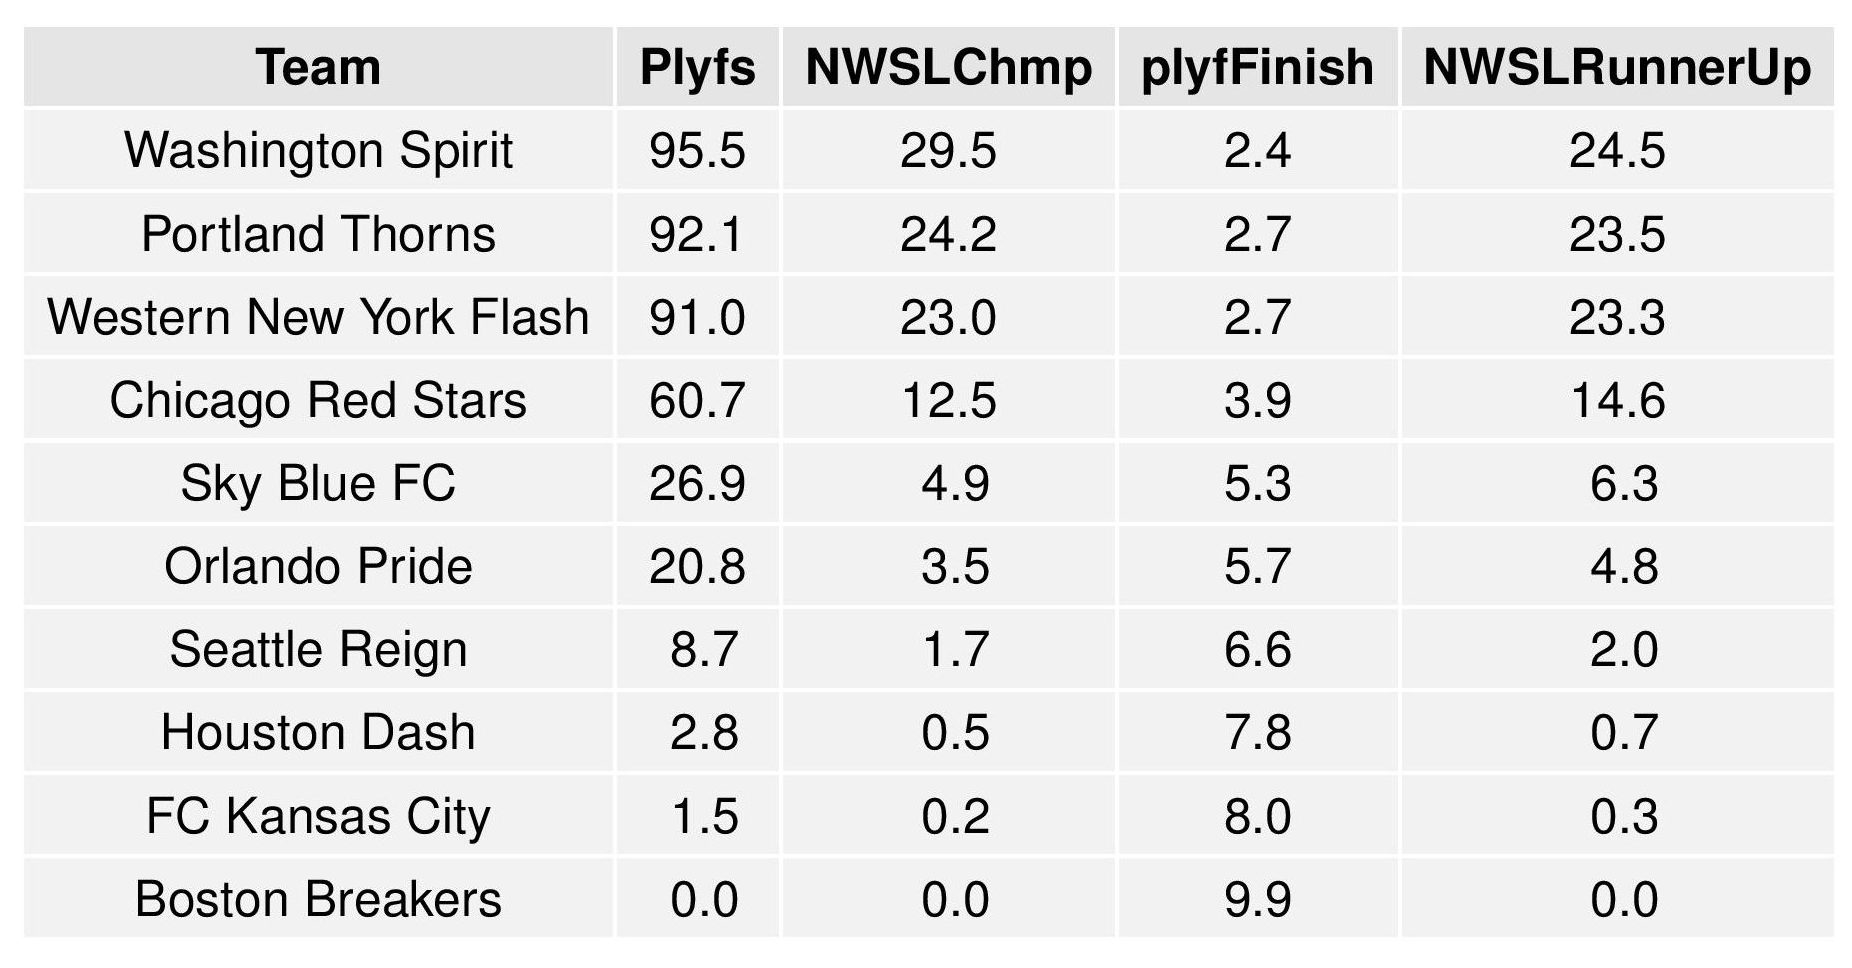
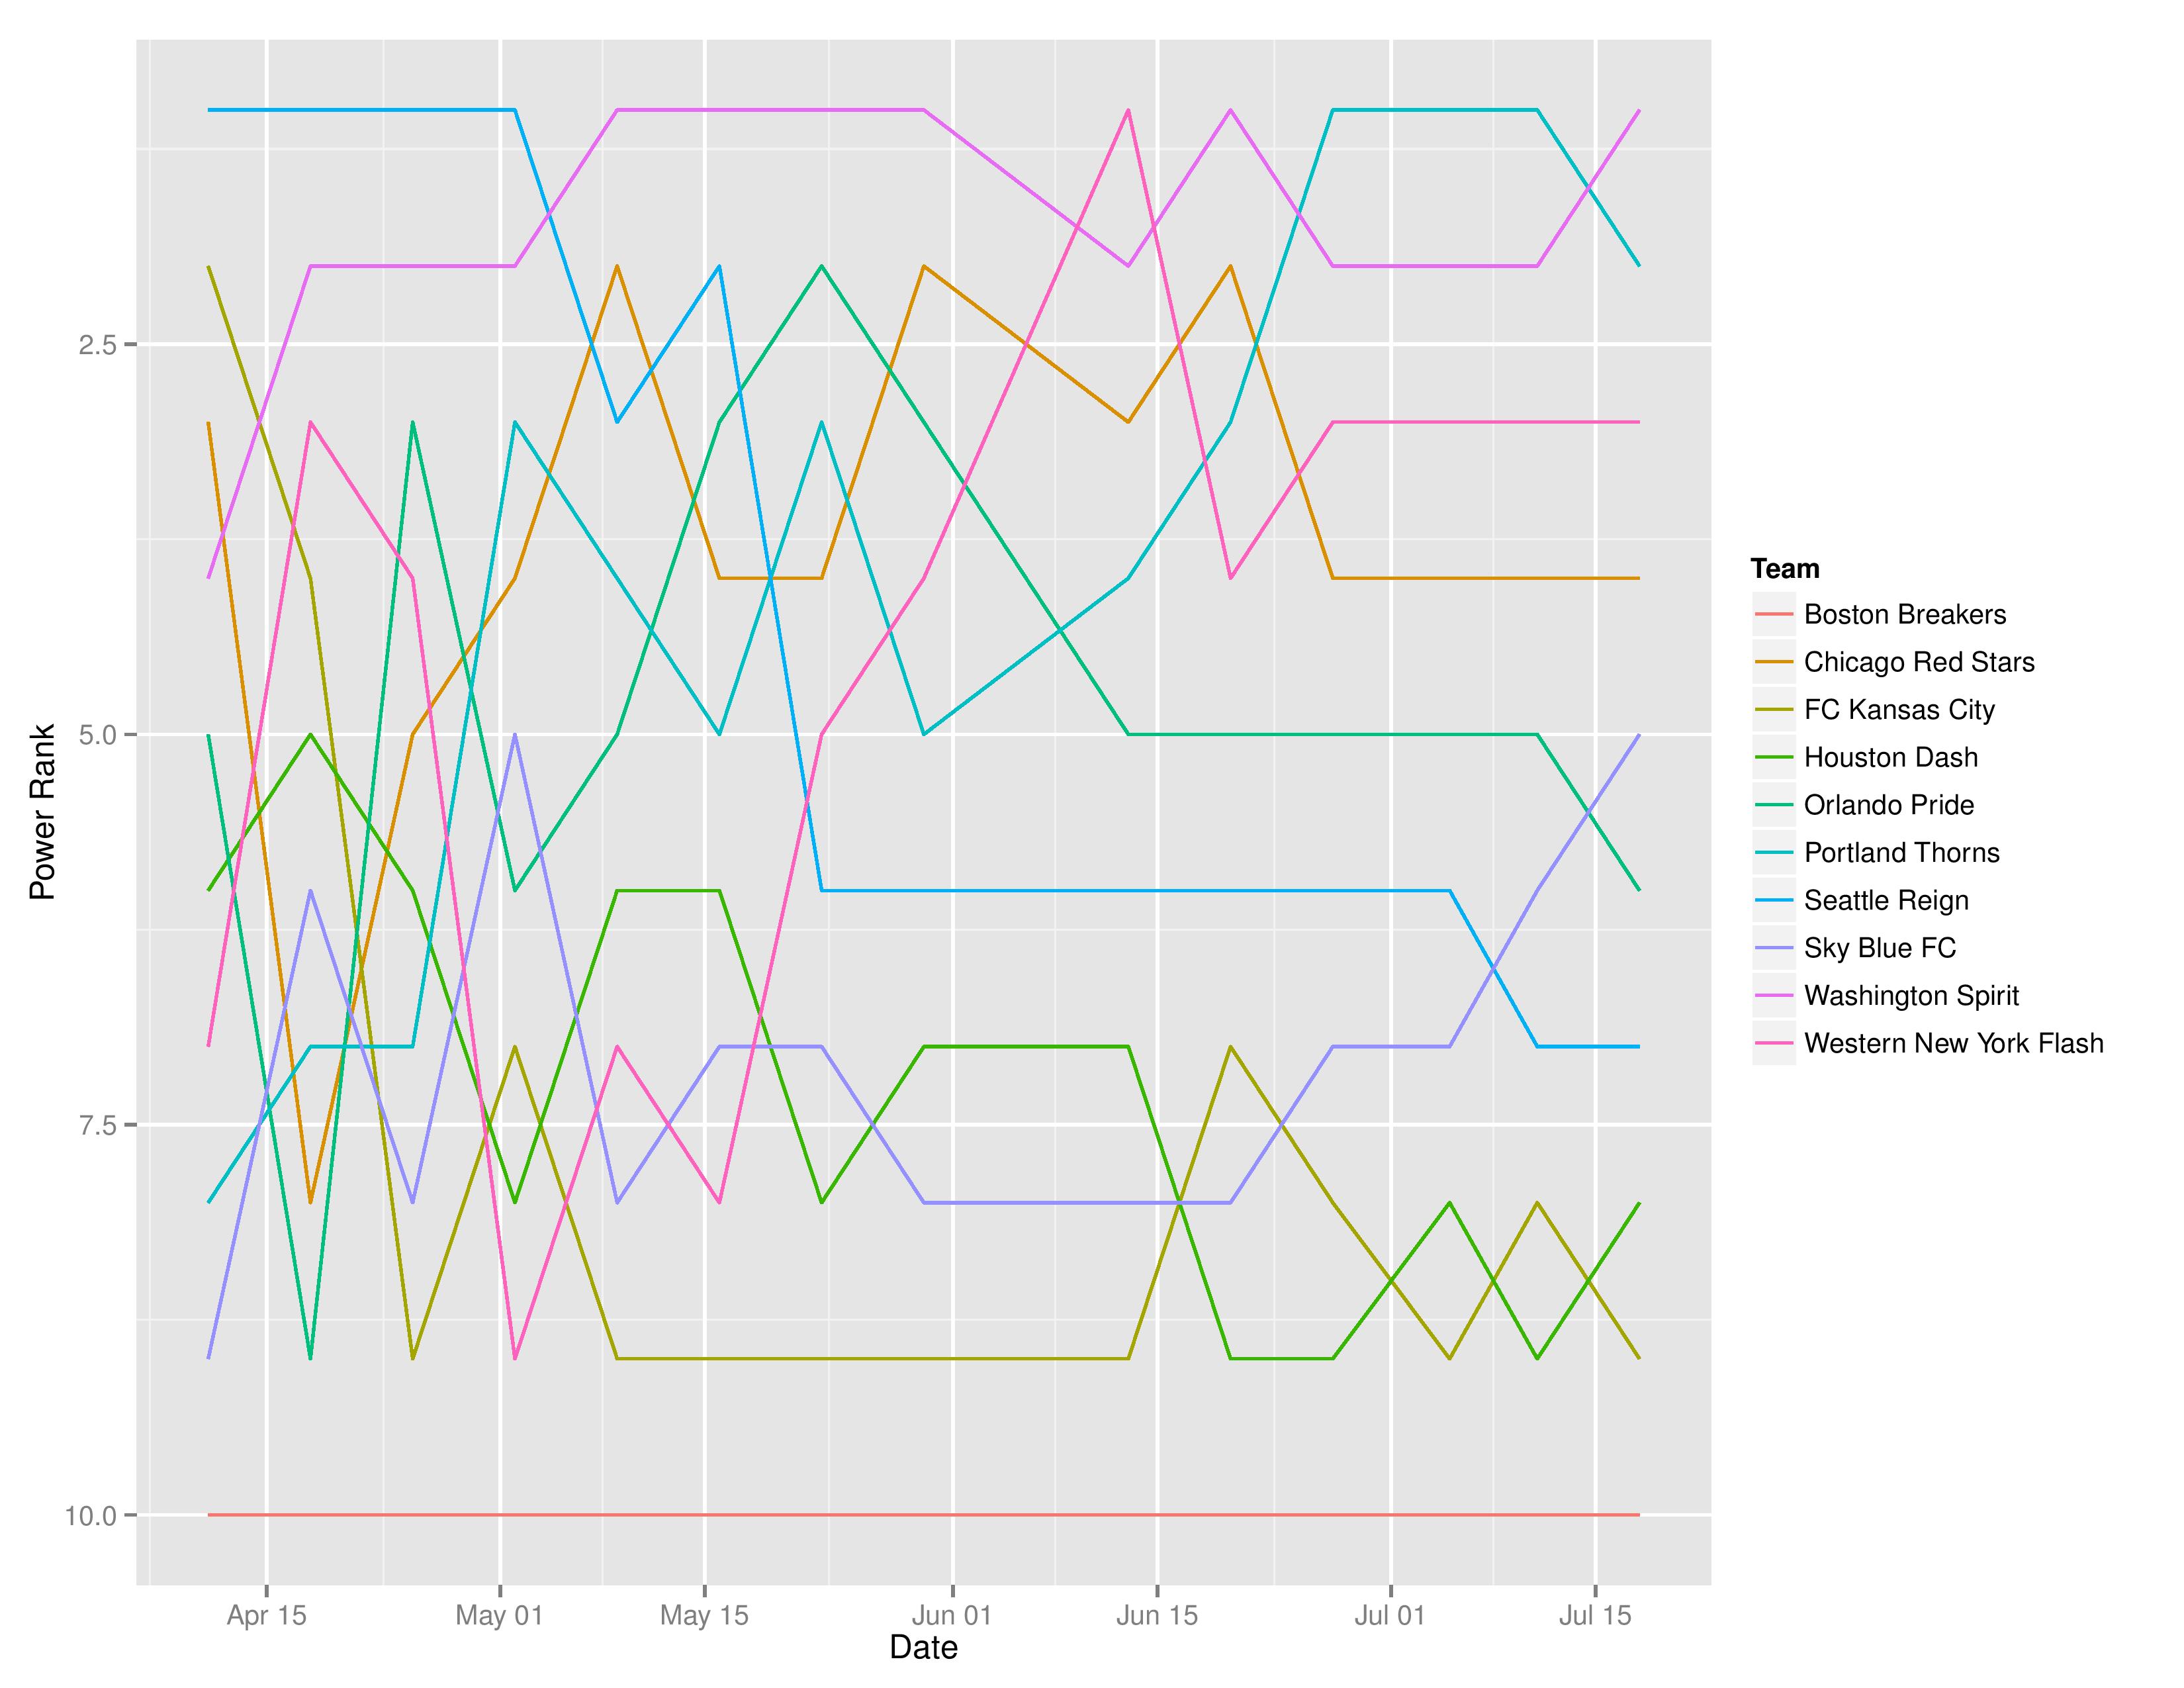
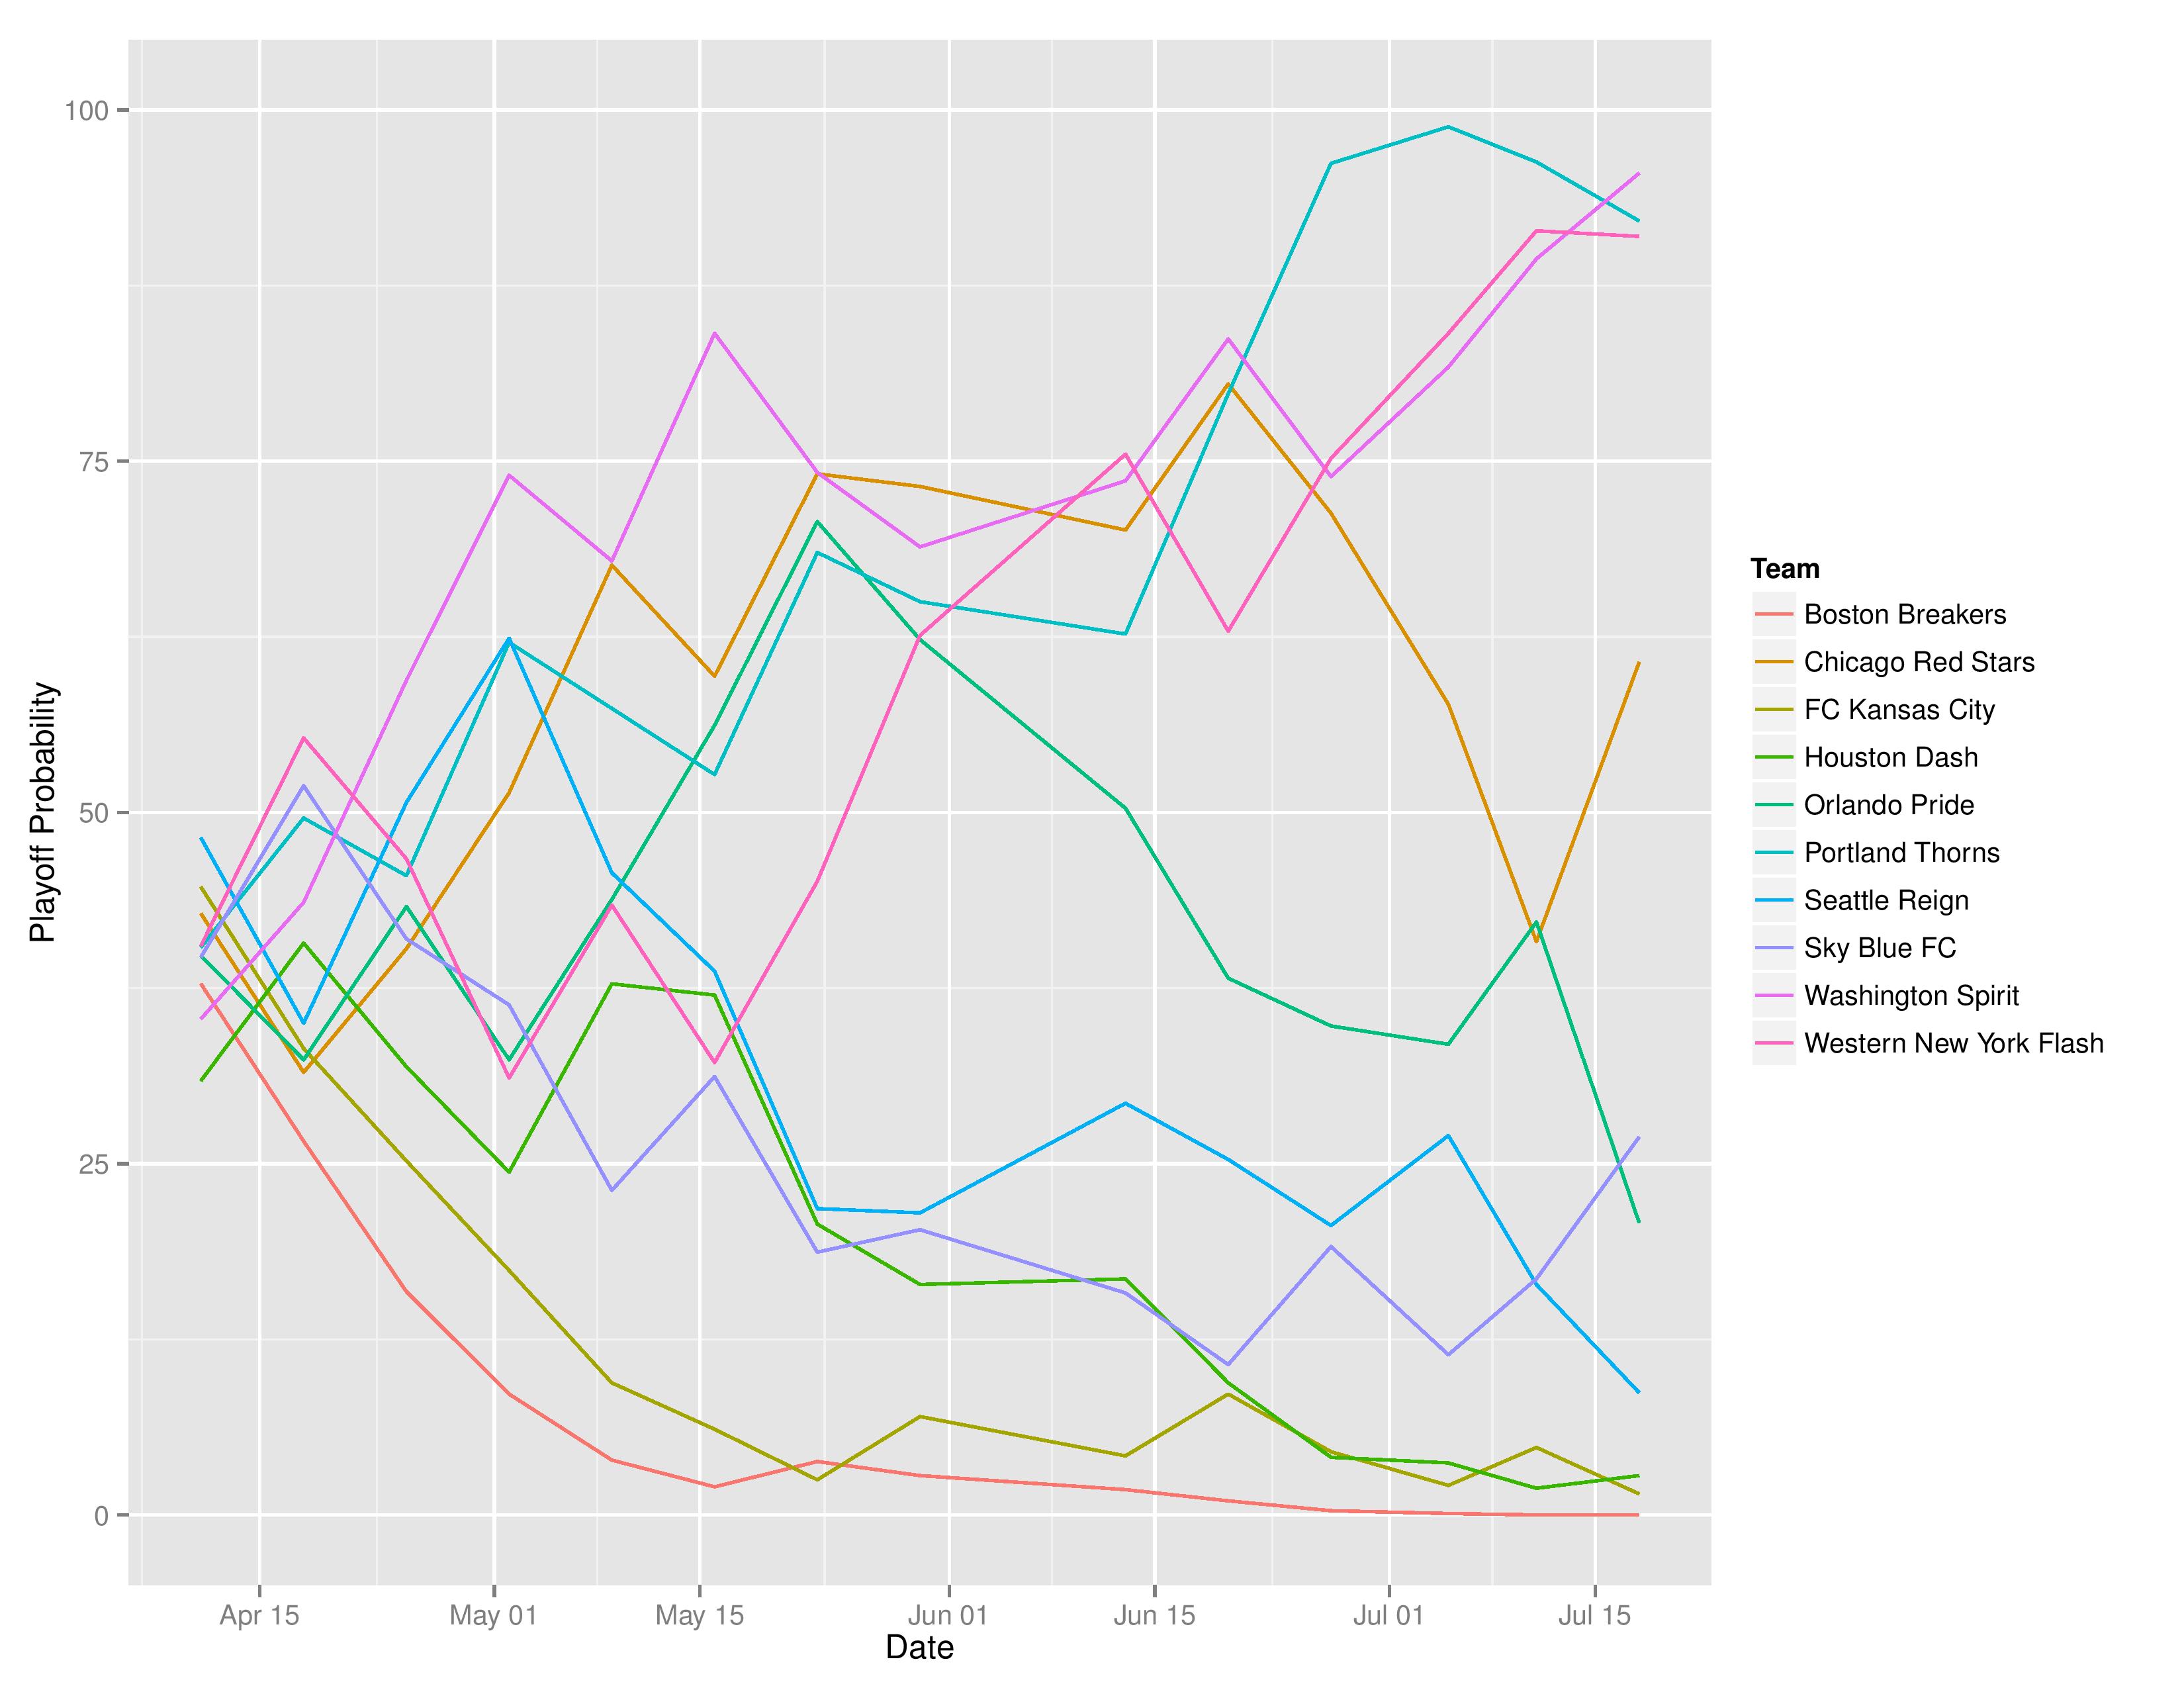
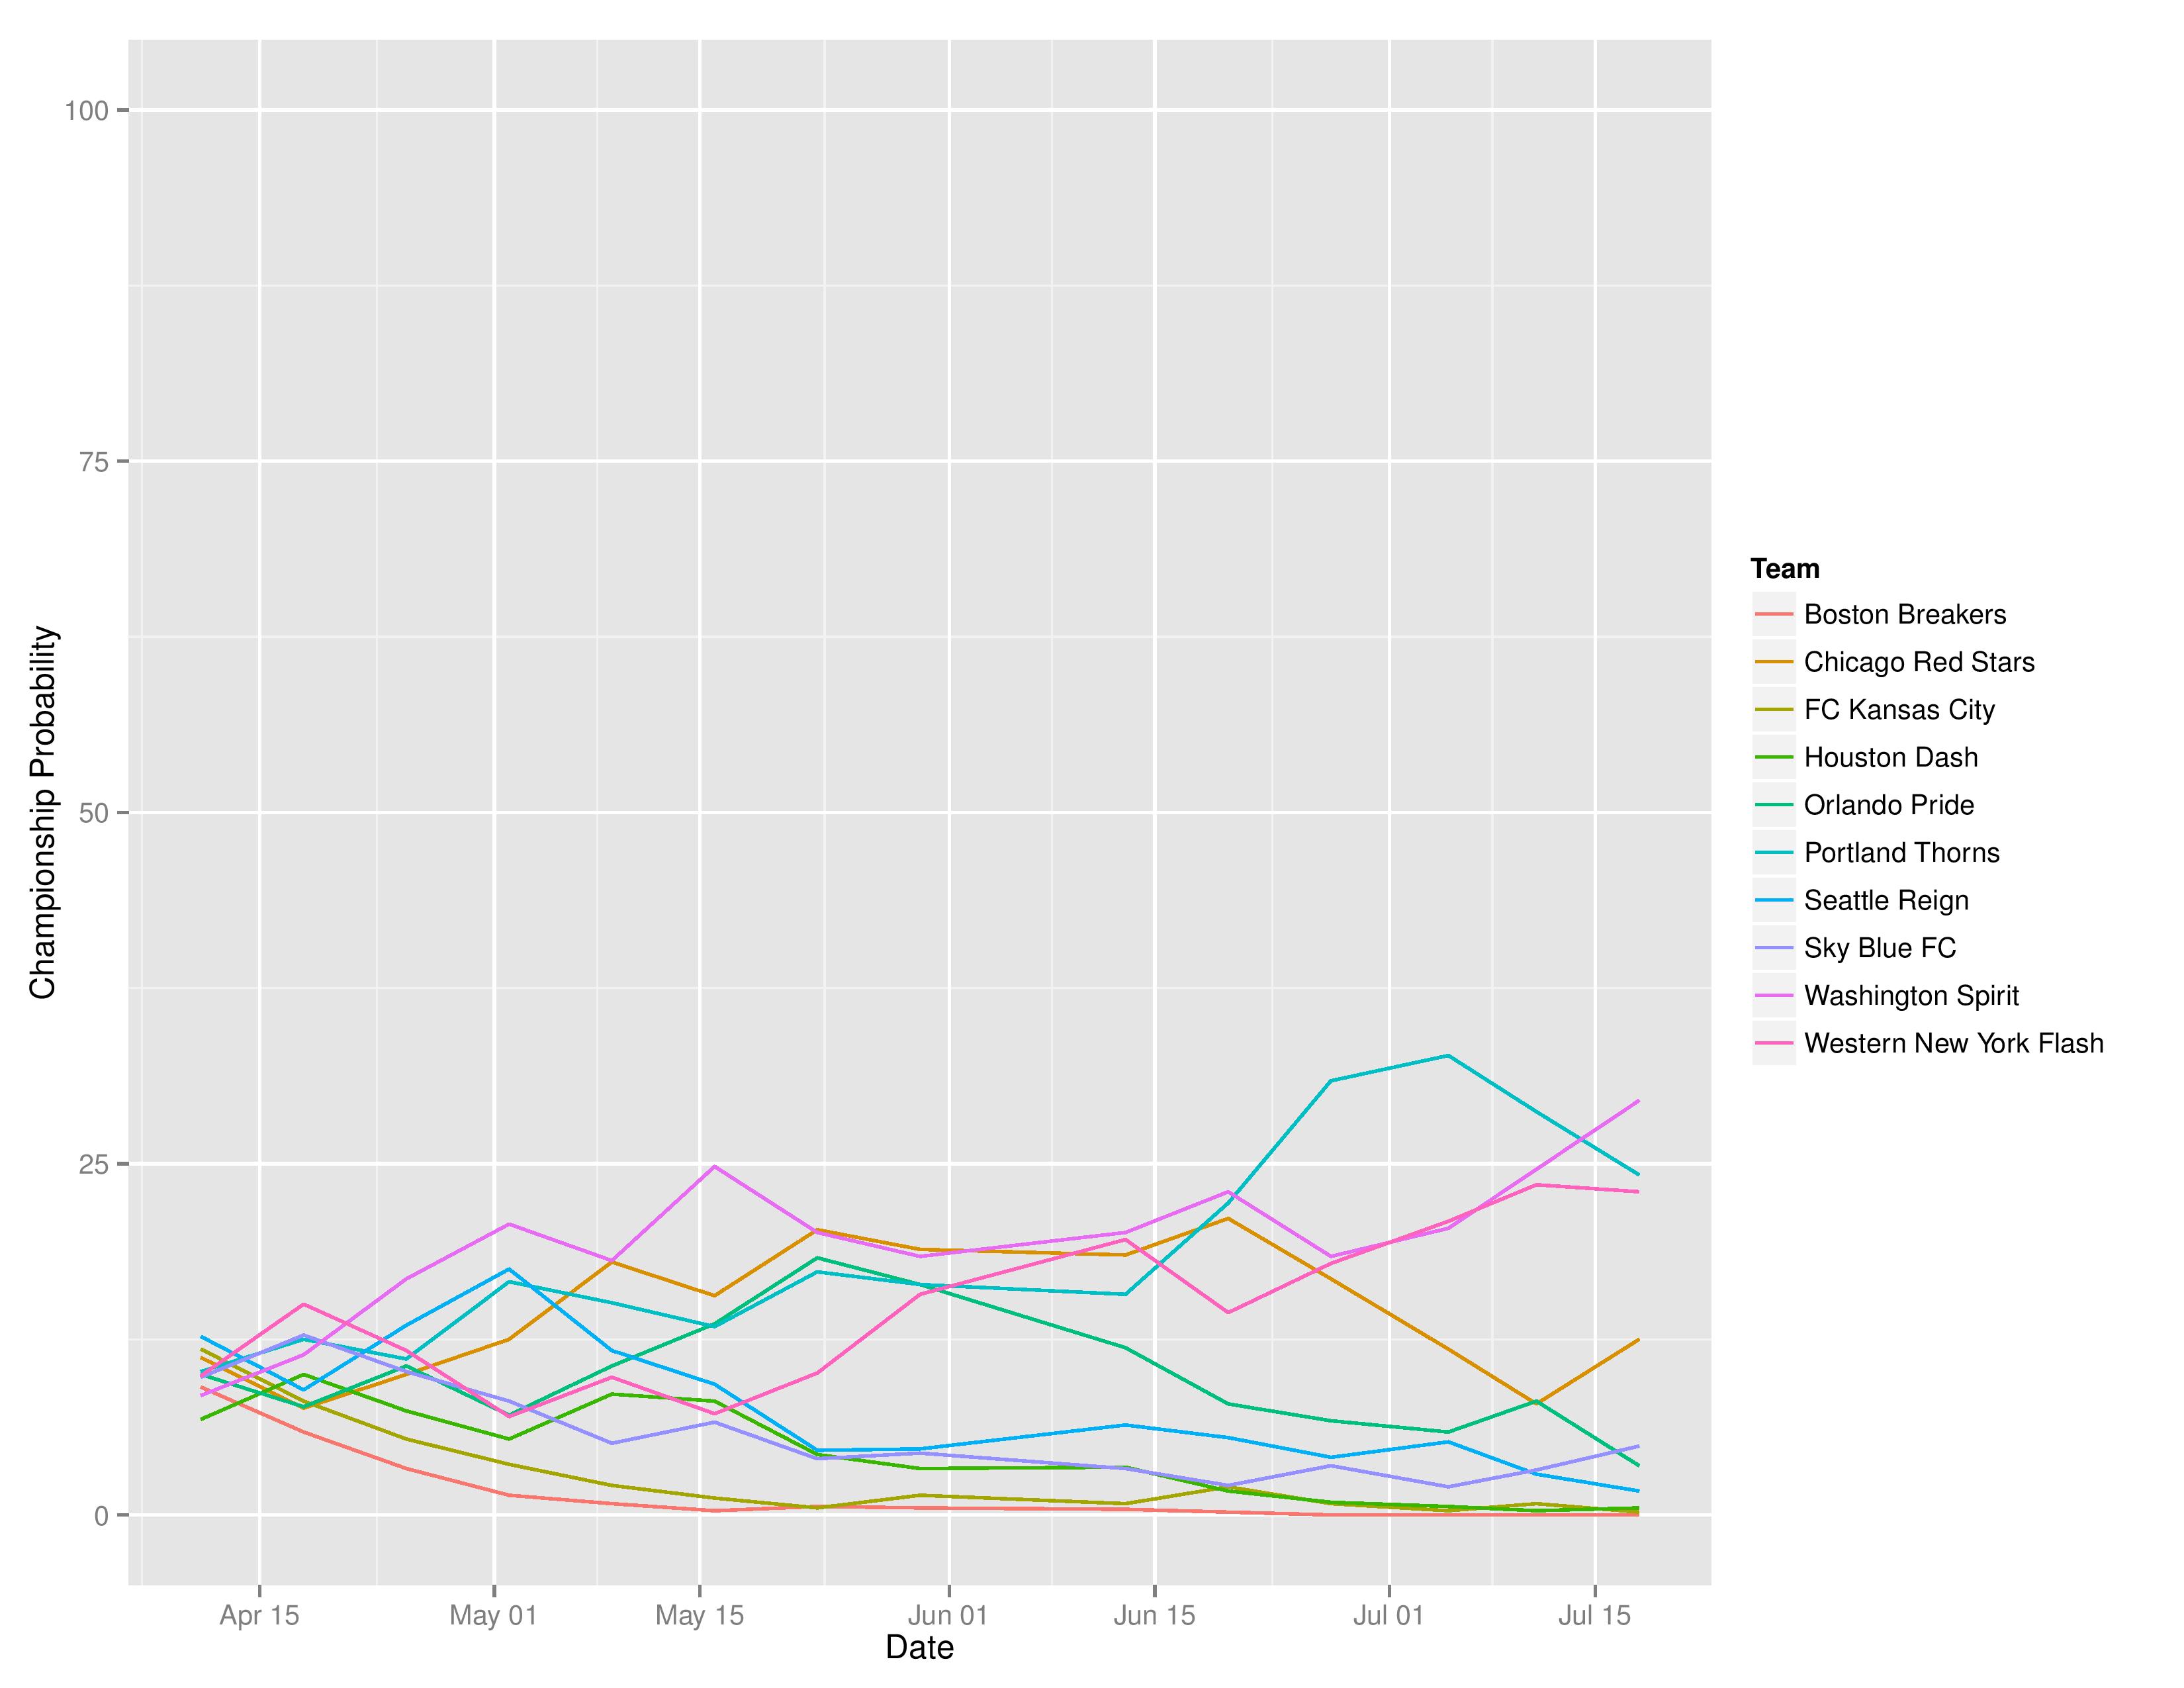
NWSL Projections
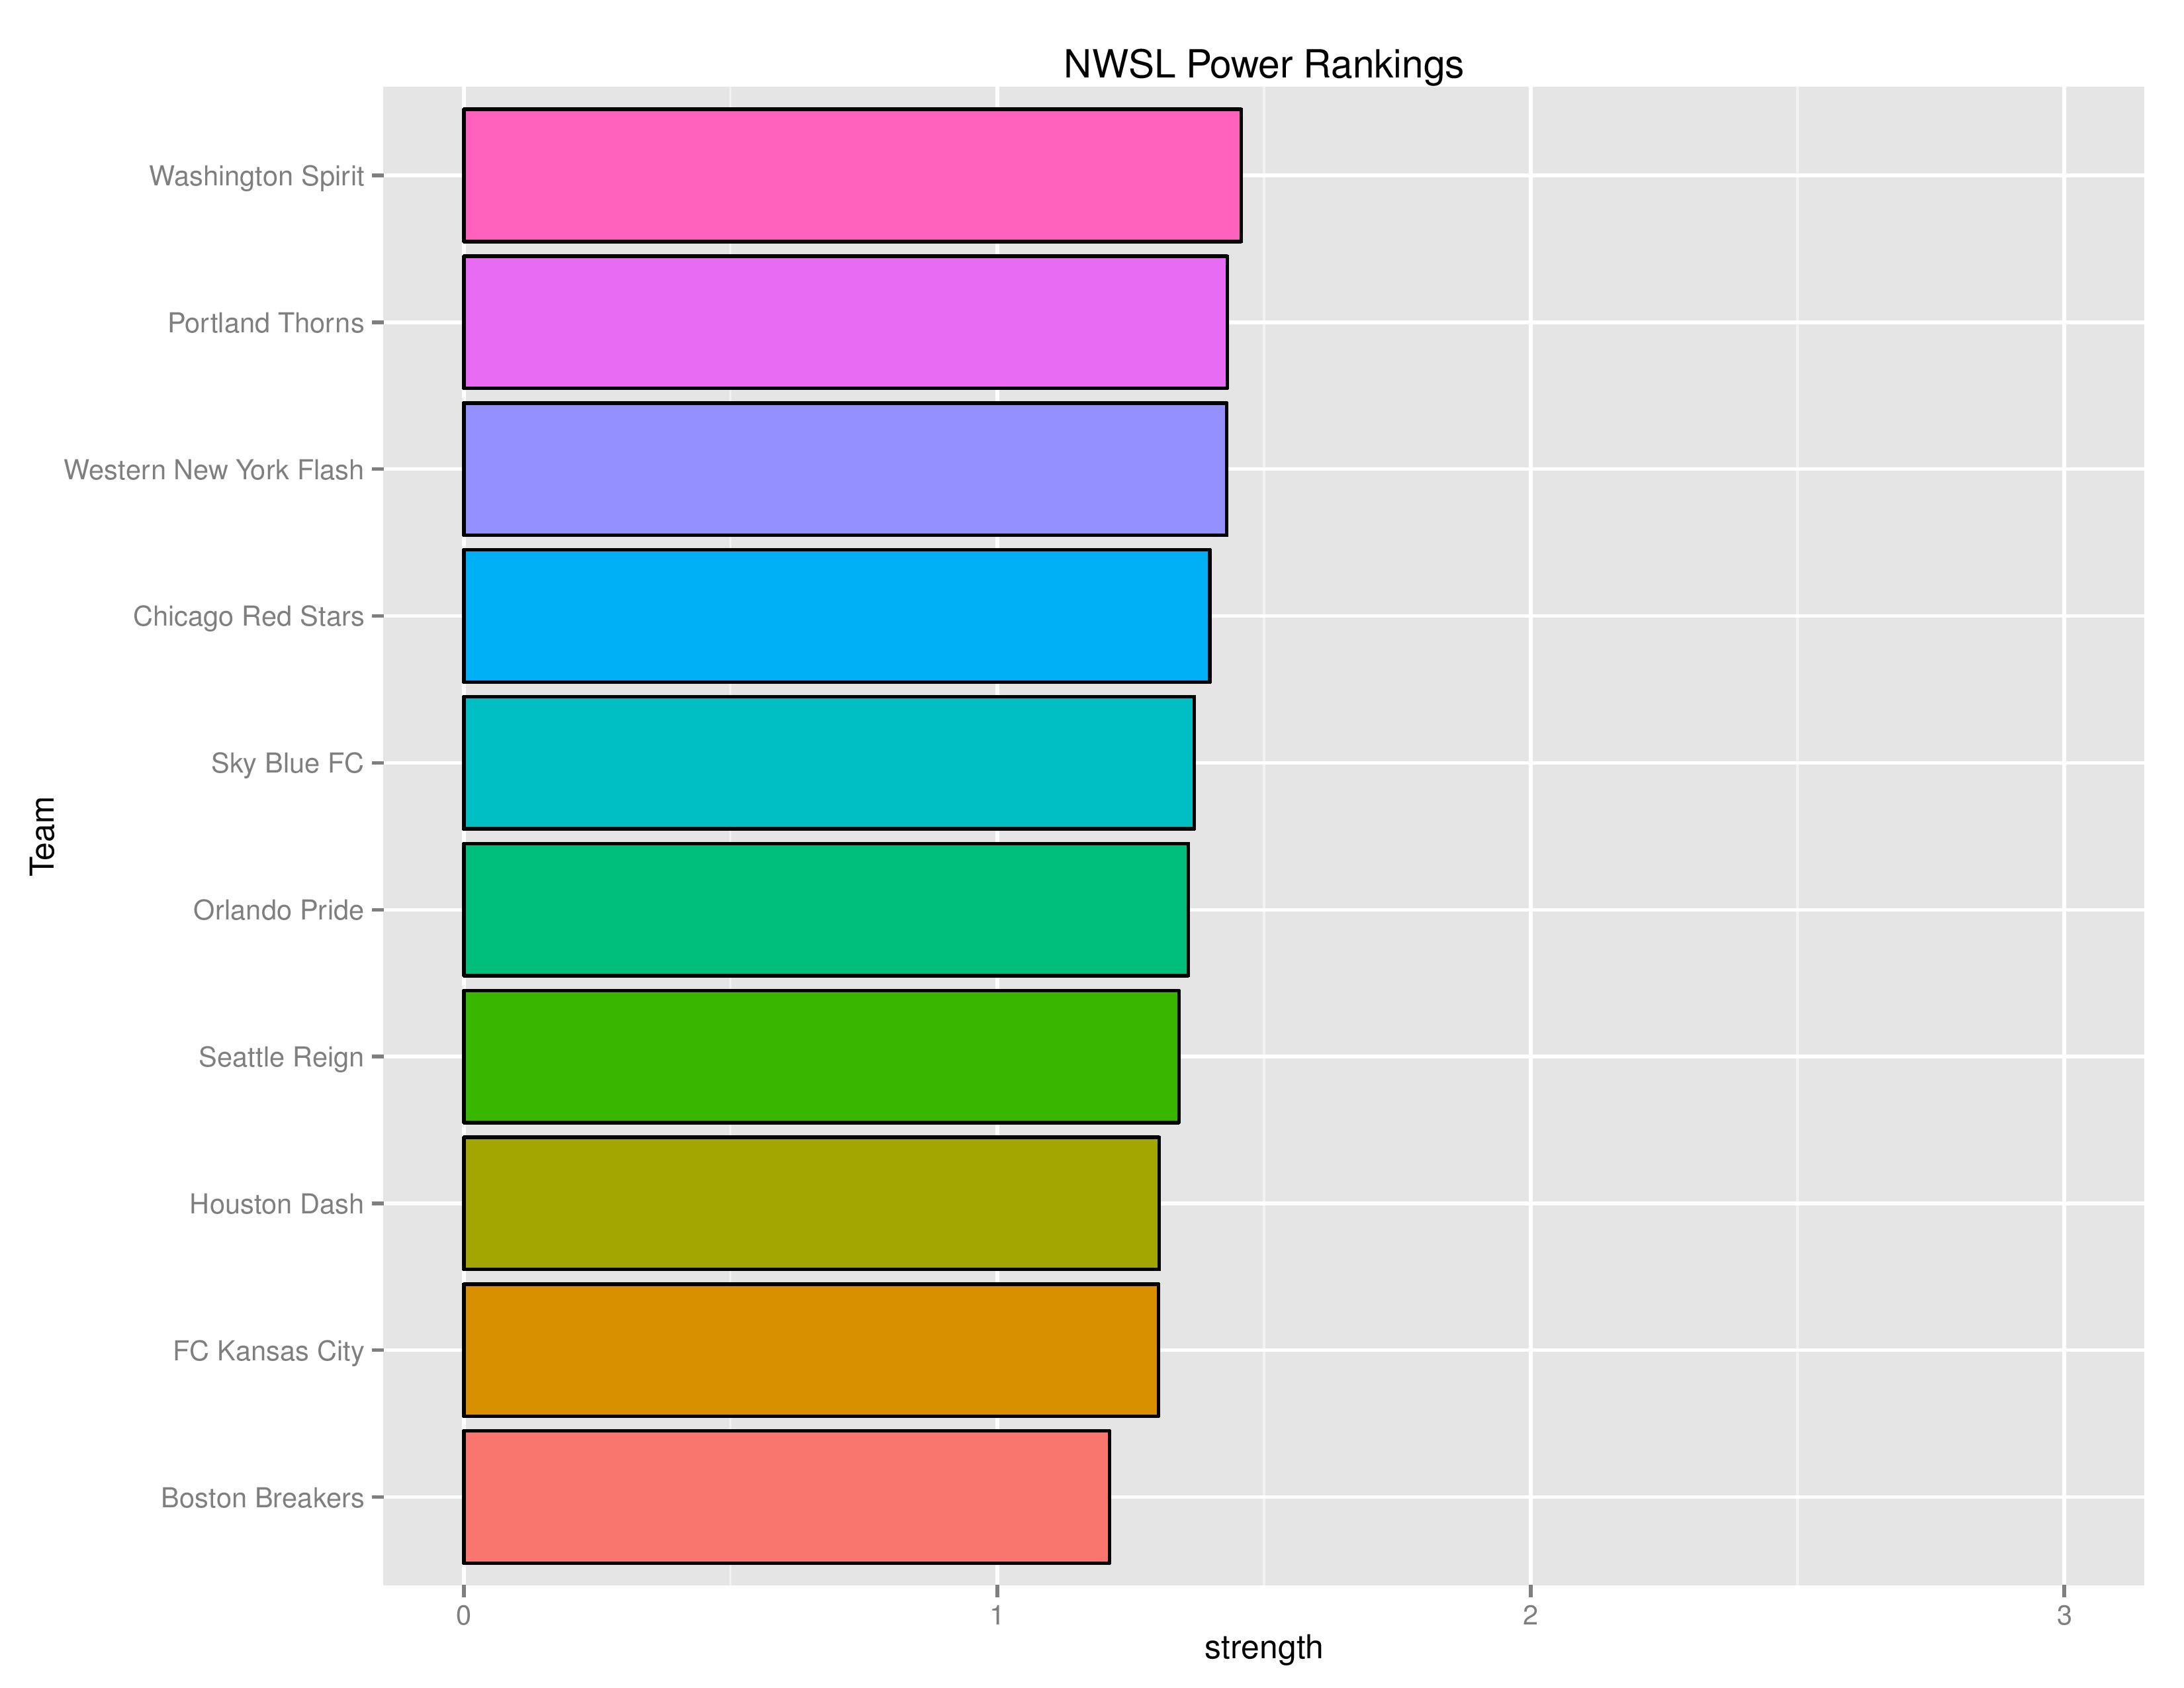
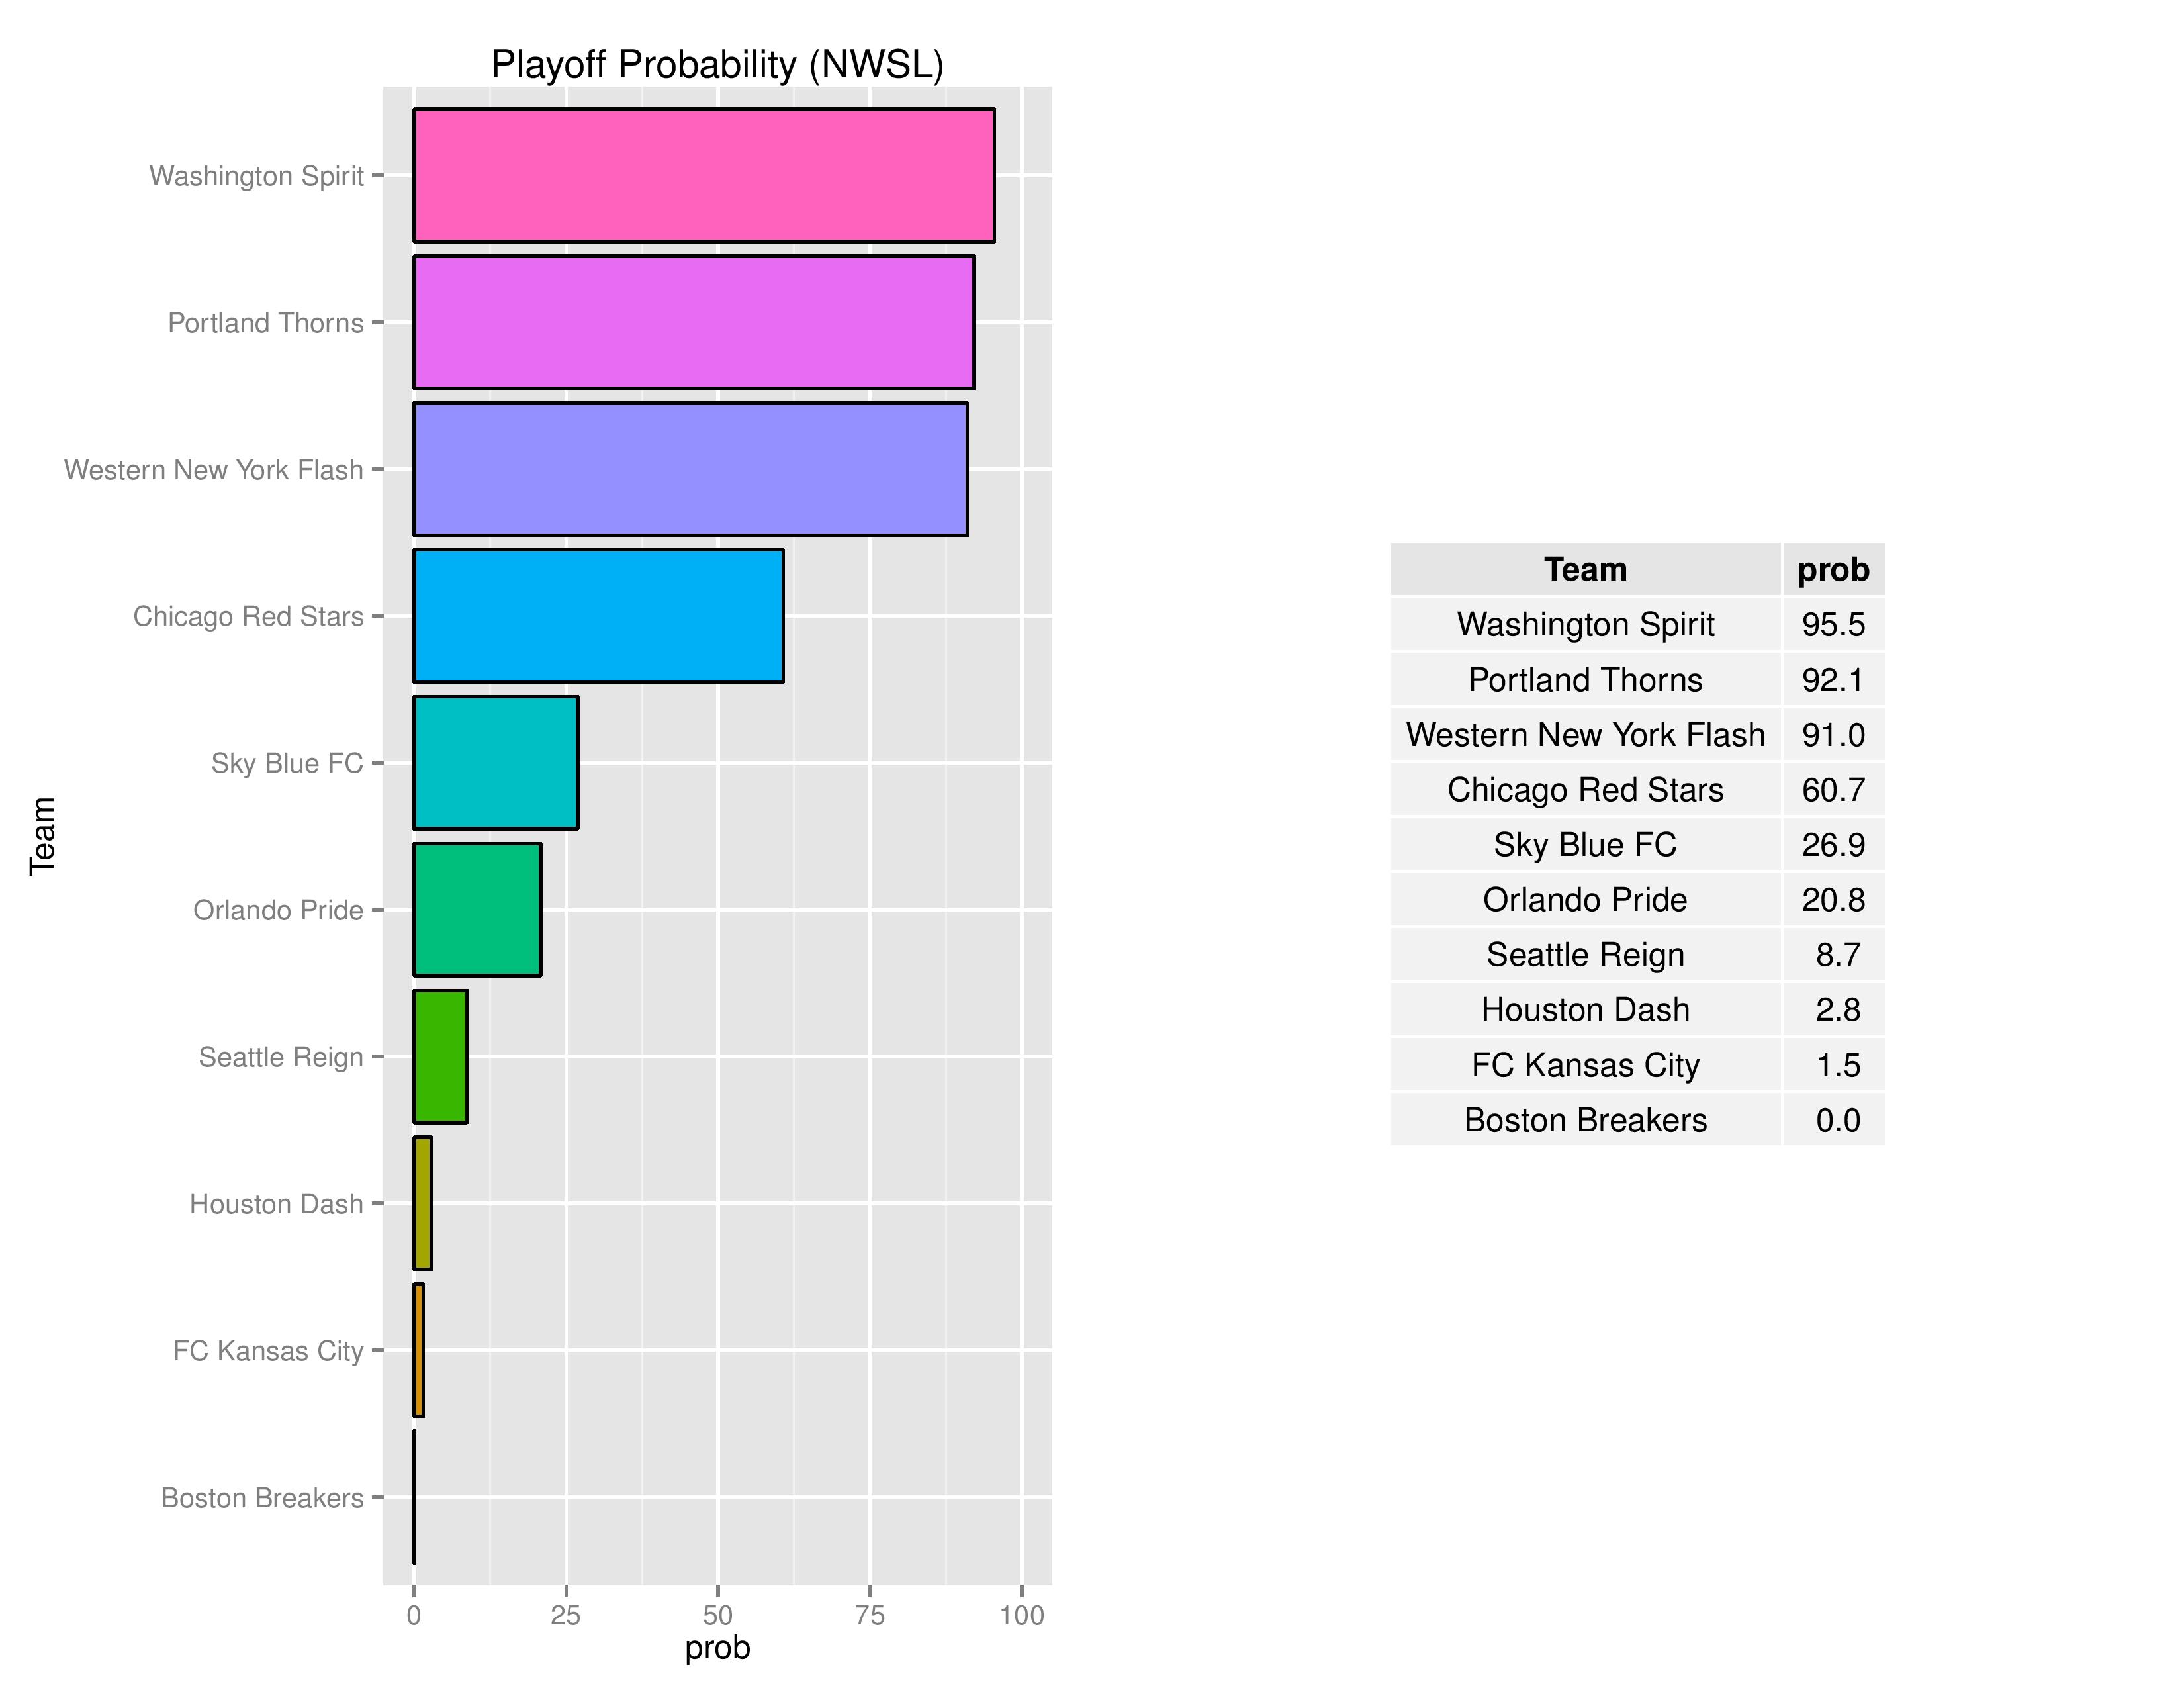
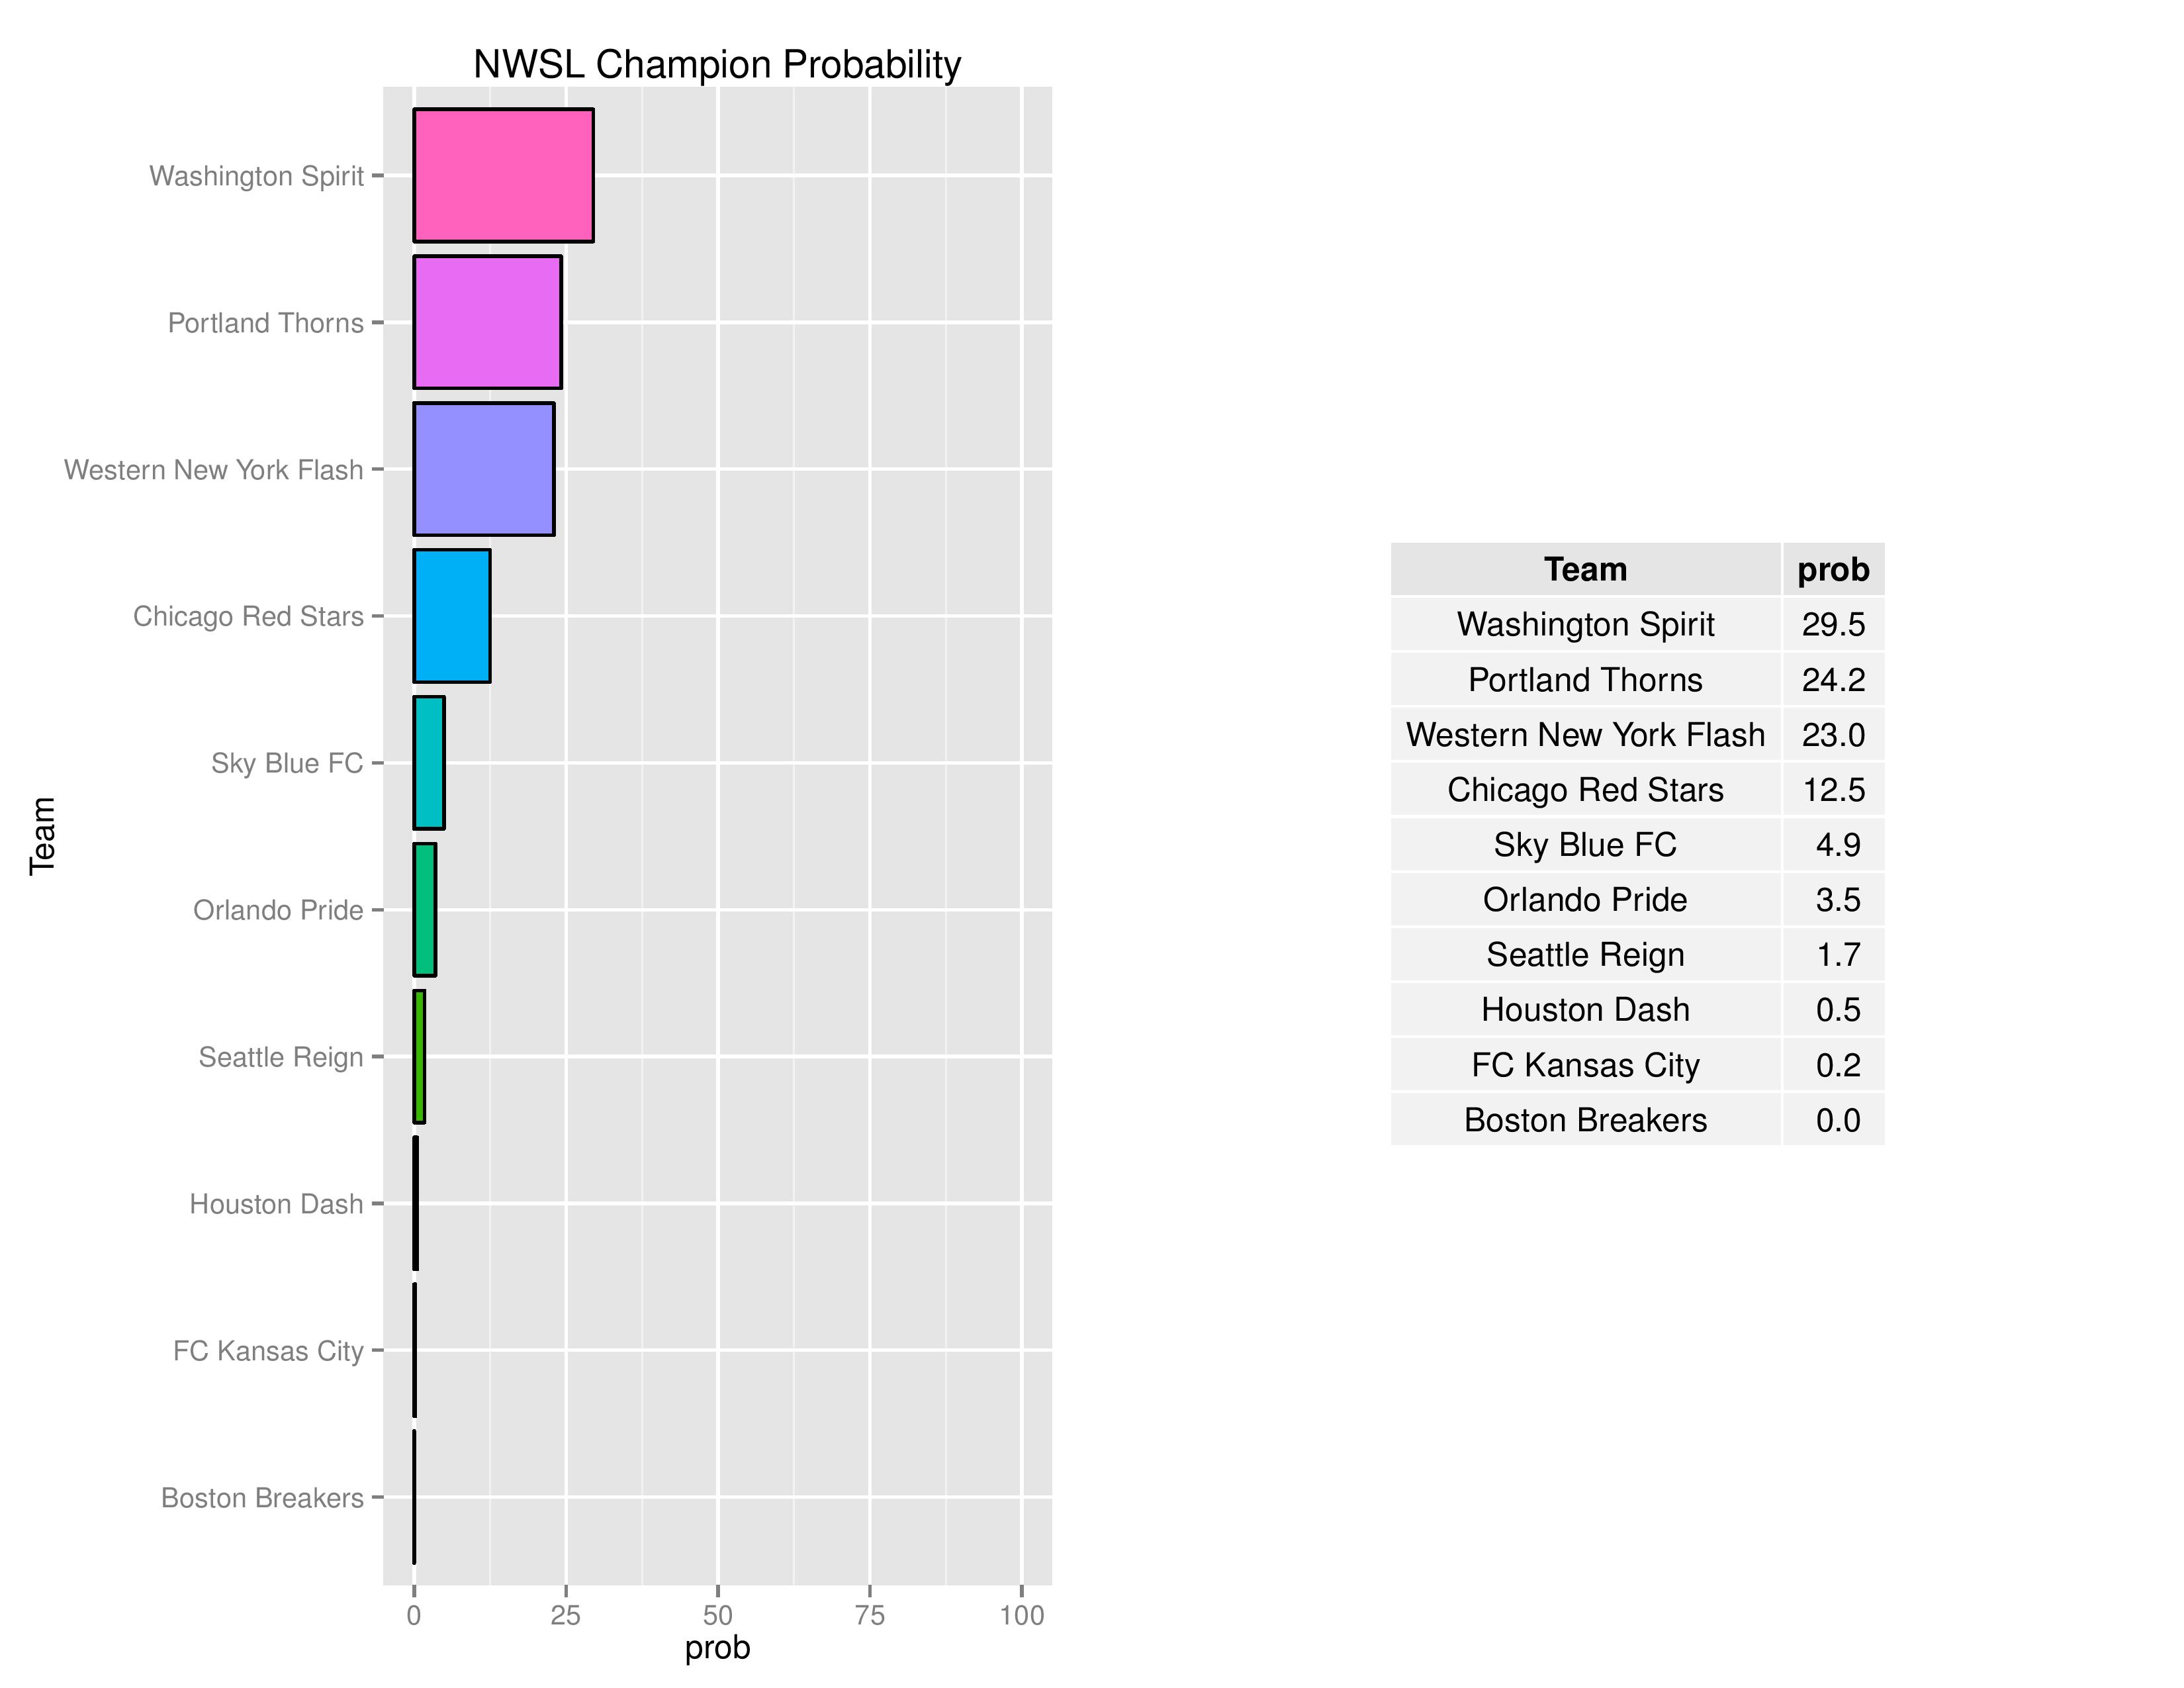
The following tables are the average simulation results produced by SEBA.

I really like these posts, but they have been a bit hard to digest for me. Would it make more sense to put the notes for each image before, and not after? For example, “the Union slipped from 3.7 to 1.7% in the chart below” and then the image follows. (There is also a bit of inconsistency with “above shows” and “see below” style captions.) Thanks!
Good tip. I like it, thanks!