Photo: Barb Colligon
You don’t need me to tell you 2012 was a tough year for the Philadelphia Union, on field and off. Most of us—from the fans to the players to the front office—are probably more than happy to forget about it and move on to offseason discussions about just who can be brought in to make 2013 a season to remember.
That said, just how does 2012 compare to the Union’s first and second season? Here are some end of the season stats with a few quick observations.
Record and goal difference
In 2010, the Union played 8 of its first 11 games on the road while we awaited the opening of PPL Park. Over that period, as can be seen the scored 14 goals while allowing 22 for a 3–7–1 record. (In the results map above, green signifies a win, red a loss, yellow a draw.) Over the first 11 games of 2011 the Union again scored 14 goals but allowed only 9 for a 6–3–2 record. Over the first 11 games of 2012 the Union allowed 14 goals while scoring only 8 for a 2–7–2 record, a record that was worse than their first year. Soon after the loss to Toronto in the 11th game of 2012, Peter Nowak was fired.
That inability to score goals, with a few memorable exceptions, would mark much of the Union’s 2012 season. Indeed, the 2012 Union scored only two more goals than the 2010 Union, and that with the benefit of 4 more games on the schedule. The key to the success of the 2011 Union was not just scoring more goals than in 2010 or 2012 but in also allowing far fewer. This is particularly noticeable in road performance, which resulted, as was the case at home, in a positive goal difference.
Goals and shots
 The Union saw a dramatic rise in shots attempted from 2010 to 2011, though attempts on goal dropped in 2012. The number of shots on goal has declined since 2010 when they were third highest in the league to 2011, when they were next to last, to 2012 when they were bottom of the league. Over the same period, they went from 9th in goals scored in 2010, to 7th in 2011, and 12th in 2012.
Interestingly, nearly 50 percent of the Union’s shots were on target in 2010.
Top scorers
 In 2010, 9 Union players scored a goal with 2 scoring 5 or more (Le Toux, Mwanga). In 2011, the goalscoring was much more spread around with 16 players scoring goals, 3 of whom scored 5 or more (Le Toux, Ruiz, Mwanga). In 2012, 12 Union players scored a goal, 4 of whom scored 5 or more (McInerney, Gomez, Pajoy, Adu).
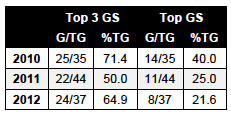
In 2010, the top 3 goal totals accounted for 71.4 percent of the team’s season total. In 2011, this number dropped to 50 percent. In 2012, the number rose to 64.9 percent (Pajoy and Adu were tied with 5 goals each to make it 4 players with the top 3 highest goal total).
As the discussion of whether or not the Union should try to bring back Sebastien Le Toux continues, it is helpful to be reminded that he accounted for 40 percent of the Union’s goals in 2010 with a strike rate of a goal every 180 minutes. In 2011, Le Toux accounted for 25 percent of the Union’s goals with a strike rate of 1 goal every 278 minutes.. With 8 goals from 18 starts and 25 appearances in, Jack McInerney accounted for 21.6 percent of the Union’s goals in 2012 with a strike rate of a goal about every 204 minutes.


Comments