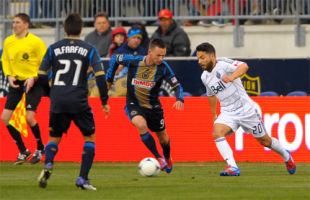
Photo: Earl Gardner
Yesterday we looked a basic passing statistics over the first four games. In the scatter plot below, we can see a simple pattern emerge along positional bands, much as Rolando De Aguiar demonstrated in a post last December looking at passing statistics from 2011.
(The chart below is interactive. Place your cursor over a player’s name to see that player’s passing accuracy percentage and passes per 90 minutes. You can also exclude individual players from the view in the display that pops up when you place your cursor over a player’s name. To return to the full view, click on the revert all button beneath the graph. If your viewing session expires, simply refresh the page.)
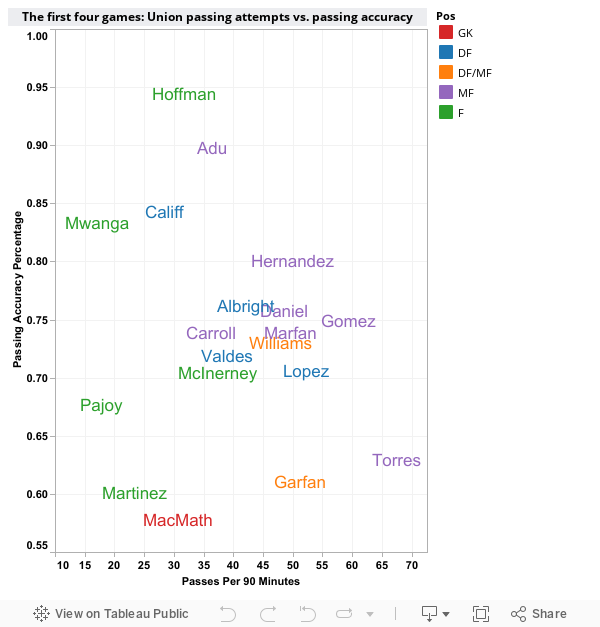
Rolando described that players in the bottom right of the graph that he produced can be viewed as “high usage, low efficiency” passers while those in the top left are “low usage, high efficiency” passers. And, as Rolando suggested, we can see groupings by position.
The forwards identified in green, for example, have fewer passes and, given the high pressure passes they are attempting based on their position on the field, generally have a lower passing accuracy. The placement of Hoffman and McInerney on the graph diverges from their fellow forwards largely because they have not yet played enough minutes to make the Passes per 90 minutes calculation reliable. McInerney has also played many of his minutes in a more midfield position and so he is closer to the midfielders identified in purple. Garfan’s position on the graph is also affected by his multi-positional play and fewer minutes compared to Lopez and Williams.
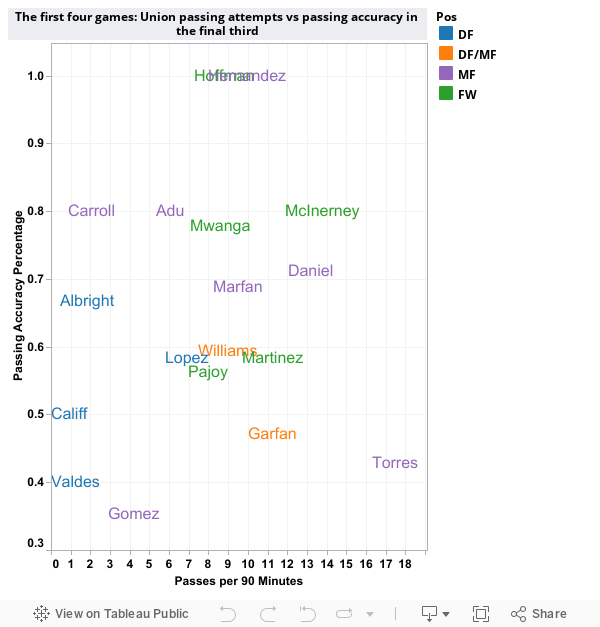
Turning to passing in the final third, we also see positional clusters. Among the defenders, we can see that Williams, Garfan and Lopez, all of whom have played at outside back, a higher number of passes than their central defender partners, which makes sense given the Union’s desire to push the outside backs up the field. The difference in passing accuracy between Mwanga and Pajoy that we noted in yesterday’s post is also apparent; while they are in a similar band in terms of number of passes in the final third, Mwanga has been more accurate over the first four games. As was also noted, Daniel stands out for having both a high number of passes in the final third and a high accuracy percentage.
As the season goes on, and a deeper data pool becomes available, we will return to the Union’s passing statistics to see what trends emerge. As always, let us know in the comment section if there are aspects of the game that you would like us to look at. We’ll do our best to gather up the data.

I’m impressed by Hoffman’s stats here. Obviously, it’s a small sample size, but it seems to indicate that he’s smart with his passing. Considering it was from his debut performance, that bodes well for the player’s intelligence and composure on the field. He was making safe passes, yes, mostly backwards, but he also wasn’t making mental errors. The data also seems to suggest we need to get Adu on the ball more.
Mwanga is so under-rated on this team.